1. Introduction
Disordered protein domains are a growing theme in protein studies [1-4]. Protein disorder results when amino acid sequences are depleted in hydrophobic residues and enriched in polar or charged residues. The result is a lack of regular secondary structural elements that results in a flexibility of the region or protein. Intrinsically disordered proteins (IDP) and intrinsically disordered protein regions (IDR) appear to fold or assume a stable conformation upon binding to partners such as proteins, DNA, or RNA [5-7]. This induced folding appears to allow IDPs and IDRs to interact with more than one binding partner, which allows proteins to be multifunctional without requiring separate binding sites for each function [
8]. The roles of IDPs and IDRs are diverse and include protein-protein interactions, protein-nucleic acid binding, phase condensation, and regulation of catalytic activity [3,9-13].
Studying the roles of such domains can be challenging since they lack a predictable regular secondary structure, which often challenges structural analysis via cryo-electron microscopy and X-ray crystallography [
14]. Unique approaches and tools are needed to help complement more traditional approaches. Even computational tools such as AlphaFold yield limited results with unstructured domains [
15]. Type IIA DNA topoisomerases found in eukaryotes have an IDR at the carboxy terminus that has been difficult to study [13-29].
DNA topoisomerase II (TOP2) is a type IIA topoisomerase that maintains DNA topology and alleviates knots and tangles in and among chromosomes [30-32]. TOP2 regulates the topology of DNA through controlling the level and extent of supercoiling using a double-strand DNA passage mechanism that involves a transient double-stranded DNA break [30-33]. The enzyme has three gates: N-gate (ATPase/transducer), DNA-gate (TOPRIM/cleavage/ligation domain), and the C-gate (lower region before CTD) that open and close in turn to ensure the enzyme remains intact [
34]. The “top” of the enzyme is the N-terminal ATPase domain followed by a transducer domain that connects with and communicates with the TOPRIM and cleavage/ligation domains within the core of the enzyme [
35,
36]. There is also a lower region that serves as a lower gate, called the C-gate for the C-terminal gate, before the intrinsically disordered CTD [
27].
Human TOP2 is found as two isoforms in cells that are expressed from separate genes: topoisomerase IIα (TOP2A) and topoisomerase IIꞵ (TOP2B). TOP2A manages supercoiling and topological entanglements during replication and mitosis [
30]. TOP2B is involved in regulating DNA topology during transcription and chromatin remodeling [
37]. Both isoforms are targeted by widely-used anticancer drugs such as etoposide and doxorubicin [
38]. Unfortunately, several adverse events are associated with these therapies and some of these adverse events may be due to the action of the drug on TOP2B [39-41]. Therefore, there is increased interest in finding ways to more selectively target TOP2A, and there have been a few compounds identified that offer some level of selectivity [
38].
The intrinsically disordered CTD of TOP2A is over 300 amino acids in length [
15,
17,
22,
28]. While this region is not required for catalytic function and appears to be variable among type IIA topoisomerases, it is needed in cellular contexts for localization and regulation of function in a cell cycle-specific manner [
16,
18,
42,
43]. This region differs significantly between TOP2A and TOP2B making it a potential point of differentiation between the two isoforms [
20,
27,
28,
38].
Structural and biochemical studies have found that deletion of portions of the CTD can affect DNA substrate selection and the ability to facilitate phase condensation [13,17-20,28,43]. CTD mutations can impact catalytic function, implying that the CTD is involved in regulating function [
28,
44]. Our previous studies examined a series of Ser/Thr residues in the CTD to determine whether mutations in purified enzymes impacted biochemical function [
28,
44]. Several regions were identified that either increased or decreased catalytic activity, which is consistent with other previous research examining the CTD [
28].
To guide our selection of additional CTD sites for evaluation, we utilized PSICalc. PSICalc is a pattern discovery tool that utilizes a derivation of the k modes algorithm to compare positions within an amino acid sequence and identify interdependencies among positions [
15]. These interdependencies represent various types of relationships including direct interactions, local folds, and long-distance interdependencies [
15,
45]. Since the tool does not require any regular ordered structure, we have proposed that this tool may enable us to make discoveries about roles of amino acid positions within IDRs and IDPs and between IDRs and other regions of a protein [
15,
29].
Previously, we applied the PSICalc tool to a dataset of 347 TOP2 sequences from various domains of life [
15,
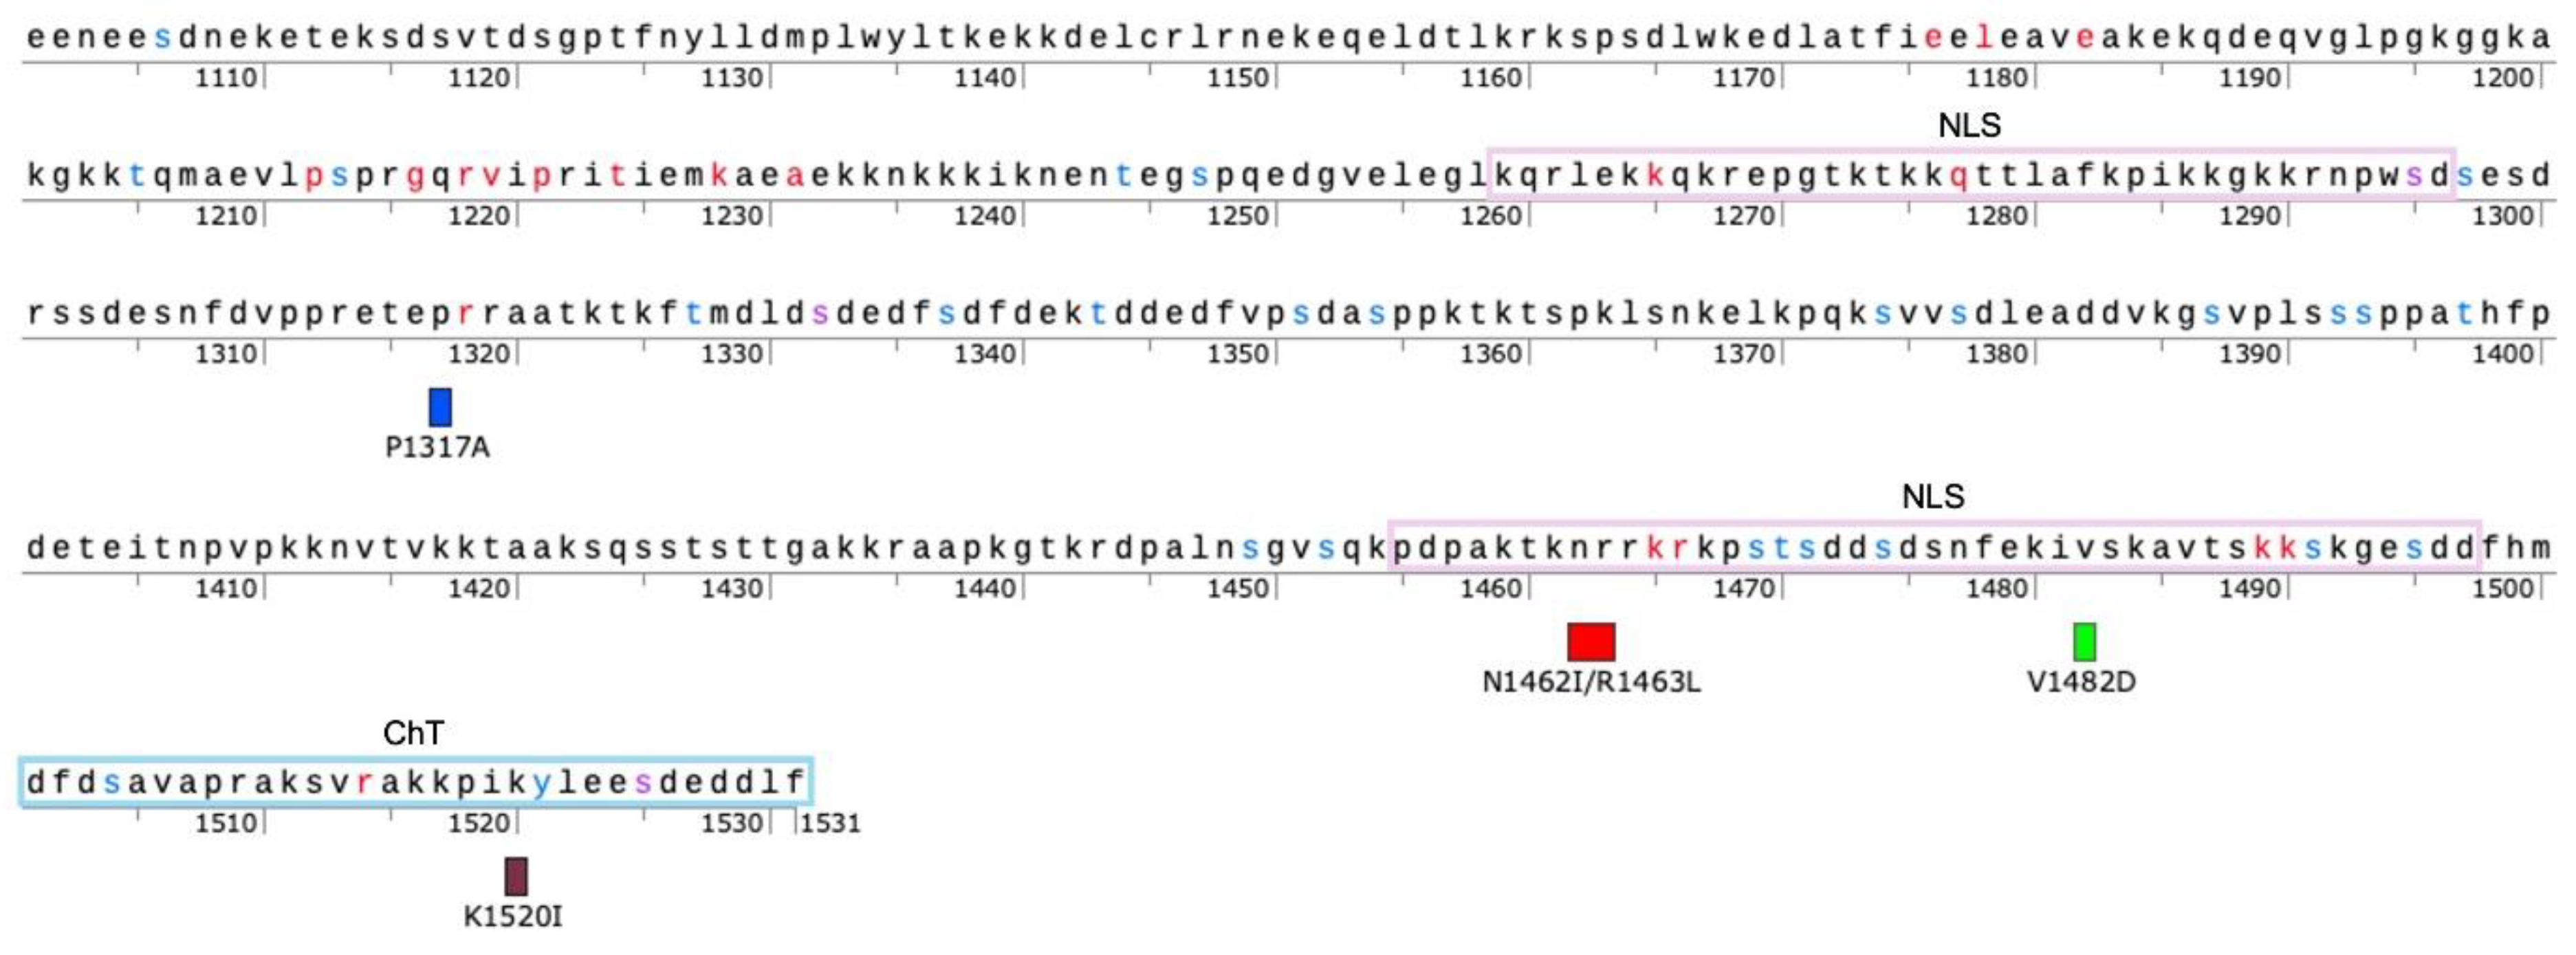
29]. This study identified several positions with the CTD that are interdependent with clusters in the N-terminal ATPase domain. We selected and mutated five CTD positions that were identified in this dataset and generated four mutants (one as a double-mutant) as outlined in
Table 1 and shown in
Figure 1. In the time since the generation and initial analysis of the mutants, it was found that the original clusters were anomalous due to an issue with the clustering algorithm, which was corrected and reported in a previous study [
29]. Using the corrected algorithm, these positions are found in clusters with other sites [
29]. Since the mutant enzymes were made before the algorithm error was discovered, we continued with our analysis of these mutants and report the results in this current study.
In this current work, we describe results with four TOP2A CTD mutants: P1317A; N1462I/R1463L; V1482D; and K1520I. Our results indicate that some mutations have little or no effect on catalytic activity while others may slightly increase or decrease activity. These results are reported and considered in light of recent bioinformatic and biochemical analyses of the CTD [
29].
2. Results
2.1. Plasmid DNA Relaxation by CTD TOP2A Mutants
Overall catalytic activity is commonly monitored using plasmid-based DNA relaxation assays combined with gel electrophoresis [
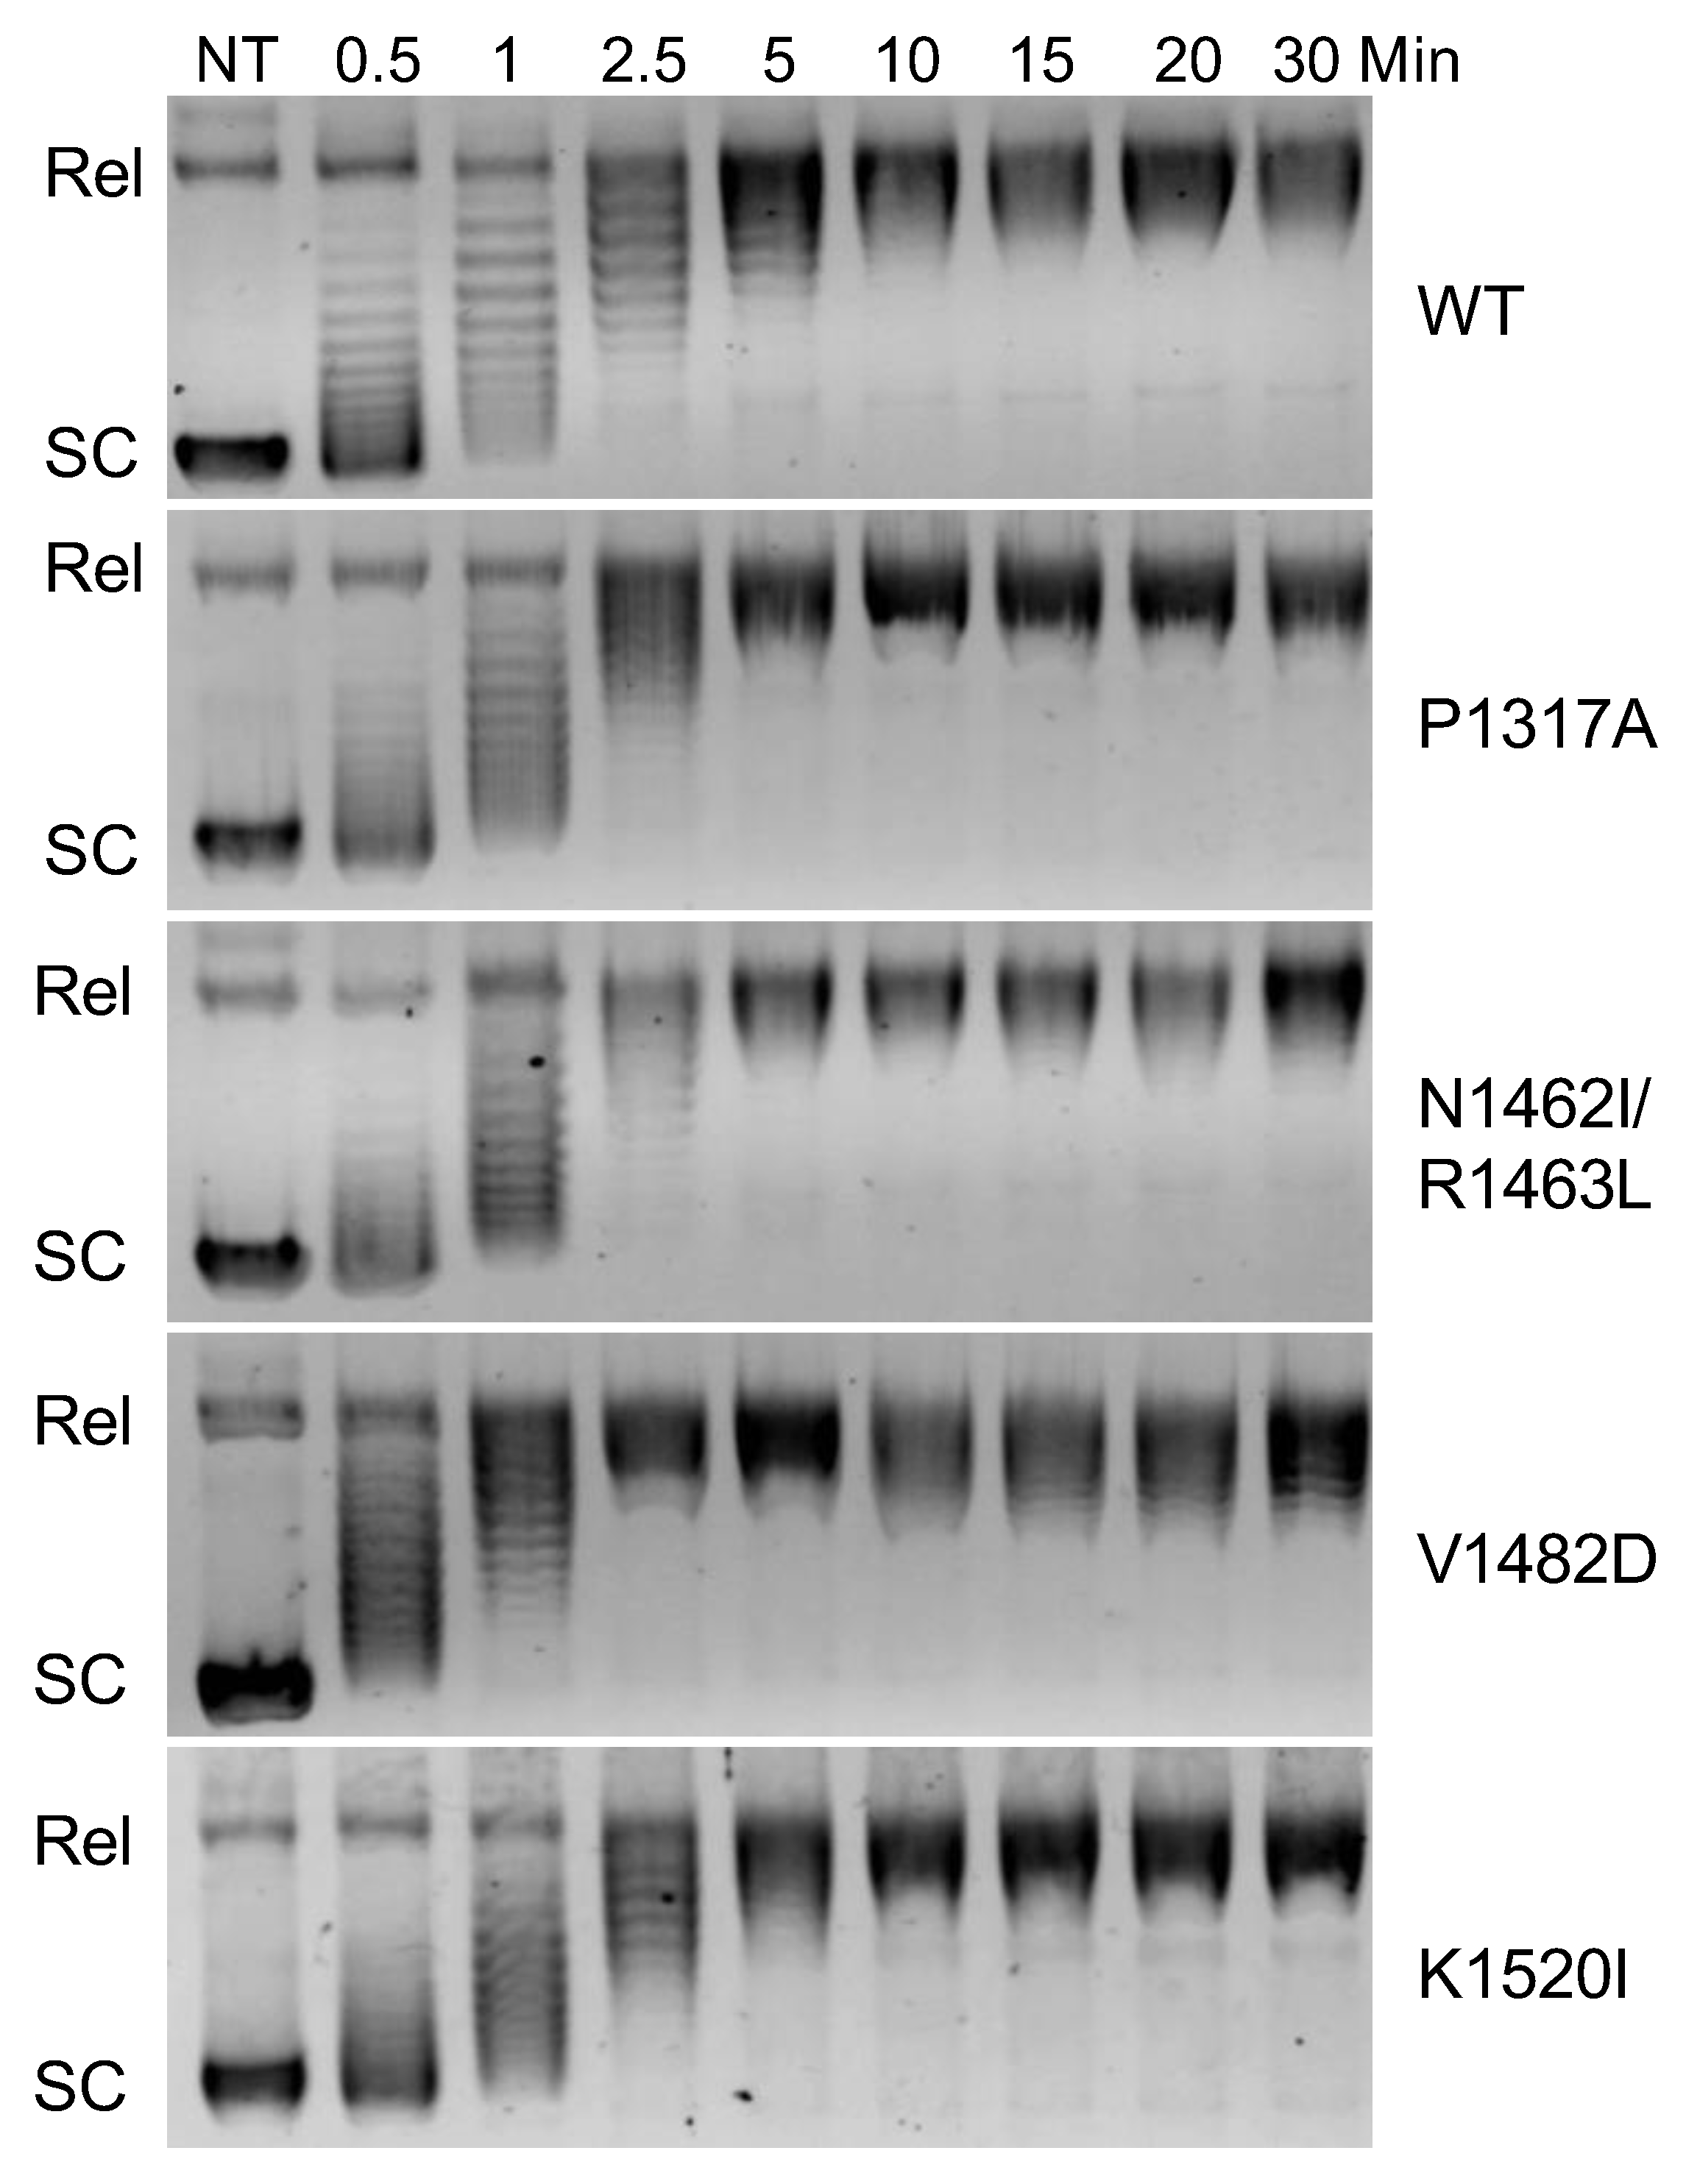
28]. The ability of TOP2A to relax negatively supercoiled DNA was determined via relaxation assays using pBR322 plasmid. Relaxation capabilities of the different mutants were compared against wildtype (WT) via time courses [Fig. 2]. Since relaxed DNA migrates much slower than supercoiled DNA in an agarose gel, the first time point at which all the DNA is in line with the relaxed band is the time at which relaxation has been completed. WT enzyme fully relaxed the substrate between 5- and 10-min. Mutants P1317A, N1462I/R1463L, and K1520I show slight increase in relaxation rate compared to WT finishing closer to 5 min. In contrast, V1482D relaxed the DNA by around 2.5 min. While relaxation captures overall catalytic activity, additional assays are needed to assess whether portions of the catalytic cycle are affected by these mutations.
Figure 2.
Relaxation time course of DNA by wildtype TOP2A (WT) and mutant TOP2A (P1317A, N1462I/R1463L, P1482D, and K1520I). Representative gel images show the migration of supercoiled plasmid in the absence of TOP2A (NT) as well as in the presence of TOP2A at increasing time points (0.5 - 30 minutes). The relaxed plasmid (Rel) migrates more slowly than supercoiled (SC) plasmid. Gel images are representative of three or more experiments.
2.2. Plasmid DNA Cleavage by CTD TOP2A Mutants
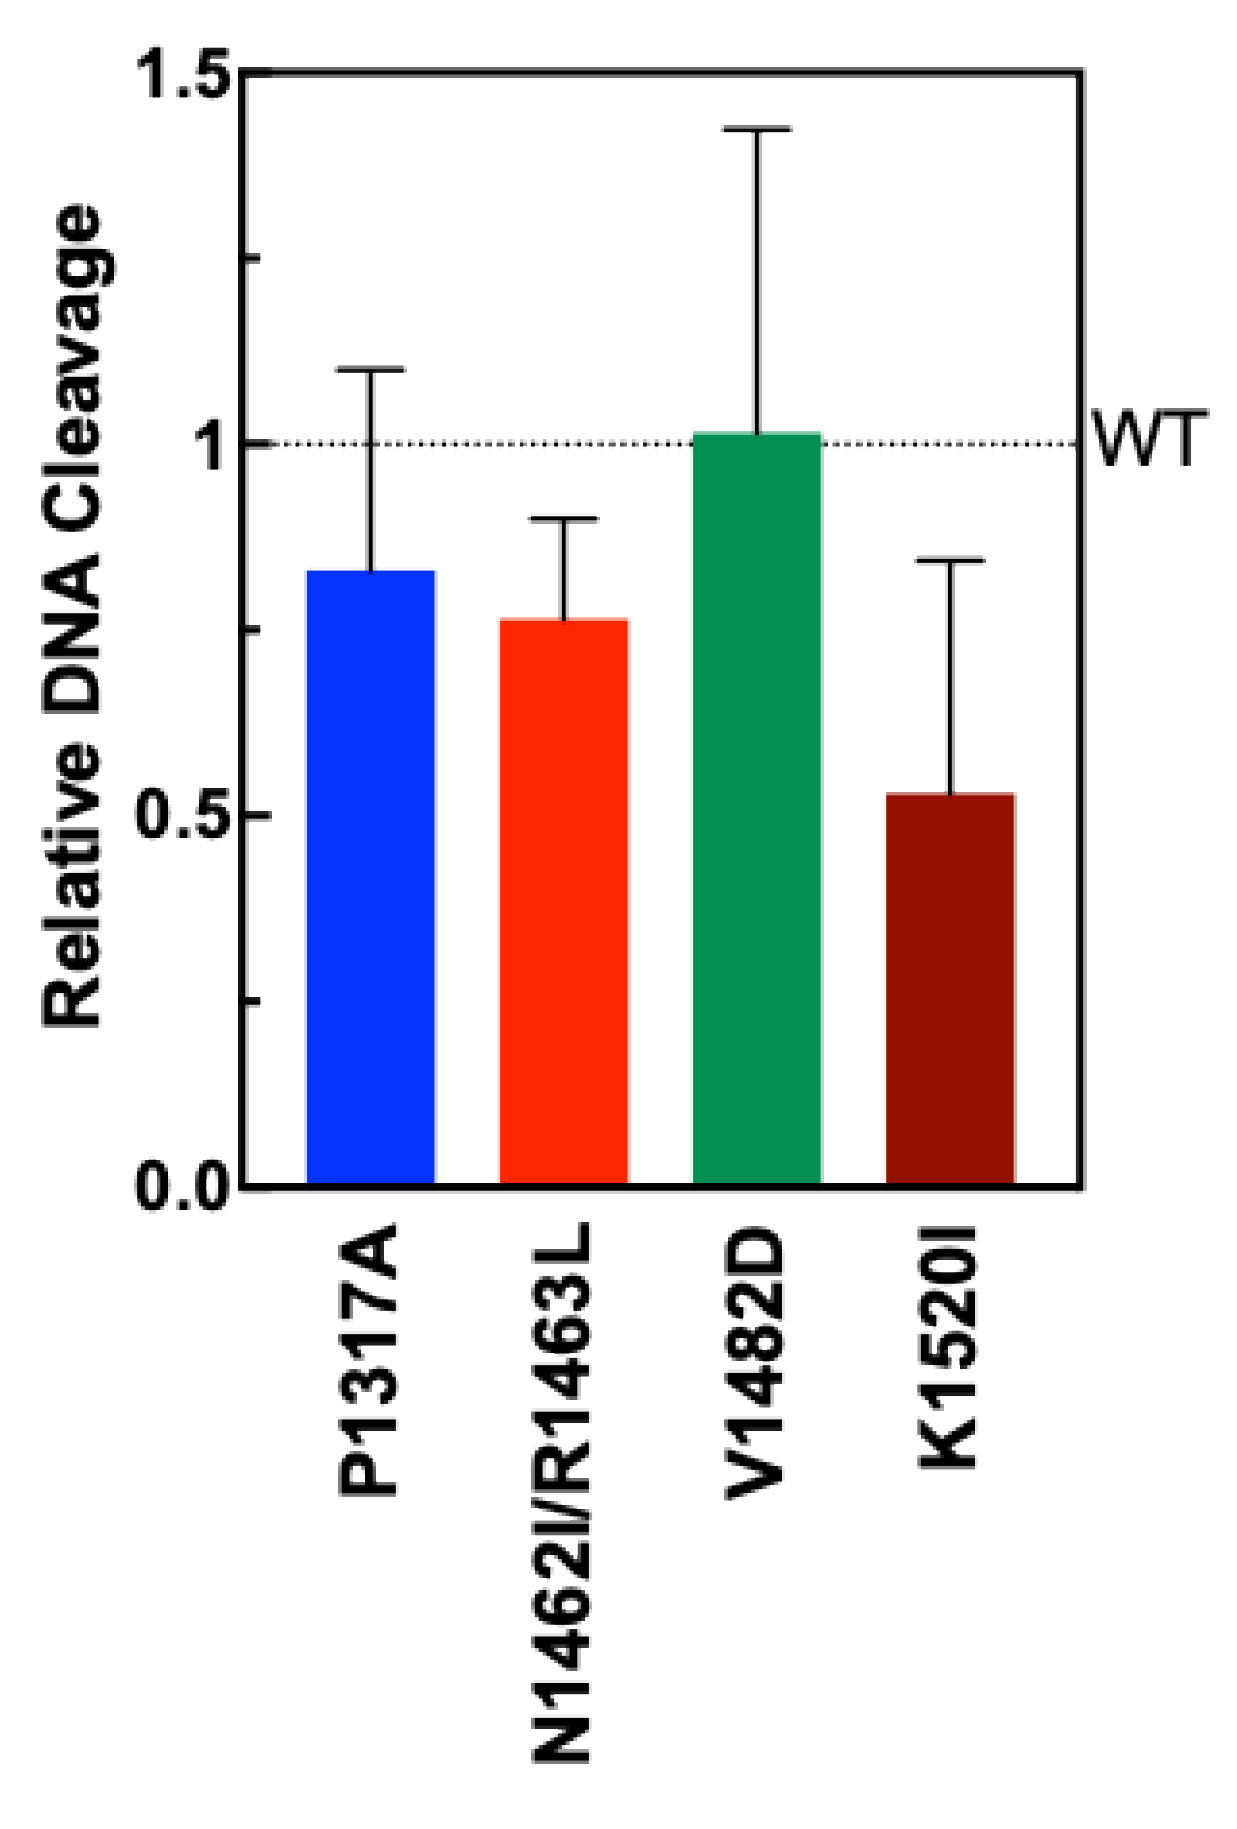
To test the extent to which the TOP2A mutants could form double-strand breaks in DNA, plasmid DNA cleavage assays were performed. Negatively supercoiled plasmid (pBR322) is was incubated with TOP2A WT and mutant enzymes. Percent of double-stranded DNA cleavage formed after a 6 min assay is shown in
Figure 3 compared with WT (dotted line). Though the results are not statistically significant, mutants P1317A, N1462I, R1463L, and K1520I all show a slight decrease in activity, with the largest decrease shown by mutant K1520I. Mutant V1482D is comparable to wild type TOP2A in cleavage activity. These results indicate that the mutations do not significantly impact DNA cleavage activity for any of the mutants.
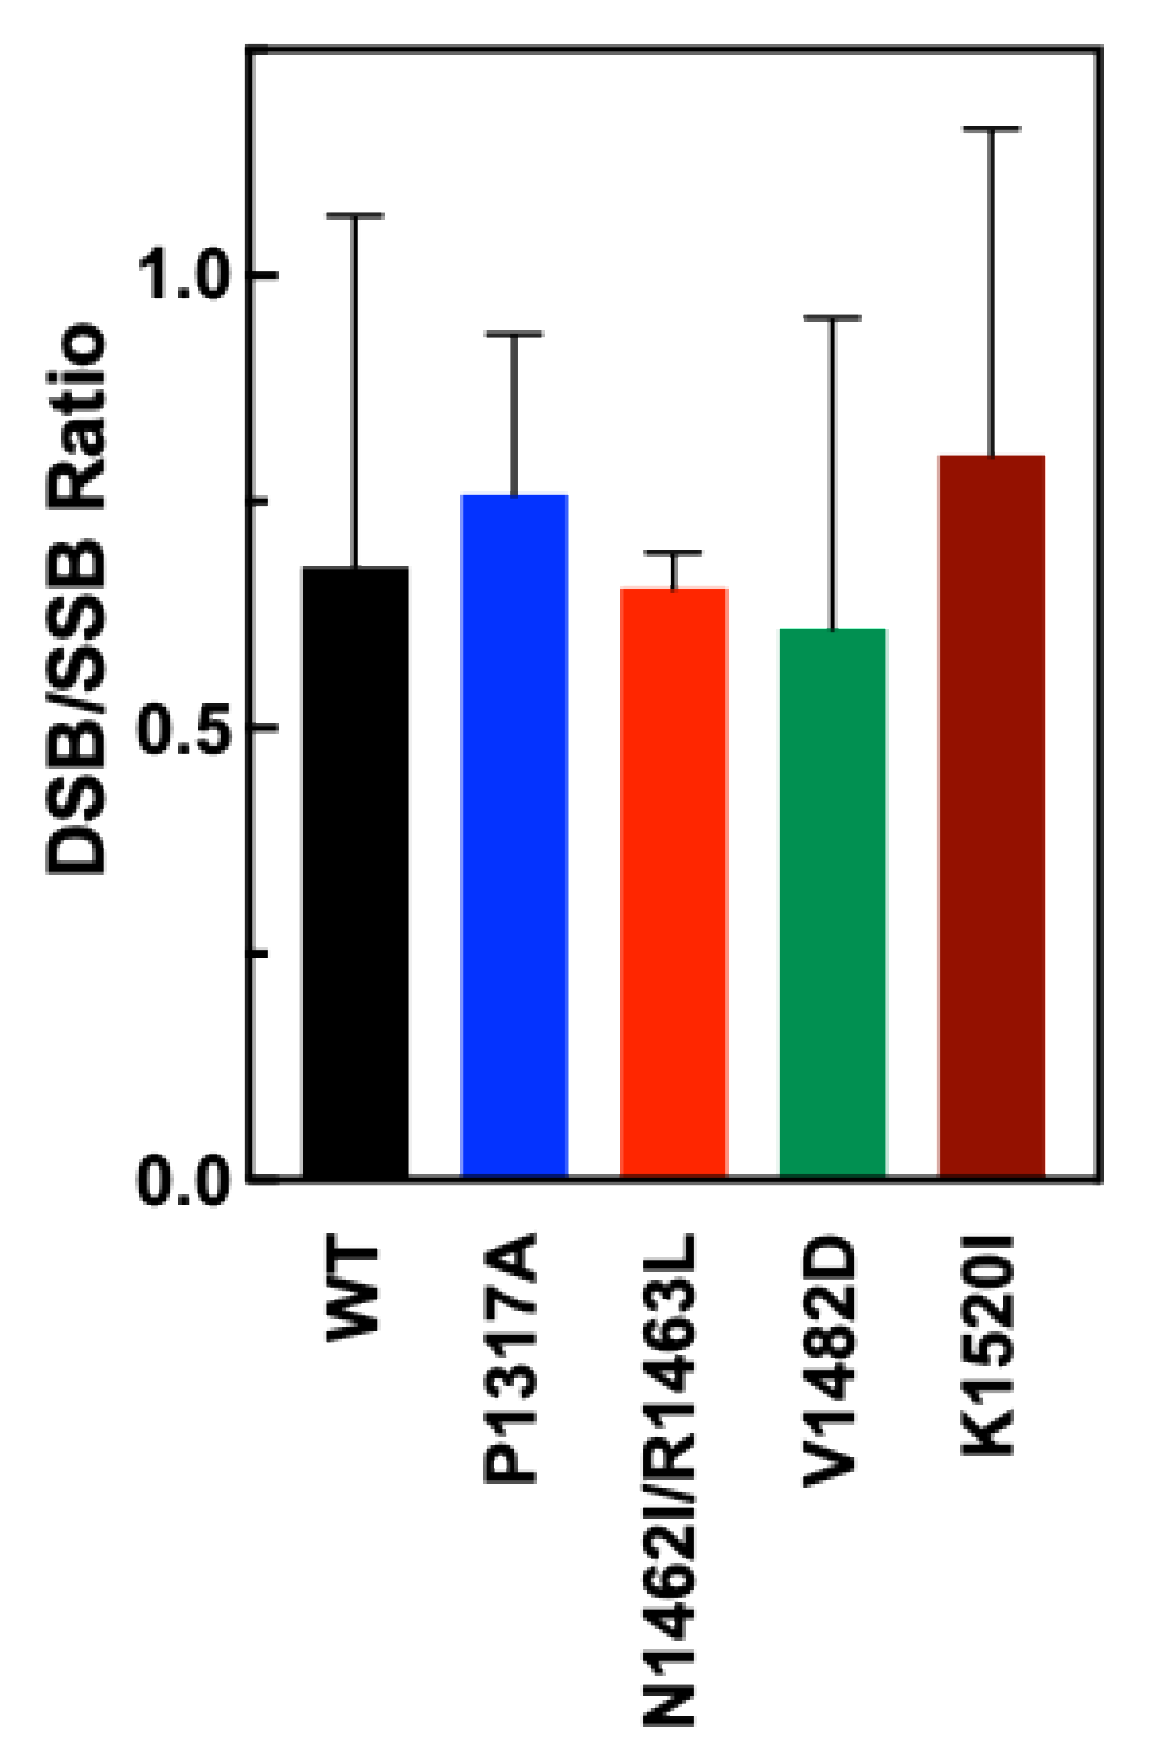
Because TOP2A contains two active sites, it is possible to monitor the level of coordination between the active sites by tracking double-strand breaks (DSBs) and single-strand breaks (SSBs) in a plasmid DNA substrate. Agarose gel electrophoresis separates the nicked (SSB) DNA from the linear (DSB) plasmid DNA. The relative coordination between the active sites of the dimer can be approximated using a DSB/SSB ratio. If the enzyme is perfectly coordinated, a high ratio of DSB compared to SSB would be expected. While evidence indicates that the two active sites can cut independently, there is a degree of coordination between the two halves [
47]. In general, the WT enzyme displays more SSB than DSB when reactions are stopped with SDS and no TOP2 poisons are present making the ratio less than 1 [
28]. This may be a protective feature of the enzyme mechanism to prevent forming too many DSB.
To examine the DSB to SSB ratios for WT and CTD mutant TOP2A, nicked and DSB bands were quantified and a ratio was calculated based upon the quantification. As see in
Figure 4, the ratios for each of the mutants are comparable to the DSB/SSB ratio of WT, indicating no significant shifts in the coordination of the CTD mutants of TOP2A.
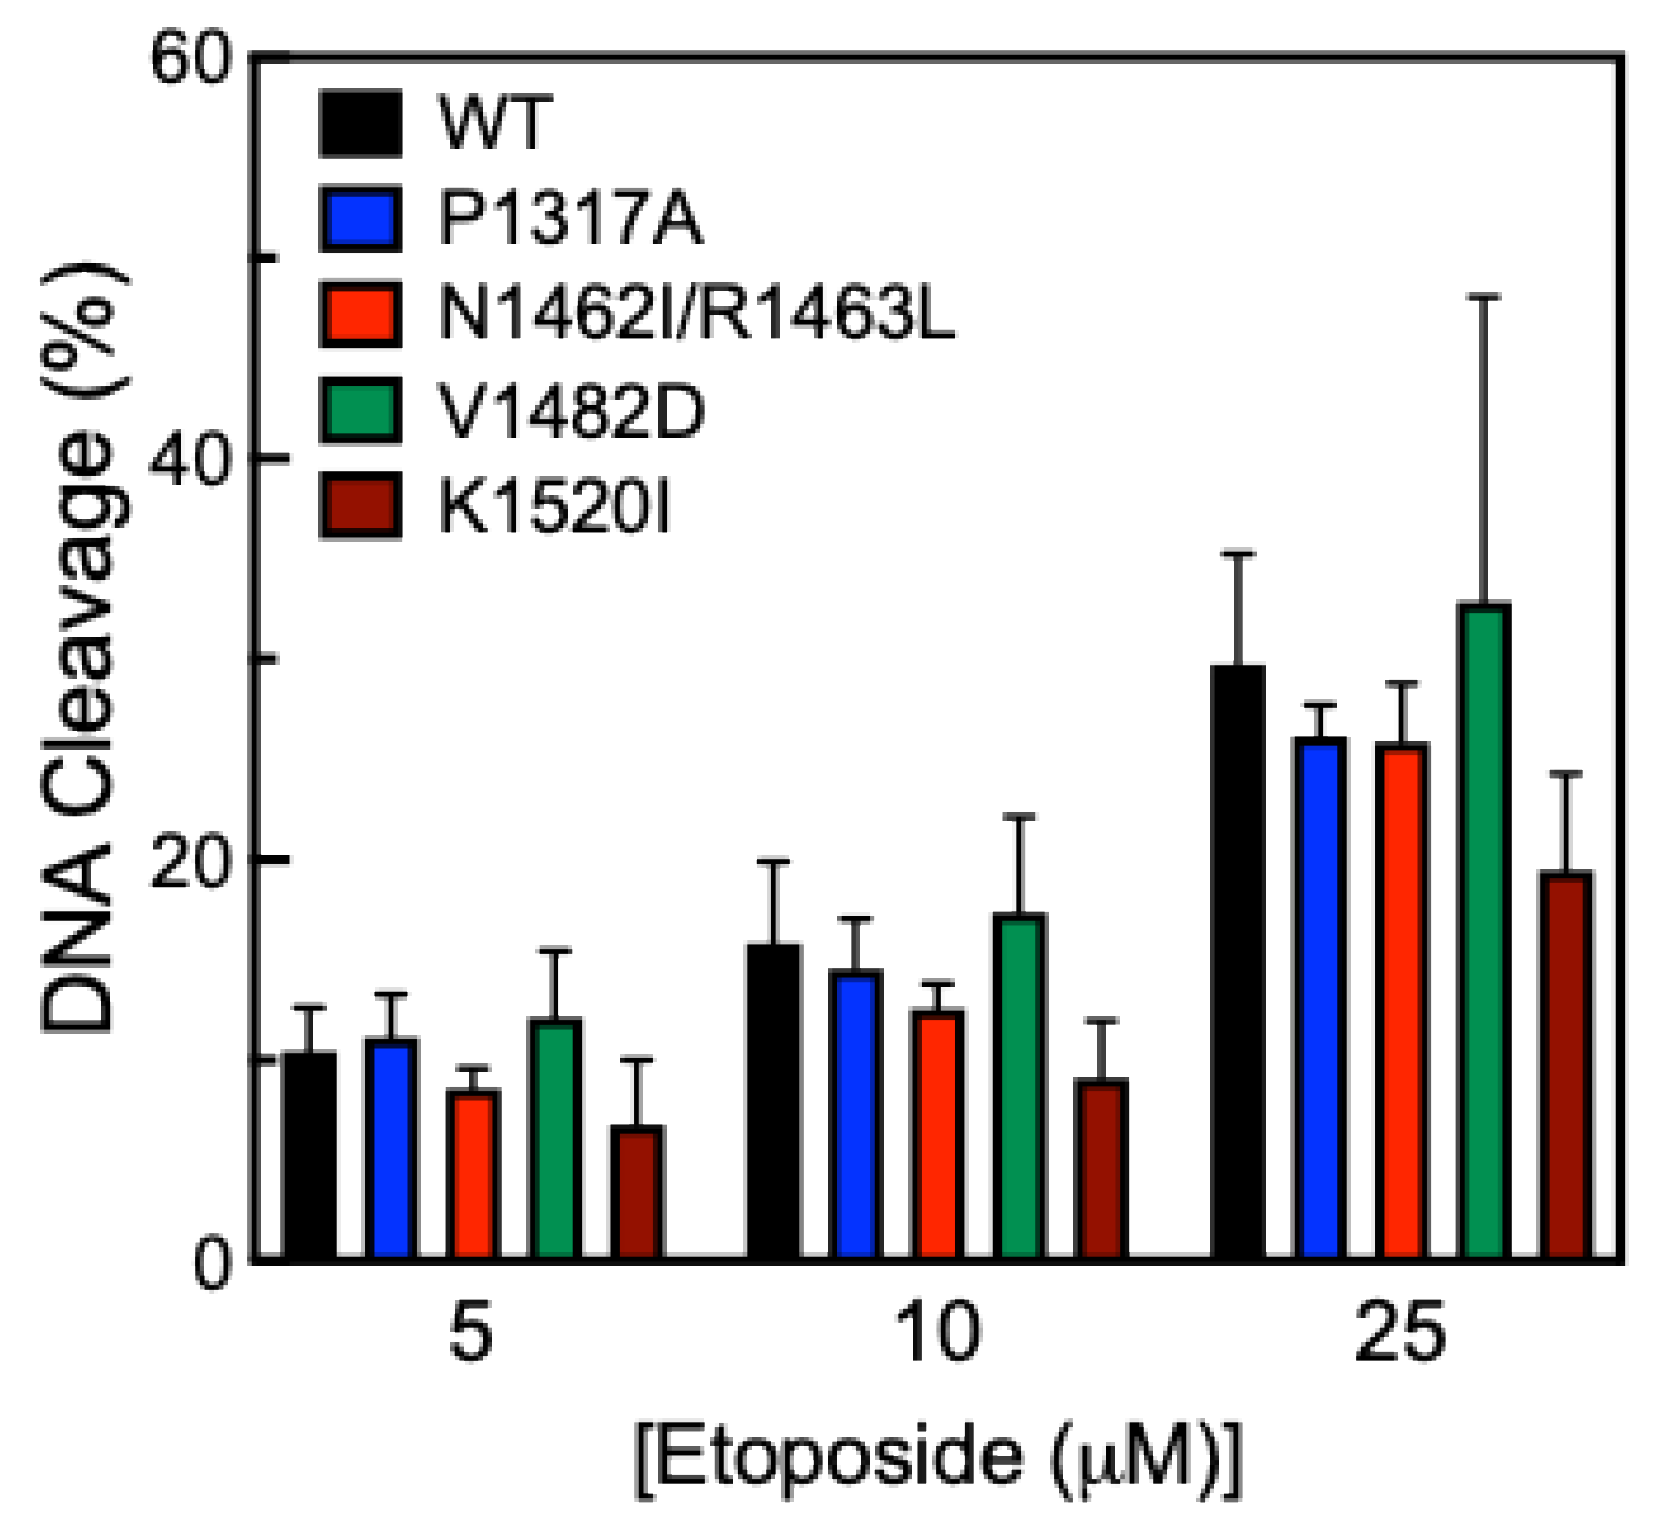
Another way to measure DNA cleavage activity is to use the anticancer drug etoposide, which inhibits TOP2A from ligating cleaved DNA in the presence of the drug [
38]. This mechanism is called “poisoning” and leads to an accumulation of DNA strand breaks. Etoposide acts in this manner and is referred to as a TOP2 poison. Cleavage assays were performed in the presence of 0-25 µM etoposide (Fig. 5). While all CTD mutants were comparable to WT, K1520I shows a slight decrease in cleavage activity compared to WT, but this difference is not statistically significant.
2.3. Plasmid DNA Binding by CTD TOP2A Mutants
While DNA cleavage activity does not appear to be significantly altered, DNA binding is also of interest to explore. It is possible that increased binding could lead to increase relaxation activity. In order to measure the level of DNA binding, we utilized the Electrophoretic Mobility Shift Assay (EMSA), which can be used to monitor enzyme-DNA binding [
28,
48]. Plasmid DNA was incubated with WT or mutant TOP2A and subsequently subjected to gel electrophoresis to separate the DNA molecules. The binding of DNA was assessed by observing the shifting of the supercoiled (SC) DNA band in the presence of increasing concentrations of WT or mutant TOP2A (Fig 6). In the presence of TOP2A, the plasmid DNA migrates more slowly due to its binding to the enzyme, and the degree of gel shift is proportional to the concentration of TOP2A. This assay was performed without the presence of Mg
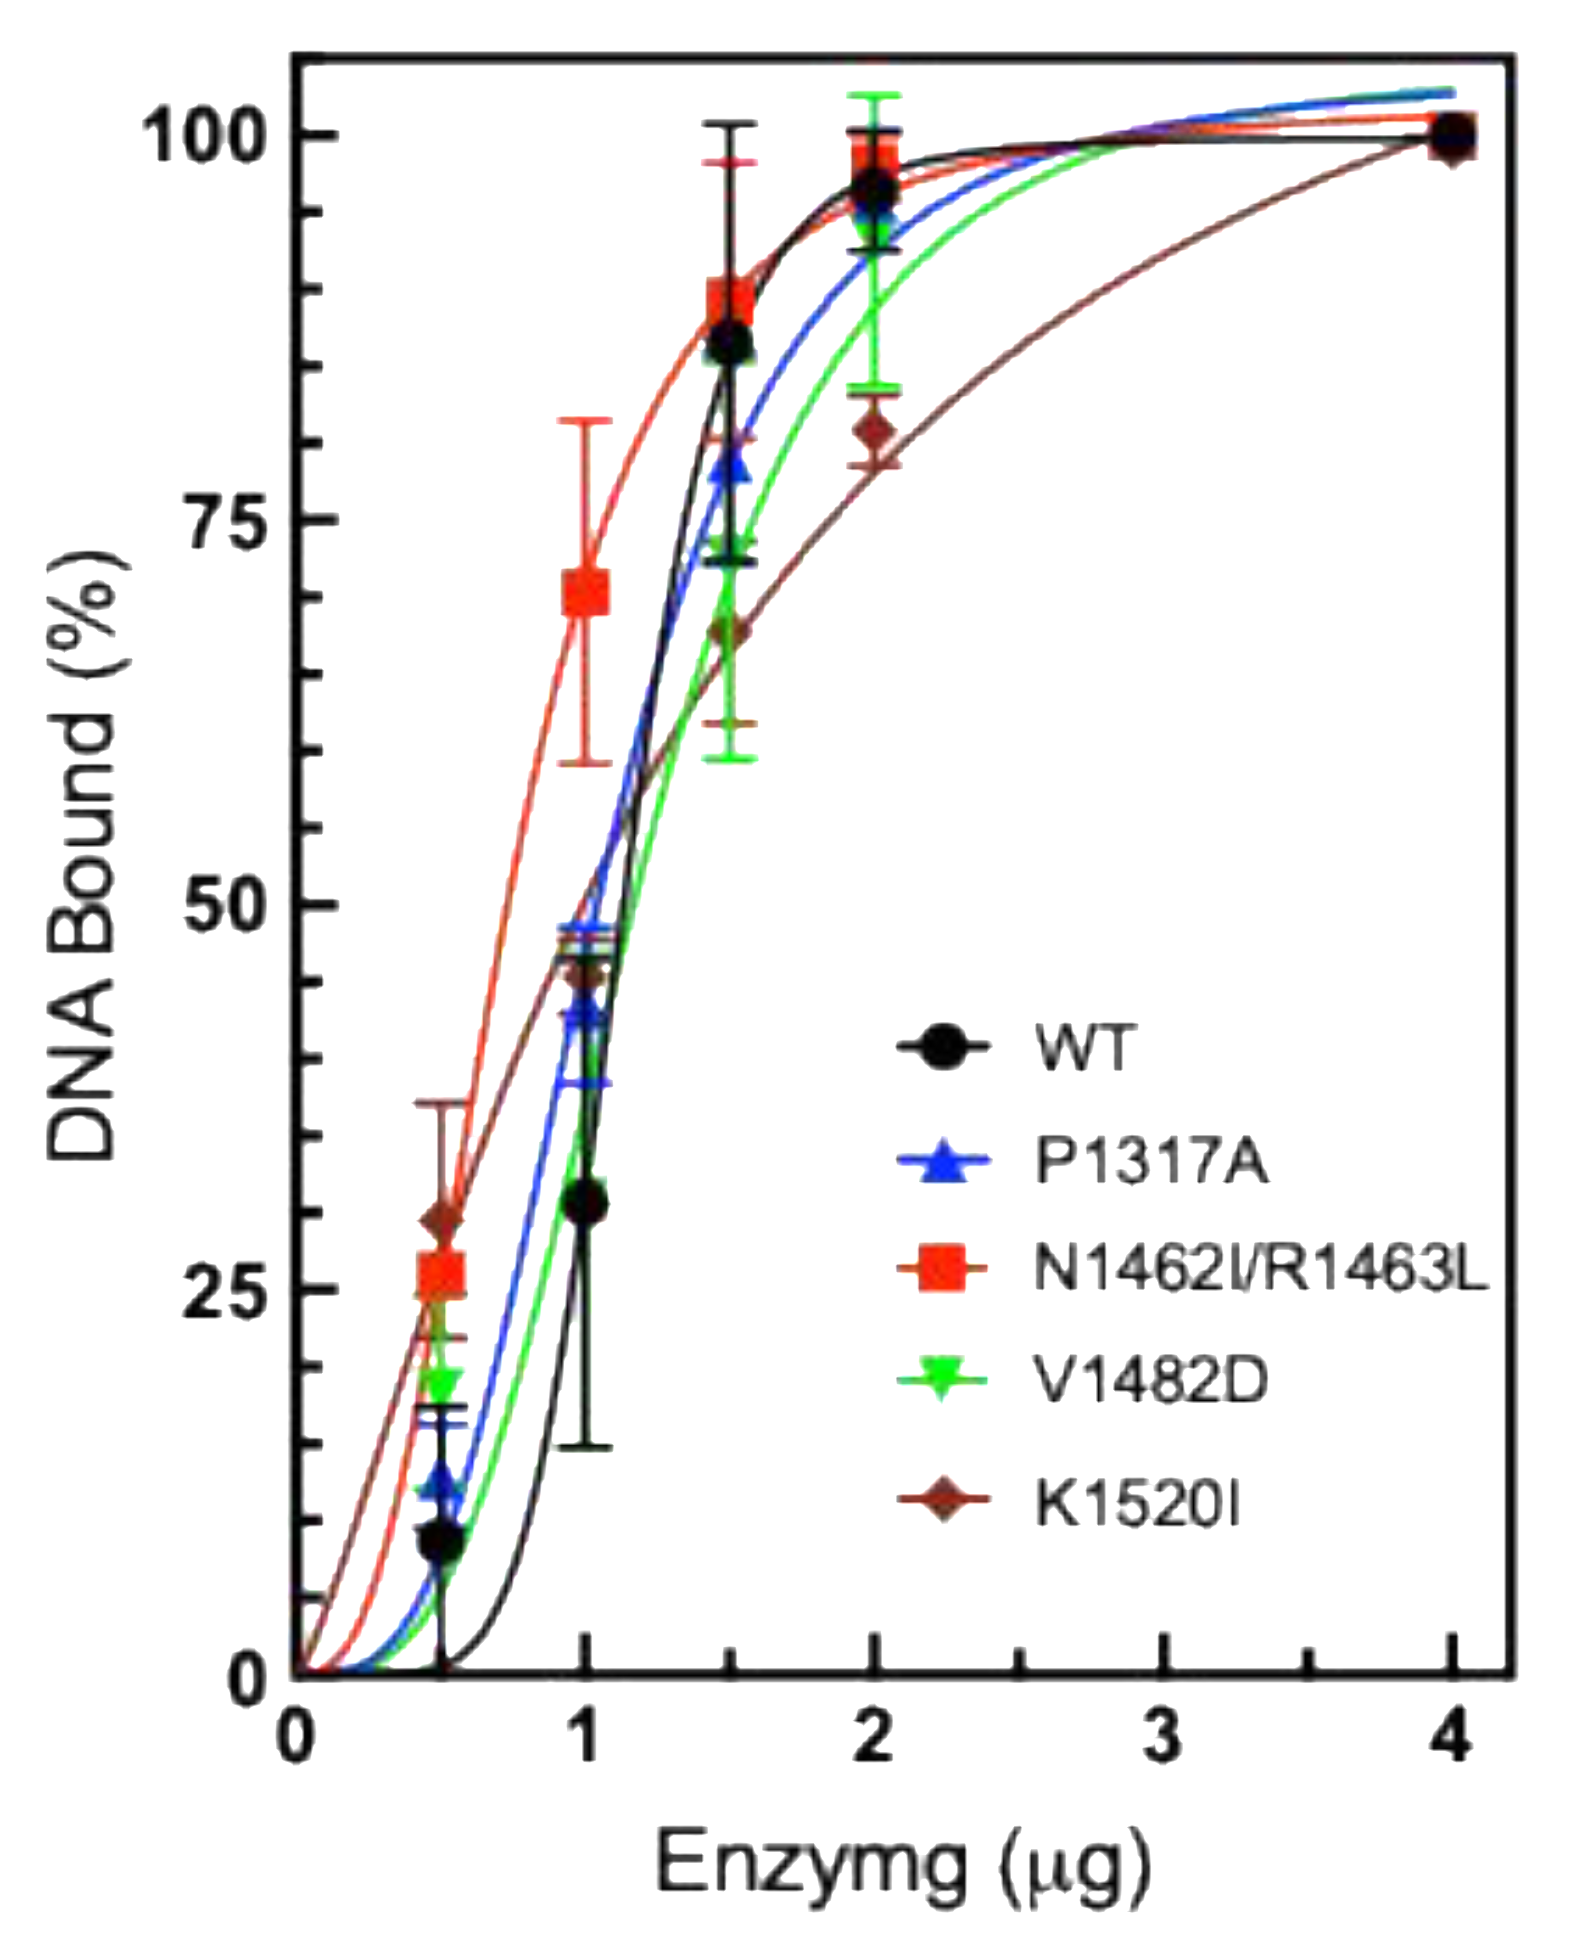
2+, which is necessary for cleavage and ligation, thereby confirming that the observed gel shift represents noncovalent interactions and not DNA cleavage products. Quantification of the gels revealed that most of the CTD mutants exhibited comparable DNA binding compared to WT TOP2A. The double mutant N1462I/R1463L TOP2A appears to bind more strongly while the K1520I is slightly weaker, compared to WT.
Figure 6.
Plasmid DNA Binding by TOP2A. Plasmid DNA was incubated in the presence of increasing concentrations of purified WT or mutant TOP2A, P1317A, N1462I/R1463L, P1482D, and K1520I (0.5-4 µg). Results are shown as percent of SC DNA remaining unshifted by binding to TOP2A. Error bars represent the standard deviation of three experiments. .
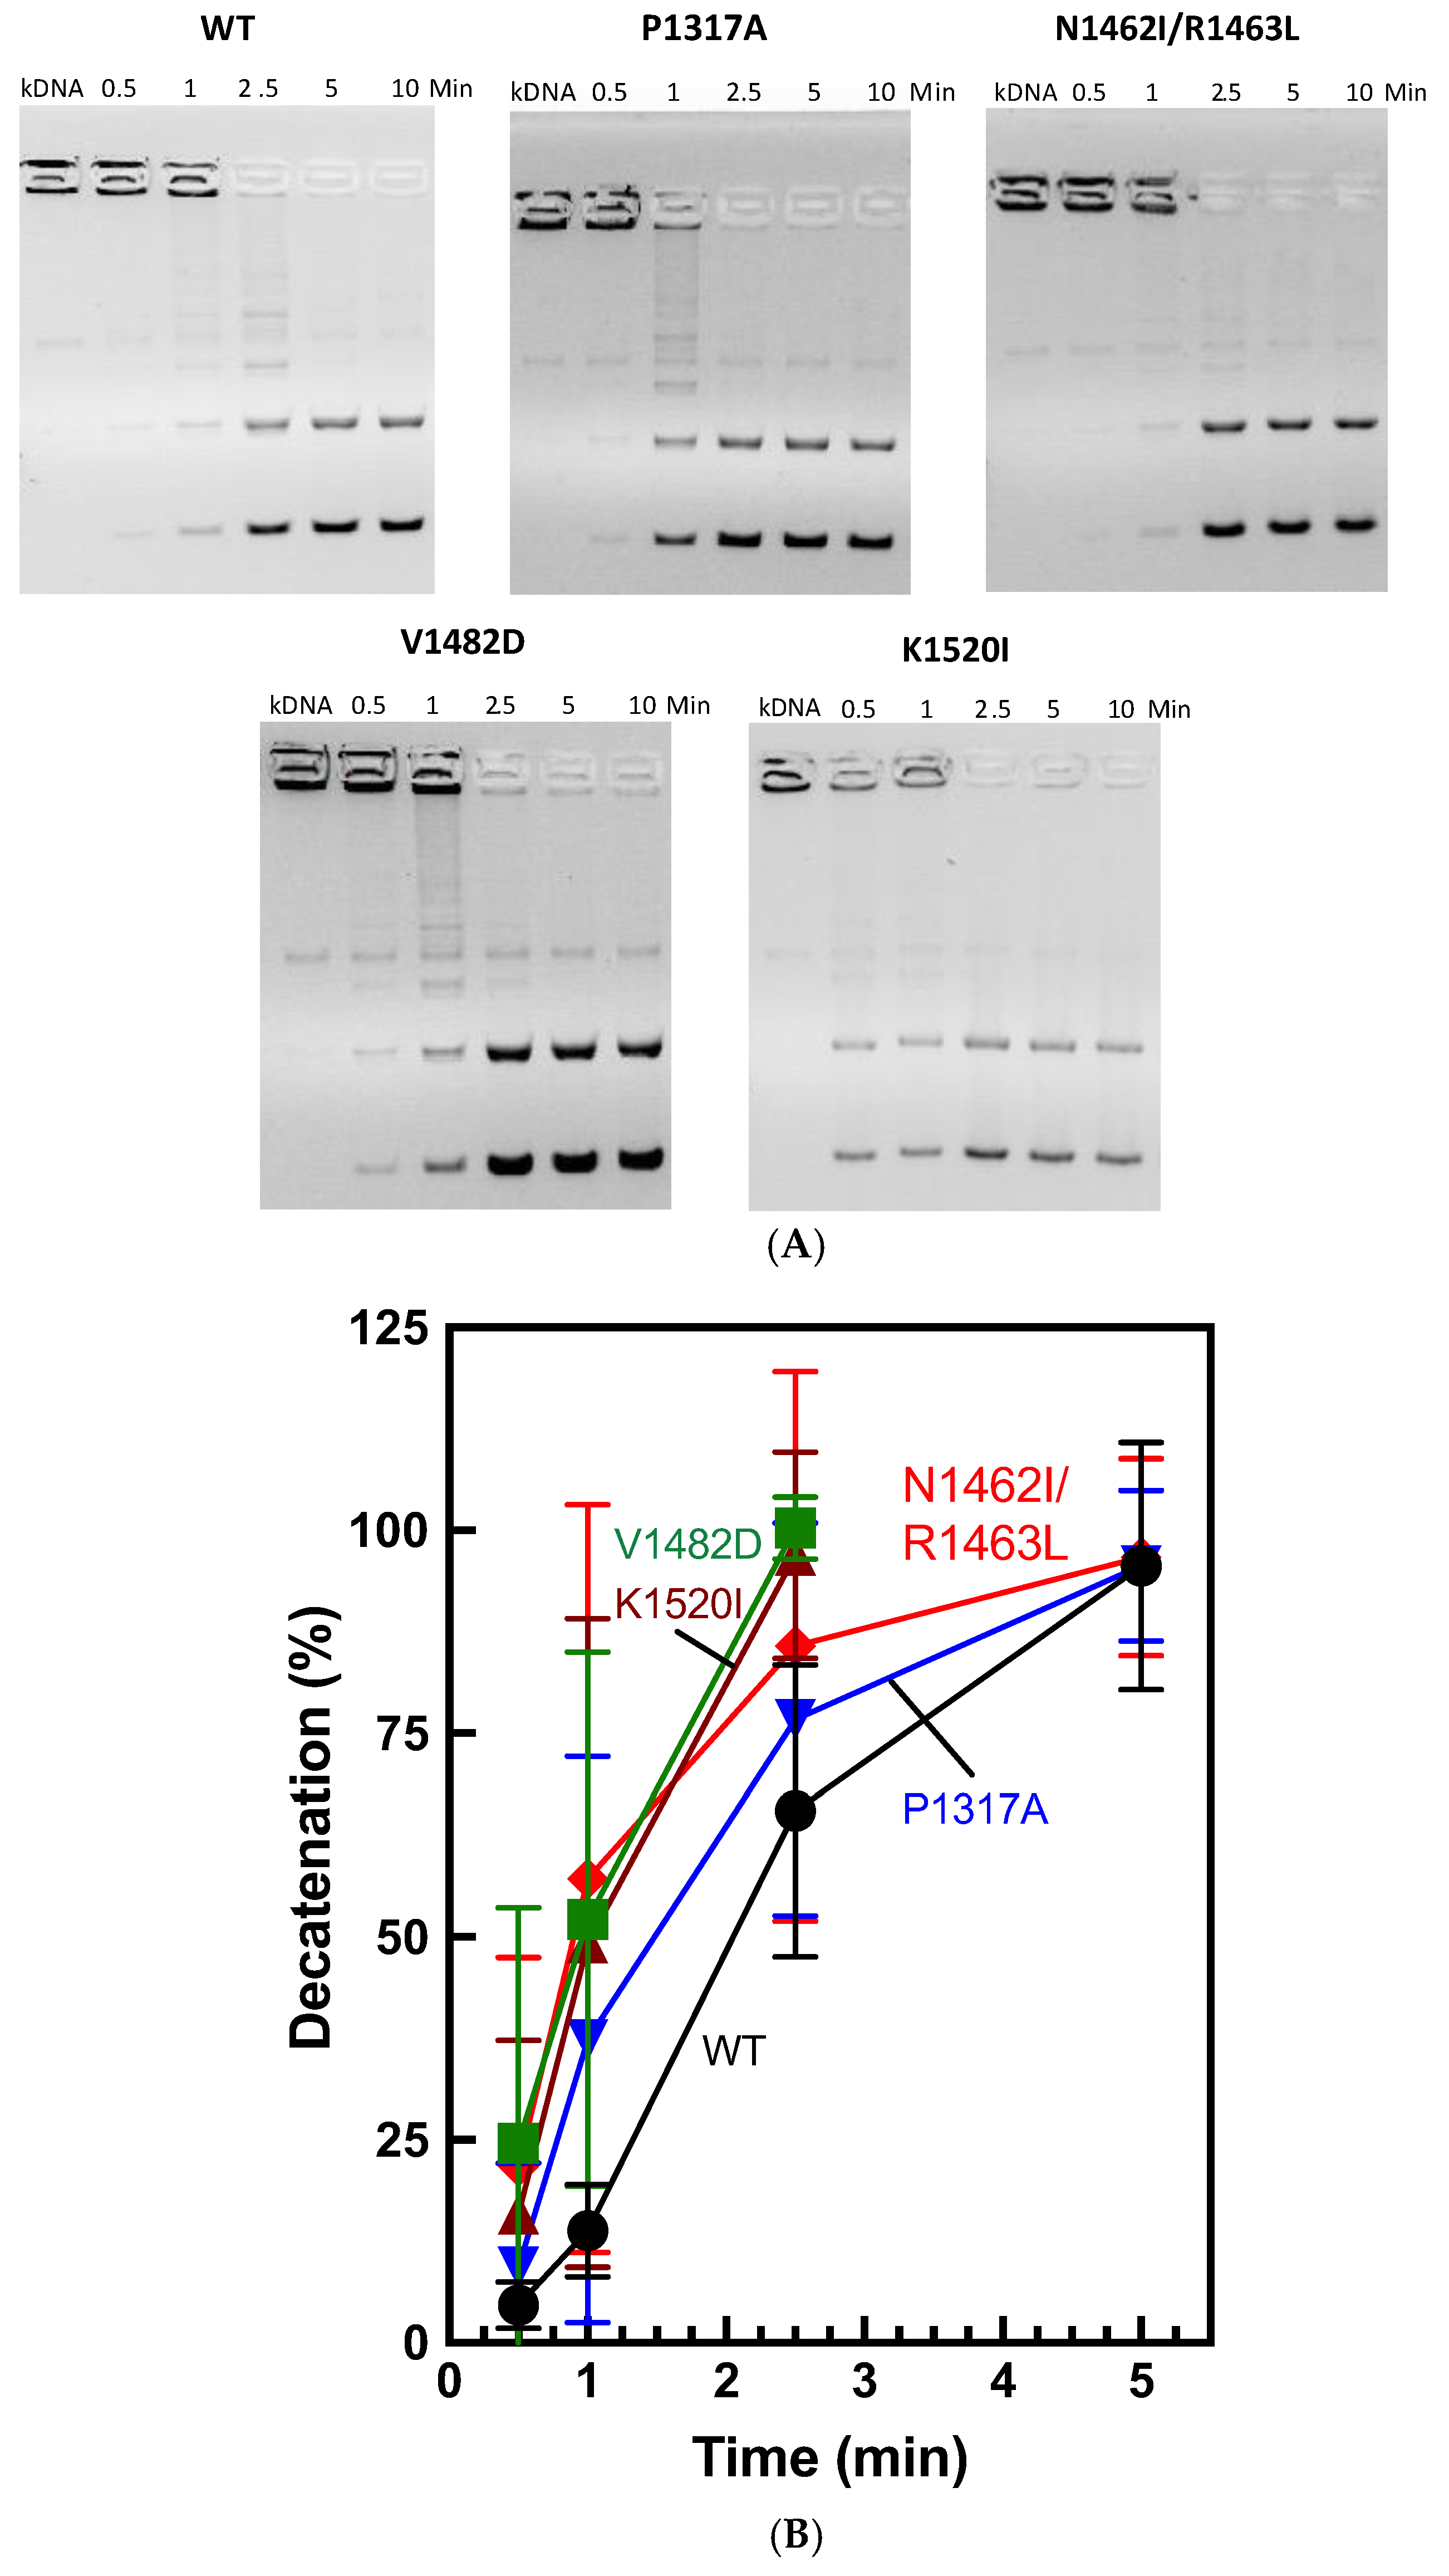
2.4. Kinetoplast DNA Decatenation by CTD TOP2A Mutants
While relaxation activity represents full catalytic function, TOP2 can also unlink DNA molecules. This activity is called decatenation, which can be tested experimentally using kinetoplast DNA (kDNA) minicircles [
28,
49]. kDNA substrates represent multiple circles of DNA connected together, which cannot migrate into an agarose gel. In the presence of TOP2A and ATP, the enzyme can unlink the kDNA minicircles resulting in smaller bands appearing in the agarose gel and the DNA in the wells gradually disappearing.
To test the ability of TOP2A mutants to decatenate DNA, we performed decatenation assays using kinetoplast DNA (kDNA) as a time course. As seen in
Figure 7, WT enzyme decatenates the substrate fully by around 5 min. While all of the CTD mutants are also finished by ~2.5-5 min, K1520I and V1482D appear to be consistently faster than WT. N1462I/R1463L appears to be slightly faster than WT at the earliest time points.
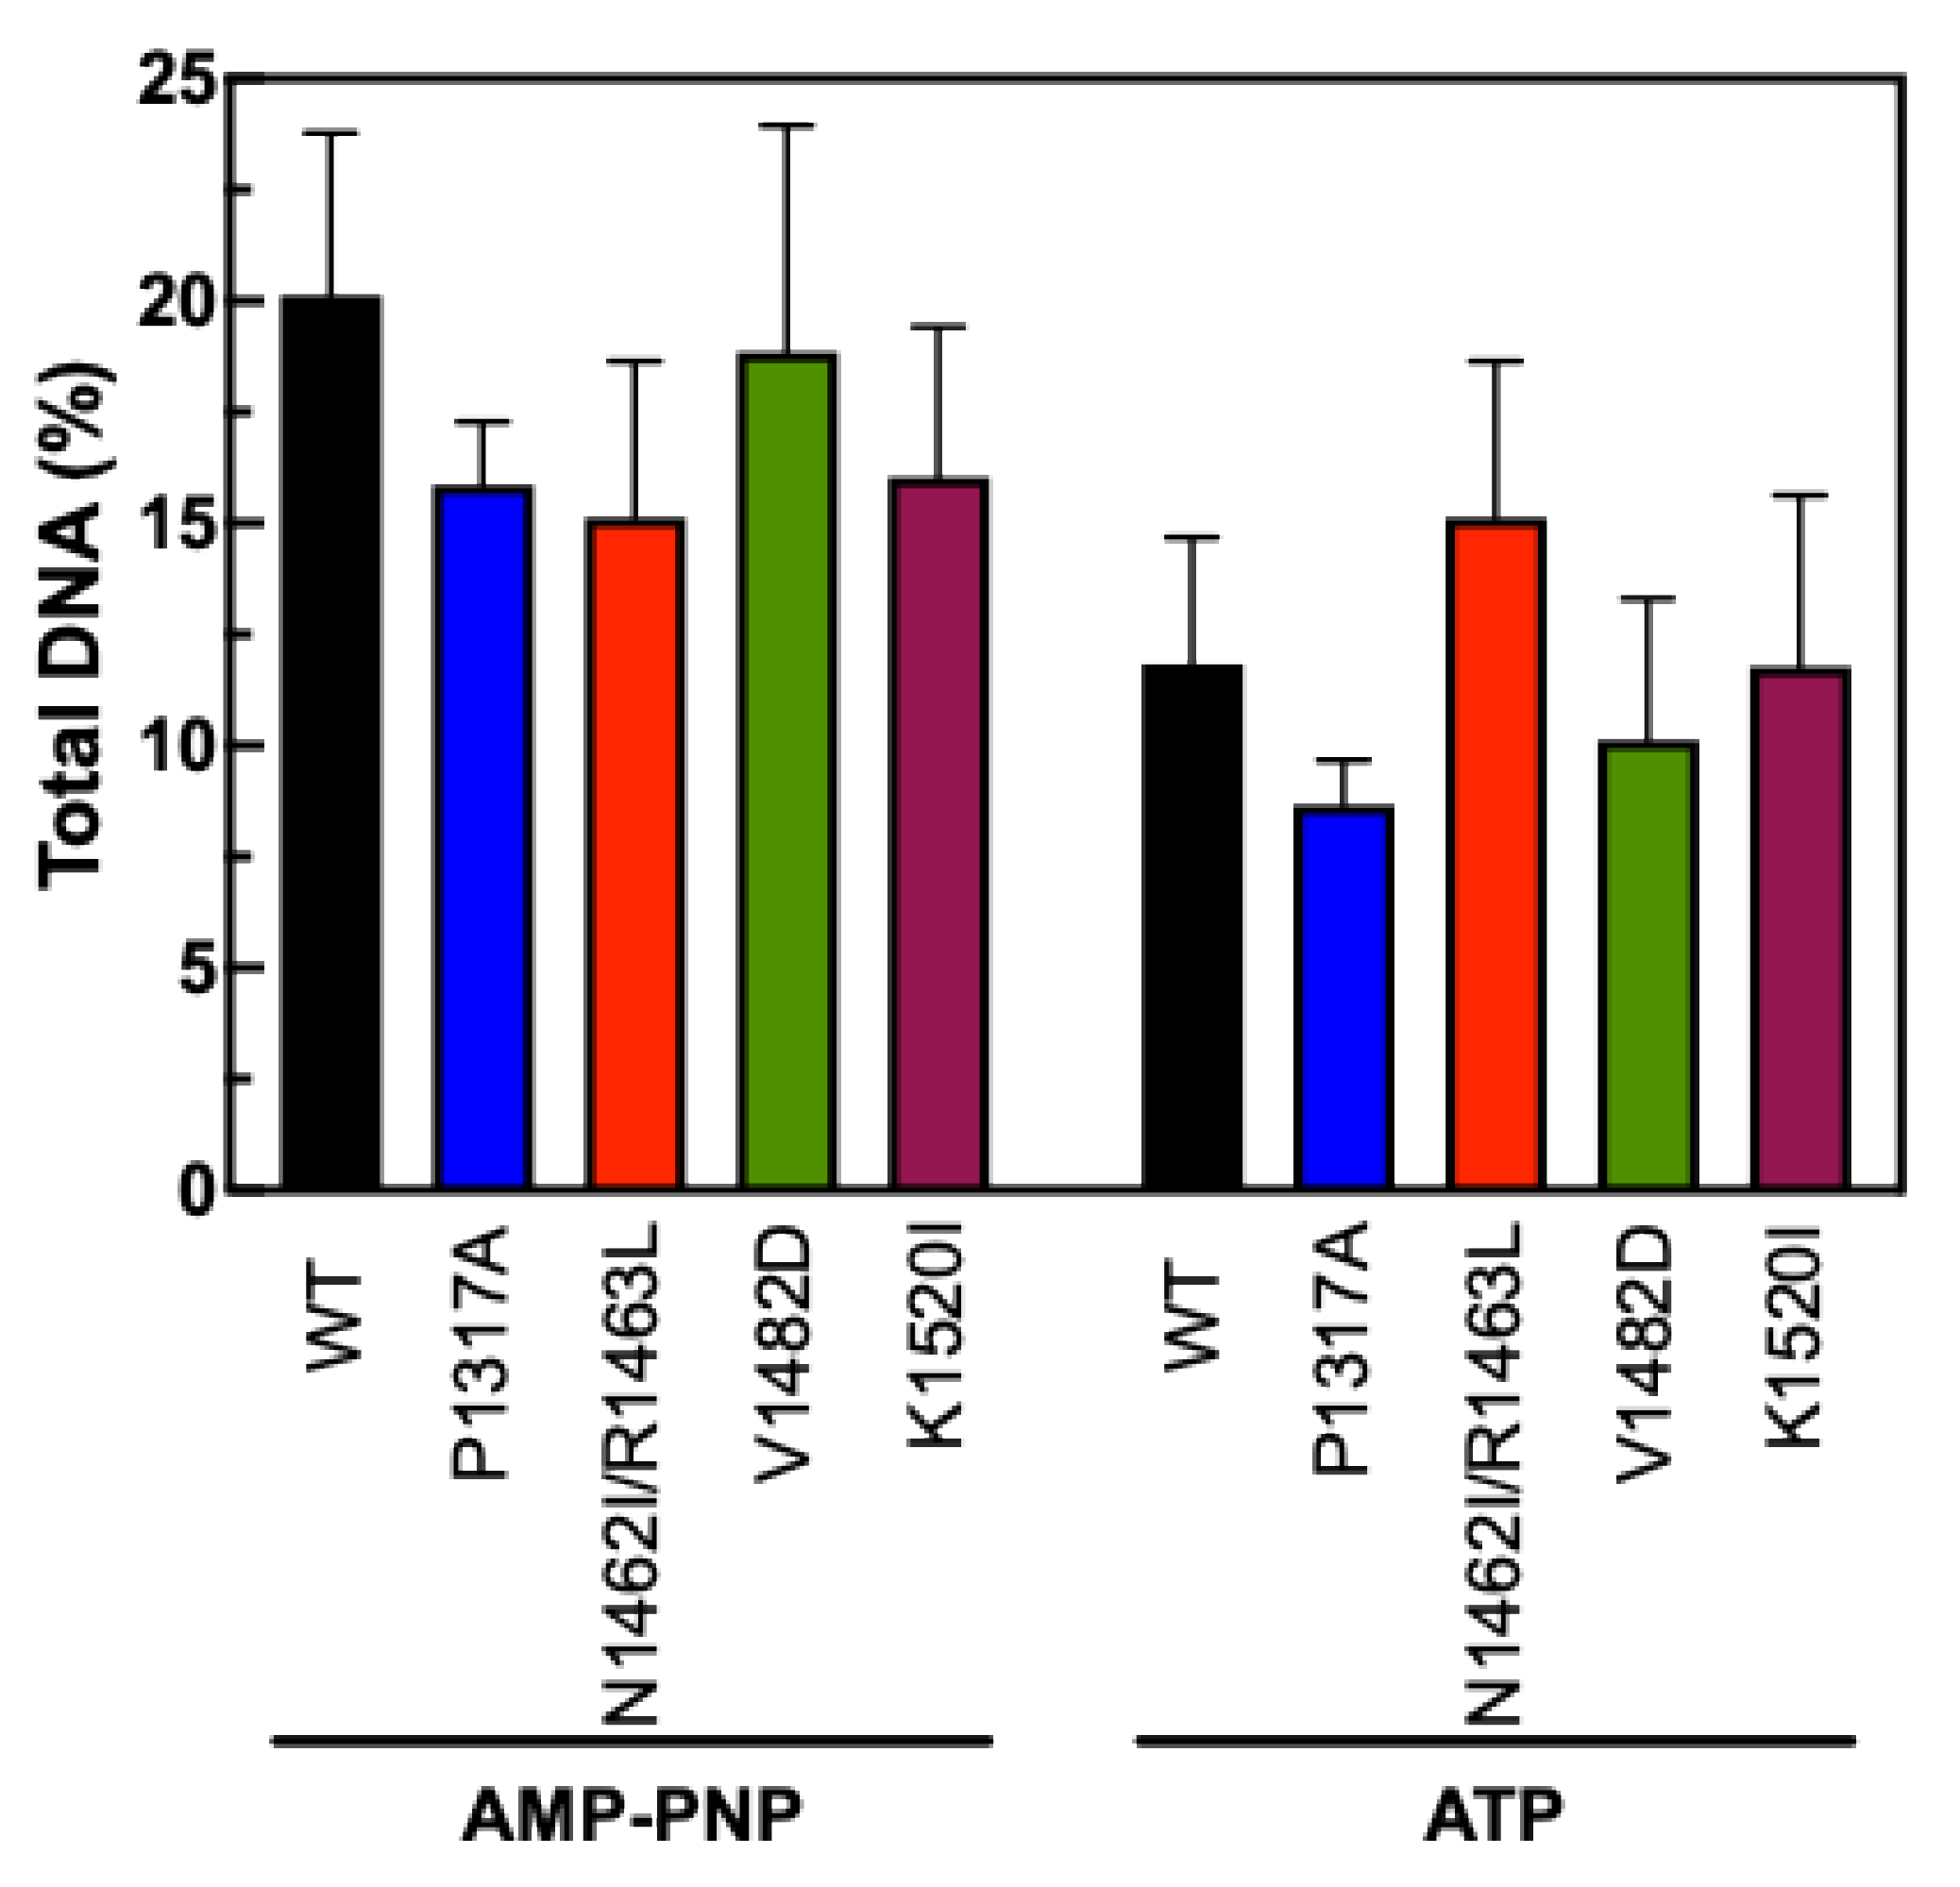
2.5. N-Terminal Clamp Stability of TOP2A CTD Mutants
The ability of TOP2A to bind to and remain on DNA also involves the amino-terminus (N-terminus), which includes the ATPase domain and a region termed the N-terminal clamp [
50,
51]. This portion of the enzyme closes around the DNA after the two segments of DNA are captured. It is unclear whether the CTD impacts the function of the N-terminal clamp, but previous results from our lab did not show a major impact of CTD mutations on N-terminal clamp stability [
44].
To measure the stability of the N-terminal clamp of TOP2A CTD mutants, we employed an updated fluorescence-based version of an assay that has been used in the past [
44,
52,
53]. For this version, DNA and TOP2A were incubated together prior to being applied to a glass fiber filter that binds well to protein but not DNA. The filters were washed with low and high salt washes prior to being soaked in proteinase K to digest any remaining protein. If the DNA and enzyme are not bound, the DNA will flow through the filter. If the enzyme is clamped around the DNA, the DNA will remain on the filter until the proteinase K digestion. AMP-PNP is an ATP analog that is expected to “trap” the enzyme while ATP allows full catalytic activity. Our results in
Figure 8 indicate that none of the CTD mutants significantly increased or decreased the stability of the N-terminal clamp. The AMP-PNP results show a slight increase above the ATP data, which is consistent with previous results indicating the ability of AMP-PNP to stabilize the clamp around DNA. Together, these results suggest that the effects seen on decatenation and relaxation are not due to any alteration of the function of the N-terminal clamp.
3. Discussion
Examination of the CTD of TOP2A has been challenging due to the disordered nature of the region. Structural biology has offered some insights along with enzymology and molecular biology. However, many questions remain unanswered about how the CTD functions and what role(s) it plays in regulating the function of TOP2A.
In this current study, we have extended our previous work on selective mutagenesis of the CTD by generating four new point mutants of TOP2A for analysis. These positions were initially selected based upon bioinformatic information, which turned out to be anomalous [
29]. Nevertheless, the analysis of these mutants was completed.
In looking at overall catalytic activity, V1482D displays faster relaxation than the WT TOP2A. Interestingly, this does not appear to result from either increase DNA cleavage, increased coordination of DNA cleavage, or increased DNA binding as measured by EMSA.
Further, V1482D displays slightly faster decatenation than WT. In contrast, K1520I displays WT relaxation activity but increased decatenation compared to WT. Together these results appear to indicate that relaxation and decatenation activities are not equivalent. This has been observed previously and implies that the CTD may impact one function without having an observable impact on the other [
28].
The increase in relaxation or decatenation over WT levels may reflect a slight shift in the way the enzyme selects and interacts with substrates. TOP2A preferentially relaxes positive supercoils, and this selectivity is traced to the CTD [
20,
54]. Therefore, the observations here regarding V1482D and K1520I align with the fact that the CTD influences substrate selection. Without structural data on these sites and the nature of the interactions, it is difficult to clarify the nature of these interactions and how the changes impact the shape of the CTD and thus the interaction with DNA substrates.
None of the mutations impacted the N-terminal clamp stability in the presence of either AMP-PNP or ATP. This has been observed with previous CTD mutations as well [
44]. This evidence may indicate that the role of the CTD does not regulate or significantly impact the ability of the N-terminus to capture DNA segments.
In terms of the bioinformatic clustering of the results via PSICalc, V1482D clusters with positions that were previously mutated causing decreased relaxation activity. Clearly, this region is important for interactions involved in relaxation. The opposite nature of the effect on the enzyme likely reflects the distinct nature of the mutations.
K1520I is part of the chromatin tether domain, which interacts with chromatin [
23]. While the substrates used in these studies did not have histones, it is possible this region still interacts with DNA. The fact that decatenation occurs more quickly may reflect the ability to release the substrate more readily.
Neither P1317A nor the double mutant N1462I/R1463L had a strong impact on catalytic activities. Each of these mutations is near regions that were mutated previously and impacted relaxation activity [
28]. The fact that these mutations had no impact suggests that the changes were either too subtle or were in a location that does not greatly affect activity.
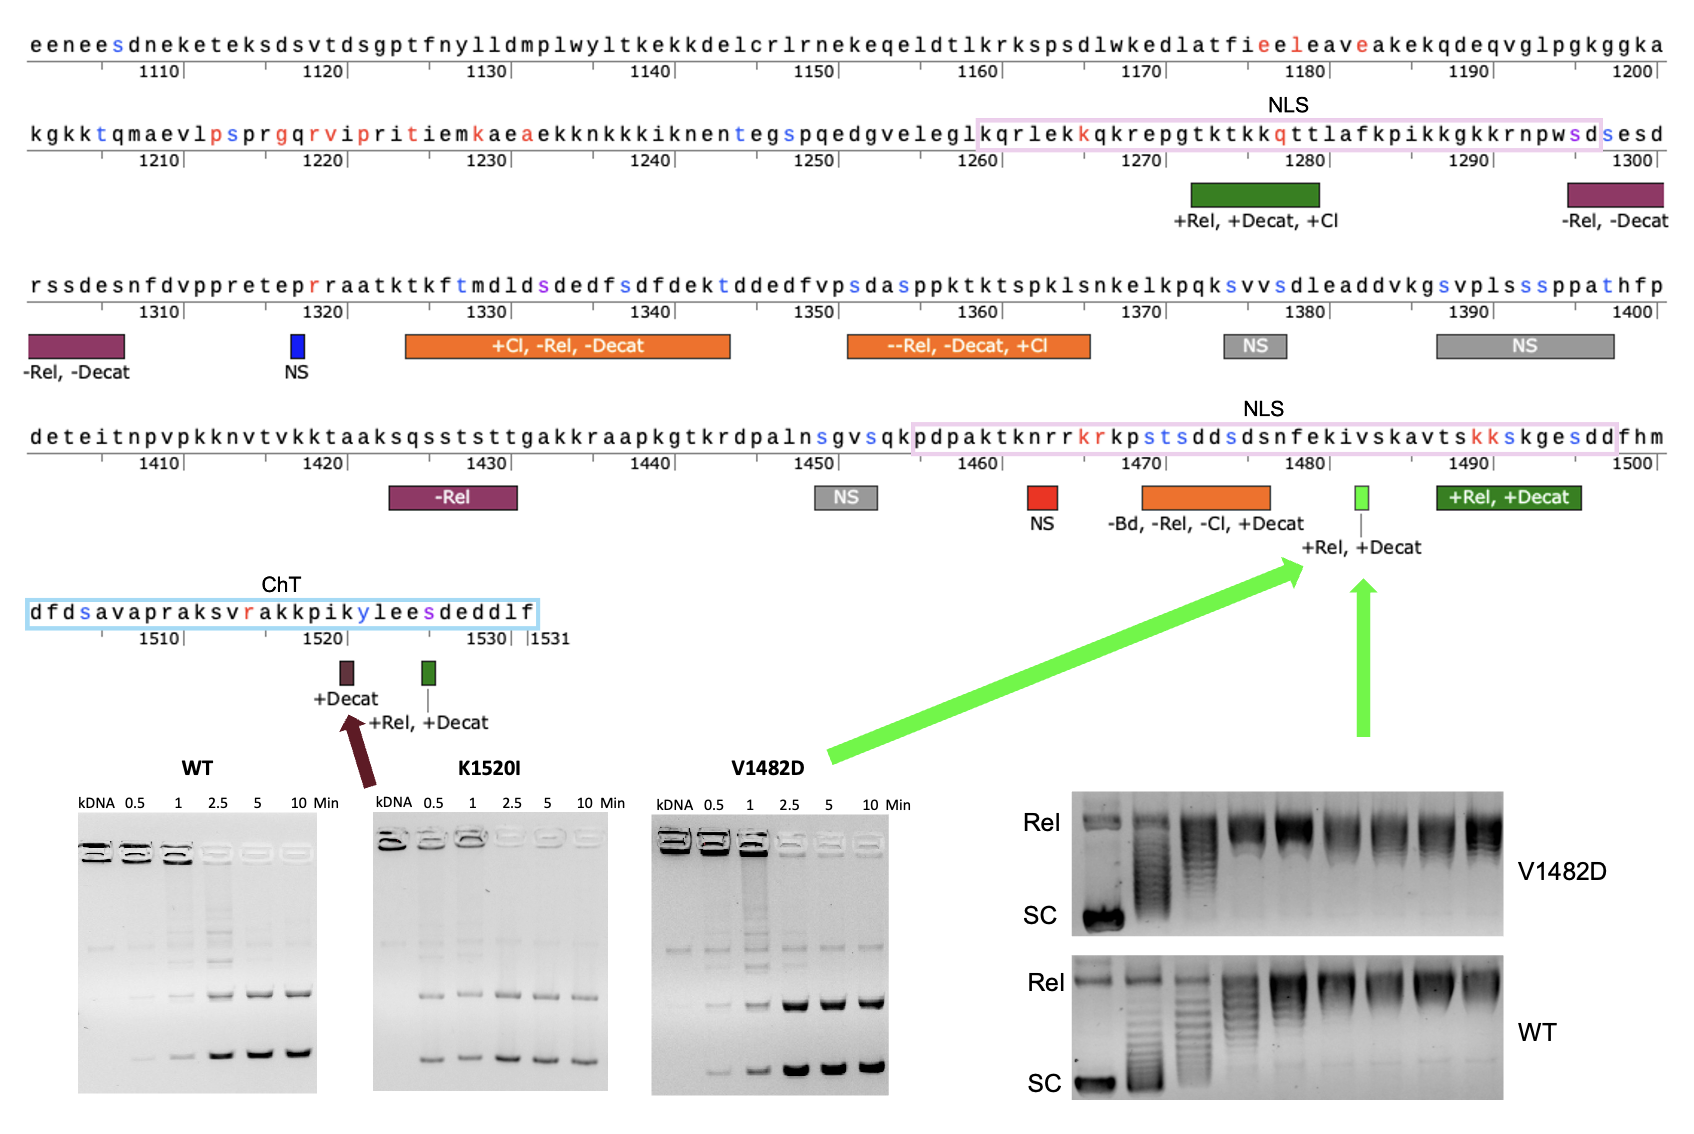
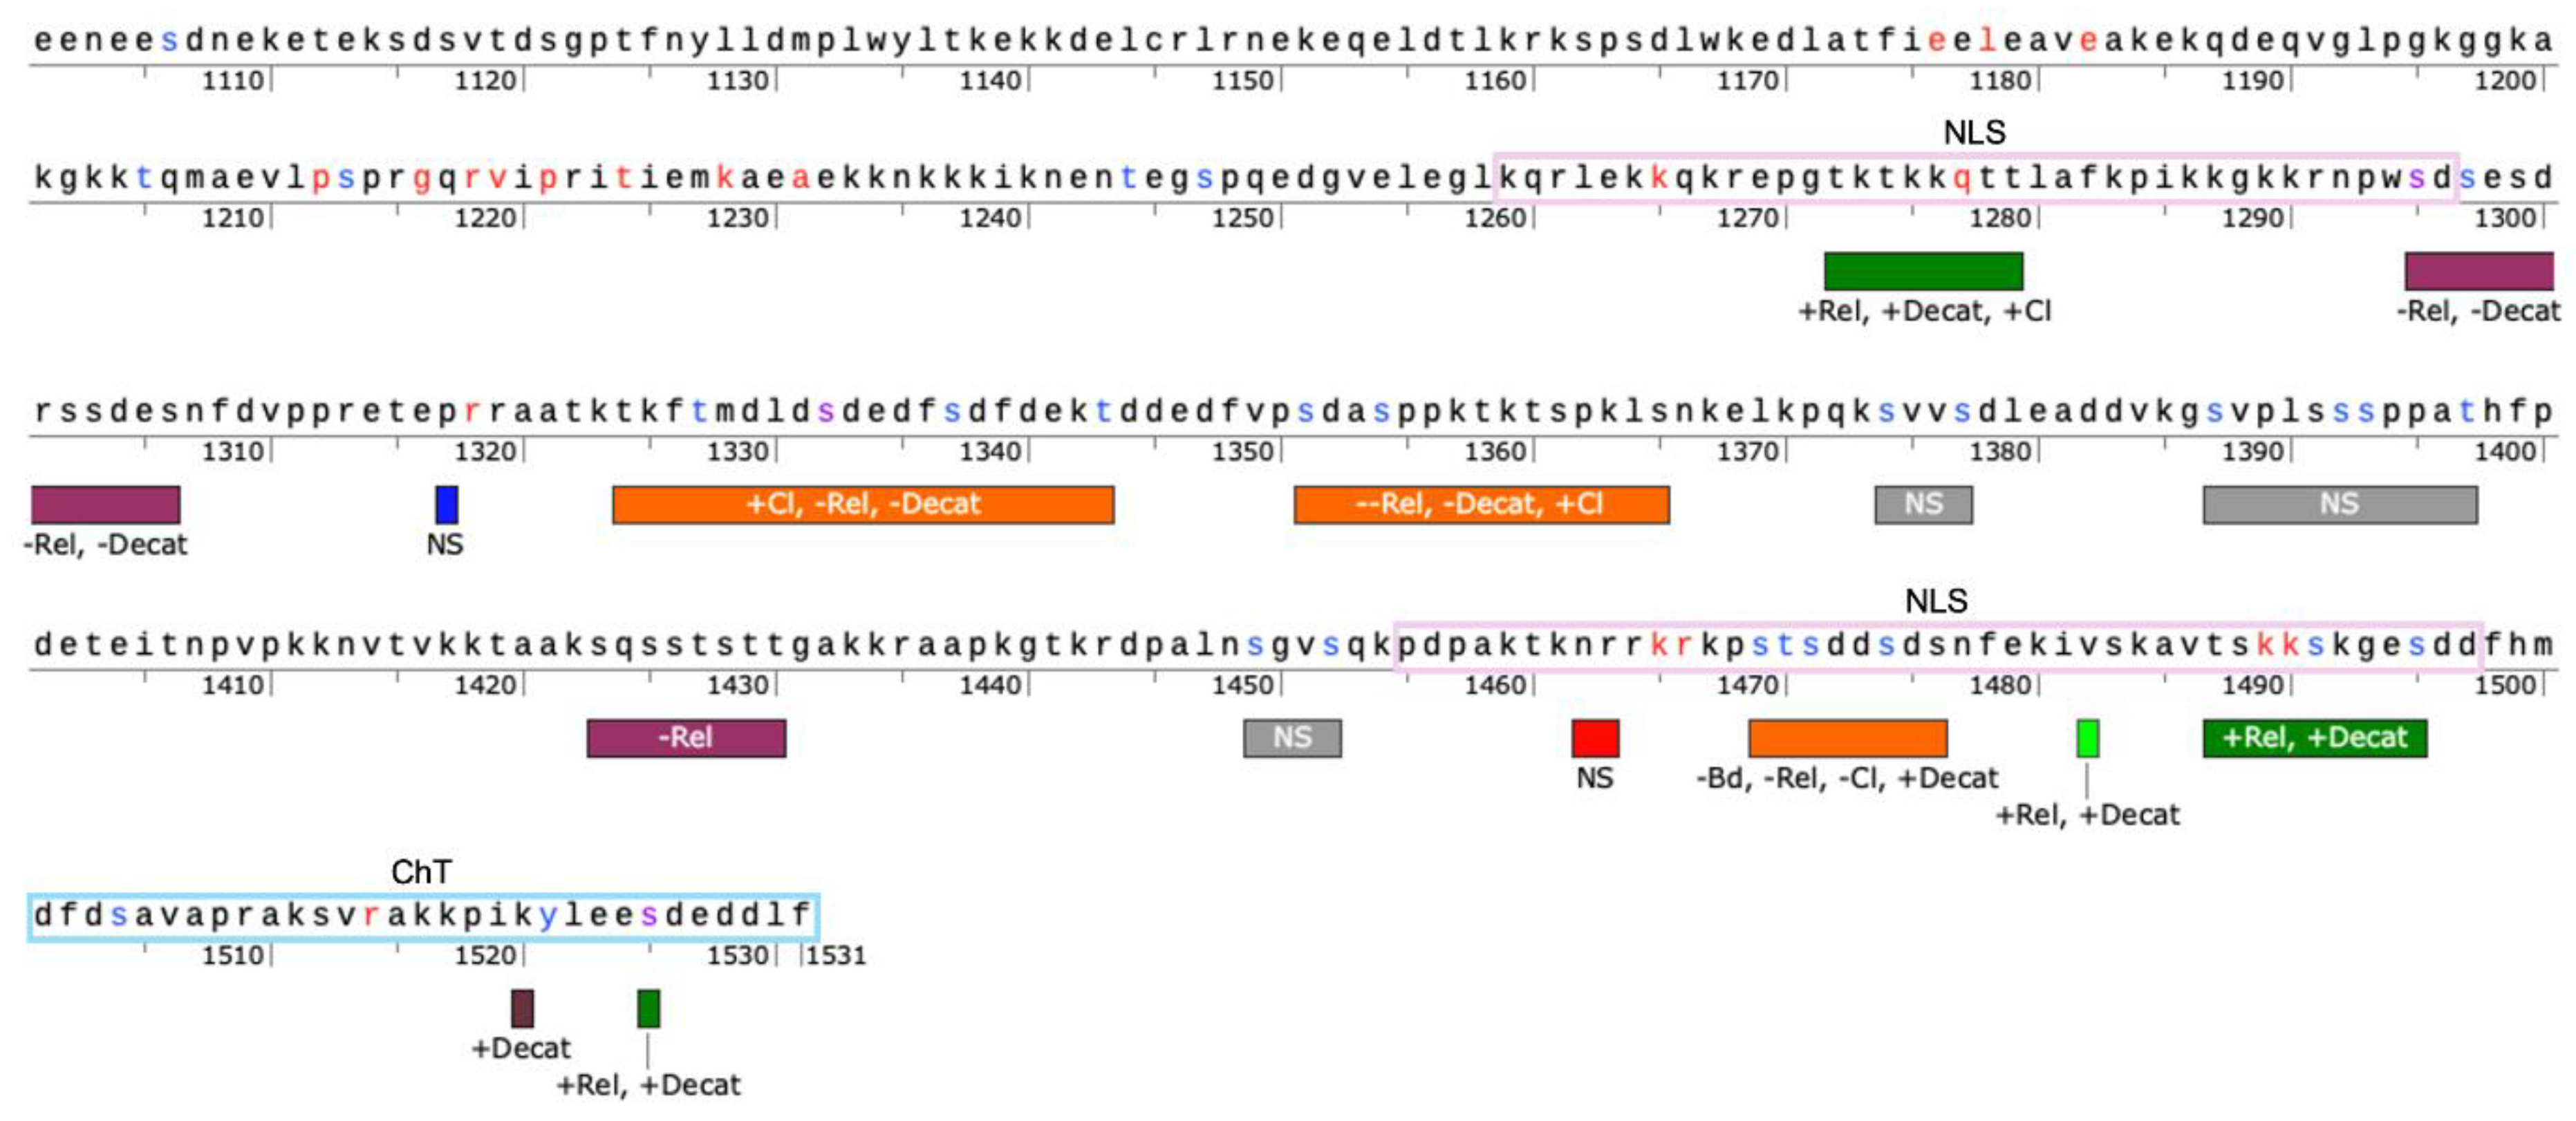
Taken together, these results support the fact that the CTD does impact TOP2A catalytic function but that not all positions have a discernable impact at least with the amino acid substitutions that were selected. Further work needs to be done to explore the segregation of function between relaxation and decatenation. To aid in this work,
Figure 9 provides a map of the CTD based upon this currently work along with our previous work indicating regions where activity levels increase or decrease following mutation [
28,
44]. As seen in the map, there appear to be regions that generally increase catalytic activity such as ~1270-1280 and ~1485-1495. There also appear to be regions that decrease catalytic activity such as ~1295-1306 and ~1423-1430. On the other hand, some regions appear to have a variable effect such ~1323-1343 and ~1351-1365, but it should be noted that these two regions appear to have a more negative impact on overall catalytic activity.
4. Materials and Methods
4.1. Enzymes, Substrates, and Reagents
Enzymes were expressed and purified using a previously-designed construct for human TOP2A with an N-terminal domain 6x-His-tag sequence [
28]. Mutagenesis and sequencing to validate changes were carried out by GenScript (Piscataway, NJ). The amino acid changes are documented in
Table 1. Sequencing data are available upon request. Wild-type and mutant human TOP2A were individually expressed in S. cerevisiae JEL1Δtop1 cells from the pESC-URA-TOP2A expression construct. Enzymes were purified as described previously [ref]. The enzymes were stored at −80 °C as a 1 mg/mL (4 μM) stock in 50 mM Tris−HCl, pH 7.7, 0.1 mM ethylenediaminetetraacetic acid (EDTA), 750 mM KCl, and 5% glycerol.
Negatively supercoiled pHOT1 and pBR322 plasmid DNA were purified from Escherichia coli using a Plasmid Mega Kit (Qiagen). Kinetoplast DNA (kDNA) was purchased from Topogen (Buena Vista, CO). Etoposide (Sigma, St. Louis, MO) was stored as a 20 mM stock in 100% DMSO at 4 °C. Etoposide was diluted to 2 mM in 10% DMSO for preparation of working solutions.
4.2. Topoisomerase IIα Plasmid DNA Relaxation Assay
Plasmid relaxation reactions were performed using a previously used procedure [
28]. Each reaction mixture contained 14 nM WT or mutant TOP2A, 5 nM negatively supercoiled pBR322 plasmid DNA, and 1 mM ATP in 20 µL of 10 mM Tris−HCl, pH 7.9, 175 mM KCl, 0.1 mM Na
2EDTA, 5 mM MgCl
2, and 2.5% glycerol. Relaxation time courses of up to 30 minutes were started by the addition of enzyme and incubated at 37°C for varying time points before stopping by adding 3 µL of stop solution [77.5 mM Na
2EDTA, 0.77% sodium dodecyl sulfate (SDS)]. After stopping the reactions, the reaction was mixed with 2 µL of 5x nucleic acid sample loading buffer. Samples were loaded into a 1.33% agarose TBE gel and subjected to electrophoresis at 150 V for 2 hours. The gel was stained in ethidium bromide and then visualized using a Bio-Rad ChemiDoc MP Imaging System and Image Lab Software (Hercules, CA). DNA relaxation was monitored by the conversion of the supercoiled plasmid DNA to relaxed topoisomers.
4.3. Topoisomerase IIα Plasmid DNA Cleavage Assay
Plasmid DNA cleavage reactions were performed using an adapted procedure from Fortune and Osheroff [
55]. Reaction mixtures contained 144 nM TOP2A, 5 nM plasmid DNA, 0-25 µM etoposide (1% DMSO final concentration) in a solution of 10 mM Tris (pH 7.9), 100 mM KCl, 0.1 mM Na
2EDTA, 5 mM MgCl
2, and 2.5% glycerol. Each reaction is started by the addition of enzyme to the reaction mixture and incubated at 37 °C for 6 minutes prior to the addition of 2 µL 2.5% SDS to stop the reaction. The reactions are removed from heat and 2 µL 250 mM Na
2EDTA and 2 µL 1x ProK in 50 mM Tris pH 7.9, 1 mM CaCl
2 are added to each reaction. The reactions are incubated at 45 °C for 30 minutes, after which 2 μL Nucleic Acid Sample Loading Buffer (Bio-Rad, Hercules, CA) are added to each tube. The reaction tubes are electrophoresed in a 1% TAE gel at 125 V for 2 hours. Results of the experiment are visualized and quantified using a Bio-Rad ChemiDoc MP Imaging System and Image Lab Software (Bio-Rad, Hercules, CA).
4.4. Topoisomerase IIα Binding of Plasmid DNA
Plasmid DNA binding reactions were performed using a previously used procedure [
28]. The reaction mixtures consist of approximately 0-4 μg (0-576 nM) of wild-type or mutant TOP2A and 0.3 μg pHOT-1 DNA plasmid in a 20 μL volume of 10 mM Tris−HCl, pH 7.9, 150 mM KCl, 1 mM EDTA, 5 mM MgCl
2, and 2.5% glycerol. Following the addition of the enzyme, the reaction mixture is incubated at 37 °C for 6 minutes to allow for binding. The binding reactions are then mixed with 2 μL Nucleic Acid Sample Loading Buffer (Bio-Rad, Hercules, CA), and the samples are then electrophoresed in 2% TAE gels containing ethidium bromide at 150 V for 2 hrs. DNA bands are visualized and quantified using a Bio-Rad ChemiDoc MP Imaging System and Image Lab Software (Bio-Rad, Hercules, CA).
4.5. Decatenation of Kinetoplast DNA (kDNA) by Topoisomerase IIα
The kDNA decatenation assays were performed as previously described with some modifications [
28]. Each reaction mixture contained 14 nM TOP2A enzyme, 0.21 μg of kDNA, and 1 mM ATP in a 20 μL volume composed of 10 mM Tris−HCl, pH 7.9, 175 mM KCl, 5 mM MgCl
2, 0.1 mM Na
2EDTA, 2.5% glycerol. After the addition of the enzyme, the mixture is incubated at 37°C and stopped using 3 μL of a stop solution composed of 0.5% SDS and 77 mM Na
2EDTA at time points ranging from 0.5-15 min. Each sample was then treated with proteinase K and incubated at 45°C for 30 min. Nucleic Acid Sample Loading Buffer (Bio-Rad, Hercules, CA) was then added to the samples before being electrophoresed in 1% TBE gels for 60 min at 150 V. The gels were stained with ethidium bromide before being imaged using a Bio-Rad ChemiDoc MP Imaging System and Image Lab Software (Bio-Rad, Hercules, CA).
4.6. Clamp Closing
The clamp closing assays were performed using an adapted procedure from Roca and Wang [
56]. All reaction mixtures were incubated at 37°C for 20 minutes and contained 0.5 μg pBR322 plasmid DNA in a solution of clamp closing buffer: 50 mM Tris (pH 7.7), 100 mM KCl, 1 mM Na
2EDTA, and 8 mM MgCl
2. Individual reaction conditions contained 0.3 μg WT or mutant TOP2A, 1 mM ATP or AMP-PNP. Glass fiber filters were prepared by soaking the filters for 20 minutes with 60 μL of SSDNA pre-wash, containing 6 μg acetylated BSA, 6 μg salmon sperm DNA, 50 mM Tris (pH 7.7), 100 mM KCl, 1 mM Na
2EDTA, and 8 mM MgCl
2, which were then washed to remove the excess salmon sperm DNA. The reactions were placed on the filters then run through a series of washes with 200 μL of low salt wash (50 mM Tris [pH 7.7], 100 mM KCl, 1 mM Na
2EDTA, and 8 mM MgCl
2), 300 μL of high salt wash (1 M NaCl, 50 mM Tris [pH 7.7], 100 mM KCl, 1 mM Na
2EDTA, and 8 mM MgCl
2), and 20 μL of proteinase K wash (2 μL of 1 mg/mL proteinase K in 18 μL of low salt wash). All washes were centrifuged at 1000 rpm for 60 seconds. The proteinase K wash was incubated at 45°C for 20 minutes. The flow-through was collected and the DNA from the low salt wash and proteinase K wash was directly quantified. The high salt wash flow-through was purified using a Monarch Plasmid DNA Purification Kit before being quantified. DNA samples were quantified using PreciseGreen, a dsDNA specific dye on an Agilent BioTek Synergy H1 Multi-Mode Microplate Reader and Gen6 Data Analysis Software.
4.7. Data Visulation
All graphs presented in this study were generated using Graphpad Prism 10 (Graphpad Software, Boston, MA).
5. Conclusions
This work lays the foundation for additional research on the CTD. It appears that this work, consistent with previous research, supports the idea that the CTD influences TOP2A catalytic activity especially as it relates to relaxation and decatenation. This result is likely broadly applicable to TOP2A. More research remains to further chart the impacts of mutations on the TOP2A CTD structure and function.
Author Contributions
Conceptualization, J.E.D.; methodology, J.E.D., J.W.C., A.K.O., A.J.T., D.N., B.D.W., L.K., L.G.S., N.T.; investigation, J.W.C., A.K.O., A.J.T., M.R.H., B.D.L., D.N., L.G.S., B.D.W., L.K., N.M.T., C.E.E.; resources, J.E.D., C.E.E., J.W.C., B.D.W., N.M.T.; data curation, J.E.D., J.W.C., A.K.O., L.G.S., B.D.W.; writing—original draft preparation, J.W.C., J.E.D., A.J.T., A.K.O.; writing—review and editing, J.E.D., J.W.C., A.K.O.; visualization, J.W.C., J.E.D., A.K.O., D.N., L.G.S., B.D.W.; supervision, J.E.D.; project administration, J.E.D.; funding acquisition, J.E.D. All authors have read and agreed to the published version of the manuscript.
Funding
This research was funded by the Biological, Physical, and Human Sciences Department, the Jobe Center for Excellence, the Heintzman Research Fund, the FHU Day of Giving, and the Center for Science and Culture.
Institutional Review Board Statement
Not Applicable
Informed Consent Statement
Not applicable.
Data Availability Statement
Datasets are available upon reasonable request to the corresponding author.
Acknowledgments
J.W.C., A.K.O, A.J.T., M.R.H., B.D.L., D.N., L.G.S., B.D.W, L.K., N.T., and C.E.E. were participants in the Biochemical and Biomedical Sciences Summer Research Program at Freed-Hardeman University supported by the FHU Day of Giving and the BPHS Department.
Conflicts of Interest
The authors declare no conflicts of interest.
Abbreviations
The following abbreviations are used in this manuscript:
| BSA |
Bovine serum albumin |
| ChT |
Chromatin tether domain |
| CTD |
C-terminal domain |
| decat |
Decatenated |
| DSB |
Double strand break |
| EMSA |
Electrophoretic mobility shift assay |
| IDP |
Intrinsically disordered proteins |
| IDR |
Intrinsically disordered protein regions |
| kDNA |
Kinetoplast DNA |
| TOP2 |
Topoisomerase II |
| TOP2A |
Topoisomerase IIα |
| TOP2B |
Topoisomerase IIβ |
| NLS |
Nuclear localization sequence |
| NT |
No topoisomerase II (without the presence of TOP2A) |
| N-terminus |
Amino-terminus |
| Rel |
Relaxed |
| SC |
Supercoiled |
| SSB |
Single strand break |
| WT |
Wildtype |
References
- Iakoucheva, L.M.; Radivojac, P.; Brown, C.J.; O’Connor, T.R.; Sikes, J.G.; Obradovic, Z.; Dunker, A.K. The importance of intrinsic disorder for protein phosphorylation. Nucleic Acids Res. 2004, 32, 1037–1049. [Google Scholar] [CrossRef] [PubMed]
- Dyson, H.J.; Wright, P.E. Intrinsically unstructured proteins and their functions. Nature Reviews Molecular Cell Biology 2005, 6, 197–208. [Google Scholar] [CrossRef] [PubMed]
- van der Lee, R.; Buljan, M.; Lang, B.; Weatheritt, R.J.; Daughdrill, G.W.; Dunker, A.K.; Fuxreiter, M.; Gough, J.; Gsponer, J.; Jones, D.T.; et al. Classification of intrinsically disordered regions and proteins. Chem Rev 2014, 114, 6589–6631. [Google Scholar] [CrossRef] [PubMed]
- Biesaga, M.; Frigolé-Vivas, M.; Salvatella, X. Intrinsically disordered proteins and biomolecular condensates as drug targets. Curr. Opin. Chem. Biol. 2021, 62, 90–100. [Google Scholar] [CrossRef]
- Fuxreiter, M. Classifying the Binding Modes of Disordered Proteins. Int. J. Mol. Sci. 2020, 21. [Google Scholar] [CrossRef]
- Musselman, C.A.; Kutateladze, T.G. Characterization of functional disordered regions within chromatin-associated proteins. iScience 2021, 24, 102070. [Google Scholar] [CrossRef]
- Zhao, B.; Katuwawala, A.; Oldfield, C.J.; Hu, G.; Wu, Z.; Uversky, V.N.; Kurgan, L. Intrinsic Disorder in Human RNA-Binding Proteins. J. Mol. Biol. 2021, 433, 167229. [Google Scholar] [CrossRef]
- Gunasekaran, K.; Tsai, C.J.; Kumar, S.; Zanuy, D.; Nussinov, R. Extended disordered proteins: targeting function with less scaffold. Trends Biochem Sci 2003, 28, 81–85. [Google Scholar] [CrossRef]
- Boija, A.; Klein, I.A.; Sabari, B.R.; Dall'Agnese, A.; Coffey, E.L.; Zamudio, A.V.; Li, C.H.; Shrinivas, K.; Manteiga, J.C.; Hannett, N.M.; et al. Transcription Factors Activate Genes through the Phase-Separation Capacity of Their Activation Domains. Cell 2018, 175, 1842–1855.e1816. [Google Scholar] [CrossRef]
- Cho, W.K.; Spille, J.H.; Hecht, M.; Lee, C.; Li, C.; Grube, V.; Cisse, II. Mediator and RNA polymerase II clusters associate in transcription-dependent condensates. Science 2018, 361, 412–415. [Google Scholar] [CrossRef]
- Trivedi, P.; Palomba, F.; Niedzialkowska, E.; Digman, M.A.; Gratton, E.; Stukenberg, P.T. The inner centromere is a biomolecular condensate scaffolded by the chromosomal passenger complex. Nat. Cell Biol. 2019, 21, 1127–1137. [Google Scholar] [CrossRef] [PubMed]
- Zamudio, A.V.; Dall'Agnese, A.; Henninger, J.E.; Manteiga, J.C.; Afeyan, L.K.; Hannett, N.M.; Coffey, E.L.; Li, C.H.; Oksuz, O.; Sabari, B.R.; et al. Mediator Condensates Localize Signaling Factors to Key Cell Identity Genes. Mol. Cell 2019, 76, 753–766. [Google Scholar] [CrossRef] [PubMed]
- Jeong, J.; Lee, J.H.; Carcamo, C.C.; Parker, M.W.; Berger, J.M. DNA-Stimulated Liquid-Liquid phase separation by eukaryotic topoisomerase ii modulates catalytic function. Elife 2022, 11. [Google Scholar] [CrossRef]
- Vanden Broeck, A.; Lotz, C.; Drillien, R.; Haas, L.; Bedez, C.; Lamour, V. Structural basis for allosteric regulation of Human Topoisomerase IIalpha. Nat Commun 2021, 12, 2962. [Google Scholar] [CrossRef] [PubMed]
- Townsley, T.D.; Wilson, J.T.; Akers, H.; Bryant, T.; Cordova, S.; Wallace, T.L.; Durston, K.K.; Deweese, J.E. PSICalc: a novel approach to identifying and ranking critical non-proximal interdependencies within the overall protein structure. Bioinform Adv 2022, 2, vbac058. [Google Scholar] [CrossRef]
- Adachi, N.; Miyaike, M.; Kato, S.; Kanamaru, R.; Koyama, H.; Kikuchi, A. Cellular distribution of mammalian DNA topoisomerase II is determined by its catalytically dispensible C-terminal domain. Nucleic Acids Res. 1997, 25, 3135–3142. [Google Scholar]
- Dickey, J.S.; Osheroff, N. Impact of the C-terminal domain of topoisomerase IIα on the DNA cleavage activity of the human enzyme. Biochemistry 2005, 44, 11546–11554. [Google Scholar] [CrossRef]
- Linka, R.M.; Porter, A.C.; Volkov, A.; Mielke, C.; Boege, F.; Christensen, M.O. C-terminal regions of topoisomerase IIα and IIβ determine isoform-specific functioning of the enzymes in vivo. Nucleic Acids Res. 2007, 35, 3810–3822. [Google Scholar]
- Meczes, E.L.; Gilroy, K.L.; West, K.L.; Austin, C.A. The impact of the human DNA topoisomerase II C-terminal domain on activity. PLoS One 2008, 3, e1754. [Google Scholar] [CrossRef]
- McClendon, A.K.; Gentry, A.C.; Dickey, J.S.; Brinch, M.; Bendsen, S.; Andersen, A.H.; Osheroff, N. Bimodal recognition of DNA geometry by human topoisomerase II alpha: preferential relaxation of positively supercoiled DNA requires elements in the C-terminal domain. Biochemistry 2008, 47, 13169–13178. [Google Scholar] [CrossRef]
- Luo, K.; Yuan, J.; Chen, J.; Lou, Z. Topoisomerase IIalpha controls the decatenation checkpoint. Nat. Cell Biol. 2009, 11, 204–210. [Google Scholar] [CrossRef] [PubMed]
- Gilroy, K.L.; Austin, C.A. The impact of the C-terminal domain on the interaction of human DNA topoisomerase II alpha and beta with DNA. PLoS One 2011, 6, e14693. [Google Scholar] [CrossRef] [PubMed]
- Lane, A.B.; Gimenez-Abian, J.F.; Clarke, D.J. A novel chromatin tether domain controls topoisomerase IIalpha dynamics and mitotic chromosome formation. J. Cell Biol. 2013, 203, 471–486. [Google Scholar] [CrossRef] [PubMed]
- Clarke, D.J.; Azuma, Y. Non-Catalytic Roles of the Topoisomerase IIalpha C-Terminal Domain. Int. J. Mol. Sci. 2017, 18. [Google Scholar] [CrossRef]
- Kozuki, T.; Chikamori, K.; Surleac, M.D.; Micluta, M.A.; Petrescu, A.J.; Norris, E.J.; Elson, P.; Hoeltge, G.A.; Grabowski, D.R.; Porter, A.C.G.; et al. Roles of the C-terminal domains of topoisomerase IIalpha and topoisomerase IIbeta in regulation of the decatenation checkpoint. Nucleic Acids Res. 2017, 45, 5995–6010. [Google Scholar] [CrossRef]
- Lotz, C.; Lamour, V. The interplay between DNA topoisomerase 2α post-translational modifications and drug resistance. Cancer Drug Resistance 2020, 3. [Google Scholar] [CrossRef]
- Hoang, K.G.; Menzie, R.A.; Rhoades, J.H.; Fief, C.A.; Deweese, J.E. Reviewing the Modification, Interactions, and Regulation of the C-terminal Domain of Topoisomerase IIα as a Prospect for Future Therapeutic Targeting. EC Pharmacology & Toxicology 2020, 8, 27–43. [Google Scholar]
- Dougherty, A.C.; Hawaz, M.G.; Hoang, K.G.; Trac, J.; Keck, J.M.; Ayes, C.; Deweese, J.E. Exploration of the Role of the C-Terminal Domain of Human DNA Topoisomerase IIalpha in Catalytic Activity. ACS Omega 2021, 6, 25892–25903. [Google Scholar] [CrossRef]
- Endsley, C.E.; Moore, K.A.; Townsley, T.D.; Durston, K.K.; Deweese, J.E. Bioinformatic Analysis of Topoisomerase IIalpha Reveals Interdomain Interdependencies and Critical C-Terminal Domain Residues. Int. J. Mol. Sci. 2024, 25. [Google Scholar] [CrossRef]
- Pommier, Y.; Sun, Y.; Huang, S.N.; Nitiss, J.L. Roles of eukaryotic topoisomerases in transcription, replication and genomic stability. Nat. Rev. Mol. Cell Biol. 2016, 17, 703–721. [Google Scholar] [CrossRef]
- Deweese, J.E.; Osheroff, N. The DNA cleavage reaction of topoisomerase II: wolf in sheep's clothing. Nucleic Acids Res. 2009, 37, 738–749. [Google Scholar] [CrossRef]
- Jian, J.Y.; Osheroff, N. Telling Your Right Hand from Your Left: The Effects of DNA Supercoil Handedness on the Actions of Type II Topoisomerases. Int. J. Mol. Sci. 2023, 24. [Google Scholar] [CrossRef] [PubMed]
- Witz, G.; Stasiak, A. DNA supercoiling and its role in DNA decatenation and unknotting. Nucleic Acids Res. 2010, 38, 2119–2133. [Google Scholar] [CrossRef]
- Roca, J.; Berger, J.M.; Harrison, S.C.; Wang, J.C. DNA transport by a type II topoisomerase: direct evidence for a two-gate mechanism. Proc. Natl. Acad. Sci. USA 1996, 93, 4057–4062. [Google Scholar] [CrossRef] [PubMed]
- Aravind, L.; Leipe, D.D.; Koonin, E.V. Toprim--a conserved catalytic domain in type IA and II topoisomerases, DnaG-type primases, OLD family nucleases and RecR proteins. Nucleic Acids Res. 1998, 26, 4205–4213. [Google Scholar] [CrossRef] [PubMed]
- Lee, S.; Jung, S.R.; Heo, K.; Byl, J.A.; Deweese, J.E.; Osheroff, N.; Hohng, S. DNA cleavage and opening reactions of human topoisomerase IIalpha are regulated via Mg2+-mediated dynamic bending of gate-DNA. Proc. Natl. Acad. Sci. U.S.A. 2012, 109, 2925–2930. [Google Scholar] [CrossRef]
- Cowell, I.G.; Casement, J.W.; Austin, C.A. To Break or Not to Break: The Role of TOP2B in Transcription. Int. J. Mol. Sci. 2023, 24. [Google Scholar] [CrossRef]
- Murphy, M.B.; Mercer, S.L.; Deweese, J.E. Inhibitors and Poisons of Mammalian Type II Topoisomerases. In Advances in Molecular Toxicology, Fishbein, J.C., Heilman, J., Eds.; Academic Press: Cambridge, MA, 2017; Volume 11, pp. 203–240. [Google Scholar]
- Cowell, I.G.; Austin, C.A. Mechanism of Generation of Therapy Related Leukemia in Response to Anti-Topoisomerase II Agents. Int. J. Environ. Res. Public Health 2012, 9, 2075–2091. [Google Scholar] [CrossRef]
- Cowell, I.G.; Sondka, Z.; Smith, K.; Lee, K.C.; Manville, C.M.; Sidorczuk-Lesthuruge, M.; Rance, H.A.; Padget, K.; Jackson, G.H.; Adachi, N.; et al. Model for MLL translocations in therapy-related leukemia involving topoisomerase IIbeta-mediated DNA strand breaks and gene proximity. Proc. Natl. Acad. Sci. U.S.A. 2012, 109, 8989–8994. [Google Scholar] [CrossRef]
- Atwal, M.; Lishman, E.L.; Austin, C.A.; Cowell, I.G. Myeloperoxidase Enhances Etoposide and Mitoxantrone-Mediated DNA Damage: A Target for Myeloprotection in Cancer Chemotherapy. Mol. Pharmacol. 2017, 91, 49–57. [Google Scholar] [CrossRef]
- Mirski, S.E.; Gerlach, J.H.; Cummings, H.J.; Zirngibl, R.; Greer, P.A.; Cole, S.P. Bipartite nuclear localization signals in the C terminus of human topoisomerase IIa. Exp. Cell Res. 1997, 237, 452–455. [Google Scholar] [PubMed]
- Mirski, S.E.; Gerlach, J.H.; Cole, S.P. Sequence determinants of nuclear localization in the alpha and beta isoforms of human topoisomerase II. Exp. Cell Res. 1999, 251, 329–339. [Google Scholar] [PubMed]
- Musselman, J.R.; England, D.C.; Fielding, L.A.; Durham, C.T.; Baxter, E.; Jiang, X.; Lisic, E.C.; Deweese, J.E. Topoisomerase IIα C-terminal Domain Mutations and Catalytic Function. bioRxiv, 2007. [Google Scholar] [CrossRef]
- Durston, K.K.; Chiu, D.K.; Wong, A.K.; Li, G.C. Statistical discovery of site inter-dependencies in sub-molecular hierarchical protein structuring. EURASIP J. Bioinform. Syst. Biol. 2012, 2012. [Google Scholar] [CrossRef]
- Hornbeck, P.V.; Zhang, B.; Murray, B.; Kornhauser, J.M.; Latham, V.; Skrzypek, E. PhosphoSitePlus, 2014: mutations, PTMs and recalibrations. Nucleic Acids Res. 2015, 43, D512–520. [Google Scholar] [CrossRef]
- Deweese, J.E.; Osheroff, N. Coordinating the two protomer active sites of human topoisomerase II: nicks as topoisomerase II poisons. Biochemistry 2009, 48, 1439–1441. [Google Scholar]
- Regal, K.M.; Mercer, S.L.; Deweese, J.E. HU-331 is a catalytic inhibitor of topoisomerase IIα. Chem. Res. Toxicol. 2014, 27, 2044–2051. [Google Scholar] [CrossRef]
- Lavrukhin, O.V.; Fortune, J.M.; Wood, T.G.; Burbank, D.E.; Van Etten, J.L.; Osheroff, N.; Lloyd, R.S. Topoisomerase II from Chlorella virus PBCV-1. Characterization of the smallest known type II topoisomerase. The Journal of Biological Chemistry 2000, 275, 6915–6921. [Google Scholar] [CrossRef]
- Vaughn, J.; Huang, S.; Wessel, I.; Sorensen, T.K.; Hsieh, T.; Jensen, L.H.; Jensen, P.B.; Sehested, M.; Nitiss, J.L. Stability of the topoisomerase II closed clamp conformation may influence DNA-stimulated ATP hydrolysis. J. Biol. Chem. 2005, 280, 11920–11929. [Google Scholar] [CrossRef]
- Laponogov, I.; Veselkov, D.A.; Crevel, I.M.; Pan, X.S.; Fisher, L.M.; Sanderson, M.R. Structure of an 'open' clamp type II topoisomerase-DNA complex provides a mechanism for DNA capture and transport. Nucleic Acids Res. 2013, 41, 9911–9923. [Google Scholar] [CrossRef]
- Wilson, J.T.; Fief, C.A.; Jackson, K.D.; Mercer, S.L.; Deweese, J.E. HU-331 and Oxidized Cannabidiol Act as Inhibitors of Human Topoisomerase IIalpha and beta. Chem. Res. Toxicol. 2018, 31, 137–144. [Google Scholar] [CrossRef]
- Keck, J.M.; Conner, J.D.; Wilson, J.T.; Jiang, X.; Lisic, E.C.; Deweese, J.E. Clarifying the Mechanism of Copper(II) alpha-(N)-Heterocyclic Thiosemicarbazone Complexes on DNA Topoisomerase IIalpha and IIbeta. Chem. Res. Toxicol. 2019, 32, 2135–2143. [Google Scholar] [CrossRef] [PubMed]
- McClendon, A.K.; Osheroff, N. The geometry of DNA supercoils modulates topoisomerase-mediated DNA cleavage and enzyme response to anticancer drugs. Biochemistry 2006, 45, 3040–3050. [Google Scholar] [CrossRef] [PubMed]
- Fortune, J.M.; Osheroff, N. Merbarone inhibits the catalytic activity of human topoisomerase IIα by blocking DNA cleavage. J. Biol. Chem. 1998, 273, 17643–17650. [Google Scholar] [CrossRef] [PubMed]
- Roca, J.; Wang, J.C. The capture of a DNA double helix by an ATP-dependent protein clamp: a key step in DNA transport by type II DNA topoisomerases. Cell 1992, 71, 833–840. [Google Scholar] [CrossRef]
|
Disclaimer/Publisher’s Note: The statements, opinions and data contained in all publications are solely those of the individual author(s) and contributor(s) and not of MDPI and/or the editor(s). MDPI and/or the editor(s) disclaim responsibility for any injury to people or property resulting from any ideas, methods, instructions or products referred to in the content. |
© 2025 by the authors. Licensee MDPI, Basel, Switzerland. This article is an open access article distributed under the terms and conditions of the Creative Commons Attribution (CC BY) license (http://creativecommons.org/licenses/by/4.0/).