
Submitted:
07 March 2025
Posted:
10 March 2025
You are already at the latest version
Abstract
Background/Objectives: FhSAP-2 is a 11.5kDa recombinant protein belonging to the Fasciola hepatica saposin-like/NK-lysin protein family. It has shown to induce partial protection >60% (reduction in parasite burden and parasite egg output) against F. hepatica challenge infection when delivered subcutaneously in rabbits and mice, either emulsified in Freund’s adjuvant or as inclusion bodies. The protection induced by FhSAP-2 was associated with increased levels of IgG2a and IFNγ. However, despite FhSAP-2 being a promising vaccine candidate, its hydrophobic character has made its purification a challenged process. The present study aimed to determine whether a modified 9.8kDa variant of protein (mFhSAP-2), lacking the string of 15 hydrophobic amino acids at amino terminus containing a dominant Th1-epitope, could retain its immunogenic and Th1-inducing properties. Methods: RAW264.7 cells were stimulated with mFhSAP-2, and levels of TNFα were determined. C57BL6 mice were immunized with mFhSAP-2 alone or emulsified with Montanide ISA50. Levels of each specific anti-mFhSAP-2 IgG subtypes, their avidity and titers were measured by ELISA. T-cell proliferation index as well as levels of CD4+/CD8+ and IFNγ /IL-4 ratios were determined. Results: In vitro, mFhSAP-2 induced dose-dependent TNFα production in RAW264.7 cells. In vivo, mice immunized with mFhSAP-2 alone induced 1.76-fold higher than IgG2a and 1.28-fold higher than IgG1, whereas mice immunized with mFhSAP-2+ISA50 developed 2.16-fold more IgG2c than IgG2a and 1.49-fold more IgG2c than IgG1. All mice developed high-avidity IgG2a and IgG2c antibodies. Mice immunized with mFhSAP-2+ISA50 developed higher IgG2a and IgG2c titers (1:6,400 and 1:25,600, respectively) than those immunized with mFhSAP-2 alone (1:1,600 and 1:3,200, respectively). Immunization with mFhSAP-2+ISA50 also induced significantly high activated CD4+/CD8+ T-cells and IFNγ/IL-4 ratios. Conclusions: Our results showed that mFhSAP-2 retained its immunogenicity and Th1-polarizing properties, which were enhanced by Montanide ISA-50 adjuvant.
Keywords:
C57BL6
; IgG2a
; IgG2c
; Avidity
; FhSAP-2
; IFN (List three to ten pertinent keywords specific to the article yet reasonably common within the subject discipline
1. Introduction
Like many other helminths, Fasciola hepatica infections are distinguished by developing dominant Th2/Treg immune responses. This immunological environment effectively prevents exacerbated inflammation and facilitates parasite survival within the mammalian host [1,2]. In the initial stages of infection in animals it is possible to detect levels of IgG2a and IFNγ, which are signature of Th1 responses. However, these levels decrease rapidly as infection progresses to the chronic phase. Thus, the dominance of a Th2 response supports the theory of a mixed initial Th1/Th2-like cytokine response that eventually is overtaken by a Th2-like profile as the disease progresses in Fasciola-infected animals [1,2]. Interestingly, animals that develop resistance to infection, exhibit high levels of IgG2 and IFNγ [3,4]. These observations suggest an inverse correlation between chronic F. hepatica infection and the induction of a parasite-specific Th1 response. These findings support the hypothesis that while a Th2 response is promoted during chronic fasciolosis, a robust Th1 response may be a crucial factor to induce resistance to the F. hepatica infection. Consequently, in developing a vaccine against F. hepatica using a protective antigen expressed in the early stages of infection, capable of polarizing the immune response toward a Th1 response represents a promising approach. In our previous studies, we demonstrated that FhSAP-2 could be a strong vaccine candidate that effectively induces this type of immune response to combat F. hepatica infection.
FhSAP-2 is a recombinant polypeptide of ~11.5kDa that belongs to the F. hepatica saposin-like/NK-lysin protein family [5]. It is highly expressed in several developmental stages of the parasite, including undeveloped eggs, newly-excysted juveniles (NEJs), and adult stages, and it is specifically localized in the gut epithelial cells and glycocalyx of both NEJs and adults [6]. When FhSAP-2 is administered subcutaneously (SC) in complete Freund’s adjuvant (CFA) or in the form of inclusion bodies (IBs), it induces partial immunity resulting in a >60-80% reduction in parasite burden and significant reduction of liver damage) in mice and rabbits challenged with F. hepatica metacercariae [7,8]. Although CFA and IBs are suitable adjuvants for research purposes, their severe inflammatory and associated side effects they produce prohibit their use in commercial vaccine formulations for both, humans and veterinary applications. The protein moiety of FhSAP-2 is rich in hydrophobic amino acids (39.6%) and contains two dominant B-cells and Th1-epitopes in its protein structure [9,10]. One of the dominant Th1 epitopes (11AVTFA15) is localized within the first 16 amino acids at the amino terminus, which also comprises a string of hydrophobic and hydroxylic amino acid residues predicted to constitute an N-terminal signal cleavage site between amino acids Ala15 and Ser16 [5]. The high hydrophobicity of FhSAP-2 makes this protein very difficult to purify, due to its tendency to aggregate and form non-specific interactions with other molecules in solution. This study aimed to determine whether a modified version of FhSAP-2, lacking the string of 15 hydrophobic amino acid sequence at the amino terminus and consequently missing a dominant Th1 epitope, could be easier to purify while still retaining immunogenicity comparable to the full-length protein. Additionally, this study also aimed to determine whether the modified protein (mFhSAP-2) when administrated without an adjuvant or emulsified in a commercially well-accepted adjuvant for human or veterinary use such as Montanide ISA50, could still induce Th1-type immune responses in mice. Since the measuring of IgG2a or IgG2c antibody subtypes along with the production of IFNγ and IL-4 in response to a vaccine, is essential for assessing the relative contribution of Th1 versus Th2 immune responses, we compared the levels of IgG2a and IgG2c antibody subtypes along with their avidities and titers using ELISA. Moreover, we investigated the capacity of mFhSAP-2 to stimulate TNFα secretion from macrophages-like cells in vitro, as well as the activation status of T-cells, and their production of IFNγ and IL-4 in vivo using flow cytometry. This comprehensive approach provided for a more accurate assessment of Th1/Th2 immune responses, offering deeper insight into the immune mechanisms.
2. Materials and Methods
2.1. Recombinant Protein Production and Purification
The cDNA encoding full-length FhSAP-2 (GeneBank AF286903) [5] comprises 306 bp and encodes a polypeptide of 101 amino acid residues, with a calculated molecular mass of 11.5 kDa and an isoelectric point (pI) of 4.63. Because the first 48 bp of FhSAP-2 encode 16 amino acids of FhSAP-2 (1MNPLFVLMLAAVTFAS16), which are predominantly hydrophobics and includes a predicted signal peptide cleavage site between amino acids Ala15 and Ser16 [5], this sequence was omitted. Only the remaining 258bp were synthesized and cloned into the vector pET30a (+) using the restriction enzymes Kpnl and Hind-III. Thus, the resulting polypeptide comprised 85 amino acid residues with a calculated molecular mass of 9.8 kDa, which was termed mFhSAP-2. To facilitate detection and purification a sequence of six histidine amino acids (6His) and a synthetic GST tag were added to the amino terminus enhancing its solubility. A TEV protease recognition sequence (ENLYFQS) was also inserted between the GST-tag and the mFhSAP-2 coding region to allow the recovery of the tag-free protein after an enzymatic digestion (Figure 1). The fusion protein 6His-GST-mFhSAP-2 was expressed in Escherichia coli BL21 StarTM DE3. A single colony of transformed E. coli-BL21 was inoculated into 5 mL of Luria Broth (LB) medium containing 100 µg/mL kanamycin and grown overnight at 37°C with shaking at 200 rpm. The pre-culture was then transferred to 1 L of LB-kanamycin pH 7.2 and incubated on a continuous shaker (250 rpm) at 37°C. When the absorbance at 600 nm reached 0.6-0.8, the fusion-protein expression was induced by adding isopropylthio-β-galactoside (IPTG) to a final concentration of 0.2mM followed by incubation at 37°C for 4h. After incubation, the cells were harvested by centrifugation at 10,000 x g for 20 min at 4°C. The bacterial pellets were lysed by sonication under denaturing conditions (using 6M urea, 2M guanidine thiocyanate, 20 mM Tris-HCl, 500 mM NaCl, and 15 mM imidazole). The bacterial lysate was centrifuged at 10,000 x g for 20 min at 4°C, then filtered through a 0.45 µm membrane, and loaded onto a HiTrap Chelating HP column (Cytiva, Malborough, MA, USA) for purification as previously described [5]. After elution, the purified mFhSAP-2 was desalted against PBS with a PD-10 column (Cytiva, Malborough, MA, USA), and subjected to digestion and endotoxin removal cycles using polymyxin B (PMB) columns according to the manufacturer’s instructions. Once the endotoxin levels assessed using a Chromogenic Limulus Amebocyte Lysate (Lonza, Walkersville, MD), were bellow 0.19 EU/mg, mFhSAP-2 was concentrated by AMICON Ultracentrifugal Filters (YM-3) and its concentration was adjusted to 1.0 mg/mL, as determined by the BCA method. The purified endotoxin-free mFhSAP-2 was stored in aliquots at -80°C until use.
2.2. Circular Dichroism (CD
CD spectroscopy was used to analyze the secondary structure of mFhSAP-2. The protein was diluted in 0.1M phosphate-buffered saline (PBS) pH 7.2 to achieve a concentration of ~200 µg/mL. CD spectra were collected using a J-1500 (Jasco) CD spectropolarimeter (Jasco Inc., Tokyo, Japan). Measurements were taken in a 1 mm cuvette at room temperature (25°C) over a wavelength range of 190–250 nm. Spectra were recorded at a scan speed of 50 nm/min, with a data pitch of 0.1 nm and a bandwidth of 1 nm. Three spectra were measured to improve the signal-to-noise ratio. The raw CD spectra data were analyzed using the BeStSelTM (2014-2024) web server (https://bestsel.elte.hu/index.php) developed by ELTE Eötvös Loránd University (Budapest, Hungary), which determines the secondary structure based on the experimental values. The results were then compared with a secondary structure prediction made using the SOPM server [5].
2.3. Animals
Wild type inbred C57BL6 mice (both sex, 6-8 weeks old) were obtained from Charles River Laboratories (Wilmington, MA USA). Animals were housed and maintained under standard conditions at 21°C and 12 h light-dark cycle, with access to food and water ad-libitum. The animal study protocol was approved by the Institutional Animal Care and Use Committee (IACUC) of the University of Puerto Rico Medical Sciences Campus (Protocols no. 7870104, and 7870106).
2.4. Cell Culture and mFhSAP-2 Treatment
RAW264.7 murine macrophage cells were obtained from ATCC (Manassas, VA, USA). Cells were seeded at 5 x 10⁵ cells/mL in 24-wells culture plates in DMEM with L-glutamine, sodium pyruvate and sodium bicarbonate (Sigma Aldrich, St Louis, MO, USA) supplemented with 10% fetal bovine serum (FBS), 100 U/mL penicillin and 100 μg/mL streptomycin. Cells were treated in triplicate with mFhSAP-2 at concentrations of 5, 10, 15, and 20 µg/mL, 10 µg/mL lipopolysaccharide (LPS) from E. coli 0111: B4 or PBS. After treatment, cells were incubated overnight at 37°C and 5% CO2.
2.5. Cell Viability Assay
RAW264.7 cells were seeded at 1 x10⁵ cells/well in 96-well flat bottom plates and treated with LPS (10 μg/mL), mFhSAP-2 (5, 10, 15 and 20 μg/mL) or PBS and incubated for 24 h at 37°C, 5% CO2. Following incubation, cell viability was assessed by adding 50μL XTT (sodium 3′-[1-(phenylaminocarbonyl)-3,4 tetrazolium]-bis(4-methoxy-6-nitro) benzene sulfonic acid hydrate) labeling reagent (Abcam, Cambridge, UK) to each well. The absorbance was read at 450 nm.
2.6. Measurement of TNF-α Levels in Cell Culture Supernatants by ELISA
After incubation, culture media from RAW264.7 cells treated with mFhSAP-2, LPS or PBS were collected, and centrifuged at 1,000 x g for 10 minutes. The supernatants were then used to measure levels of tumor necrosis factor-alpha (TNF-α) using the commercially available Enzyme-linked immunosorbent assay (ELISA) kit from Abcam (Cambridge, UK), following the manufacturer’s instructions.
2.7. Sera from Fasciola Hepatica Infected Animals
The sera from F. hepatica infected animals used in this study were obtained from the sera bank of the Molecular Parasitology and Immunology Laboratory, at the Department of Microbiology of University of Puerto Rico-Medical Sciences Campus. Samples included sera from 16 New Zealand White (NZW) rabbits that were orally infected with 30 F. hepatica metacercariae (mc). Eight of these were collected between 3 to 6 weeks after infection (early infection) and eight between 10 to 12 weeks after the infection (late infection). This study also included serum samples from 11 inbred mice (6 C57BL/6 and 5 BALB/c mice) collected between days 15 to 21 after an oral infection with 10 F. hepatica mc each. The infection of both rabbits and mice was confirmed by the presence of immature or mature flukes in their respective livers [11,12]. Serum samples from naïve NZW rabbits and naïve mice were included as negative controls (NC). The aliquots used in the present study had remained frozen at -80°C and had not been previously thawed.
2.8. Immunization of C57BL6 Mice with mFhSAP-2
A group of ten C57BL/6 mice (n=10) was injected subcutaneously three times with 50μg of mFhSAP-2 emulsified 1:1 in Montanide ISA50 (Seppic, Courbevoie, France). Each immunization was administered on the dorsal surface of the mice at biweekly intervals. Another group of mice (n=5) received the same immunization regimen with 50 μg of mFhSAP-2 without adjuvant. Two weeks after the last immunization (day 45 after the first immunization), the animals were bled out via retroorbital vein under deep anesthesia and euthanized for spleen collection. A group of naïve mice (n=5) that received only the adjuvant was used as negative control. Blood samples collected from immunized and control mice collected at the time of euthanasia were centrifuged at 2,000 rpm and the serum was stored at -80°C until use.
2.9. Enzyme-Linked Immunoassay (ELISA) for Determining Total Levels of IgG Antibody
Sera from rabbits and mice infected with F. hepatica and sera from mFhSAP-2 immunized mice, were analyzed by ELISA to measure specific IgG antibody levels using mFhSAP-2 as antigen, following a pre-established protocol that had been optimized by checkerboard titration. Briefly, certified high-binding polystyrene flat-bottom 96-well microplates (Corning, NY, USA) were coated with 100 µL/well of mFhSAP-2 (5 µg/mL) diluted in coating buffer (0.05 M carbonate-bicarbonate buffer, pH 9.6, Sigma Aldrich, St. Louis, MO, USA). Plates were incubated overnight at 4°C in a humid chamber and then washed three times with PBS containing 0.05% Tween-20 (PBST) using an automated microplate washer (Well Wash, Thermo Fisher Scientific, Waltham, MA, USA). After washing, the free-antigen binding sites in the wells were blocked by adding 300 µL/well of 4% bovine serum albumin (BSA, Sigma Aldrich, St. Louis, MO, USA), diluted in PBST. After 1 hour incubation at 37°C, the blocking solution was removed, and 100 µL/well of each serum sample (diluted 1:100 in PBST) was added to the plate in duplicate. Following incubation (1 hour at 37°C), the plates were washed three times, and 100 µL/well of anti-rabbit IgG HRP (Bio-Rad Laboratories, Hercules, CA, USA) or anti-mouse IgG-HRP (Cell Signaling Technology, Danvers, MA, USA), diluted 1:10,000 in PBST, was added. After 1 hour incubation at 37°C, the plates were washed to remove excess antibody. Then, 100 µL of substrate solution, consisting of 10 mg -phenylenediamine dihydrochloride (Sigma Aldrich, St. Louis, MO, USA), dissolved in 25 mL of 0.1 M citrate-phosphate buffer (Sigma Aldrich, St. Louis, MO, USA), and 10 µL of 30% H2O2 (Sigma Aldrich, St. Louis, MO, USA), was added to each well. The plate was incubated at room temperature (RT) in the dark to allow the enzymatic reaction to develop. The reaction was stopped by the addition of 50 µL/well of 10% HCl, and the absorbances were measured at 492 nm (OD492) using Multiskan FC (ThermoScientific, Walham, MA, USA).
2.10. ELISA for IgG Isotype Levels
To measure IgG isotypes in mouse sera, the same protocol described above for total IgG determination was followed with few modifications. Briefly, plates were coated, blocked, and incubated with serum samples as described for detecting total IgG. After sample incubation and washing steps, 100 µL of each specific goat anti-mouse IgG1, IgG2a, IgG3, or rabbit anti-mouse IgG2c (all from Sigma Aldrich, St. Luois, MO, USA) diluted 1:1,000 in PBST, was added. After 1 hour incubation at 37°C, the plates were washed to remove excess antibody. Then, 100 µL of either rabbit anti-goat IgG HRP (Bio-Rad Laboratories, Hercules, CA, USA) or goat anti-rabbit IgG-HRP (Bio-Rad Laboratories, Hercules, CA, USA) diluted 1:80,000 in PBST, was added. After incubation at 37°C for 1 hour, the plates were washed, and the reaction was developed as described for the total IgG ELISA. To determine the end-point titers for IgG2a and IgG2c, we followed the procedure described above for IgG isotype levels. The sera of mFhSAP-2 immunized mice were serially diluted from 1:100 to 1: 25,600 in PBST. The endpoint titer for IgG2a and IgG2c antibodies was defined as the highest dilution with an OD492 value above the cut-off, calculated as the average OD492 of negative control sera plus 2 standard deviations (SD).
2.11. Avidity of Anti-mFhSAP-2 IgG2a and IgG2c Antibodies
The avidity of specific anti-mFhSAP-2 IgG2a and IgG2c antibodies in immunized mice was determined using a urea-based dissociation ELISA, as described by Nazeri et al. (2020) [13]. Two ELISA plates were done in parallel: one for measuring the anti-mFhSAP-2 IgG2a and IgG2c isotypes and the other for measuring their avidity. The coating, blocking, and sample incubation steps were performed as described in the ELISA for total IgG. However, after sample incubation, one plate was washed three times with PBST as usual, while the other plate was washed three times with urea dissociation buffer (8M urea, Thermo Fisher Scientific, Waltham, MA, USA), diluted in PBST, and then washed once with PBST. Following the washes, both plates followed the protocol for detecting specific IgG2a and IgG2c described above. The avidity index (AI) was calculated as the ratio of the OD492 of the urea-treated samples to the untreated samples, multiplied by 100. The AI was interpreted as low if <30%, intermediate if between 30% and 50%, and high if >50%.
2.12. Splenocyte Proliferation
To assess the ability of mFhSAP-2 to induce T-cell proliferation from splenocytes, we used a CyQUANT® Cell Proliferation Assay Kit (Thermo Fisher Scientific, Waltham, MA, USA). This assay employs the green-fluorescent dye CyQUANT® GR dye, which exhibits strong fluorescence when bound to nucleic acids of viable cells, allowing for cell quantification based on fluorescence intensity. Splenocytes from C57BL/6 mice immunized with mFhSAP-2+ISA50 along with negative controls were thawed, diluted in supplemented high glucose RPMI-1640 with L-glutamine and HEPES (ATCC, Manassas, Virginia, USA) and centrifuged at 300 × g. Then, the cells were washed once and resuspended in RPMI-1640 supplemented with 10% heat inactivated fetal bovine sera (iFBS), 100 U/mL penicillin, and 100 µg/mL streptomycin and incubated at 37°C in 5% CO2 for 1 hour. After incubation, cell viability was assessed using trypan blue staining. Splenocytes from each mouse were seeded in triplicate at a concentration of 5x10⁴ cells/well in a flat-bottom 96-well plate. Cells were then stimulated with 10 µg/ml mFhSAP-2 or left unstimulated for 72 hours at 37°C in 5% CO2. Following incubation, the culture medium was carefully removed from each well and the plate was frozen at -80°C. On the day of the assay, a reference standard curve was generated on the same plate. To create the standard curve, a cell suspension (1×10⁶ cells/mL) stored at -80°C was thawed and used to prepare eight serial dilutions in CyQUANT® GR dye/cell-lysis buffer (diluted 1:80), starting from 250,000 viable cells/well (200 µL) ensuring to remain within the linear range of the assay. Negative controls (no cells) were also included. CyQUANT® GR dye/cell-lysis buffer (diluted 1:80) was then added to the remaining wells. After a 2 to 5-minute incubation, fluorescence was measured (excitation max: 480 nm, emission max: 520 nm). The cell proliferation index (CPI) was calculated as the ratio of the number of cells at 72 hours to the number of cells at 0 hours, based on the linear standard curve, where fluorescence (y) was correlated to cell numbers (x), using the formula y = A + Bx.
2.13. Flow Cytometry
Flow cytometry was performed to assess the activation status of CD4+ and CD8+ T cells as well as the intracellular secretion of IFN-γ and IL-4. Splenocytes were thawed as described above for the cell proliferation assay. Splenocytes from each mouse were seeded in duplicate at a concentration of 2x10⁵ cells/well in a round-bottom 96-well plate. Cells were stimulated with 10 µg/mL mFhSAP-2 for 24 hours at 37°C in 5% CO₂. After incubation, the plates were treated with Brefeldin A and incubated for 4 hours. Then, the plates were washed with FACS buffer (Biolegend, San Diego, CA, USA) and treated with 50 µL of an antibody cocktail containing anti-CD3 BV650 (diluted 1:400), anti-CD4 BV711 (diluted 1:400), anti-CD8a FITC (diluted 1:200), anti-CD69 BV785 (diluted 1:200), and viability dye Aqua (diluted 1:100) from Biolegend (San Diego, CA, USA), along with CD16/CD32 Fc block (diluted 1:500) from BD Biosciences (San Jose, CA, USA). Then, the plates were incubated for 30 minutes at 4°C in the dark, washed with FACS buffer, and fixed with 100 µL fixation buffer (BD Biosciences, San Jose, CA, USA) for 10 minutes at 4°C. After fixation, the cells were washed again, resuspended in FACS buffer, and stored at 4°C. The same procedure was followed for intracellular staining the day before flow cytometry analysis, except Perm/Wash buffer (BD Biosciences, San Jose, CA, USA) was used for washes and antibody preparation. The antibody cocktail for intracellular markers consisted of anti-IFN-γ from BD Biosciences (San Jose, CA, USA) and anti-IL-4 PE/Cy7 from Biolegend (San Diego, CA, USA), both diluted 1:200 in the cocktail. FACS buffer was used for the final wash and to resuspend cells. Data acquisition was performed using a 2-laser FACS Celesta flow cytometer (BD Biosciences, San Jose, CA, USA). Data were analyzed using FlowJo software v.10. To evaluate the Th1 response, the ratios of CD4+/CD8+ T cells and IFNγ/IL4 cytokines among activated T cells were calculated, with higher ratios indicating enhanced T helper cell activity and a stronger Th1 response, respectively.
2.14. Statistical Analysis
Data was expressed as mean values and mean standard error of the mean (SEM). The data was analyzed for normality with the Shapiro-Wilk test and outliers identified before statistical analyses. A Student’s t-test was used to determine significant differences between the groups, with p<0.05 considered significant. Analysis was performed using GraphPad Prism software (v.10).
3. Results
3.1. mFhSAP-2 Was Successfully Expressed in E. coli with High Purity and Yield
Transfection of pET30a (+)-6His-GST-mFhSAP-2 into E. coli BL21 StarTM DE3 competent bacteria resulted in the production of the recombinant fusion protein with a mmolecular weight of ~38.7 kDa as revealed by SDS-PAGE and Western blot (Figure S1). The optimum expression conditions for the protein were determined and reported in a previous study [5] (data not shown). After digestion and completion of endotoxin removal, mFhSAP-2 was recovered with 85% purity, a concentration of 1.20 mg/mL, and endotoxin levels 0.19 EU/mg.
3.2. mFhSAP-2 Exhibits a Secondary Structure Similar to that Predicted for Full-Length FhSAP-2
Circular dichroism (CD) spectra data was analyzed to estimate the fractional composition of each secondary structure element using the BeStSelTM (2014-2024) web server. The spectrum of mFhSAP-2 (Figure 2) recorded at pH 7.2, 25oC, revealed a composition of 66.0% α-helix, and 34.0% extended or random coil (Table 1). The CD data closely resemble the calculated data for the secondary structure of full-length FhSAP-2 as predicted by the SOPMA server [5].
3.3. mFhSAP-2 Induces TNFα Production in RAW264.7 Cells Without Affecting Cell Viability
RAW264.7 cells treated with mFhSAP-2 secreted detectable levels of TNFα in every sample tested. TNFα concentration in the culture media reached values of 432.03 150.16 pg/mL when cells were treated with 5 µg/mL mFhSAP-2. TNF levels progressively increased to 714.60 25.10; 878.0 127.00 and 1,329.7 255.70 pg/mL when cells were treated with mFhSAP-2 concentrations of 10, 15 and 20 µg/mL, respectively (Figure 3A). Negative control (NC) cells treated with PBS did not secrete any detectable levels of TNFα. However, cells treated with LPS secreted TNFα levels of ~1,404 125 pg/mL, which were not significantly different from those induced by the highest mFhSAP-2 concentration tested (20 g/mL) (Figure 3B). Importantly, none of the mFhSAP-2 concentrations tested or LPS treatments affected the viability of RAW264.7 cells, as evidenced by the high OD450 values obtained, which were similar or higher to those observed for the PBS treated cells (Figure 3C).
3.4. mFhSAP-2 Induces Strong Anti-mFhSAP-2 IgG Response in F. hepatica Infected and Immunized Animals
As shown in Figure 4, sera from rabbits and mice experimentally infected with F. hepatica exhibited a strong total IgG response against mFhSAP-2. There were no significant differences (ns) in the average OD492 values between the rabbit sera from early (1.288 0.581) and late infection (1.808 0.236) (Figure 4A). The average OD492 observed in infected mice was 1.614 0.665, suggesting that both rabbits and mice produce comparable levels of specific antibodies against mFhSAP-2 during F. hepatica infection. Statistically significant differences were found between the mice group immunized with mFhSAP-2 + ISA50 (average OD492 = 2.750 0.280) and the infected group (p<0.0001). However, no significant differences were found between infected and mFhSAP-2 immunized mice. Moreover, the group immunized with mFhSAP-2+ ISA50 also showed higher and statistically significant differences than the group immunized with mFhSAP-2 alone (p=0.0026, average OD492= 2.086 0.344) (Figure 4B). In contrast, antibody levels in control rabbits (average OD492= 0.007 0.007) and control mice (average OD492 = 0.136 0.084) were close to the assay background.
3.5. mFhSAP-2 Induces a Predominant Th1 Antibody Response in Immunized Mice and a Predominant Th2 Antibody Response in Infected Animals
Analysis of specific antibody subtypes in mice immunized with either mFhSAP-2 alone or mFhSAP-2 + ISA50 revealed the presence of all antibody subtypes (IgG1, IgG2a, IgG2c and IgG3). Among these, IgG2c was the most abundant, followed by IgG1 and IgG3. As shown in our results, both formulations (mFhSAP-2 and mFhSAP-2 + ISA50) induced a similar IgG subtype profile (Figure 5A-B). In the mFhSAP-2 + ISA50 immunized group, the average levels of IgG2c were significantly higher than IgG2a (p<0.0001, OD492 = 2.238 0.602 and 1.032 0.171, respectively) and were also significantly higher than IgG1 (p=0.0032, average OD492 = 1.504 0.095), and IgG3 (p<0.0001, average OD492 = 1.031 0.213). In the mFhSAP-2 immunized group, the average levels of IgG2c were 1.76-fold higher than IgG2a (average OD492 = 1.199 0.499) with IgG2c OD492 values ranging between 0.2 to 3.37 (average OD492= 2.122 1.339). This variability in IgG2c levels resulted in no significant differences between IgG2c and IgG2a, nor between IgG2c levels and those of IgG1 (average OD492 = 1.661 0.049), and IgG3 (average OD492 = 0.723 0.150) (Figure 5B). When analyzing the IgG subtypes of F. hepatica infected mice, it was found that IgG1 was the dominant isotype in all samples (average OD492 = 1.567 0.557). Levels of IgG1 were 2.85-fold higher than IgG2a (average OD492= 0.549 0.213), 7.87-fold higher than IgG2c (average OD492 = 0.199 0.155) and 4.5-fold higher than IgG3 (average OD492 = 0.348 0.144) and these differences were statistically significant (p= 0.034, p=0.004 and p=0.0016, respectively) (Figure 5C). Further analyses of specific IgG subtypes showed that both mFhSAP-2 + ISA50 and mFhSAP-2 immunized mice had lower IgG1/IgG2c ratio (average OD492 = 0.64 0.099 and 0.90 0.066, respectively) suggesting a mixture of Th1 and Th2 response with predominance of the Th1 antibody subtype. In contrast, IgG1/IgG2a for these groups were higher (1.525 0.252 and 1.327 0.493, respectively), indicating a mixed Th1 and Th2 response with predominance of the Th2 antibody subtype. Additionally, F. hepatica infection showed significantly higher IgG1/IgG2a (3.135 0.908) and IgG1/IgG2c (13.63 6.63) ratios than immunization with mFhSAP-2 + ISA50 or with mFhSAP-2 alone, respectively (p=0.05), which is typical of a polarized Th2 response (Figure 5D).
3.6. mFhSAP-2 Induces High Avidity IgG2a and IgG2c Antibodies with a Predominance of IgG2c over IgG2a in Immunized C57BL/6 Mice
Mice immunized with mFhSAP-2 + ISA50 had high-avidity IgG2a and IgG2c antibodies (AI>50%) while mice infected with F. hepatica infected had intermediate-avidity IgG2a antibodies (AI between 30% and 50%) and low-avidity IgG2c antibody (AI <30%) (Figure 6A, Table 2). Moreover, the mean serum antibody titers in both mFhSAP-2 (Figure 6B) and mFhSAP-2+ISA50 immunized groups (Figure 6C) showed lower IgG2a end-point titers (1:1,600 and 1:6,400, respectively) compared to IgG2c titers (1:3,200 and 1:25,600, respectively).
3.7. Immunization with mFhSAP-2 Induces Splenocyte Proliferation and Predominance of CD4 T Cells Over CD8 T Cells and Higher IFNγ Than IL-4 Production
Splenocytes from immunized and naïve mice were non-stimulated or stimulated in vitro with mFhSAP-2. As expected, splenocytes from non-stimulated, immunized mice that were non-stimulated exhibited an average cell proliferation index (CPI) of 1.809 ± 0.142, which was significantly different (p=0.0176) from the average CPI showed by non-stimulated samples from naïve mice. However, splenocytes from mFhSAP-2 stimulated immunized mice that were stimulated with mFhSAP-2 exhibited a CPI of 1.449 ± 0.138, which was not significantly different from that exhibited by splenocytes from mFhSAP-2 stimulated naïve mice (1.147 ± 0.091) (Figure 7A). Additionally, cytokine production and activation status of T helper cells (CD4+) and cytotoxic T cells (CD8+) in mice immunized with mFhSAP-2 were determined by flow cytometry. Splenocytes from in vitro mFhSAP-2 stimulated immunized mice stimulated with mFhSAP-2 were labelled with antibodies specific for CD3+, CD4+, CD8+, CD69, IFNγ and IL-4 and the results were compared to those showed by labelled splenocytes from in vitro mFhSAP-2 stimulated naïve mice. As our results show, immunized mice exhibited higher CD4+/CD8+ ratios (16.02 ± 0.734) than naïve mice (9.77 ± 2.940) and these differences were statistically significant (p=0.0252). These results indicate a predominance of activated CD4+ T cells over CD8+ T cells in immunized mice (Figure 7B). When analyzing the IFN-γ/IL-4 ratios in CD4+ T cells, immunized mice had average ratios of 0.950 ± 0.126, which were significantly higher (p=0.0376) than those observed in naïve mice (0.468 ± 0.058) (Figure 7C). In contrast, the levels of IFNγ and IL-4 secreted by CD8+ T cells from immunized subjects were like those observed in naïve mice (data not shown).
4. Discussion
In the search for potential vaccine candidates against F. hepatica, antigens that promote T helper 1 (Th1) immune responses have been proposed as promising targets. However, this approach appears to contradict the established paradigm that anti-helminth protection depends on the mobilization and activation of various immune cells including type-2 macrophages and Th2-cells. These cells are known to promoting type-2 associated cytokines such as IL-4, IL-5 and IL-9, among others [14]. Notably, F. hepatica infection exhibits a strong immunomodulatory behavior, inducing a dominant Th2 immune response while actively suppressing the Th1 responses in the host [1,2]. The rationale for developing F. hepatica vaccines that promote a Th1 response is based on the studies done of Indonesian thin-tail (ITT) sheep, which naturally exhibit resistance to Fasciola infection [3,4], characterized by high levels of specific IgG2a antibody and Th1-associated cytokines [3]. In our previous studies we demonstrated that it is possible to induce acquired immunity associated with Th1-responses through the immunization of experimental animals with the FhSAP-2 antigen, which is a member of the F. hepatica saposin-like/NK-lysin protein family [8,11,15]. Although FhSAP-2 has induced substantial protection levels ranging from over 60% [8] to more than 80% [11,15], scaling up vaccination trials in larger animal models, such as cattle or sheep, have been largely hindered by challenges in producing the protein in sufficient quantities. This limitation arises from the high hydrophobic character of FhSAP-2, and the low yield typically obtained during its production, even after extraction from inclusion bodies. Its tendency to aggregate and form non-specific interactions with other molecules in solution makes this protein very difficult to purify at high yield. Therefore, the primary objective of this study was to determine whether a truncated version of the protein, lacking the first 16 amino acids at the N- terminus, which include a large stretch of hydrophobic residues and one of the protein’s two dominant Th1 epitope, could still induce a Th1-type immune response. Our results demonstrate that omitting this hydrophobic region and adding a synthetic amino acid sequence, such as GST at the N-terminus, significantly improved the protein’s solubility. Upon expressing this modified construct in E. coli, the resulting protein, now termed mFhSAP-2, was recovered with a high purity index (>85%) and an acceptable yield.
Given that proper folding of antigenic epitopes is crucial for antibody recognition in vaccine development, we assessed whether mFhSAP-2 could retain antigenic epitopes capable of reacting with antibodies elicited during F. hepatica infection. Our results showed that mFhSAP-2 was highly reactive with sera from both, rabbits and mice with active F. hepatica infection. This suggest that removing the N-terminal region did not compromise antigenic recognition and that the protein’s proper folding was preserved. Furthermore, this is consistent with the understanding that antigenic sites in a protein are primarily localized in regions with low hydrophobicity and high solvent accessibility [16]. Circular dichroism (CD) analysis revealed that mFhSAP-2 has an ordered secondary structure, consisting of 66% alpha helix, which closely aligns with the 67.33% alpha helix content predicted for the full-length FhSAP-2 by an independent bioinformatic algorithm (SOPM software) [5]. These observations suggest that mFhSAP-2 retained its main structural features, comprising of five amphipathic α helical domains, along with six cysteine residues and seven hydrophobic residues at strictly conserved positions [5].
Upon de confirmation of mFhSAP-2 proper folding, we proceeded to determine whether the protein retained its capacity to induce immune responses both in vitro and in vivo. The initial experiments were conducted using RAW264.7 cells, which when stimulated with LPS, mimic the behavior of macrophages in vivo by significantly increasing production of TNFα, a pro-inflammatory cytokine involved in the innate immune responses [17,18]. The finding that different concentrations of mFhSAP-2 induced detectable levels of TNFα in culture media, with TNFα production increasing in a dose-dependent manner without affecting cell viability, suggest that mFhSAP-2 is nontoxic and is capable of activating macrophages. These in vitro observations, along with the high levels of specific IgG antibodies detected in naïve mice immunized with either mFhSAP-2 alone or mFhSAP-2+ISA50, confirm that antibodies also confirm that mFhSAP-2 is highly immunogenic, even in the absence of an adjuvant.
To further dissect the type of antibody response induced by mFhSAP-2, we analyzed the relative amount of IgG subtypes in sera of the immunized animals. Mouse IgG2a and IgG2c are signature Th1-type immunoglobulin subtypes primarily stimulated by Th1-associated cytokines such as IFNγ, and their presence is often used as a marker for a dominant Th1 immune response [19]. In contrast, the IgG1 subtype is considered a Th2-type antibody, meaning its production is primarily associated with Th2-immune responses characterized by the production of cytokines like IL4 [20]. The IgG2a and IgG2c isotypes are encoded by closely linked genes within the IgG heavy constant region. In mice these isotypes are inherited as haplotypes Igh-1a and Igh-1b, respectively, and are organized in tandem on the same chromosome as two distinct loci [21]. Since not all mouse strains expresses both haplotypes at the same time or intensity, it is important to consider the specific mouse strain for an accurate interpretation of the Th1/Th2 response. In our study, we used C57BL6 mice, which are considered a Th1-biased genetic background mouse strain [22]. According to some authors, C57BL6 mice could exclusively express IgG2c due to a deletion in the IgG2a gene [21] or express significantly much more IgG2c than IgG2a [13]. Our results in mFhSAP-2 immunized C57BL6 mice with or without adjuvant are consistent with those studies, showing a clear IgG2c-biased subtype response [22]. This was confirmed by the higher IgG2c titers observed in the immunized mice, compared to the lower end-point titers for IgG2a. Thereby, studies measuring IgG2a instead of IgG2c in C57BL6 mice could draw misleading conclusions about the immune response induced by a recombinant experimental vaccine [23,24]. An interesting finding of our study is that mice immunized with mFhSAP-2 had higher levels of IgG2c than IgG1, which indicate that mFhSAP-2 can induce Th1-biased responses even in the absence of an adjuvant. However, IgG2c levels were notably higher in the group immunized with mFhSAP-2 + ISA50, suggesting that delivering mFhSAP-2 with Montanide ISA50 helps potentiate the Th1-immune polarization induced by the protein. This is consistent with previous studies on recombinant vaccines for Bovine herpesvirus, malaria, Leishmania, and Toxoplasmosis, where Montanide ISA50 was used to enhance Th1- immune responses [25-28]. In contrast, mice infected with F. hepatica exhibited significantly higher levels of IgG1 than IgG2a or IgG2c, characteristic of a polarized Th2-immune response, which is typical of F. hepatica infections [1,2].
Evaluating antibody avidity is another important factor in vaccine development. Avidity is the strength to which an IgG antibody subtype will bind to its specific target epitope. It is established during the affinity maturation process, and a failure to produce high avidity IgG subtypes may result in an insufficient protective immunity against infections and diseases [29,30]. In our study, the group immunized with mFhSAP-2 + ISA50 exhibited high-avidity IgG2a and IgG2c antibodies whereas the infected group had IgG2a and IgG2c antibodies with low to moderate avidity. Since C57BL/6 mice predominantly express IgG2c instead of IgG2a, evaluating the IgG2a avidity could lead to incorrect interpretations of a vaccine candidate’s potential to induce protection against infection. Moreover, previous studies have shown that increased levels of high-avidity IgG2(a/c) antibodies correlate with lower F. hepatica fluke burdens and enhanced immune protection [31], as well as with facilitating pathogen elimination through mechanisms such as antibody-dependent cellular cytotoxicity (ADCC), which plays a critical role in eliminating F. hepatica NEJs [32,33]. In our study, both IgG2a and IgG2c isotypes induced by mFhSAP-2 immunization exhibited high avidity, reinforcing their potential role in protective immunity. Additionally, given that IFN stimulates the production of Th1 associated antibodies like IgG2c, we also analyzed the T cell proliferation, activated CD4+/CD8+ T-cell populations, and IFN/IL-4 production. As expected, a higher cell proliferation index, CD4+/CD8+ ratio and IFN/IL-4 ratio were observed in mice immunized with mFhSAP-2 + ISA50, confirming that this vaccine formulation induces a polarized Th1-immune responses.
5. Conclusions
Our results demonstrated that a modified recombinant version of FhSAP-2 (mFhSAP-2) lacking one of its dominant Th1 epitopes, is highly immunogenic and capable of inducing a Th1-biased immune responses in C57BL/6 mice. These responses were enhanced when mFhSAP-2 was adjuvanted with Montanide ISA50. While mFhSAP-2 + ISA50 induced high avidity IgG2a and IgG2c antibody subtypes, accurately interpreting a Th1 immune response in the C57BL/6 mouse strain is more reliable when measuring IgG2c rather than IgG2a, alongside with IFN production. The antibody profile elicited by mFhSAP-2 + ISA50 was enterily opposite to that observed in mice F. hepatica infected mice which displayed significantly higher IgG1 levels than IgG2c, characteristic of a Th2-polarized immune response. Furthermore, the optimized genetic construct encoding mFhSAP-2 along with the refined expression and purification protocol developed in this study, enables the production of mFhSAP-2 with high purity and protein yield. This advancement facilitates the expansion of vaccination trials to larger animal models of veterinary importance.
Supplementary Materials
The following supporting information can be downloaded at: Preprints.org. Figure S1: SDS-Page and Western Blot analysis of purified mFhSAP-2 fusion protein.
Author Contributions
Conceptualization, A.M.E.; data curation, R.R.N. and A.M.E.; methodology, A.M.E.; R.R.N.; A.A.R., M.F.G. and C.O.M.; validation, R.R.N.; formal analysis, R.R.N. A.M.E.; investigation, R.R.N. and G.F.Q.; resources, A.M.E.; writing—original draft preparation, A.M.E., and R.R.N.; writing—review and editing A.A.R., A.M.E., A.A.R.; M.F.G., G.F.Q., and C.O.M.; visualization; R.R.N.; supervision, A.M.E.; project administration; A. M.E. All authors have read and agreed to the published version of the manuscript.
Funding
This research was supported by NIAID grant SC1 AI155439-01
Institutional Review Board Statement
The study was conducted in accordance with the Declaration of Helsinki and approved by the Ethics Institutional Animal Care and Use Committee of the University of Puerto Rico-Medical Sciences Campus (Protocol No. 7870104, and 7870106).
Data Availability Statement
All data is presented in this manuscript and provided as supplementary information
Acknowledgments
We want to thank Dr. Yamil Gerena for providing access to the flow cytometry unit and Dr. Stephanie Dorta for advisory in these analysis. We also thank Dr. Pearl Akamine for providing access to the CD spectropolarimeter at UPR-Molecular Sciences Research Center as well as her guidance and support with the circular dichroism facilities.
Conflicts of Interest
The authors declare no conflicts of interest.
References
- Dalton, J.P.; Robinson, M.W.; Mulcahy, G.; O'Neill, S.M.; Donnelly, S. Immunomodulatory molecules of Fasciola hepatica: candidates for both vaccine and immunotherapeutic development. Vet Parasitol 2013, 195, 272–285. [Google Scholar] [CrossRef]
- McNeilly, T.N.; Nisbet, A.J. Immune modulation by helminth parasites of ruminants: implications for vaccine development and host immune competence. Parasite 2014, 21, 51. [Google Scholar] [CrossRef]
- Pleasance, J.R., H. W., Estuningsih, S. E.; Widjajanti, S.; Meesusen, E.; Piedrafita, D. Innate and adaptive resistance of Indonesian Thin-tail sheep to liver fluke. A comparative analysis of Fasciola hepatica and Fasciola gigantica infection. Vet. Parasitol. 2011, 178, 264–272. [Google Scholar] [CrossRef] [PubMed]
- Piedrafita, D.R., H. W. Prowse, R.; Spithill, T.W.. Immunology of the host-parasite relationship in fasciolosis (Fasciola hepatica and Fasciola gigantica). Can. J. Zool. 2004, 82, 233–250. [Google Scholar]
- Espino, A.M.; Hillyer, G.V. Molecular cloning of a member of the Fasciola hepatica saposin-like protein family. J Parasitol 2003, 89, 545–552. [Google Scholar] [CrossRef] [PubMed]
- Caban-Hernandez, K.; Espino, A.M. Differential expression and localization of saposin-like protein 2 of Fasciola hepatica. Acta Trop 2013, 128, 591–597. [Google Scholar] [CrossRef] [PubMed]
- Espino, A.M.; Rivera, F. Quantitation of cytokine mRNA by real-time RT-PCR during a vaccination trial in a rabbit model of fascioliasis. Vet Parasitol 2010, 169, 82–92. [Google Scholar] [CrossRef]
- Rivera, F.; Espino, A.M. Adjuvant-enhanced antibody and cellular responses to inclusion bodies expressing FhSAP2 correlates with protection of mice to Fasciola hepatica. Exp Parasitol 2016, 160, 31–38. [Google Scholar] [CrossRef]
- Espino, A.M.; Torres, D.; Morales, A.; Delgado, B.; Quetel, J.; Osuna, A. Fasciola hepatica: identification of CD4+ T-helper epitopes from the 11.5 kDa saposin-like protein SAP-2 using synthetic peptides. Exp Parasitol 2007, 117, 65–73. [Google Scholar]
- Torres, D.; Espino, A.M. Mapping of B-cell epitopes on a novel 11.5-kilodalton Fasciola hepatica-Schistosoma mansoni cross-reactive antigen belonging to a member of the F. hepatica saposin-like protein family. Infect Immun 2006, 74, 4932–4938. [Google Scholar]
- Espino, A.M.; Morales, A.; Delgado, B.; Rivera, F.M.; Figueroa, O.; Suarez, E. Partial immunity to Fasciola hepatica in mice after vaccination with FhSAP2 delivered as recombinant protein or DNA construct. Ethn Dis 2010, 20, S1–17. [Google Scholar] [PubMed]
- Burton, L.J.; Rivera, M.; Hawsawi, O.; Zou, J.; Hudson, T.; Wang, G.; Zhang, Q.; Cubano, L.; Boukli, N.; Odero-Marah, V. Muscadine Grape Skin Extract Induces an Unfolded Protein Response-Mediated Autophagy in Prostate Cancer Cells: A TMT-Based Quantitative Proteomic Analysis. PLoS One 2016, 11, e0164115. [Google Scholar] [CrossRef]
- Nazeri, S.; Zakeri, S.; Mehrizi, A.A.; Sardari, S.; Djadid, N.D. Measuring of IgG2c isotype instead of IgG2a in immunized C57BL/6 mice with Plasmodium vivax TRAP as a subunit vaccine candidate in order to correct interpretation of Th1 versus Th2 immune response. Exp Parasitol 2020, 216, 107944. [Google Scholar] [CrossRef]
- Vacca, F.; Le Gros, G. Tissue-specific immunity in helminth infections. Mucosal Immunol 2022, 15, 1212–1223. [Google Scholar] [CrossRef]
- Espino, A.M.; Hillyer, G.V. A novel Fasciola hepatica saposinlike recombinant protein with immunoprophylactic potential. J Parasitol 2004, 90, 876–879. [Google Scholar] [CrossRef] [PubMed]
- Ranganathan, S.G.; Nakai, K.; Schonbach, C. Encyclopedia of Bioinformatics and Computational Biology. Chapter: Immunoinformatics Databases, 2019; Elsevier: ISBN 978-0-12-811432-2. [Google Scholar]
- Park, P.H.; McMullen, M.R.; Huang, H.; Thakur, V.; Nagy, L.E. Short-term treatment of RAW264.7 macrophages with adiponectin increases tumor necrosis factor-alpha (TNF-alpha) expression via ERK1/2 activation and Egr-1 expression: role of TNF-alpha in adiponectin-stimulated interleukin-10 production. J Biol Chem 2007, 282, 21695–21703. [Google Scholar] [CrossRef]
- Zhu, W.; Yu, J.; Nie, Y.; Shi, X.; Liu, Y.; Li, F.; Zhang, X.L. Disequilibrium of M1 and M2 macrophages correlates with the development of experimental inflammatory bowel diseases. Immunol Invest 2014, 43, 638–652. [Google Scholar] [CrossRef]
- Cetre, C.; Pierrot, C.; Cocude, C.; Lafitte, S.; Capron, A.; Capron, M.; Khalife, J. Profiles of Th1 and Th2 cytokines after primary and secondary infection by Schistosoma mansoni in the semipermissive rat host. Infect Immun 1999, 67, 2713–2719. [Google Scholar] [CrossRef]
- Firacative, C.; Gressler, A.E.; Schubert, K.; Schulze, B.; Muller, U.; Brombacher, F.; von Bergen, M.; Alber, G. Identification of T helper (Th)1- and Th2-associated antigens of Cryptococcus neoformans in a murine model of pulmonary infection. Sci Rep 2018, 8, 2681. [Google Scholar] [CrossRef]
- Zhang, Z.; Goldschmidt, T.; Salter, H. Possible allelic structure of IgG2a and IgG2c in mice. Mol Immunol 2012, 50, 169–171. [Google Scholar] [CrossRef]
- Schulte, S.; Sukhova, G.K.; Libby, P. Genetically programmed biases in Th1 and Th2 immune responses modulate atherogenesis. Am J Pathol 2008, 172, 1500–1508. [Google Scholar] [CrossRef]
- Fiorino, F.; Rondini, S.; Micoli, F.; Lanzilao, L.; Alfini, R.; Mancini, F.; MacLennan, C.A.; Medaglini, D. Immunogenicity of a Bivalent Adjuvanted Glycoconjugate Vaccine against Salmonella Typhimurium and Salmonella Enteritidis. Front Immunol 2017, 8, 168. [Google Scholar] [CrossRef] [PubMed]
- Lucca, L.E.; Desbois, S.; Ramadan, A.; Ben-Nun, A.; Eisenstein, M.; Carrie, N.; Guery, J.C.; Sette, A.; Nguyen, P.; Geiger, T.L.; et al. Bispecificity for myelin and neuronal self-antigens is a common feature of CD4 T cells in C57BL/6 mice. J Immunol 2014, 193, 3267–3277. [Google Scholar] [CrossRef]
- Dummer, L.A.; Araujo, I.L.; Finger, P.F.; dos Santos, A.G., Jr.; da Rosa, M.C.; Conceicao, F.R.; Fischer, G.; van Drunen Littel-van den Hurk, S.; Leite, F.P. Immune responses of mice against recombinant bovine herpesvirus 5 glycoprotein D. Vaccine 2014, 32, 2413–2419. [Google Scholar] [CrossRef] [PubMed]
- Jones, G.L.; Spencer, L.; Lord, R.; Mollard, R.; Pye, D.; Saul, A. Peptide vaccines derived from a malarial surface antigen: effects of dose and adjuvants on immunogenicity. Immunol Lett 1990, 24, 253–260. [Google Scholar] [CrossRef] [PubMed]
- Sahar, E.A.; Can, H.; Iz, S.G.; Doskaya, A.D.; Kalantari-Dehaghi, M.; Deveci, R.; Guruz, A.Y.; Doskaya, M. Development of a hexavalent recombinant protein vaccine adjuvanted with Montanide ISA 50 V and determination of its protective efficacy against acute toxoplasmosis. BMC Infect Dis 2020, 20, 493. [Google Scholar] [CrossRef]
- Shokri, M.; Roohvand, F.; Alimohammadian, M.H.; Ebrahimirad, M.; Ajdary, S. Comparing Montanide ISA 720 and 50-V2 adjuvants formulated with LmSTI1 protein of Leishmania major indicated the potential cytokine patterns for induction of protective immune responses in BALB/c mice. Mol Immunol 2016, 76, 108–115. [Google Scholar] [CrossRef]
- Oostindie, S.C.; Lazar, G.A.; Schuurman, J.; Parren, P. Avidity in antibody effector functions and biotherapeutic drug design. Nat Rev Drug Discov 2022, 21, 715–735. [Google Scholar] [CrossRef]
- Ugurlar, D.; Howes, S.C.; de Kreuk, B.J.; Koning, R.I.; de Jong, R.N.; Beurskens, F.J.; Schuurman, J.; Koster, A.J.; Sharp, T.H.; Parren, P.; et al. Structures of C1-IgG1 provide insights into how danger pattern recognition activates complement. Science 2018, 359, 794–797. [Google Scholar] [CrossRef]
- Mulcahy, G.; O'Connor, F.; McGonigle, S.; Dowd, A.; Clery, D.G.; Andrews, S.J.; Dalton, J.P. Correlation of specific antibody titre and avidity with protection in cattle immunized against Fasciola hepatica. Vaccine 1998, 16, 932–939. [Google Scholar]
- Flores-Velazquez, L.M.; Ruiz-Campillo, M.T.; Herrera-Torres, G.; Martinez-Moreno, A.; Martinez-Moreno, F.J.; Zafra, R.; Buffoni, L.; Rufino-Moya, P.J.; Molina-Hernandez, V.; Perez, J. Fasciolosis: pathogenesis, host-parasite interactions, and implication in vaccine development. Front Vet Sci 2023, 10, 1270064. [Google Scholar] [CrossRef] [PubMed]
- Golden, O.; Flynn, R.J.; Read, C.; Sekiya, M.; Donnelly, S.M.; Stack, C.; Dalton, J.P.; Mulcahy, G. Protection of cattle against a natural infection of Fasciola hepatica by vaccination with recombinant cathepsin L1 (rFhCL1). Vaccine 2010, 28, 5551–5557. [Google Scholar] [CrossRef] [PubMed]
Figure 1.
Strategy for cloning a modified version of recombinant FhSAP-2. (A) 101 amino acid sequence of FhSAP-2 (11.5kDa) as reported in the GenBank (Accession No. AF286903). The box over the first 16 amino acids represents the removed amino terminal region in mFhSAP-2, containing hydrophobic (blue) and hydrophilic (red) residues, along with a predicted signal peptide cleavage site between Ala15 and Ser16 (arrow). The sequence of amino acids 11AVTFA15 (underlined) represents one of the dominant Th1-epitopes of FhSAP-2. (B) Sequence of mFhSAP-2 fusion protein, lacking the initial 16 amino acids and the dominant Th1-epitope. A 6His tag and a GST tag (red) were added at the amino terminus to facilitate detection and purification, respectively. Kpnl and Hind-III restriction sites (yellow) were added into mFhSAP-2 for cloning into the pET30a (+) vector. A TEV protease cleavage site (green) was also added at the amino terminus to allow the removal of the His-GST tag after purification.
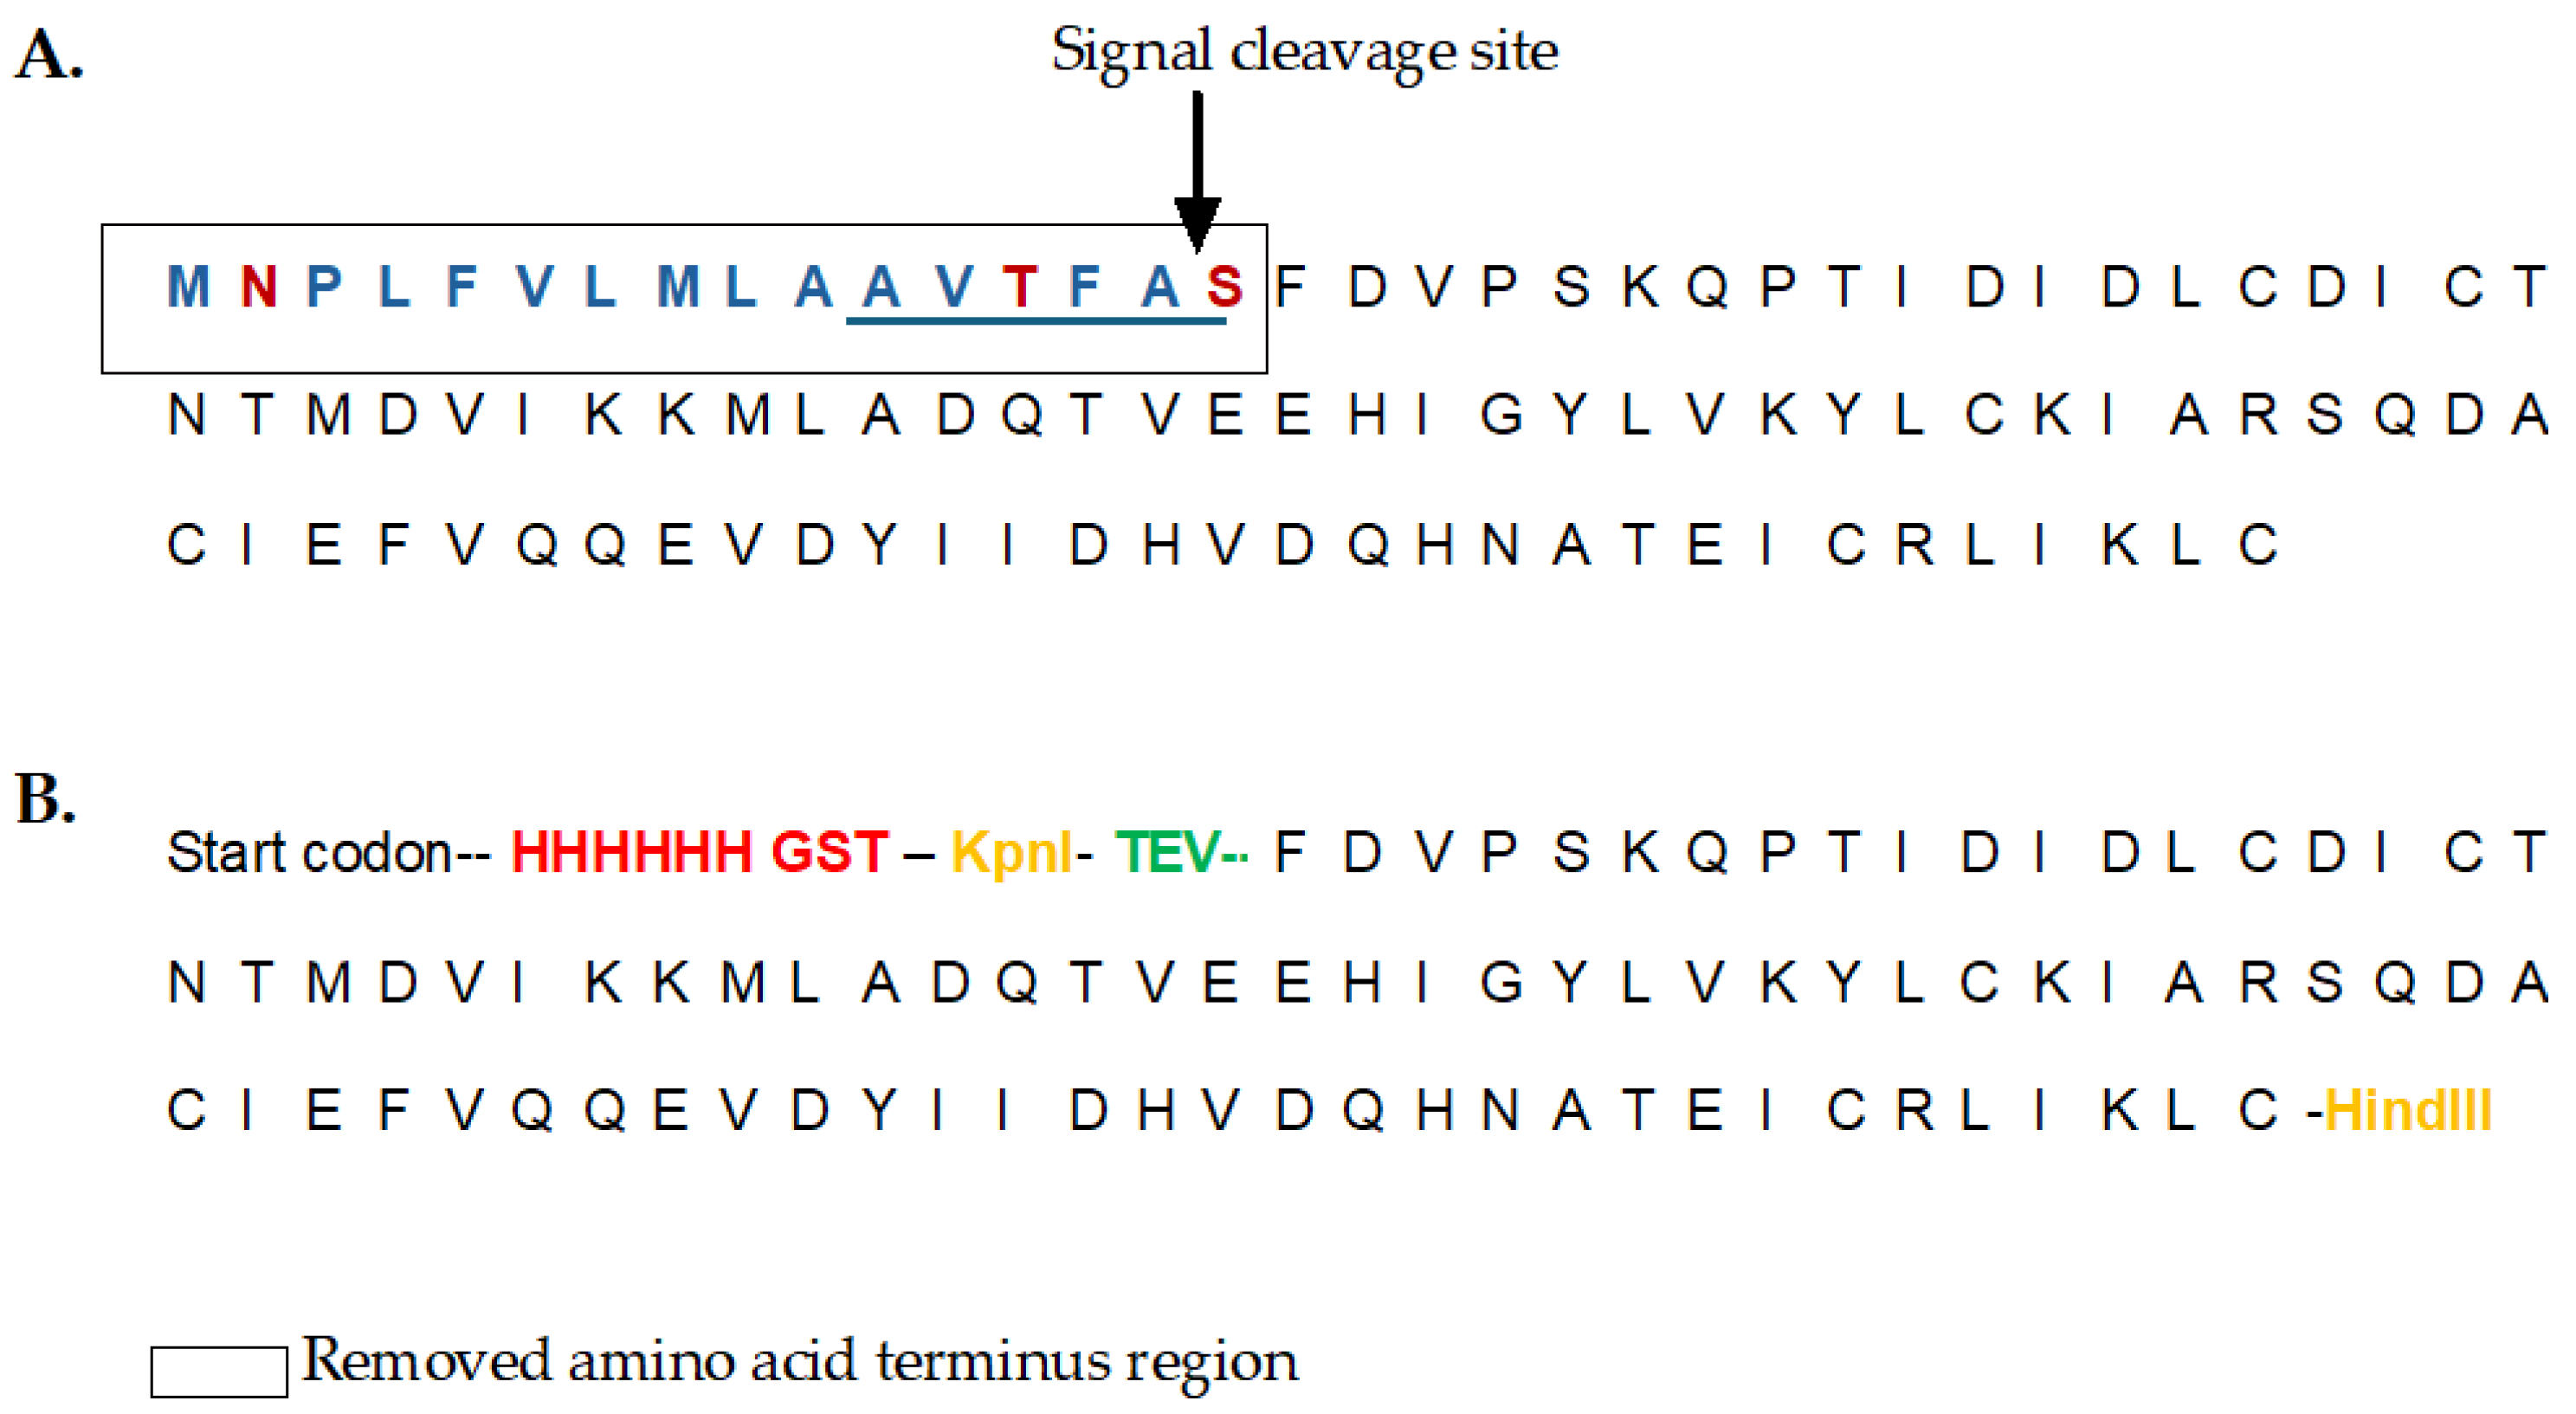
Figure 2.
Circular dichroism (CD) spectra of purified mFhSAP-2. The CD spectra was recorded using a Jasco J-1500 spectropolarimeter at a concentration of 200μg/mL at 25°C, over a wavelength range of 190 and 250 nm. CD raw data was analyzed using the BeStSelTM web server.
Figure 2.
Circular dichroism (CD) spectra of purified mFhSAP-2. The CD spectra was recorded using a Jasco J-1500 spectropolarimeter at a concentration of 200μg/mL at 25°C, over a wavelength range of 190 and 250 nm. CD raw data was analyzed using the BeStSelTM web server.
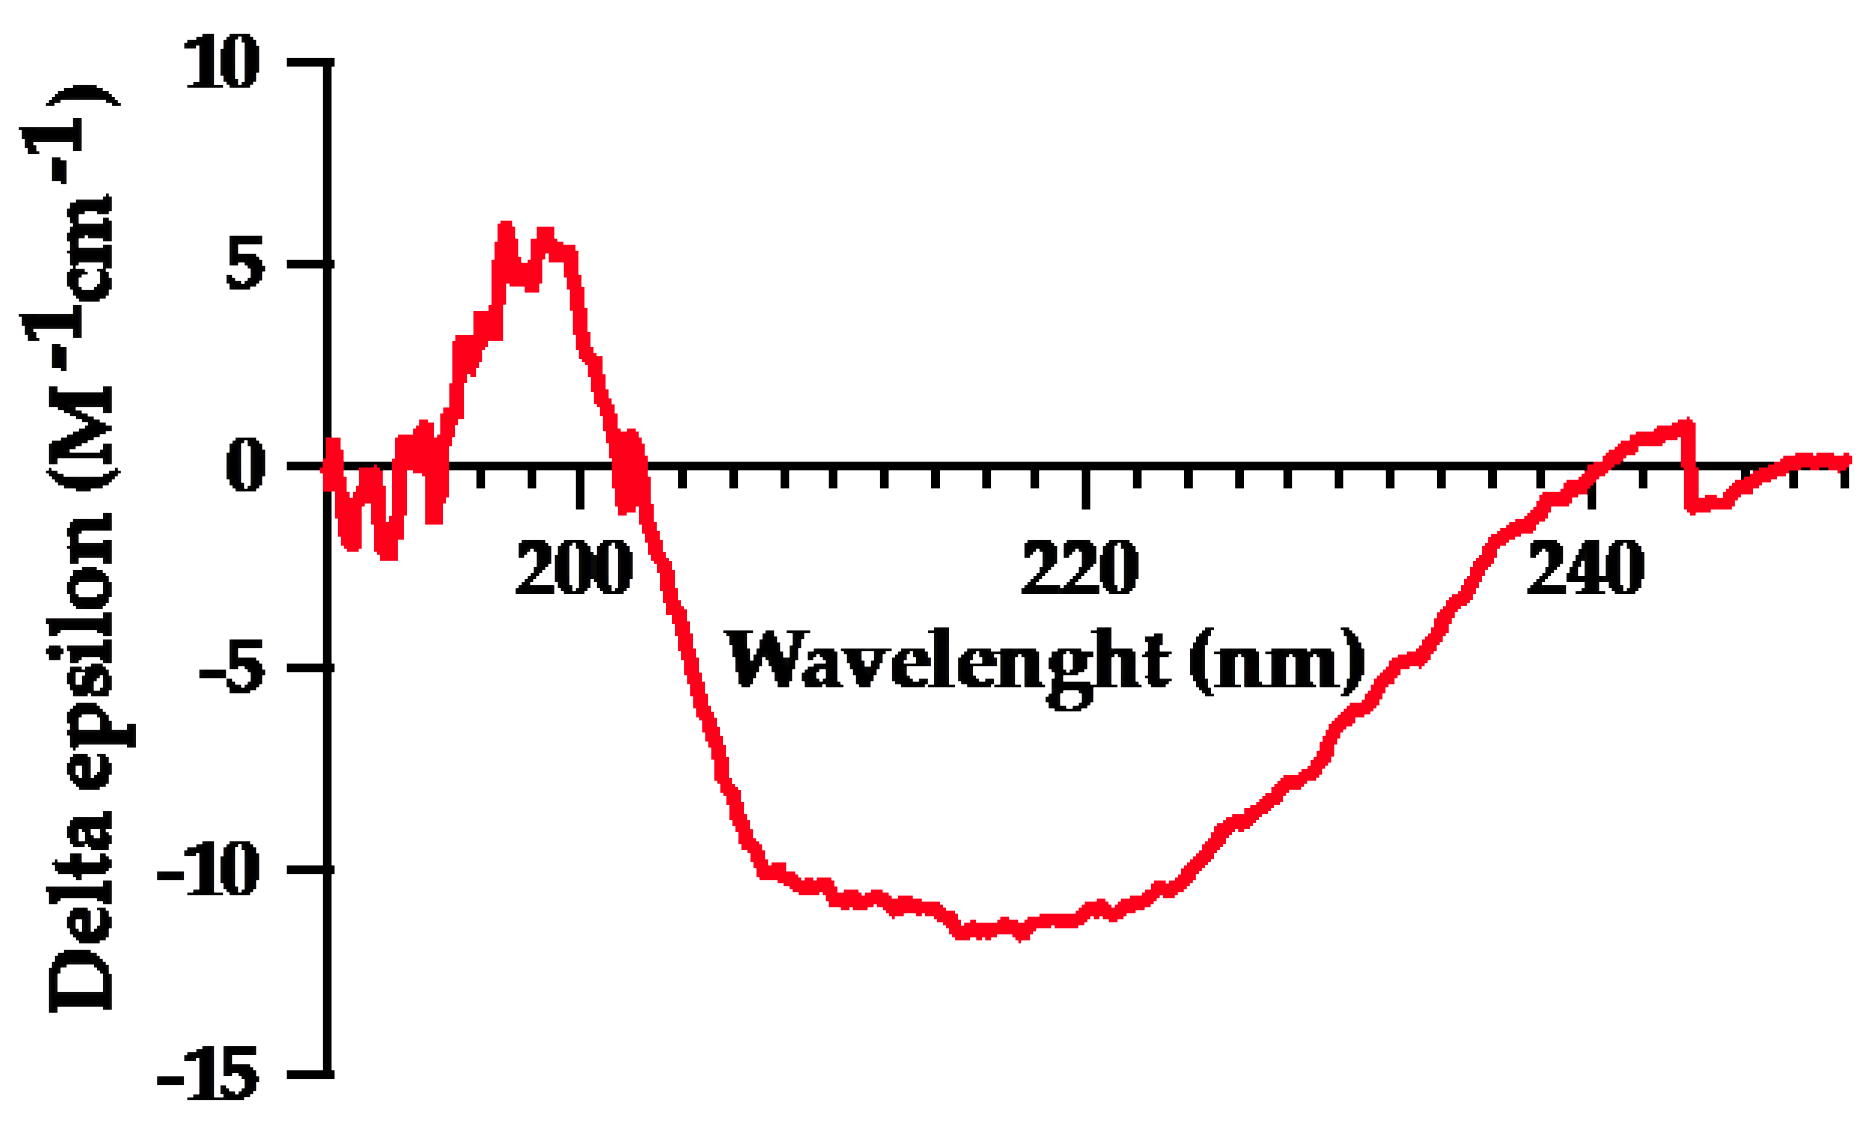
Figure 3.
TNFα secretion and cell viability in RAW 264.7 cells treated with mFhSAP-2. RAW264.7 cells are macrophage-like cells from murine origin. Cells were seeded in RPMI medium at a concentration of 5 x 10⁵ cells/mL and stimulated with increasing concentrations of mFhSAP-2 (5 to 20 g/mL). Cells stimulated with LPS (10 g/mL) were used as activation control, and cells treated with PBS as negative control. (A) Linear TNFα standard curve (left) showing the correlation between known TNFα concentrations (x-axis) and OD450 values (y-axis). Dose-response curve (right) showing TNFα secretion in response to mFhSAP-2 in RAW 264.7 cells (B) TNFα secretion in RAW 264.7 cells treated with mFhSAP-2 (20 μg/mL), LPS (10 μg/mL), and PBS (negative control). (C) Cell viability assay in RAW 264.7 cells treated with PBS, mFhSAP-2, or LPS (10 μg/mL). OD values equal to or above PBS (negative control) indicate high cell viability and metabolic activity. Data are presented as mean ± SEM. Statistical significance was determined using unpaired t-tests: ****p<0.0001, ns: not significant.
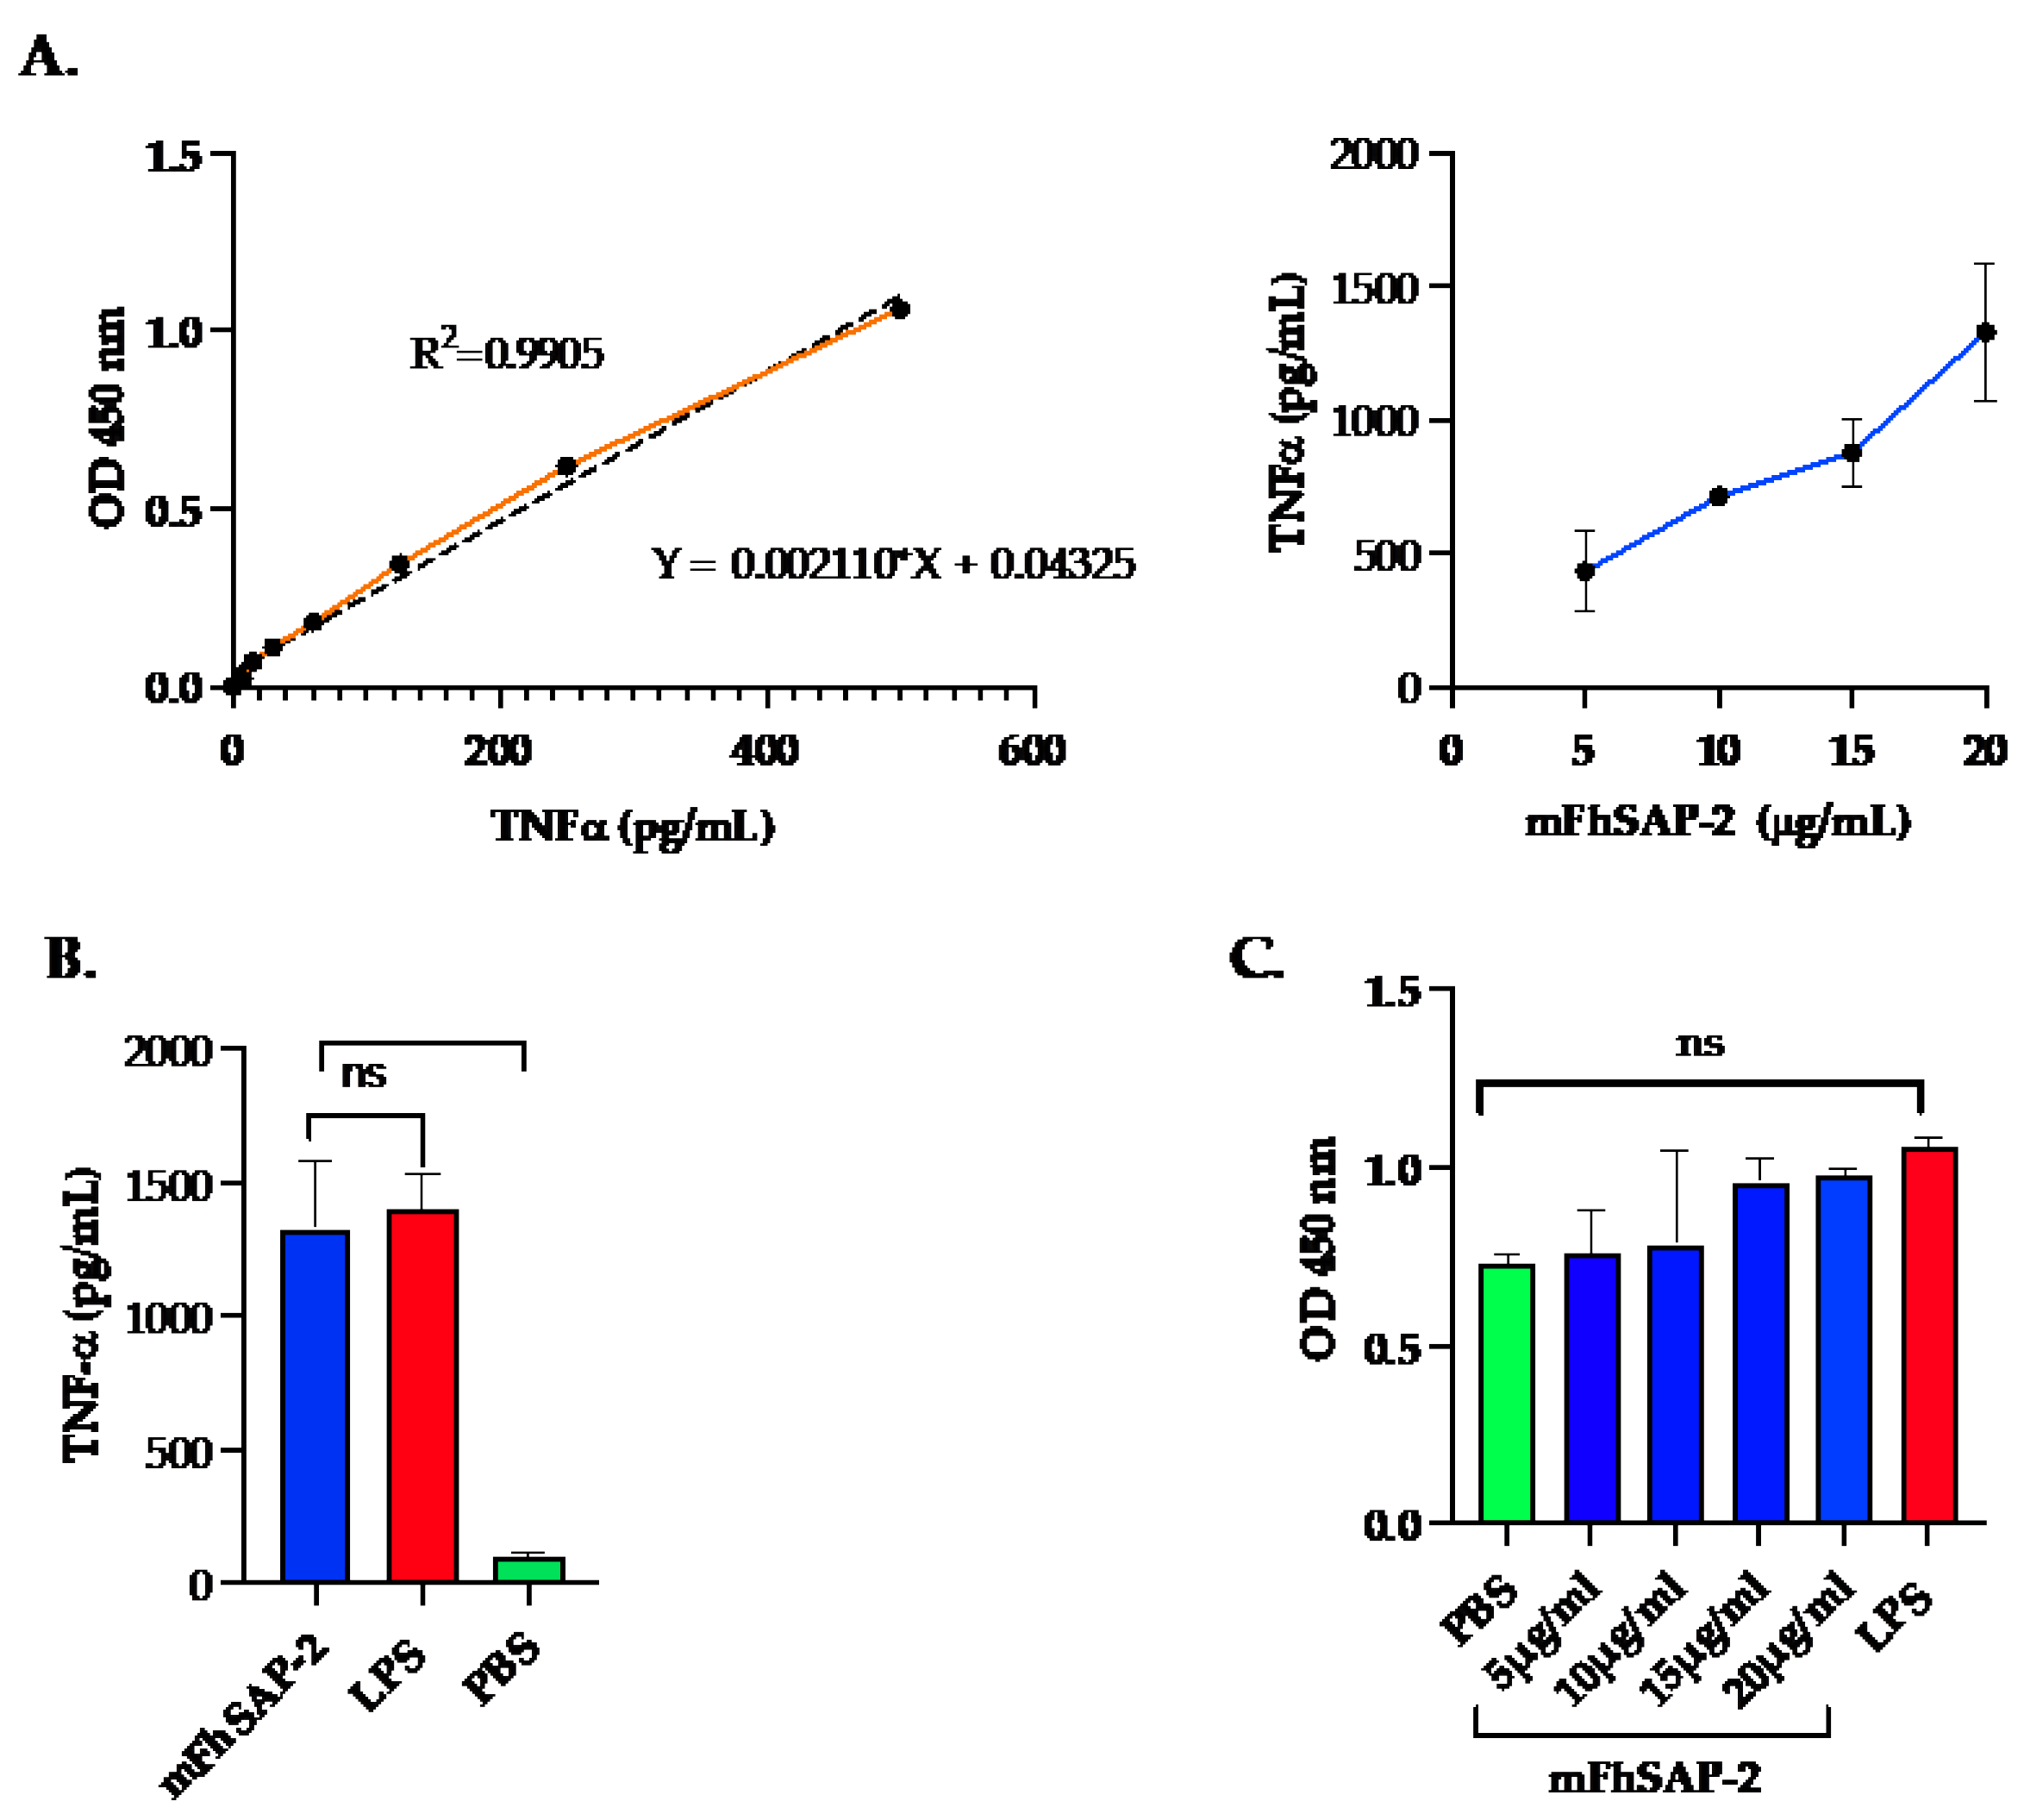
Figure 4.
Specific IgG antibodies against mFhSAP-2 in NZW rabbits and C57BL/6 mice. The ability of mFhSAP-2 to react with sera from infected and immunized animals was measured by ELISA. (A) Levels of specific anti-mFhSAP-2 IgG antibodies elicited in New Zealand White (NZW) rabbits during early and late stages of Fasciola hepatica challenge infection. Rabbit sera collected prior to infection were used as negative controls (NC). (B) Levels of specific anti-mFhSAP-2 IgG antibodies elicited in C57BL/6 mice infected with F. hepatica or immunized either with mFhSAP-2 + ISA50 or with m-FhSAP-2 alone. Sera from naïve C57BL/6 mice were used as negative controls (NC). Data are presented as mean ± SEM. Statistical significance was determined using unpaired t-tests: ****p<0.0001, ***p =0.0001, **p=0.0026, ns: not significant.
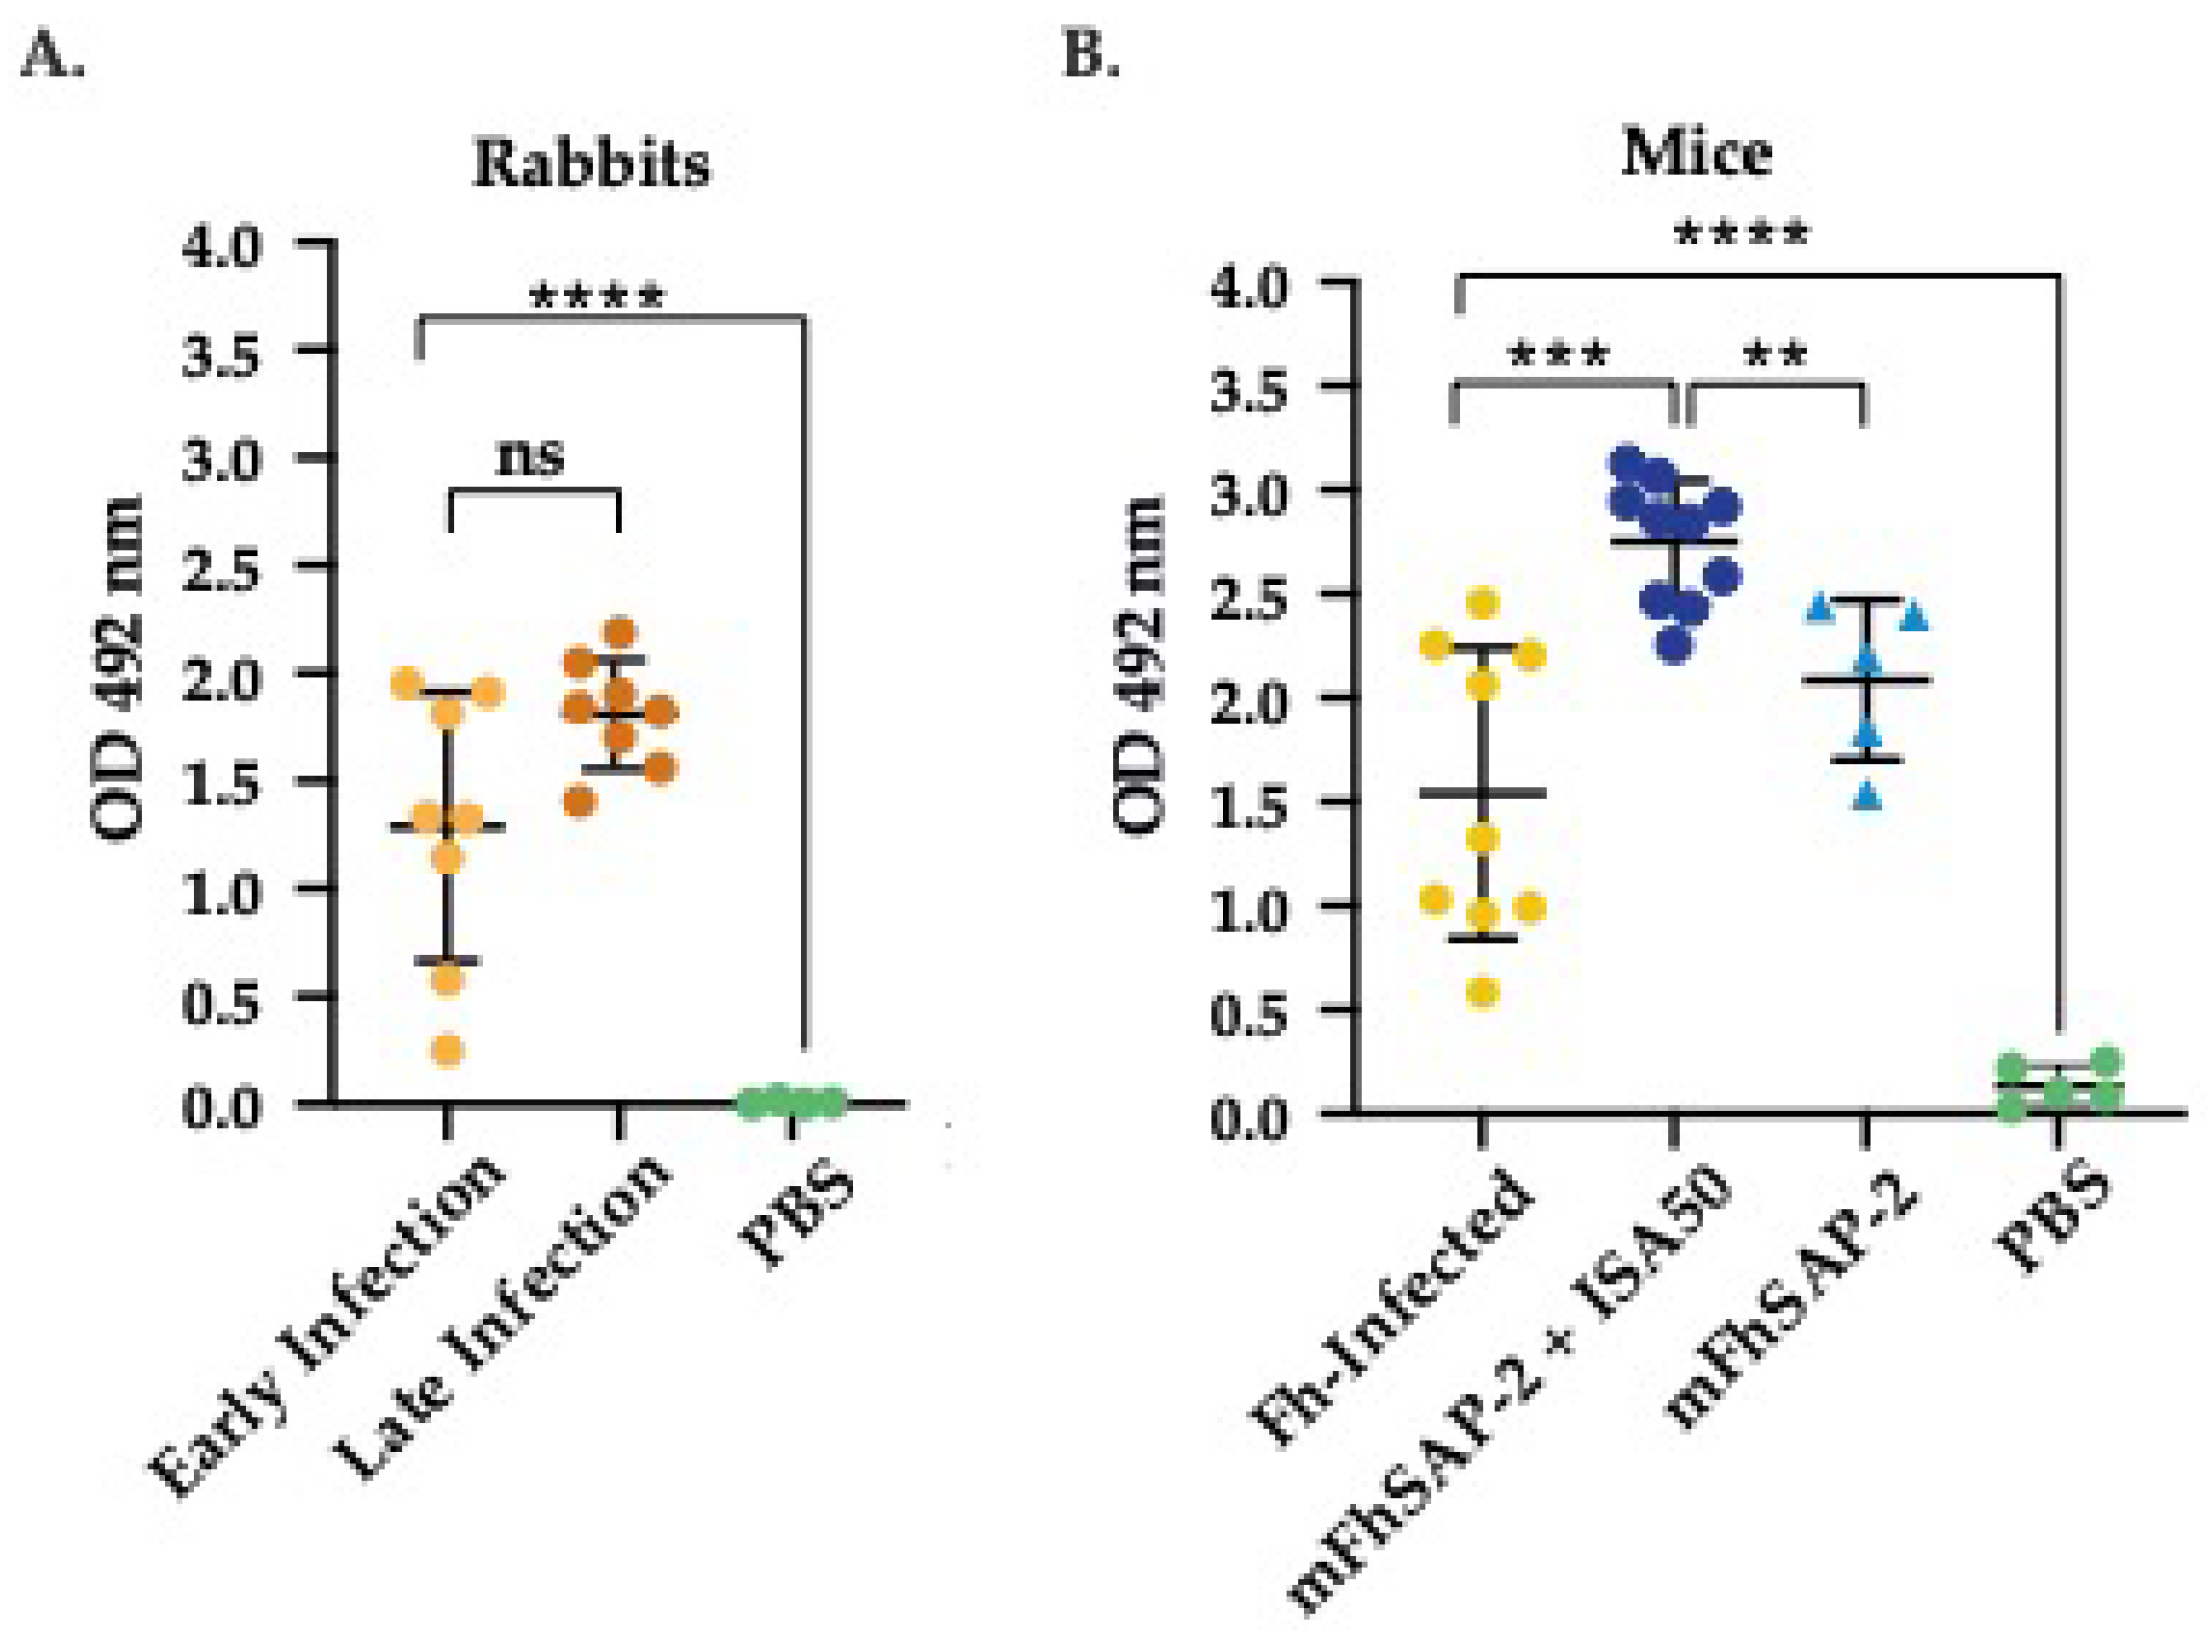
Figure 5.
IgG subtype profile induced by mFhSAP-2 in C57BL/6 mice compared to F. hepatica infection. ELISA was used to assess the IgG profile against mFhSAP-2 in C57BL/6 mice immunized with mFhSAP-2 + ISA50, mFhSAP-2 alone, or infected with F. hepatica (A) mFhSAP-2 + ISA50 induced significantly more IgG2c levels than IgG2a (****p<0.0001), IgG1 (** p=0.0032) or IgG3 (**** p<0.0001). (B) mFhSAP-2 also induced more IgG2c levels than other subtypes, but differences were not statistically significant (ns). (C) F. hepatica infection induced significantly more IgG1 levels than IgG2a (**p=0.0034), IgG2c (**p=0.0040), or IgG3 (**p=0.0016). (D) F. hepatica infected mice had significantly higher IgG1/IgG2a (*p=0.05) and IgG1/IgG2c (*p=0.05) ratios than those immunized with mFhSAP-2 + ISA50 or mFhSAP-2 alone. Data are presented as mean ± SEM. Statistical significance was determined using unpaired t-tests.
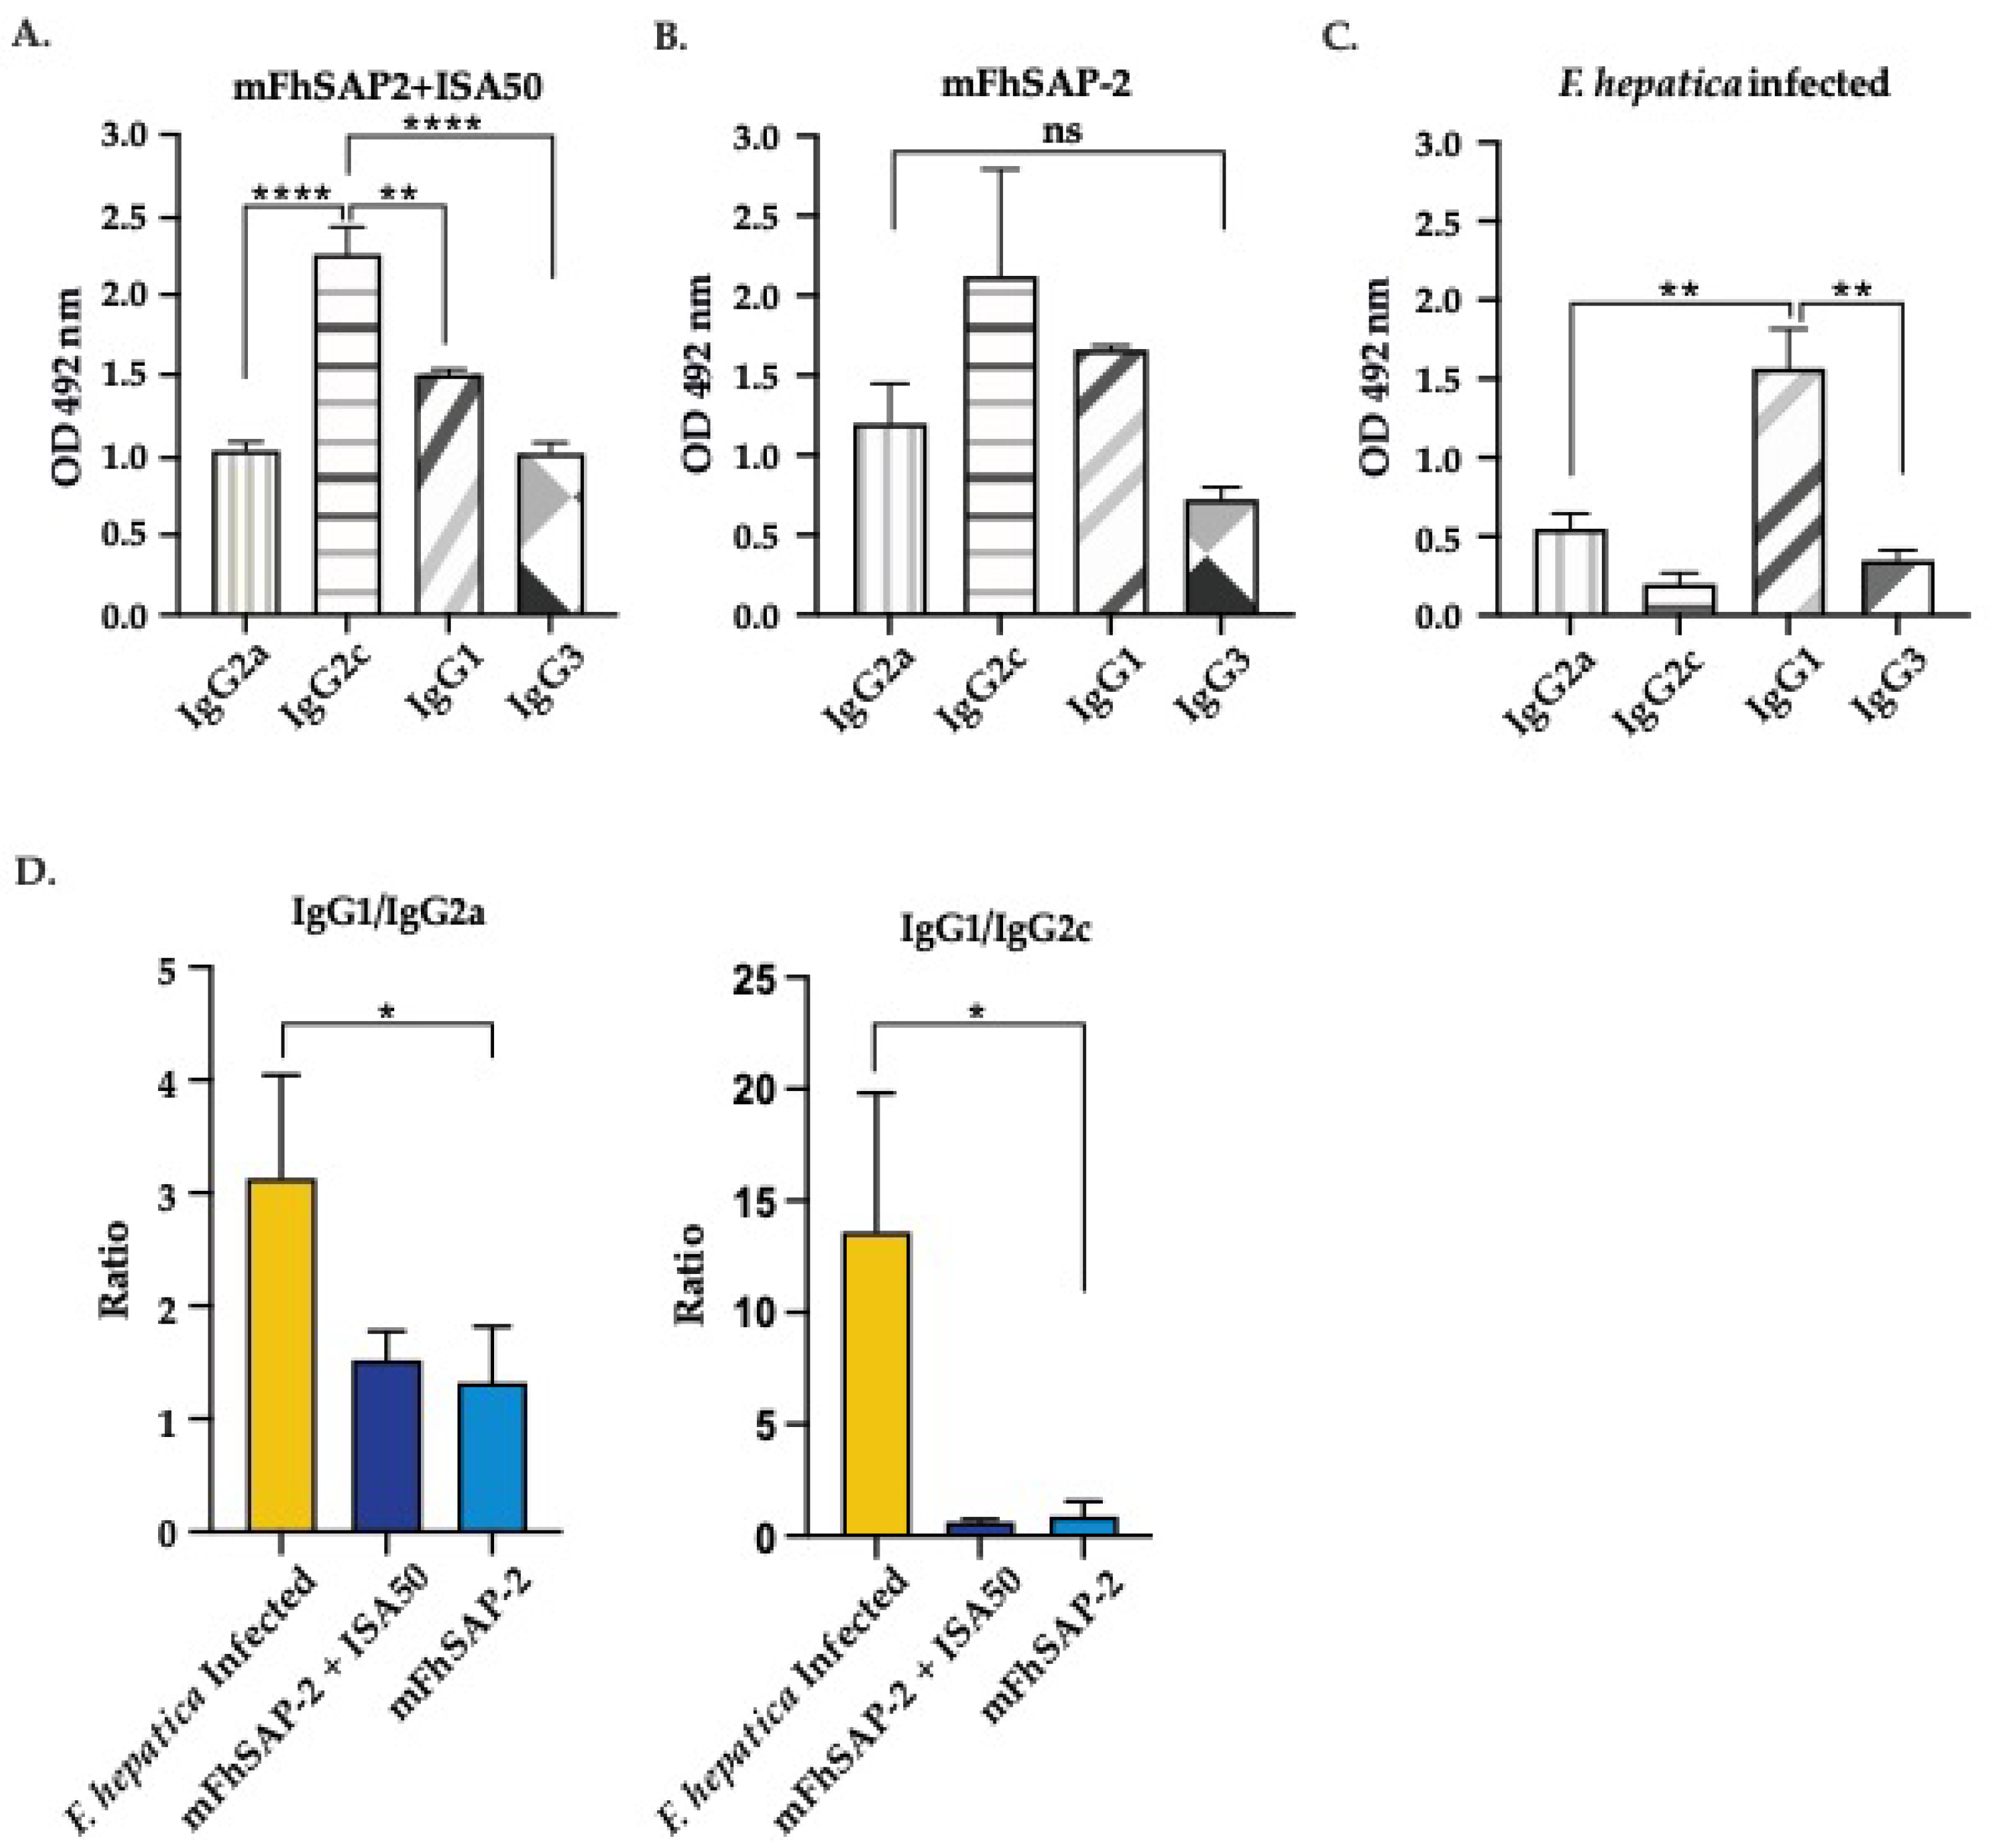
Figure 6.
IgG2a and IgG2c avidity index and titration curves. The avidity and titers of anti-mFhSAP-2 IgG2a and IgG2c antibodies were measured by ELISA. (A) Avidity index of IgG2a and IgG2c in C57BL/6 mice either infected with F. hepatica or immunized with mFhSAP-2 + ISA50. Avidity was interpreted as low if AI <30%, intermediate if between 30% and 50%, and high if >50%. Immunization with mFhSAP-2+ISA50 induced high-avidity IgG2a and IgG2c antibodies that were significantly higher than those induced by F. hepatica infection (***p=0.001), which elicited moderate to low avidity IgG2a and IgG2c, respectively. (B-C) The mean serum antibody titers showed that both mFhSAP-2 and mFhSAP-2 + ISA50 immunized mice had lower IgG2a end-point titers (1:1,600 and 1:6,400, respectively) compared to IgG2c (1:3,200 and 1:25,600, respectively). Data are presented as mean ± SEM.
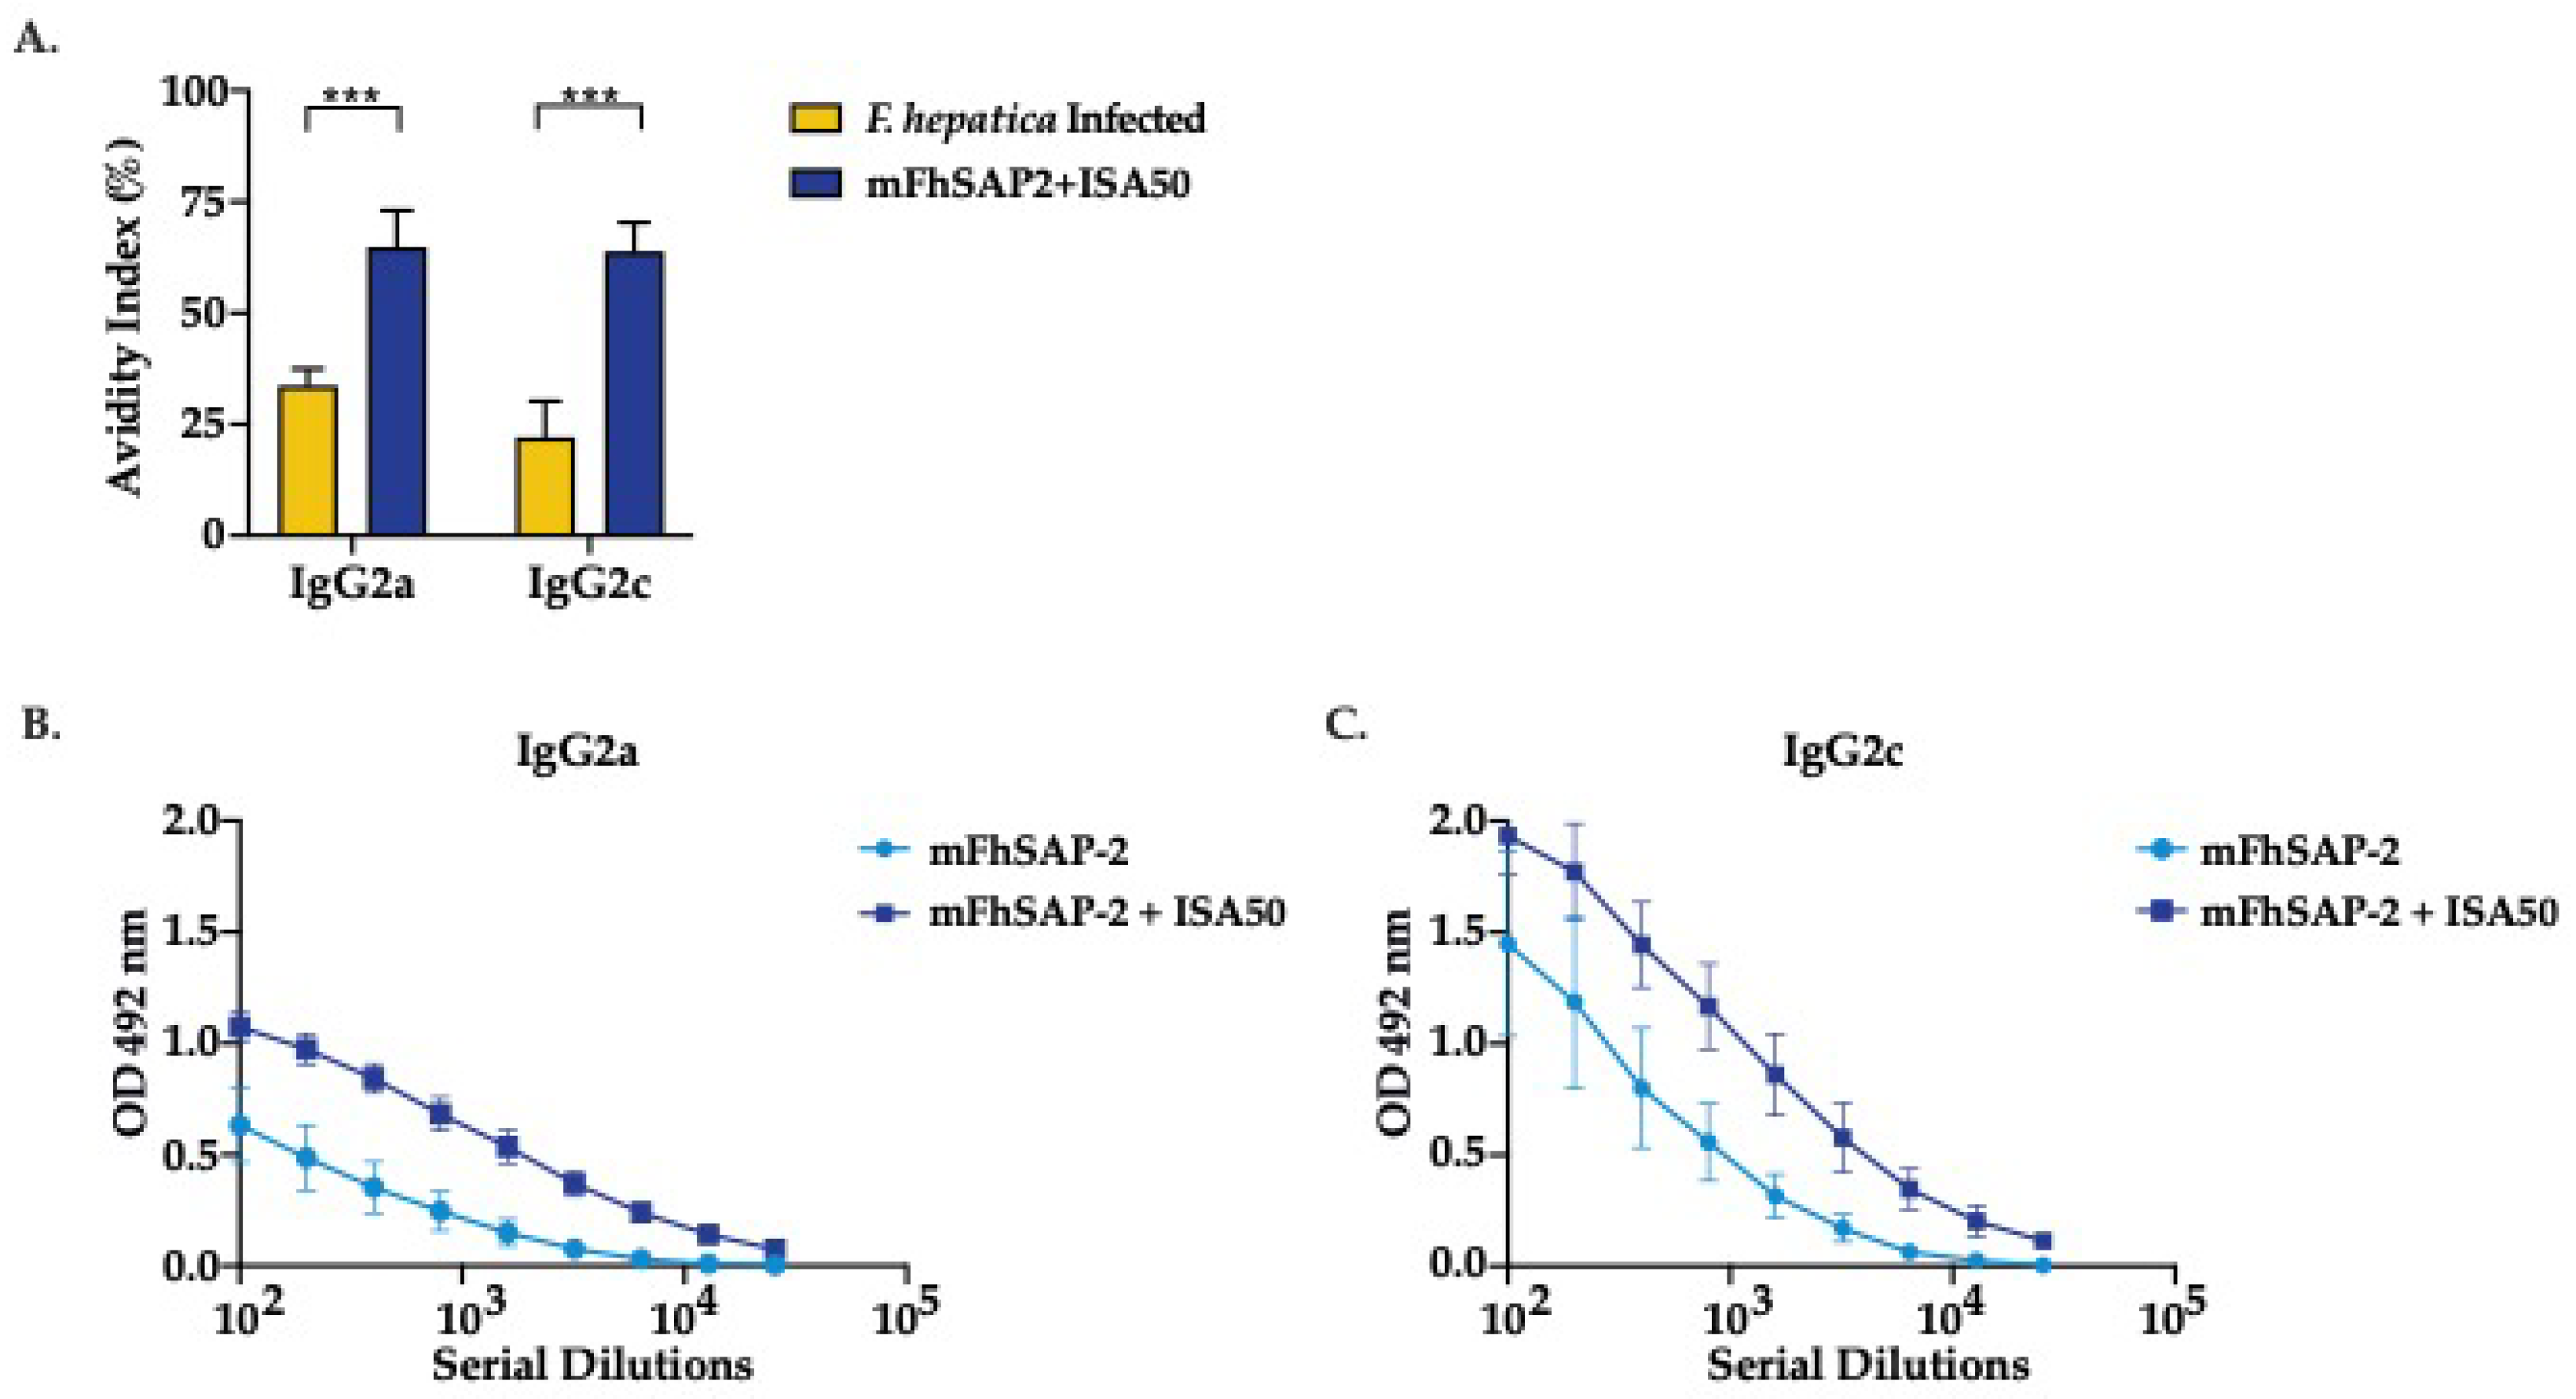
Figure 7.
Activation of CD4+ T cells in response to mFhSAP-2. (A) Splenocytes from C57BL/6 mice immunized with mFhSAP-2 + ISA50 or naïve (negative control: NC) were cultured in vitro, either non-stimulated or stimulated with mFhSAP-2 for 72 hours. Cell proliferation index (CPI) was calculated as the ratio of the number of cells at 72 hours to the number of cells at 0 hours. Non-stimulated cells from immunized mice showed significantly higher proliferation index than those from negative controls (*p=0.0176). (B-C) Splenocytes from C57BL/6 mice immunized with mFhSAP-2 + ISA50 or naïve (negative control: NC) were cultured in vitro, stimulated with mFhSAP-2 for 24 hours and analyzed by flow cytometry. Mice immunized with mFhSAP-2 + ISA50 had significantly higher number of activated (CD69+) CD4+ T-cells (*p=0.0252) than activated CD8+ T-cells compared to negative control (NC) animals. CD4+ T cells from mFhSAP-2+ISA50 immunized mice showed significantly higher IFN/IL-4 ratios than NC animals (*p=0.0376). Data are presented as mean ± SEM. Statistical significance was determined using unpaired t-tests.
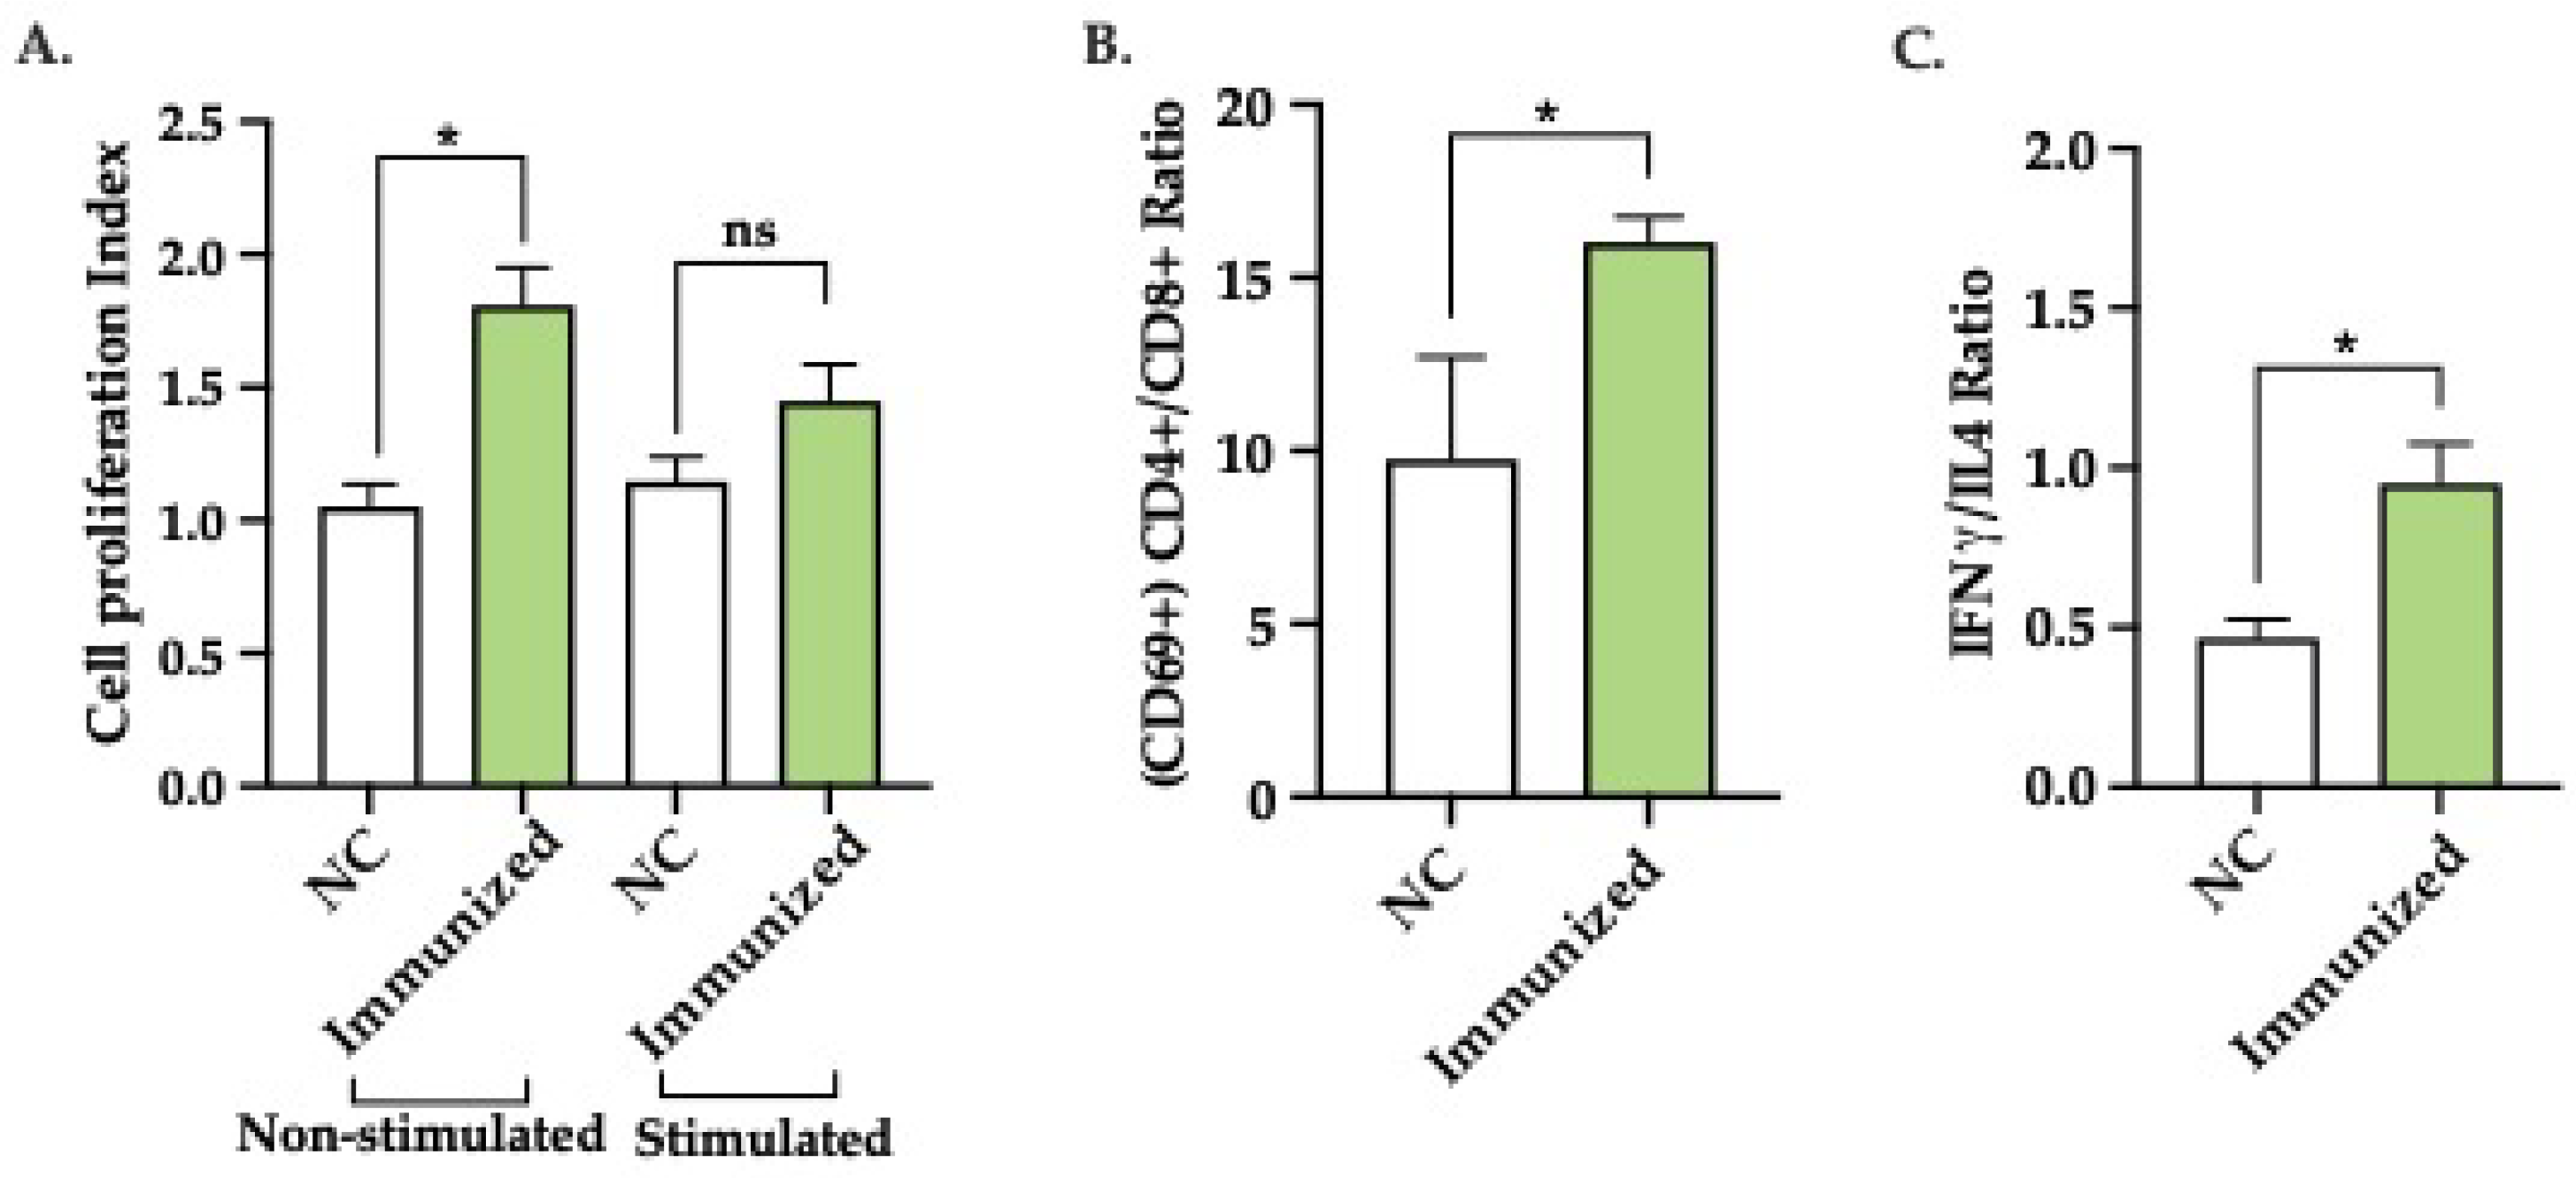

Table 1.
Secondary structure analysis of mFhSAP-2.
| Method | -Helix (%) | -Sheet (%) | Extended or random coil (%) |
|---|---|---|---|
| Circular dichroism (25oC) | 66.00 | -- | 34.00 |
| SOPMA Server * | 67.33 | 3.96 | 18.71 |
*Prediction made to the full-length FhSAP-2 protein in Espino et al 2003, J. Parasitol. 89 (1): 545-552.
Table 2.
Avidity analysis of IgG2a and IgG2c antibodies to mFhSAP-2 + ISA50
| SD | ||
|---|---|---|
| Group | IgG2a | IgG2c |
| 1-F. hepatica Infected | 42.55% 1.46 | 21.45% 15.84 |
| 2-mFhSAP-2+ISA50 immunized | 72.73% 23.01 | 66.16 19.18 |
Disclaimer/Publisher’s Note: The statements, opinions and data contained in all publications are solely those of the individual author(s) and contributor(s) and not of MDPI and/or the editor(s). MDPI and/or the editor(s) disclaim responsibility for any injury to people or property resulting from any ideas, methods, instructions or products referred to in the content. |
© 2025 by the authors. Licensee MDPI, Basel, Switzerland. This article is an open access article distributed under the terms and conditions of the Creative Commons Attribution (CC BY) license (http://creativecommons.org/licenses/by/4.0/).
Copyright: This open access article is published under a Creative Commons CC BY 4.0 license, which permit the free download, distribution, and reuse, provided that the author and preprint are cited in any reuse.


