
Submitted:
09 March 2025
Posted:
10 March 2025
You are already at the latest version
Abstract
Thermal imaging technology has revolutionized various fields, but current high operating temperature (HOT) mid-wave infrared (MWIR) cameras, particularly those based on xBn detectors, face limitations in size and cost due to the need for cooling to 150 Kelvin. This study explores the potential of extending the operating temperature of these cameras to 180 Kelvin, leveraging advanced AI algorithms to mitigate the increased thermal noise expected at higher temperatures. The research investigates the feasibility and effectiveness of this approach for remote sensing applications, combining experimental data with cutting-edge image enhancement techniques like Enhanced Super-Resolution Generative Adversarial Networks (ESRGAN). The findings demonstrate the potential of 180 Kelvin operation for xBn MWIR cameras, particularly in daylight conditions, paving the way for a new generation of more affordable and compact thermal imaging systems.
Keywords:
xBn MWIR Camera
; 180 Kelvin Operation
; ESRGAN
; High Operating Temperature (HOT)
; Cost-Effective Thermal Imaging
; Image Quality Assessment
; SWaP
1. Introduction
Thermal imaging has emerged as a powerful tool in remote sensing, providing valuable information about surface temperatures and thermal patterns. However, the sensitivity of thermal cameras is often limited by thermal noise, which can significantly degrade image quality.
commercially available thermal cameras offer a diverse range of spatial resolutions, typically spanning from 160 x 120 pixels to 1280 x 1024 pixels [1] and new cameras even up to 2560×2048 pixels [2], reflecting a complex interplay between achieving desired image detail and optimizing Size, Wight and Power (SWaP) characteristics [1]. This resolution dictates the level of detail that can be discerned in the thermal image. However, regardless of the inherent resolution of the camera, the quality of thermal images is often compromised by thermal noise. Thermal noise, an inherent characteristic of all electronic systems operating above absolute zero, arises from the random thermal motion of charge carriers within the camera sensor. This noise manifests random fluctuations in the detected signal, introducing graininess and reducing the clarity of the thermal image. There are several researches about performance of HCT (HgCdTe) MWIR cameras that work on higher temperatures up to 217 Kelvin [3,4] that allow reduce in camera size, wight and price. However, there is no available research about the performance of xBn MWIR cameras that operates above 150 Kelvin.
xBn detectors, specifically InAsSb/AlSbAs XBn detectors, offer several advantages comparable to HCT. For example: XBn detectors exhibit diffusion-limited dark currents, nearly 40% weight reduction, power reduction, and better mean time to failure (MTTF) [5]. Therefore, it's important to check the performance of those types of cameras as well.
Traditionally, researchers have relied on various image processing techniques to mitigate the impact of thermal noise and enhance the quality of thermal images. Image enhancement encompasses a wide range of approaches aimed at improving the visual appeal and information content of an image, including techniques to sharpen details, adjust contrast and reduce noise [6]. While these techniques can be effective to a certain extent, they often struggle to fully compensate for the inherent limitations posed by thermal noise, especially in low-light conditions or when imaging objects with subtle temperature variations. Traditional methods often rely on multiple images or prior knowledge, which may not always be available or practical. Furthermore, many algorithms struggle with distortions like saturation, a challenge also present in thermal imaging when temperature ranges exceed sensor capabilities [7]
The emergence of artificial intelligence (AI), particularly deep learning algorithms, has revolutionized the field of image processing, offering new and powerful tools for image enhancement and super-resolution. Super-resolution, a specific class of image enhancement, focuses on increasing the resolution of an image beyond its inherent limits, essentially recovering finer details that were lost during the image acquisition process. Early Super resolution (SR) models, such as Super-Resolution Generative Adversarial Network (SRGAN) [8] and ESRGAN [9], relied on bicubic kernel interpolation to downsample HR images during training, creating synthetic Low-resolution (LR) images to learn the mapping between LR and SR image pairs. However, bicubic kernel interpolation, while computationally simple, only partially simulates the complexity of real-world image degradation, which often involves a diverse combination of degradations like blurring, noise, and compression artifacts. This limitation led to the development of blind SR models, designed to handle LR images with unknown and complex degradation processes [10].
Real-ESRGAN [11], a prominent example of a blind SR model, utilizes the HDM (High-order Deterioration Model) to more effectively simulate real-world image degradation during training. HDM goes beyond simple interpolation methods, incorporating a combination of blurring, downsampling, noise addition, and compression to create a more realistic representation of real-world LR images [12]. This comprehensive approach enables Real-ESRGAN to learn a more robust mapping between LR and HR image pairs, leading to improved reconstruction quality for real-world images.
Despite its advantages, Real-ESRGAN still faces challenges. Reconstructed images can sometimes appear overly smooth, resulting in a loss of fine texture details and, consequently, a performance that is inferior to classical models like SRGAN and ESRGAN in certain scenarios [12]. This over-smoothing is likely a consequence of the model prioritizing the removal of noise and artifacts, sometimes at the expense of fine textural details. Moreover, while Real-ESRGAN reconstructed images might exhibit good visual quality, they can differ significantly from the original HR image, particularly in terms of fine textures and subtle details. This deviation, while not always visually apparent, raises concerns about the fidelity of the reconstruction and its suitability for applications where accurate representation of fine details is critical.
Operating a thermal camera at 180 Kelvin, instead of the conventional 150 Kelvin, presents both opportunities and challenges. On the one hand, operating at a higher temperature could potentially lead to increased thermal noise, further degrading image quality. On the other hand, this approach allows for the exploration of a new operational regime for thermal cameras, potentially offering benefits in terms of cost, power consumption, or sensor sensitivity. Investigating the feasibility and benefits of operating thermal cameras at this higher temperature, while effectively mitigating the increased thermal noise, constitutes a novel and potentially impactful research direction.
This article aims to demonstrate the feasibility and effectiveness of operating a xBn MWIR thermal camera at 180 Kelvin for remote sensing applications, leveraging advanced AI algorithms like ESRGAN to compensate for the increased thermal noise. By combining this novel operational approach with cutting-edge image enhancement techniques, this research seeks to pave the way for a new generation of thermal imaging systems capable of delivering high-quality images even in challenging conditions.
By extending the operational range to 180 Kelvin, the price and size of a camera can be reduced significantly as the power of the cooling system can up to 20% according to the heat transfer formula
Where:
Q = Heat transfer rate (W)
U = Overall heat transfer coefficient (W/m²K)
A = Surface area of the heat exchanger (m²)
ΔT = Temperature difference between the hot and cold sides (K)
Therefor cooling power for 150 Kelvin is 0.01 * 150K = 1.5W and for 180 Kelvin is Cooling power = 0.01 * 120K = 1.2W. therefore the Size reduction factor is 1.2W / 1.5W = 0.8 or 20%. Usually, for high end products reduced of 20% in performance can give a discount of 50% percent in price and size which can affect the entire design of the camera and reduce the price significantly. One can decide not to reduce the cooler volume but to enlarge the camera matrix. HOT cameras open design possibilities that are essential in many type of system such as airborne applications like MAWS (Missile Approach Warning System) and EO-DAS (Electro Optical Distributed Aperture Systems)[13,14,15]
The primary objective of this study is to investigate the theoretical and experimental feasibility of operating xBn MWIR thermal cameras at 180 Kelvin. In this article we focus on Investigate the performance at various operating temperatures and several AI algorithms.
The subsequent sections of this article will detail the experimental methodology, data analysis, and results of this research. The objective is to showcase the effectiveness of this approach in improving the quality of thermal images acquired at 180 Kelvin, ultimately contributing to the advancement of thermal imaging technology for remote sensing applications.
2. Materials and Methods
For our experiments, we use an xBn MWIR camera of SCD company with 10μm pitch, 640×512 FPA and frame rate of 30Hz. The Camera had the ability to work at different temperatures https://www.scd.co.il/products/blackbird-640-sparrow/.
Our first experiment was a USAF 1951 target that installed inside an ilet5 collimator of CI-Systems that define to ΔT of 4 deg. We put the camera in front of the collimator and test it first in 150 Kelvin and after it in 180 Kelvin. The setup of the experiment is shown in Figure 1.
The second experiment was outdoors during daylight with pictures that were taken at a distance of 400 meters in 150 & 180 Kelvin. The third experiment was outdoors during evening (Low light) with pictures that were taken at a distance of 400 meters in 150 & 180 Kelvin. Figure 2 demonstrates test setup in the outdoor experiments
We took the raw data from the experiments and enhance it using general algorithms in the following order: 1. We Adjusted the image intensity 2. We remove hot pixels by using a median filter on Adjacent pixels. In this step , We adjusted the filter at each temperature, so at a temperature of 150 Kelvin, the threshold for activating the filter was 0.9 (meaning only on the very hot pixels), while for 180 Kelvin, the threshold was 0.1 (meaning the filter would have to be activated as a burden on the entire image due to the noise level). 3 we use ESRGAN algorithm, that wasn't specifically trained for our experiments. Figure 3 shows the Flowchart of the method
In order to show the improvement of the images we made a 2 step's quality comparison: first we compared the difference between the original image to the enhanced image in 150 Kelvin and in 180 Kelvin. The compared was made using the NIQE (Naturalness Image Quality Evaluator) [16] which a no-reference image quality score. This is because we don't have a reference image to compare with. The NIQE algorithm uses the comparison between the natural MVG (Multivariate Gaussian Model) and the distorted image’s MVG model. The formula used for the comparison is:
where and are the mean vectors and covariance matrices of the natural MVG model and the distorted image’s MVG model.
The second step was made between the enhanced 150 and 180 Kelvin and between the original 150 and 180 Kelvin, in order to show the improvement from the original images the enhanced images. For this step we used several known methods such as MSE (Mean Squared Error) & PSNR (Peak Signal-to-Noise Ratio) & UIQI (Universal Image Quality Index). MSE computes the mean square error between original image and distorted image. The formula used for the MSE computation is:
where I,K are the reference image and distorted image. PSNR computes the ratio between peak power of signal image to noise corrupting the signal image. Higher the value of PSNR higher the clarity of the distorted image. The formula used for the PSNR computation is:
where R is the maximum value (pixel) of input image. The UIQI breaks the comparison between original and distorted image into three comparisons namely: 1. Luminance 2. Contrast and 3. Structural
where are the mean values of original and distorted images, are the standard deviation of original and distorted images and Is the covariance of both images Based on the above three comparison equations. The formula used for the UIQI computation is:
3. Results
In this section we will show the images thar were taken in experiments, the enhancement that was made and we will show the improvement both in 180 Kelvin.
3.1. First Experiment
In this experiment we compared a USAF 1951 target in 150 Kelvin and 180 Kelvin. The USAF 1951 resolution test chart is shown in Figure 4. The test chart will be able to help to determine the maximum optical resolution that we can get. As we can see there are six groups. Each group consists of six elements, numbered from 1 to 6. The optical resolution is calculated as follows:
The original image that was received in 150 Kelvin and its enhancement are shown in Figure 5 and the 180 Kelvin original and enhancement images are shown in Figure 6.
One can see that the in Figure 5b we can still see the strips in group 2 element 4 which five us a resolution of 5.66lp/mm and in Figure 6b it can be seen only up to group (-1) element 5 which give us resolution of 0.794lp/mm. in both cases (150Kelvin and 180 Kelvin) there are improvement form original images to the enhanced one.
3.2. Second Experiment
The second experiment was outdoors during daylight. The pictures contain buildings, trees and vehicles. The original image that was received in 150 Kelvin and its enhancement are shown in Figure 7 and the 180 Kelvin original and enhancement images are shown in Figure 8. The original image in 180 Kelvin is blur and it is hard to identify details such as the shape of the wall near to the black car, the shape of the tree trunk near the white car or even the fence in the upper right side of the image which can be seen in the enhanced image. It is clear that the 150 Kelvin enhanced image is better compared to the 180 Kelvin. However, the gap narrowed sharply after the enhancement.
3.3. Thrid Experiment
The third experiment was outdoors during evening (Low light). The pictures contain buildings, trees and people. The original image that was received in 150 Kelvin and its enhancement are shown in Figure 9 and the 180 Kelvin original and enhancement images are shown in Figure 10. After the enhancement, both images (150 & 180 Kelvin) were less blur and more details can be seen. Although it is clear that the quality in 150 Kelvin is better. For example: In Figure 9 one can determine three people walking on sidewalk on lower right side of the enhanced image which was hard to identify in the original image. However, it is still hard to find the one guy that is walking on the sidewalk in Figure 10.
To quantify the improvement, we made a comparison using NIQE algorithm for the original images in both 150 &180 Kelvin as can be seen in Table 1 below. A lower score means that the images are considered to have higher perceived quality. One can see that enhancement made a difference in almost all the images (except in the USAF 1951 -150 Kelvin where the scores are quite the same in both images), and that the results in enhanced 180 Kelvin are similar to the enhanced 150 Kelvin, although ,the starting point of the 180 Kelvin images were worse.
The second comparison is between the original images and enhanced images as can be seen in Table 2. For MSE a lower score means a better match between the compared images. For UIQI a perfect match is when UIQI is equal to 1. A score of 0 indicates no correlation between the images. For PSNR a higher score is better. image matching is considered a good match with a PSNR score above 20. One can see that in all the tested methods, the results are better in 150 Kelvin compared to 180 Kelvin. The reason is that, although the enhanced images in 180Kelvin are similar to 150Kelvin, the starting point of the original 180Kelvin images was worse, therefore the differences between original images and enhanced images in 150 Kelvin are less compared to 180 Kelvin.
4. Discussion
The research presented in this article demonstrates the potential for operating xBn MWIR thermal cameras at 180 Kelvin. While the results are promising, especially for daylight conditions, there are several avenues for further exploration and improvement:
4.1. Algorithm Optimization
Algorithm optimization is crucial for enhancing the image quality of xBn MWIR thermal cameras operating at 180 Kelvin, especially under low-light conditions. There are several specific strategies for achieving this:
Training Data Specificity: The AI algorithm used in the study, ESRGAN, was not specifically trained for thermal images nor was the xBn MWIR camera being tested. Training deep learning models on datasets of thermal images captured at 180 Kelvin is essential. This allows the algorithm to learn the specific noise patterns and characteristics associated with higher-temperature operation, leading to better noise reduction and image enhancement.
Exploring Architectures: While ESRGAN has shown promise, there are other deep learning architectures for single-image super-resolution (SISR). Models like SRCNN, VDSR, EDSR, and SRGAN could be evaluated and compared based on their performance on 180 Kelvin thermal images. Each of these models has strengths and weaknesses, and selecting the optimal architecture will depend on factors such as the desired level of image detail, computational constraints, and the specific application.
Addressing Low-Light Challenges: The sources emphasize the need for algorithms specifically designed to tackle low-light image enhancement. LIME (low-light image enhancement), which estimates and refines the illumination map of an image, could be particularly effective in this context. By addressing the uneven illumination often present in low-light scenes, LIME can improve the visibility of details and enhance overall image quality.
Incorporating Attention Mechanisms: Attention-based deep learning models, such as RCAN (Residual Channel Attention Network)[17], have shown significant potential for image super-resolution. These models selectively focus on specific features or regions of an image, allowing for more efficient processing and potentially leading to better results, particularly in challenging scenarios like low-light conditions.
By meticulously optimizing these algorithmic aspects, one can unlock the full potential of 180 Kelvin thermal imaging, leading to more robust, higher-quality images even in challenging lighting conditions. This advancement could revolutionize the field, making high-performance thermal imaging more accessible for various applications.
4.2. Multi-Image Processing
The current study focused on single image enhancement (SISO). By incorporating multi-image processing techniques, such as temporal noise reduction or super-resolution algorithms that leverage information from consecutive frames, it may be possible to achieve significant improvements in image quality, even in low-light scenarios. This approach could be particularly beneficial for capturing moving objects, as algorithms designed to identify differences between consecutive images could be employed. Additionally, exploring multi-spectral and spatial data fusion techniques, similar to those used in remote sensing, could further enhance resolution and image detail by combining information from multiple spectral bands.
By pursuing these research directions, the feasibility and effectiveness of 180 Kelvin thermal imaging can be further validated and enhanced, potentially paving the way for a new generation of cost-effective and high-performance thermal imaging systems across various applications.
5. Conclusions
This research demonstrates that operating xBn MWIR thermal cameras at 180 Kelvin is achievable, particularly in daylight conditions where high-quality images can be obtained even with generic image processing. However, there are still some challenges remain in enhancing image quality in low-light scenarios. The study highlights the need for further research and development in enhancement algorithms optimized to LIME. By addressing these research areas, the feasibility and effectiveness of 180 Kelvin thermal imaging can be further enhanced. This advancement could lead to a new generation of cost-effective and high-performance thermal imaging systems for diverse applications, including astronomy, environmental monitoring, and materials science.
References
- Jiao, J.; Zhao, L.; Pan, W.; Li, X. Development and Core Technologies for Intelligent SWaP3 Infrared Cameras: A Comprehensive Review and Analysis. Sensors 2023, 23, 4189. [Google Scholar] [CrossRef] [PubMed]
- Magid, A.; Shkedy, L.; Ben Ari, N.; Shiloah, N.; Jakobson, C.G.; Freiman, W.; Armon, E.; Almog, E.; Nawi, S.S.; Katz, A.; et al. New low SWaP high definition MWIR detector with 5um pitch. In: Infrared Technology and Applications L. SPIE, 2024. p. 207-220.
- Pillans, L.; Ash, R.M.; Hipwood, L.; Knowles, P. MWIR mercury cadmium telluride detectors for high operating temperatures. In: Infrared Technology and Applications XXXVIII. SPIE, 2012. p. 1006-1017.
- Madejczyk, P.; Gawron, W.; Sobieski, J.; Martyniuk, P.; Rutkowski, J. MCT heterostructures for higher operating temperature infrared detectors designed in Poland. Opto-Electronics Rev. 2024, 31, e144551–e144551. [Google Scholar] [CrossRef]
- Klipstein, P.C.; Avnon, E.; Benny, Y.; Berkowicz, E.; Cohen, Y.; Dobromislin, R.; Fraenkel, R.; Gershon, G.; Glozman, A.; Hojman, E.; et al. Development and Production of Array Barrier Detectors at SCD. J. Electron. Mater. 2017, 46, 5386–5393. [Google Scholar] [CrossRef]
- Guo, X.; Li, Y.; Ling, H. LIME: Low-Light Image Enhancement via Illumination Map Estimation. IEEE Trans. Image Process. 2016, 26, 982–993. [Google Scholar] [CrossRef] [PubMed]
- Gur, E.; Sarafis, V.; Falat, I.; Vacha, F.; Vacha, M.; Zalevsky, Z. Super-resolution via iterative phase retrieval for blurred and saturated biological images. Opt. Express 2008, 16, 7894–7903. [Google Scholar] [CrossRef] [PubMed]
- NAGANO, Yudai; KIKUTA, Yohei. SRGAN for super-resolving low-resolution food images. In: Proceedings of the Joint Workshop on Multimedia for Cooking and Eating Activities and Multimedia Assisted Dietary Management. 2018. p. 33-37.
- WANG, Xintao, et al. Esrgan: Enhanced super-resolution generative adversarial networks. In: Proceedings of the European conference on computer vision (ECCV) workshops. 2018. p. 0-0.
- LIU, Anran, et al. Blind image super-resolution: A survey and beyond. IEEE transactions on pattern analysis and machine intelligence, 2022, 45.5: 5461-5480.
- Wang, X.; Xie, L.; Dong, C.; Shan, Y. Real-esrgan: Training real-world blind super-resolution with pure synthetic data. In: Proceedings of the IEEE/CVF international conference on computer vision. 2021. p. 1905-1914.
- Zhu, Z.; Lei, Y.; Qin, Y.; Zhu, C.; Zhu, Y. IRE: Improved Image Super-Resolution Based on Real-ESRGAN. IEEE Access 2023, 11, 45334–45348. [Google Scholar] [CrossRef]
- Shkedy, L.; Hirsh, I.; Klipstein, P.; Nitzani, M.; Gliksman, S.; Ben Ari, N.; Shiloah, N.; Jakobson, C.; Lury, Y.; Nahor, H.; et al. Advanced MAWS and DAS IR solutions based on HOT MWIR technology. In: Infrared Technology and Applications XLIX. SPIE, 2023. p. 255-268.
- SHKEDY, L., et al. HOT MWIR detector with 5 um pitch. In: Infrared Technology and Applications XLVII. SPIE, 2021. p. 146-157..
- KLIPSTEIN, P. C., et al. Advanced Infrared Photodetectors at SCD. In: ICOL-2019: Proceedings of the International Conference on Optics and Electro-Optics, Dehradun, India. Springer Singapore, 2021. p. 31-35..
- MITTAL, Anish; SOUNDARARAJAN, Rajiv; BOVIK, Alan C. Making a “completely blind” image quality analyzer. IEEE Signal processing letters, 2012, 20.3: 209-212.
- Zhang, Y.; Li, K.; Li, K.; Wang, L.; Zhong, B.; Fu, Y. Image super-resolution using very deep residual channel attention networks. In: Proceedings of the European conference on computer vision (ECCV). 2018. p. 286-301.
Figure 1.
Setup of the experiment: SCD camera, Collimator, Laptop (a) we can see that ; (b) represent how the raw data is seen in the laptop during the experiment's setup.
Figure 1.
Setup of the experiment: SCD camera, Collimator, Laptop (a) we can see that ; (b) represent how the raw data is seen in the laptop during the experiment's setup.
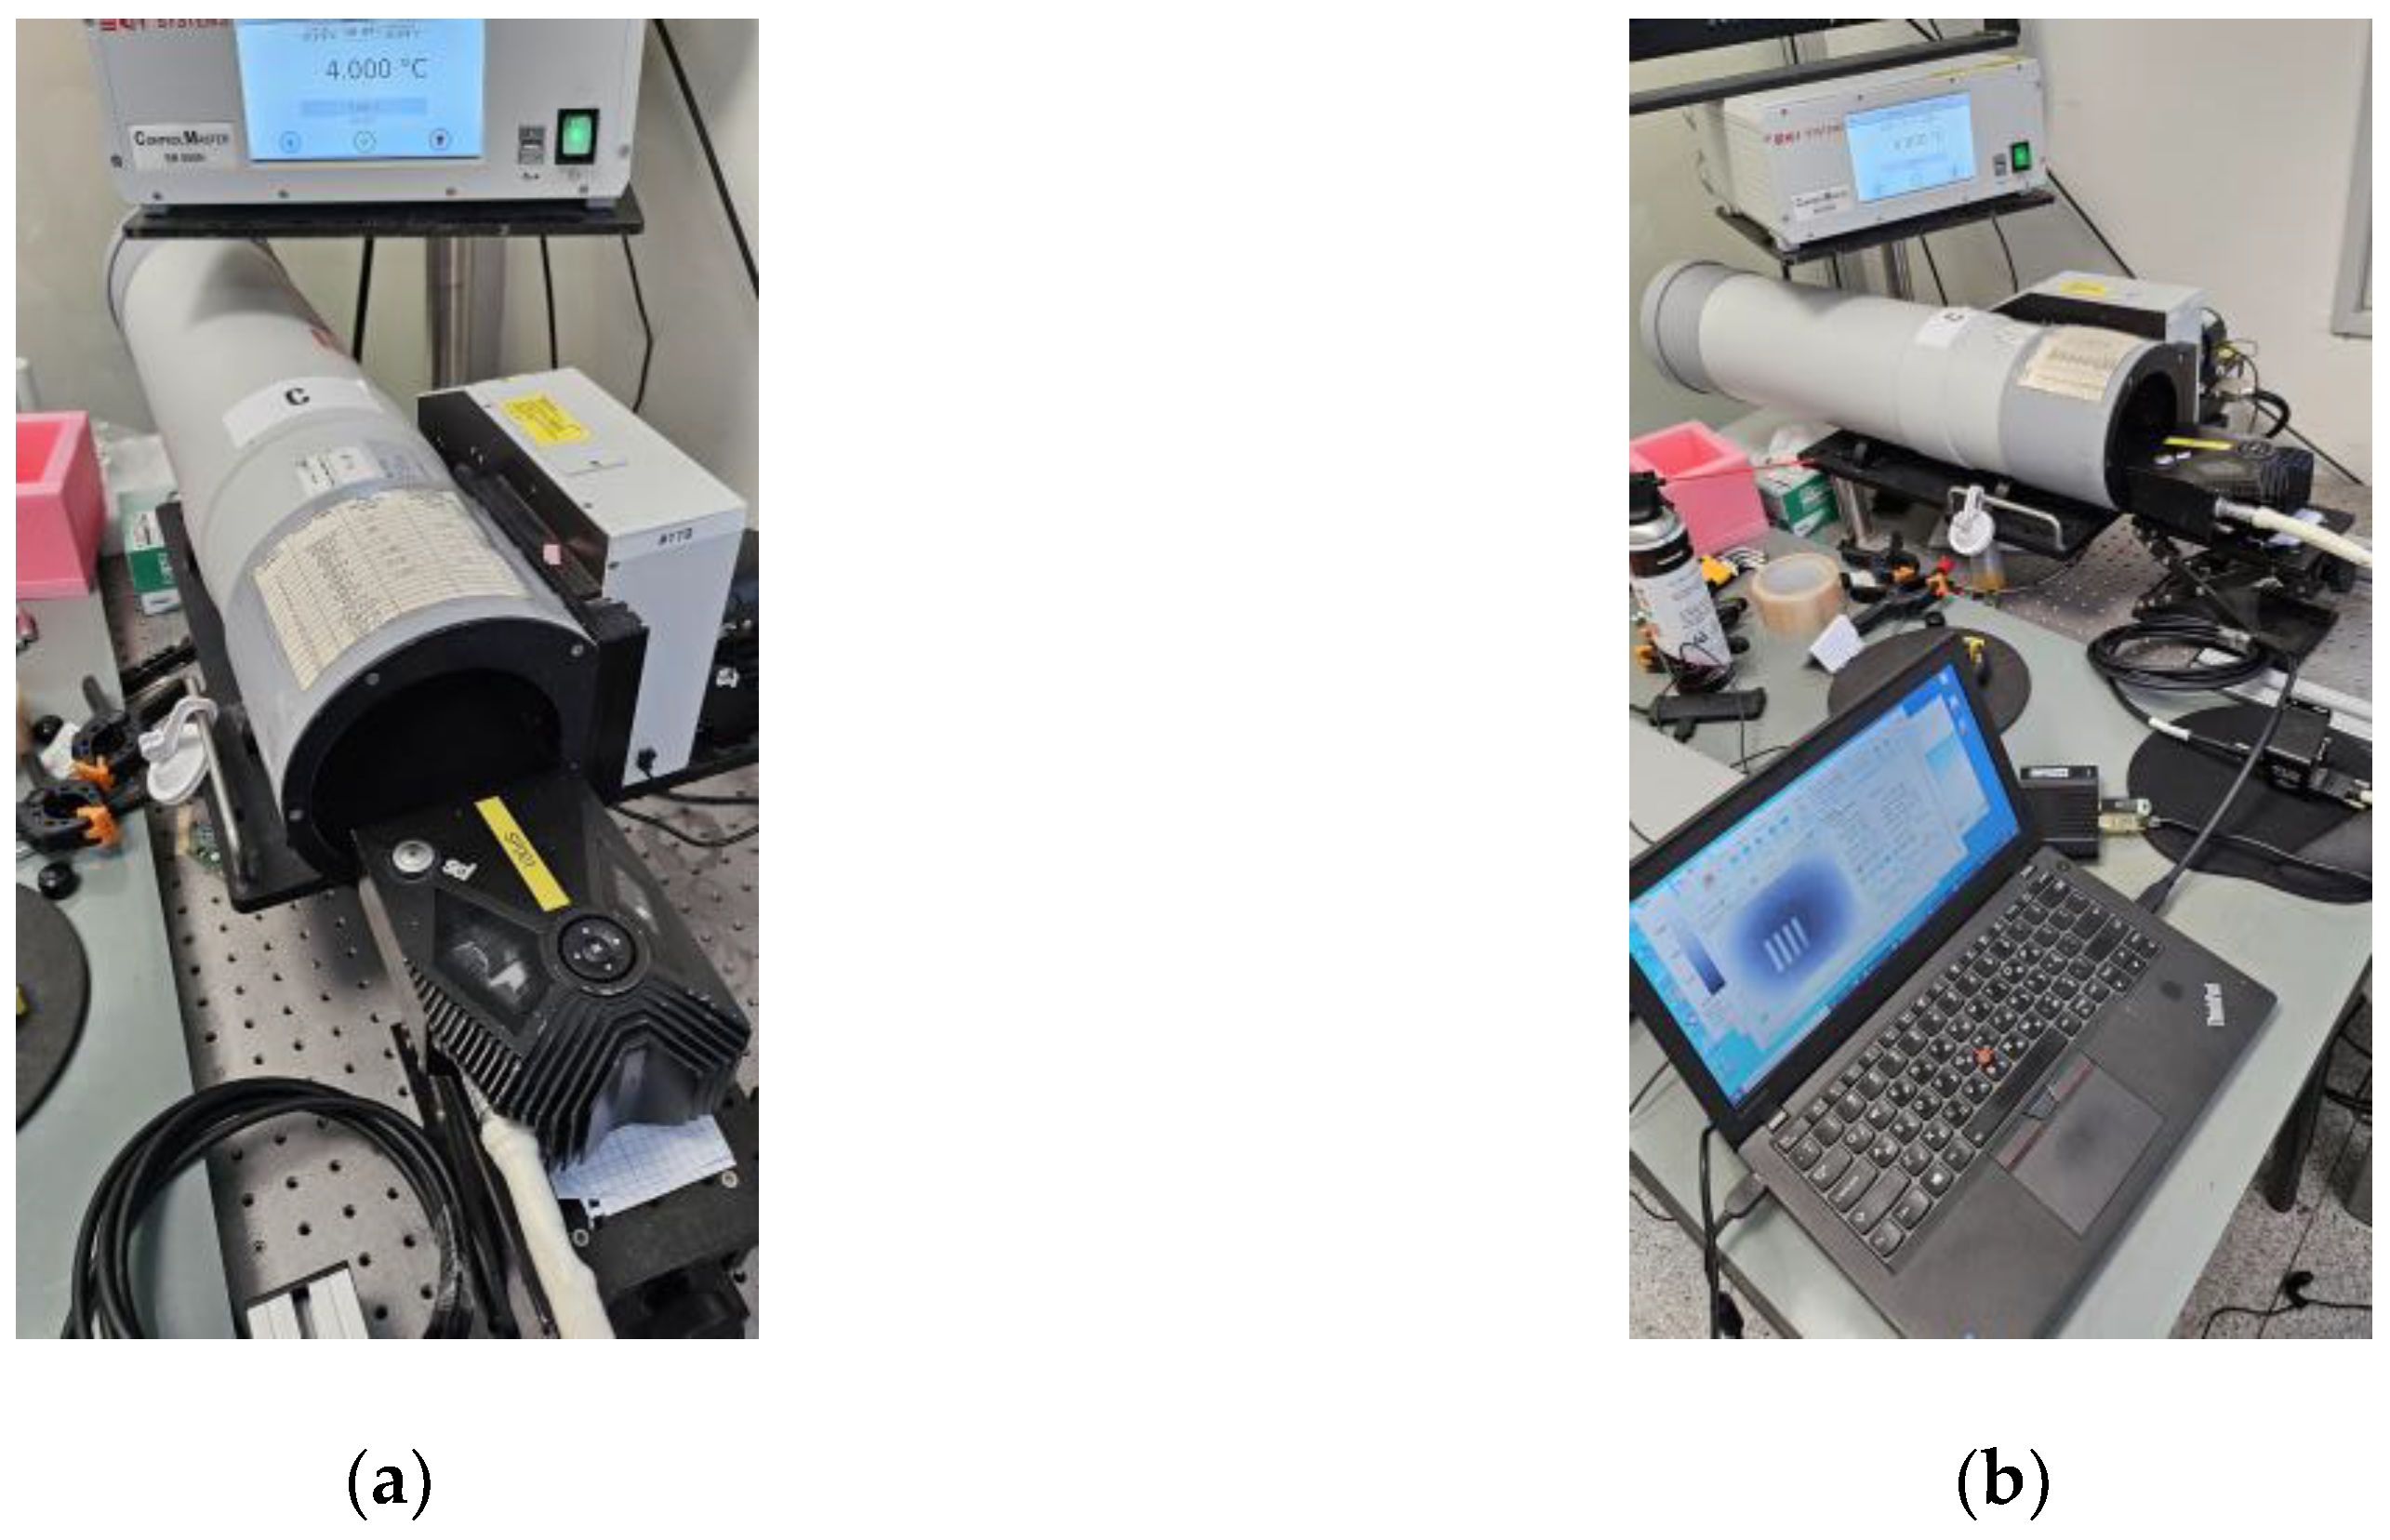
Figure 2.
Setup of the outdoor experiments: SCD camera, Laptop, batteries.
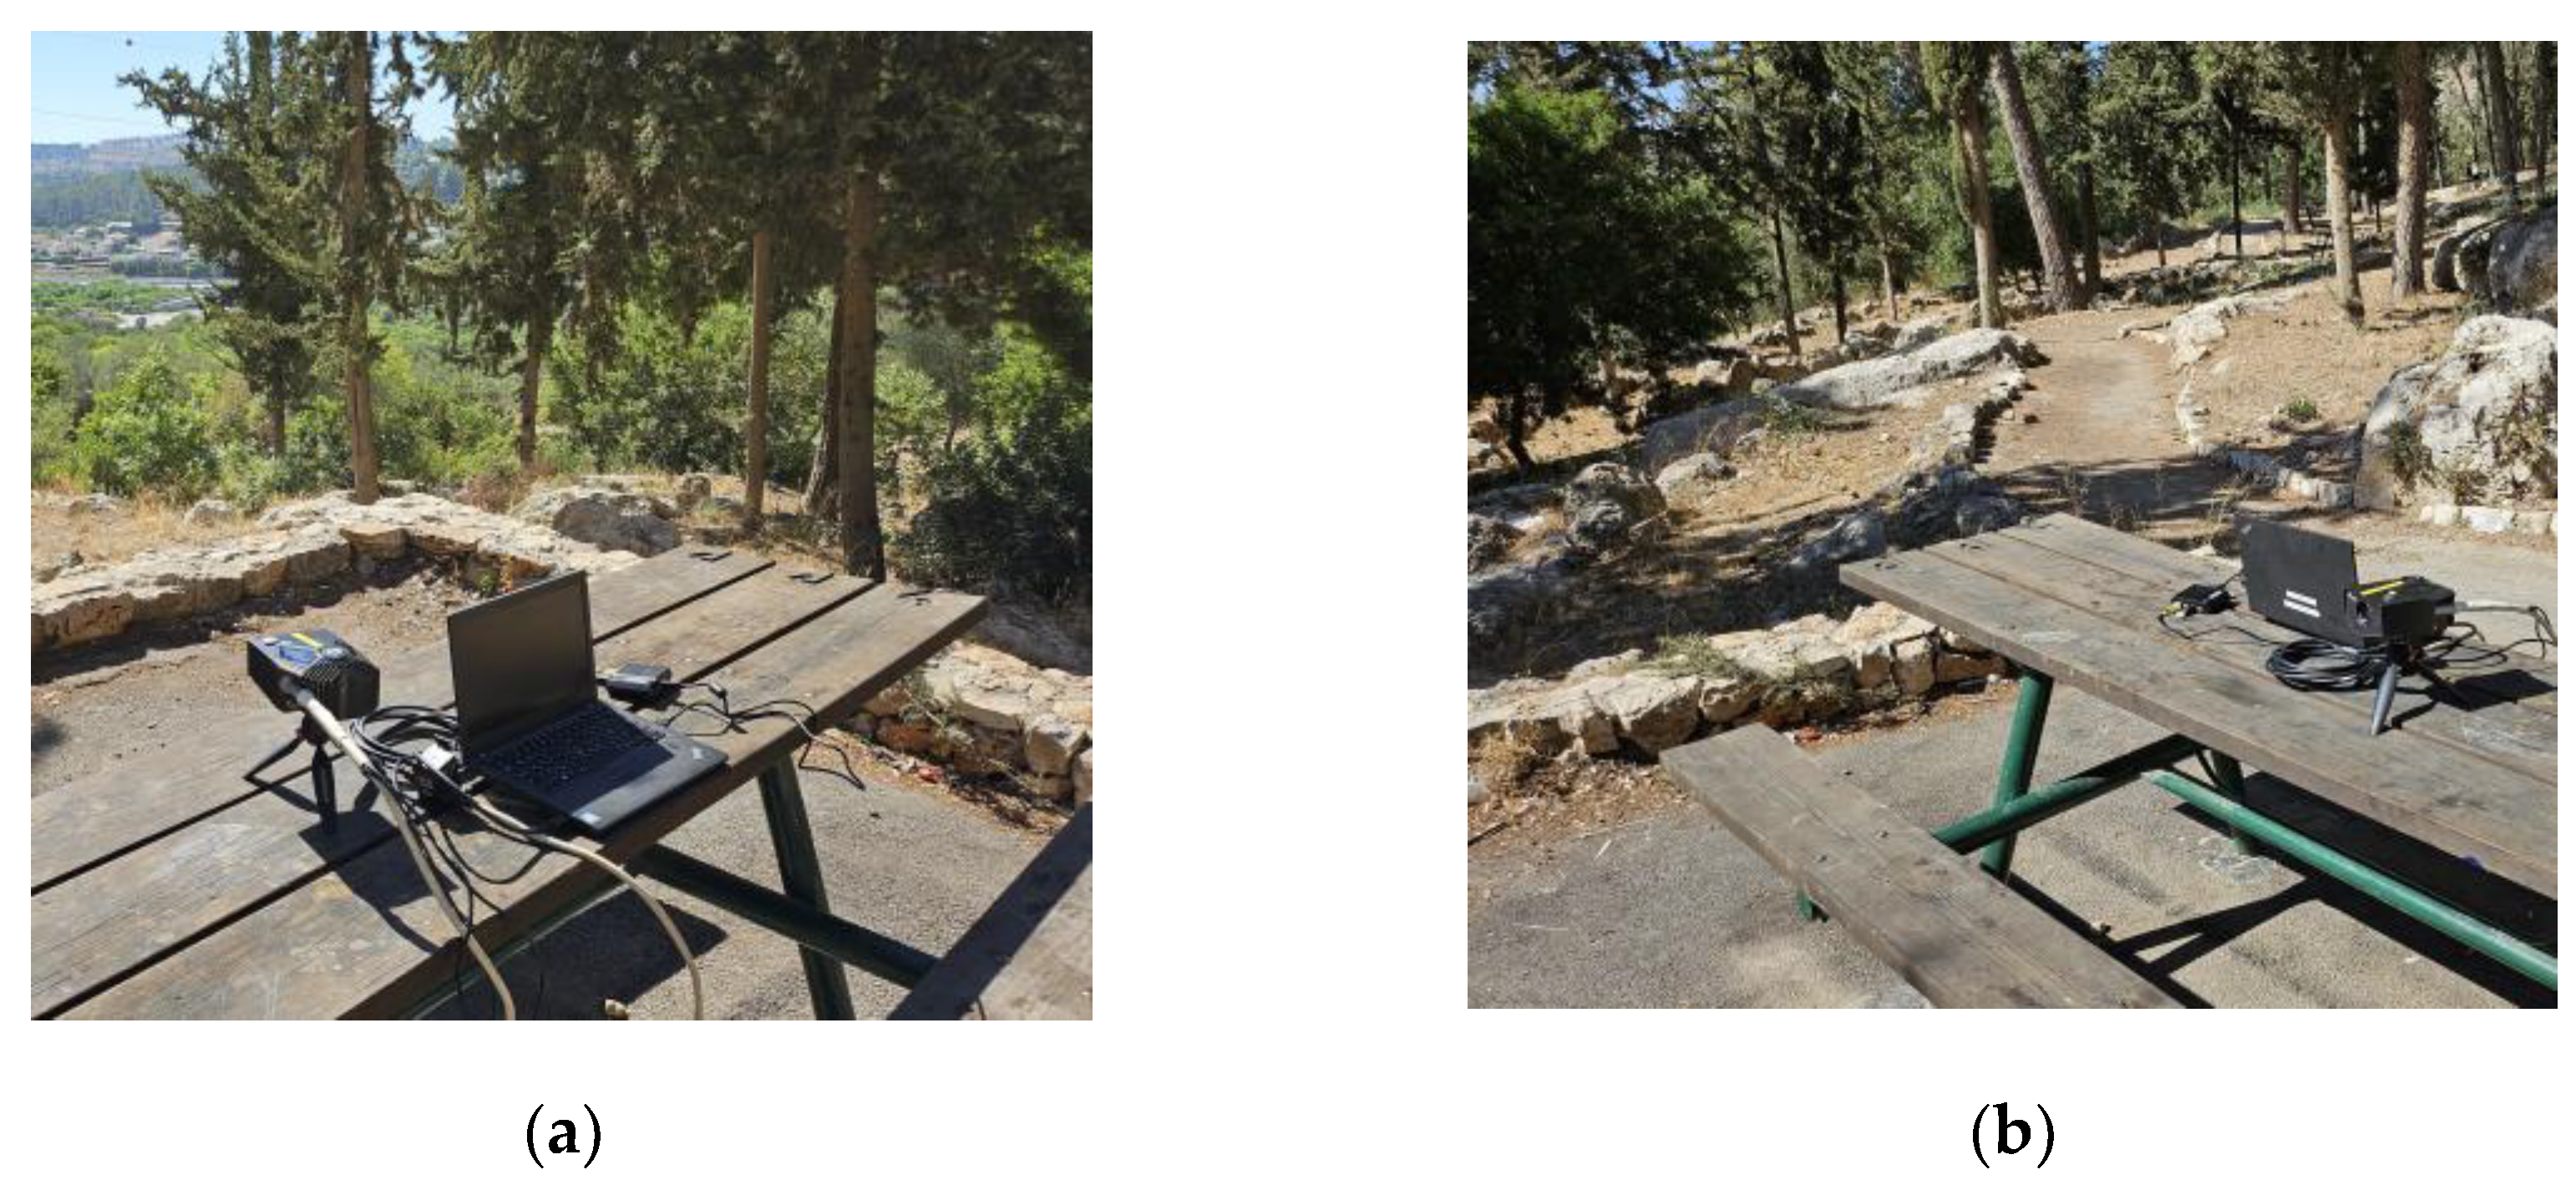
Figure 3.
Enhancement flowchart.
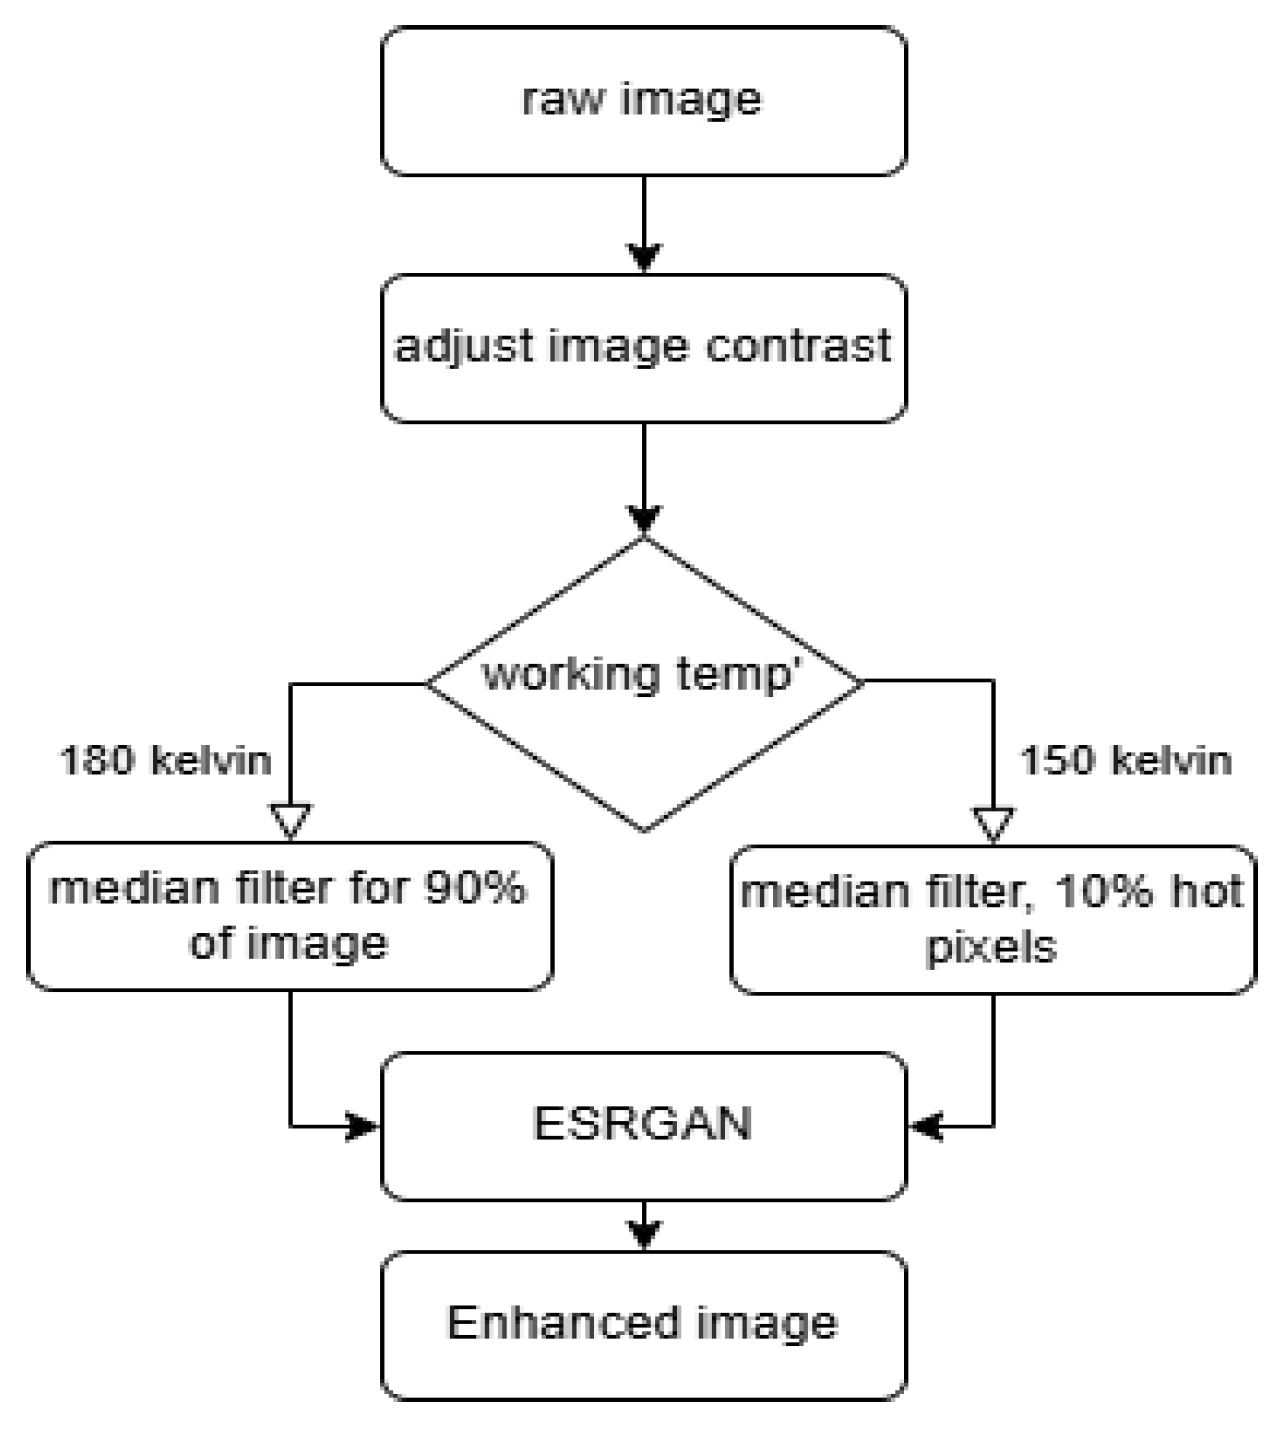
Figure 4.
USAF 1951 resolution test chart.
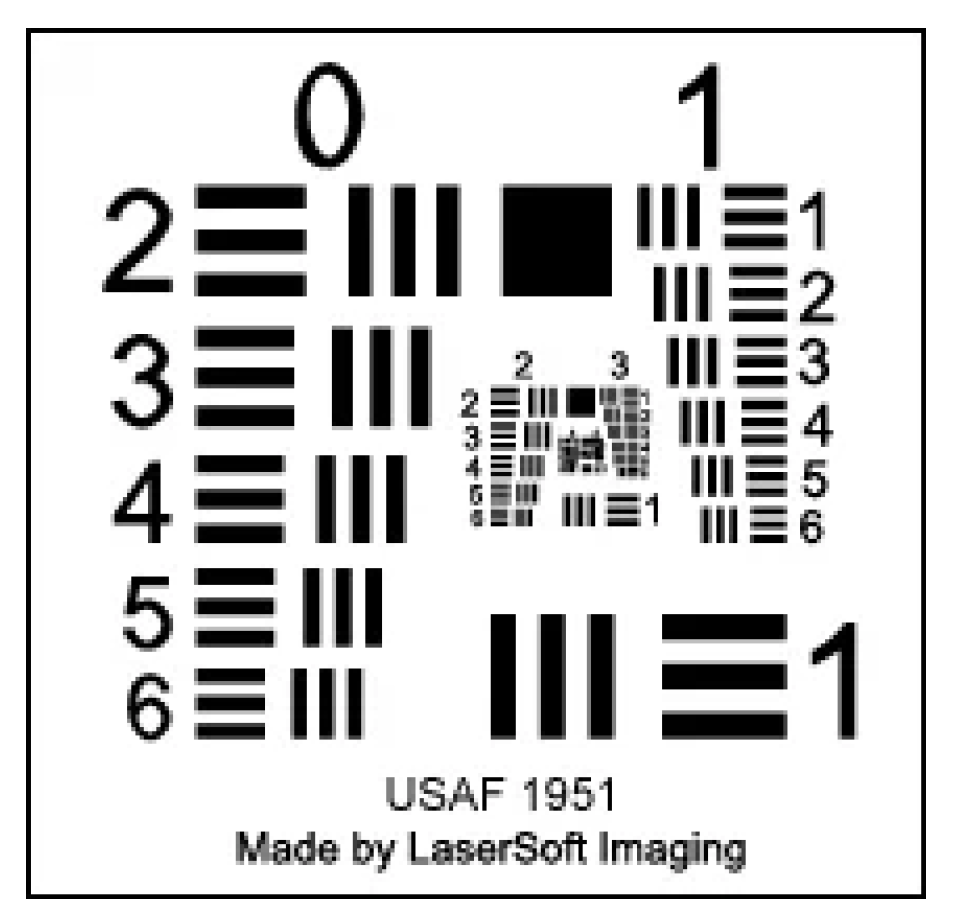
Figure 5.
USAF 1951 images in 150 Kelvin. (a) original image; (b) after ESRGAN enhancement.
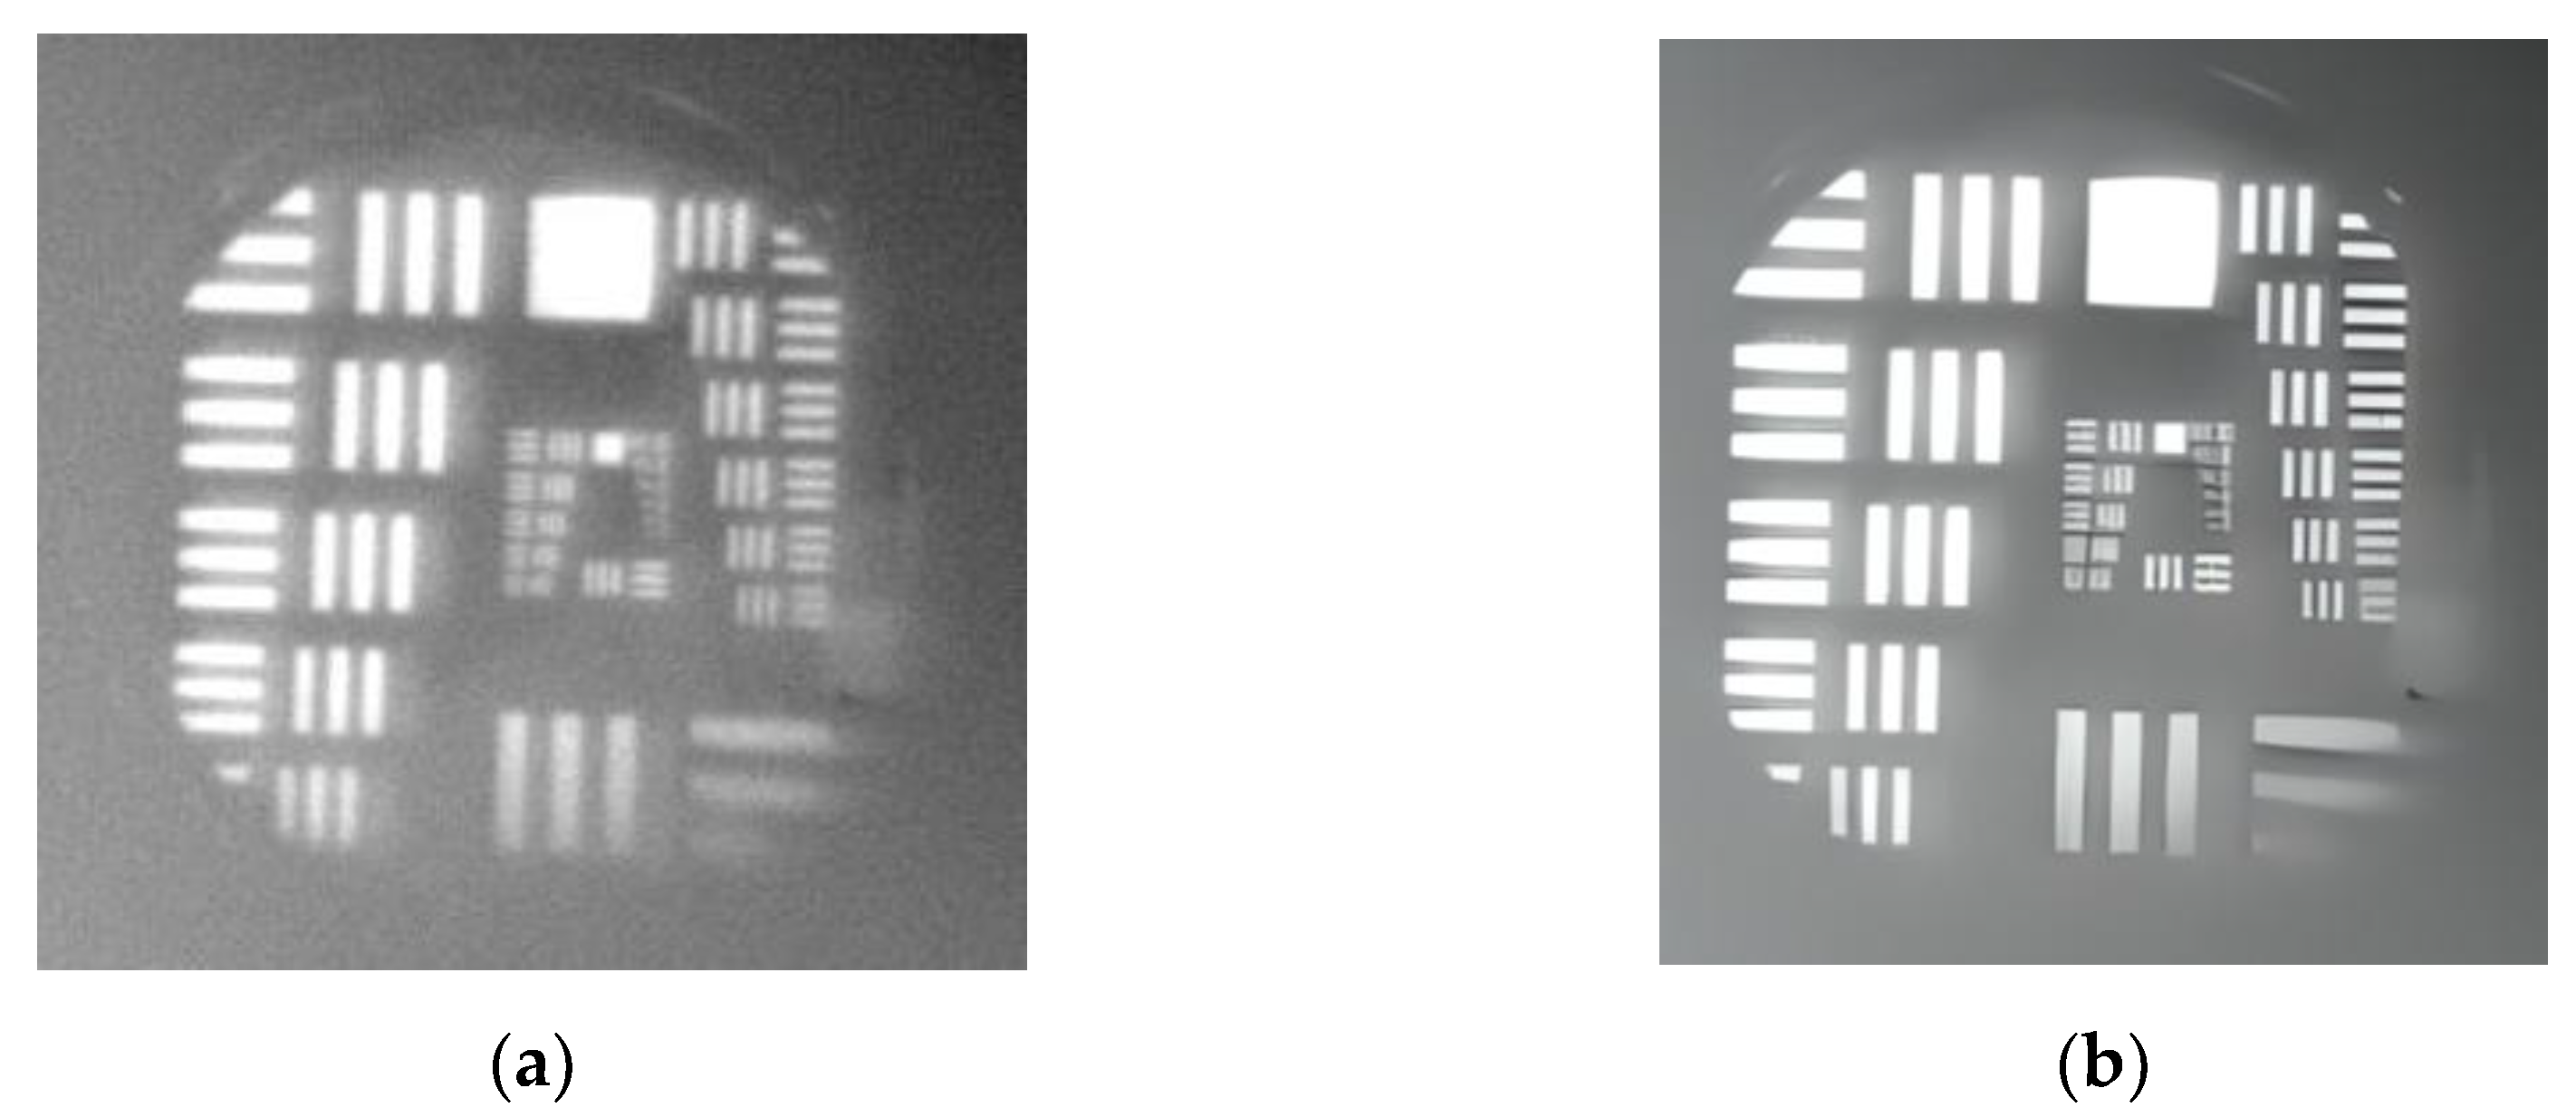
Figure 6.
USAF 1951 images in 180 Kelvin. (a) original image; (b) after enhancement
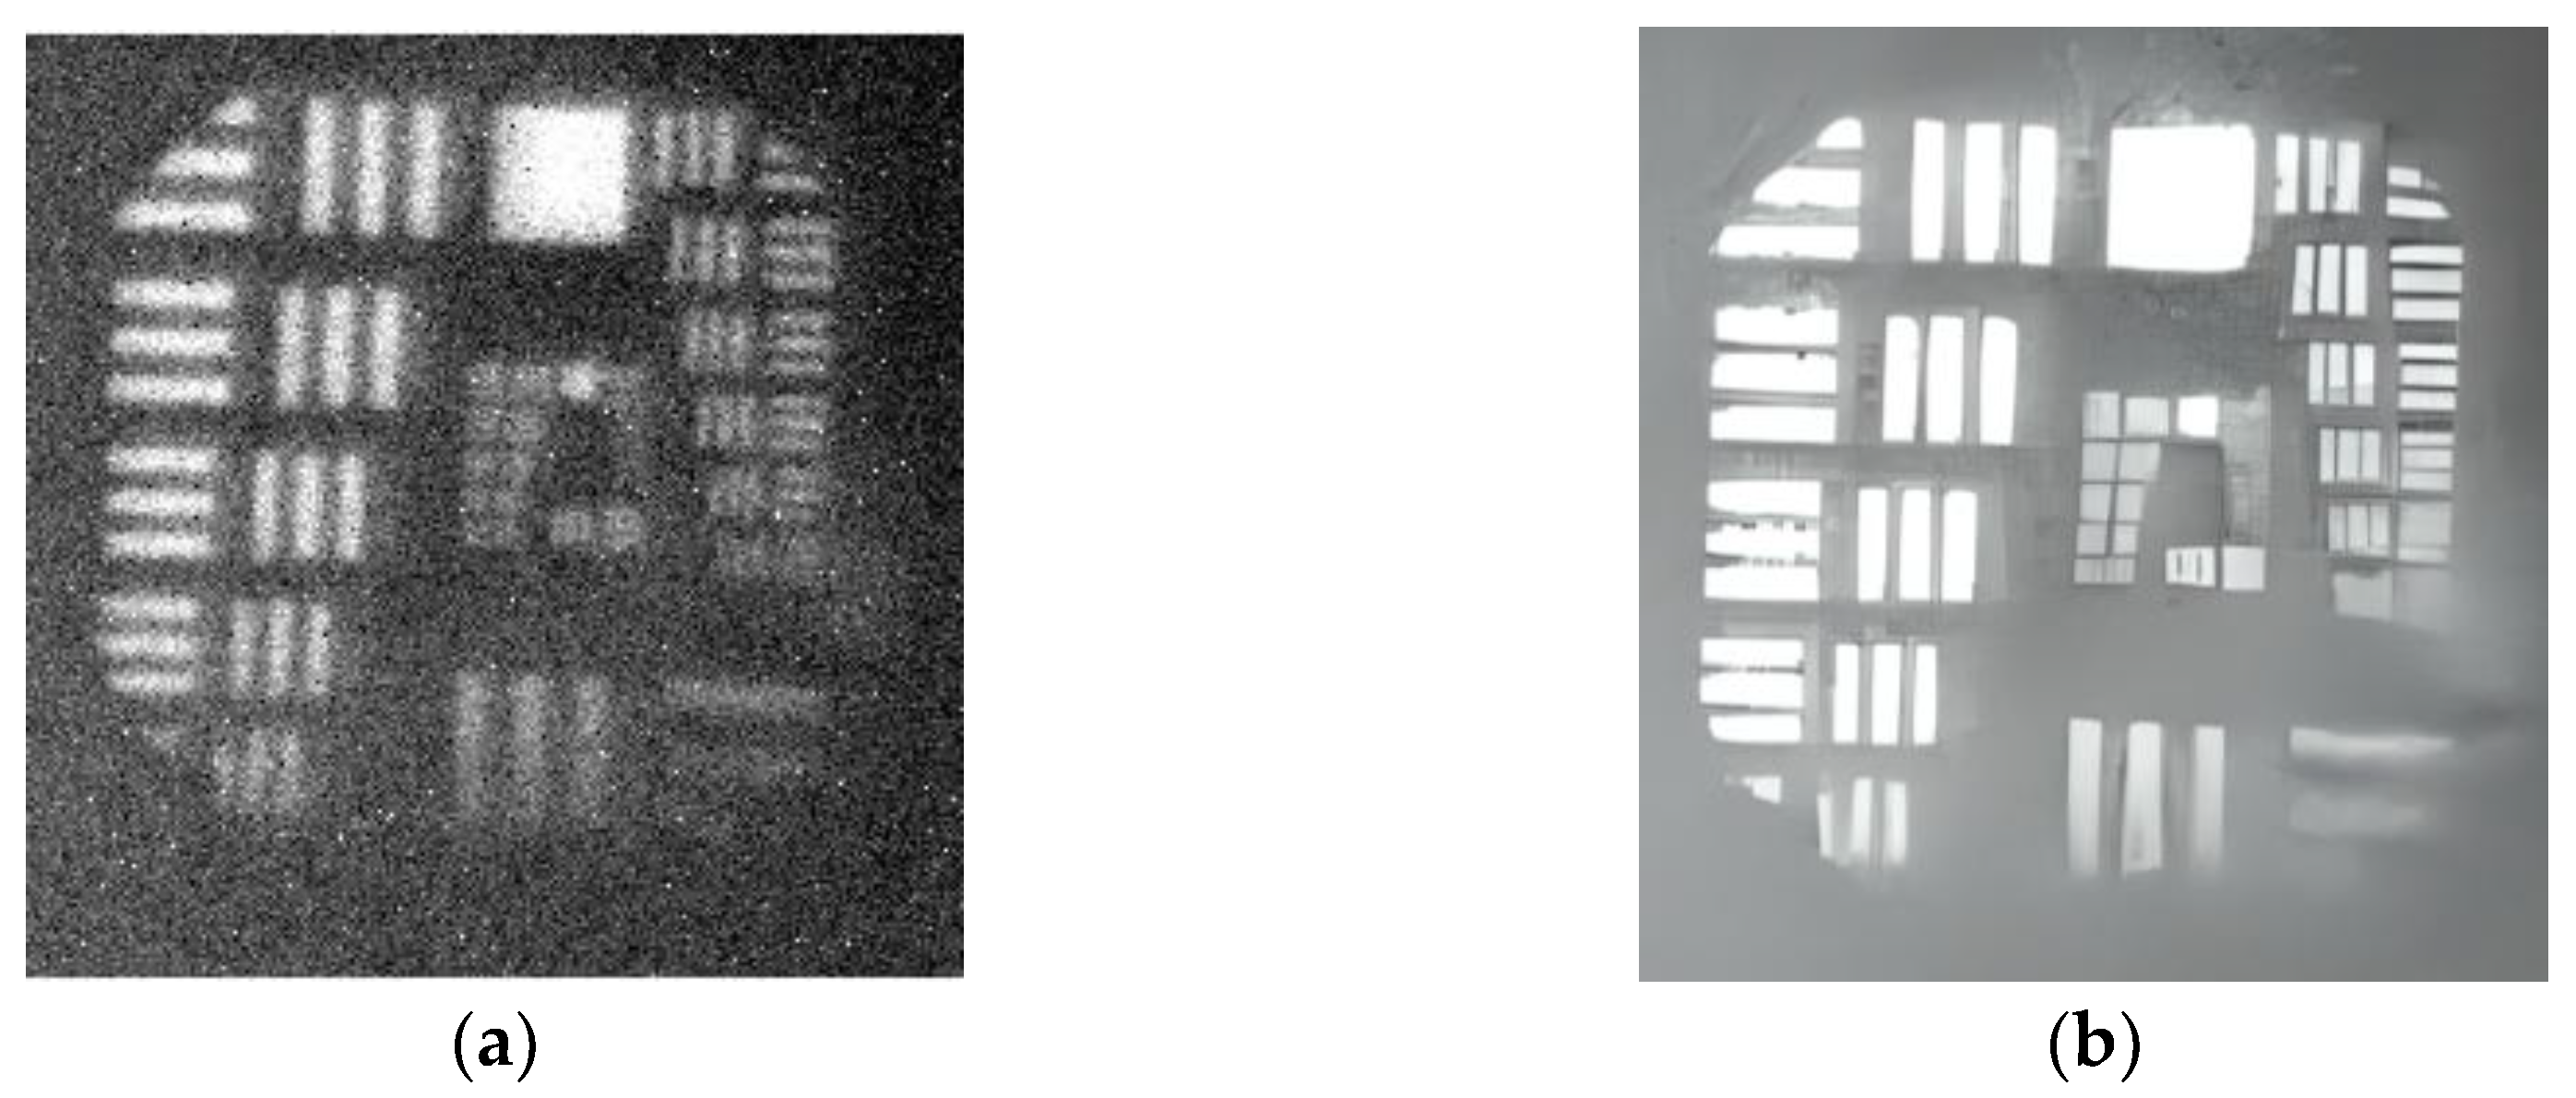
Figure 7.
Day images in 150 Kelvin(a) original image; (b) after enhancement
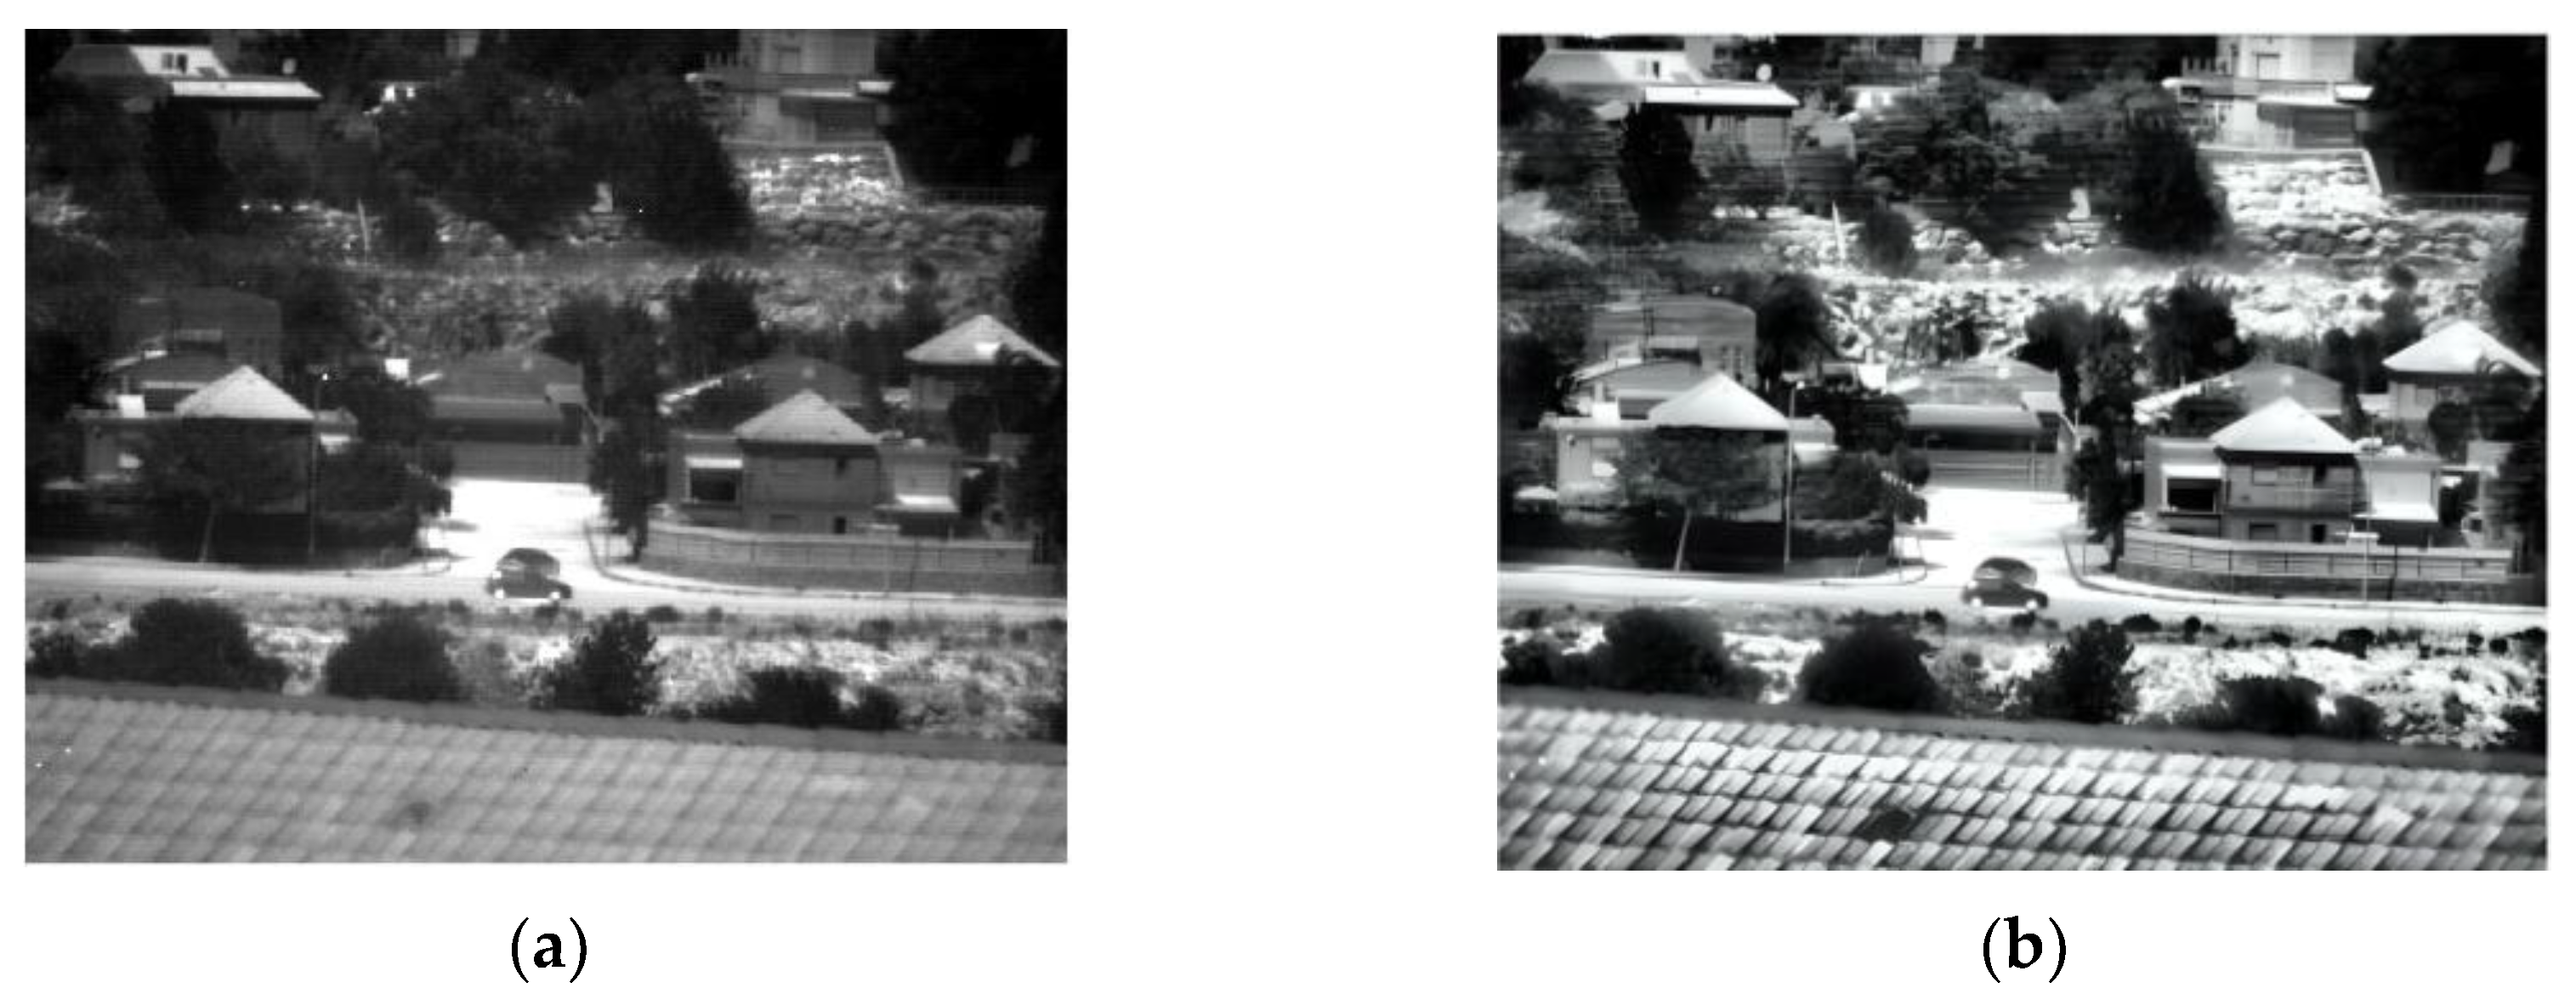
Figure 8.
Day images in 180 Kelvin(a) original image; (b) after enhancement
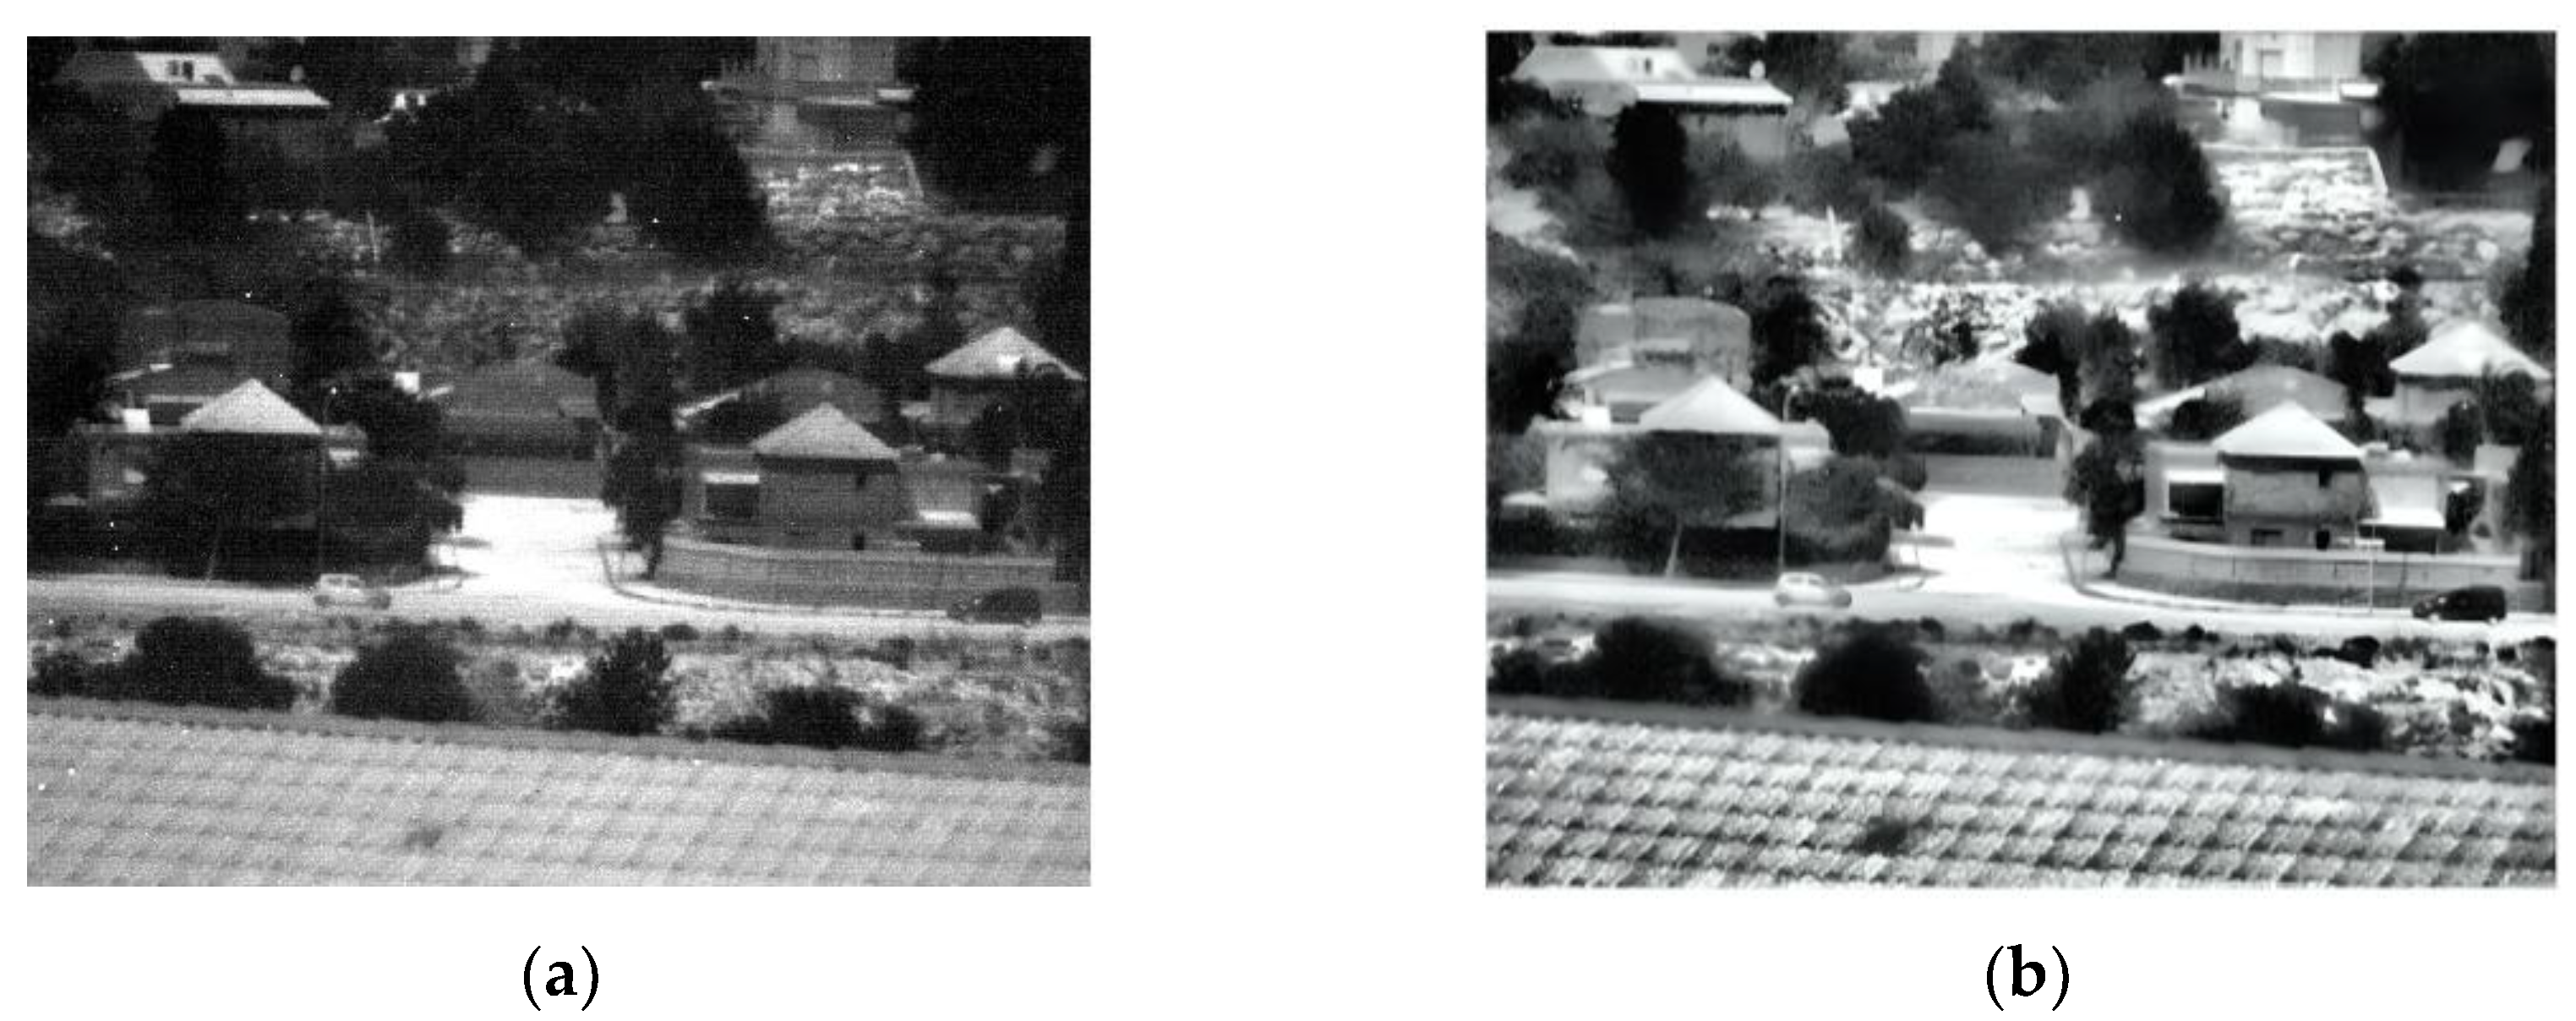
Figure 9.
Low-light images in 150 Kelvin. (a) original image; (b) after enhancement
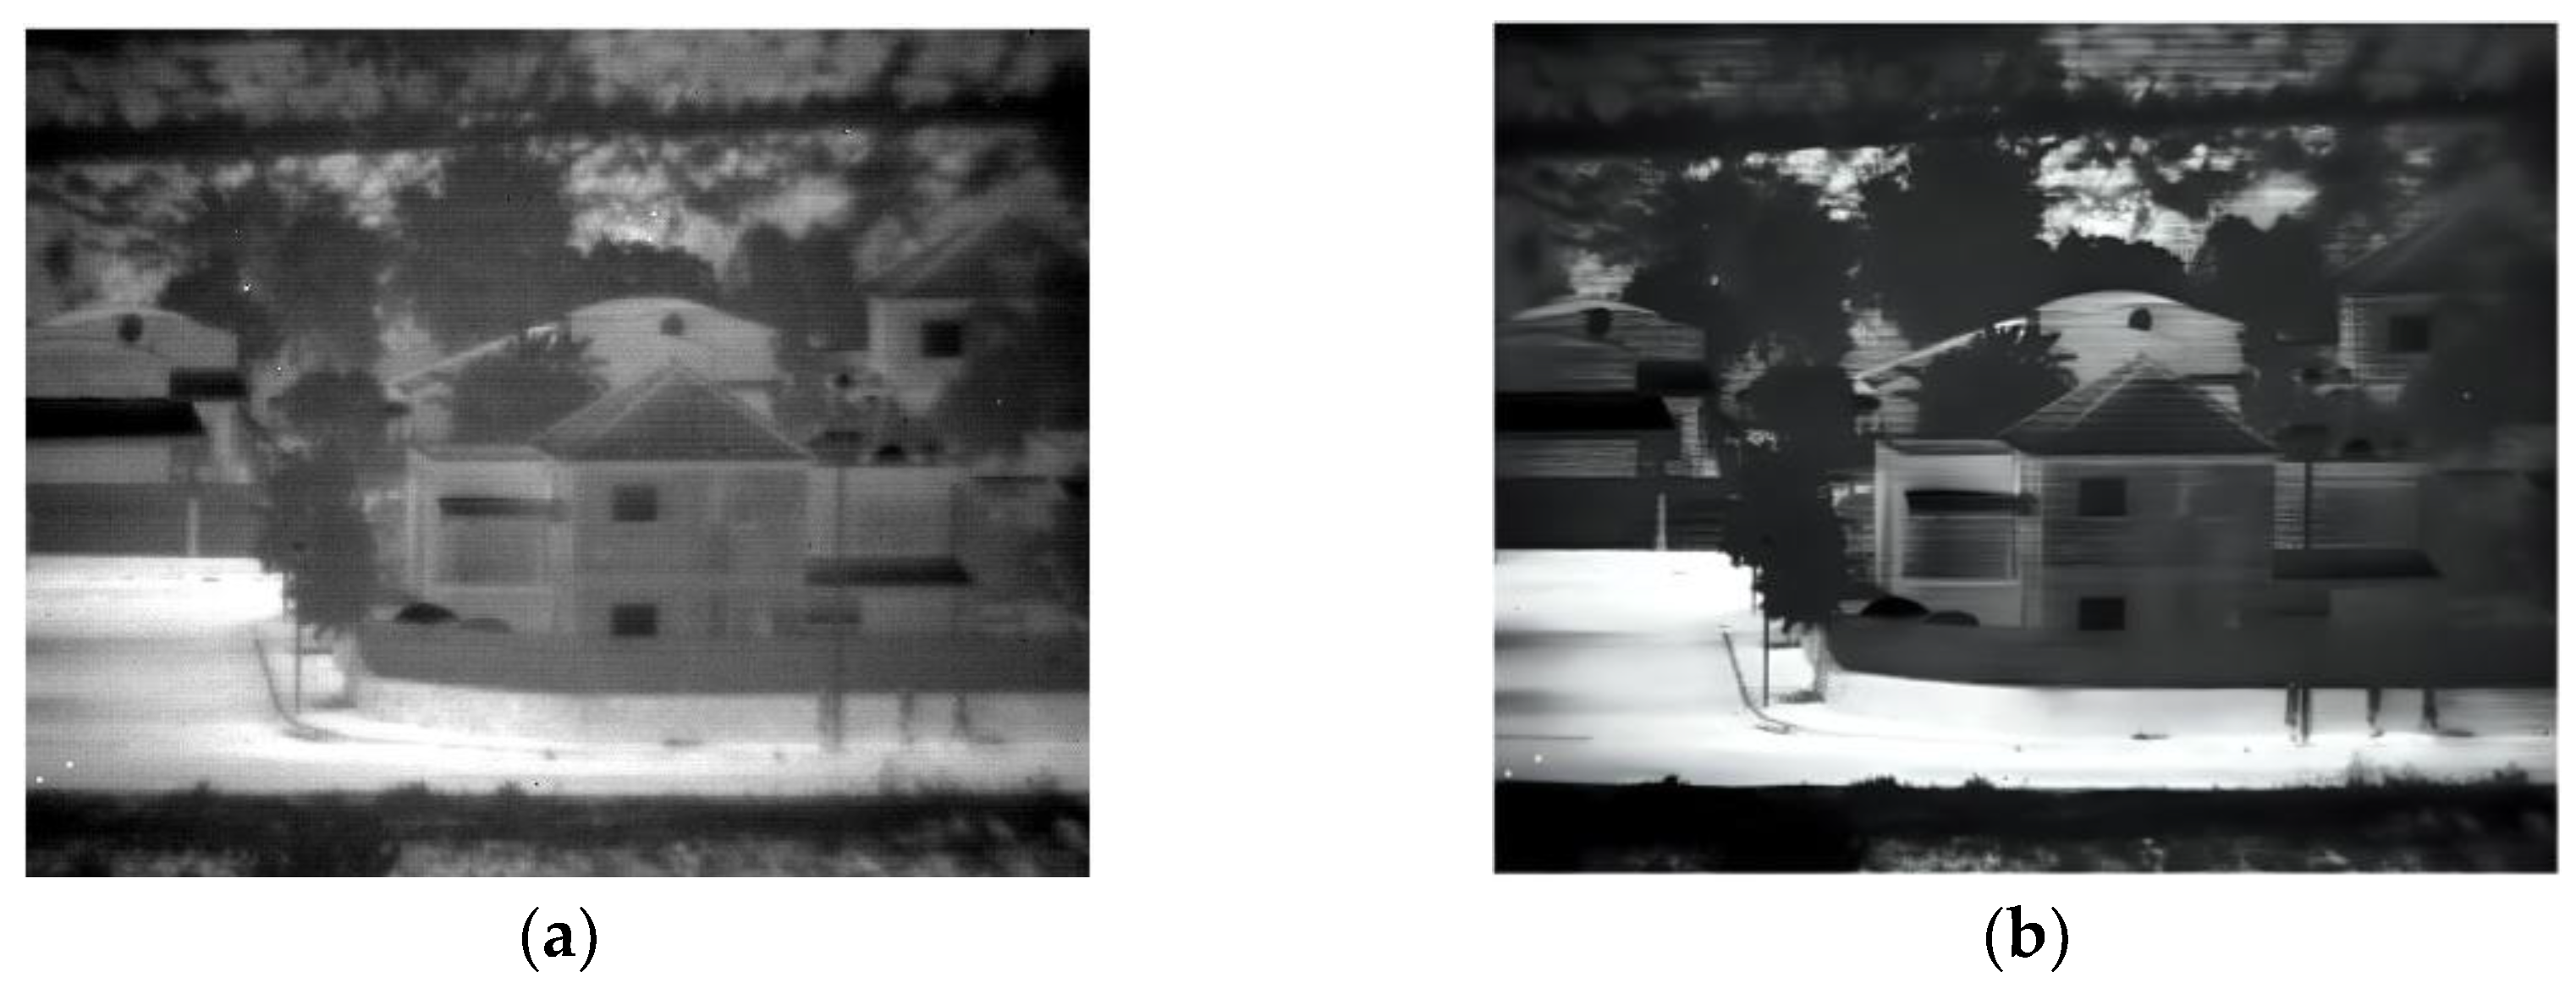
Figure 10.
Low-light images in 180 Kelvin. (a) original image; (b) after enhancement
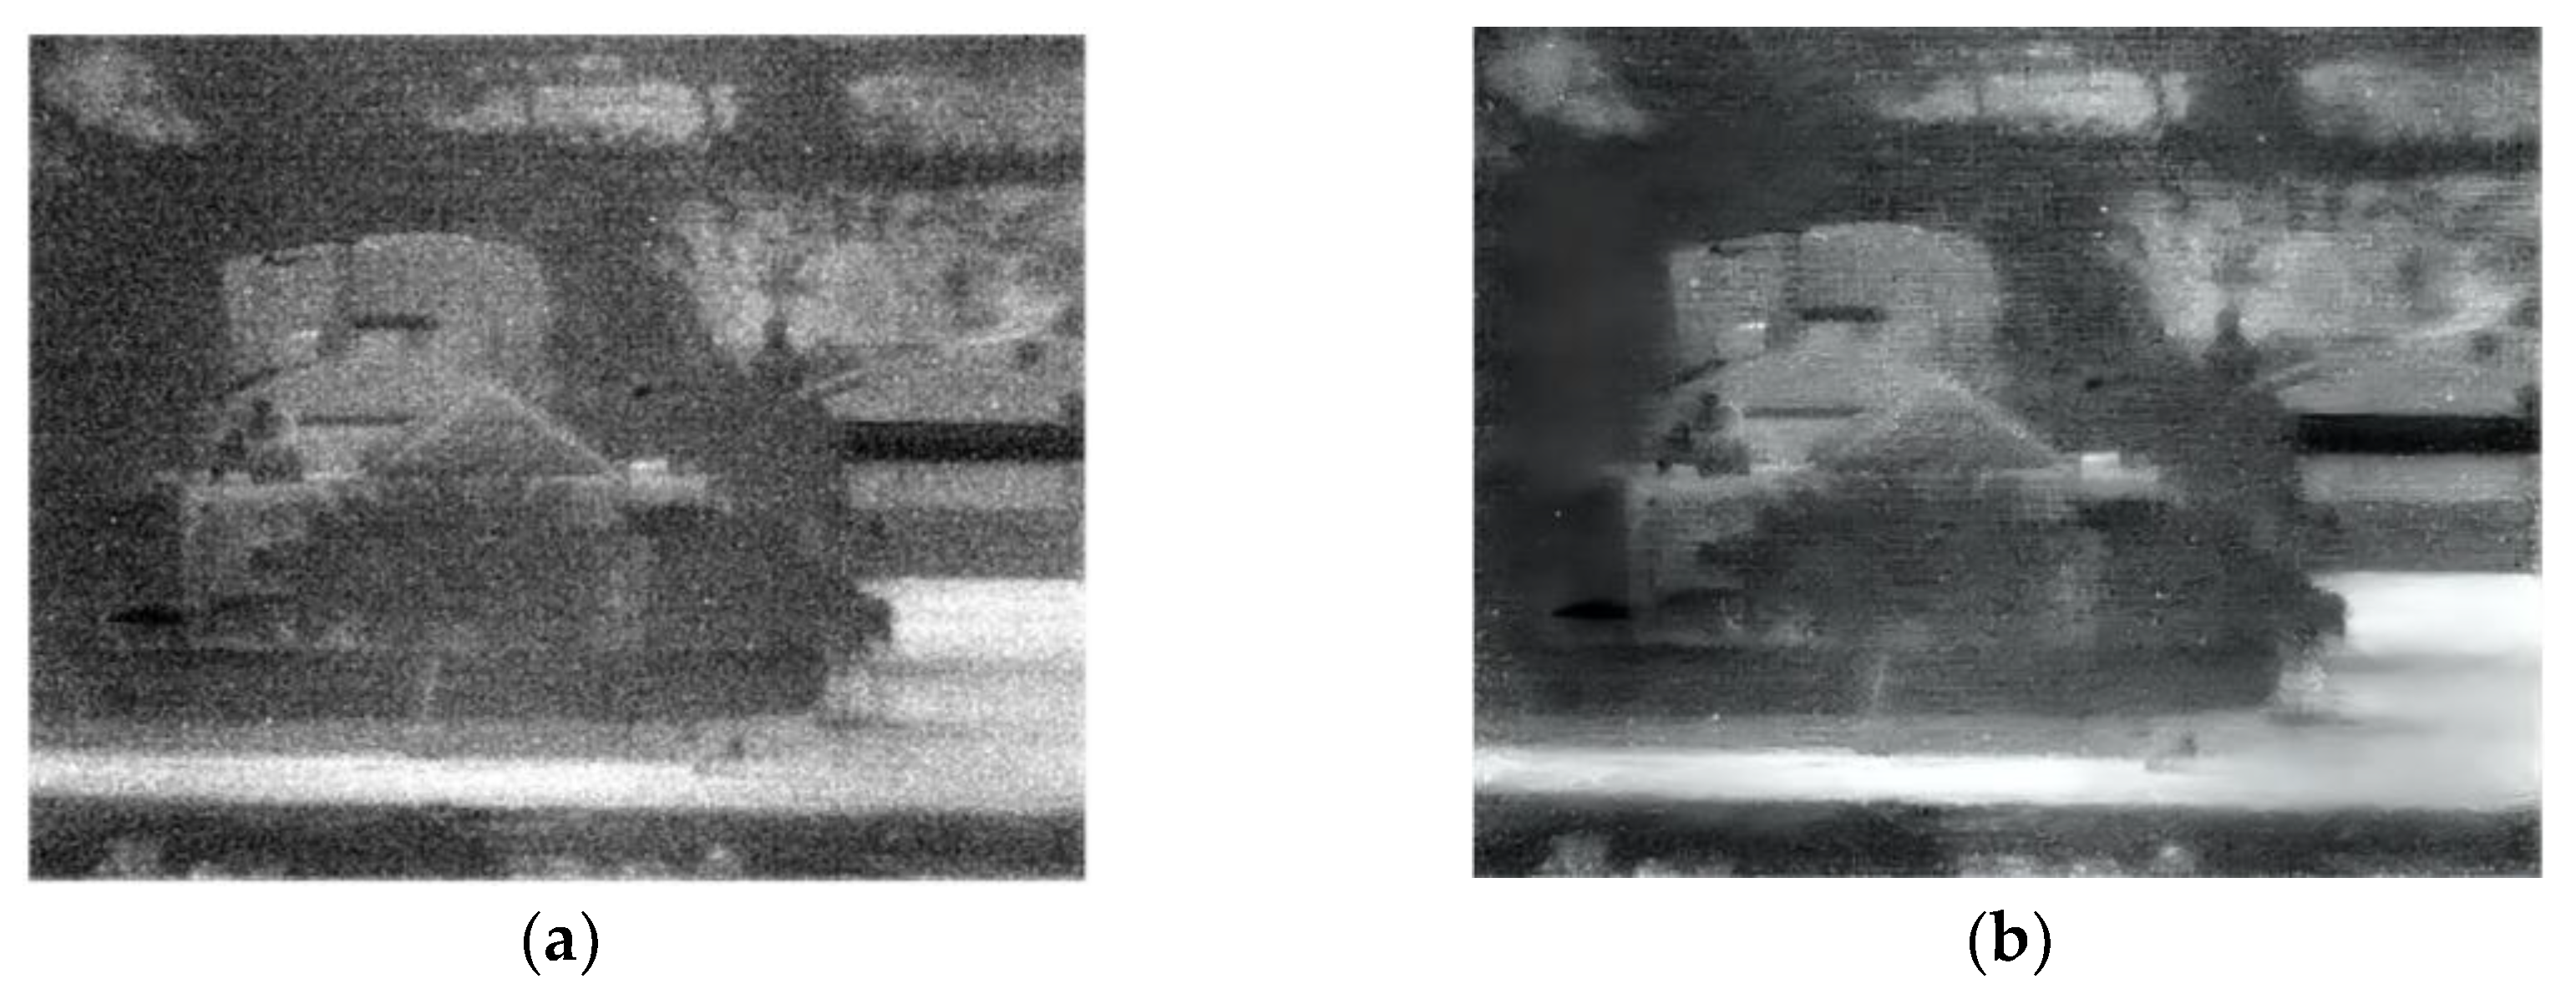

Table 1.
NIQE results to all images.
| Original image | Original 150k | Enhanced 150k | Original 180k | Enhanced 180k |
|---|---|---|---|---|
| USAF1951 | 3.637 | 3.76 | 12.421 | 5.73 |
| Day light | 4.418 | 2.178 | 5.328 | 1.928 |
| Low light(evening) | 7.56 | 3.803 | 16.794 | 3.033 |
Table 2.
MSE/PSNR/UIQI results to original/enhanced pair images comparison.
| Pair images | MSE | PSNR | UIQI |
|---|---|---|---|
| USAF1951 150original / 150enhanced | 0.013 | 18.846 | 0.826 |
| USAF1951 180original / 180enhanced | 0.004 | 23.947 | 0.954 |
| Day light 150original / 150enhanced | 0.036 | 14.041 | 0.787 |
| Day light 180original / 180enhanced | 0.045 | 13.44 | 0.751 |
| Low light (evening) 150original / 150enhanced | 0.014 | 18.42 | 0.902 |
| Low light(evening) 180original / 180enhanced | 0.019 | 17.05 | 0.775 |
Disclaimer/Publisher’s Note: The statements, opinions and data contained in all publications are solely those of the individual author(s) and contributor(s) and not of MDPI and/or the editor(s). MDPI and/or the editor(s) disclaim responsibility for any injury to people or property resulting from any ideas, methods, instructions or products referred to in the content. |
© 2025 by the authors. Licensee MDPI, Basel, Switzerland. This article is an open access article distributed under the terms and conditions of the Creative Commons Attribution (CC BY) license (http://creativecommons.org/licenses/by/4.0/).
Copyright: This open access article is published under a Creative Commons CC BY 4.0 license, which permit the free download, distribution, and reuse, provided that the author and preprint are cited in any reuse.


