
Submitted:
07 March 2025
Posted:
07 March 2025
You are already at the latest version
Abstract
Introduction - Critical care medicine is a complex activity where knowledge, experience, intuition, and sometimes even luck converge. Diagnosing diseases and selecting effective therapies represent a daily challenges for clinicians, requiring them to analyze and process vast amounts of information. Patient’s medical history, clinical signs and symptoms, laboratory results, and radiological findings are just some of the elements that must be considered during routine practice. At times, the sheer volume of data can overwhelm doctors, exposing them to the risk of becoming lost in a maze of irrelevant information. This narrative review focuses on a curated set of biomarkers renowned for their reliability in supporting clinical decision-making. By leveraging these tools, we aim to streamline decision-making processes and enhance patient outcomes in the ICU’s high-stakes environment.
Keywords:
ICU Biomarkers
; Procalcitonin
; NT-proBNP
; Prealbumin
; Interleukin-6
; Neuron-specific enolase
; Serum creatinine
; Cystatin C
; Activated clotting time
1. Introduction
Critical care medicine is a complex activity where knowledge, experience, intuition, and sometimes even luck converge. Diagnosing diseases and selecting effective therapies represent a daily challenges for clinicians, requiring them to analyze and process vast amounts of information. Patient’s medical history, clinical signs and symptoms, laboratory results, and radiological findings are just some of the elements that must be considered during routine practice. At times, the sheer volume of data can overwhelm doctors, exposing them to the risk of becoming lost in a maze of irrelevant information. This narrative review focuses on a curated set of biomarkers renowned for their reliability in supporting clinical decision-making. By leveraging these tools, we aim to streamline decision-making processes and enhance patient outcomes in the ICU’s high-stakes environment.
2. Neuron-Specific Enolase (NSE) as a Prognostic Marker of Central Nervous System Damage and Poor Neurological Outcomes Following Cardiac Arrest
NSE is an enzyme released during neuronal cell necrosis or apoptosis, serving as a biomarker to stratify illness severity and predict outcomes in various conditions, including sepsis-associated encephalopathy (SAE) [1], status epilepticus (SE) [2] and out-of-hospital cardiac arrest (OHCA) [3]. At the molecular level, Neuron-Specific Enolase (NSE) is the γ-isoform of the glycolytic enzyme enolase, encoded by the ENO2 gene. During neuronal maturation, this isoenzyme progressively replaces Non-Neuronal Enolase (NNE), encoded by the ENO1 gene, marking a critical transition that reflects neuronal differentiation and specialization [4]. The predominance of NSE in mature neurons enhances their metabolic efficiency, supporting the high energy demands required for functions such as synaptic transmission and cellular signaling [5]. NSE serves as a critical biomarker in various neurological conditions, providing insights into disease severity and aiding diagnostic accuracy. In sepsis-associated encephalopathy (SAE), elevated NSE levels have been shown to correlate with disease severity. A meta-analysis of 682 SAE patients and 946 controls revealed a significant mean difference of 7.79 ng/mL (95% CI: 5.23–10.34, I² = 99%) between groups [1]. Furthermore, a cut-off value of 14.36 μg/L on day 3 demonstrated moderate diagnostic accuracy, with a sensitivity of 61.1% and specificity of 73.9% [6]. In status epilepticus (SE), NSE’s diagnostic utility improves when used alongside complementary biomarkers. Individually, NSE exhibited limited accuracy (AUC: 0.624, sensitivity: 77.3%, specificity: 45.2%). However, its combination with S100β, a biomarker of astrocytic damage, significantly enhanced diagnostic performance, achieving an AUC of 0.748 [2]. In out-of-hospital cardiac arrest (OHCA), NSE levels measured at specific time points provide critical prognostic insights. Serum NSE levels exceeding 20 μg/L on days 3–4 post-arrest are strongly associated with poor neurological outcomes, with a sensitivity of 85% and specificity of 82%. Levels surpassing 30 μg/L on day 4 offer 100% specificity for predicting poor outcomes [3]. Specificity improves progressively over time, increasing from 70–75% on day 1 to 85–90% by days 3–4, as NSE accumulates due to sustained neuronal injury and disruption of the blood-brain barrier [7]. Serial NSE measurements further refine prognostic accuracy. For instance, the 48:24-hour NSE ratio enhances predictive precision, with a ratio ≥1.7 achieving 100% specificity for poor outcomes [8]. These findings highlight the utility of time-dependent NSE measurements and ratios for reliable outcome prediction in OHCA patients. While NSE is a valuable biomarker, its diagnostic reliability is significantly enhanced when integrated with other tools. Somatosensory Evoked Potentials (SSEPs), which evaluate cortical responses to peripheral nerve stimulation, are highly specific for predicting poor neurological outcomes. The absence of the N20 response is nearly 100% specific, though its sensitivity is limited, ranging from 30–60% [9]. Electroencephalography (EEG), particularly when performed within the first 24 hours, identifies malignant patterns such as burst suppression and isoelectric activity, with specificity levels between 90–100% [9]. Neuroimaging, including CT and MRI, complements functional assessments. CT findings, such as a reduced gray-to-white matter ratio, exhibit a specificity of 98%, while MRI, particularly diffusion-weighted imaging, can detect subtle anoxic injuries with high sensitivity [7]. Clinical exams remain indispensable in prognostication. The absence of brainstem reflexes and a motor Glasgow Coma Scale (GCS) scores ≤2 at 72 hours are strongly predictive of poor outcomes [9]. Despite its utility, NSE levels are influenced by confounding factors such as hemolysis, which can artificially elevate values by up to 50% [10]. Therefore, while NSE is a dynamic and reliable marker, its interpretation must be contextualized within a multimodal prognostic framework, integrating clinical, electrophysiological, and imaging data. Combining Neuron-Specific Enolase (NSE) with complementary biomarkers such as neurofilament light (NfL) or S100β significantly enhances diagnostic accuracy and provides a more comprehensive understanding of neuronal injury. This multimodal approach aids in critical decisions, including escalation or withdrawal of care, ensuring a patient-centered and tailored management strategy [11]. NSE’s utility as a biomarker is best realized when integrated into a broader framework that includes tools such as Somatosensory Evoked Potentials (SSEPs), Electroencephalography (EEG), neuroimaging, and clinical assessments. This robust combination yields precise prognostic insights, empowering clinicians to make informed decisions and deliver individualized care in critical neurological conditions. Ongoing research focused on optimizing NSE thresholds, exploring its dynamics over time, and refining its combination with other biomarkers is paving the way for improved neuro-prognostication strategies. These advancements further solidify NSE’s role as a cornerstone in neurocritical care, facilitating better outcomes for patients with severe neurological injuries.

| Condition | Biological Mechanism | Cut-off NSE | Sensitivity (%) | Specificity (%) | Main Findings |
|---|---|---|---|---|---|
| Out-of-Hospital Cardiac Arrest (OHCA) | Cerebral ischemia & reperfusion injury. | >20 μg/L (Days 3–4) | 85 | 82 | - NSE >30 μg/L (Day 4) → 100% specificity for poor prognosis.- 48:24-hour NSE ratio ≥1.7 → 100% specificity. [3] |
| Sepsis-Associated Encephalopathy (SAE) | Neuronal damage due to inflammation and BBB disruption. | 14.36 μg/L (Day 3) | 61.1 | 73.9 | - NSE elevated in SAE vs. controls (Δ 7.79 ng/mL, 95% CI: 5.23–10.34).- Moderate diagnostic accuracy, improves with IL-6. [6] |
| Status Epilepticus (SE) | Neuronal damage from prolonged seizures. | 17.8 μg/L | 77.3 | 45.2 | - NSE alone: limited accuracy (AUC = 0.624).- With S100β → AUC = 0.748, better specificity. [2] |
| Delirium in ICU | Acute brain dysfunction, unclear NSE role. | Not defined | NA | NA | - NSE not a direct mortality predictor.- May indicate disease severity / ventilation need. [12] |
| Ischemic/Traumatic Brain Injury | Neuronal apoptosis and necrosis. | >25 μg/L | 76 | 80 | - NSE correlates with injury severity.- Specificity affected by sepsis, shock. [1] |
3. Procalcitonin (PCT): A Biomarker for Detecting Infections and Guiding Antibiotic Therapy
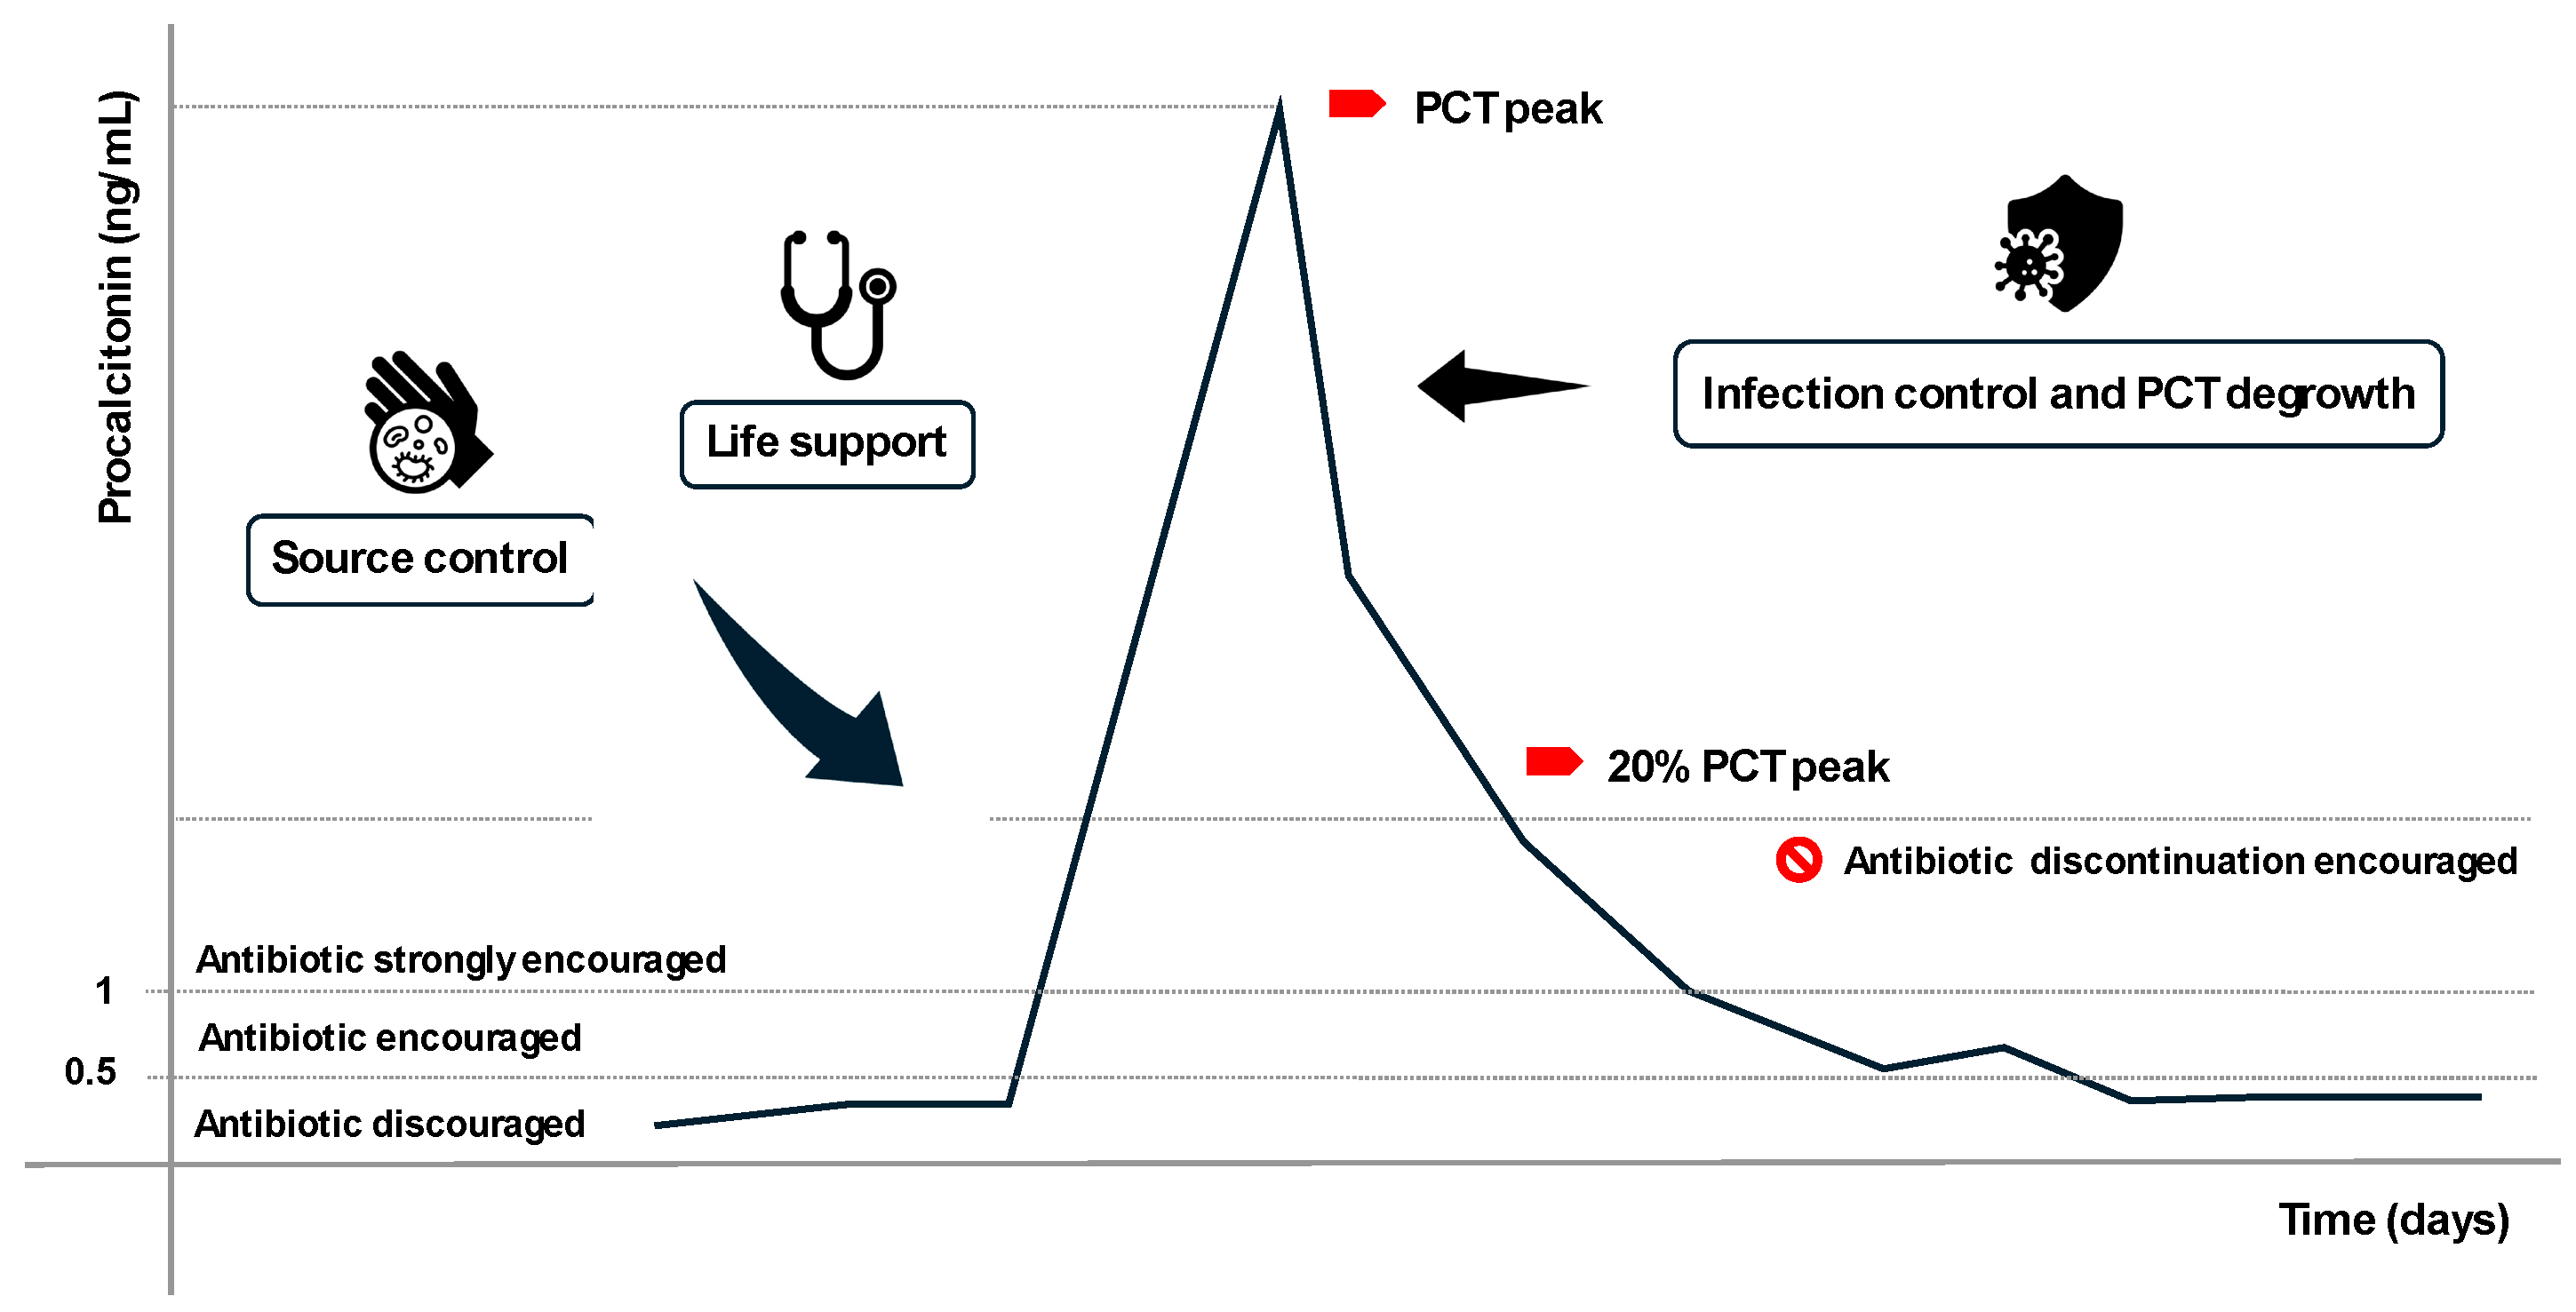
PCT is a peptide prohormone composed of 116 amino acids and serves as the precursor of calcitonin, a key regulator of calcium homeostasis [13]. Under normal conditions, PCT is produced in the C-cells of the thyroid gland, where it is subsequently cleaved into active calcitonin in response to elevated calcium levels. Calcitonin lowers plasma calcium levels by counteracting parathyroid hormone (PTH) activity, reducing calcium resorption from bone, and promoting renal calcium excretion [14]. In healthy, uninfected individuals, plasma PCT levels remain below 0.5 ng/mL, while calcitonin levels are approximately 10 pg/mL [15]. During bacterial infections, however, non-endocrine tissues such as adipocytes release large quantities of PCT into the bloodstream in response to immuno-inflammatory stimuli, including lipopolysaccharides (LPS), bacterial toxins, Interleukin-6 (IL-6), and Tumor Necrosis Factor α (TNF- α). Plasma PCT levels can rise dramatically, ranging from 1 to 2000 ng/mL, depending on the severity and spread of the infection [16]. Notably, during these infections, plasma calcium levels remain unaffected because the procalcitonin produced by non-endocrine tissues is not converted into active calcitonin. While the exact function of PCT as acute-phase protein is not yet fully understood, its levels are strongly correlated with bacterial infections, making it a valuable biomarker for differentiating sepsis from other inflammatory conditions.
The 2010 PRORATA trial significantly influenced the clinical use of PCT. This multicenter, prospective, parallel, open-label trial randomized patients into two groups: a control group where antibiotic therapy initiation and discontinuation followed existing guidelines, and an intervention group where these decisions were guided by PCT levels. In the intervention group, PCT levels above 1 ng/mL recommended antibiotic initiation, while levels below 0.5 ng/mL or reductions to less than 20% of the PCT peak supported discontinuation. Although 28-day and 60-day mortality rates were similar in both groups, the PCT-guided group experienced significantly shorter antibiotic exposure. The authors concluded that PCT-guided therapy safely reduces antibiotic exposure and selective pressure without compromising patient survival [17]. PCT demonstrates high sensitivity and specificity, with false positives and false negatives being relatively rare. False positives can occur following major surgery, trauma, burns, or cardiac arrest, while false negatives are more likely in compartmentalized or early-stage infections. Despite its utility, several aspects of PCT kinetics remain unclear [18]. For instance, acute kidney injury may influence PCT elimination, though current data are limited [19]. Thus, while PCT is a valuable diagnostic and therapeutic tool, it should not be used in isolation. Clinical decisions regarding infection diagnosis and antibiotic strategies should integrate PCT levels within a broader clinical context to ensure accuracy and optimal patient care.
Figure 1.
.
4. N-Terminal Pro-Brain Natriuretic Peptide (NT-proBNP): A Reliable Biomarker for Cardiac Failure Diagnosis and Management
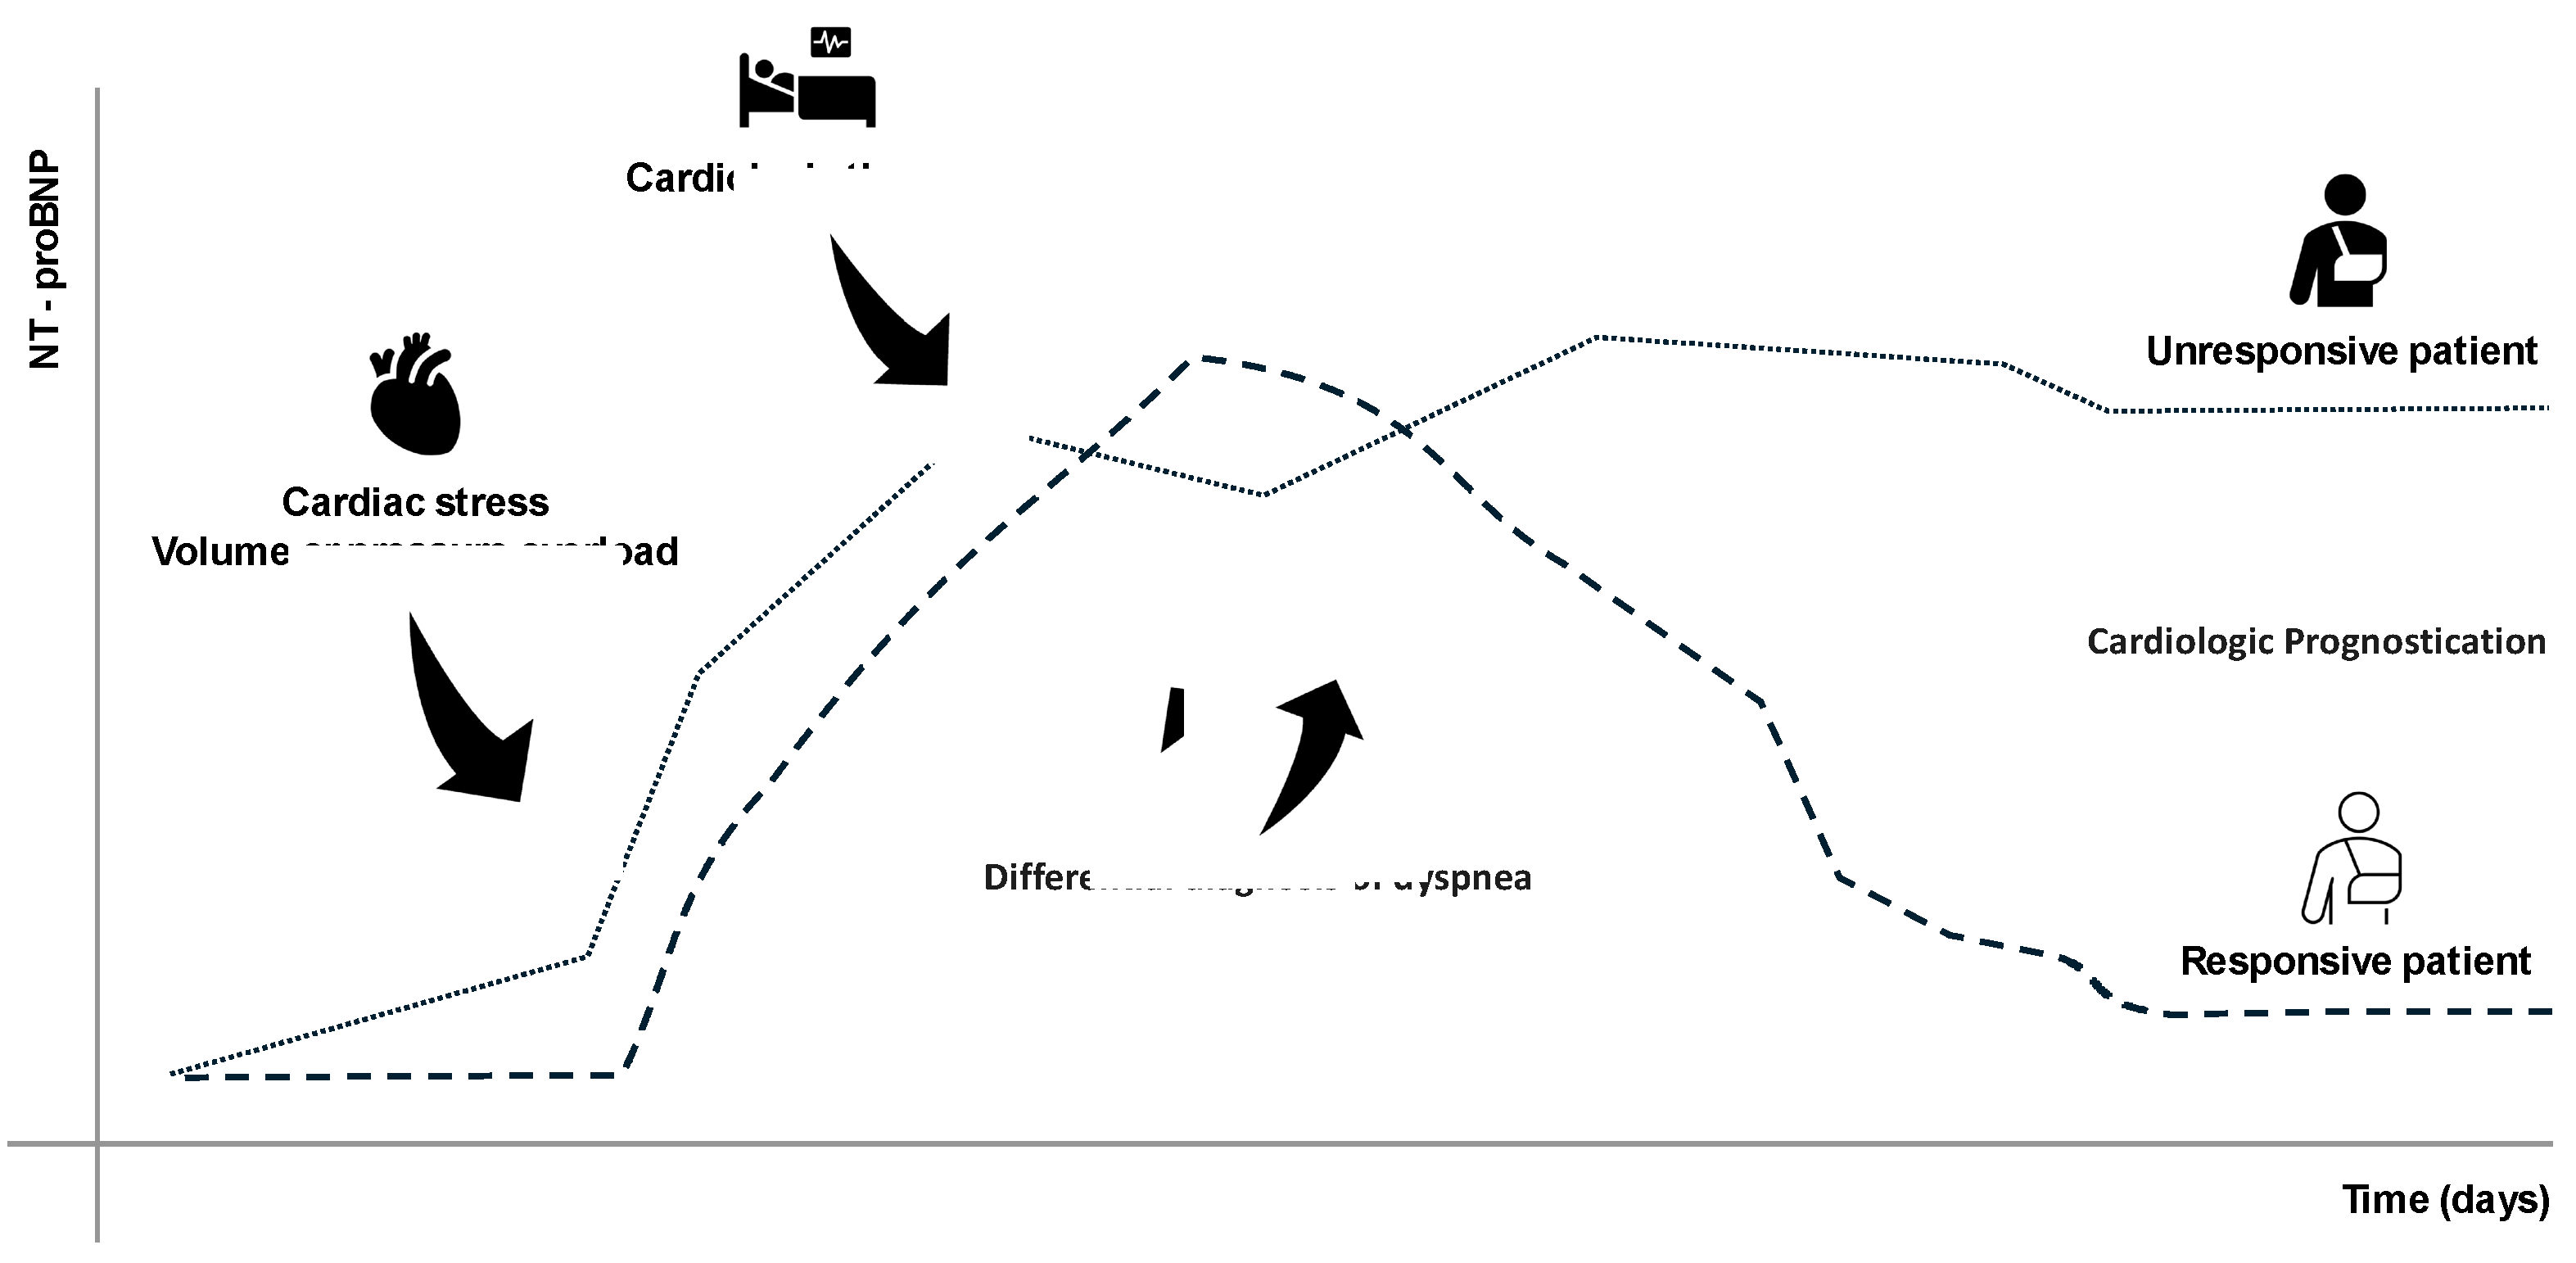
NT-proBNP is a 76-amino-acid peptide derived from the cleavage of the proBNP precursor, which is primarily secreted by cardiomyocytes in response to increased wall stress or hemodynamic overload. Upon secretion, proBNP splits into two fragments: BNP (biologically active) and NT-proBNP (biologically inactive) which is then predominantly cleared by kidneys [20]. Although NT-proBNP itself has no direct biological function, its release closely reflects the pathophysiological processes of the heart [21]. ProBNP is synthesized in response to ventricular wall stretching, often due to volume or pressure overload and contributes to hemodynamic regulation by inducing vasodilation, lowering blood pressure, and promoting natriuresis and diuresis [20]. NT-proBNP is inactive, but being gifted of greater stability and longer half-life compared to BNP, can serve as a reliable, indirect indicator of cardiac stress (BNP release), characteristics which make it a sensitive and specific biomarker widely recognized for both acute and chronic heart failure [21]. Nevertheless, its high sensitivity and specificity, some clinical conditions can elevate NT-proBNP independently from heart failure. Plasma levels of NT-proBNP can be influenced by several factors such as age, sex, body mass index, chronic renal insufficiency, atrial fibrillation, and certain chronic pulmonary diseases [22]. False positives can also occur in cases of sepsis and pulmonary hypertension while false negatives are common in obese individuals, probably due to increased peptide distribution volume. Interpreting NT-proBNP levels requires then careful consideration of the clinical context and patient-specific factors to avoid diagnostic errors [23]. Elevated NT-proBNP levels are instrumental in confirming heart failure in patients presenting with symptoms such as dyspnea, fatigue, or peripheral edema. The biomarker is particularly helpful in distinguishing cardiac-origin dyspnea from pulmonary-origin dyspnea in emergency settings [24]. Beyond diagnosis, NT-proBNP is a valuable tool for monitoring heart failure progression and assessing treatment response. Reductions in NT-proBNP levels often correlate with clinical improvement, while increases may signal disease worsening or inadequate therapy [25]. Prognostically, elevated NT-proBNP levels are linked to a higher risk of adverse cardiovascular events, including hospitalization and mortality [21]. As such, NT-proBNP also plays a role in risk stratification for patients with cardiovascular diseases. In addition to its central role in heart failure management, NT-proBNP has applications in other clinical contexts, such as perioperative risk assessment and the diagnosis of pulmonary hypertension [26]. However, its use should always be integrated with other clinical and diagnostic data to provide a comprehensive evaluation of the patient’s condition.
Figure 2.
.
5. Interleukin-6 (IL-6): A Key Biomarker of Systemic and Pulmonary Inflammation
IL-6 is a cytokine and an essential biomarker extensively present in numerous acute and chronic inflammatory conditions. It is secreted by a wide range of cells, including T-cells, macrophages, endothelial cells, and fibroblasts, in response to infections, tissue injury, and other pro-inflammatory stimuli [27]. IL-6 plays a dual role, acting as both a pro-inflammatory and anti-inflammatory mediator depending on the physiological context. From a molecular perspective, IL-6 is a glycoprotein consisting of 184 amino acids with a molecular weight of approximately 26 kDa. It signals through the IL-6 receptor complex, which comprises a specific IL-6 binding receptor and the gp130 signal-transducing subunit [28]. Upon receptor binding, IL-6 activates downstream pathways such as JAK/STAT and MAPK, driving cellular responses related to inflammation and immune regulation [29]. IL-6 is critical in the immune response, contributing to the acute-phase reaction by promoting the production of acute-phase proteins such as C-reactive protein (CRP) and fibrinogen in the liver [30]. It is also a key mediator of fever and neutrophil mobilization during infections. In critically ill patients, IL-6 levels correlate with the severity of systemic inflammation and tissue damage, making it a valuable biomarker for prognosis and disease monitoring [29]. Recent studies, including those by Kobayashi et al. highlight the role of IL-6 in Acute Respiratory Distress Syndrome (ARDS) following sepsis [27]. Alveolar macrophages have been shown to significantly express IL-6, reinforcing its role in lung injury-associated inflammation. Matthay et al. further identified IL-6 as a biomarker distinguishing severe sepsis patients with ARDS, emphasizing its diagnostic and prognostic relevance in critical care [31]. IL-6 is a highly sensitive biomarker for systemic inflammation, particularly in sepsis and ARDS, often rising before clinical deterioration [32]. However, its specificity is limited, as IL-6 levels can increase in various conditions such as trauma, burns, surgery, or autoimmune diseases [30]. False positives can complicate diagnosis in these scenarios, while delayed or low IL-6 production may occur in immunocompromised patients, potentially masking the severity of inflammation [33]. In intensive care, IL-6 is used to monitor critically ill patients, particularly for early sepsis detection. Elevated IL-6 levels often precede other clinical signs and are associated with the severity of sepsis and mortality risk [33]. In ARDS, IL-6 levels correlate with lung inflammation and tissue damage, reflecting disease progression. During the COVID-19 pandemic, IL-6 gained prominence as a marker of cytokine storm, aiding in identifying patients at risk of rapid deterioration and guiding immunomodulatory therapies like tocilizumab [34]. IL-6 also serves as an indicator of therapeutic response. Reductions in IL-6 levels may suggest effective treatment with anti-inflammatory agents such as corticosteroids or IL-6 receptor antagonists. Additionally, IL-6 has potential applications in stratifying patients for targeted interventions [35]. Despite its clinical utility, interpreting IL-6 levels requires consideration of the broader clinical context due to its non-specificity. Combining IL-6 measurements with other biomarkers like PCT and CRP enhances diagnostic accuracy, particularly for conditions such as ARDS and sepsis [36]. IL-6 is a versatile biomarker with applications in diagnosing and managing inflammatory and critical conditions. Its ability to provide early indications of systemic inflammation and its correlation with the disease severity makes it invaluable in intensive care settings. However, its interpretation should always be integrated with clinical assessments and additional biomarkers to maximize its diagnostic and prognostic potential.
6. Serum Creatinine (SCr) and Cystatin C (CysC): Essential Biomarkers for Renal Function Evaluation
SCr and Cystatin C CysC are essential biomarkers in renal diagnostics, each offering distinct advantages in sensitivity and specificity. SCr, a byproduct of muscle metabolism, is widely used because of its affordability and accessibility. However, its levels are influenced by extrarenal factors such as muscle mass, diet, and age, which can limit its reliability—especially in vulnerable populations like ICU patients [37,38]. On the other hand, CysC, a low-molecular-weight protein produced consistently by all nucleated cells, is emerging as a robust alternative. Its serum concentration, determined primarily by glomerular filtration, makes it a precise marker for estimating the glomerular filtration rate (GFR) and detecting early kidney dysfunction [39,40]. SCr is produced through creatine phosphate metabolism in skeletal muscles, with its levels varying significantly based on factors such as diet and body composition. These variations can compromise its reliability in evaluating kidney function, particularly in critically ill patients [38]. In contrast, CysC is consistently produced and freely filtered by the kidneys, undergoing complete catabolism in the proximal tubules [41,42]. This characteristic makes it a more stable biomarker that is less affected by external variables. While SCr reflects renal function through its elimination via glomerular filtration, it rises slowly in cases of kidney dysfunction. This delay limits its usefulness in detecting early acute kidney injury (AKI), particularly in conditions such as sarcopenia where muscle mass is reduced [43]. In contrast, CysC, being independent of muscle mass, offers a more accurate and timely assessment of GFR changes, responding faster to AKI or therapeutic interventions [44]. SCr also has low sensitivity for detecting early AKI, often requiring significant GFR reductions (greater than 50%) before its levels noticeably rise. This delayed response restricts its utility for rapid diagnosis [45]. On the other hand, CysC demonstrates superior sensitivity and specificity, with an area under the curve (AUC) of 0.89 for AKI detection. Additionally, it offers greater prognostic value for chronic kidney disease (CKD) progression compared to SCr [46,47]. Despite its limitations, SCr remains the standard biomarker for routine monitoring in stable CKD patients due to its low cost and widespread availability. However, its accuracy is compromised in critically ill patients or those with complicating factors such as malnutrition or fluid overload [48]. Conversely, CysC is particularly effective in acute settings like the ICU, excelling in early AKI detection and renal recovery monitoring. Furthermore, it is a superior predictor of CKD progression and cardiovascular events. The combination of SCr and CysC enhances diagnostic precision, enabling better risk stratification and more personalized treatment plans [49,50]. While SCr remains a cost-effective and accessible tool for routine renal function assessment, its reliability diminishes in complex clinical scenarios due to delayed responses and extrarenal influences. CysC, with its higher sensitivity, specificity, and independence from confounding factors, is invaluable for acute settings such as AKI diagnosis and CKD progression monitoring. By integrating both biomarkers, clinicians can adopt a comprehensive diagnostic approach that improves accuracy and supports tailored clinical interventions in both acute and chronic scenarios.
| Characteristic | Serum Creatinine (SCr) | Cystatin C (CysC) |
|---|---|---|
| Production | Derived from muscle metabolism | Produced constantly by all nucleated cells |
| Elimination | Filtered by glomeruli; partially secreted by tubules | Filtered and fully metabolized in proximal tubules |
| Influencing Factors | Muscle mass, diet, age, hydration | Minimal; thyroid and inflammation influence |
| Cost | Low (<€5) | High (~10× SCr) |
| Half-Life | ~4 hours | ~1.5–2 hours; faster response to GFR changes |
| Sensitivity for AKI | Low; delayed detection | High; AUROC 0.89 for AKI |
| Specificity for CKD | Moderate | High; better predictor of CKD progression |
| Response to Therapy | Slow; lag in reflecting renal recovery | Fast; better indicator of therapy response |
| Utility in Pediatric Patients | Limited due to growth-related variability | Effective; reliable even in pediatric populations |
| Utility in Post-Transplant Monitoring | Limited; less accurate for dynamic GFR changes | Superior marker for post-transplant renal function monitoring |
| Utility in Critical Care | Limited in ICU; confounded by muscle wasting | High; preferred in ICU settings for early AKI detection |
| Correlation with Inflammation or Other Conditions | Minimal inflammation impact | May be influenced by systemic inflammation |
| Primary Applications | CKD monitoring, basic renal evaluation | Early AKI detection, ICU, cardiovascular risk prediction |
7. Activated clotting time (ACT): A Rapid and Reliable Marker for Monitoring Anticoagulation Therapy
ACT is a point-of-care test used to assess whole blood coagulation. It measures the time required for clot formation after activation of the intrinsic pathway, typically induced by celite, kaolin, or similar compounds. The ACT result is expressed in seconds, representing the time taken for the clot to form [51]. Detection methods vary and include monitoring changes in oscillation, resistance to plunger movement (as in Medtronic systems), light absorption, or thrombin exhaustion. The ACT is commonly used to assess the anticoagulant effects of heparin at the bedside, offering a significantly faster turnaround time compared to standard laboratory tests. Unlike activate partial thromboplastin time (aPTT), which becomes unreliable at high heparin concentrations, the ACT exhibits a more linear dose-response curve at the levels required for procedures such as cardiopulmonary bypass, hemodialysis, cardiac catheterization, and vascular surgery [52] [53]. However, it is less reliable at lower heparin concentrations [54]. It is important to note that different ACT measurement devices are not interchangeable. Internal validation may be necessary to establish consistency between various machines and cartridges. This validation often requires comparison with a gold-standard reference method, such as the anti-Xa heparin concentration assay, to ensure accuracy and reliability [55]. ACT testing is susceptible to alterations caused by various factors, including temperature fluctuations, hemodilution, the presence of lupus anticoagulant, and platelet function abnormalities [56]. As a result, while the test may initially perform reliably after a heparin bolus—typically achieving target values of 400-500 seconds—the reliability of ACT can diminish during and towards the end of cardiopulmonary bypass, especially in prolonged procedures. This decline in correlation is particularly notable when comparing ACT values with anti-Xa levels (ranging from 0.3 to 3.4 U/mL) [57]. The weakened correlation can potentially lead to subtherapeutic heparin dosing, underscoring the need for caution and supplementary monitoring in such scenarios. Different ACT devices have been evaluated during hemodialysis, demonstrating good performance for heparin concentrations between 0.2 and 3.3 U/mL, with ACT targets typically ranging from 150 to 200 seconds depending on the manufacturer’s reference. The coefficient of variation for this application was found to be between 3–5% when compared to anti-Xa levels [58]. However, less reproducible results were observed with systems utilizing glass surfaces for clot activation. This limitation arises from the relatively low heparin concentrations in hemodialysis, which fall near the lower detection range of ACT testing. For other applications involving low heparin dosages, such as the treatment of deep vein thrombosis, ACT testing was evaluated against anti-factor Xa levels (targeting 0.3–0.7 U/mL). In these scenarios, laboratory aPTT showed better reliability and correlation with heparin concentrations, with correlation coefficients of r = 0.72 for ACT and r = 0.74–0.86 for aPTT. Notably, decisions based on ACT agreed with aPTT results only 60% of the time, highlighting the limitations of ACT in these settings [59]. Originally described in 1966, ACT remains a practical and user-friendly option for rapid, repeatable bedside assessment of heparinization. However, interpreting ACT results requires caution, particularly in contexts such as prolonged extracorporeal circulation, residual heparinization, or low heparin dosages. When feasible, laboratory assays should be considered as a complementary or confirmatory method. A deep understanding of the specific ACT system in use is crucial, including awareness of the need for internal validation of cutoff values. For example, ACT targets of 400–450 seconds for cardiopulmonary bypass and 150–200 seconds for continuous renal replacement therapy should be confirmed and optimized based on the device and clinical context.
8. Prealbumin: A Marker for Differentiating Catabolic and Anabolic Phases in Critically Ill Patients
Prealbumin, also known as transthyretin (TTR), derives its original name from its electrophoretic properties, as it migrates just ahead of the albumin band during electrophoresis. However, despite the similarity in naming, prealbumin is not involved in albumin synthesis [60]. It is a 55 kDa homotetrameric protein primarily synthesized in the liver. Its main function includes serving as a transporter for thyroid hormones, thyroxine (T4) and triiodothyronine (T3), as well as holo-retinol-binding protein (holo-RBP) [61]. TTR has a relatively short half-life of approximately 2.5 days, making it a dynamic marker for changes in protein metabolism. In clinical practice, TTR has been recognized for over 50 years as a marker of nutritional status, but this view has evolved over time. Recent publications have highlighted that its role as a simple indicator of nutritional status could be an oversimplification [62]. Understanding its behavior during the acute phase of illness reveals that it is not merely a passive reactant but an active component of the acute response. TTR production is suppressed by the transcriptional influence of IL-6, and this suppression triggers the release of its bound hormones, event that leads to a transient hyperthyroid state. This hormonal surge acts as an acute metabolic booster, amplifying the primary cytokine wave and supporting energy demands by promoting lipid oxidation and glycolysis in tissues [63]. Monitoring TTR levels can help clinicians identify high-risk patients who are undergoing severe acute catabolic phases or those with chronic protein-energy malnutrition. By tracking these fluctuations, clinicians can better assess the appropriate timing for nutritional interventions, avoiding the pitfalls of overfeeding, which can worsen patient outcomes [64]. More than just a guide for adjusting caloric or protein intake, TTR levels can help pinpoint the resolution phase, when the patient becomes more nutrient-receptive and enters an anabolic state, signaling a critical window for effective nutritional support [65]. TTR has proven useful in predicting outcomes for patients requiring hemodialysis, particularly at the onset of uremia. Levels below 10 mg/dL compared to those between 10-17 mg/dL were associated with a longer hospital stay, with an average of 22 days versus 6 days, respectively [66]. TTR has also been shown to be effective in assessing prognosis in acute heart failure (AHF) patients. A study conducted in a cardiac ICU found that levels below 14 mg/dL at admission and below 15 mg/dL at discharge were strongly correlated with all-cause mortality and composite endpoints of all-cause death or readmission [67]. Similarly, an observational study revealed that AHF patients who died in the hospital had a mean TTR level of 13 mg/dL at admission, compared to 18 mg/dL in those discharged alive (p<0.001), demonstrating a significant predictive value with these cutoffs [68]. Furthermore, in patients with acute coronary disease, a high CRP/TTR ratio was associated with an increased risk of major cardiac complications, with an odds ratio of 1.3 (95% CI: 1.0–1.6). TTR levels of 19.84 ± 3.64 were linked to a higher risk compared to 15.73 ± 4.39 (p<0.001), indicating the importance of monitoring these values in this patient group as well [69]. In the general ICU population, TTR remains a valuable prognostic marker. A 2008 study, conducted by Devakonda et al, found that the mean TTR value on day 1 was strongly associated with survival outcomes, with levels of 14.3 mg/dL in survivors compared to 8.9 mg/dL in those who died (p < 0.0001) [65], while the study conducted by Haltmeier et al on trauma ICU patients demonstrated that TTR at admission was strongly correlated with infection rates (44.7% vs. 19% for values below or above 19 mg/dL, p < 0.001), mortality (17% vs. 7.4%, respectively, for the same cutoff, p < 0.007), and ICU length of stay (15.6 days vs. 7.8 days, respectively) [70]. In conclusion, changes in TTR over time are useful for understanding the patient’s clinical trajectory but also serves as an intermediate-term marker reflecting the inflammatory response and nutritional status in critically ill patients. This can help raise suspicion for diagnostic or therapeutic interventions when needed.
9. Clinical Tips: Practical Use of Biomarkers in the ICU
In the intensive care unit, selecting the right biomarkers and using them effectively can significantly impact patient outcomes. Each biomarker has its strengths and limitations, and understanding these is essential for accurate diagnosis and management. The effective use of biomarkers in the ICU, as detailed in the Table 3, provides clinicians with actionable insights to improve patient management. NSE is highly reliable for assessing neurological outcomes after cardiac arrest, particularly when combined with tools such as SSEPs, EEG, and neuroimaging [71]. Its multimodal application ensures accurate prognostication while mitigating the risk of misinterpretation. Similarly, PCT aids in identifying bacterial infections and guiding antibiotic therapy, reducing unnecessary antibiotic exposure when integrated into clinical algorithms [72]. NT-proBNP is an essential biomarker for diagnosing heart failure and distinguishing cardiac from pulmonary causes of dyspnea, especially in emergencies [73]. For renal function, CysC outperforms SCr in detecting early AKI, making it a go-to biomarker for critically ill patients [74]. Moreover, IL-6 and TTR provide key information on systemic inflammation and nutritional status, respectively, supporting tailored interventions [75]. However, as the Table XX notes, certain limitations require careful consideration. SCr, though widely used, is a slower and less reliable marker for early AKI, particularly in ICU settings where confounding factors like muscle mass variations can distort results. NSE, while valuable, must be used alongside other diagnostics due to potential confounders like hemolysis [76]. Likewise, PCT and IL-6 require contextual interpretation to avoid misdiagnosis in non-bacterial or systemic inflammatory conditions [77]. Finally, TTR should not be used as a standalone nutritional marker but as part of a comprehensive evaluation reflecting metabolic and inflammatory states.
10. Future Advances in Biomarker Utilization in the ICU
The future of biomarkers in the ICU is poised to transform patient care, enabling more precise diagnosis, monitoring, and treatment. Multiplex panels that combine biomarkers like NSE, IL-6, and PCT, paired with Artificial Intelligence [78], will enhance diagnostic accuracy, and predict outcomes in conditions like sepsis and ARDS. Similarly, point-of-care testing devices for biomarkers such as CysC or NT-proBNP will provide rapid, bedside results, allowing clinicians to make timely decisions. Biomarkers are also paving the way for precision medicine, where stratifying patients based on markers like IL-6 can tailor therapies, such as immunomodulators for cytokine storms or antibiotics for bacterial infections [79]. Emerging markets like NfL for neuronal injury and KIM-1 for renal dysfunction are set to offer greater specificity and sensitivity, improving early diagnosis and intervention. Advances in omics technologies will further personalize care by identifying molecular profiles to guide real-time treatment adjustments [80]. Efforts to standardize biomarker assays and make testing more accessible will expand their use globally. Beyond acute care, biomarkers like TTR and NT-proBNP show promise in predicting long-term complications, helping guide recovery strategies after ICU discharge [81,82]. These advancements will shift biomarkers from diagnostic aids to central components of personalized ICU care, equipping clinicians to deliver targeted, timely, and effective interventions.
11. Conclusion
Integrating biomarkers into a broader diagnostic and therapeutic framework, clinicians can make more informed decisions. The key lies in using them contextually acknowledging their strengths while being mindful of their limitations. When interpreted thoughtfully, these tools enhance diagnostic precision, guide targeted interventions, and ultimately improve patient care. The future of biomarkers in the ICU is both exciting and transformative. With advances in technology, analytics, and personalized care, biomarkers will become more than diagnostic tools—they will serve as integral components of dynamic, patient-centered treatment strategies. By continuing to refine biomarker utility and integrating them into a multimodal framework, clinicians will be better equipped to meet the challenges of critical care and improve outcomes for their patients.
Author Contributions
Francesco Cipulli: Conceptualization, methodology, validation, data curation, writing—original draft, and editing. Eleonora Balzani: Conceptualization, methodology, validation, data curation, writing—original draft, and editing. Sergio Lassola and Giuseppe Marini: Contribution to original draft writing. Silvia De Rosa: Conceptualization, methodology, validation, data curation, writing—original draft, and editing. Giacomo Bellani: Supervision, project administration. All authors have read and approved the final version of the manuscript.
Funding
This research received no external funding.
Conflicts of Interest
The authors declare no conflicts of interest.
Abbreviations
The following abbreviations are used in this manuscript:
| NSE | Neuron-Specific Enolase |
| PCT | Procalcitonin |
| NT-proBNP | N-terminal pro-brain natriuretic peptide |
| SCr | Serum creatinine |
| CysC | Cystatin C |
| TTR | Prealbumin |
| ACT | Activated clotting time |
References
- Zhi M, Huang J and Jin X 2024 Clinical value of serum neuron-specific enolase in sepsis-associated encephalopathy: a systematic review and meta-analysis Syst Rev 13 191.
- Hanin A, Denis J A, Frazzini V, Cousyn L, Imbert-Bismut F, Rucheton B, Bonnefont-Rousselot D, Marois C, Lambrecq V, Demeret S and Navarro V 2022 Neuron Specific Enolase, S100-beta protein and progranulin as diagnostic biomarkers of status epilepticus J Neurol 269 3752–60.
- Vondrakova D, Kruger A, Janotka M, Malek F, Dudkova V, Neuzil P and Ostadal P 2017 Association of neuron-specific enolase values with outcomes in cardiac arrest survivors is dependent on the time of sample collection Crit Care 21 172.
- Sakimura K, Kushiya E, Takahashi Y and Suzuki Y 1987 The structure and expression of neuron-specific enolase gene Gene 60 103–13.
- Marangos P J and Schmechel D E 1987 Neuron Specific Enolase, A Clinically Useful Marker for Neurons and Neuroendocrine Cells Annu. Rev. Neurosci. 10 269–95.
- Feng Q, Wu L, Ai Y H, Deng S Y, Ai M L, Huang L, Liu Z Y and Zhang L N 2017 [The diagnostic value of neuron-specific enolase, central nervous system specific protein and interleukin-6 in sepsis-associated encephalopathy] Zhonghua Nei Ke Za Zhi 56 747–51.
- Kim Y-J, Kim Y H, Youn C S, Cho I S, Kim S J, Wee J H, Park Y S, Oh J S, Lee B K and Kim W Y 2023 Different neuroprognostication thresholds of neuron-specific enolase in shockable and non-shockable out-of-hospital cardiac arrest: a prospective multicenter observational study in Korea (the KORHN-PRO registry) Crit Care 27 313.
- Chung-Esaki H M, Mui G, Mlynash M, Eyngorn I, Catabay K and Hirsch K G 2018 The neuron specific enolase (NSE) ratio offers benefits over absolute value thresholds in post-cardiac arrest coma prognosis Journal of Clinical Neuroscience 57 99–104.
- Scarpino M, Lolli F, Lanzo G, Carrai R, Spalletti M, Valzania F, Lombardi M, Audenino D, Celani M G, Marrelli A, Contardi S, Peris A, Amantini A, Sandroni C, Grippo A, Amantini A, Carrai R, Grippo A, Lanzo G, Lolli F, Masi G, Moretti M, Peris A, Scarpino M, Spalletti M, Bandinelli C, Lombardi M, Contardi S, Marudi A, Audenino D, Rikani K, Ospedale Galliera E O, Marrelli A, Cantisani T A, Celani M G, Fiacca A, Sabadini R and Valzania F 2019 Neurophysiology and neuroimaging accurately predict poor neurological outcome within 24 hours after cardiac arrest: The ProNeCA prospective multicentre prognostication study Resuscitation 143 115–23.
- Mastroianni A, Panella R and Morelli D 2020 Invisible hemolysis in serum samples interferes in NSE measurement Tumori 106 79–81.
- Müller J, Bissmann B, Becker C, Beck K, Loretz N, Gross S, Amacher S A, Bohren C, Pargger H, Tisljar K, Sutter R, Marsch S and Hunziker S 2021 Neuron-Specific Enolase (NSE) Predicts Long-Term Mortality in Adult Patients after Cardiac Arrest: Results from a Prospective Trial Medicines 8 72.
- Macedo R C D, Tomasi C D, Giombelli V R, Alves S C, Bristot M D L U, Locks M F T, Petronilho F, Grandi C, Quevedo J, Dal-Pizzol F and Ritter C 2013 Lack of association of S100β and neuron-specific enolase with mortality in critically ill patients Rev. Bras. Psiquiatr. 35 267–70.
- Davies J 2015 Procalcitonin J Clin Pathol 68 675–9.
- Algeciras-Schimnich A, Preissner C M, Theobald J P, Finseth M S and Grebe S K G 2009 Procalcitonin: a marker for the diagnosis and follow-up of patients with medullary thyroid carcinoma J Clin Endocrinol Metab 94 861–8.
- Meisner M 2014 Update on Procalcitonin Measurements Ann Lab Med 34 263–73.
- Gaïni S, Koldkjaer O G, Pedersen C and Pedersen S S 2006 Procalcitonin, lipopolysaccharide-binding protein, interleukin-6 and C-reactive protein in community-acquired infections and sepsis: a prospective study Crit Care 10 R53.
- Bouadma L, Luyt C-E, Tubach F, Cracco C, Alvarez A, Schwebel C, Schortgen F, Lasocki S, Veber B, Dehoux M, Bernard M, Pasquet B, Régnier B, Brun-Buisson C, Chastre J and Wolff M 2010 Use of procalcitonin to reduce patients’ exposure to antibiotics in intensive care units (PRORATA trial): a multicentre randomised controlled trial The Lancet 375 463–74.
- Jona V, Bharadwaj R, Swindler J and Stokes C 2012 False Negative Procalcitonin Levels in Patients With Positive Blood Cultures Chest 142 230A.
- Chun K, Chung W, Kim A J, Kim H, Ro H, Chang J H, Lee H H and Jung J Y 2019 Association between acute kidney injury and serum procalcitonin levels and their diagnostic usefulness in critically ill patients Sci Rep 9 4777.
- Bayés-Genís A, Santaló-Bel M, Zapico-Muñiz E, López L, Cotes C, Bellido J, Leta R, Casan P and Ordóñez-Llanos J 2004 N-terminal probrain natriuretic peptide (NT-proBNP) in the emergency diagnosis and in-hospital monitoring of patients with dyspnoea and ventricular dysfunction European J of Heart Fail 6 301–8.
- Forfia P R, Watkins S P, Rame J E, Stewart K J and Shapiro E P 2005 Relationship Between B-Type Natriuretic Peptides and Pulmonary Capillary Wedge Pressure in the Intensive Care Unit Journal of the American College of Cardiology 45 1667–71.
- Christenson R H 2008 What is the value of B-type natriuretic peptide testing for diagnosis, prognosis or monitoring of critically ill adult patients in intensive care? Clinical Chemistry and Laboratory Medicine 46.
- Baggish A L, van Kimmenade R R J and Januzzi J L 2008 The differential diagnosis of an elevated amino-terminal pro-B-type natriuretic peptide level Am J Cardiol 101 43–8.
- Christ M and Mueller C 2008 Use of natriuretic peptide assay in dyspnea Dtsch Arztebl Int 105 95–100.
- Smit B, Spoelstra-de Man A M, Girbes A R and De Waard M C 2015 NT-proBNP in cardiopulmonary resuscitated patients treated with mild therapeutic hypothermia is not independently associated with mortality: a retrospective observational study BMC Anesthesiol 15 48.
- Hou J-L, Gao K, Li M, Ma J-Y, Shi Y-K, Wang Y and Zhao Y-F 2008 Increased N-terminal pro-brain natriuretic peptide level predicts atrial fibrillation after surgery for esophageal carcinoma World J Gastroenterol 14 2582–5.
- Kobayashi A, Hashimoto S, Kooguchi K, Kitamura Y, Onodera H, Urata Y and Ashihara T 1998 Expression of Inducible Nitric Oxide Synthase and Inflammatory Cytokines in Alveolar Macrophages of ARDS Following Sepsis Chest 113 1632–9.
- Tanaka T, Narazaki M and Kishimoto T 2014 IL-6 in Inflammation, Immunity, and Disease Cold Spring Harbor Perspectives in Biology 6 a016295–a016295.
- Matthay M A, Ware L B and Zimmerman G A 2012 The acute respiratory distress syndrome J. Clin. Invest. 122 2731–40.
- Chalmers J D, Singanayagam A and Hill A T 2008 C-Reactive Protein Is an Independent Predictor of Severity in Community-acquired Pneumonia The American Journal of Medicine 121 219–25.
- Ware L B, Koyama T, Zhao Z, Janz D R, Wickersham N, Bernard G R, May A K, Calfee C S and Matthay M A 2013 Biomarkers of lung epithelial injury and inflammation distinguish severe sepsis patients with acute respiratory distress syndrome Crit Care 17 R253.
- Gamarra-Morales Y, Molina-López J, Santiago-Ruiz F-C, Herrera-Quintana L, Vázquez-Lorente H, Gascón-Luna F and Planells E 2024 Efficiency of IL-6 in Early Prognosis and Follow-Up in Critically Ill Patients with Septic Shock Diseases 12 298.
- Li L, Yao Y, Feng X, Chen L, Wu R, Chang Y, Lou Q, Pan J and Wang Z 2022 Analysis of Clinical Manifestations and Imaging of COVID-19 Patients in Intensive Care ed M F Hashmi Contrast Media & Molecular Imaging 2022 9697285.
- Boretti A and Banik B 2022 Modulation of Covid-19 cytokine storm by tocilizumab Journal of Medical Virology 94 823–8.
- Zhou Y, Li C, Mei S, Xu Q, Qin S, Feng J, Wang J, Xing S, Wang W, Li F, Zhou Q, He Z, Gao Y, Zhang X and Zhang Z 2024 Identifying risk factors for acute respiratory distress syndrome in critically ill patients: a retrospective study Front. Med. 11 1469291.
- Wu Q, Yang H and Kang Y 2018 Comparison of diagnostic accuracy among procalcitonin, C-reactive protein, and interleukin 6 for blood culture positivity in general ICU patients Crit Care 22 339.
- De Rosa S, Samoni S and Ronco C 2016 Creatinine-based definitions: from baseline creatinine to serum creatinine adjustment in intensive care Crit Care 20 69.
- De Rosa S, Greco M, Rauseo M and Annetta M G 2023 The Good, the Bad, and the Serum Creatinine: Exploring the Effect of Muscle Mass and Nutrition Blood Purif 52 775–85.
- Baxmann A C, Ahmed M S, Marques N C, Menon V B, Pereira A B, Kirsztajn G M and Heilberg I P 2008 Influence of muscle mass and physical activity on serum and urinary creatinine and serum cystatin C Clin J Am Soc Nephrol 3 348–54.
- Lorenz G, Hettwer S, McCallum W, Angermann S, Wen M, Schmaderer C, Heemann U, Roos M, Renders L and Steubl D 2019 Plasma C-terminal agrin fragment and rapid kidney function decline in chronic kidney disease patients Medicine (Baltimore) 98 e15597.
- Shlipak M G, Mattes M D and Peralta C A 2013 Update on cystatin C: incorporation into clinical practice Am J Kidney Dis 62 595–603.
- Peng P, Fu X C, Wang Y, Zheng X, Bian L, Zhati N, Zhang S and Wei W 2024 The value of serum cystatin c in predicting acute kidney injury after cardiac surgery: A systematic review and meta-analysis PLoS One 19 e0310049.
- Ostermann M, Legrand M, Meersch M, Srisawat N, Zarbock A and Kellum J A 2024 Biomarkers in acute kidney injury Ann. Intensive Care 14 145.
- Poventud-Fuentes I, Garnett E, Akcan-Arikan A and Devaraj S 2022 Comparison of Cystatin C and Creatinine-Based Equations with Measured Glomerular Filtration Rate in a Diverse Pediatric Population J Appl Lab Med 7 1016–24.
- Miyazaki S, Iino N, Koda R, Narita I and Kaneko Y 2021 Brain-derived neurotrophic factor is associated with sarcopenia and frailty in Japanese hemodialysis patients Geriatr Gerontol Int 21 27–33.
- Nourie N, Ghaleb R, Lefaucheur C and Louis K 2024 Toward Precision Medicine: Exploring the Landscape of Biomarkers in Acute Kidney Injury Biomolecules 14 82.
- Chew J S C, Saleem M, Florkowski C M and George P M 2008 Cystatin C--a paradigm of evidence based laboratory medicine Clin Biochem Rev 29 47–62.
- Yong Z, Pei X, Zhu B, Yuan H and Zhao W 2017 Predictive value of serum cystatin C for acute kidney injury in adults: a meta-analysis of prospective cohort trials Sci Rep 7 41012.
- Kashani K, Cheungpasitporn W and Ronco C 2017 Biomarkers of acute kidney injury: the pathway from discovery to clinical adoption Clin Chem Lab Med 55 1074–89.
- Bufkin K B, Karim Z A and Silva J 2024 Review of the limitations of current biomarkers in acute kidney injury clinical practices SAGE Open Med 12 20503121241228446.
- Erkinaro T, Moilanen J, Lahtinen J, Mosorin M and Savolainen E-R 2022 The Standard Point-of-Care Hemochron Jr. ACT+ Test in Monitoring Heparin Administration for Cardiopulmonary Bypass in Severe Factor XII Deficiency Journal of Cardiothoracic and Vascular Anesthesia 36 2031–4.
- Chen Y, Phoon P H Y and Hwang N C 2022 Heparin Resistance During Cardiopulmonary Bypass in Adult Cardiac Surgery Journal of Cardiothoracic and Vascular Anesthesia 36 4150–60.
- Roosendaal L C, Hoebink M, Wiersema A M, Blankensteijn J D and Jongkind V 2024 Activated clotting time-guided heparinization during open AAA surgery: a pilot study Pilot Feasibility Stud 10 73.
- Wehner J E, Boehne M, David S, Brand K, Tiede A and Bikker R 2020 Activated Clotting Time (ACT) for Monitoring of Low-Dose Heparin: Performance Characteristics in Healthy Adults and Critically Ill Patients Clin Appl Thromb Hemost 26 1076029620975494.
- Hansen R, Koster A, Kukucka M, Mertzlufft F and Kuppe H 2000 A quick anti-Xa-activity-based whole blood coagulation assay for monitoring unfractionated heparin during cardiopulmonary bypass: a pilot investigation Anesth Analg 91 533–8.
- Yoshinaga K, Otsuka Y, Furukawa T, Amitani S, Kimura N and Sanui M 2021 Correlation between activated clotting time monitoring and heparin concentration measurement in a patient with antiphospholipid syndrome during cardiac valve surgery: a case report JA Clin Rep 7 24.
- Grewal N, Yousef D, Palmen M, Klautz R, Eikenboom J and Wink J 2022 Accuracy of point-of-care coagulation testing during cardiopulmonary bypass in a patient post COVID-19 infection J Cardiothorac Surg 17 108.
- Helin T, Tirri T, Korkala H, Lappalainen K and Joutsi-Korhonen L 2023 Laboratory Assessment of Unfractionated Heparin (UFH) with Activated Clotting Time (ACT) and Anti-Xa Activity during Peripheral Arterial Angiographic Procedure Diagnostics 13 1489.
- McLaughlin K, Rimsans J, Sylvester K W, Fanikos J, Dorfman D M, Senna P, Connors J M and Goldhaber S Z 2019 Evaluation of Antifactor-Xa Heparin Assay and Activated Partial Thromboplastin Time Values in Patients on Therapeutic Continuous Infusion Unfractionated Heparin Therapy Clin Appl Thromb Hemost 25 1076029619876030.
- Keller U 2019 Nutritional Laboratory Markers in Malnutrition JCM 8 775.
- Ingenbleek Y and Young V 1994 Transthyretin (prealbumin) in health and disease: nutritional implications Annu Rev Nutr 14 495–533.
- Dellière S and Cynober L 2017 Is transthyretin a good marker of nutritional status? Clin Nutr 36 364–70.
- Wajner S M, Goemann I M, Bueno A L, Larsen P R and Maia A L 2011 IL-6 promotes nonthyroidal illness syndrome by blocking thyroxine activation while promoting thyroid hormone inactivation in human cells J. Clin. Invest. 121 1834–45.
- Linden M A, Freitas R G B D O N, Teles L O D S, Morcillo A M, Ferreira M T and Nogueira R J N 2024 Transthyretin and Nutritional Status in Critically Ill Adults on Parenteral Nutrition: A Prospective Cohort Study Nutrients 16 2448.
- Devakonda A, George L, Raoof S, Esan A, Saleh A and Bernstein L H 2008 Transthyretin as a marker to predict outcome in critically ill patients Clin Biochem 41 1126–30.
- Sreedhara R, Avram M M, Blanco M, Batish R, Avram M M and Mittman N 1996 Prealbumin is the best nutritional predictor of survival in hemodialysis and peritoneal dialysis Am J Kidney Dis 28 937–42.
- Akashi M, Minami Y, Haruki S, Jujo K and Hagiwara N 2019 Prognostic implications of prealbumin level on admission in patients with acute heart failure referred to a cardiac intensive care unit J Cardiol 73 114–9.
- Lourenço P, Silva S, Friões F, Alvelos M, Amorim M, Torres-Ramalho P, Teles M J, Guimarães J T and Bettencourt P 2013 Does pre-albumin predict in-hospital mortality in heart failure? Int J Cardiol 166 758–60.
- Wang W, Ren D, Wang C-S, Li T and Yao H-C 2019 High sensitivity C-reactive protein to prealbumin ratio measurement as a marker of the prognosis in acute coronary syndrome Sci Rep 9 11583.
- Haltmeier T, Inaba K, Durso J, Khan M, Siboni S, Cheng V, Schnüriger B, Benjamin E and Demetriades D 2020 Transthyretin at Admission and Over Time as a Marker for Clinical Outcomes in Critically Ill Trauma Patients: A Prospective Single-Center Study World J Surg 44 115–23.
- Kim S H, Kim H J, Park K N, Choi S P, Lee B K, Oh S H, Jeung K W, Cho I S and Youn C S 2020 Neuron-specific enolase and neuroimaging for prognostication after cardiac arrest treated with targeted temperature management PLoS One 15 e0239979.
- Westwood M, Ramaekers B, Whiting P, Tomini F, Joore M, Armstrong N, Ryder S, Stirk L, Severens J and Kleijnen J 2015 Procalcitonin testing to guide antibiotic therapy for the treatment of sepsis in intensive care settings and for suspected bacterial infection in emergency department settings: a systematic review and cost-effectiveness analysis Health Technol Assess 19 v–xxv, 1–236.
- Cao Z, Jia Y and Zhu B 2019 BNP and NT-proBNP as Diagnostic Biomarkers for Cardiac Dysfunction in Both Clinical and Forensic Medicine Int J Mol Sci 20 1820.
- Lagos-Arevalo P, Palijan A, Vertullo L, Devarajan P, Bennett M R, Sabbisetti V, Bonventre J V, Ma Q, Gottesman R D and Zappitelli M 2015 Cystatin C in acute kidney injury diagnosis: early biomarker or alternative to serum creatinine? Pediatr Nephrol 30 665–76.
- Tanaka T, Narazaki M and Kishimoto T 2014 IL-6 in inflammation, immunity, and disease Cold Spring Harb Perspect Biol 6 a016295.
- Tolan N V, Vidal-Folch N, Algeciras-Schimnich A, Singh R J and Grebe S K G 2013 Individualized correction of neuron-specific enolase (NSE) measurement in hemolyzed serum samples Clin Chim Acta 424 216–21.
- Mat-Nor M B, Md Ralib A, Abdulah N Z and Pickering J W 2016 The diagnostic ability of procalcitonin and interleukin-6 to differentiate infectious from noninfectious systemic inflammatory response syndrome and to predict mortality J Crit Care 33 245–51.
- Michelhaugh S A and Januzzi J L 2022 Using Artificial Intelligence to Better Predict and Develop Biomarkers Heart Fail Clin 18 275–85.
- Johnson K B, Wei W-Q, Weeraratne D, Frisse M E, Misulis K, Rhee K, Zhao J and Snowdon J L 2021 Precision Medicine, AI, and the Future of Personalized Health Care Clin Transl Sci 14 86–93.
- Vitorino R 2024 Transforming Clinical Research: The Power of High-Throughput Omics Integration Proteomes 12 25.
- Metra M, Nodari S, Parrinello G, Specchia C, Brentana L, Rocca P, Fracassi F, Bordonali T, Milani P, Danesi R, Verzura G, Chiari E and Dei Cas L 2007 The role of plasma biomarkers in acute heart failure. Serial changes and independent prognostic value of NT-proBNP and cardiac troponin-T Eur J Heart Fail 9 776–86.
- C; Méndez Hernández R and Ramasco Rueda F 2023 Biomarkers as Prognostic Predictors and Therapeutic Guide in Critically Ill Patients: Clinical Evidence J Pers Med 13 333.
Table 3.
Tips for Diagnosis and Management: Recommended Uses and Precautions.
| Biomarker | Recommended Use | Use with Caution |
|---|---|---|
| NSE | Neurological outcomes after cardiac arrest; reliable with time-based measurements and multimodal tools (SSEPs, EEG, imaging). | Avoid standalone use; factors like hemolysis can inflate levels. Combine with other diagnostic tools. |
| PCT | Bacterial infections and antibiotic guidance; reduces unnecessary antibiotics in clinical algorithms. | Limited for non-bacterial inflammation (e.g., post-surgery, viral); always interpret within clinical context. |
| NT-proBNP | Heart failure diagnosis and management; differentiates cardiac vs. pulmonary dyspnea and monitors disease progression. | May be elevated due to non-cardiac causes (e.g., renal dysfunction, age); careful clinical correlation required. |
| CysC | Early detection of AKI in critically ill patients; more sensitive and specific than SCr. | SCr is slow to detect early AKI and influenced by muscle mass, limiting reliability in critical settings. |
| IL-6 | Systemic inflammation, sepsis, and ARDS tracking; useful for monitoring cytokine storms and treatment responses. | Lacks specificity: elevated levels in trauma, burns, or autoimmune diseases. Correlate with clinical signs. |
| TTR | Nutritional and inflammatory status in critically ill; identifies catabolic/anabolic phases for tailored nutritional interventions. | Not solely a nutritional marker; reflects inflammatory/metabolic changes, requiring contextual interpretation. |
Disclaimer/Publisher’s Note: The statements, opinions and data contained in all publications are solely those of the individual author(s) and contributor(s) and not of MDPI and/or the editor(s). MDPI and/or the editor(s) disclaim responsibility for any injury to people or property resulting from any ideas, methods, instructions or products referred to in the content. |
© 2025 by the authors. Licensee MDPI, Basel, Switzerland. This article is an open access article distributed under the terms and conditions of the Creative Commons Attribution (CC BY) license (http://creativecommons.org/licenses/by/4.0/).
Copyright: This open access article is published under a Creative Commons CC BY 4.0 license, which permit the free download, distribution, and reuse, provided that the author and preprint are cited in any reuse.


