1. Introduction
L-asparaginase, an enzyme catalyzing the hydrolysis of L-asparagine to L-aspartic acid and ammonia, is a valuable component in the treatment of acute lymphoblastic leukemia (ALL) and certain lymphomas [
1,
2,
3,
4,
5,
6]. Bacterial L-asparaginases from
Escherichia coli (EcA) and
Erwinia chrysanthemi (ErA) are currently employed in combination chemotherapy, exploiting the dependence of rapidly proliferating tumor cells on exogenous asparagine [
7]. This dependence is particularly pronounced in leukemic cells, which exhibit significantly lower asparagine synthetase activity compared to normal tissues [
8,
9,
10,
11,
12,
13,
14,
15,
16,
17,
18]. L-asparaginase treatment leads to cell cycle arrest in the G1 phase and apoptosis. Bacterial L-asparaginases are broadly classified into two types [
19,
20,
21]:
Type I, constitutively expressed cytoplasmic enzymes with high KM (~1-8 mM) for L-asparagine, generally lacking significant anti-tumor activity (e.g., Bacillus subtilis, Methanococcus jannaschii, Pyrococcus horikoshii);
Type II, periplasmic enzymes with low KM (~10-20 µM) for L-asparagine, demonstrating anti-proliferative activity and including those used clinically (EcA and ErA), along with others such as Yersinia pseudotuberculosis, Helicobacter pylori, and Wolinella succinogenes.
L-asparaginase from
Rhodospirillum rubrum (RrA) is noteworthy as a Type I cytoplasmic enzyme that, unlike most others in its class, exhibits demonstrable anti-proliferative activity. However, a critical consideration in the clinical application of L-asparaginases is the avoidance of significant L-glutaminase activity, which can contribute to toxicity [
22,
23,
24,
25]. While EcA and ErA are currently the only bacterial L-asparaginases approved for medical use, their L-glutaminase activity (5-10% of L-asparaginase activity) and relatively high
KM for L-glutamine (1-3 mM) necessitate careful monitoring for adverse effects.
RrA presents a compelling alternative due to its significantly lower L-glutaminase activity (<0.01% of L-asparaginase activity) and its low homology to EcA and ErA [
3,
26,
27,
28,
29,
30]. This low homology, coupled with its unique structural features – including a shorter amino acid sequence (172 residues per monomer compared to 330 in EcA and ErA) – makes RrA a potential candidate for treating patients who develop hypersensitivity to clinically used asparaginases. Further highlighting its potential, RrA demonstrates cytotoxic activity against several human leukemia (K562), prostate cancer (DU145), and breast cancer (MDA-MB-231, MCF7) cell lines, surpassing the cytotoxic effects of ErA while exhibiting lower overall toxicity compared to EcA [
29]. The present study aims to comprehensively characterize the physicochemical properties, biocatalytic characteristics, and cytostatic efficacy of wide RrA and three of its mutants, in comparison with established commercial L-asparaginase preparations (EcA). This detailed characterization will contribute significantly to the evaluation of RrA’s potential as a novel therapeutic agent for leukemia.
The mutation selection strategy is based on data obtained from the study of other RrA mutants [
31,
32].
Structural changes of the RrА mutants in the enzyme inter-subunits contacts area (A64V, E67K and R118H, G120R) could led to the improvement of kinetic parameters and enzyme stabilization due the elimination of the steric hindrance in the case of mutations RrA upon dimer formation. Reduction of negative charges near areas of contact of subunits may lead to reduce monomers repulsion generally negatively charged, and increase protein stability. In the case of the substitutions E149R, V150P and A64V, E67K (in the loop regions) it is expected that rigidity and stability of the protein globule packing increases by means of additional salt linkage and the saturation of the protein molecule nonpolar contacts. Substitutions E149R, V150P improved cytotoxic activity of the RrA [
33].
Here we investigated the effect of point mutations in inter-subunits contacts area, as well as in the area of the loop region, which could be involved as a contact area upon interaction of the enzyme with the cancer cells on the conformational stability properties, biocatalytic activity, and cytostatic effects of L-asparaginase (RrA). RrA and its three mutants (Mut1: A64V, E67K; Mut2: R118H, G120R; Mut3: E149R, V150P, F151T) were studied as well the influence of the N-terminal peptide: the 17-amino acid peptide sequence, MASMTGGQQMGRGSSRQ, is a capsid peptide derived from the bacteriophage T7 and has been engineered to enhance the thermal stability of RrA.
Unlike clinically used L-asparaginases such as EcA and ErA, which primarily exert their anti-cancer effects through asparagine depletion, some RrA variants offer a distinct mechanism of action. This represents a significant advantage, offering a potential alternative for patients who develop resistance or hypersensitivity to conventional asparaginase therapies.
Here, we investigated the correlation between the physicochemical and kinetic properties of RrA and its mutants with the cytotoxicity and therapeutic potential. We evaluated alterations in thermostability, determining the impact of mutations on the enzyme's resistance to thermal denaturation and its potential for enhanced stability in vivo. Furthermore, we assessed the impact of mutations on Vmax (the maximum reaction rate), substrate specificity (KM) providing crucial insights into the catalytic efficiency of each mutant. This investigation contributes to the rational engineering of improved enzyme-based therapeutics.
2. Materials and Methods
2.1. Reagents
The following reagents were used in this work: L-asparagine monohydrate (BioChemica, Great Britain), trypsin (Sigma-Aldrich, St. Louis, Missouri, USA), sodium phosphate buffered saline solution (PBS; Eco-Service, St. Petersburg, Russia), salts, acids, alkalis, etc. (Reachim, Russia).
2.2. Enzymes
1) L-Asparaginase EcA from E. coli is a commercial drug manufactured by Medac (Germany) and Veropharm (Moscow, Russia).
2) Native L-Asparaginase RrA from Rhodospirillum rubrum.
The RrA gene, a native form, was isolated from the bacterium Rhodospirillum rubrum, which is part of the collection of the Department of Microbiology at Lomonosov Moscow State University in Moscow, Russia. This gene was obtained using the pET-23a vector from Novagen, Madison, Wisconsin, USA. To culture cells containing plasmids, 0.05 mg/mL of kanamycin was added to the medium. To induce the expression of the target protein, lactose was added to the expressed culture when the optical density at 600 nm (OD600) reached 1.9, with a final concentration of 0.2%. Cells were cultured for an additional 17–20 hours and then centrifuged at 4,000 × g for 15 minutes. All steps of enzymatic purification were performed at a temperature of +4°C. A sample of five grams of biomass was suspended in a buffer solution of 50 mL (20 mM PBS at pH 7.4 with the addition of 1 mM glycine and 1 mM EDTA). The mixture was then subjected to ultrasonic treatment. After that, cellular debris and intact cells were separated by centrifugation at 35,000 x g for 30 minutes. The resulting supernatant, which contained the target enzyme, was applied to Q-sepharose columns manufactured by Pharmacia in Sweden. The protein was then eluted using a linear gradient ranging from 0 to 1.0 M NaCl. The fractions obtained were analyzed for protein content using absorption at 280 nm and enzyme activity measurements. Ultrafiltration, desalination, and replacement of the buffer were performed using Amicon membranes manufactured by Millipore in Burlington, Massachusetts. The samples were subsequently frozen and stored at a temperature of –20 degrees Celsius.
3) Mutant forms of L-Asparaginase RrA from Rhodospirillum rubrum.
Mutant forms of RrA
A64V, E67K (RrA Mut1), RrA
R118H, G120R (RrA Mut2), RrA
E149R, V150P, F151T (RrA Mut3) (
Table 1) were obtained using site-directed mutagenesis ("Quik Change") Single-Primer Reactions in Parallel using the pET23a vector ("Novagen", USA), carrying the RrA gene as a matrix. In Mut3, glutamic acid (E) was replaced by arginine (R) at position 149, valine (V) by proline (P) at position 150, and phenylalanine (F) by threonine (T) at position 151. In Mut1 – alanine (A) replaces valine (V) in 64 and glutamic acid (E) replaces lysine (K) in 67. In Mut2 – arginine (R) is replaced by histidine (H) at the 118th position and glycine (G) by arginine (R) at the 120th position. The N-fragment MASMTGGQQMGRGSSRQ is also present in the RrA Mut1 and Mut2.The mutations were confirmed by Sanger DNA sequencing.
The process of isolating and purifying mutant forms of enzymes was carried out in the laboratory of medical biotechnology at the V. N. Orekhovich Institute of Biomedical Chemistry. The procedure involved the isolation and purification of L-asparaginases from the cells of a producing strain. This process included the use of ultrasound to treat the cell suspension, followed by the removal of debris through centrifugation. Subsequently, two stages of ion exchange chromatography were performed using columns filled with Q-Sepharose from Pharmacia (Sweden) and DEAE-Toyopearl 650 from ToyoSoda (Japan). Ultrafiltration, desalination, and concentration were also employed using PM10 membrane filters from Millipore (USA) in an Amicon cell. All stages of the purification process were conducted at +4°C. The resulting L-asparaginase preparations were then stabilized with 0.5% glucose and lyophilized for storage at –80°C.
2.3. FTIR Spectroscopy of Enzymes and Its Secondary Structure
Fourier-transform infrared (FTIR) spectra of enzyme solutions were acquired using a MICRAN-3 FTIR microscope and a Bruker Tensor 27 spectrometer equipped with a liquid-nitrogen-cooled mercury cadmium telluride (MCT) detector. Deconvolution of the Amide I band (1600-1700 cm⁻¹) in the FTIR spectrum of asparaginases was performed to determine secondary structure content. This involved baseline correction, smoothing, and subsequent deconvolution using a curve-fitting algorithm (Gaussian functions) to resolve overlapping bands corresponding to different secondary structure elements (α-helices, β-sheets, turns, random coils) taking into account the molar extinction coefficients of each component (α-helix 700 M
–1×cm
–1, high-frequency β-sheet component (1695–1675 cm
–1) 180 M
–1×cm
–1, major low-frequency β-sheet component (1639–1628 cm
–1) 180 M
–1×cm
–1, random coil structures 330 M
–1×cm
–1) [
34,
35,
36]. The relative areas under each resolved peak were then used to calculate the percentage contribution of each secondary structure element to the overall protein conformation.
2.4. Circular Dichroism (CD) Spectroscopy
Circular dichroism (CD) spectra of native L-asparaginase and its conjugates (with L-asparagine and L-aspartic acid) were recorded using a Jasco J-815 CD spectrometer (Jasco, Tokyo, Japan). Measurements were performed from 200-260 nm at 37°C in a 300 µL quartz cuvette (1 mm path length). Spectra were obtained by averaging five scans with 1 nm increments. Samples were dissolved in 10 mM sodium phosphate buffer (pH 7.4) at protein concentrations ranging from 0.25 to 1.00 mg/mL.
2.5. Catalytic Activity Determination by CD Spectroscopy
L-asparaginase activity was determined using the Jasco J-815 CD spectrometer (Jasco, Tokyo, Japan). A solution of 40 mM L-asparagine in 10 mM sodium phosphate buffer (pH 7.4) was diluted to the desired concentration. 15 µL of a 1 mg/mL L-asparaginase solution (in the same buffer) was added to yield a final enzyme concentration of 0.05 mg/mL. The reaction was conducted at 37°C in a 300 µL quartz cuvette (1 mm path length). Ellipticity at 210 nm was monitored over time. The hydrolysis rate was calculated using a calibration curve relating ellipticity to L-asparagine and L-aspartic acid concentrations, determined independently.
2.6. L-Asparaginase Thermodenaturation Parameter Determination
Thermodenaturation parameters were determined using the Jasco J-815 CD spectrometer. A solution of native enzyme or conjugate (0.5 mg/mL protein in 15 mM sodium phosphate buffer, pH 7.4) was heated from 20°C to 100°C at a rate of 1°C/min in a 300 µL quartz cuvette (1 mm path length). Denaturation was monitored by following changes in ellipticity at 220 nm. Data were analyzed using JASCO Spectra Manager software (Jasco, Tokyo, Japan).
The obtained thermograms were approximated by an asymmetric sigmoid dependence in the Origin program (OriginLab Corporation, Northampton, MA, USA). Using the ratio: ΔG = −RT ln [(θn – θ) / (θ – θd)], where values of elliptic proteins in the native and denatured forms (θn and θd, respectively) were taken as the average values of enzyme ellipticity before and after the completion of the conformational transition of the protein.
Then, using the Van't-Hoff isobar equation: , the values of the effective enthalpy of denaturation were calculated.
The value of the effective entropy was found from the formula:
2.7. Trypsinolysis Stability Assay
The stability of L-asparaginase and its modified forms during trypsinolysis was assessed using CD spectroscopy. Trypsin (0.01 mg/mL final concentration) was added to a solution of native or modified enzyme (0.5 mg/mL protein in pH 7.4 buffer). The mixture was incubated at 37°C with samples taken at 5-minute intervals (5, 10, 15, 20, 25, 30, 35, 40, 45, 50, 55, and 60 minutes). Residual catalytic activity was immediately determined by CD spectroscopy at 37°C using reaction mixtures containing 0.05 mg/mL enzyme and 20 mM substrate in pH 7.5 buffer.
2.8. Cell Culture and Cytotoxicity Assay
K562 leukemia cells and A549 lung carcinoma cells were obtained from the Live Systems Collection (V. N. Orekhovich Institute of Biomedical Chemistry, Moscow, Russia). Cells were cultured in RPMI-1640 medium (Gibco, Thermo Fisher Scientific) supplemented with 5% fetal bovine serum (Capricorn Scientific) and 1% sodium pyruvate (Paneco) in a humidified incubator at 37°C with 5% CO2. Cytotoxicity was assessed using the MTT assay. The MTT assay protocol involved seeding cells at a defined density in 96-well plates. After 24 hours, cells were treated with varying concentrations of the compounds under investigation. After 24 hours, MTT solution (3-(4,5-dimethylthiazol-2-yl)-2,5-diphenyltetrazolium bromide) was added, and the cells were incubated for 12h. The resulting formazan crystals were then dissolved using a solubilization DMSO solution, and the absorbance was measured using a microplate reader at wavelength 570 nm. Absorbance values were directly proportional to the number of viable cells.
2.9. FTIR Spectroscopy for Studying Enzyme-Cell Interactions
Cell suspensions (4-7 × 10⁵ cells/mL) were harvested by centrifugation (Eppendorf centrifuge 5415C, 2 × 5 min, 4000×g) and washed twice with sterile phosphate-buffered saline (PBS, pH 7.4). The cells were then resuspended in PBS to a concentration of 1 × 10⁷ cells/mL. A 20 µL aliquot of the cell suspension was deposited onto the spectrometer chamber, followed by the addition of 10 µL of enzyme solution (1-5 mg/mL). Samples were incubated at 37°C, and FTIR spectra were recorded at 5-minute intervals over a one-hour period.
3. Results and Discussion
3.1. FTIR Spectroscopy for Characterization of Native and Mutant RrA L-Asparaginases and Comparison with Pharmaceutical (EcA) Preparations
FTIR spectroscopy was used to characterize native and mutant forms of RrA L-asparaginase and compare them to commercially available asparaginases (EcA).
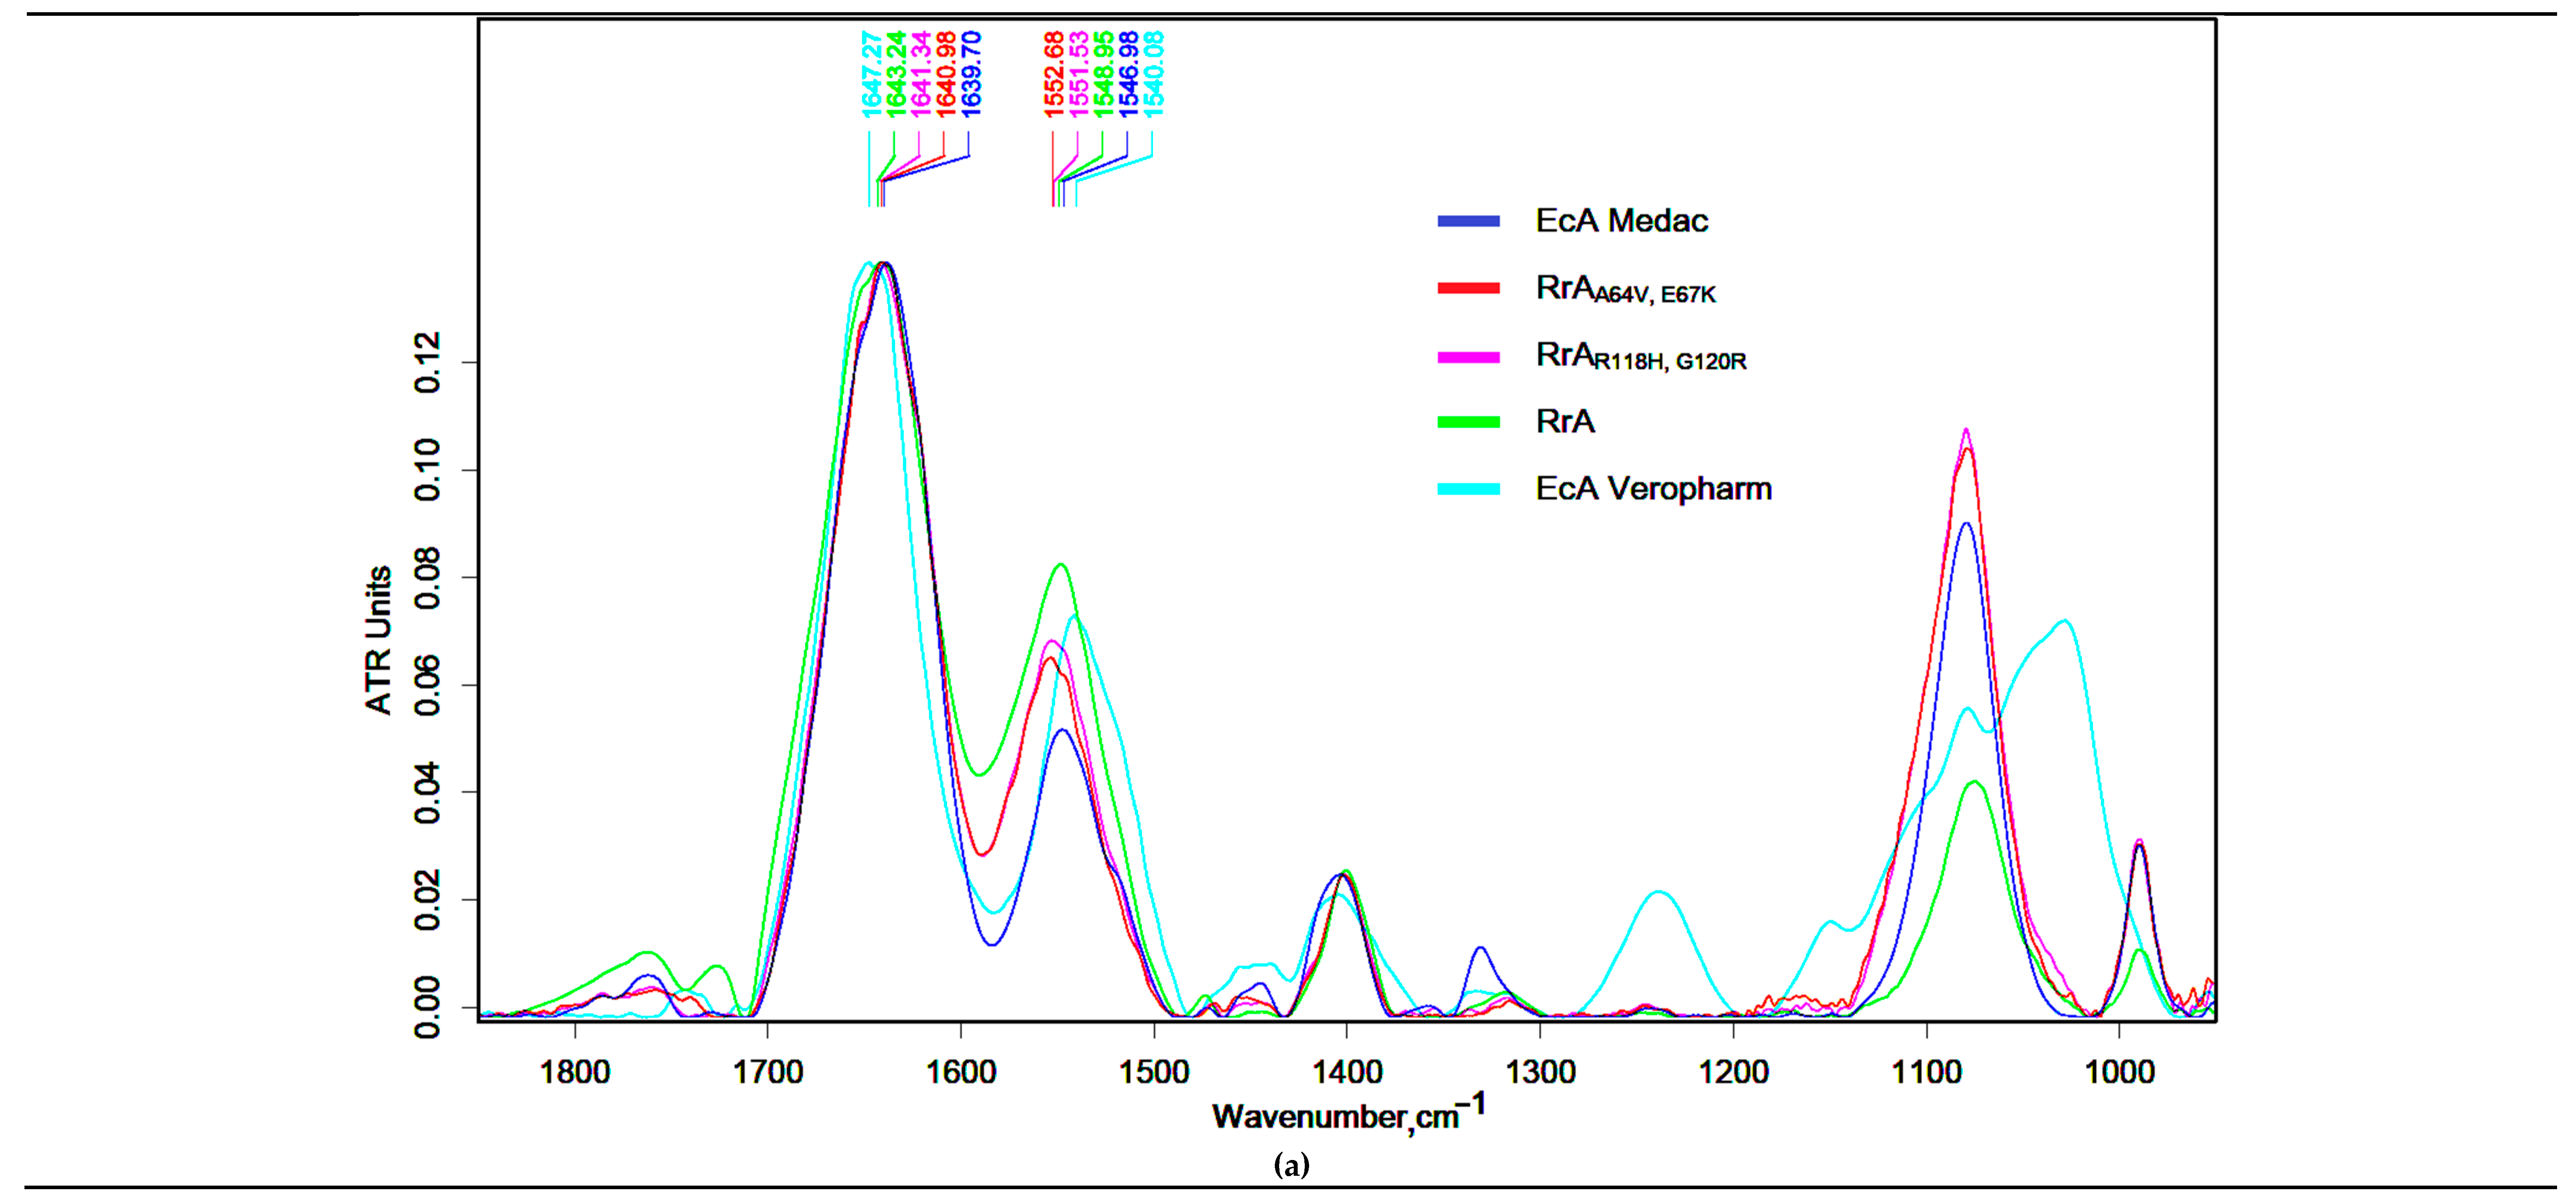
Figure 1a displays the FTIR spectra within the 1800-900 cm⁻¹ range. Characteristic protein major bands [
37] have been observed for the presented proteins:
Amide I band (1700-1590 cm⁻¹, C=O stretching (76%), C–N stretching (11%), CCN deformation (8%), NH in-plane bending (5%));
Amide II band (1580-1500 cm⁻¹, NH in-plane bending (45%), CN stretching (30%), CO in-plane bending (10%) CC stretching (8%), NC stretching (7%));
Amide III band (near 1240 cm⁻¹, NH in-plane bending (50), CC stretching (20), CN stretching (18), CO in-plane bending (12)), along with a C-O-C stretching band (around 1120-1000 cm⁻¹).
The FTIR spectral analysis of all asparaginases reveals a remarkable degree of similarity, with a notable proximity in the positions of the centroids of the peak maxima for the Amide I and Amide II bands. These centroids fall within the ranges of 1640–1647 cm⁻¹ for Amide I and 1540–1553 cm⁻¹, which is consistent with expectations for proteins belonging to similar classes. FTIR spectroscopy reveals distinct differences in secondary structure between native and mutant RrA L-asparaginases and commercially available EcA preparations (Medac and Veropharm). The native RrA exhibits Amide I and Amide II mass centers at 1643.2 cm⁻¹ and 1549 cm⁻¹, respectively, indicating a predominantly β-sheet conformation. The RrA mutants (R118H,G120R and A64V,E67K) show slight shifts to lower wavenumbers in the Amide I band (1641.3 cm⁻¹ and 1641 cm⁻¹, respectively), suggesting subtle alterations in secondary structure due to the mutations. The amide I band center of gravity in the FTIR spectrum of EcA-Veropharm is located at 1647 cm⁻¹, which is similar to the native RrA. These FTIR data highlight structural variations that may contribute to differences in enzyme activity and stability among these different L-asparaginase preparations.
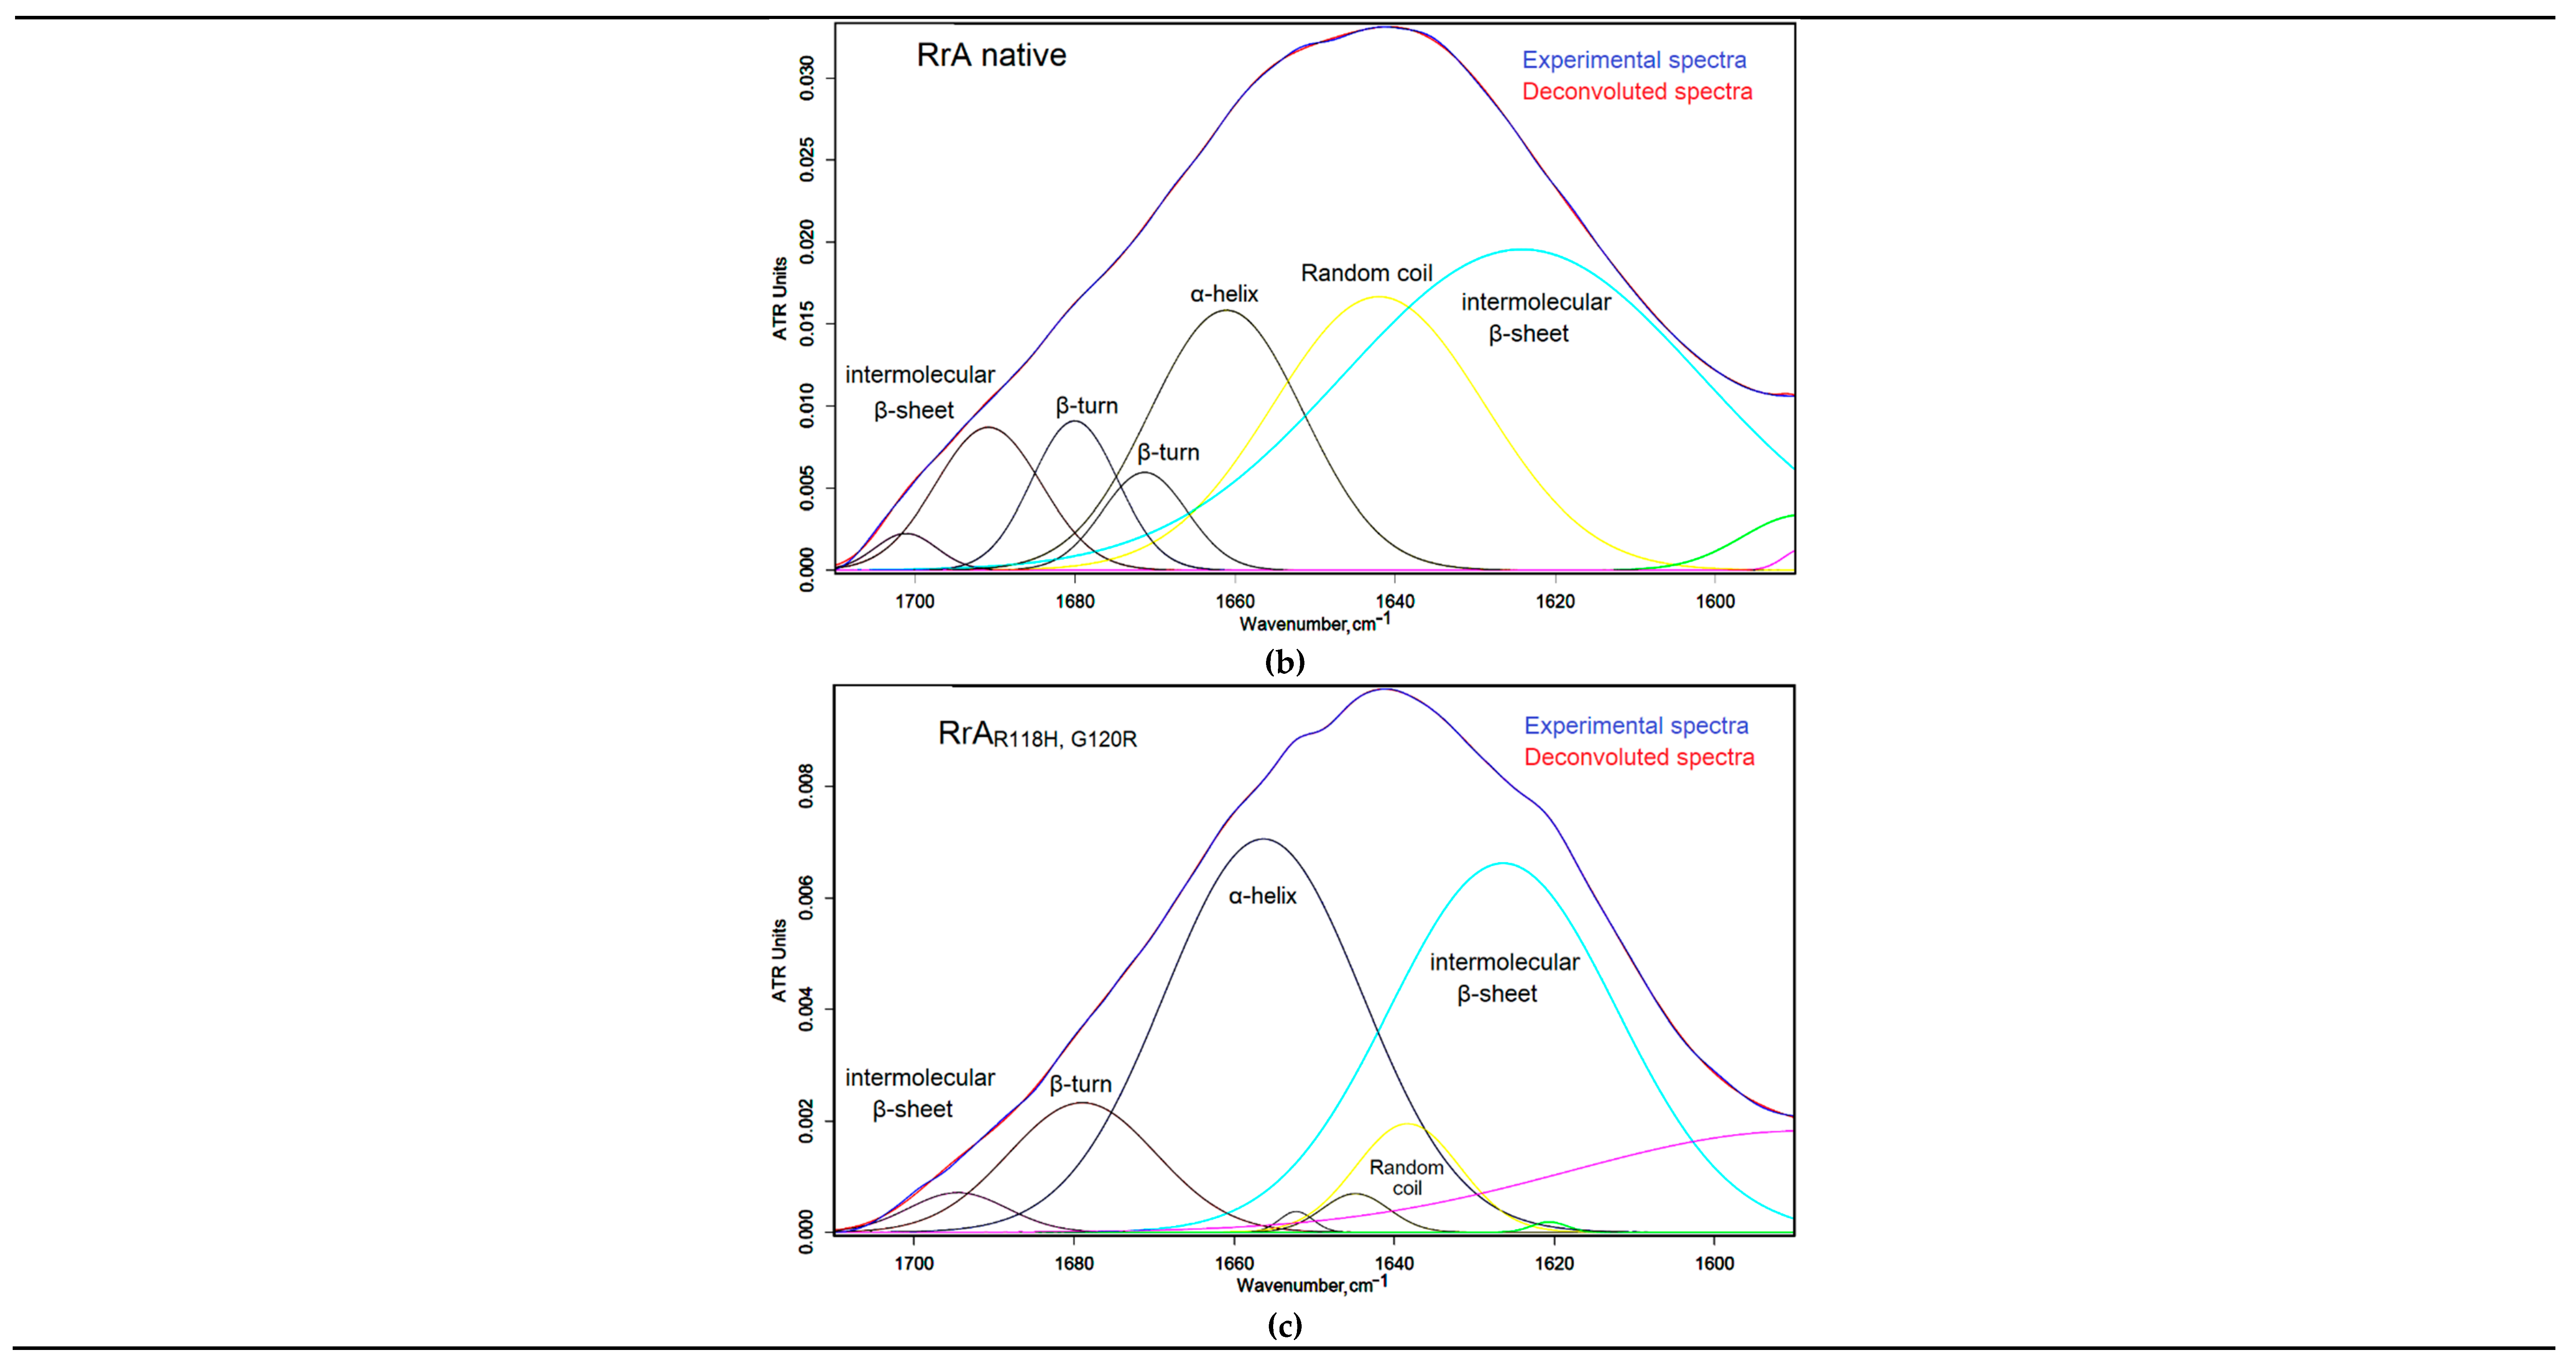
In order to accurately evaluate the secondary structure of asparaginases, we have performed a deconvolution of the amide I bands for a more detailed analysis.
Figure 1b and 1c present Gaussian deconvolution of the Amide I band to determine secondary structure content for RrA and its mutants.
Figure 1d quantitatively shows the secondary structure composition. Compared to native RrA, the mutant forms (RrA
A64V, E67K and RrA
R118H, G120R) show significant differences in secondary structure. Specifically, RrA exhibits a higher proportion of β-turns (30.02%) and random coil (31.24%) compared to its mutant counterparts. The mutants show a substantial increase in β-sheet content, especially RrA
R118H, G120R (28.12%), and a decrease in α-helices. RrA
A64V, E67K demonstrates an intermediate profile.
Based on visual inspection of IR spectra, there is a clear discrepancy between RrA and commercial EcA formulations when compared. EcA-Medac has a higher α-helix content (38.1%) and lower random coil content (21.8%) than RrA. EcA-Veropharm shows the average values of α-helix content (27.5%) and for the remaining components of the secondary structure (random coil and β-sheet) compared to all other asparaginases analyzed. The differences in secondary structure could potentially influence the stability, enzymatic activity, and pharmacokinetic properties of the different asparaginase forms. Our data on the secondary structure of L-asparaginase RrA are in good agreement with the literature data. In particular, there is a similar percentage of α-helices and β-structural elements, which confirms the correctness of the experiments and the comparability of our results with the data obtained by analyzing the CD spectra of the commercial drug EcAII (Kidrolase), where the proportion of α-helices was 32.2%, and β-sheet – 18.3% [
38]; and RrA, where the proportion of α-helices was 36 ± 2%, β-sheet 14 ± 4%, β-turns 16 ± 2% and random coil 30 ± 3% [
39]. This allows us to use the literature data as a basis for interpreting the results obtained and drawing conclusions about the effect of mutations on the structure and, consequently, the function of the enzyme.
3.2. Determination of the Catalytic Parameters of L-Asparaginase RrA and Its Mutant Forms
3.2.1.3. D Structures of RrA and Mutant Forms and How Theoretical Amino Acid Substitutions Affect the Substrate Binding and Specificity of RrA
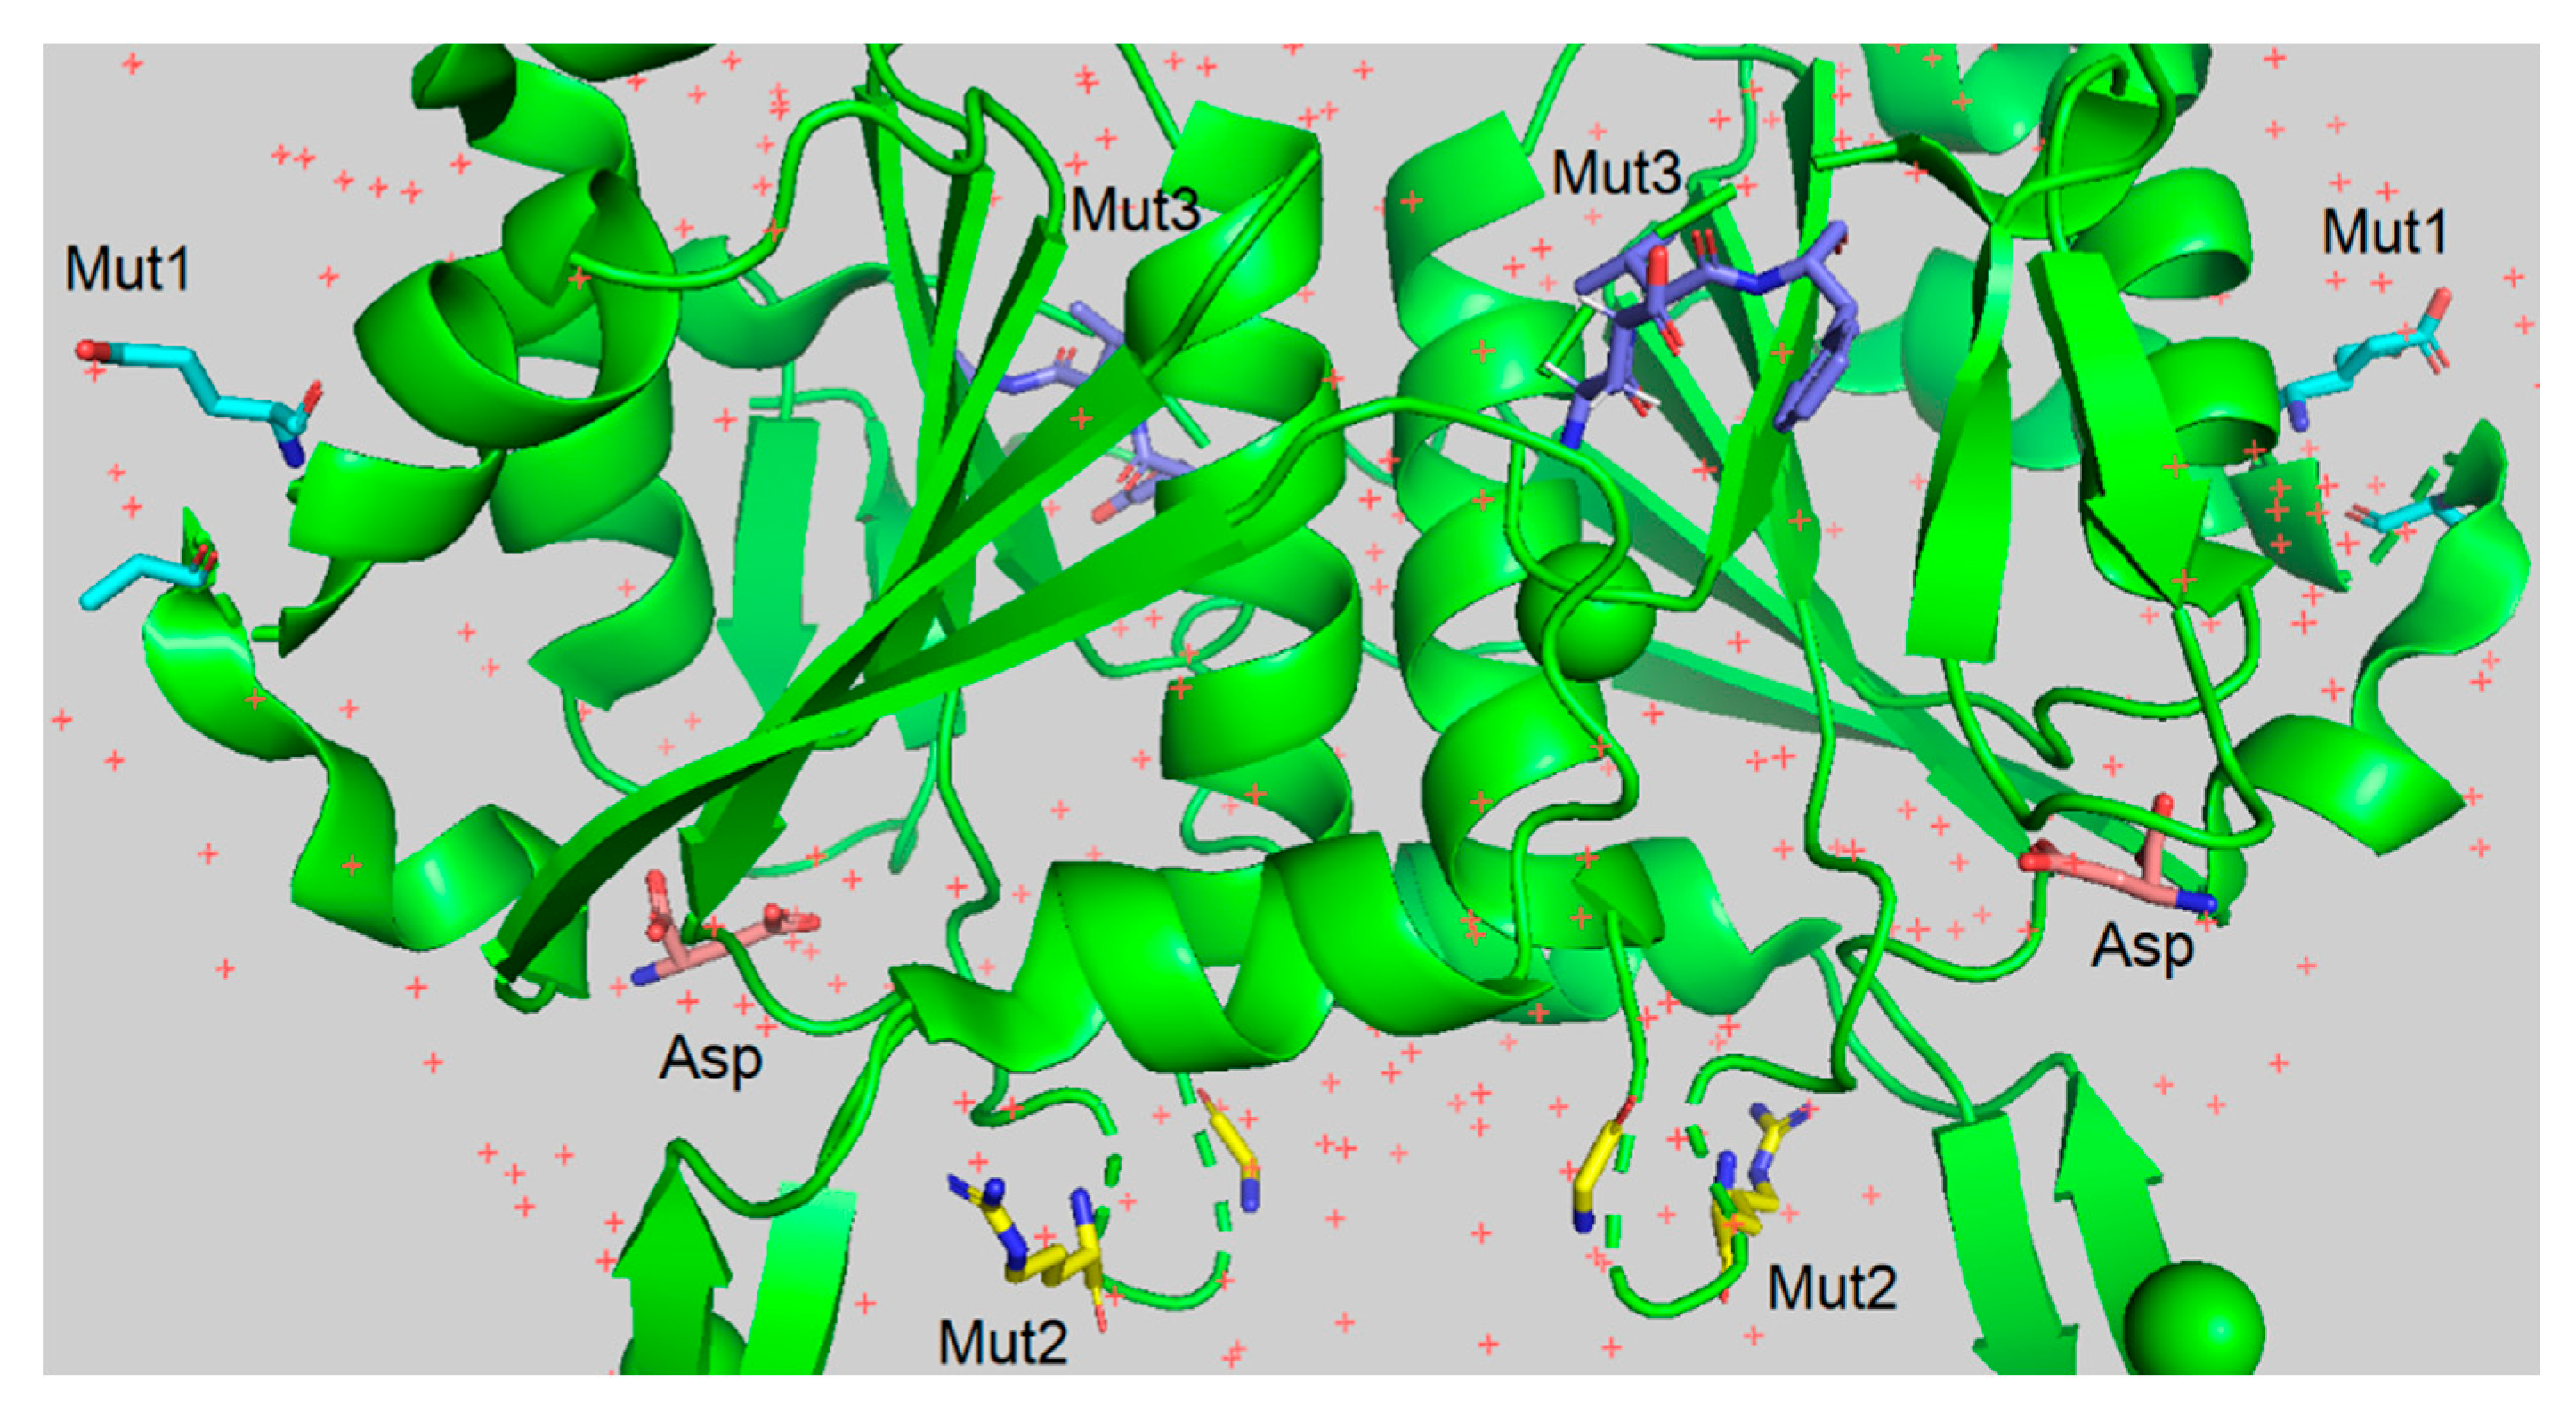
The rationale behind the chosen mutations for RrA L-asparaginase stems from prior research on other RrA mutants, aiming to identify combinations that enhance enzyme functionality. Specifically, the mutations were selected to explore potential improvements in catalytic activity, thermal stability, and antitumor activity. Mut1 (A64V, E67K, shown in blue in
Figure 2), Mut2 (R118H, G120R, highlighted in yellow in
Figure 3) and Mut3 (E149R, V150P, F151T, shown in purple in
Figure 3) builds upon mutations E149R and V150P, known to improve antitumor activity, with the addition of F151T could potentially amplify this effect. The location of these substitutions within the RrA structure is illustrated in
Figure 3, which also depicts the reaction product (Asp) in flesh pink. Moreover, the presence of the N17-terminal amino acid sequence MASMTGGQQMGRGSSRQ of the bacteriophage T7 capsid protein in the RrA-Mut1 and RrA-Mut2 structures can improve biocatalytic properties of mutant RrA forms. We hypothesize that these novel combinations will exhibit synergistic effects, leading to overall improved enzyme properties.
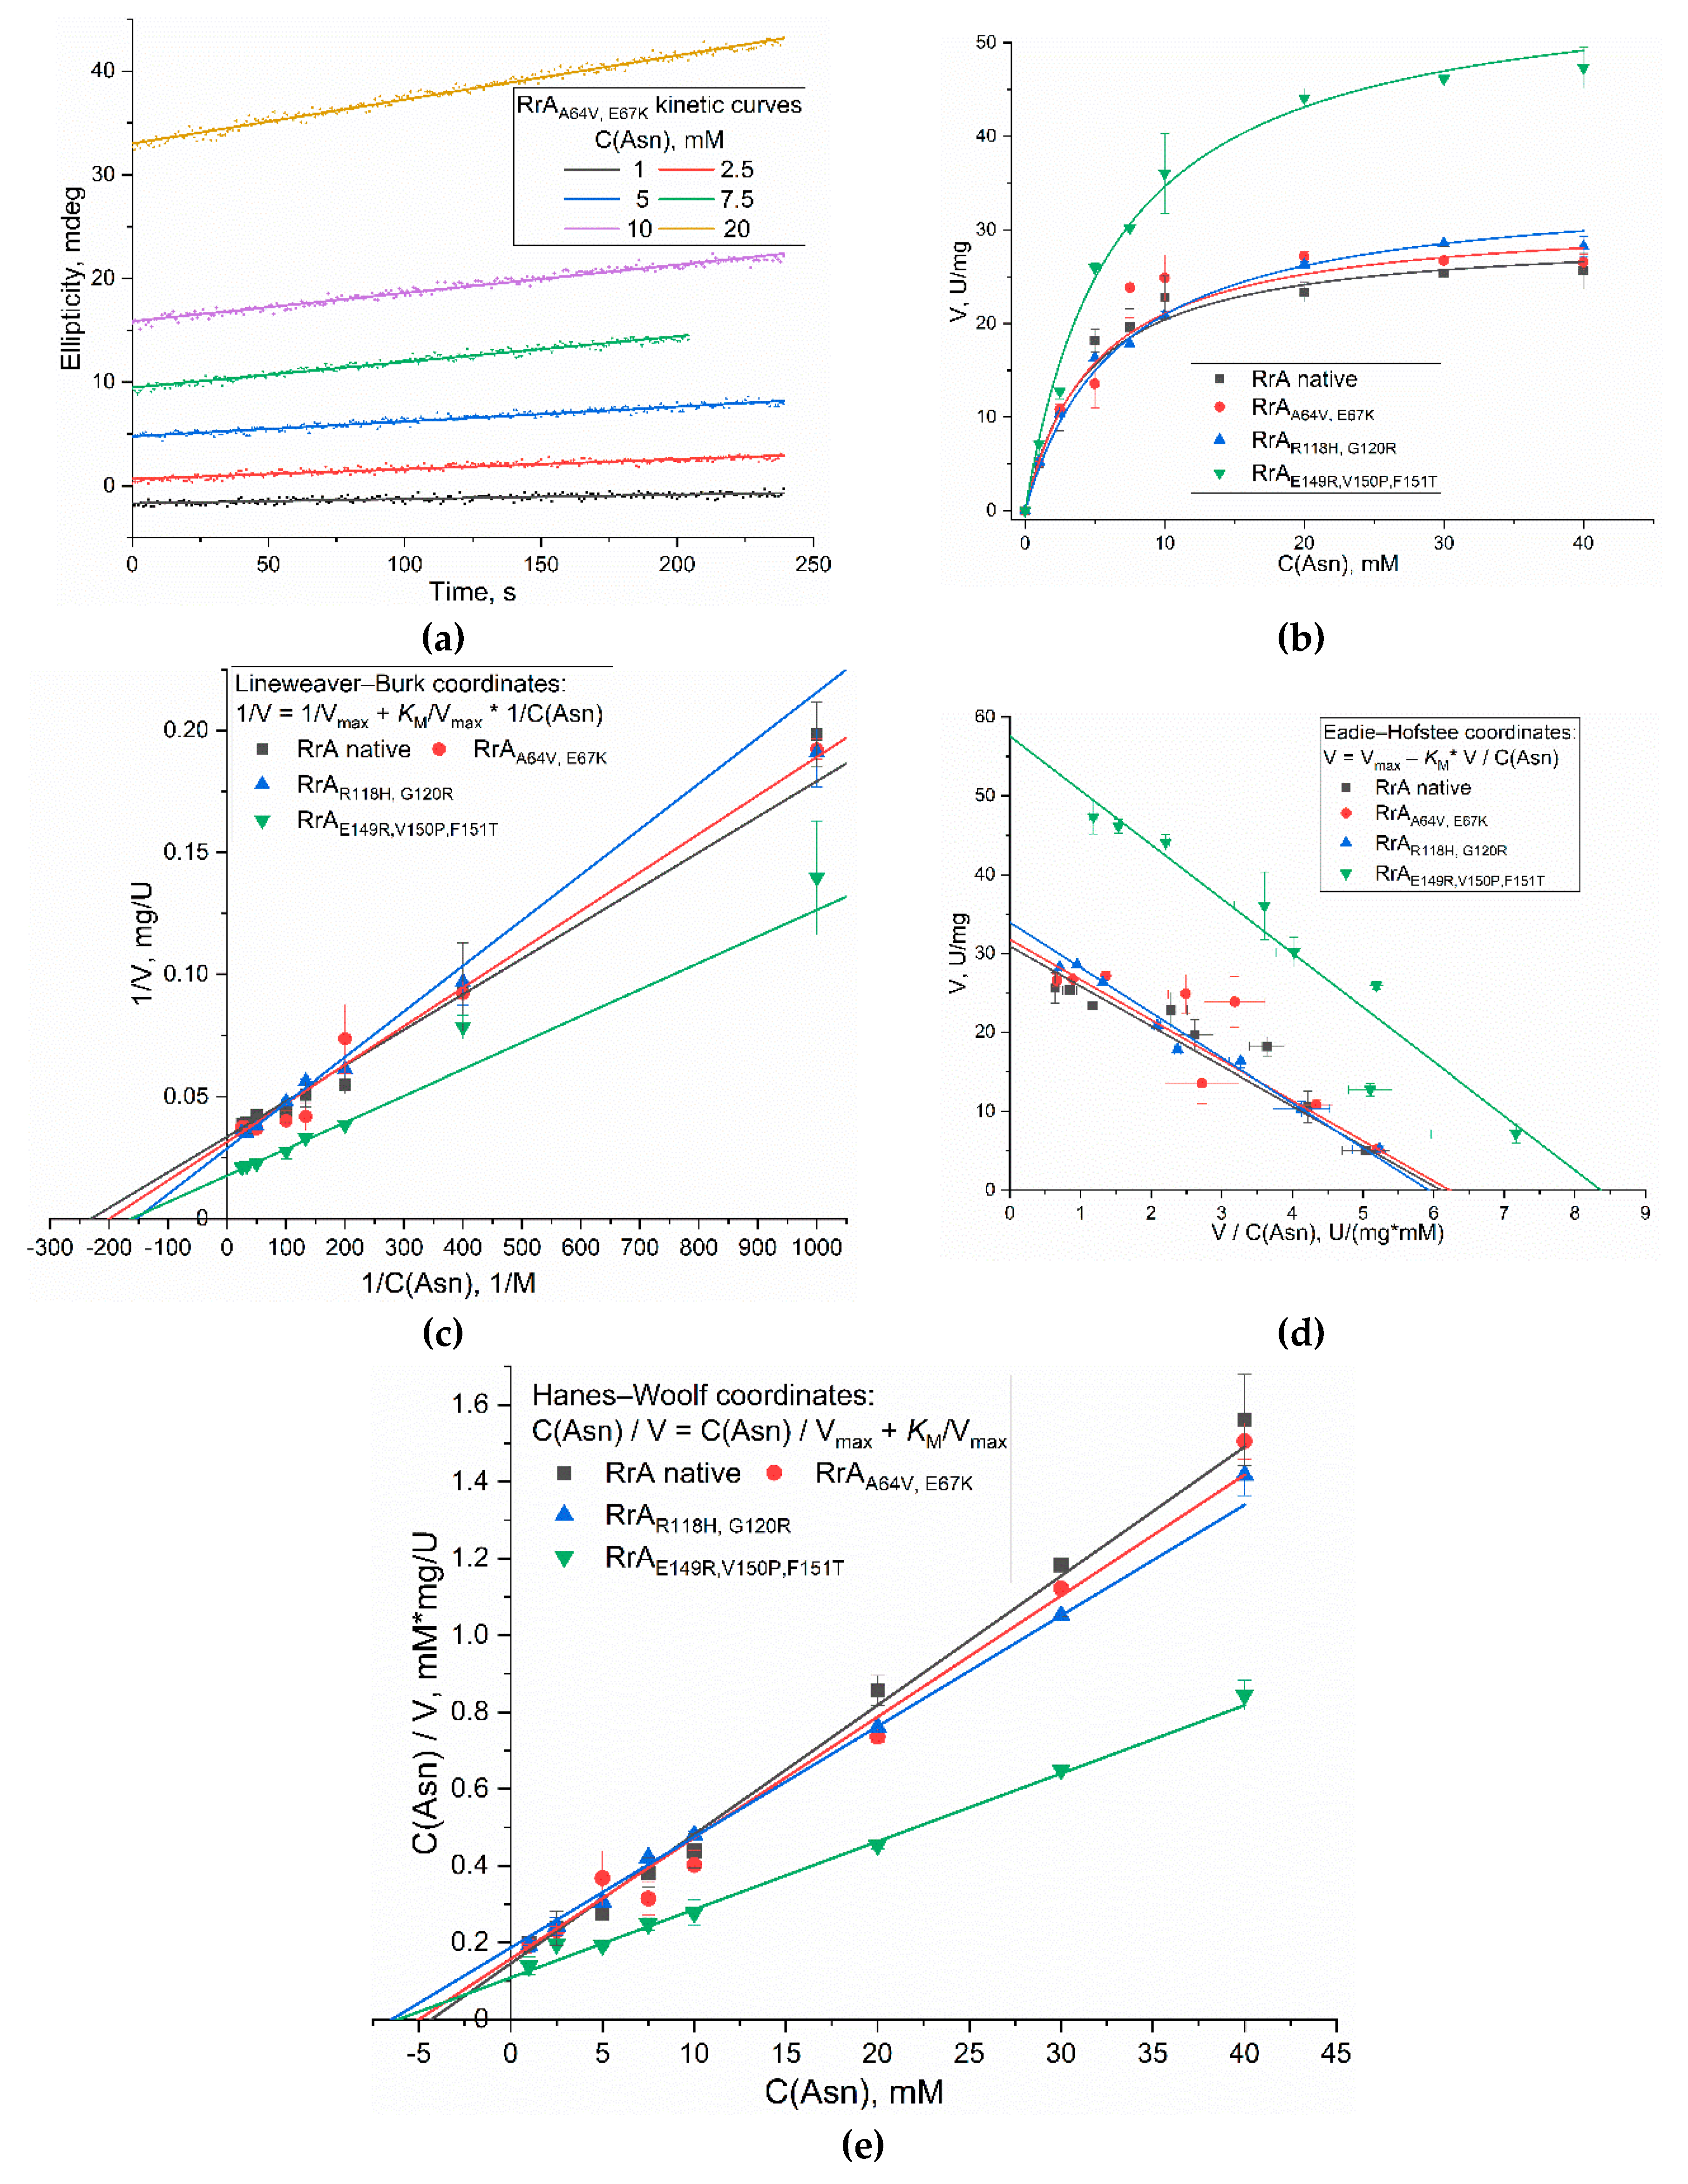
3.2.2. Kinetics Curves
Circular dichroism (CD) spectroscopy offers a unique approach for determining L-asparaginase catalytic parameters by monitoring the enzymatic hydrolysis of L-asparagine. The method exploits the difference in absorbance of right and left circularly polarized light by chiral molecules. L-asparagine and its hydrolytic product, L-aspartic acid, exhibit distinct CD spectra in the far-UV region due to differences in their secondary structures and chromophores. The change in the CD signal at a specific wavelength (210 nm) during the enzymatic reaction directly reflects the decrease in L-asparagine concentration and the concomitant increase in L-aspartic acid concentration. By establishing a calibration curve relating the CD signal to substrate concentration (the difference in the ellipticity of L-asparagine and L-aspartic acids with a concentration at λ = 210 nm Δε = 1.66 mdeg/mM), the reaction kinetics can be accurately determined, enabling the calculation of kinetic parameters such as V
max (maximum reaction velocity) and
KM (Michaelis constant, representing substrate affinity). This provides a continuous, real-time measurement of enzymatic activity, offering advantages over endpoint assays [
40].
Figure 3a exemplifies the kinetic curves of Asn hydrolysis catalyzed by native RrA L-asparaginase and three mutant variants (Mut1: A64V, E67K; Mut2: R118H, G120R; Mut3: E149R, V150P, F151T) obtained using CD spectroscopy method. These curves demonstrate the time-dependent decrease in the CD signal reflecting the conversion of L-asparagine to L-aspartic acid. Subsequently, Michaelis-Menten kinetics scheme were applied to the data to determine the kinetic parameters. Analysis was performed using both nonlinear regression (
Figure 3b) and three linearization methods: Lineweaver-Burk (
Figure 3c), Hanes-Woolf (
Figure 3d), and Eadie-Hofstee (
Figure 3e).
Table 2 presents the kinetic parameters of the
KM and V
max curves for the Asn hydrolysis by L-asparaginase RrA native and mutant forms of L-asparaginase RrA. Briefly, the RrA Mut3 showed the highest V
max (approximately double that of the native enzyme), suggesting a significant increase in catalytic efficiency. The
KM values for all mutants were slightly higher than the native RrA (5-7 mM vs 4-5 mM), indicating a possible slight decrease in substrate affinity.
More detailed, nonlinear Michaelis-Menten regression analysis (
Table 2) revealed a V
max of 29.6 ± 1.4 U/mg for the native RrA enzyme and
KM of 4.5 ± 0.5 mM. The mutant RrA Mut3 (E149R, V150P, F151T) exhibited a significantly increased V
max of 57.2 ± 2.4 U/mg, approximately double that of the native enzyme, indicating a substantial enhancement in catalytic activity. This increase in V
max was accompanied by a slightly elevated
KM of 6.5 ± 0.7 mM, suggesting a modest reduction in substrate affinity. Mutants RrA Mut1 (A64V, E67K) and RrA Mut2 (R118H, G120R) showed less dramatic changes in V
max (31.6 ± 0.7 U/mg and 34.9 ± 0.4 U/mg respectively) with
KM values of 5.0 ± 0.3 mM and 6.7 ± 0.4 mM respectively, indicating smaller alterations in both catalytic efficiency and substrate affinity compared to Mut3. This is due, in particular, to the number of substitutions of amino acid residues, which can be either two or three, as well as the location of these substitutions. Amino acid substitutions near position 150 have a more pronounced effect on the catalytic parameters. All nonlinear regression analyses displayed high R-squared values (≥0.9970), confirming excellent fits to the Michaelis-Menten model.
The Lineweaver-Burk, Hanes-Woolf, and Eadie-Hofstee linearization methods (
Table 2) yielded comparable V
max values to the nonlinear regression. However,
KM values displayed minor variations across these methods, underscoring the inherent limitations and potential biases of linearization approaches. In particular, the Eadie-Hofstee plot for Mut3 showed a substantially lower R-squared value (0.8436), indicating a poor fit, which further supports the superior reliability of nonlinear regression for precise kinetic parameter determination. The consistency observed between the nonlinear regression results and the other methods, however, for the native enzyme and mutants 1 and 2, highlight the overall reliability of the CD-spectroscopy based approach. In summary, this study demonstrates a robust method for determining kinetic parameters of L-asparaginase, and reveals that specific mutations can significantly impact catalytic efficiency. The Mut3 variant shows the most promising results for improved L-asparaginase activity.
3.3. The Thermograms of L-Asparaginases and Parameters of Its Thermodenaturation
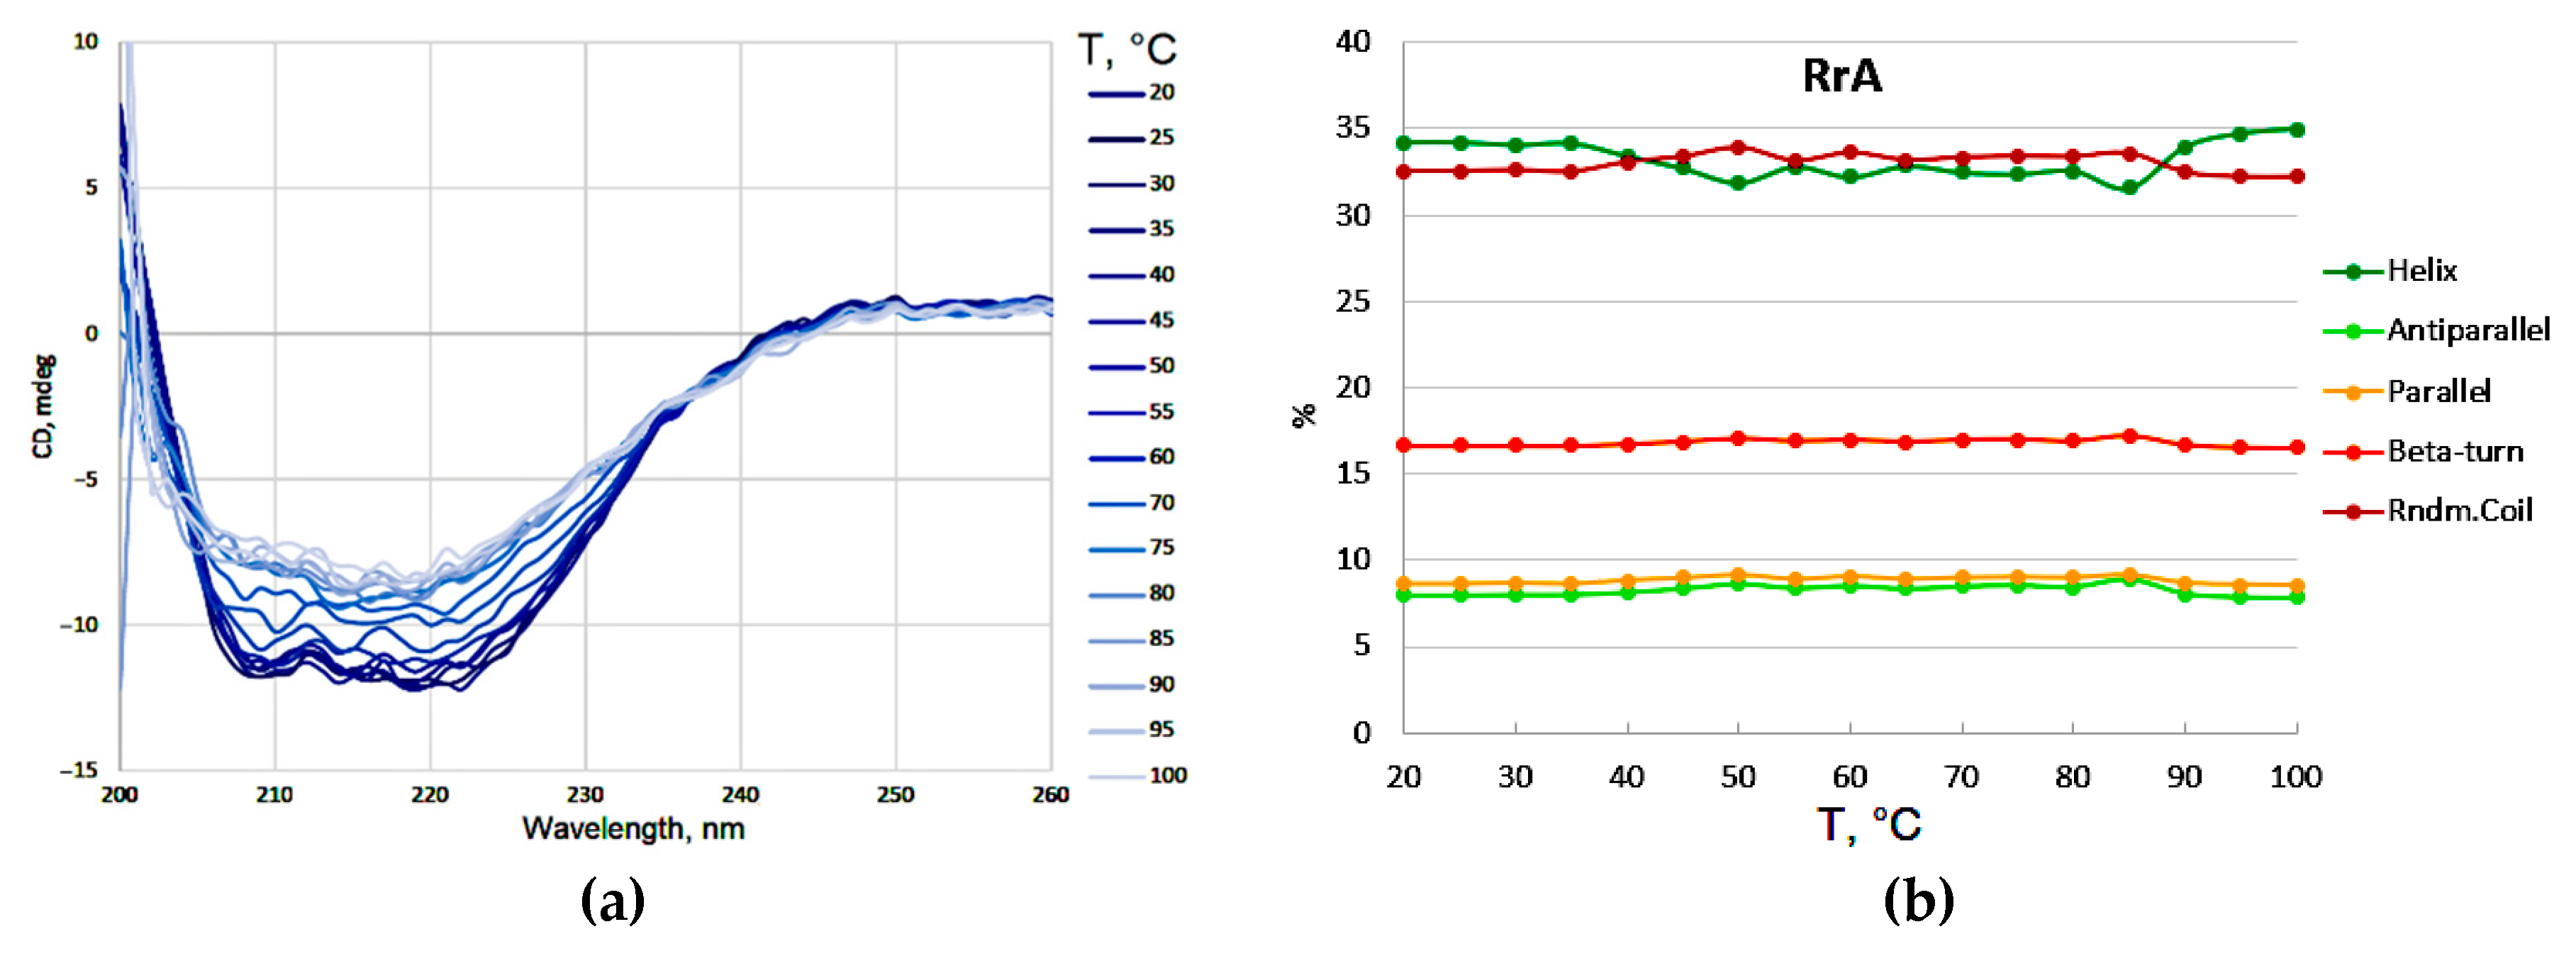
Thermal stability of native RrA L-asparaginase and its mutant forms, alongside commercial EcA preparations (Medac and Veropharm), was assessed using CD spectroscopy. This method effectively monitors protein denaturation by tracking changes in ellipticity as a function of temperature. Protein unfolding, often a cooperative process, can be monitored through CD spectroscopy.
Figure 4a presents the CD spectra, serving as a landmark to identify the wavelength at which the phase transition is most effectively tracked. In this specific case, the wavelength around 220 nm appears to be the most sensitive to changes in protein structure during unfolding and therefore is chosen for monitoring the transition.
To investigate the structural changes during denaturation, CD spectra were recorded at various temperatures during the thermal scans (
Figure 4a). Deconvolution of these spectra (
Figure 4b) allowed for the quantification of secondary structure elements (α-helices, β-sheets, β-turns, and random coil). The deconvolution data confirmed the relatively minor changes in secondary structure content observed upon heating native RrA, supporting the initial observation that the overall secondary structure is largely preserved during thermal denaturation under these conditions. This implies that thermal denaturation of the RrA enzyme involves a more subtle disruption of tertiary structure and/or a change in non-ordered elements rather than complete unfolding. The differences in Tm values and reversibility of denaturation could be explained by specific amino acid changes in the mutants, highlighting the importance of protein engineering in optimizing L-asparaginase properties.
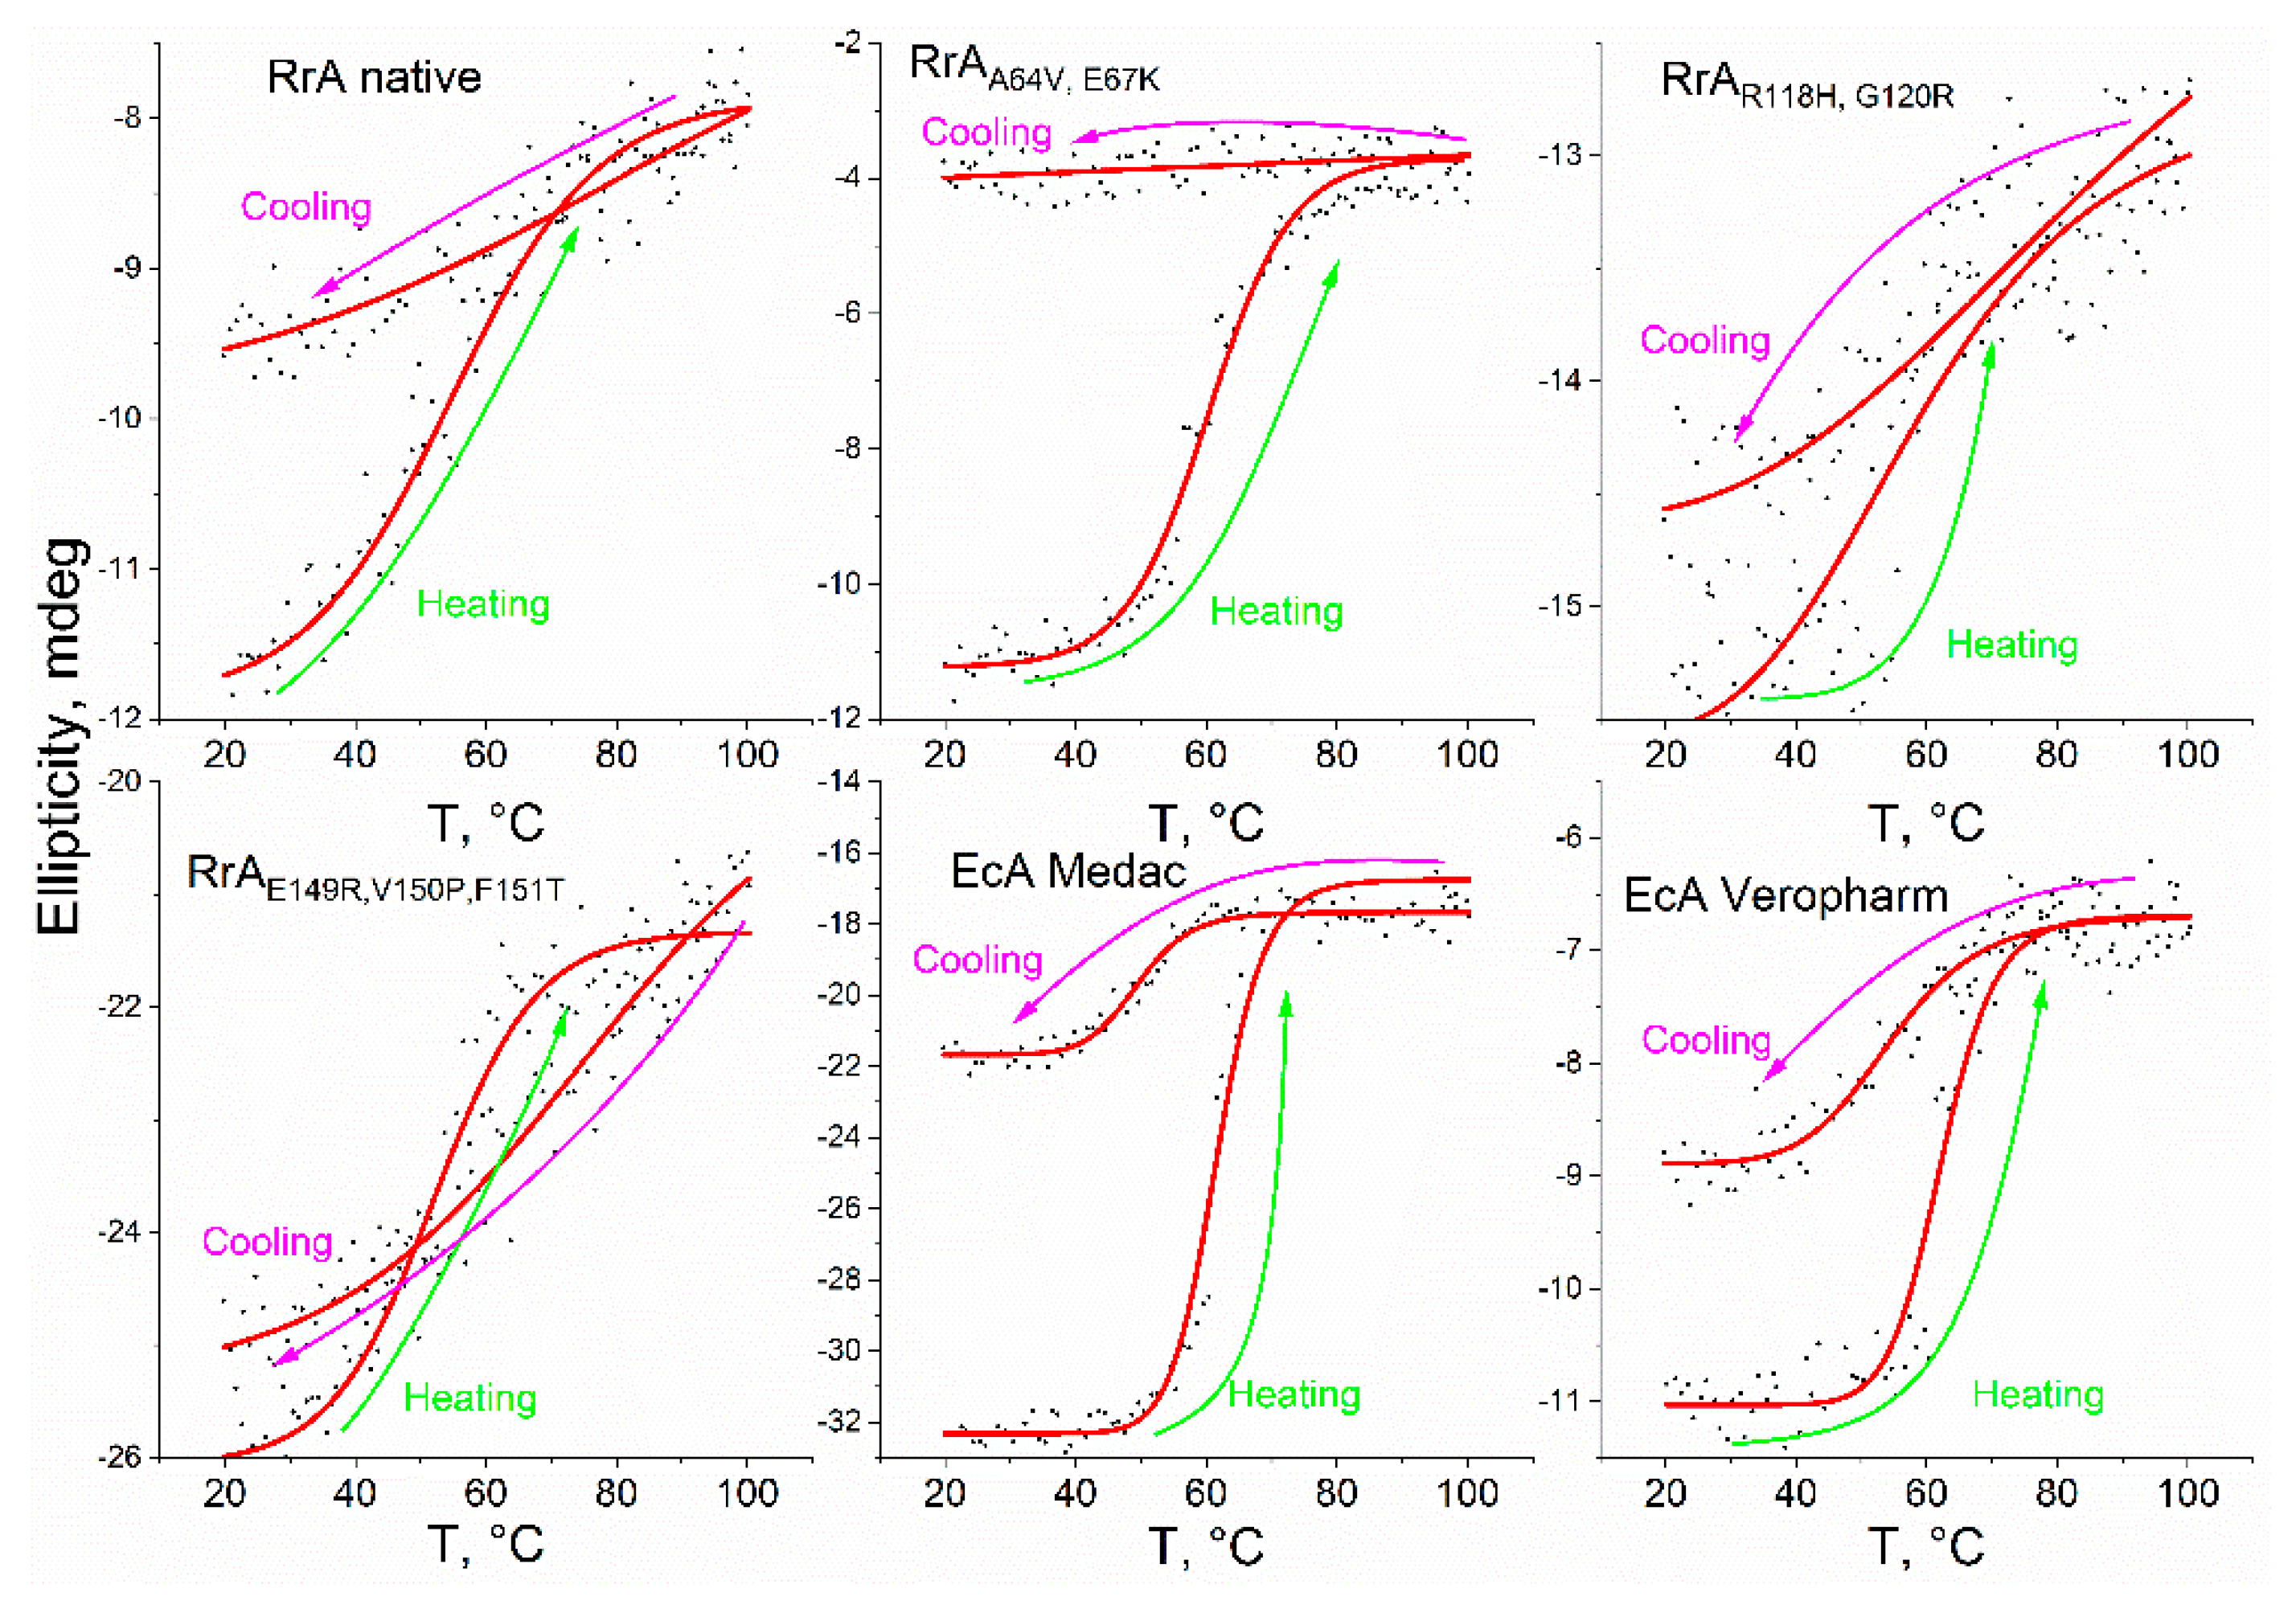
Thermal denaturation profiles (thermograms) were generated by heating samples from 20°C to 100°C at a constant rate of 1°C/min, followed by cooling at the same rate (
Figure 5). The thermograms of native RrA and its mutants revealed a relatively small change in ellipticity during phase transition (Δθ = 1-8 mdeg) upon heating, indicating the retention of a significant proportion of α-helices and β-sheets. Cooling experiments demonstrated reversible denaturation for mutants RrA
E149R,V150P,F151T and RrA
R118H, G120R with near-complete recovery of ellipticity, while native RrA showed partial recovery. In contrast, mutant RrA
A64V, E67K exhibited irreversible denaturation.
In the case of pharmaceutical preparations based on EcA, there is a dramatic change in ellipticity within a narrow temperature range close to 60 °C. For EcA Medac, this change amounts to approximately 24 millidegrees (75% change in signal from initial), while for EcA Veropharm it is about 4 millidegrees (35% change in signal from initial). In the case of EcA drugs, an abrupt phase transition occurs. In the case of native RrA and Mut3, the phase transition is smooth, which makes it possible to restore the initial activity during cooling. For RrA-Mut1 and RrA-Mut2, a sharp phase transition occurs with loss of activity.
The melting temperature (Tm), defined as the temperature at which 50% of the protein is denatured, was estimated by analyzing the CD signal at 220-222 nm, a wavelength range characteristic of α-helices. The Tm values were 54.6 °C for RrA, 52 °C for RrA-Mut3, 59.4 °C for RrA-Mut2, and 60.3 °C for RrA-Mut1, indicating that the last two possess the highest thermal stability. The temperature of the RrA phase transitions is close to the temperature optimum, but at the same time slightly higher - by about 5 degrees. Conversely, both EcA enzymes maintain their stability up to 60 °C, with a melting point estimated at 62 °C, showcasing their remarkable thermal stability. Nonetheless, under physiological conditions, RrA exhibits sufficient performance as well.
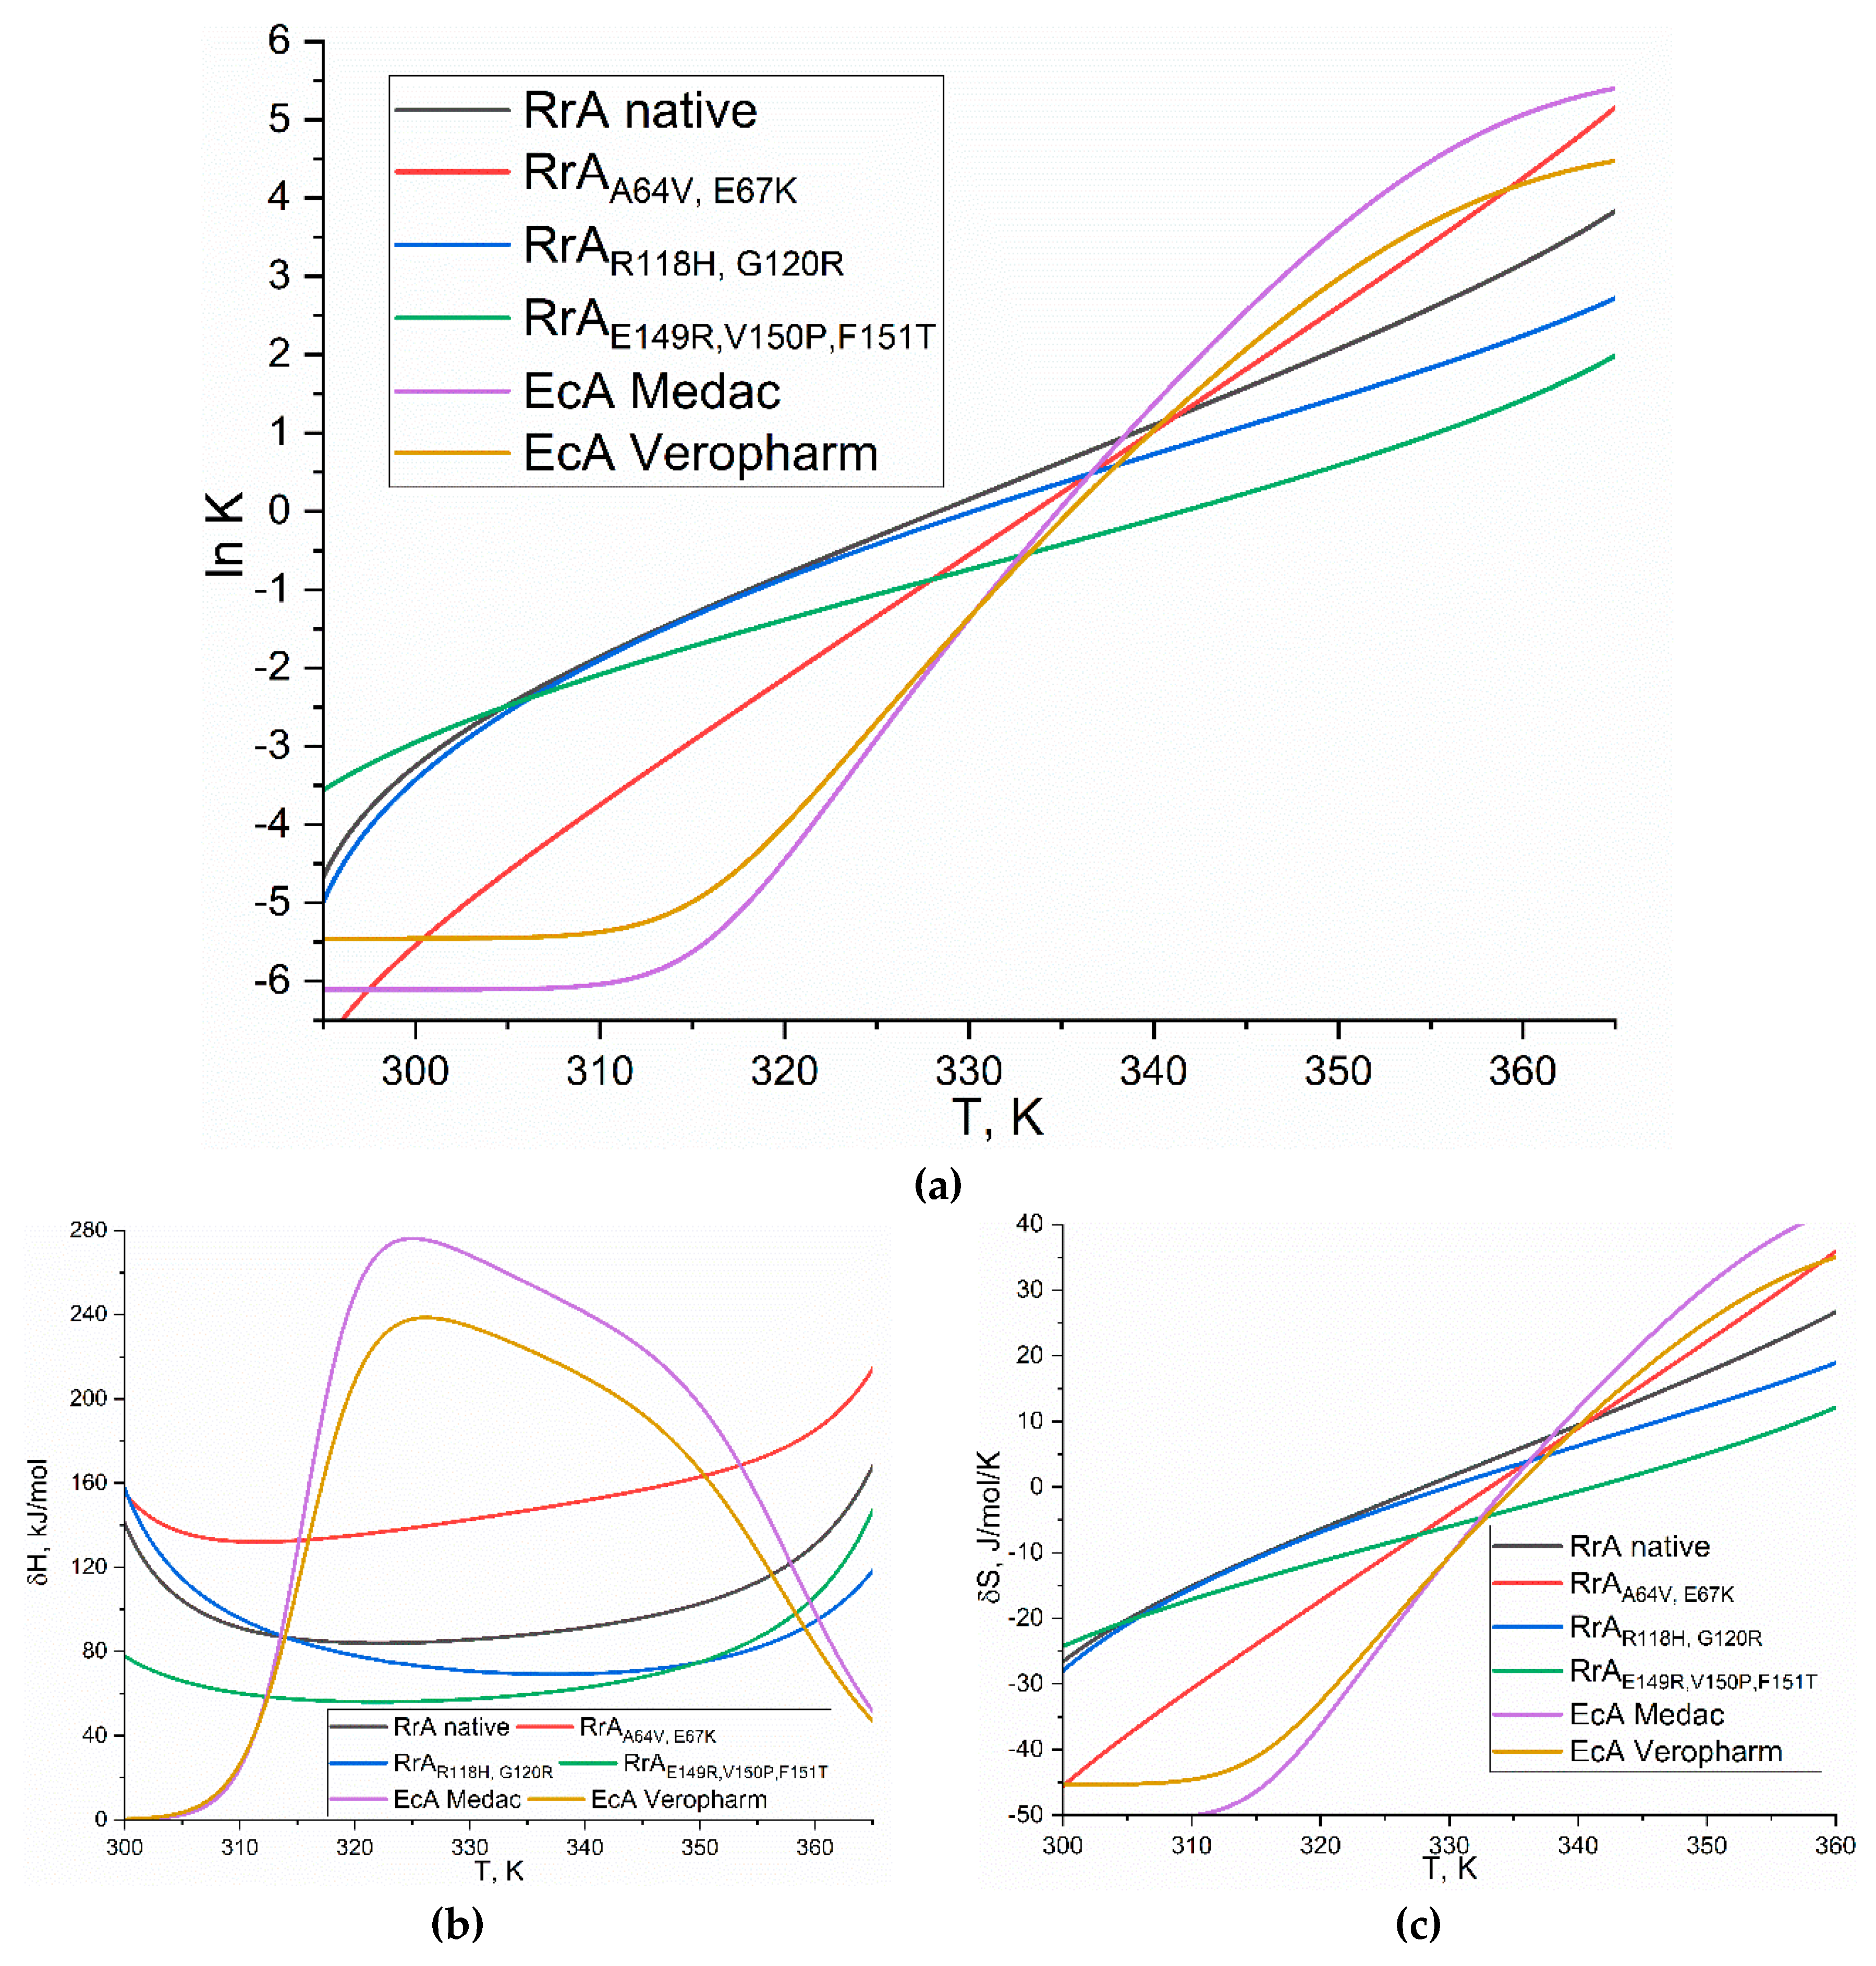
Thermodenaturation process of asparaginases was modeled as a reversible equilibrium between native (N) and denatured (D) states: N <--> D, with an equilibrium constant K = [N]/[D]. The analysis starts with experimental thermograms, which are fitted to an asymmetric sigmoidal function (
Figure 5). Then, Gibbs free energy change (ΔG) was calculated using the following equation: Δ
G = −
RT ln K. The enthalpy change (ΔH) is then determined using the Van't Hoff isobar equation: dlnK/dT = ∆H/(RT
2). Finally, the entropy change (ΔS) was calculated using the equation: ΔS = (ΔH – ΔG)/T.
Figure 6 presents the thermodynamic analysis of L-asparaginase denaturation. Panel (a) shows the dependence of the natural logarithm of the equilibrium constant (ln K) for the native-to-denatured transition on the temperature (T), following the van't Hoff equation. The slope of this plot yields the enthalpy change (ΔH) of denaturation. Panel (b) displays the enthalpy change (ΔH) as a function of temperature, illustrating its temperature dependence. Panel (c) presents the entropy change (ΔS) as a function of temperature, reflecting the change in disorder upon denaturation.
The data in
Table 4 present the thermodynamic parameters (lnK, ΔH, ΔS) for the thermal denaturation of several L-asparaginases at 37°C in PBS (pH 7.4, 0.01 M). Let us delve into the analysis of these findings and juxtapose them with the available literature, with a particular emphasis on elucidating the influence of the N-terminal segment on stability. Native RrA exhibits a lnK of -1.85 and a ΔH of 91.1 kJ/mol. A negative lnK indicates that the native state is favored at 37°C. RrA-Mut1 and RrA-Mut2 – mutants, containing the N-terminal fragment, show comparable or slightly improved lnK values (-1.89 and -2.08, respectively) and ΔH values (97.8 and 60.2 kJ/mol) compared to native RrA. This suggests that the presence of the N-terminal fragment in Mut2 does not significantly enhance thermostability in these specific mutants, but in the case of Mut1, the effect is obvious. The lower ΔH for Mut2 might indicate a less cooperative unfolding process. RrA-Mut3 shows a significantly lower lnK (-6.04) and ΔH (25.1 kJ/mol), indicating increased thermostability. EcA Medac and Veropharm asparaginases also exhibit lower lnK (-5.37) and ΔH (26.6 kJ/mol) values compared to native RrA, suggesting high thermostability.
The literature data for ovalbumin variants show a correlation between higher ΔH values and higher denaturation temperatures, indicating greater thermostability [
37]. The native ovalbumin has a ΔH of 514 kJ/mol and a denaturation temperature of 78.3°C. Modifications like S-ovalbumin formation (thermostable albumin variant) increase both ΔH (602 kJ/mol) and denaturation temperature (86.0°C), enhancing stability. Other modifications, such as methylation and lyophilization, decrease both parameters, leading to lower stability. Thus, comparing the asparaginase data with the ovalbumin data highlights the ΔH values for the asparaginases are generally much lower than those of ovalbumin, suggesting that asparaginases are less thermostable.
Thermodynamic analysis reveals minimal losses in thermostability for the RrA asparaginase mutants, while key improvements are observed in other crucial properties. Mutants 2 and 3 exhibit enhanced reversibility to termodenaturation, vital for protein stability in blood plasma, and improved kinetic parameters. These findings, combined with the retained thermostability, indicate the successful development of enhanced asparaginase variants with improved therapeutic potential.
3.4. Resistance of L-Asparaginases to Trypsinolysis
The susceptibility of L-asparaginases to trypsinolysis is a crucial factor determining their stability and efficacy in vivo, as trypsin-like proteases in the bloodstream can degrade the therapeutic enzyme. Moreover, the resistance of the enzyme to trypsinolysis correlates with its accessibility to plasma proteins of the complement system. This study investigated the trypsinolytic stability of native RrA L-asparaginase and several mutants, comparing them to commercially available EcA preparations (Medac and Veropharm). We hypothesized that trypsinolysis could proceed via two main pathways: denaturation (a first-order process) or aggregation (a second-order or higher-order process). To distinguish between these mechanisms, the kinetic data were analyzed using first-order (ln[A] vs. time) and second-order (1/[A] vs. time) plots. Linearity in a first-order plot would suggest denaturation as the predominant mechanism, while linearity in a second-order plot would indicate aggregation.
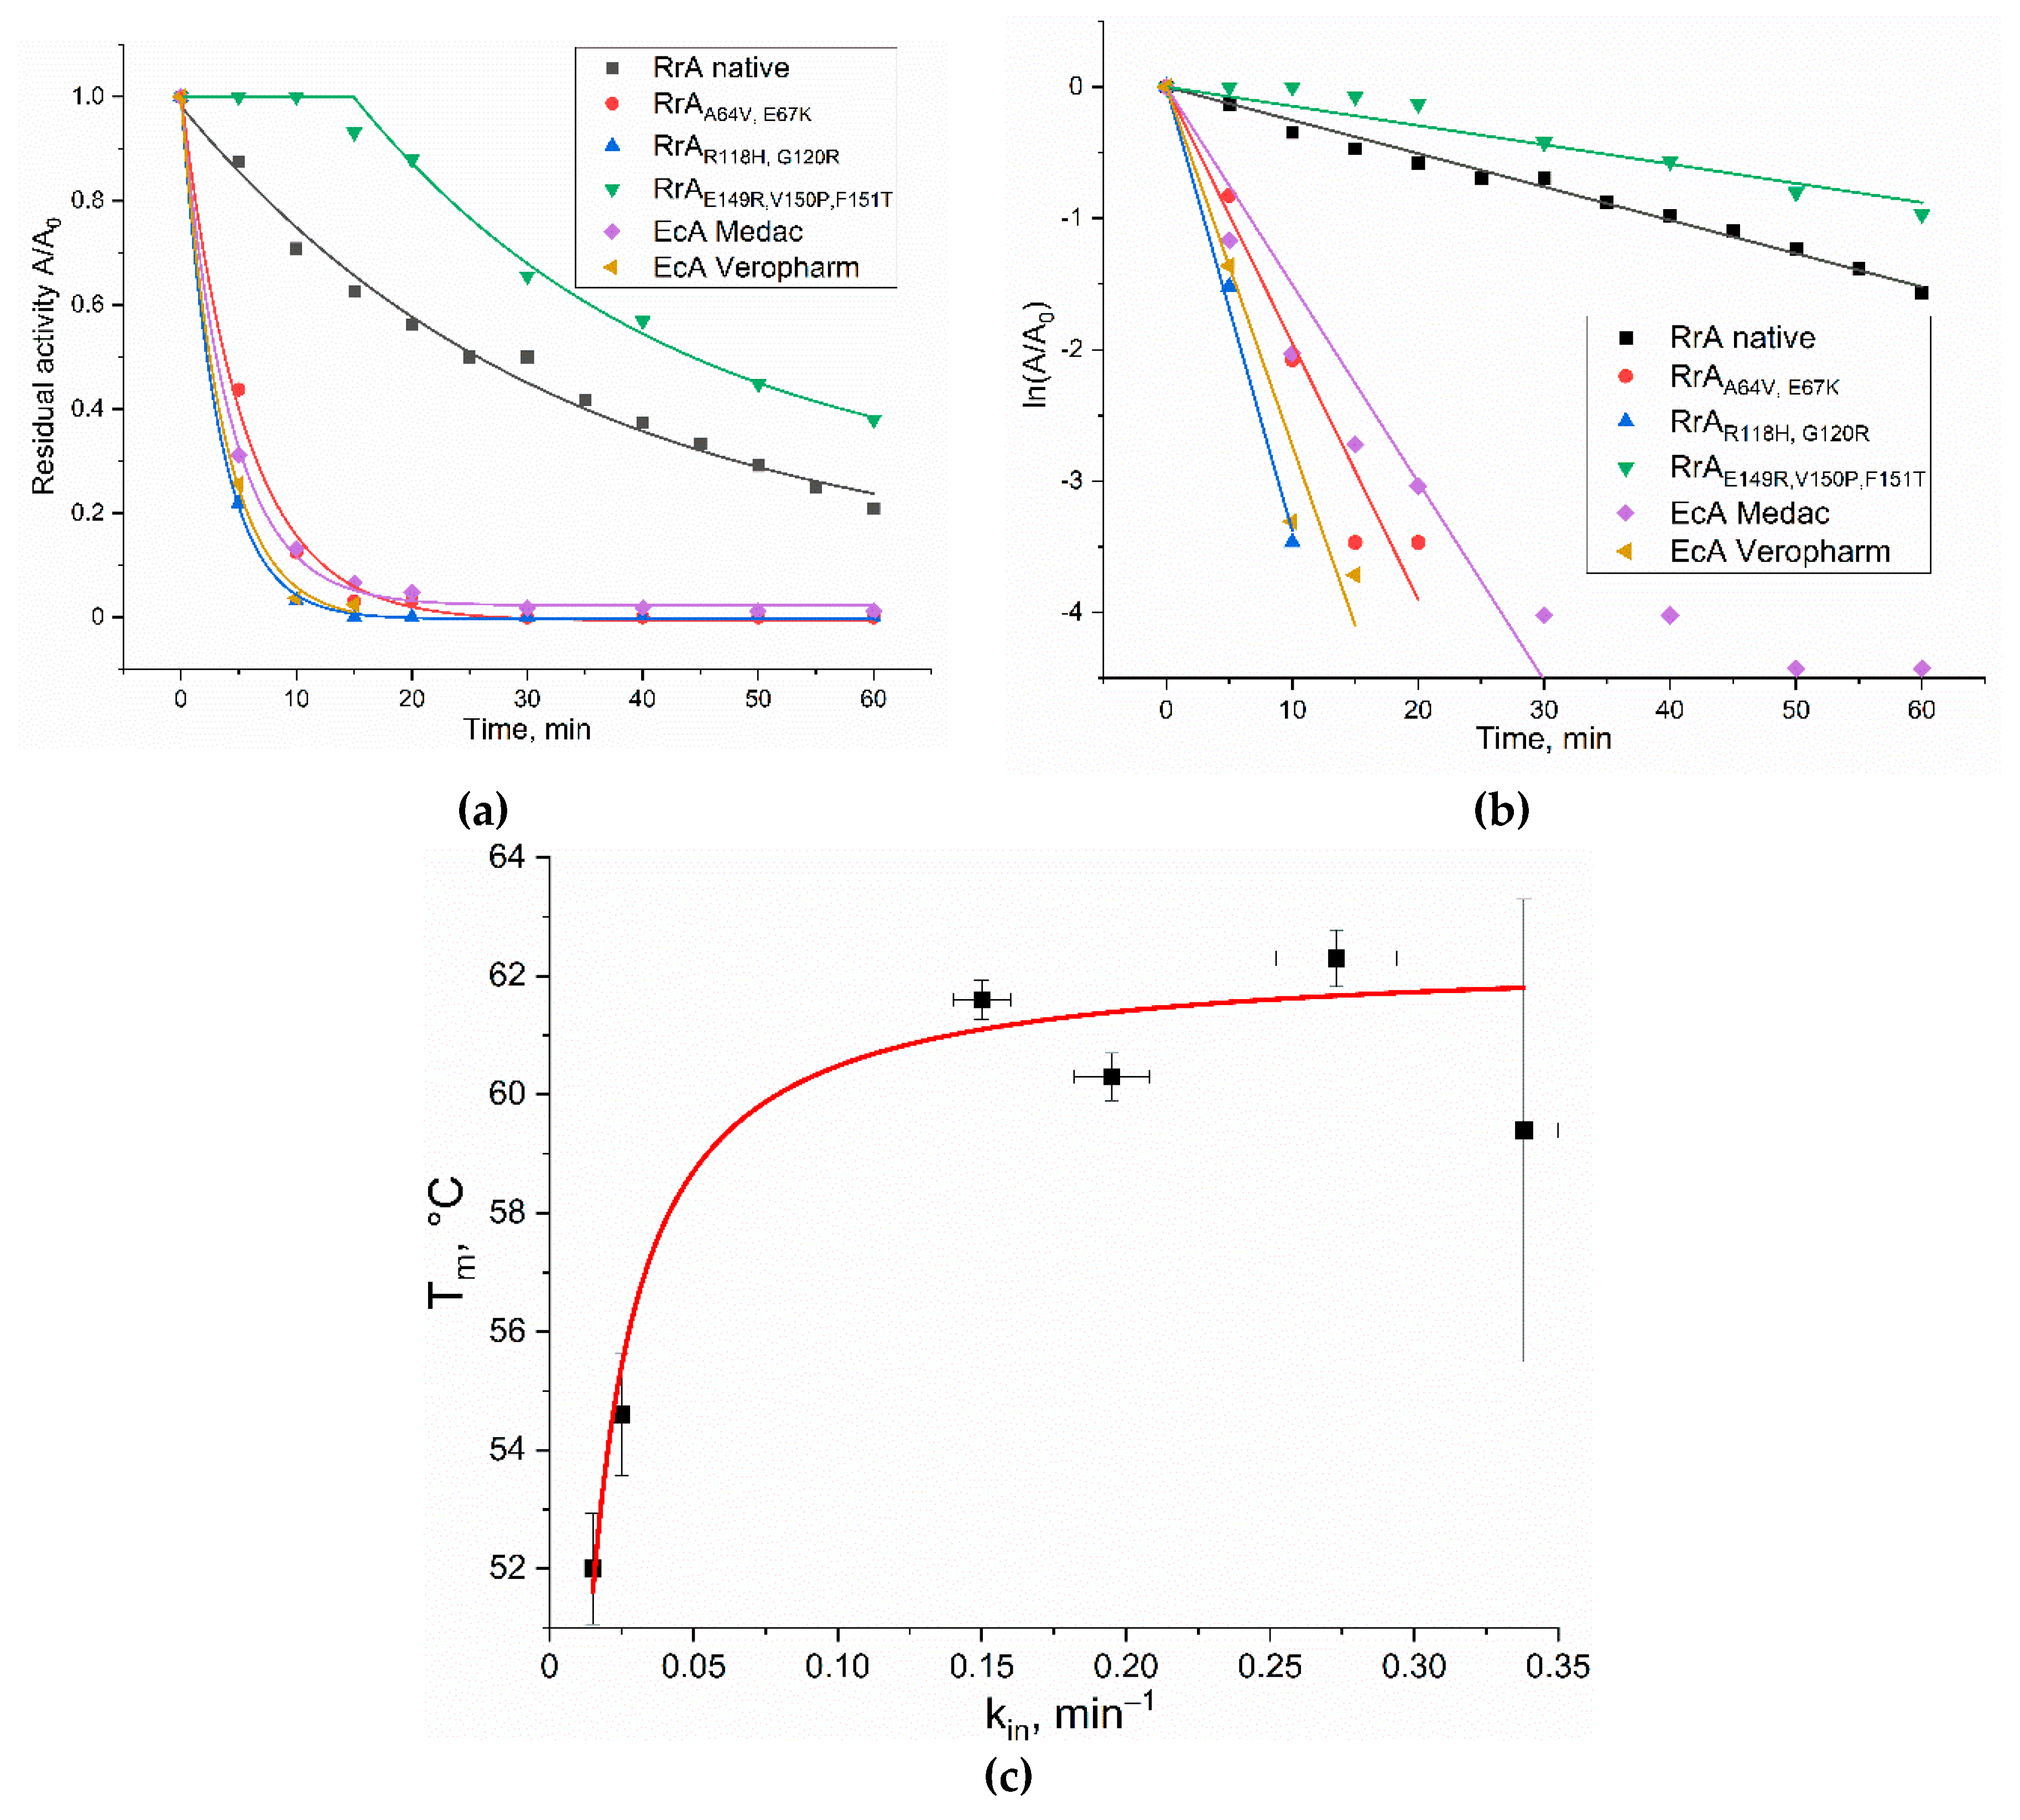
Figure 7a shows the kinetic curves of trypsinolysis. As shown in
Figure 7b, these curves were linearized in first-order coordinates (without aggregation). This indicates that trypsin's action deliberately leads to structural degradation of the L-asparaginase molecule rather than promoting intermolecular aggregation.
The rate of inactivation varied significantly among the different L-asparaginase variants. Native RrA and its mutant RrA-Mut3 exhibited the highest resistance to trypsinolysis, retaining approximately 21% and 45% of their relative activity, respectively, after 60 minutes (
Figure 7). All other L-asparaginases tested showed a more rapid decline in activity, losing over 90% within 15 minutes.
Table 5 presents the inactivation rate constants (k
in) for various L-asparaginases during trypsinolysis.
Table 5.
Constants of L-asparaginase inactivation during trypsinolysis (k
in, min
–1). The conditions are similar to those shown in
Figure 6.
Table 5.
Constants of L-asparaginase inactivation during trypsinolysis (k
in, min
–1). The conditions are similar to those shown in
Figure 6.
| Enzyme |
kin, min–1
|
| RrA native |
0.025 ± 0.001 |
| *RrAA64V,E67K
|
0.195 ± 0.013 |
| *RrAR118H,G120R
|
0.338 ± 0.012 |
| RrAE149R,V150P,F151T
|
0.015 ± 0.001 |
| EcA-Medac |
0.150 ± 0.010 |
| EcA-Veropharm |
0.273 ± 0.021 |
These kin constants quantify the rate at which each enzyme loses activity in the presence of trypsin, reflecting their susceptibility to proteolytic degradation. A lower kin value indicates greater resistance to trypsinolysis. Native RrA displays a relatively low kin (0.025 ± 0.001 min–1), indicating substantial resistance to trypsin. In contrast, mutants RrAA64V,E67K (0.195 ± 0.013 min–1) and RrAR118H,G120R (0.338 ± 0.012 min–1) show considerably higher inactivation rates, suggesting increased susceptibility to trypsin. Interestingly, RrAE149R,V150P,F151T demonstrates surprisingly high stability (0.015 ± 0.001 min–1), even exceeding that of the native enzyme. This highlights the complex interplay of amino acid substitutions and their impact on trypsin accessibility.
The commercial EcA preparations also exhibit relatively high inactivation rates: EcA-Medac (0.150 ± 0.010 min–1) and EcA-Veropharm (0.273 ± 0.021 min–1), comparable to some of the RrA mutants. This suggests that the structural features making these commercial preparations susceptible to trypsinolysis are distinct from those affecting the RrA mutants and native enzyme.
Thus, although N-terminal fragment may contribute to thermostability as suggested by the provided data above, it appears to negatively impact resistance to trypsin degradation in the tested mutants. This highlights the complex interplay between different stability aspects and the importance of considering multiple factors when engineering protein stability. The increased susceptibility of certain mutants to trypsinolysis may be explained by their amino acid sequences. The introduction of positively charged lysine at position 67 (RrA-Mut1) and arginine at position 120 (RrA-Mut2) likely creates additional trypsin binding sites, resulting in faster inactivation. The Mut3 substitutions (E149R, V150P, F151T) in RrA increase trypsinolysis resistance by creating a localized conformational change. The charge alteration (E149R), proline's rigidifying effect (V150P), and hydrophobicity change (F151T) likely combine to either sterically hinder trypsin access or alter the protein surface to make it less favorable for trypsin binding.
Figure 7.
(a) The dependence of the relative activity of the samples during trypsinolysis on time. Conditions of trypsinolysis: [E] = 0.5 mg/mL, trypsin 0.01 mg/mL, pH 7.4, PBS, 37 °C). Subsequent measurement of activity by CD method: ([S] = 20 mM, [E] = 0.05 mg/mL pH 7.4, PBS, 37°C). (b) Linearization of kinetic curves of trypsinolysis in semilogarithmic coordinates. (c) The correlation between the trypsin inactivation rate constant (k
in) and the melting temperature (T
m) for the asparaginases studied (
Table 5).
The data of
Figure 7c shows a positive correlation between the trypsin inactivation rate constant (k
in) and the melting temperature (T
m) for the asparaginases studied (which indicates the effect of protein globule compactness and density on stability to trypsinolysis). Higher T
m (greater thermal stability) unexpectedly correlates with higher k
in (lower trypsin resistance). This suggests that while overall compactness may protect some cleavage sites, it might also create less stable regions, or that strategies to increase T
m inadvertently increase trypsin accessibility.
In conclusion, this trypsinolysis study highlights the significant differences in stability among native RrA, its mutants, and commercial EcA preparations. The enhanced stability and catalytic activity of RrA-Mut3 identify it as a promising candidate for further development as a novel therapeutic agent. The preferential denaturation pathway under the conditions of this experiment supports further investigation into the specific trypsin cleavage sites and their influence on overall protein stability. The contrasting behavior of EcA preparations further emphasizes the importance of considering the influence of specific amino acid sequences and protein structure on the in vivo stability and efficacy of L-asparaginase therapeutics.
3.5. Cytostatic Effect of L-Asparaginases on Cancer Cells
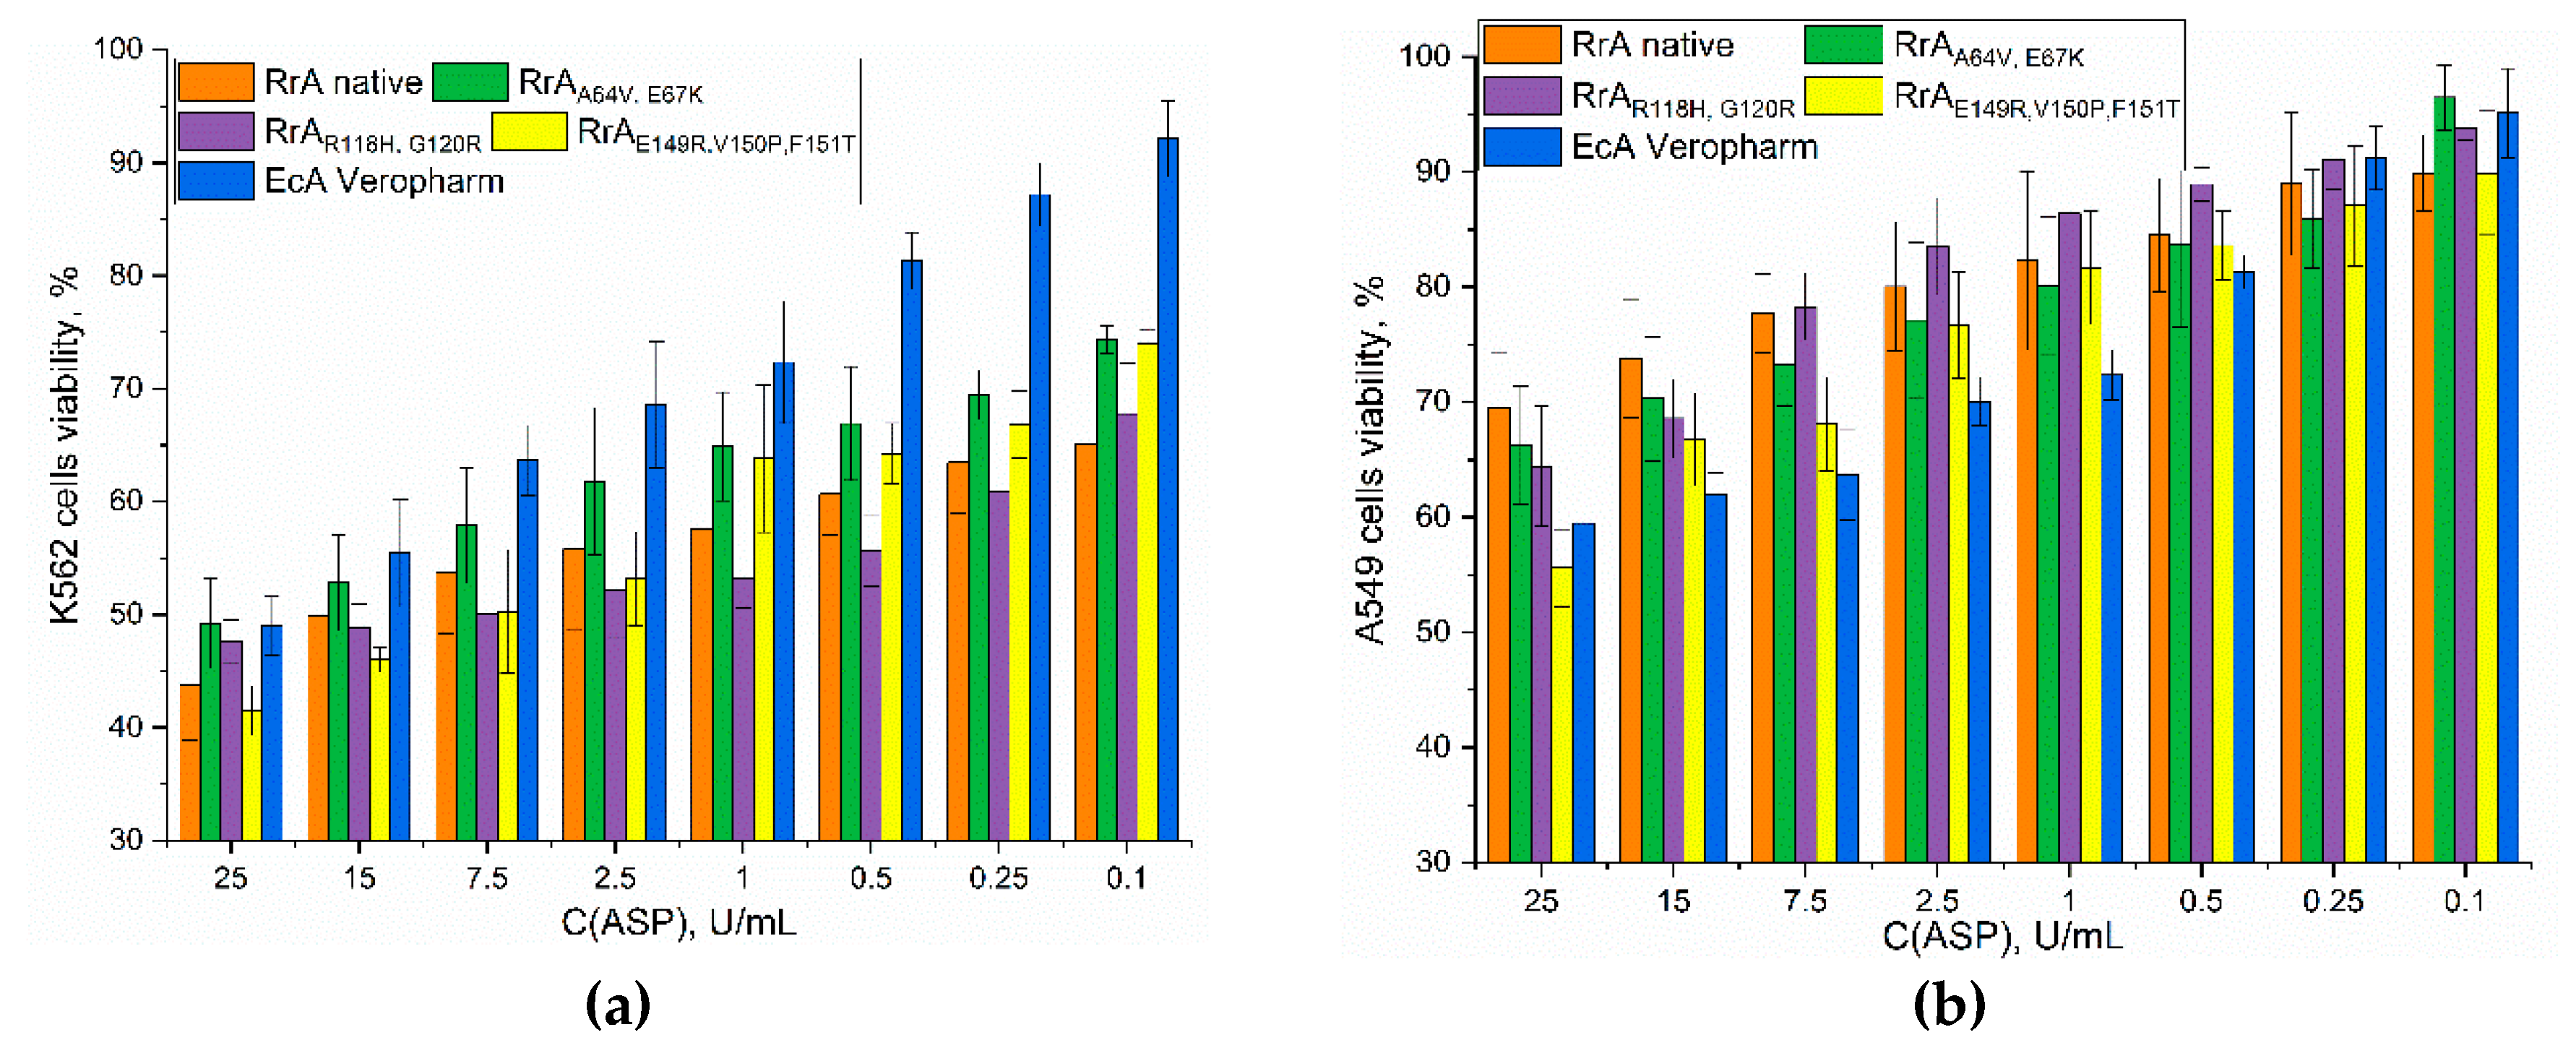
We investigated the cytostatic effects of various L-asparaginases on K562 (leukemic) and A549 (lung cancer) cells using MTT assays (
Figure 8). The results demonstrate the potent anti-proliferative activity of all tested L-asparaginases against K562 cells. This is consistent with the known dependence of many leukemic cells on exogenous asparagine for survival; therefore, L-asparaginase’s depletion of asparagine effectively inhibits their growth. However, the data also reveals significant variation in potency among enzymes.
In stark contrast to the K562 results,
Figure 8b demonstrates a significantly weaker cytotoxic effect of all L-asparaginases on A549 cells. This suggests that A549 cells are less dependent on exogenous asparagine or possess mechanisms to compensate for asparagine depletion. The low sensitivity of A549 cells highlights a key limitation of L-asparaginase-based therapies: their effectiveness is highly dependent on the specific tumor type and its metabolic characteristics. Solid tumors, unlike many leukemias, often exhibit robust asparagine biosynthesis pathways, rendering them less susceptible to L-asparaginase-induced asparagine deprivation.
Table 6 presents the IC
50 values (concentrations required to inhibit cell growth by 50%) for the K562 cells. Native RrA displayed an IC
50 of 15 ± 2 U/mL. Mutant RrA
R118H,G120R showed the strongest cytostatic effect with an IC
50 of 11.5 ± 0.7 U/mL, indicating enhanced anti-leukemic activity compared to the native enzyme. RrA
E149R,V150P,F151T also showed a strong effect with an IC
50 of 10 ± 1 U/mL. RrA
A64V,E67K exhibited a slightly weaker effect (IC50 = 25 ± 3 U/mL). The commercial preparation EcA-Veropharm had an IC
50 of 24 ± 4 U/mL, demonstrating comparable activity to RrA
A64V,E67K but significantly less potency than the most effective mutants. The N-terminal region in mutant forms of RrA does not significantly affect cytostatic activity.
In the context of A549 cell lines, mutant variants exhibit a higher degree of activity compared to native RrA, resulting in a decrease in cell viability ranging from 5% to 15%. Nonetheless, the cytostatic activity in these cells remains inferior to that observed in K562 cell lines.
The literature data shows that the different RrA mutants tested on Jurkat cells largely lacked significant antitumor activity, except for RrA
E149R, V150P, which showed comparable activity to the commercial EcA Medac at dosages of 2 U/mL and above [
33]. The original RrA also showed minimal activity against Jurkat cells. It's important to note that the cell lines used in the two datasets are different (K562 vs. Jurkat), which could influence the observed activity.
In summary, the data highlights the differential sensitivity of various cancer cell lines to L-asparaginase treatment and indicates that RrA mutants can exhibit enhanced anti-leukemic activity compared to both the native enzyme and the commercial EcA preparation. The weaker effect observed on A549 cells underscores the importance of considering cell-line specific responses when evaluating the therapeutic potential of L-asparaginases.
4. Conclusions
This study provides a comprehensive characterization of the conformational stability parameters, enzymatic activity, and anticancer effects of wild-type Rhodospirillum rubrum L-asparaginase (RrA) and three engineered mutants (Mut1: A64V, E67K; Mut2: R118H, G120R; Mut3: E149R, V150P, F151T), comparing them to commercially available EcA preparations. Our findings reveal significant improvements in several key parameters for the engineered RrA variants, suggesting promising avenues for developing improved L-asparaginase-based therapies. Mut1 aimed to enhance catalytic activity at physiological pH. Structural changes of the RrА Mut2 (R118H, G120R) led to the improvement of kinetic parameters and enzyme stabilization due to the elimination of the steric hindrance in the case of this mutation upon oligomerization and increase protein stability. Mut3 focused on increasing antitumor activity. The N-terminal addition in Mut1 and Mut2 aimed for further biocatalytic improvements. These mutations were rationally selected based on previous research to potentially create synergistic effects leading to a superior enzyme.
Native RrA exhibited a Vmax of 30 U/mg and a KM of 4.5 ± 0.5 mM. Mut3 showed a remarkable increase in Vmax to 57 U/mg, almost doubling its catalytic efficiency, while Mut2 demonstrated more moderate improvements. Importantly, all mutants showed increased KM values (by 1-2 mM), suggesting alterations in substrate binding affinity. However, the enhanced velocity in Mut3 outweighs this effect, leading to overall superior catalytic performance.
Thermal stability analysis revealed a critical difference between RrA and commercial EcA. Mut3 demonstrated markedly enhanced stability against trypsinolysis via a localized conformational change, retaining 45% of its activity after 30 minutes of exposure, significantly higher than native RrA (21%) and commercial EcAs (less than 10% remaining). Charge alteration, proline-induced rigidity, and hydrophobicity changes likely hinder trypsin access or reduce favorable binding.
Cytostatic activity against K562 leukemia cells confirmed the potential of the engineered RrA. Mut3 showed the most significant improvement, with an IC50 of 10 U/mL, compared to native RrA (15 U/mL) and EcA-Veropharm (24 U/mL). Mut2 also demonstrated enhanced activity (IC50 of 11.5 U/mL). These results suggest that the modifications in Mut2 (especially the G120R substitution) and Mut3 (V150P, in conjunction with E149R and F151T) led to a more effective interaction with cellular targets within K562 cells. A549 lung carcinoma cells showed consistently low sensitivity to all L-asparaginases, highlighting the specific effectiveness of this enzyme against leukemia cells.
The enhanced catalytic efficiency, improved stability, and superior anticancer activity of Mut2 and, especially, Mut3 establish them as promising candidates for next-generation L-asparaginase-based therapies, opening avenues for more effective and less toxic treatments for leukemia.
Author Contributions
Conceptualization, E.V.K., D.D.Z. and I.D.Z.; methodology, I.D.Z., A.N.S. and E.V.K.; formal analysis, I.D.Z.; investigation, I.D.Z., A.N.S. and E.V.K.; data curation, I.D.Z. M.V.P. and S.S.A.; writing—original draft preparation, I.D.Z.; writing—review and editing, E.V.K., D.D.Z.; project supervision, E.V.K.; funding acquisition, D.D.Z., E.V.K. All authors have read and agreed to the published version of the manuscript.
Funding
The work was done in the framework of the Russian Federation fundamental research program for the long-term period (2021−2030) (№ 122022800499-5).
Institutional Review Board Statement
Raji cell lines were obtained from Lomonosov Moscow State University Depository of Live Systems Collection (Moscow, Russia). The animal study protocol was approved by the Bioethics Committee at the Lomonosov Moscow State University no:110, 27 February 2020.
Acknowledgments
The work was performed using the equipment FTIR microscope MICRAN-3 (Simex, Novosibirsk, Russia), FTIR spectrometer Bruker Tensor 27 (Bruker, Ettlingen, Germany), Jasco J-815 CD Spectrometer (JASCO, Tokyo, Japan), AFM microscope NTEGRA II (NT-MDT Spectrum Instruments, Moscow, Russia) of the program of Moscow State University development. We gratefully acknowledge Dmitry I. Malikov and Natalia V. Dobryakova for the contributions to this work, specifically for performing the circular dichroism (CD) spectroscopy experiments.
Conflicts of Interest
The authors declare no conflicts of interest.
Abbreviations
The following abbreviations are used in this manuscript:
| ASP |
L-asparaginase |
| CD |
Circular dichroism |
| EcA |
Escherichia coli L-asparaginase |
| FTIR |
Fourier-transform infrared |
| RrA |
Rhodospirillum rubrum L-asparaginase |
| Vmax
|
Maximum reaction rate |
References
- Burke, M.J.; Zalewska-Szewczyk, B. Hypersensitivity Reactions to Asparaginase Therapy in Acute Lymphoblastic Leukemia: Immunology and Clinical Consequences. Futur. Oncol. 2022, 18, 1285–1299. [CrossRef]
- Maese, L.; Rau, R.E. Current Use of Asparaginase in Acute Lymphoblastic Leukemia/Lymphoblastic Lymphoma. Front. Pediatr. 2022, 10, 1–13. [CrossRef]
- V.S. Pokrovskii, M.V. Komarova, S.S.A.; M.V. Pokrovskaya, M.S. Kalish’yan, S.S.K.; Treshchalina, E.M. Рoль The Role Of Enzymatic Activity in The Realization Of The Antiproliferative Effect Of L-Asparaginases. Klin. Onkogematol. 2015, 8, 120–128.
- Weber, G.; Buhren, B.; Schrumpf, H.; Wohlrab, J.; Gerber, P. Therapeutic Enzymes: Function and Clinical Implications.; 2019; Vol. 1148; ISBN 978-981-13-7708-2.
- Emadi, A.; Zokaee, H.; Sausville, E. a Asparaginase in the Treatment of Non-ALL Hematologic Malignancies. Cancer Chemother. Pharmacol. 2014, 73, 875–883. [CrossRef]
- Juluri, K.R.; Siu, C.; Cassaday, R.D. Asparaginase in the Treatment of Acute Lymphoblastic Leukemia in Adults: Current Evidence and Place in Therapy. Blood Lymphat. Cancer Targets Ther. 2022, 12, 55–79. [CrossRef]
- Appel, I.M.; Hop, W.C.J.; Pieters, R. Changes in Hypercoagulability by Asparaginase: A Randomized Study between Two Asparaginases. Blood Coagul. Fibrinolysis 2006, 17, 139–146. [CrossRef]
- Lorenzi, P.L.; Llamas, J.; Gunsior, M.; Ozbun, L.; Reinhold, W.C.; Varma, S.; Ji, H.; Kim, H.; Hutchinson, A.A.; Kohn, E.C.; et al. Asparagine Synthetase Is a Predictive Biomarker of L-Asparaginase Activity in Ovarian Cancer Cell Lines. Mol. Cancer Ther. 2008, 7, 3123–3128. [CrossRef]
- Lomelino, C.L.; Andring, J.T.; McKenna, R.; Kilberg, M.S. Asparagine Synthetase: Function, Structure, and Role in Disease. J. Biol. Chem. 2017, 292, 19952–19958. [CrossRef]
- Hashimoto, K.E.N.; Suzuki, F.; Sakagami, H. Declined Asparagine Synthetase MRNA Expression and Enhanced Sensitivity to Asparaginase in HL-60 Cells Committed to Monocytic Differentiation. Anticancer Res. 2009, 29, 1303–1308.
- Ren, Y.; Roy, S.; Ding, Y.; Iqbal, J.; Broome, J.D. Methylation of the Asparagine Synthetase Promoter in Human Leukemic Cell Lines Is Associated with a Specific Methyl Binding Protein. Oncogene 2004, 23, 3953–3961. [CrossRef]
- Richards, N.G.J.; Kilberg, M.S. Asparagine Synthetase Chemotherapy. Annu. Rev. Biochem. 2006, 76, 629–654.
- Ikeuchi, H.; Ahn, Y.-M.; Otokawa, T.; Watanabe, B.; Hegazy, L.; Hiratake, J.; Richards, N.G.J. A Sulfoximine-Based Inhibitor of Human Asparagine Synthetase Kills L-Asparaginase-Resistant Leukemia Cells. Bioorg. Med. Chem. 2012, 20, 5915–5927.
- Chiu, M.; Taurino, G.; Bianchi, M.G.; Kilberg, M.S.; Bussolati, O. Asparagine Synthetase in Cancer: Beyond Acute Lymphoblastic Leukemia. Front. Oncol. 2020, 9, 1–10. [CrossRef]
- Hutson, R.G.; Kitoh, T.; Moraga Amador, D.A.; Cosic, S.; Schuster, S.M.; Kilberg, M.S. Amino Acid Control of Asparagine Synthetase: Relation to Asparaginase Resistance in Human Leukemia Cells. Am. J. Physiol. - Cell Physiol. 1997, 272. [CrossRef]
- Balasubramanian, M.N.; Butterworth, E. a; Kilberg, M.S. Asparagine Synthetase: Regulation by Cell Stress and Involvement in Tumor Biology. Am. J. Physiol. Endocrinol. Metab. 2013, 304, 789–799. [CrossRef]
- Haskell, C.M.; Canellos, G.P. L-Asparaginase Resistance in Human Leukemia--Asparagine Synthetase. Biochem. Pharmacol. 1969, 18, 2578–2580.
- Gutierrez, J. a; Pan, Y.-X.; Koroniak, L.; Hiratake, J.; Kilberg, M.S.; Richards, N.G.J. An Inhibitor of Human Asparagine Synthetase Suppresses Proliferation of an L-Asparaginase-Resistant Leukemia Cell Line. Chem. Biol. 2006, 13, 1339–1347. [CrossRef]
- Muneer, F.; Siddique, M.H.; Azeem, F.; Rasul, I.; Muzammil, S.; Zubair, M.; Afzal, M.; Nadeem, H. Microbial L-Asparaginase: Purification, Characterization and Applications. Arch. Microbiol. 2020, 202, 967–981. [CrossRef]
- Dumina, M.; Zhgun, A.; Pokrovskaya, M.; Aleksandrova, S.; Zhdanov, D.; Sokolov, N.; El’darov, M. Highly Active Thermophilic L-Asparaginase from Melioribacter Roseus Represents a Novel Large Group of Type II Bacterial L-Asparaginases from Chlorobi-Ignavibacteriae-Bacteroidetes Clade. Int. J. Mol. Sci. 2021, 22, 13632. [CrossRef]
- Lubkowski, J.; Wlodawer, A. Structural and Biochemical Properties of L-Asparaginase. FEBS J. 2021, 288, 4183–4209. [CrossRef]
- Al-Hazmi, N.E.; Naguib, D.M. Plant Asparaginase versus Microbial Asparaginase as Anticancer Agent. Environ. Sci. Pollut. Res. 2022, 29, 27283–27293. [CrossRef]
- Dumina, M.; Zhgun, A.; Pokrovskaya, M.; Aleksandrova, S.; Zhdanov, D.; Sokolov, N.; El’darov, M. A Novel L-asparaginase from Hyperthermophilic Archaeon Thermococcus Sibiricus: Heterologous Expression and Characterization for Biotechnology Application. Int. J. Mol. Sci. 2021, 22, 1–17. [CrossRef]
- Batool, T.; Makky, E.A.; Jalal, M.; Yusoff, M.M. A Comprehensive Review on L-Asparaginase and Its Applications. Appl. Biochem. Biotechnol. 2016, 178, 900–923. [CrossRef]
- Chan, W.K.; Lorenzi, P.L.; Anishkin, A.; Purwaha, P.; Rogers, D.M.; Sukharev, S.; Rempe, S.B.; Weinstein, J.N. The Glutaminase Activity of L -Asparaginase Is Not Required for Anticancer Activity against ASNS-Negative Cells. Blood 2014, 123, 3596–3607.
- Kudryashova, E. V.; Pokrovskaya, M. V.; Alexandrova, S.S.; Vinogradov, A.A.; Sokolov, N.N. FTIR-Based L-Asparaginase Activity Assay Enables Continuous Measurements in Optically Dense Media Including Blood Plasma. Anal. Biochem. 2020, 598, 113694. [CrossRef]
- Pokrovsky, V.S.; Kazanov, M.D.; Dyakov, I.N.; Pokrovskaya, M. V.; Aleksandrova, S.S. Comparative Immunogenicity and Structural Analysis of Epitopes of Different Bacterial L-Asparaginases. BMC Cancer 2016, 16, 1–9. [CrossRef]
- Dobryakova, N. V.; Zhdanov, D.D.; Sokolov, N.N.; Aleksandrova, S.S.; Pokrovskaya, M. V.; Kudryashova, E. V. Improvement of Biocatalytic Properties and Cytotoxic Activity of L-Asparaginase from Rhodospirillum Rubrum by Conjugation with Chitosan-Based Cationic Polyelectrolytes. Pharmaceuticals 2022, 15, 406. [CrossRef]
- Пoкрoвская, М.В.; Пoкрoвский, В.С.; Александрoва, С.С.; Анисимoва, Н.Ю.; Андрианoв, Р.М.; Трещалина, Е.М.; Пoнoмарев, Г.В.; Сoкoлoв, Н.Н. Рекoмбинантная Внутриклетoчная L-Аспарагиназа Rhodospirillum Rubrum с Низкoй L-Глутаминазнoй Активнoстью и Антипрoлиферативным Эффектoм. Биoмедицинская химия 2013, 59, 192–198.
- Sokolov, N.N.; Eldarov, M.A.; Pokrovskaya, M. V.; Aleksandrova, S.S.; Abakumova, O.Y.; Podobed, O. V.; Melik-Nubarov, N.S.; Kudryashova, E. V.; Grishin, D. V.; Archakov, A.I. Bacterial Recombinant L-Asparaginases: Properties, Structure, and Anti-Proliferative Activity. Biochem. Suppl. Ser. B Biomed. Chem. 2015, 9, 325–338. [CrossRef]
- Pokrovskaya, M. V.; Zhdanov, D.D.; Eldarov, M.A.; Aleksandrova, S.S.; Veselovsky, A. V.; Pokrovskiy, V.S.; Grishin, D. V.; Gladilina, J.A.; Sokolov, N.N. Suppression of Telomerase Activity in Leukemic Cells by Mutant Forms of Rhodospirillum Rubrum L-Asparaginase. Biochem. Suppl. Ser. B Biomed. Chem. 2017, 11, 219–233. [CrossRef]
- Plyasova, A.A.; Pokrovskaya, M. V.; Lisitsyna, O.M.; Pokrovsky, V.S.; Alexandrova, S.S.; Hilal, A.; Sokolov, N.N.; Zhdanov, D.D. Penetration into Cancer Cells via Clathrin-dependent Mechanism Allows L-asparaginase from Rhodospirillum Rubrum to Inhibit Telomerase. Pharmaceuticals 2020, 13, 1–18. [CrossRef]
- Pokrovskaya, M. V.; Aleksandrova, S.S.; Pokrovsky, V.S.; Veselovsky, A. V.; Grishin, D. V.; Abakumova, O.Y.; Podobed, O. V.; Mishin, A.A.; Zhdanov, D.D.; Sokolov, N.N. Identification of Functional Regions in the Rhodospirillum Rubrum L-Asparaginase by Site-Directed Mutagenesis. Mol. Biotechnol. 2015, 57, 251–264. [CrossRef]
- Byler, D.M.; Susi, H. Examination of the Secondary Structure of Proteins by Deconvolved FTIR Spectra. Biopolymers 1986, 25, 469–487. [CrossRef]
- Yang, H.; Yang, S.; Kong, J.; Dong, A.; Yu, S. Obtaining Information about Protein Secondary Structures in Aqueous Solution Using Fourier Transform IR Spectroscopy. Nat. Protoc. 2015, 10, 382–396. [CrossRef]
- Sukumaran, S. Protein Secondary Structure Elucidation Using FTIR Spectroscopy. 2018, 4.
- Tatulian, S.A. Structural Characterization of Membrane Proteins and Peptides by FTIR and ATR-FTIR Spectroscopy. In Biotechnology and Bioengineering; 2013; Vol. 84, pp. 177–218.
- de Moura, W.A.F.; Schultz, L.; Breyer, C.A.; de Oliveira, A.L.P.; Tairum, C.A.; Fernandes, G.C.; Toyama, M.H.; Pessoa-Jr, A.; Monteiro, G.; de Oliveira, M.A. Functional and Structural Evaluation of the Antileukaemic Enzyme L-Asparaginase II Expressed at Low Temperature by Different Escherichia Coli Strains. Biotechnol. Lett. 2020, 42, 2333–2344. [CrossRef]
- Malakhova, M.A.; Pokrovskaya, M. V.; Alexandrova, S.S.; Sokolov, N.N.; Kudryashova, E. V. Regulation of Catalytic Activity of Recombinant L-Asparaginase from Rhodospirillum Rubrum by Conjugation with a PEG-Chitosan Copolymer. Moscow Univ. Chem. Bull. 2018, 73, 185–191. [CrossRef]
- Kudryashova, E. V.; Sukhoverkov, K. V. “Reagent-Free” l-Asparaginase Activity Assay Based on CD Spectroscopy and Conductometry. Anal. Bioanal. Chem. 2016, 408, 1183–1189. [CrossRef]
Figure 1.
(a) FTIR spectra of native and mutant forms of RrA L-asparaginase and commercially available asparaginases (EcA) in 1800-900 cm⁻¹ range. C(protein) = 3 mg/mL. PBS (0.01M, pH 7.4). T = 37 °C. (b) Gaussian deconvolution of the Amide I band in FTIR spectrum of native RrA L-asparaginase. (c) Gaussian deconvolution of the Amide I band in FTIR spectrum of mutant RrAR118H, G120R L-asparaginase. (d) The quantitative content of secondary structure elements in the composition of proteins.
Figure 2.
Positions of amino acid substitutions in the RrA structure. Substitutions in Mut1 are marked in blue. Substitutions in Mut2 are marked in yellow. Substitutions in Mut3 are marked in purple. The reaction product (Asp) is shown as flesh pink.
Figure 2.
Positions of amino acid substitutions in the RrA structure. Substitutions in Mut1 are marked in blue. Substitutions in Mut2 are marked in yellow. Substitutions in Mut3 are marked in purple. The reaction product (Asp) is shown as flesh pink.
Figure 3.
(a) Examples of kinetic curves of Asn hydrolysis by L-asparaginase recorded using the CD spectroscopy method. (b) Michaelis curves of substrate specificity of RrA enzymes and mutant forms. (c) Linearization of curves (b) in Lineweaver–Burk coordinates. (d) Linearization of curves (b) in Eadie–Hofstee coordinates. (e) Linearization of curves (b) in Hanes–Woolf coordinates. Conditions: 10 mM phosphate buffer, pH 7.4, temperature 37°C, wavelength 210 nm.
Figure 4.
(a) The changes in the CD spectra of L-asparaginase RrA upon heating. (b) Changes in the content of secondary structures of native RrA upon heating. [E] = 0.5 mg/mL, PBS (0.01M, pH 7.4).
Figure 4.
(a) The changes in the CD spectra of L-asparaginase RrA upon heating. (b) Changes in the content of secondary structures of native RrA upon heating. [E] = 0.5 mg/mL, PBS (0.01M, pH 7.4).
Figure 5.
Thermograms of heating and cooling of L-asparaginases - change in ellipticity at a wavelength of 220 nm: RrA (0.5 mg/mL), RrA-Mut1 (0.5 mg/mL), c) RrA-Mut2 (0.5 mg/mL); RrA-Mut3 (0.5 mg/mL), as well as pharmacy products EcA Medac and Veropharm. PBS (pH 7.4, 0,01M).
Figure 5.
Thermograms of heating and cooling of L-asparaginases - change in ellipticity at a wavelength of 220 nm: RrA (0.5 mg/mL), RrA-Mut1 (0.5 mg/mL), c) RrA-Mut2 (0.5 mg/mL); RrA-Mut3 (0.5 mg/mL), as well as pharmacy products EcA Medac and Veropharm. PBS (pH 7.4, 0,01M).
Figure 6.
(a) The ln K dependence of the L-asparaginase () denaturation process on the temperature in degrees Kelvin. (b) The energy δH profile of the same reaction as a function of temperature 20-90 °C. (c) δS profile of the same reaction from temperature 20-90 °C. PBS (pH 7.4, 0.01M).
Figure 6.
(a) The ln K dependence of the L-asparaginase () denaturation process on the temperature in degrees Kelvin. (b) The energy δH profile of the same reaction as a function of temperature 20-90 °C. (c) δS profile of the same reaction from temperature 20-90 °C. PBS (pH 7.4, 0.01M).
Figure 8.
MTT analysis of the viability of (a) K562 cells, and (b) A549 cells under the action of L-asparaginases. RPMI-1640 medium with the addition of 5% fetal bovine serum and 1% sodium pyruvate at 5% CO2 / 95% air in a humidified atmosphere at a temperature of 37 °C.
Figure 8.
MTT analysis of the viability of (a) K562 cells, and (b) A549 cells under the action of L-asparaginases. RPMI-1640 medium with the addition of 5% fetal bovine serum and 1% sodium pyruvate at 5% CO2 / 95% air in a humidified atmosphere at a temperature of 37 °C.
Table 1.
The characteristics of mutant forms of L-Asparaginase RrA from Rhodospirillum rubrum.
Table 1.
The characteristics of mutant forms of L-Asparaginase RrA from Rhodospirillum rubrum.
| Designation |
Substitutions in DNA |
Substitutions in protein |
| Mut1* |
C191T,G199A |
A64V, E67K |
| Mut2* |
G353A,G354C,G358A |
R118H, G120R |
| Mut3 |
G445A,A446G,G448C,T449C,T450C,T451A,T452C |
E149R, V150P, F151T |
Table 2.
Kinetic parameters
KM and V
max of Asn hydrolysis by L-asparaginase RrA native and mutant forms, determined using nonlinear regression and linear approximation in various coordinates. The experimental conditions are similar to those indicated in the caption to
Figure 2.
Table 2.
Kinetic parameters
KM and V
max of Asn hydrolysis by L-asparaginase RrA native and mutant forms, determined using nonlinear regression and linear approximation in various coordinates. The experimental conditions are similar to those indicated in the caption to
Figure 2.
|
Nonlinear регрессия
анализ Michaelis-Menten
|
| Enzyme |
Native RrA |
RrAA64V, E67K (RrA Mut1) |
RrAR118H, G120R (RrA Mut2) |
RrAE149R, V150P, F151T (RrA Mut3) |
| Vmax, U/mg |
29.6 ± 1.4 |
31.6 ± 0.7 |
34.9 ± 0.4 |
57.2 ± 2.4 |
| KM, mM |
4.5 ± 0.5 |
5.0 ± 0.3 |
6.7 ± 0.4 |
6.5 ± 0.7 |
| R-Square |
0.9940 |
0.9979 |
0.9998 |
0.9970 |
| Lineweaver–Burk plot |
| Enzyme |
Native RrA |
RrAA64V, E67K (RrA Mut1) |
RrAR118H, G120R (RrA Mut2) |
RrAE149R, V150P, F151T (RrA Mut3) |
| Vmax, U/mg |
29.7 ± 1.8 |
31.7 ± 0.8 |
34.7 ± 0.4 |
56.4 ± 2.2 |
| KM, mM |
4.3 ± 0.7 |
5 ± 0.4 |
6.5 ± 0.4 |
6.1 ± 0.7 |
| R-Square |
0.9428 |
0.982 |
0.9832 |
0.9715 |
| Hanes–Woolf plot |
| Enzyme |
Native RrA |
RrAA64V, E67K (RrA Mut1) |
RrAR118H, G120R (RrA Mut2) |
RrAE149R, V150P, F151T (RrA Mut3) |
| Vmax, U/mg |
29.7 ± 1.8 |
31.7 ± 0.8 |
34.7 ± 0.4 |
56.4 ± 2.2 |
| KM, mM |
4.3 ± 0.2 |
5 ± 0.1 |
6.5 ± 0.1 |
6.1 ± 0.1 |
| R-Square |
0.9793 |
0.9962 |
0.9991 |
0.9912 |
| Eadie–Hofstee diagram |
| Enzyme |
Native RrA |
RrAA64V, E67K (RrA Mut1) |
RrAR118H, G120R (RrA Mut2) |
RrAE149R, V150P, F151T (RrA Mut3) |
| Vmax, U/mg |
30.9 ± 2.3 |
31.8 ± 0.8 |
33.9 ± 0.4 |
57.6 ± 5.6 |
| KM, mM |
5.1 ± 0.5 |
5.1 ± 0.2 |
5.7 ± 0.3 |
6.9 ± 1.2 |
| R-Square |
0.9454 |
0.9932 |
0.9843 |
0.8436 |
Table 4.
Thermodynamic parameters of L-asparaginase thermodenaturation at 37 °C. PBS (pH 7.4, 0.01 M).
Table 4.
Thermodynamic parameters of L-asparaginase thermodenaturation at 37 °C. PBS (pH 7.4, 0.01 M).
| Parameter |
Native RrA |
RrAA64V, E67K (RrA Mut1) |
RrAR118H, G120R (RrA Mut2) |
RrAE149R, V150P, F151T (RrA Mut3) |
EcA Medac |
EcA Veropharm |
| ln K |
–1.85 |
–3.73 |
–1.89 |
–2.08 |
–6.04 |
–5.37 |
| ΔH, kJ/mol |
91.1 |
132.2 |
97.8 |
60.2 |
25.1 |
26.6 |
| ΔS, J/mol/K |
–15.1 |
–30.6 |
–15.4 |
–17.1 |
–50.1 |
–44.6 |
Table 6.
IC50 values on K562 cells (concentration of semi-inhibition of cell growth) determined using MTT analysis under the action of L-asparaginases. RPMI-1640 medium with the addition of 5% fetal bovine serum and 1% sodium pyruvate at 5% CO2 / 95% air in a humidified atmosphere at a temperature of 37 °C.
| Enzyme |
IC50 on K562 cells, U/mL |
| RrA native |
15 ± 2 |
| RrAA64V,E67K
|
25 ± 3 |
| RrAR118H,G120R
|
11.5 ± 0.7 |
| RrAE149R,V150P,F151T
|
10 ± 1 |
| EcA-Veropharm |
24 ± 4 |
|
Disclaimer/Publisher’s Note: The statements, opinions and data contained in all publications are solely those of the individual author(s) and contributor(s) and not of MDPI and/or the editor(s). MDPI and/or the editor(s) disclaim responsibility for any injury to people or property resulting from any ideas, methods, instructions or products referred to in the content. |
© 2025 by the authors. Licensee MDPI, Basel, Switzerland. This article is an open access article distributed under the terms and conditions of the Creative Commons Attribution (CC BY) license (http://creativecommons.org/licenses/by/4.0/).