Preprint
Article

This version is not peer-reviewed.

Empirical Formula for Determining Freshwater Zooplankton Biomass from Pigs Manures of the Piggeries in Forest Guinea

Submitted:

05 March 2025

Posted:

07 March 2025

You are already at the latest version

Abstract

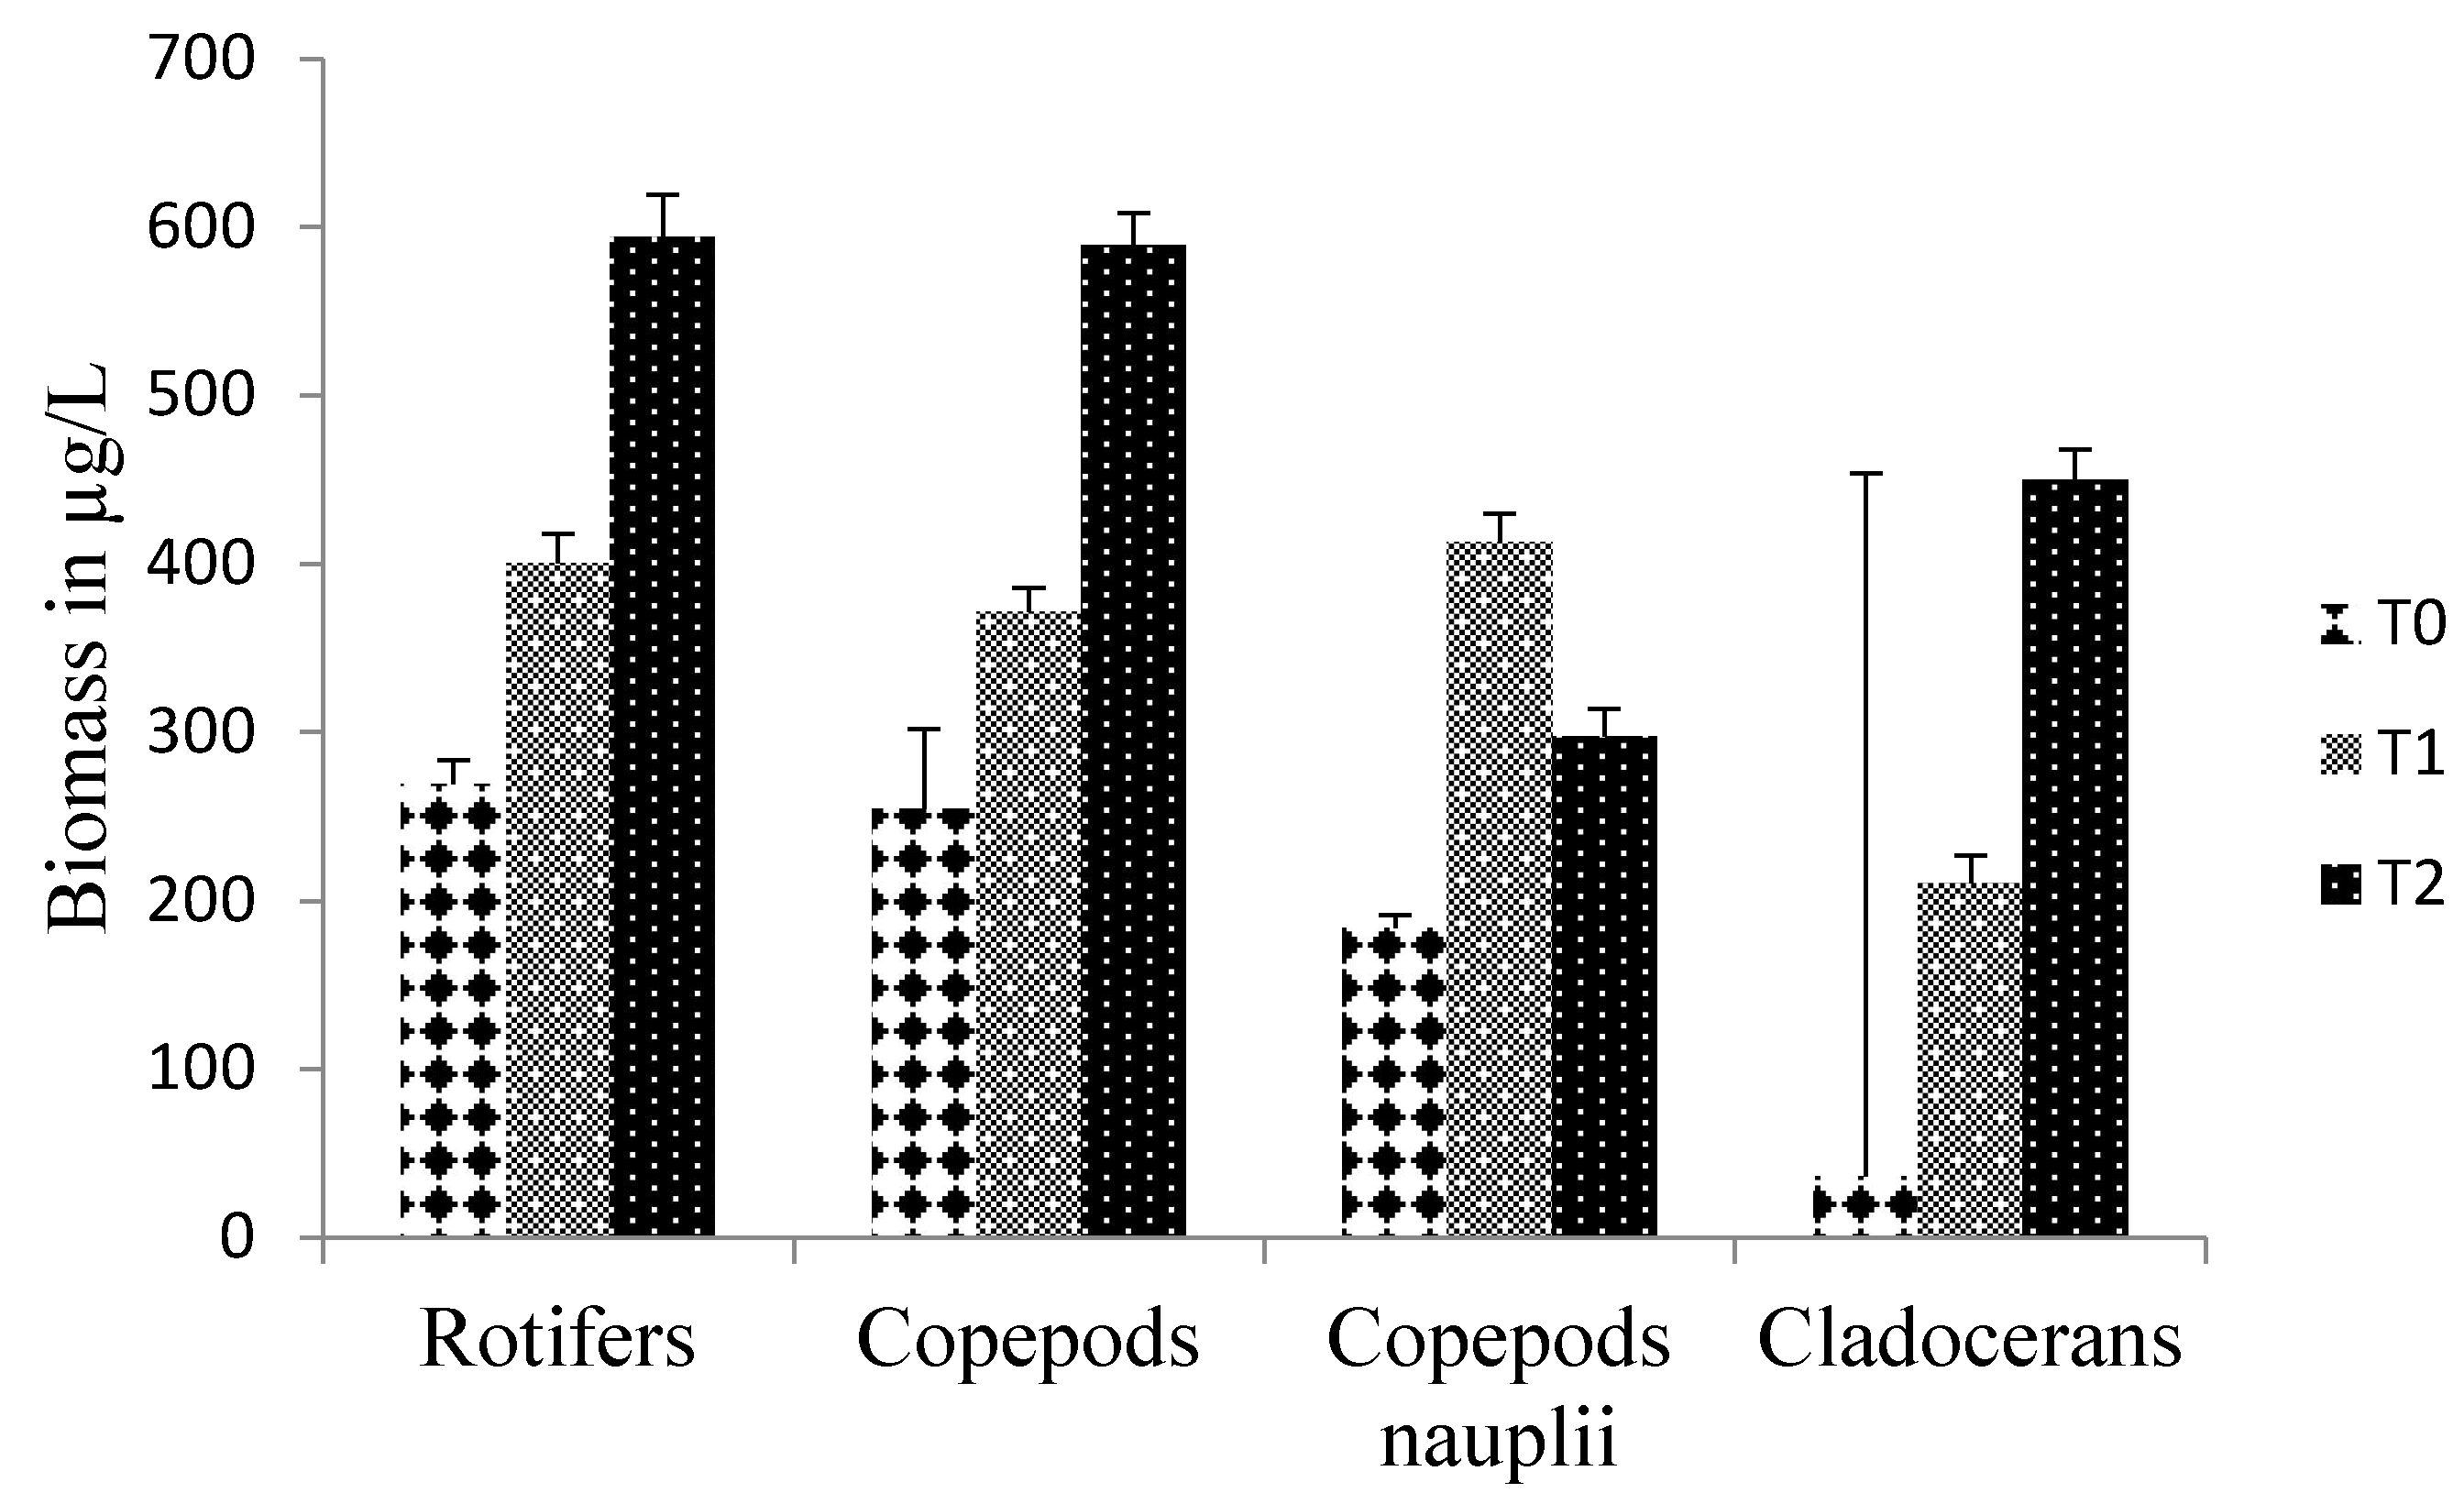
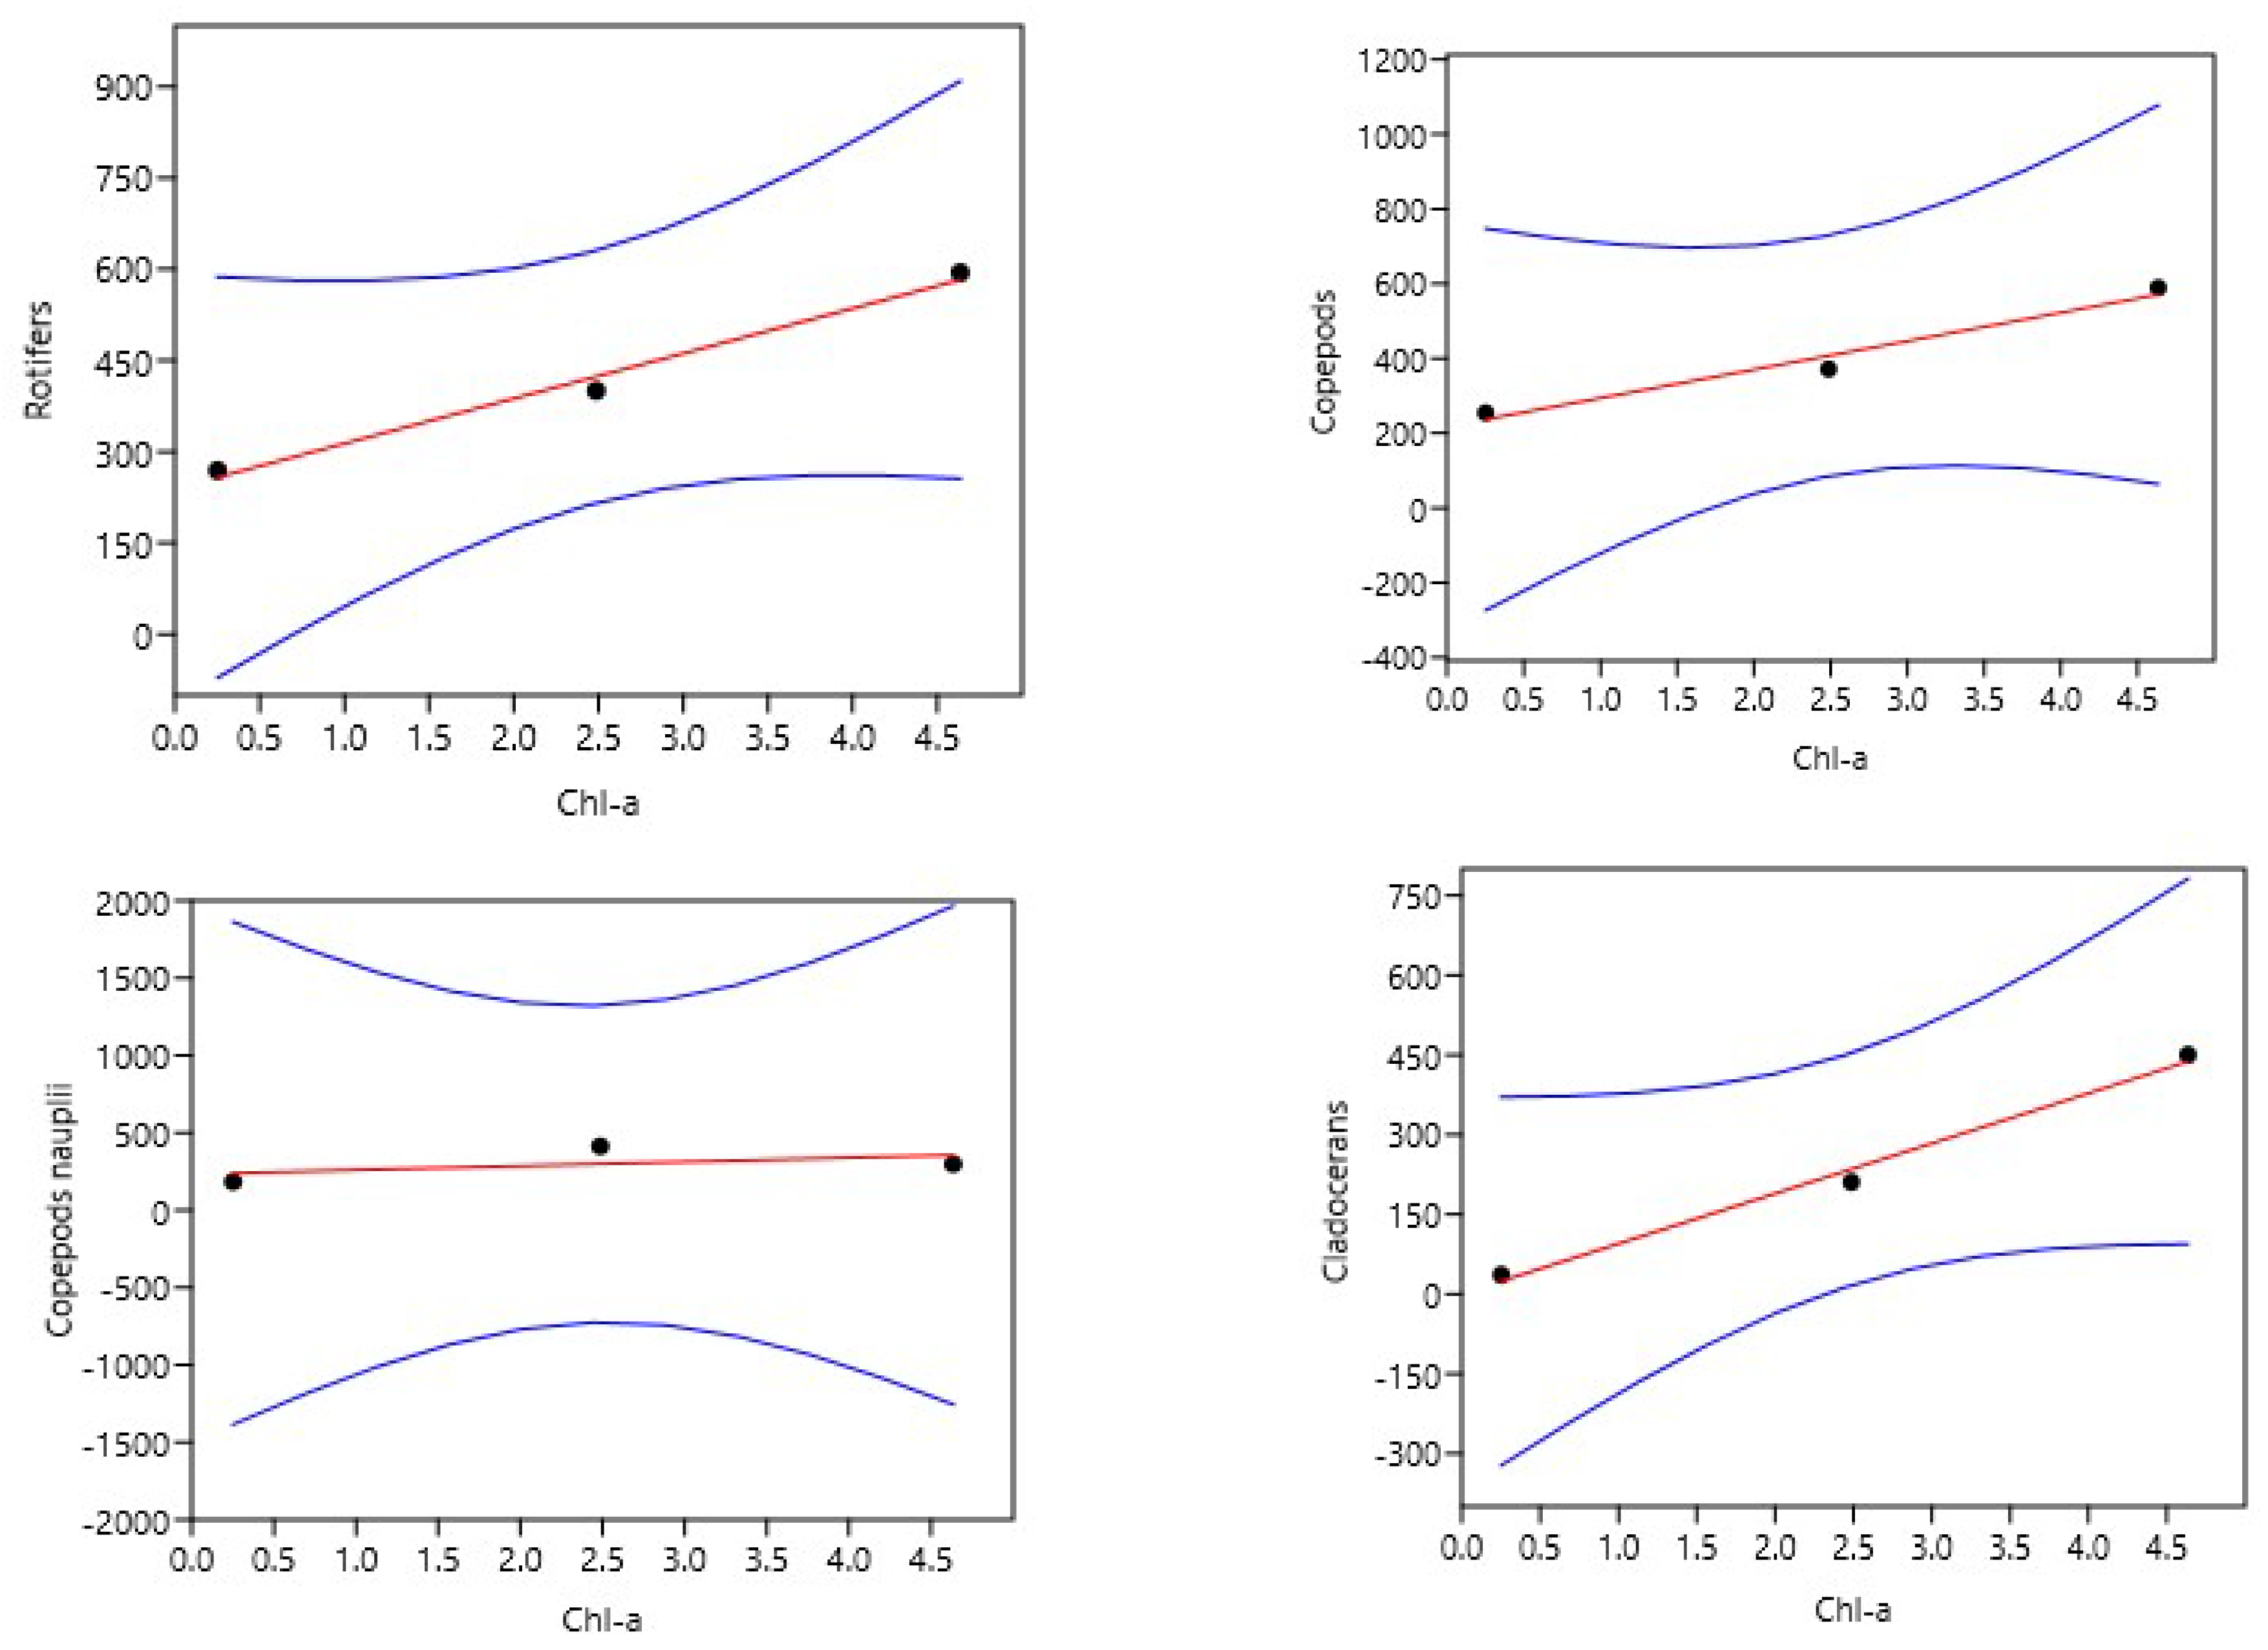
To identify an ideal dose of pig manure from piggeries in the Forest Guinea for the production of zooplankton in rural fish farms for larval breeding, three doses including a control of 0 (T0), 300 (T1) and 600 (T2) g/m3 were tested for forty-five days. The experimental device of three buckets with a capacity sixty liters per treatment was each filled with 40 liters of demineralized water and immediately fertilized with the different doses. Three days after fertilization, phytoplankton was seeded followed by zooplankton seventy-two hours later. The initial seeding density was 35±7.62 ind/L or (23±1.13 ind/L of copepod nauplii or 1.84±0.13 µg/L (Thermocyclops sp.), 4±0.1 ind/L or 1.88±0.1 µg/L copepod adults (Thermocyclops sp.), 1±0.007 ind/L or 2.7±0.7 µg/L cladocerans (Moina sp. and Daphnia sp.) and 3±1.48 ind/L or 0.21 ± 1.48 of rotifers (Brachionus sp and Asplanchna sp.). The results show that doses of 300 (T1) and 600 (T2) g/m3 of pig slurry gave good primary production, the highest of which was obtained with T2 (4.63±2.48 mg/L) with a strong correlation with zooplankton biomass (r2 between 0.96 and 0.98). Biomasses recorded in T2 were 594.35±24.93 µg/L rotifers, 589.73±18.98 µg/L copepods and 449.95±18.15 µg/L cladocerans. This dose could be considered ideal for rural fish farmers in forested Guinea.

Keywords: 
;  ;  ;  ;  

1. Introduction

Food and agriculture are essential to achieve all the Sustainable Development Goals (SDGs) directly related to fisheries and aquaculture (SDG 14) [1]. However, many sub-Saharan African countries struggle develop and transform fish farming into viable economic activity. Indeed, despite the many potentials they have, they only contribute less than 0.5% the 1.5% the tonnage of African aquaculture production [2]. The majority African countries, the scarcity, unavailability food and the cost this food really slow down aquaculture general and fish farming particular [3,4]. In addition, the success larval rearing has been limited by the early use artificial meals [5]. One major constraints recognized and which hinders the development this activity in Guinea is the lack on the local market high-performance feeds at different growth stages prices accessible to fish farmers [6,7]. This is a crucial factor in slowing down the development Guinean fish farming despite investments in recent decades [8]. In addition, the import surcharge on products intended for animal feed restricts imports fish feed, as well those the flours needed for the local production feed. Faced with this situation, it is necessary to set up feed production systems adapted the socio-economic situation employers, species fish be fed and especially according availability locally organic fertilizers. In Forest Guinea, the wettest region Guinea, the greatest risk is that a drop in the level water tables climate change, with a significant number fish farming activities according a preliminary study carried out by APDRA under the direction a member the Intergovernmental Panel on Climate Change [9]. It is therefore urgent to design and implement fish production systems that have a positive impact on water sources. Indeed, according [10] and [11], dry food is absorbed by the water column, prevents light penetration, creates deposits and an anxious environment, and would pollute the production environments unlike the use zooplankton. The use live food (zooplankton) produced from organic fertilizers of animal origin for the larval rearing freshwater fish is an essential alternative. According to [5], live food stimulates food intake and would facilitate the establishment enzyme complexes in fish at the larval stage. According to [12], a good diet for larval rearing aquaculture species is essential, especially for growth, survival and disease resistance larvae. Zooplankton is used as feed for fish larvae in aquaculture due its high nutrient content, easy digestibility and richness in polyunsaturated fatty acids (PUFAs) and unsaturated fatty acids (UFAs) [13]. Previous studies on the use of organic fertilizers such as poultry droppings, cow dung [14] (Agadjihouèdé et al., 2011) and rabbit droppings [15] for the production aquatic zooplankton have been conducted. However, the composition organic fertilizers animal origin in macro and microelements varies from one environment another and is dependent on the diets which livestock are subjected and influences algal and zooplankton productivity. This is what justifies the present study whose main objective is the determination of the optimal dose of organic fertilizer (pig manure) obtained in the piggeries the forest Guinea. Specifically, it is a question (i) evaluating the influence organic fertilizer on the abundance the three major zooplankton groups, (ii) evaluating the biomass of zooplankton from the different doses organic fertilizers (iii) determining the optimal dose of organic fertilizer (pigs manure) for a production freshwater zooplankton.

2. Material and methods

2.1. Experimental design

The experiment was conducted September 2023 at a site (7°43’57.6’’N ; 08°50’4.3’’E altitude 7 m above sea level) located at the University of N'Zérékoré. The experimental design is made of 9 plastic buckets of 60 L capacity each, exposed at free air on the previously described site. For this purpose, seventy-two hours before experiment starting up, buckets were cleaned and disinfected. It is made of three (03) treatments including one control such as: T0, T1, T2, corresponding respectively to 0, 300, 600 of dry pig manure (PM) in one (01) m3 of water replicated thrice. Buckets were filled with 40 liters of demineralized water and immediately fertilized [16]. Pig droppings were obtained from an integrated fish production farm in the urban commune of N’Zérékoré. Manures contained 16.13%, 0.36% and 0.72% of N, P and K respectively.

2.2. Physico-chemical and trophic parameters

During experiment, temperature, pH, conductivity and dissolved oxygen have been measured in situ every sampling day at noon with a multi-parameter borer Water Quality Meter (Version AZ86031) à ± 0.01 pH and ± 0.1°C by mg/L). At each sampling site, 250 mL of the culture was filtered per bucket on the one hand for dosage of chlorophyll-a and for dosage of nutritive salts (ammonium, nitrate, nitrite and orthophosphate) on the other hand. Dosage of chlorophyll a was carried out according to [17], [18] and [19] while dosage of nutritive salts was realized according to [20] following below formula, with a spectrophotometer of molecular absorption (HACH DR/ 2800).
C h l a ( µ g L ) = A 0 665 A 0 750 ( A a 665 A a 750 ) x 11.49 x v x 2.43 V x L
whith, Ao665: Absorption at 665 nm before acidification; Ao750: Absorption at 750 nm before acidification; Aa665: Absorption at 665 nm after acidification; Aa750: Absorption at 750 nm after acidification; 2.43: factor to associate the reduction in absorbance to the initial concentration of chlorophyll; 11.49: absorption coefficient of chlorophyll-a, V: volume of the sample filtered (l), L: length of the cuvette (cm) and v: volume of the extract in ml

2.3. Phytoplankton and Zooplankton seeding process

After fertilizing, production areas were left for three days in order to enable nutrients releasing by washing so that they will be available to phytoplankton (microalgae). After this period, medium were seeded with phytoplankton according to [16] by transferring ten (10) liters of polyculture (Heterotis niloticus, Heterobranchus isopterus and Oreochromis niloticus) pond water from the Federation of Fish Farmers of Forest Guinea (FFFFG) previously filtered with plankton net of 30 µm mesh to eliminate zooplankton.
Zooplankton was seeded three (03) days after microalgae seeding, otherwise six days after fertilizing. Indeed, according to [21], this period is sufficient for microalgae development. To harvest zooplankton, three hundred (100) liters of the previous pond were filtered with a net of 30µm, and then concentrated in 250 mL of water. Each bucket was seeded with 25 mL of this filtrate. A sub sampling of 50 mL was taken and formolled in order to perform individuals counting and zooplankton diversity study. In the absence of suitable equipment in the laboratory (sensitive scales) for weighing zooplankton species during the work, data from the literature were used to estimate zooplankton biomass: for each species, the numbers of individuals were transformed into biomass using the average individual dried masses calculated [22,23] and used by [24], which are 0.07 µg/ind for rotifers, 0.08 µg/ind for nauplii-stage copepods and 0.47 µg/ind for adult copepods; and 2.7 µg/ind (dry weight) for adult cladoceran [25]. The initial seeding density was 35 ± 7.62 ind/L either ( 23± 1.13 ind/L nauplii of copepods either 1.84 ± 0.13 µg/L of (Thermocyclops sp.), 4 ± 0.1 ind/L either 1.88±0.1 µg/L adults of copepods (Thermocyclops sp.), 1 ± 0.007 ind/L either 2.7 ± 0.7 µg/L of cladocerans (Moina sp. and Daphnia sp.) and 3 ± 1.48 ind/L either 0.21 ± 1.48 of rotifers (Brachionus sp and Asplanchna sp.). These three great groups of zooplankton are generally phytophage.

2.4. Statistical analysis

From data collected, density (D) was obtained by using these equations: D = n V 2 V 1 V 3 where n: number of individuals counted, V1: volume (l) of aliquot, V2: volume (l) of sample concentrated, V3: volume (l) of water filtered. Collected data were analyzed using STATISTICA software (Statsoft inc., Tulsa, OK, USA). All significant levels were fixed at P < 0.05. The influence of treatments was studied using a one-way ANOVA; in case of need, significance of differences among means was tested using the test LSD of Fisher.
Linear regression relationship equation was applied to determine the relationships between chlorophyll-a versus total biomass zooplankton of this study as follow ; Y = aX+b with slop intercep whereas, Y represents the biomass zooplankton and X represent the chlorophyll-a, whereas, a : was a constant value and b : was the regression coefficient [26]. Excel software was used for data organization and requests enabled data extraction for statistical analyses and graphic making up by using Paleotological Statistic (PAST) version 4.02 accessible on website http://folk.uio.no/ohammer/past/.

3. Results

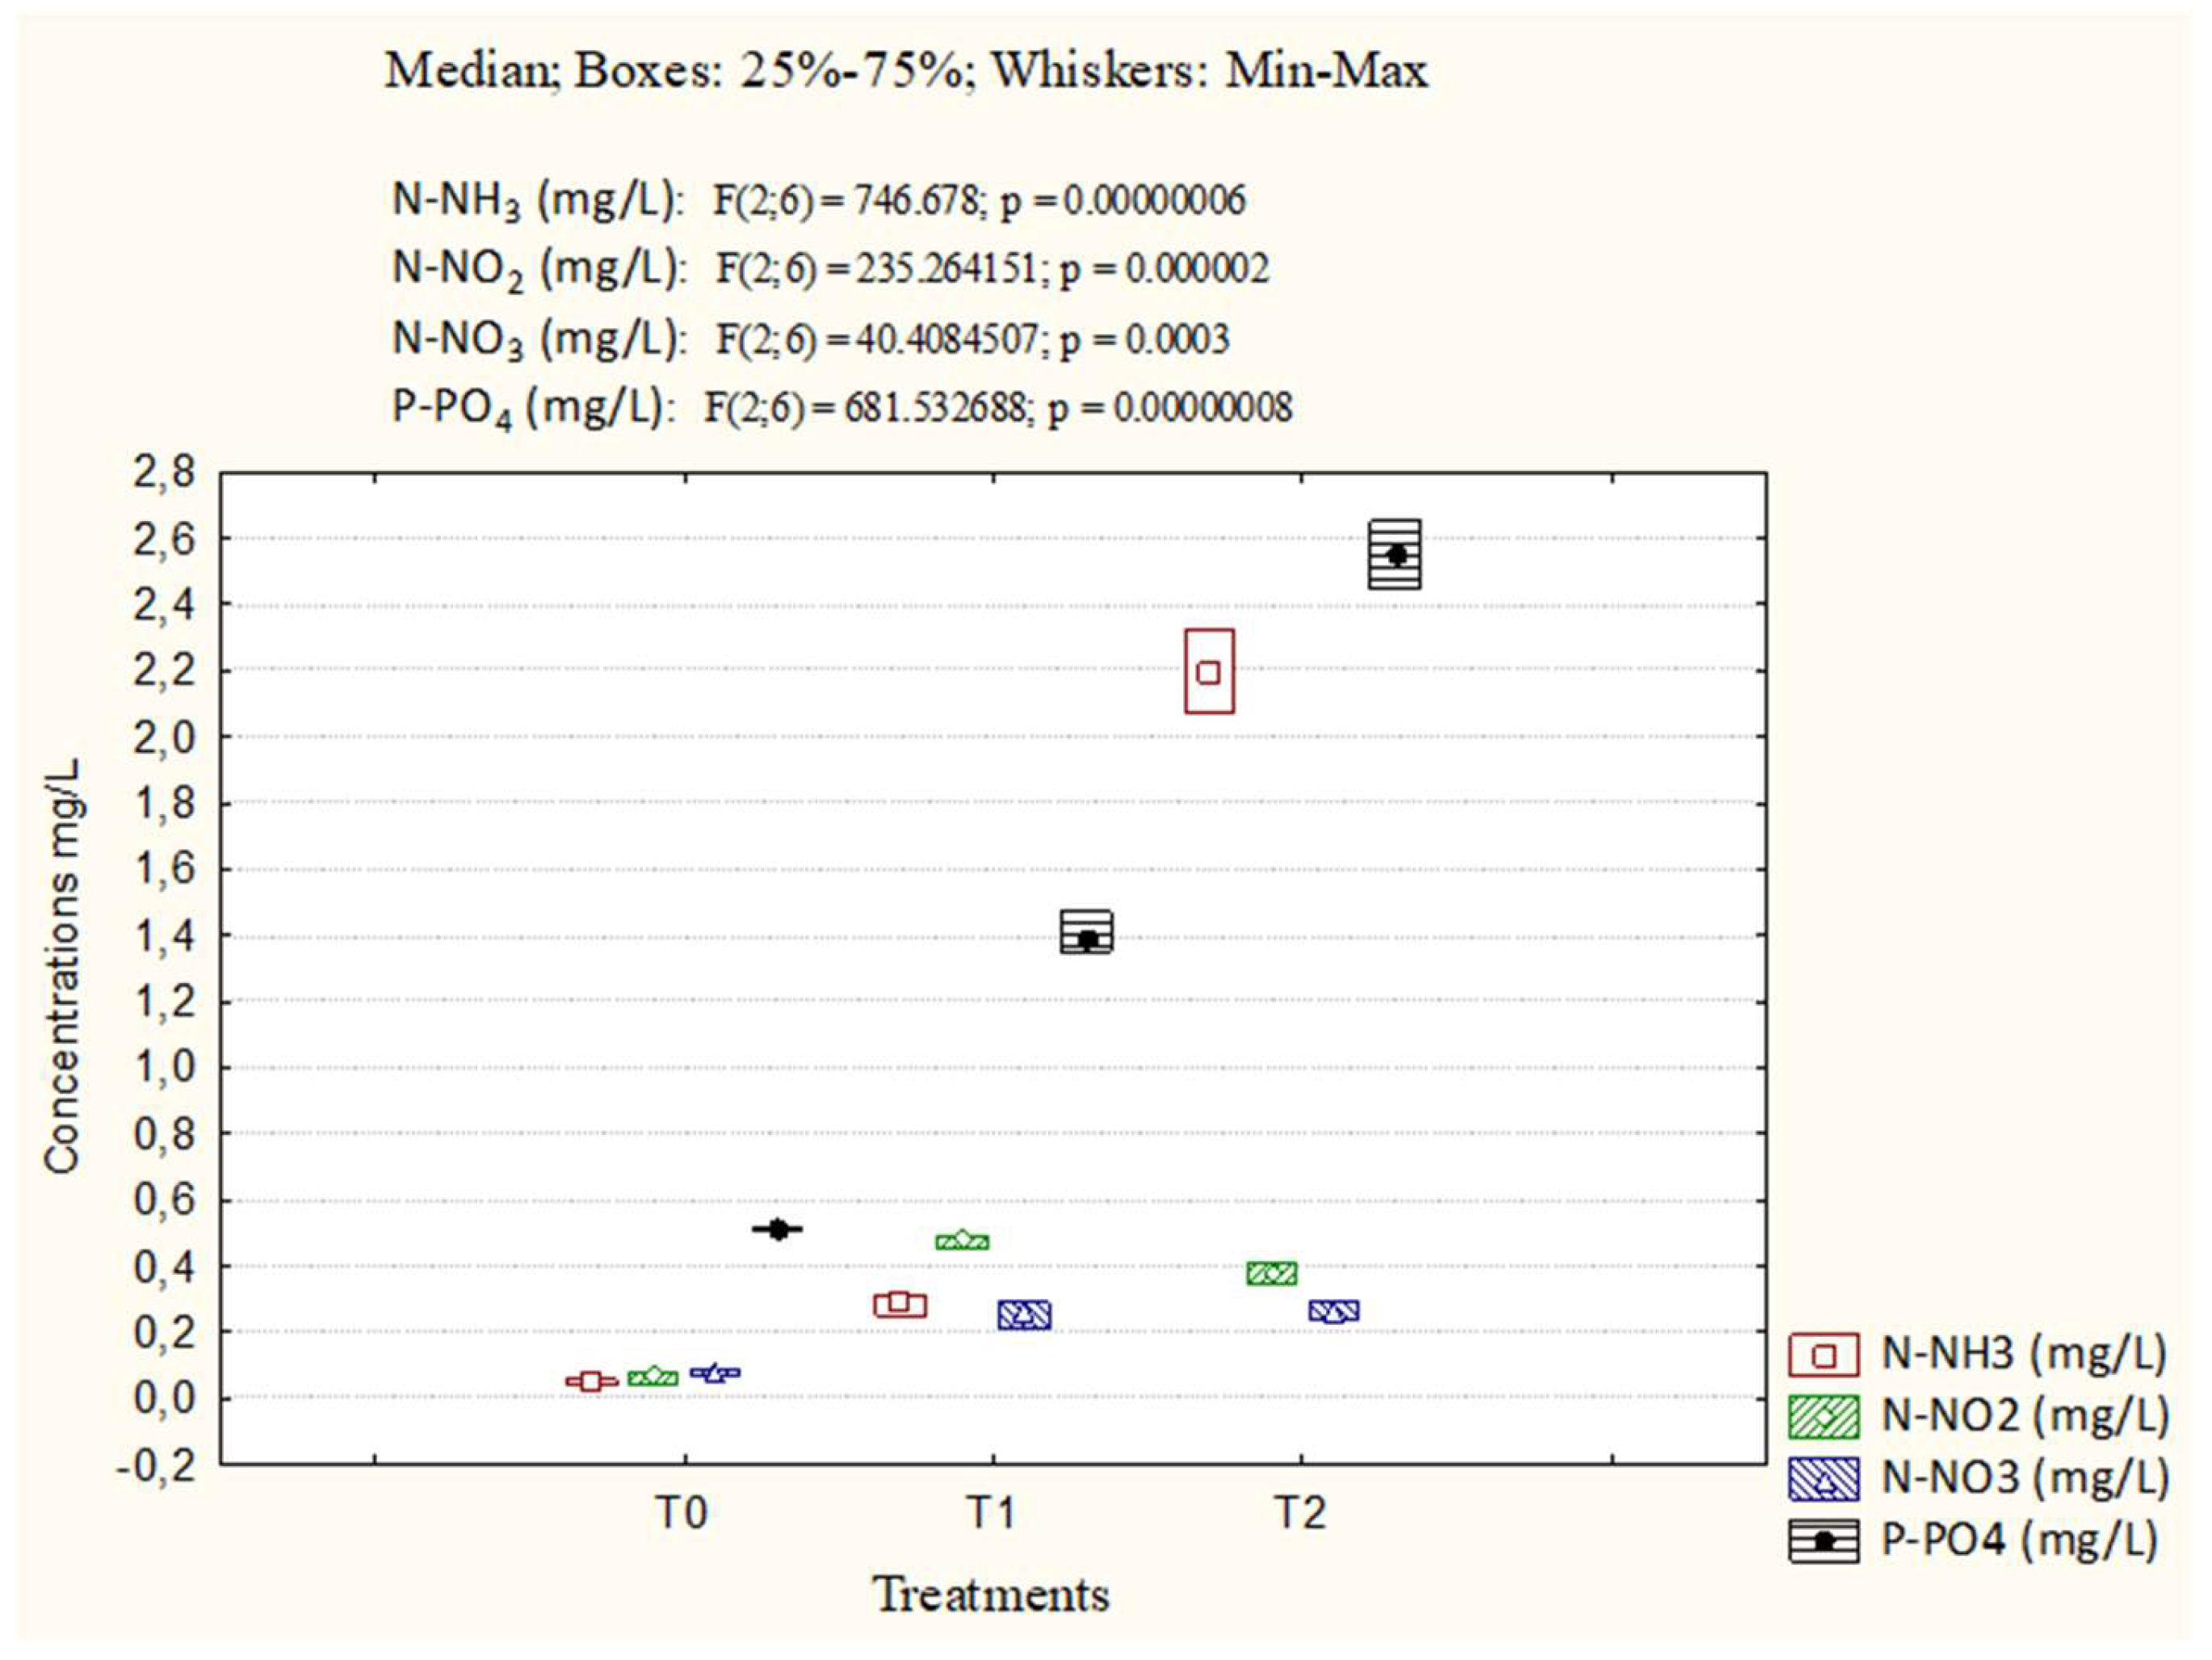
3.1. Abiotic parameters

The analysis of variance of the results for the effects of the different doses (treatments), considering the concentrations, shows a large significant difference (F (10, 30) = 8.26; p=0.00) between the different treatments and physicochemical parameters. With the exception of temperature, which did not vary between treatments (F(2, 6) = 2.96; P>0.05), the mean values of the other parameters varied from one treatment to another from 6.12 to 76.72 for conductivity, from 0.17 to 0.40 for pH, from 4.86 to 50.29 for TDS and from 0 to 0.04 for salinity (Table 1). As shown in Table 1, mean values for parameters such as electrical conductivity, salinity, TDS and dissolved oxygen were higher in the fertilized media than in the T0 control treatment, with a high significant difference (p < 0.00). With the exception of pH, the highest mean values of the various parameters mentioned above were recorded in the T2 medium followed by T1 with a significant difference (p < 0.05).
Mean nutrient concentrations varied significantly between treatments (F (6, 18) = 320.27; p = 0.00). The highest concentrations were obtained in treatment T2 with an average of 2.19 ± 012, 0.38 ± 0.03, 0.26 ± 0.02 and 2.55 ± 0.1 respectively of N-NH3, N-NO2, N-NO3 and P-PO4 (Figure 1), followed by T1 and T0.

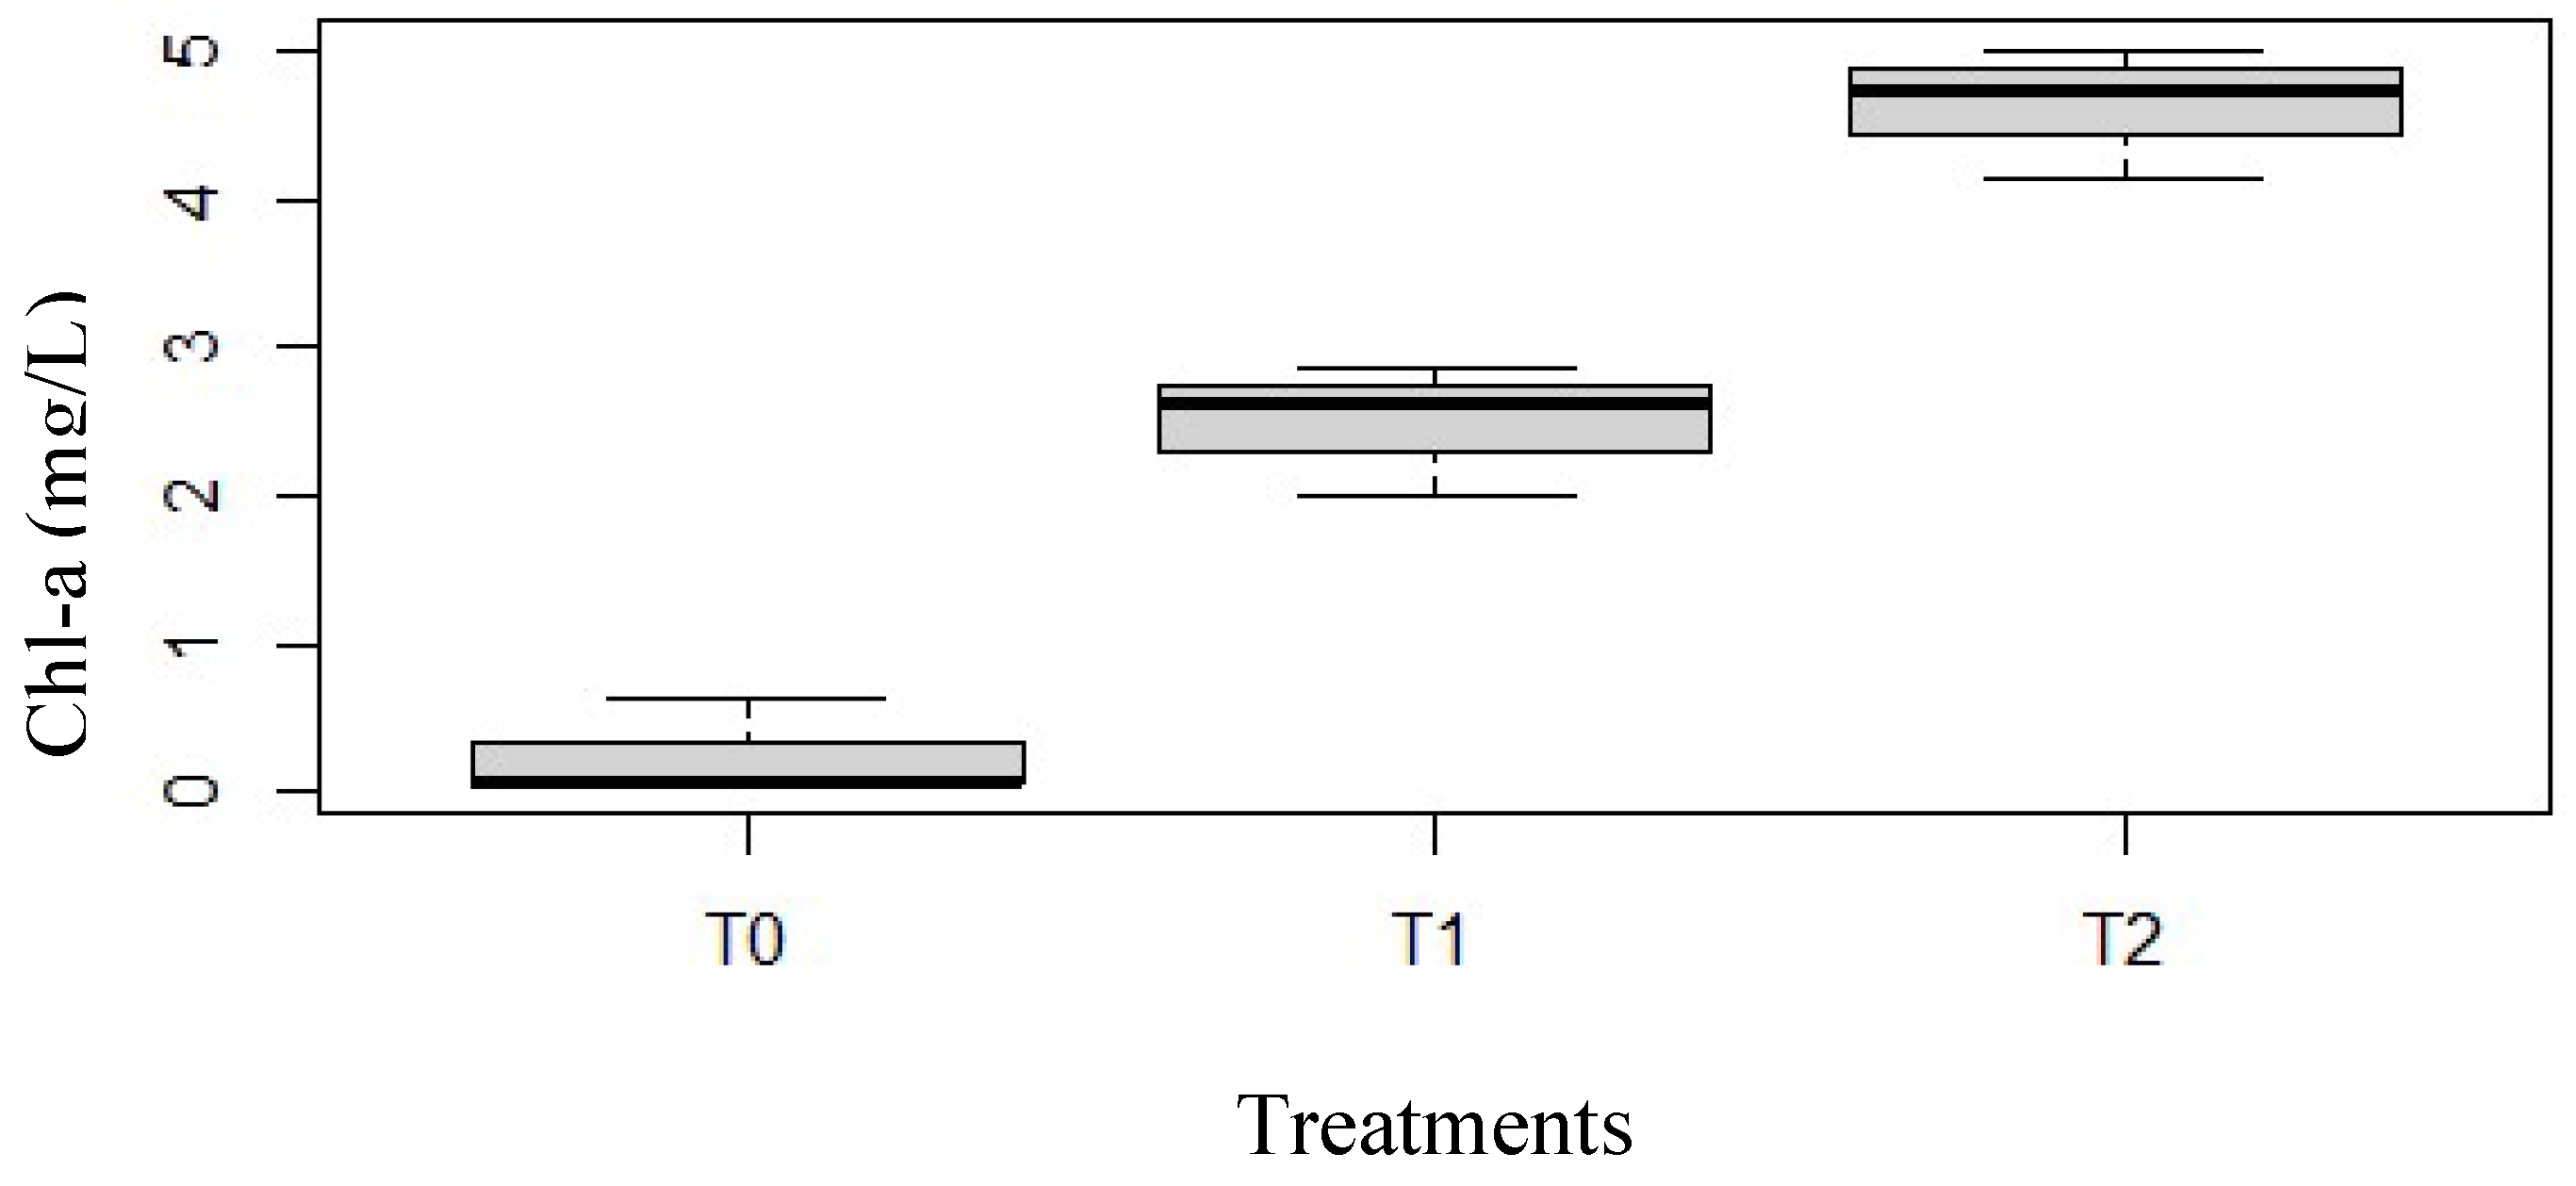
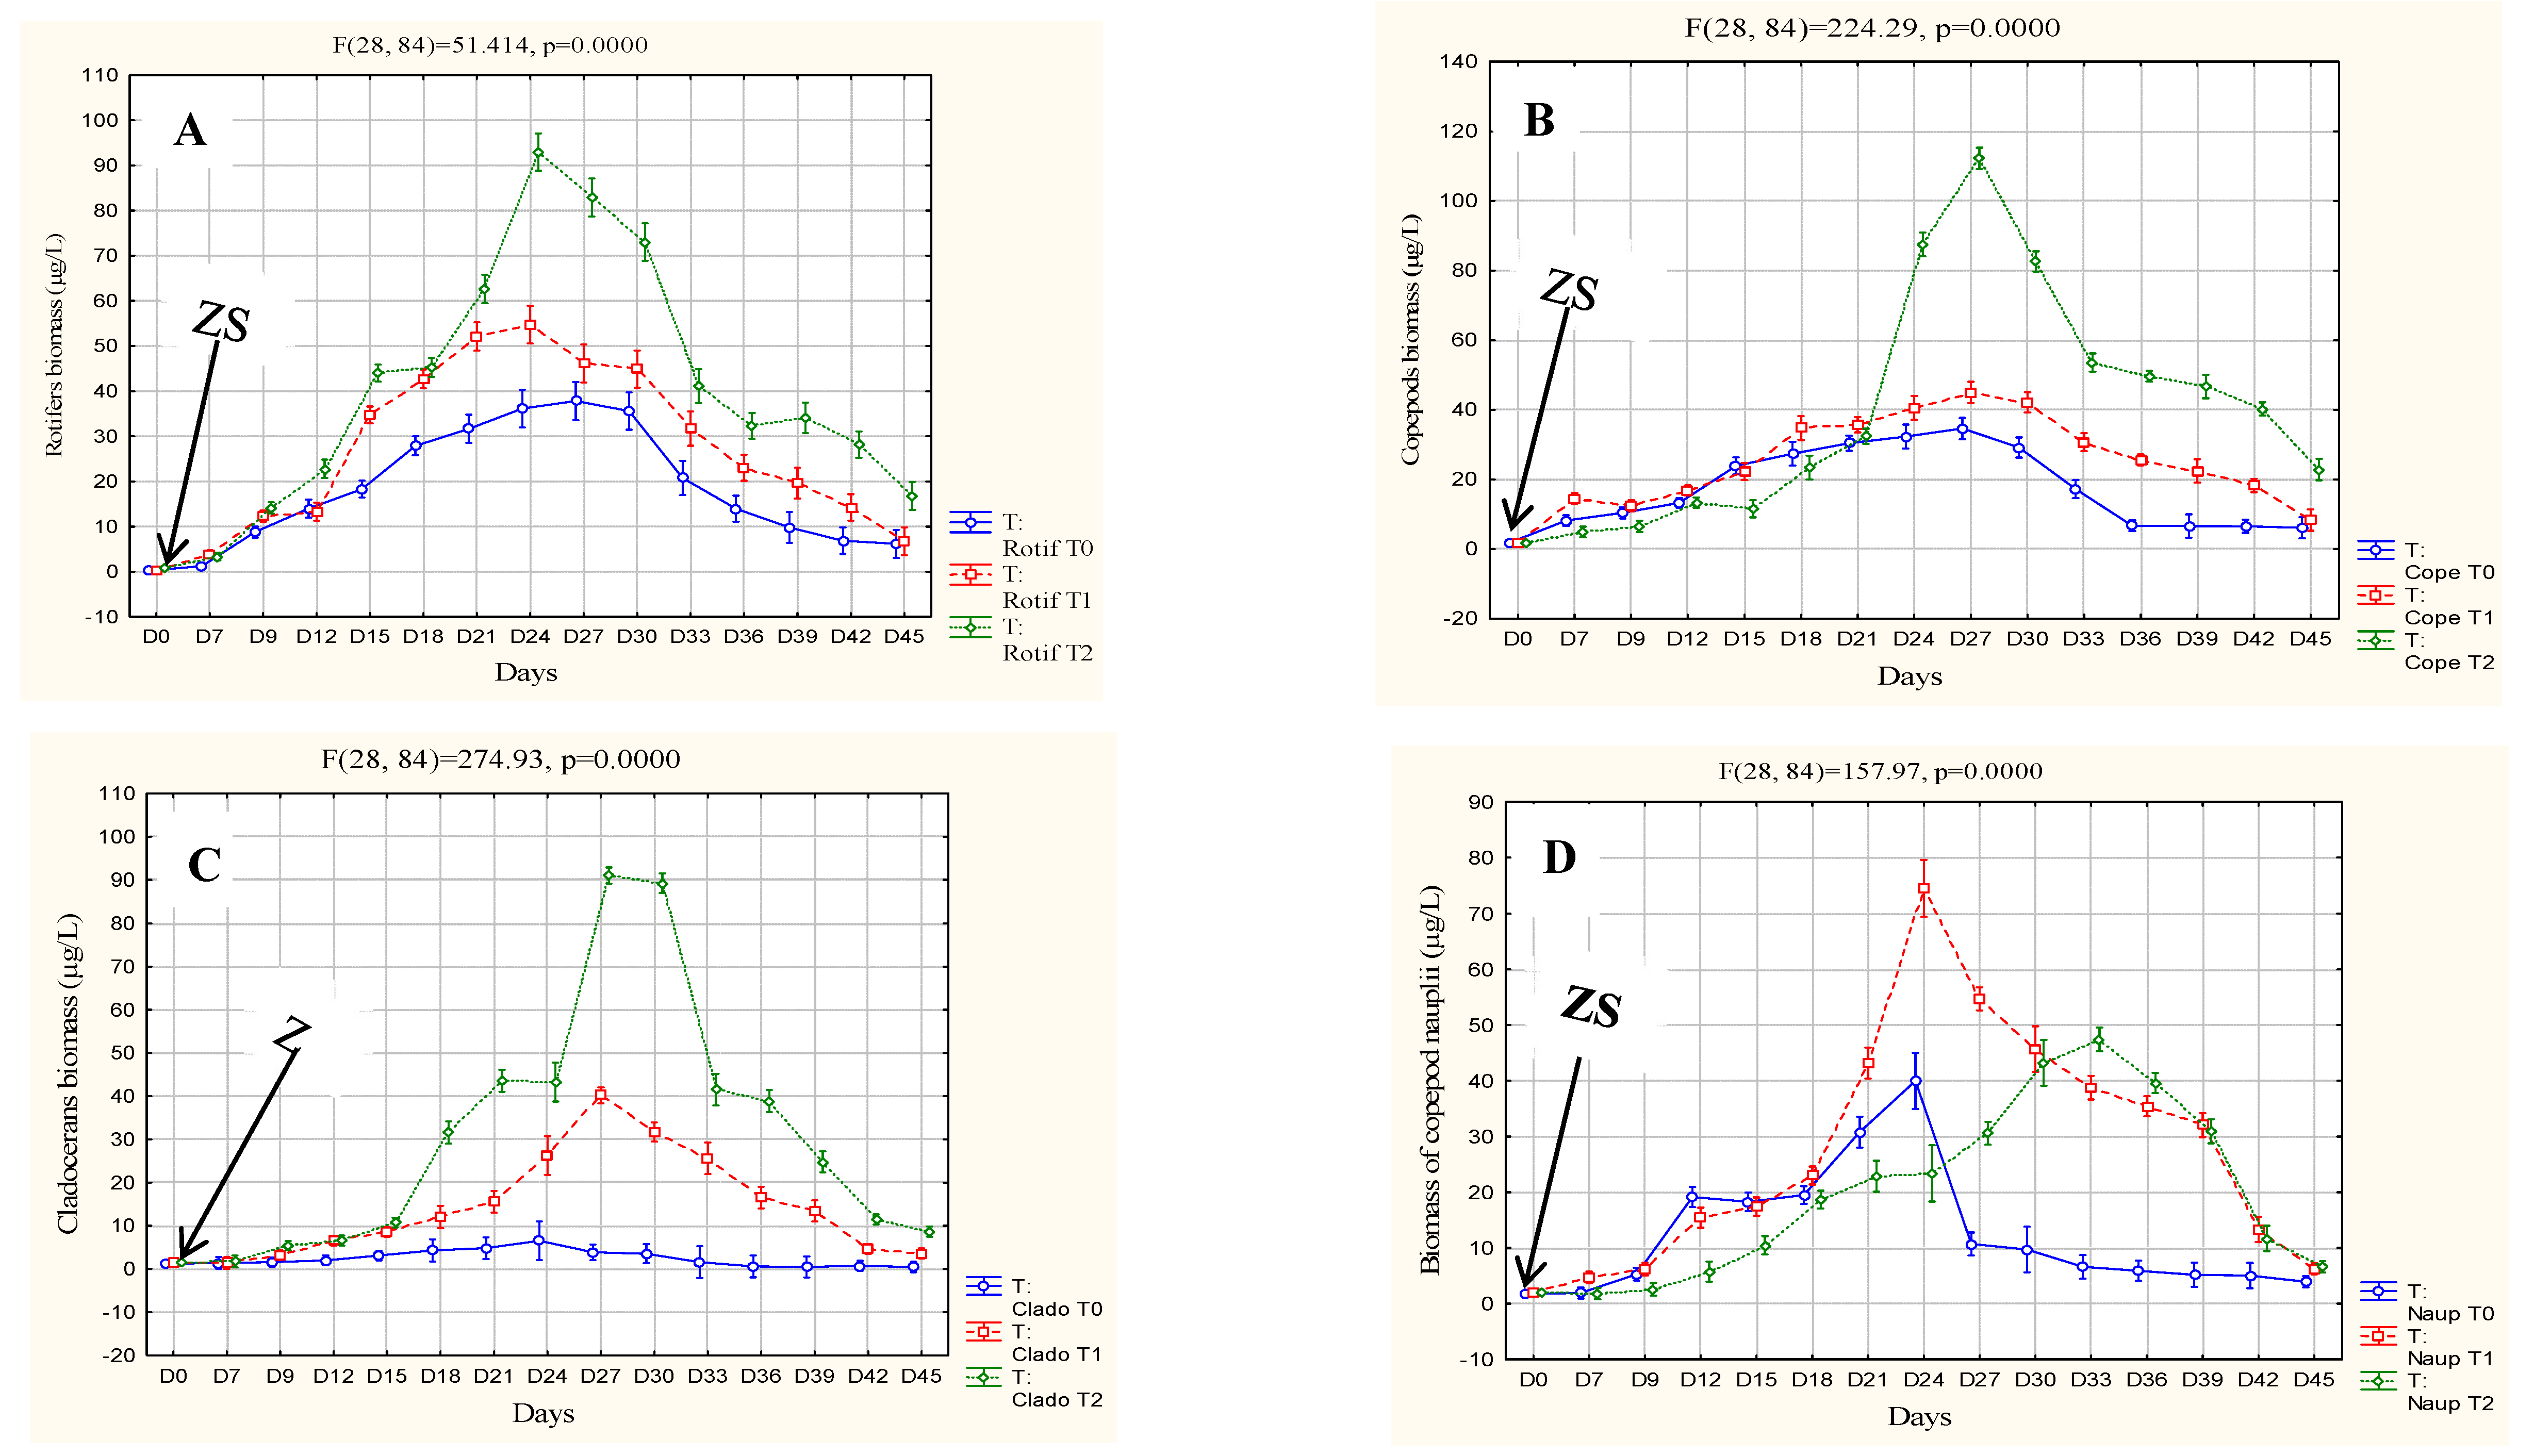
3.2. Biotic parameter

Figure 2 shows the different chlorophyll-a means for the different treatments, with significant differences (F (2, 6) = 85.60; p = 0.00). Treatment T2 recorded the highest Chl-a concentration at 4.63 ± 2.48 mg/L. In the same way, a higth positive correlation (R = 0.982, R²= 0.96, F = 198.9702, p < 0.00) was observed between chlorophyll-a concentration and pig manure dose.

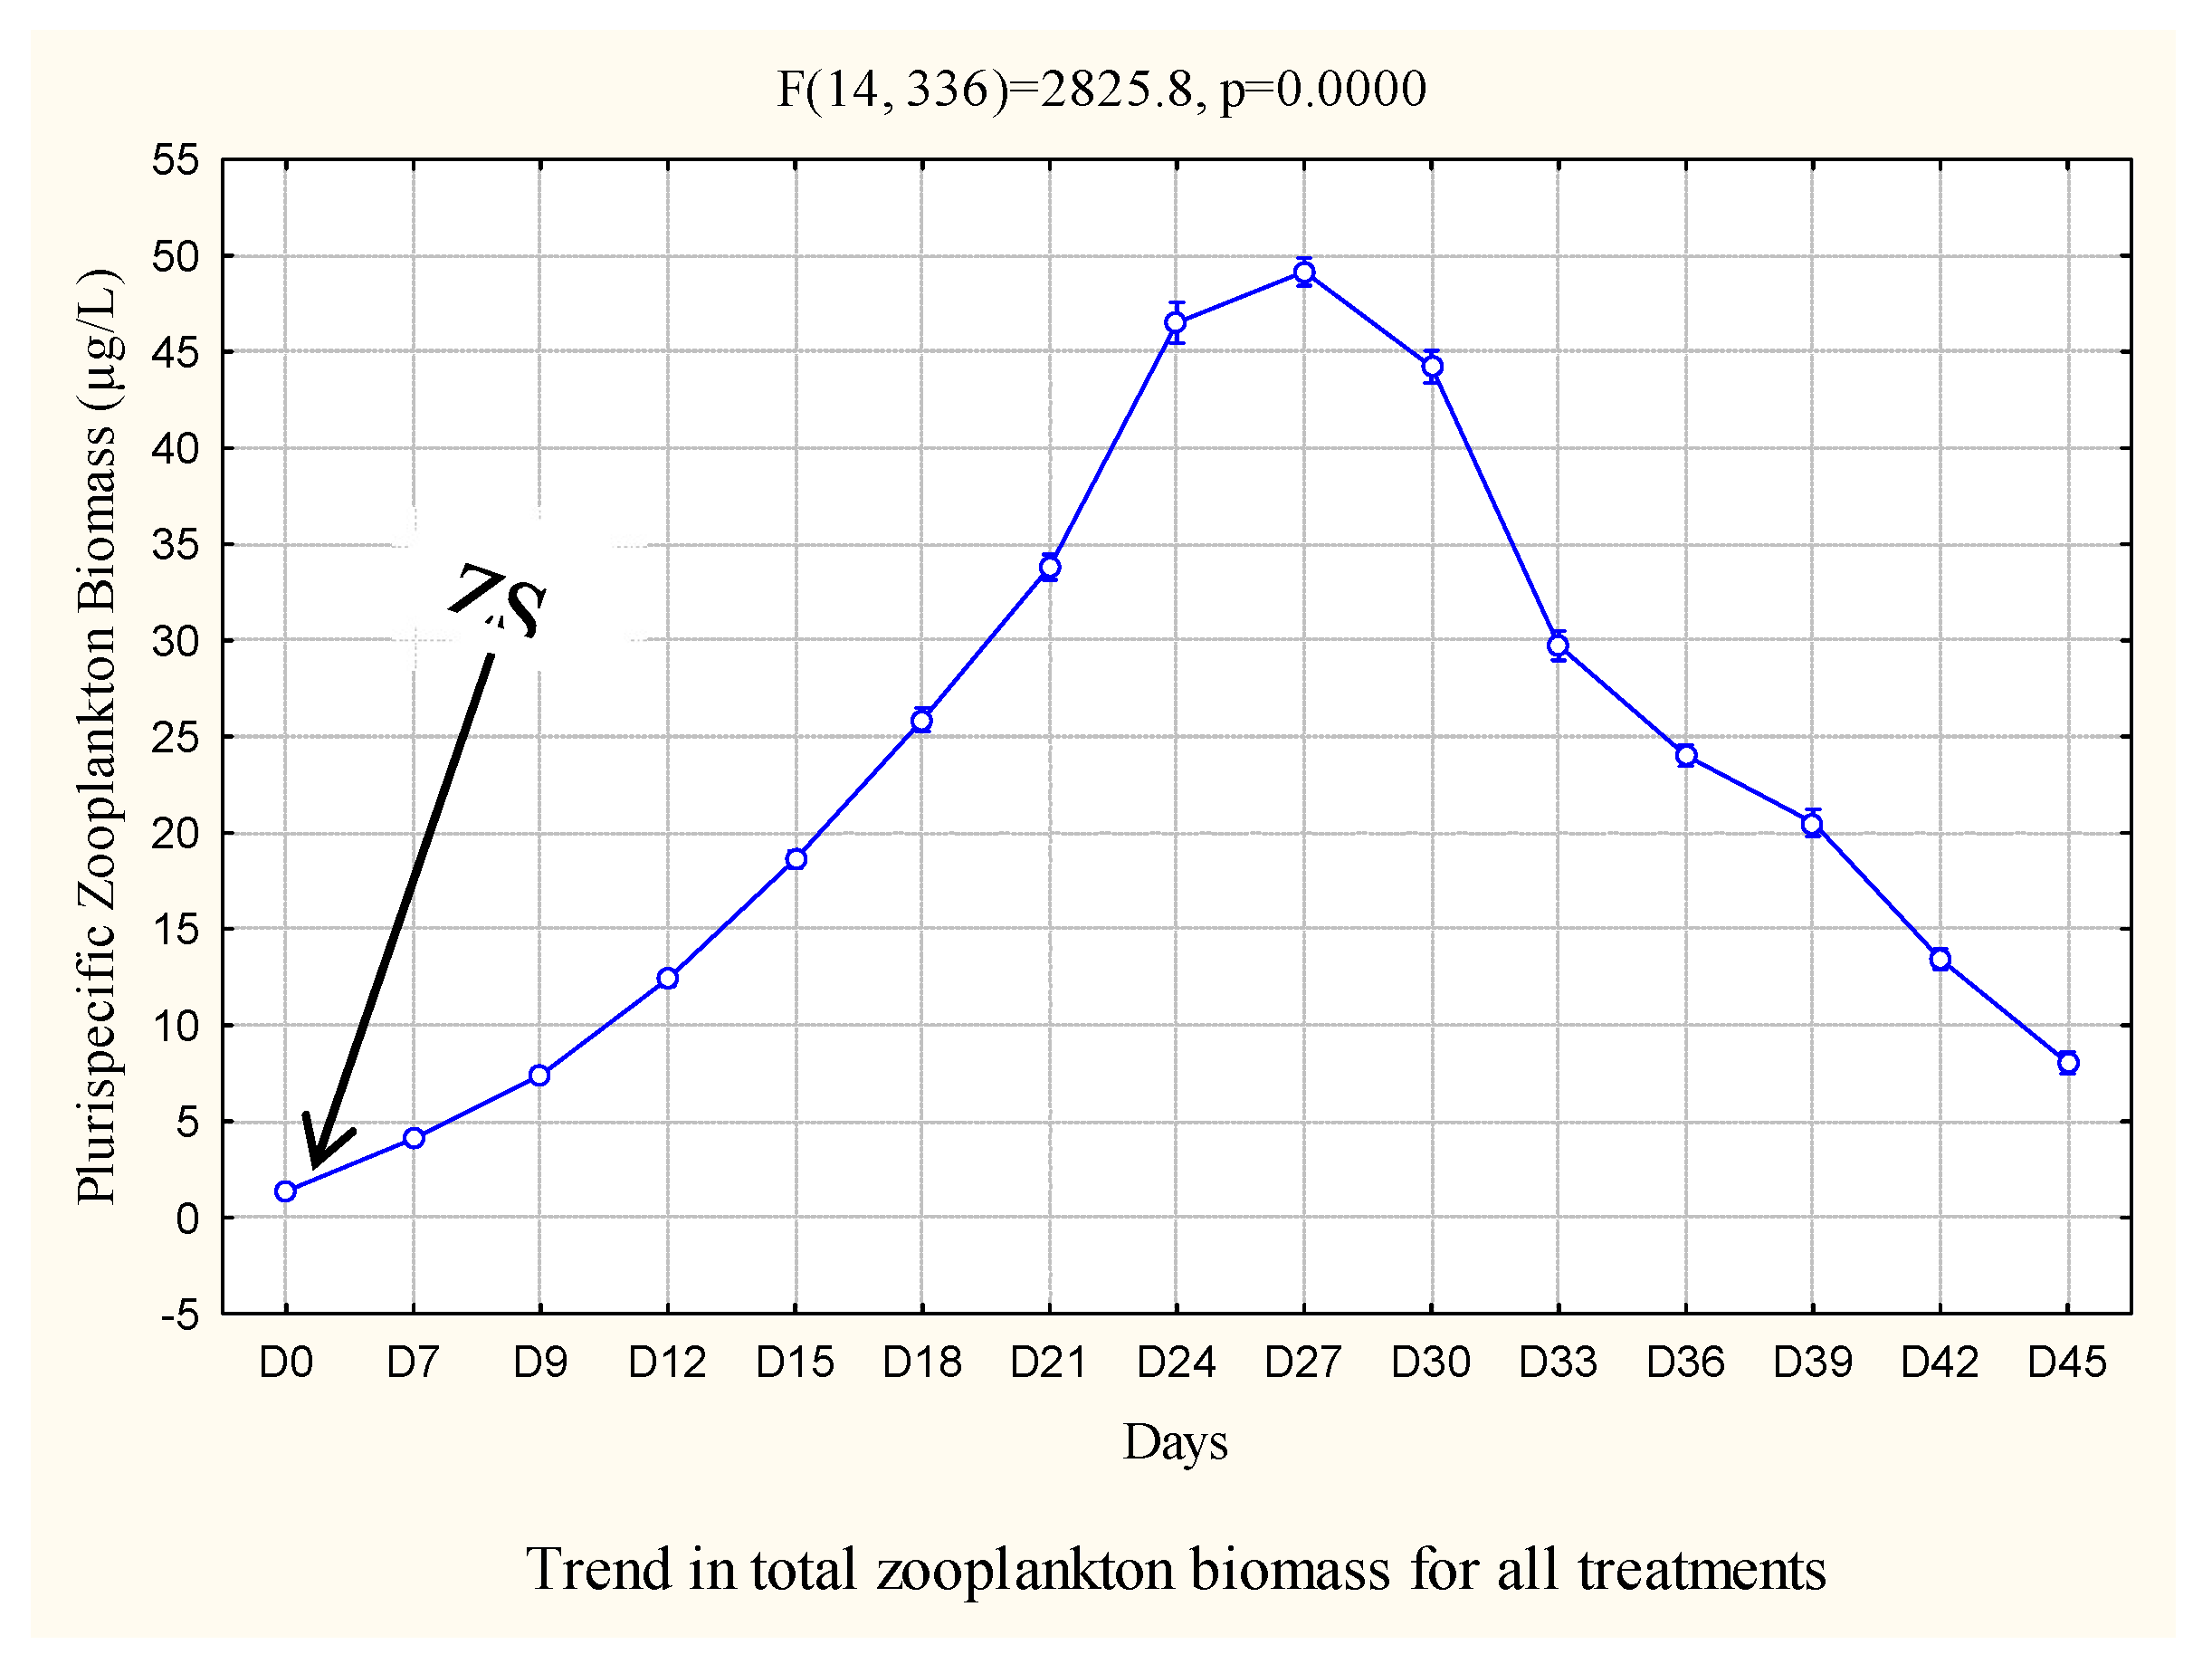
3.3. Multispecies zooplankton biomass

The biomasses of rotifers, copepods, copepod nauplii and cladocerans in the different treatments evolved in three main phases: a latent phase after seeding, from day 0 to day 7, followed by an exponential phase from day 8 to day 27, when they reached their maximum biomasses before decreasing until day 45 (Figure 4), regardless of the dose pig manures used. Maximum biomass was 49.15 ± 31.05 µg/L, with a significant difference (F (28, 84) = 51.41; p = 0.00). However, the evolution of copepod nauplii biomass did not follow the same trend (Figure 3D). Indeed, copepod nauplii reached their maximum biomass on day 24 after seeding in treatment T1 (74.50 ± 2.04 µg/L) followed by treatment T0 (39.98 ± 1.17 µg/L) and on day 33 for treatment T2 (47.44 ± 0.88 µg/L) with a difference (F (28, 84) = 157.97; p = 0.00) (Figure 3D). Biomass trends for rotifers, adult copepods and cladocerans are higher in treatment T2 (Figure 3 A, B, C) followed by T1, except in treatment T0 (Figure 3D).
Furthermore, the highest average zooplankton biomass in dry matter was obtained with treatment T2 (600g/m3) (rotifers 594.35±24.93, copepods 589.73±18.98 and cladocerans 449.95±18.15 µg/L) (Figure 5).
The various linear regressions between chlorophyll-a levels (primary production) and the biomasses of rotifers, copepods and cladocerans show a very strong correlation (r2 between 0.96 and 0.98) except for nauplii copepods, which show a moderate correlation (r2=0.25) (Table 4 and Figure 6). This analysis shows that the organic fertilizers used in this study (pig manure) stimulate primary production (Chl-a) and, in turn, increase in zooplankton biomass.

4. Discussion

Temperature plays major role in the uptake nutrients by phytoplankton and the metabolism zooplankton.The average temperatures recorded in this study fall within temperature tolerance range for zooplankton, which between 15°C and 30°C [27]. It is slightly lower than that obtained by [14] which is around 30±2°C in these zooplankton production environments with poultry manures. This could be explained by the difference in climatic zones. Indeed, the Guinean forest region is the most humid in Guinea with an average temperature oscillate between 24 and 28°C, which would justify the average temperatures obtained during this study. Similarly, the temperatures recorded during this work are close to those obtained by [28] which is between 27 and 28°C and constitutes according to the author temperature range suitable for reproduction Brachionus Calyciflorus rotifers. The almost neutral pH our cultures is close to those obtained by [25,29] which would be between 7.7 to 8, and stimulates the maximum growth proteins and algae therefore chlorophylls and certain species rotifers [30]. The salinity rate obtained was lower than that of [31 between 15 and 20 ppt (parts per thousand) which would be optimal for the production calanoid copepods Acartia tropica. This difference would be due to the composition the culture media. Indeed, [31] used seawater enriched with organic carbon after filtering. The conductivity characterizes the richness in nutrients such as N-NH3, N-NO2, N-NO3 and P-PO4 the media fertilized with pig manures and the highest was obtained treatment T2. Our results are superior to those obtained by [32] with pig manures obtained after feeding pigs with a special diet. It could be said that pig manures used in this study would be richer in nutrients. For significant primary production (chlorophyll-a), a minimum value of 2 mg/L is required, reported by [33]. The mean chl-a values the T2 followed by T1 treatments are significantly above this average. The good primary productivity (Chl-a) recorded in treatment T2 would be due not only to richness the environment but also to the average temperature of the experimental period which constitutes an important determining factor according to [34, 35]. Since there is good correlation between chl-a rate and zooplankton biomass, our results (Table 4 and Figure 6) confirm those [36, 37]. The strong correlations between the dose (organic fertilizer, r² = 0.96) chlorophyll-a on the one hand and those of the biomasses on zooplankton groups and chlorophyll-a the other hand are better than those obtained by [38] (r² = 0.40 with P < 0.01) in the lakes of Jiangsu and Anhui. The most significant chlorophyll-a rate and biomass rotifers, copepods and cladocerans were obtained in T2 treatment. They are higher than those obtained by [14,39]. Indeed, the dose 600g/m3 (T2) pig droppings would have created a favorable environment for growth and reproduction the different groups freshwater zooplankton.

5. Conclusion

Dose of 600g/m3 (T2) pigs manures provides favorable environment for the development phytoplankton via the rate chlorophyll-a and freshwater zooplankton which uses it effectively for its growth and development. This dose could be proposed to rural fishfarmers to replace dry food and artemia which are expensive and almost unavailable the local market. However, studies on the production phytoplankton and zooplankton with doses higher than those used this study should be done in order to better understand the development behavior plankton.

Author Contributions

Conceptualization, manuscrit, editing and methodology A.R.; formal analysis, visualization, writing-original and writing-review, G.D.; Investigation, K.A.O.; resources, review and Data Curation, B.P.; supervision, Writing - review and editing, M.J-C.

Funding

This research received no external funding.

Acknowledgments

We thank the Ministry of Higher Education, Scientific Research and Innovation (MESRSI) of the Republic of Guinea.

Conflicts of Interest

The authors declare no conflict of interest.

References

  1. FAO (Organisation des Nations Unies pour l’alimentation et l’agriculture) Rome, 2021, P44. www.fao.org/pwb.
  2. Lazard, J. La diversité des piscicultures mondiales illustrée par les cas de la Chine et du Nigeria. Cah. Agric. 2014, 23, 24–33. [Google Scholar] [CrossRef]
  3. Fiogbe, E.D.; Kestemont, P. ; Micha, J-C. Performances zootechniques comparées de rotifères d'eau douce Brachionus calyciflorus et de nauplies d'Artemia chez les larves de la perche fluviatile perca fluviatilis. Tropic. 2003, 21, 31-35. http://www.tropicultura.org/text/v21n1.pdf#page=33.
  4. Arimoro, F. First feeding in the African Catfish Clarias anguillaris fry in tanks with the freshwater rotifer Brachionus calyciflorus cultured in a continuous feed back mechanism in comparison with a mixed zooplankton diet. J. of Fish. and Aquat. Sci. 2007, 2, 275–284. [Google Scholar] [CrossRef]
  5. Ashaari, A.; Iehata, S.; Kim H-J.; Rasdi, N.W. Recent advancement of zooplankton enriched with nutrients and probiotic isolates from aquaculture systems: a review, J. of Appli. Anim. Res. 2024, 52-1. [CrossRef]
  6. Adande, R.; Liady, M.N.D.; Tossavi, C.E.; Fiogbe, E.D. The effect of zooplankton produced using rabbit manure and artemia on the survival and growth of larvae of Clarias gariepinus, Heterobranchus longifilis and heteroclarias. Int. of Fish. and Aquat. Sci. 2017, 5, 340–345. [Google Scholar]
  7. Adande, R.; Djidohokpin, G.; Djissou, S.M.A.; Bilivogui, P. Bromatological value of Chironomidae produced from organic fertilizers and their effects on the growth of Clarias gariepinus fry in the Guinean forest region. Blue Biotechnol. 2025. [CrossRef]
  8. CILSS. Permanent Interstate Committee for Drought Control in the Sahel. 2009, P15. https://www.anasa.gov.gn/2021/wp-content/uploads/2021/02/Situation-Alimentaire-et-Nutritionnelle-Guinees-2019.pdf.
  9. APDRA (Association de Pisciculture et Développement rural en Afrique). Pisciculture Paysanne, rapport d’activité, l’innovation piscicole pour satisfaire les besoins alimentaires. 2017, P.23. apdra.org http://apdra.org › IMG › file · Fichier PDF.
  10. Knuckey, R.M.; Brown, MR.; Robert, R.; Frampton, D.M. F. ; “Production of Microalgal Concentrates by Flocculation and Their Assessment as Aquaculture Feeds,” Aquacultural Enginer. 2006, 300-313.
  11. Conceição, L.E.C.; Yúfera, M.; Makridis, P.; Morais, S.; Dinis, M.T. “Live Feeds for Early Stages of Fish Rearing,” Aquaculture Research. 2010. 41, no. 5: 613-640.
  12. Sontakke., R.; Chaturvedi, C.S.; Saharan, N.; Tiwari, V.K.; Haridas, H.; Rani, A.B. Sontakke. R.; Chaturvedi, C.S.; Saharan, N.; Tiwari, V.K.; Haridas, H.; Rani, A.B. Growth response, digestive enzyme activity and stress enzyme status in early stages of an endangered fish, Notopterus chitala (Hamilton, 1822) fed with live feed and formulated diet. Aquaculture. 2019, 182-190. [CrossRef]
  13. Kandathil Rad hakrishnan, D.; AkbarAli, I.; Schmidt, B.V.; John, E.M.; Sivanpillai, S.; Thazhakot Vasunambesan, S. Improvement of nutritional quality of live feed for aquaculture: an overview. Aquac Res. 2020, 51, 1–17. [Google Scholar] [CrossRef]
  14. Agadjihouèdé, H.; Bonou, A.C.; Montchowui, E.; Laleye, P. Recherche de la dose optimale de fiente de volaille pour la production spécifique de zooplancton à des fins piscicoles. Cah. Agric. 2011, 247–60. [Google Scholar] [CrossRef]
  15. Adandé, R.; Liady, M.N.D.; Bokossa, H.K.J.; Djidohokpin, G.; Zouhir, F.; Mensah, G. A.; Fiogbe, E.D. Utilisation rationnelle de fertilisants organiques pour la production de macroinvertébrés benthiquesd’eau douce en pisciculture. Base. 2018, 208–219. [Google Scholar] [CrossRef]
  16. Adande, R. ; Liady, Liady, M.N.D.; Sossoukpe, E.; Fiogbe, E.D. Effect of Different Doses of Rabbit Manure on the Abundance, Growth Rate and Production of Zooplankton in Plurispecific System for Fish Larvae Feeding, Int. J. of Aquacult. 2017, 7, 112-121. http://ija.biopublisher.ca.
  17. UNESCO. Determination of phytosynthetic pigment in seawater, Repport SCOR UNESCO, Pers 17. Monographs on oceanographic methodology, 1966. http://unesdoc.unesco.org/images/0007/000716/071612eo.pdf.
  18. Shoko, A.; Getabu, A.; Mwayuli, G.; Mgaya, Y. Growth performance yields and economic benefits of O. niloticus and Kales (B oleracea) cultured under vegetable-fish culture integration. Tanz. J. of Sc. 2011, 37-48. [CrossRef]
  19. Gebru, T.T.; Balkew, W.K. Plankton Composition and Abundance in Semi Intensive Aquaculture Pond and their Preference by Nile tilapia. Aquacult. Stud. 2023, 23, AQUAST1032. [Google Scholar] [CrossRef]
  20. Rodier, J. ; Legube, B, Analyse de l'eau. 2016, P1600. https://www.unitheque.com/Livre/dunod/Technique_et_ingenierie/L_analyse_de_l_eau-93883.html.
  21. Guiral, D.; Arfi, R.; Bouvy, M.; Pagano, M.; Saint-Jean, L. Ecological organization and succession during natural recolonization of a tropical pond. Hydrobiologia, 1994, 229-242. [CrossRef]
  22. Gras, R.; Saint-Jean, L. ; Croissance en poids de quelques copépodes planctoniques du lac Tchad. Rev. d'Hydrobio. Trop. 1981, 14 : 135-47.
  23. Legendre, M.; Pagano, M.; Saint-Jean, L. Peuplements et biomasse zooplanctonique dans des étangs de pisciculture lagunaire (Layo, Côte d'Ivoire). Étude de la recolonisation après la mise en eau. Aquaculture, 1987, 67, 321-41.
  24. Dabbadie, L. Étude de la viabilité d'une pisciculture rurale à faible niveau d'intrant dans le Centre-Ouest de la Côte d'Ivoire : approche du réseau trophique. Thèse de doctorat de l'université de Paris 6 en océanologie biologique. 1996.
  25. Sipaúba-Tavares, L.H.; Bachion, M.A. Popula tion growth and development of two species of Cladocera, Moina micrura and Diaphanosoma birgei, in laboratory. Brazilian J. of Biology, 2002, 701-11.
  26. Masood, A.; Ahmad, K. ; Particulate matter forecasting using artificial neural network and support vector machine based models. Proceedings of the 3rd International Conference on ICT for Digital, Smart, and Sustainb. Develop. ICIDSSD 2022. [CrossRef]
  27. Ludwig, G.M. Tank culture of sunshine bass Morone chrysops X.M., saxatilis fry with freshwater rotifer B. calyciflorus and salmon starter meal as first food sources. J. of the world Aquacult. Society, 1994, 337-341. [CrossRef]
  28. Kabir, K.A.; Baly, R.L.; Hasan, I.; Naser, M.D.N.; Shahadat, M.D. , High density rotifer culture as live food for larval rearing in Carp hatcheries. World J. of Zoology, 2010, 110-114. https://scholar.google.com.hk/citations?user=--agAFoAAAAJ&hl=zh-CN.
  29. Xu, W.Y.; Cui, J.N. Effect of pH on survival, reproduction, egg viability and growth rate of five closely related rotifer species . Aquat. Ecol. 2008, 607-616. [CrossRef]
  30. Hodaifa, G.M.; Martínez, E.; Sánchez, S. Influence of pH on the Culture of Scenedesmus obliquus in Olive-mill Wastewater. Biotechnol. Bioprocess Eng. 2009, 14, 854–860. [Google Scholar] [CrossRef]
  31. Wilson, J.M.; Ignatius, B.; Sawant, P.B.; Santhosh, B.; Chadha, N.K. Productivity of the calanoid copepod Acartia tropica in response to different salinities and multigenerational acclimatization. Aquaculture, 2021, 531 – 735818. [CrossRef]
  32. Akodogbo , H.H.; Bonou, C.A.; Adandé, R.; Sossou,D.S.; Fiogbé, E.D.; Optimization of zooplankton production from pig dung optimal dose: renewed medium. Agricultural advances, 2015, 15-21. http://www.jebas.org/00300120022015/AKODOGBO%20et%20al%20JEBAS.pdf.
  33. Canovas, S.; Casellas, C.; Picot, B.; Pena, G.; Bontoux, J. Evolution annuelle du peuplement zooplanc tonique dans un lagunage à haut rendement et incidence du temps de séjour. Rev. des Sci. de l'Eau, 1991, 269-89.
  34. Carvalho, L.; Solimini, A. G.; Phillips, G.; Pietiläinen, O.P.; Moe, J.; Cardoso, A. C.; Solheim, A. L.; Ott, I.; Søndergaard, M.; Tartari, G.; Rekolainen, S. Site-specific chlorophyll reference conditions for lakes in Northern and Western Europe. Hydrobiologia, 2009, 633-5966.
  35. Liu, Y.; Guo, H.; Yang, P. Exploring the influence of lake water chemistry on chlorophyll a: A multivariate statistical model analysis. Ecol. Model. 2010, 221- 681688.
  36. Trevisan, G.V.; Forsberg, B.R. Relationships among ni trogen and total phosphorus, algal biomass and zooplankton density in the central Amazonia lakes. Hydrobiologia, 2007, 357-365.
  37. Magumba, D.; Maruyama, A.; Takagaki, M.; Kato, A.; Kikuchi, M. Relationships between Chlorophyll-a, Phosphorus and Nitrogen as Fundamentals for Controlling Phytoplankton Biomass in Lakes. Environ. Control Biol. 2013; 51. [Google Scholar] [CrossRef]
  38. Wu, B.; Dai, S.; Wen, X.; Qian, C.; Luo, F.; Xu, J.; Wang, X.; Li, Y.; Xi, Y. Chlorophyll-nutrient relationship changes with lake type, season and small-bodied zooplankton in a set of subtropical shallow lakes. Ecological Indicators, 2022, 135, art. no. 108571. [CrossRef]
  39. Ouba, A. Variabilité saisonnière et interannuelle (2000-2013) de l’abondance, de la biomasse et du spectre de taille du zooplancton dans le bassin Levantin. Ecosystèmes. Université Paris VI, Français. 2015, NNT: 2015PA066545. tel-01325647.
Figure 1. Mean concentrations of nutrients in the different production media. T0 (the control), T1, T2 corresponding respectively to 0, 300,600 g of dry pig manure (PM).
Preprints 151367 g001
Figure 2. Mean concentrations of chloropyhll-a in the different production media. T0 (the control), T1, T2 corresponding respectively to 0, 300,600 g of dry pig manure (PM).
Preprints 151367 g002
Figure 3. Evolution of the density different zooplankton groups on treatments. (ZS : zooplankton seeding), Rotif : rotifers, Cope : Copepod, Clado : Cladocera, Naup : Copepod nauplii,T0 (the control), T1, T2 corresponding respectively to 0, 300,600 g of dry pig manure (PM).
Preprints 151367 g003
Figure 4. : Evolution of total zooplankton biomass basis pig manure as a function of days. (ZS : zooplankton seeding) .
Preprints 151367 g004
Figure 5. : Estimation total biomass produced by treatment to zooplankton groups.
Preprints 151367 g005
Figure 6. Linear regression association between total biomass rotifers, copepods,copepods nauplii, cladocerans and concentration of chlorophyll-a.
Preprints 151367 g006
Table 1. Physico-chemical parameters of the different treatments.
Parameters Cond (µs/cm) pH TDS T°C DO (mg/L) Sal (mg/L)
T0 225±6.12c 7.33±0.37c 162.4±4.86c 28.34±0.38a 4.7±0.17c 0.21±0.00a
T1 574.13±76.72b 6.73±0.40abc 277.6±50.29b 27.85±0.36a 6.03±0.05ab 0.33±0.01ab
T2 616.26±24.91a 6.4±0.17ab 397.73±39.03a 29.36±0.08a 6.03±0.05ab 0.36±0.04ab
Cond: conductivity,DO: dissolved oxygen, Sal: salinity, Transp: transparence, TDS: total dissolved solids. T0 (the control), T1,T2 corresponding respectively to 0,300,600 g of dry pig manure (PM). Mean values affected by different letters on the same colonne are significantly different at 5% threshold.
Table 4. Linear regression association between total biomass zooplankton and of chlorophyll-a (µg/L).
Characters Regression coefficients t-test at 5% significant (p<0.05) Correlation type
X Y a b r r2 N p-value CT
Chl-a (µg/L) Biomass Rotifers 74.05 239.39 0.99 0.98 1999 0.07 ***
Biomass Copepods 76.18 217.98 0.98 0.96 0.34 ***
Biomass copepods nauplii 26.50 232.93 0.50 0.25 0.67 **
Biomass Cladocerans 94.33 0.35 0.99 0.98 0.32 ***
CT = Correlation type; *** shows the strong correlation (r > 0.70); ** shows moderate correlation (r = 0.51-0.69); * represent weak correlation (r < 0.50); shows insignificant correlation when p>0.05; a : intercept of regression line, b : slope of regression line, r: correlation coefficient.
Disclaimer/Publisher’s Note: The statements, opinions and data contained in all publications are solely those of the individual author(s) and contributor(s) and not of MDPI and/or the editor(s). MDPI and/or the editor(s) disclaim responsibility for any injury to people or property resulting from any ideas, methods, instructions or products referred to in the content.
Copyright: This open access article is published under a Creative Commons CC BY 4.0 license, which permit the free download, distribution, and reuse, provided that the author and preprint are cited in any reuse.
Prerpints.org logo

Preprints.org is a free preprint server supported by MDPI in Basel, Switzerland.

Subscribe

Disclaimer

Terms of Use

Privacy Policy

Privacy Settings

© 2025 MDPI (Basel, Switzerland) unless otherwise stated