
Submitted:
05 March 2025
Posted:
06 March 2025
You are already at the latest version
Abstract
Inflammatory bowel diseases(IBD), including mainly ulcerative colitis (UC) and Crohn's disease (CD), have been associated with cognitive and psychological changes, though the mechanisms remain unclear.
This prospective case-control study aimed to evaluate cognitive performance, and biomarkers (homocysteine, serum amyloid A, brain derived neurotrophic factor and S100B protein) in IBD patients.
A total of 90 individuals (34 UC, 21 CD, and 35 controls) were assessed using the Montreal Cognitive Assessment (MoCA), Memory Impairment Index (MIS), and biomarker analysis. MoCA and MIS testing showed significant differences between UC, CD and controls, with lower scores observed in IBD groups (p=0.003, p=0.015). Regarding trail making tests, digit symbol substitution test and forward and backward digit span, no significant changes were observed. No functional deficits were observed in daily activities. Biomarker analysis revealed lower brain-derived neurotrophic factor and higher serum amyloid A levels in IBD patients, correlated to MOCA and MIS score. There were no significant differences in psychological distress between IBD patients and controls. Subtle cognitive declines were noted across all groups during the 1-year follow-up, without any statistical significance when groups were compared.
In conclusion, IBD patients reported lower cognitive scores compared to controls, while no differences in depression and anxiety scores were observed. Higher BDNF levels correlated with better cognitive functioning, while higher serum amyloid A correlated with lower cognitive functioning.
Keywords:
IBD
; crohn's disease
; ulcerative collitis
; dementia
; mild cognitive impairment
; cognitive impairment
; depression
; anxiety
; stress
; MoCA
; serum amyloid A
; SAA
; homocysteine
; HCY
; BDNF
; brain derived neurotrophic factor
; S100b protein
; biomarker
1. Introduction
Inflammatory bowel disease (IBD) is a group of conditions characterized by chronic intestinal inflammation, with the most common types being Crohn’s disease (CD) and ulcerative colitis (UC) [1,2]. Although the exact mechanisms of IBD remain unclear, its pathogenesis is thought to involve a complex interplay of genetic predisposition, environmental triggers, and immune dysregulation. A hallmark of IBD is an abnormal immune response where the body mistakenly targets gut microbiota, leading to intestinal inflammation, disruption of the intestinal barrier, and systemic inflammation. This chronic inflammatory state perpetuates tissue damage and is central to the disease’s progression [3].
Mild cognitive impairment (MCI) is characterized by cognitive decline that exceeds normal aging but does not significantly interfere with daily functioning. Risk factors for MCI include aging, genetics, lifestyle behaviors, and medical conditions [4]. Emerging evidence suggests that systemic inflammation, including chronic inflammation seen in IBD, may contribute to cognitive impairment by promoting neuroinflammation and oxidative stress [5,6]. Notably, some studies have identified a potential association between IBD and an increased risk of Alzheimer’s disease (AD) or other neurodegenerative disorders, suggesting shared inflammatory pathways [5,7,8].
Several biomarkers, including homocysteine (Hcy), serum amyloid A (SAA), brain-derived neurotrophic factor (BDNF), and S100 calcium-binding protein B (S100B), have been implicated in both IBD and neurodegenerative processes [9]. Elevated Hcy levels in IBD patients have been associated with cerebrovascular damage, oxidative stress, and cognitive decline [10,11]. SAA, an acute-phase protein produced during inflammation, was found to contribute to neuroinflammation and neuronal damage, though its role in IBD is not well understood. Chronic gut inflammation in IBD has been linked to increased amyloid protein levels [12,13,14]. Similarly, BDNF, essential for neuronal growth and synaptic function, was reported to be dysregulated in IBD and linked to neurological disorders, though its exact role in IBD-associated inflammation remains unclear [15,16]. Lastly, S100B, a protein involved in neuroinflammation and oxidative stress, was found to be elevated in both the intestinal tissue and serum of IBD patients, reflecting damage to the enteric nervous system and the systemic effects of inflammation [17].
Aim of the Study
The aim of this study was to explore the role of gut-brain axis (GBA) interactions in the development of MCI in patients diagnosed with IBD. The focus was on pathological changes at the intestinal level, including disruption of the intestinal barrier and alterations in the gut microbiome. Blood biomarkers associated with cognitive dysfunction, namely SAA, Hcy, S100B, and BDNF, were evaluated as potential predictors for the development of MCI or dementia in the study population.
2. Material and Methods
2.1. Study Design and Assessment Methodology
A comprehensive research protocol was developed and published at the outset of the study [19], ensuring a structured and transparent approach. This facilitated adherence to predefined methodologies, minimized the risk of bias, and enhanced the study’s reproducibility. Cognitive assessments were conducted by an examiner officially certified to administer the Montreal Cognitive Assessment (MoCA), ensuring the validity and reliability of the evaluations. The Memory Index Score (MIS), derived from the MoCA, was used to provide a focused measure of memory performance, offering a more nuanced analysis of memory impairment in the study population. Additional tools included the Depression, Anxiety, and Stress Scale (DASS-21), as well as the Activities of Daily Living (ADL) and Instrumental Activities of Daily Living (IADL) questionnaires, which were sourced from publicly available materials. Permission was obtained for the EQ-5D-5L questionnaire to assess quality of life, ensuring compliance with copyright and ethical guidelines [20,21]. Cognitive performance was further evaluated using the Trail Making Tests A and B (TMT-A and TMT-B), the Digit Symbol Substitution Test (DSST), and the Forward and Backward Digit Span (FDS and BDS) tests, all sourced from freely available resources. This methodology ensured the ethical and rigorous use of validated assessment tools while maintaining accessibility for data collection.
2.2. Design and Participants
We conducted a single-center observational, prospective, analytic case-control study from December 2021 to May 2024. The study focused on patients from medical clinics in Cluj-Napoca, including the Institute of Gastroenterology and Hepatology O. Fodor, the County Emergency Hospital, and the Clinical CF Hospital. Three separate groups consisting of IBD patients (CD group, UC group) and a control group (CG) were recruited in the study. A follow-up was performed at 50-54 weeks after the baseline visit.
2.3. Inclusion Criteria
Patients in the CD and UC groups were required to meet the following inclusion criteria: male or female, age over 18 years, a confirmed diagnosis of IBD, and signed informed consent. Patients in the IBD groups were required to meet specific remission criteria: CD patients needed to have a Crohn’s Disease Activity Index (CDAI) score below 150, while UC patients required a Harvey-Bradshaw Index (HBI) score below 2. Participants in the CG were required to be male or female, age over 18 years, with no diagnosis of IBD and a good level of overall health.
2.4. Exclusion Criteria
Absolute exclusion criteria were prior stroke or myocardial infarction or cardiac arrest, severe organ failure, familial Alzheimer’s Disease (AD), concomitant past and current neurological disorders (epilepsy, encephalopathy of any cause, history of severe head trauma, history of encephalitis, multiple sclerosis, Parkinson’s disease, brain tumor, and dementia due to any cause), pregnancy, prior psychiatric disorders and chronic use of neuroleptics and anticholinergic medication (depression, anxiety disorder, attention deficit hyperactivity disorder, autism spectrum disorders, posttraumatic stress disorder, schizophrenia, personality disorders, and alcohol and drug abuse), unclear IBD diagnosis, prior involvement in clinical trials, current and past history of neoplasia, use of vitamin B12 and B9 supplements, short bowel syndrome, diabetes mellitus, hypothyroidism, prior diagnosis of atrial fibrillation and uncontrolled arterial hypertension.
2.5. Clinical Assessment
Patients included in the study provided informed consent by signing the Informed Consent Form (ICF). Following this, each patient underwent a thorough physical examination, which included measurements of blood pressure, pulse, and pulse oximetry. IBD severity was assessed using CDAI for CD patients and HBI for UC patients. A comprehensive neurological examination was then conducted. Cognitive assessments were performed using validated tools, including the Montreal Cognitive Assessment (MOCA), Memory Impairment Score (MIS), Forward and Backward Digit Span (FDS and BDS), Trail Making Test A and B (TMT-A and TMT-B), and the Digit Symbol Substitution Test (DSST). Additionally, patients completed a series of standardized questionnaires: the Depression Anxiety Stress Scales (DASS-21), the COVID-19 Impact Scale, a short cognitive assessment, and a quality-of-life questionnaire (5Q-5D-5L). Activities of Daily Living (ADL) and Instrumental Activities of Daily Living (IADL) were also performed in order to stratify patients who suffer from mild/moderate or severe cognitive impairment from patients with all-cause dementia. A comprehensive assessment of the medical history was also performed. A 5 mL blood sample was taken from the participants and stored until it was examined.
2.6. Laboratory Assessment
The concentrations of serum HCY, BDNF, SAA, and S100B were assessed using enzyme-linked immunosorbent assay (ELISA) kits. Each sample was tested in duplicate according to the instructions provided with the kits (Table 1).
For each parameter, a calibration curve was created using the protein standard provided with the kit. Absorbance was measured with a microplate reader (ClarioStar, BMGLabtech, Ortenberg, Germany), and the data were acquired and analyzed using the Mars software integrated into the system. A four-parameter logistic regression model was used to develop the calibration curve for quantification, and the final concentration was determined by averaging the duplicate measurements. Data is presented in Figure 1 and Table 8.
2.7. Statistical Analysis
Counts and percentages were used to describe categorical data. Medians and interquartile ranges (IQR) were used to describe data not following normal distribution. Comparisons between groups regarding categorical data were performed with Chi-square test or Fisher exact test. Comparisons between three groups for data not following the normal distribution were performed with Kruskal-Wallis test, followed by nonparametric post-hoc tests. To verify the associations observed in the univariate analyses between the disease and biomarkers multivariate linear models were fit. For each model the biomarkers were selected as dependent variables, and the disease group (CD, UC, or CG) was the exploratory variable. In case the residuals were not normally distributed, the logarithm of the dependent variable was used instead. Each model was adjusted for confounding variables, selected based on the literature and clinical or physio pathological rationale. The number of independent variables did not surpass the rule of thumb of ten subjects per variable (degree of freedom), to prevent overfitting. For each model the multicollinearity was checked with correlation analyses and variance inflation factor. The heteroskedasticity was checked with Breusch-Pagan test, as well as with scale-location plots. The linear functional form was assessed with component plus residual plots. All statistical analysis were performed with the R environment for statistical computing and graphics (R Foundation for Statistical Computing, Vienna, Austria), version 4.3.2 [18].
3. Results
3.1. Study Participants
A total of 90 subjects were included in the final analysis, divided into three groups: 21 in the CD group, 34 in the UC group, and 35 in the CG. Demographics such as age (p=0.528), education level (p=0.376), smoking index/year (p=0.312), and body mass index (BMI) (p=0.789) were similar across groups (Table 2). However, a higher proportion of females was observed in the CG compared to the UC and CD groups (p=0.032). There was no significant difference in the proportion of participants living in rural versus urban areas (p=0.22). CD and UC participants reported engaging in physical activity at least once per week with a significantly higher frequency than the CG (p=0.013) (Table 2). Ten patients were excluded from the IBD groups: three due to pregnancy, five for personal reasons, and two because relocation made participation impractical, while 10 subjects from the control group, out of which 9 were males were excluded from the study due to non-compliance and failure to present to the 12 months visit. None of the included subjects had an impairment in the ADL and IADL scales.
Patients experiencing acute flares were recruited during hospitalization, with interviews and blood samples collected after the resolution of the flare. All patients included in the UC group had a HBI score <2, indicating they were in clinical remission. Similarly, all patients in the CD group had a CDAI score <150, confirming their remission status at the time of assessment. Therefore, disease activity was minimal across both groups, reducing the potential confounding effects of active inflammation on cognitive performance and biomarker levels.
Chronic treatment used by the UC and CD group is presented in Table 3. Most of the CD and UC group were treated with biologic therapy, encompassing 57% and 47% of total.
3.2. Baseline Cognitive and Emotional Function in CD, UC, and Controls: A Comparative Analysis
Baseline MoCA testing revealed significantly lower scores in the CD group compared to the CG (p=0.004) and in the UC group compared to the CG (p=0.017), with no significant difference between the CD and UC groups (p=0.301). Similarly, MIS scores were significantly lower in the CD group (p=0.022) and UC group (p=0.038) compared to the CG, but no significant difference was observed between the CD and UC groups (p=0.43) (Table 4). TMT-A and TMT-B completion times were higher in the CD and UC groups compared to controls, indicating trends toward slower processing speed, attention, and executive function, though these differences were not statistically significant (p=0.186 for TMT-A; p=0.113 for TMT-B). DSST scores were lower in the CD and UC groups compared to controls, suggesting potential impacts on processing speed, attention, and working memory, though not statistically significant (p=0.374)(Table 4). In the FDS test, all groups showed comparable results (p=0.968). However, the CD group demonstrated lower scores in the BDS test compared to the other groups, though the difference was not statistically significant (p=0.6).
Patients were stratified into four cognitive categories based on their MoCA scores: Normal cognition: MoCA ≥ 26; Mild cognitive impairment (MCI): MoCA 18-25; Moderate cognitive impairment: MoCA 11-17; Severe cognitive impairment: MoCA ≤ 10. No participants showed impairments in ADL or IADL assessments, supporting the classification of cognitive impairment without concurrent functional decline. Cognitive impairment was identified in 14 (66.67%) CD patients, 16 (47.06%) UC patients, and 9 (25.71%) controls (p=0.006). Moderate cognitive impairment was observed in 5 (23.81%) CD patients and 3 (8.82%) UC patients, while none of the controls exhibited such low scores(Table 5).
No statistically significant differences were observed in stress, anxiety, or depression scores between the UC, CD, and control groups (p > 0.5). Interestingly, psychological scores were lower in the IBD groups compared to controls. Regarding anxiety, very severe levels were reported in 3 CD patients (14.29%). Mild and moderate anxiety levels were less frequent in the CD group (14.29% and 9.52%) compared to the UC group (17.65% and 14.71%) and controls (22.86% and 17.14%). Severe depression was reported by 1 CD patient (4.76%) and 1 UC patient (2.94%), while none of the controls reported this level. Mild and moderate depression levels were less frequent in the UC group (8.82% and 8.82%) compared to the CD group (9.52% and 9.52%) and controls (11.43% and 14.29%) (Table 6).
3.3. Baseline Biomarker Assessment in CD, UC and Controls: A Comparative Analysis
Serum biomarkers were assessed during the baseline visit. Hcy was elevated in the CD group, followed by the UC group, however none of the changes were statistically significant (p=0.369). SAA levels were highest in the UC group, followed surprisingly by the CG group. Statistically significant differences were observed across all group comparisons (p=0.003), while no significant difference was found between the CD and CG groups (p=0.561). BDNF levels were lowest in the UC group, followed by the CD group, with statistically significant differences observed across all groups (p<0.001). However, no significant difference was found between the CD and UC groups (p=0.071)(Table 7, Figure 1).
3.4. Longitudinal Findings in Cognitive Function in CD, UC and Controls: A Comparative Analysis
At the 1-year follow-up, small decreases in MoCA and MIS scores were observed across all groups, reflecting mild cognitive decline over time, though not statistically significant (Table 8). Notably, two CD patients who initiated anti-integrin therapy showed significant cognitive improvement, with MoCA score increases of 12 and 4 points, respectively.

Table 8.
Comparison of Cognitive Scores at 1 year visit (IQR=interquartile range; CI=confidence interval;).
Table 8.
Comparison of Cognitive Scores at 1 year visit (IQR=interquartile range; CI=confidence interval;).
| Group | CD Group (n=21) |
UC Group (n=34) |
CG (n=35) |
P (CD-UC, CD-CG, UC-CG) |
|---|---|---|---|---|
| MOCA- 1 year visit, median (IQR) | 23 (18–27) | 25.5 (21–28) | 27 (23.5–30) | 0.012 (0.388, 0.016, 0.035) |
| MIS- 1 year visit, median (IQR) | 10 (7–13) | 12 (9–14) | 14 (11–15) | 0.033 (0.67, 0.069, 0.041) |
At the 1-year follow-up, a small decrease in both MoCA and MIS scores was observed across all three groups (Table 9). However, none of the differences proved stastistically significant (p>0.05)
3.5. Multivariate Analysis of Biomarkers in CU, CD, and Controls: Adjusting for Lifestyle Factors
To assess the robustness of the findings in the univariate analyses we created multiple linear regression models predicting the biomarkers of interest based on the disease group and adjusted for body mass index, number of sleep hours and practice of sport. The analysis of biomarkers revealed the following results: SAA: The UC group showed higher SAA levels compared to controls, with this difference remaining significant after adjusting for body mass index, sleep, and physical activity (p = 0.029, R² = 0.08) (Table 10). Hcy: No significant differences in Hcy levels were observed between the disease groups after adjustment in the multivariate model (Table 11). BDNF: Both the CD and UC groups exhibited lower BDNF levels compared to controls, with this difference maintaining significance in the multivariate analysis (p < 0.001, R² = 0.18) (Table 12).
3.6. Correlations Between Serum Biomarkers and Cognitive Functioning
3.7. Diagnostic Performance of Serum Biomarkers for Cognitive Dysfunction
ROC curve analysis was performed to assess the diagnostic accuracy of BDNF, SAA, and Hcy in identifying cognitive dysfunction. The area under the curve (AUC) values for all three biomarkers ranged between 0.5 and 0.6, indicating poor discriminative ability. No significant differences were observed between the AUC values of the biomarkers, suggesting that none provided a reliable diagnostic tool for cognitive dysfunction.
4. Discussions
This study provides new insights into the GBA interactions in IBD, highlighting potential links between chronic intestinal inflammation, cognitive impairment, and biomarker alterations.
Cognitive assessment using MoCA and MIS revealed that patients with IBD are more likely to exhibit MCI compared to controls, even though deficits in daily functioning (as assessed by ADL and IADL scores) were not apparent. While MoCA and MIS scores were significantly diminished in IBD group compared to controls and no significant differences where observed in TMT-A, TMT-B or DSST, which are testing solely processing speed, attention and executive function it could suggest that memory is mostly affected in the patients suffering of IBD. These findings align with prior research suggesting MCI in this population [22,23,24]. However, the prevalence of cognitive impairment in UC patients (47.06%) was lower than previously reported (89.65%), likely due to differences in diagnostic criteria, study populations, and cognitive assessment tools [22]. Standardizing assessment protocols across studies would enhance comparability and provide clearer insights into cognitive outcomes in IBD populations.
The mild cognitive decline observed over one year underscores the importance of ongoing monitoring in IBD patients. Notably, cognitive improvements in two CD patients receiving anti-integrin therapy suggest a potential link between advanced treatment and cognitive outcomes, highlighting an area for future investigation.
Biomarker analyses highlighted lower BDNF levels and higher SAA levels in IBD patients, which remained significant even after adjusting for confounders. These results suggest potential links between systemic inflammation and cognitive decline in IBD populations, particularly in UC patients. Hcy levels showed no significant associations, suggesting limited relevance as a cognitive biomarker in this context. The S100B protein levels did not surpass the detection threshold of the assay kit used in this study, suggesting that its normal physiological range may be higher than the sensitivity limit of the kit [25]. This finding implies that direct neuronal damage, as indicated by elevated S100B levels, is unlikely to be the primary mechanism underlying the cognitive changes observed in our cohort. Instead, these cognitive alterations are more likely attributable to a functional impairment of the blood-brain barrier, which may disrupt neuroinflammatory homeostasis without necessarily causing extensive neuronal injury.
The correlation between biomarkers and cognitive decline was present but weak, primarily due to the limited number of included patients, which may have affected the statistical power of the analysis. This limitation could be addressed in future studies by increasing the sample size, ensuring a more comprehensive patient inclusion strategy, and incorporating additional biomarkers or longitudinal assessments to strengthen the analysis of cognitive decline in IBD patients. ROC curve analysis indicated low performance in diagnostic cognitive impairment, but further studies involving a larger number of patients could shape this pattern an increase the sensitivity and specificity of this biomarker set.
Contrary to existing literature, stress, anxiety, and depression scores were lower in IBD patients compared to controls [24,26,27,28]. This unexpected finding may reflect effective coping mechanisms, social support, or selection bias in the study cohort. However, patients required to be in clinical remission period which could also positively influence their depression, anxiety and stres scores. Also, biologic treatment could improve their affective lifestyle. Further research is needed to explore the psychosocial and environmental factors influencing psychological resilience in IBD populations.
One of the main limitations of this study was the widespread fear of hospitals, a phenomenon exacerbated by the COVID-19 pandemic. However, this challenge was mitigated by the fact that many patients required regular medical prescriptions at monthly or bi-monthly intervals, ensuring continued participation. Language barriers also posed a challenge, as several cognitive assessment questionnaires have not been clinically validated in Romania, restricting the selection of available tools. Additionally, telephonic and video-based cognitive testing were not feasible due to the absence of officially approved remote testing methods. Lastly, the relatively small sample size and the limited follow-up period represent further limitations, potentially restricting the generalizability of the findings. Biomarkers such as C-reactive protein and fecal calprotectin were unavailable for many patients due to the nature of their consultations, clinical assessment tools were utilized to distinguish between remission and active disease. Specifically, the CDAI and the HBI were employed to stratify patients and ensure accurate classification. From the initial number of patients, a total of 20 were lost to follow-up due to different reasons. Since 7 of the CD patients were lost and only 3 from the UC group, it created a gap in the total number of IBD patients. Also, in the controls group, out of 10 lost to follow-up patients, 9 were males, thus creating a significant difference in gender between the 3 groups.
Future research should focus on larger, longitudinal studies involving diverse populations to confirm observed trends in cognitive performance and biomarker levels among IBD patients. Such studies should assess the influence of disease severity, inflammation, and treatment on cognitive and psychological outcomes, while also identifying protective factors and effective interventions.
5. Conclusions
This study provides valuable insights into cognitive and biomarker differences in IBD patients, emphasizing the need for further investigation. While cognitive impairments in IBD are detectable, they are not universally severe and may occur without significant functional deficits. Lower BDNF and higher SAA levels suggest a potential link between systemic inflammation and cognitive decline in IBD, particularly in UC patients. Future research should prioritize longitudinal studies, standardized cognitive assessment protocols, and additional biomarker exploration to clarify disease-related cognitive changes and inform targeted interventions.
Author Contributions
Conceptualization: O.-F.S., ; Methodology: A.-D.S.; Software: C.-D.L.; Validation- all authors; Formal Analysis, C.-D.L.; Investigation, O.-F.S., A.-M.S., X.-M.M., M.I. ; Resources: A.-I.T., R.S.; Data Curation: M.I.; Writing—Original Draft Preparation: O.-F.S., A.-D.S., M.I., C.-D.L., A.-I.T.; Writing—Review & Editing: A.-I.T.; Visualization: A.-I.T.; Supervision, A.-I.T.; Project Administration, A.-I.T.; Funding Acquisition, O.-F.S. All authors have read and agreed to the published version of the manuscript.
Ethical Approval
The protocol was approved by the Ethics Committees of the Iuliu Hatieganu University of Medicine and Pharmacy, Cluj-Napoca (# 52/28.02.2022), the Regional Institute of Gastroenterology and Hepatology “Octavian Fodor” (# 10148/11.10.2022), and the Clinical CF Hospital (# 14/13.07.2022). It was registered with ClinicalTrials (identifier NCT05760729). The study was conducted in accordance with the ethical principles outlined in the current version of the Declaration of Helsinki of 1975, revised in 2013, and all applicable local regulatory requirements. All participants signed and dated the latest approved version of the informed consent form (ICF) before any study specific procedures were performed. A written version of the participant information and informed consent was presented to each participant, detailing no less than the exact nature of the study, what it will involve for the participant, the implications and constraints of the protocol, the known side effects and any risks involved in taking part, and the agreement to use the data for primary and secondary data analyses. It was clearly stated that the participant wass free to withdraw from the study at any time for any reason without prejudice to future care, without affecting their legal rights, and with no obligation to provide a reason for withdrawal.
Data availability statement
Study data is available upon reasonable request from the corresponding author. The data will not be published on a public platform for ethical reasons. The pseudonymization of the participants will be removed from the database if a request for access is received.
Acknowledgments
We would like to thank all study participants, all clinicians who answered the call of participating in this study, hospital management, nurses, and all who have indirectly and directly facilitated this study. This study was financed by the Iuliu Hatieganu University of Medicine and Pharmacy, Cluj-Napoca, Romania (grant numbers 881/46/12 January 2022 and 772/37/11 January 2023).
Conflicts of Interest
None of the authors declare any conflict of interest.
Abbreviations
AD: Alzheimer’s disease; ADL: activities of daily living; BDNF: brain-derived neurotrophic factor; BDST: backward digit span testing; CD: Crohn’s disease; CDAI: Crohn Disease Activity Index; CG: Control group; CNS: Central Nervous system; CV=Coefficient of variation; DASS: Depression Anxiety Stress Scale; DSST: Digit Symbol Substitution Test; ELISA: enzyme-linked immunosorbent assay; ENS: Enteric Nervous system; FDST: forward digit span testing; GBA: gut–brain axis; HBI: Harvey-Bradshaw Index; Hcy: homocysteine; IADL: Instrumental Activities of Daily Living; IBD: inflammatory bowel disease; IQR=Interquartile range; MCI: mild cognitive impairment; MIS: memory impairment score; MOCA: Montreal Cognitive Assessment; S100B: S100 calcium-binding protein B; SAA: serum amyloid A; SCCAI: Simple Clinical Colitis Activity Index; TMT: Trail Making Test; UC: ulcerative colitis.
References
- Maaser C, Sturm A, Vavricka S, Kucharzik T, Fiorino G, Annese V, European Crohn’s and Colitis Organisation (ECCO), European Society of Gastrointestinal and Abdominal Radiology (ESGAR). ECCO-ESGAR Guideline for Diagnostic Assessment in IBD part 1: initial diagnosis, monitoring of known IBD, detection of complications. J Crohns Colitis 2019, 13, 144–164. [Google Scholar] [CrossRef]
- Sturm A, Maaser C, Calabrese E, Annese V, Fiorino G, Kucharzik T, European Crohn’s and Colitis Organisation (ECCO), European Society of Gastrointestinal and Abdominal Radiology (ESGAR)z. ECCO-ESGAR Guideline for Diagnostic Assessment in IBD part 2: IBD scores and general principles and technical aspects. J Crohns Colitis 2019, 13, 273–284. [Google Scholar] [CrossRef]
- Chavarria C, Casanova M, Chaparro M, Barreiro-de Acosta M, Ezquiaga E, Bujanda L, et al. Prevalence and factors associated with fatigue in patients with inflammatory bowel disease: a multicentre study. J Crohns Colitis 2019, 13, 996–1002. [Google Scholar] [CrossRef]
- Chen Y, Liang N, Li X, Yang S, Wang Y, Shi N. Diagnosis and treatment for mild cognitive impairment: a systematic review of clinical practice guidelines and consensus statements. Front Neurol 2021, 12, 719849. [Google Scholar] [CrossRef]
- Shen X, Niu L, Wang Y, Cao X, Liu Q, Tan L, et al. Inflammatory markers in Alzheimer’s disease and mild cognitive impairment: a meta-analysis and systematic review of 170 studies. J Neurol Neurosurg Psychiatry 2019, 90, 590–598. [Google Scholar] [CrossRef]
- Sharma N, Dhiman S, Bodh V, Sharma D, Sharma R, Sharma S, et al. Cognitive dysfunction in ulcerative colitis patients in remission and its comparison with patients with irritable bowel syndrome and healthy controls. Indian J Gastroenterol 2021, 40, 169–175. [Google Scholar] [CrossRef]
- Chen P, Cheng S, Lin H, Lee C, Chou C. Risk factors for the progression of mild cognitive impairment in different types of neurodegenerative disorders. Behav Neurol 2018, 2018, 6929732–6929738. [Google Scholar] [CrossRef]
- Wang D, Zhang X, Du H. Inflammatory bowel disease: a potential pathogenic factor of Alzheimer’s disease. Prog Neuropsychopharmacol Biol Psychiatry 2022, 119, 110610. [Google Scholar] [CrossRef]
- 21. Sarb OF, Sarb AD, Iacobescu M, Vlad IM, Milaciu MV, Ciurmarnean L, Vacaras V, Tantau AI. From Gut to Brain: Uncovering Potential Serum Biomarkers Connecting Inflammatory Bowel Diseases to Neurodegenerative Diseases. Int J Mol Sci. 2024, 25, 5676. [Google Scholar] [CrossRef] [PubMed] [PubMed Central]
- Ma F, Wu T, Zhao J, Ji L, Song A, Zhang M, et al. Plasma homocysteine and serum folate and vitamin B(12) levels in mild cognitive impairment and Alzheimer’s disease: a case-control study. Nutrients 2017, 9, 725. [Google Scholar] [CrossRef]
- Lauriola M, D’Onofrio G, Ciccone F, Germano C, Cascavilla L, Paris F, et al. Relationship of homocysteine plasma levels with mild cognitive impairment, Alzheimer’s disease, vascular dementia, psychobehavioral, and functional complications. J Alzheimers Dis 2021, 82, 235–248. [Google Scholar] [CrossRef] [PubMed]
- Jack CR, Wiste HJ, Therneau TM, Weigand SD, Knopman DS, Mielke MM, et al. Associations of amyloid, tau, and neurodegeneration biomarker profiles with rates of memory decline among individuals without dementia. JAMA 2019, 321, 2316–2325. [Google Scholar] [CrossRef]
- Serrano-Pozo A, Das S, Hyman BT. APOE and Alzheimer’s disease: advances in genetics, pathophysiology, and therapeutic approaches. Lancet Neurol 2021, 20, 68–80. [Google Scholar] [CrossRef] [PubMed]
- Tran SM, Mohajeri MH. The role of gut bacterial metabolites in brain development, aging and disease. Nutrients 2021, 13, 732. [Google Scholar] [CrossRef]
- Kim BY, Lee SH, Graham PL, Angelucci F, Lucia A, Pareja-Galeano H, et al. Peripheral brain-derived neurotrophic factor levels in Alzheimer’s disease and mild cognitive impairment: a comprehensive systematic review and meta-analysis. Mol Neurobiol 2017, 54, 7297–7311. [Google Scholar] [CrossRef]
- Miranda M, Morici JF, Zanoni MB, Bekinschtein P. Brain-derived neurotrophic factor: a key molecule for memory in the healthy and the pathological brain. Front Cell Neurosci 2019, 13, 363. [Google Scholar] [CrossRef]
- Polyakova M, Mueller K, Arelin K, Lampe L, Rodriguez FS, Luck T, et al. Increased serum NSE and S100B indicate neuronal and glial alterations in subjects under 71 years with mild neurocognitive disorder/mild cognitive impairment.Front Cell Neurosci 2022, 16, 788150. [CrossRef]
- R Core Team. R: A Language and Environment for Statistical Computing [Internet]. R Foundation for Statistical Computing: Vienna, Austria; 2024.
- Sarb OF, Vacaras V, Sarb A, Iacobescu M, Tantau AI. Cognitive Dysfunction and Affective Mood Disorder Screening in Patients With Chronic Inflammatory Bowel Disease: Protocol for a Prospective Case-Control Study. JMIR Res Protoc. 2023, 12, e50546. [Google Scholar] [CrossRef] [PubMed] [PubMed Central]
- Buchholz I, Janssen MF, Kohlmann T, Feng YS. A systematic review of studies comparing the measurement properties of the three-level and five-level versions of the EQ-5D. Pharmacoeconomics 2018, 36, 645–661. [Google Scholar]
- Janssen MF, Bonsel GJ, Luo N. Is EQ-5D-5L Better Than EQ-5D-3L? A Head-to-Head comparison of descriptive systems and value sets from seven countries/regions. Pharmacoeconomics 2018, 36, 675–697. [Google Scholar]
- Sharma N, Dhiman S, Bodh V, Sharma D, Sharma R, Sharma S, Sharma B. Cognitive dysfunction in ulcerative colitis patients in remission and its comparison with patients with irritable bowel syndrome and healthy controls. Indian J Gastroenterol. 2021, 40, 169–175. [Google Scholar] [CrossRef] [PubMed]
- Hopkins CWP, Powell N, Norton C, Dumbrill JL, Hayee B, Moulton CD. Cognitive Impairment in Adult Inflammatory Bowel Disease: A Systematic Review and Meta-Analysis. J Acad Consult Liaison Psychiatry. 2021, 62, 387–403. [Google Scholar] [CrossRef] [PubMed]
- Bartocci B, Dal Buono A, Gabbiadini R, Busacca A, Quadarella A, Repici A, Mencaglia E, Gasparini L, Armuzzi A. Mental Illnesses in Inflammatory Bowel Diseases: mens sana in corpore sano. Medicina (Kaunas). 2023, 59, 682. [Google Scholar] [CrossRef] [PubMed] [PubMed Central]
- Faisal, M. , Vedin, T., Edelhamre, M. et al. Diagnostic performance of biomarker S100B and guideline adherence in routine care of mild head trauma. Scand J Trauma Resusc Emerg Med 2023, 31, 3. [Google Scholar] [CrossRef]
- Barberio B, Zamani M, Black CJ, Savarino EV, Ford AC. Prevalence of symptoms of anxiety and depression in patients with inflammatory bowel disease: a systematic review and meta-analysis. Lancet Gastroenterol Hepatol. 2021, 6, 359–370. [Google Scholar] [CrossRef] [PubMed]
- Luo J, Xu Z, Noordam R, van Heemst D, Li-Gao R. Depression and Inflammatory Bowel Disease: A Bidirectional Two-sample Mendelian Randomization Study. J Crohns Colitis. 2022, 16, 633–642. [Google Scholar] [CrossRef] [PubMed]
- Rada C, Gheonea D, Ţieranu CG, Popa DE. Diagnosis and Psychotherapeutic Needs by Early Maladaptive Schemas in Patients With Inflammatory Bowel Disease. Front Psychol. 2022, 12, 807107. [Google Scholar] [CrossRef] [PubMed] [PubMed Central]
Figure 1.
Comparison of serum biomarker levels (SAA, Hcy, and BDNF) among UC, CD, and control groups. Data are presented as box-and-whisker plots, where the central line represents the median, the box indicates the interquartile range (IQR), and the whiskers extend to the minimum and maximum values within 1.5×IQR. Statistical significance was assessed using appropriate tests, with p-values reported in the results section. SAA=Serum Amyloid A. HCY=Homocysteine. BDNF=Brain derived neurotrophic factor.
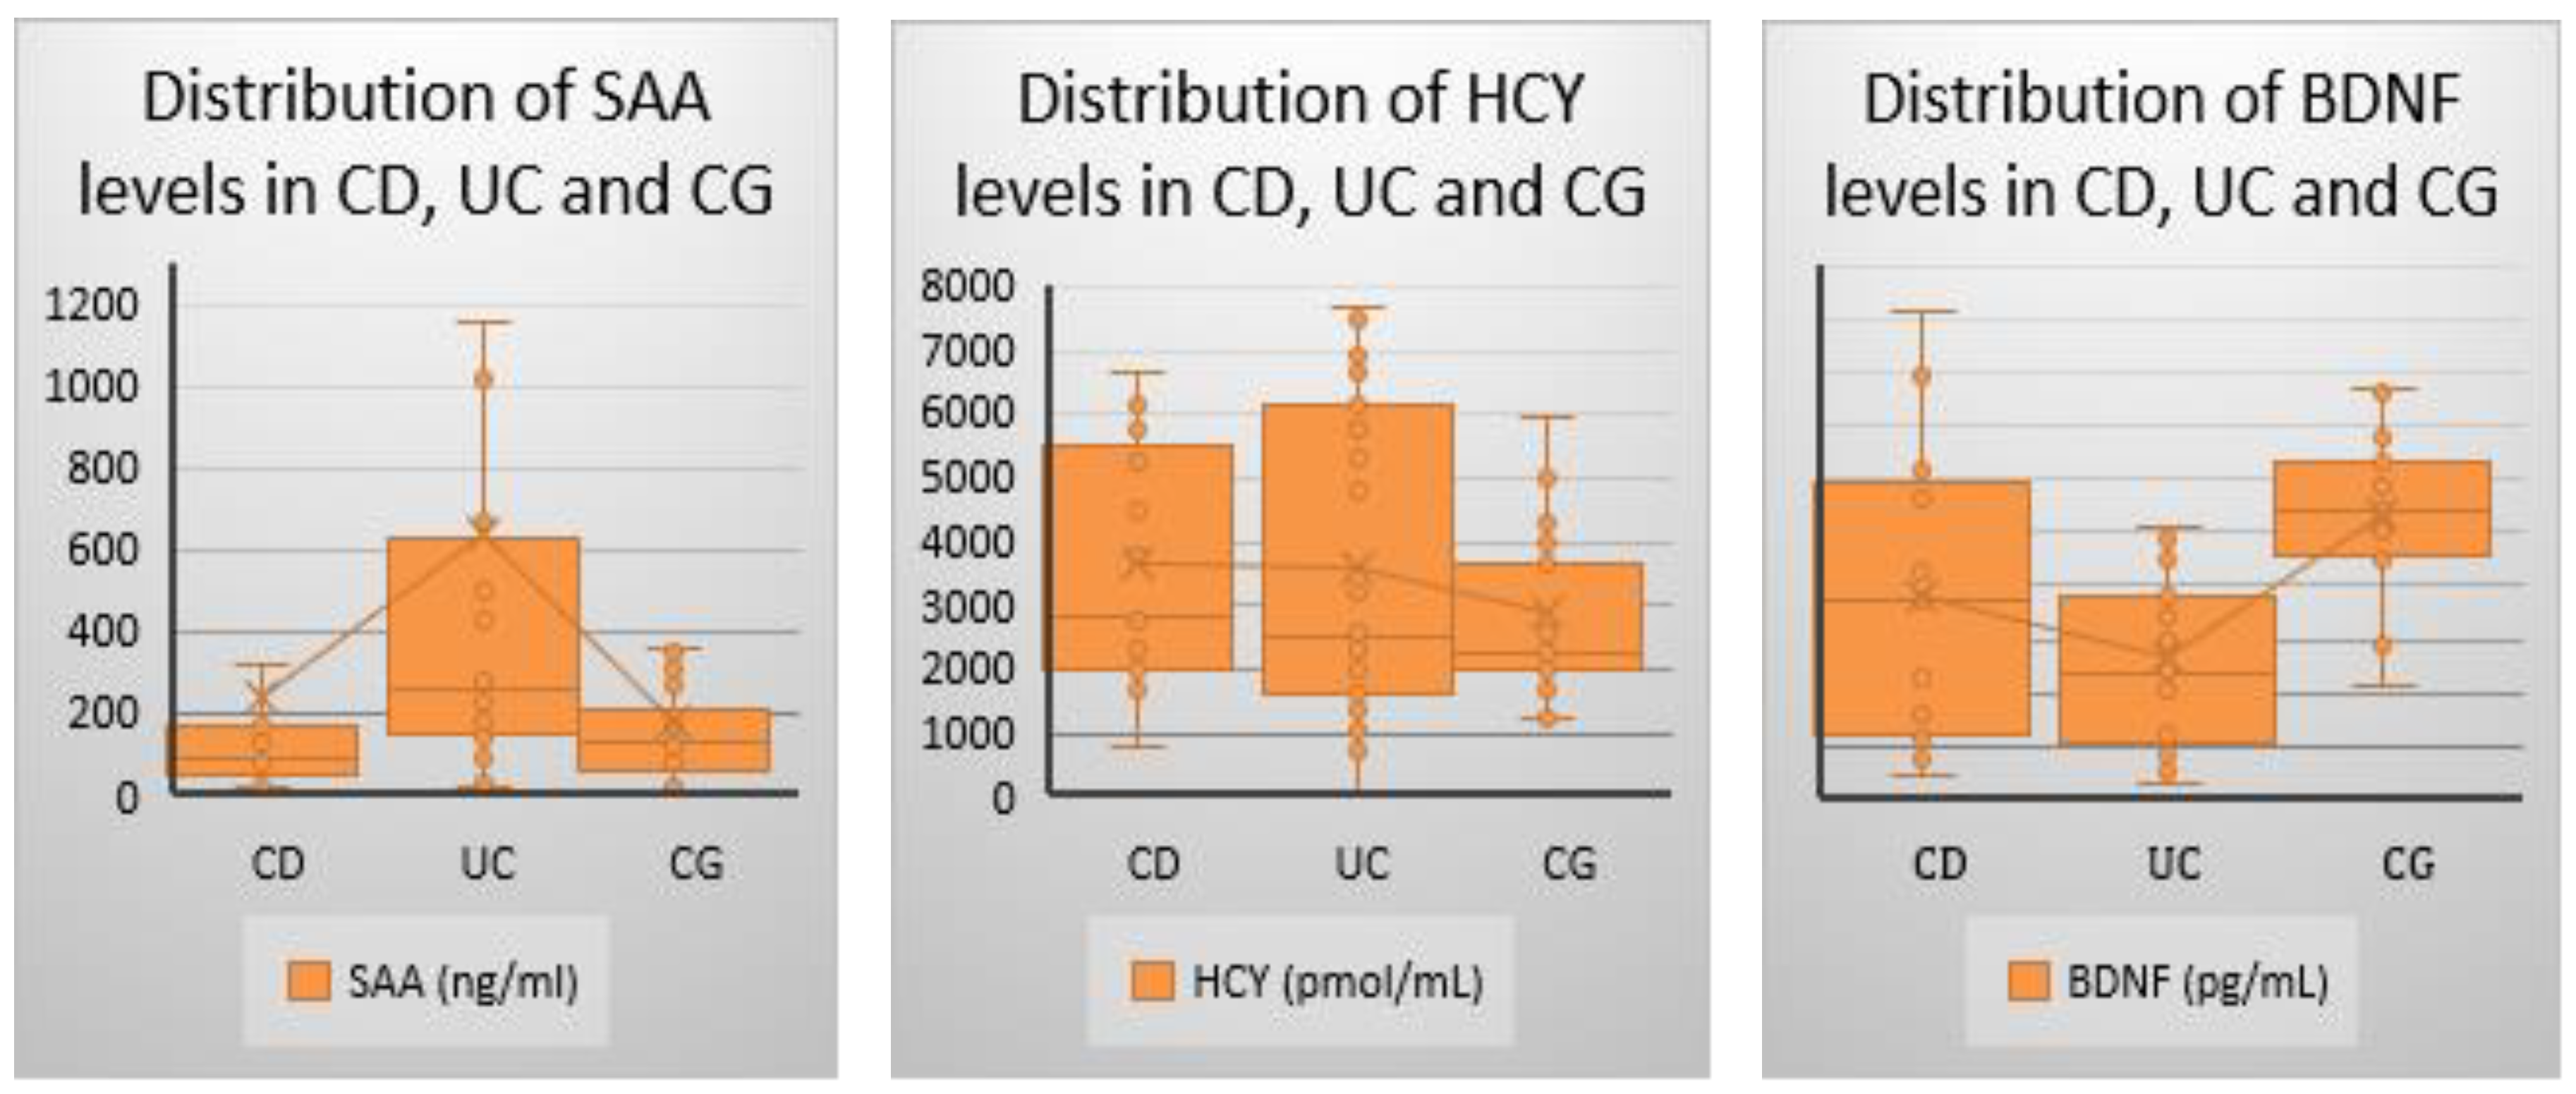
Figure 2.
Correlation Between Serum BDNF and SAA Levels in Study Participants. Scatter plot showing the correlation between serum BDNF and SAA levels. Each point represents an individual patient. The trend line illustrates the direction of correlation (R² = 0.058), indicating a weak association between the two biomarkers. Blue represents the 95% confidence interval. Orange represents the 95% prediction interval. SAA=Serum amyloid A. BDNF=Brain derived neurotrophic factor. CD=Crohn Disease. UC=Ulcerative collitis.
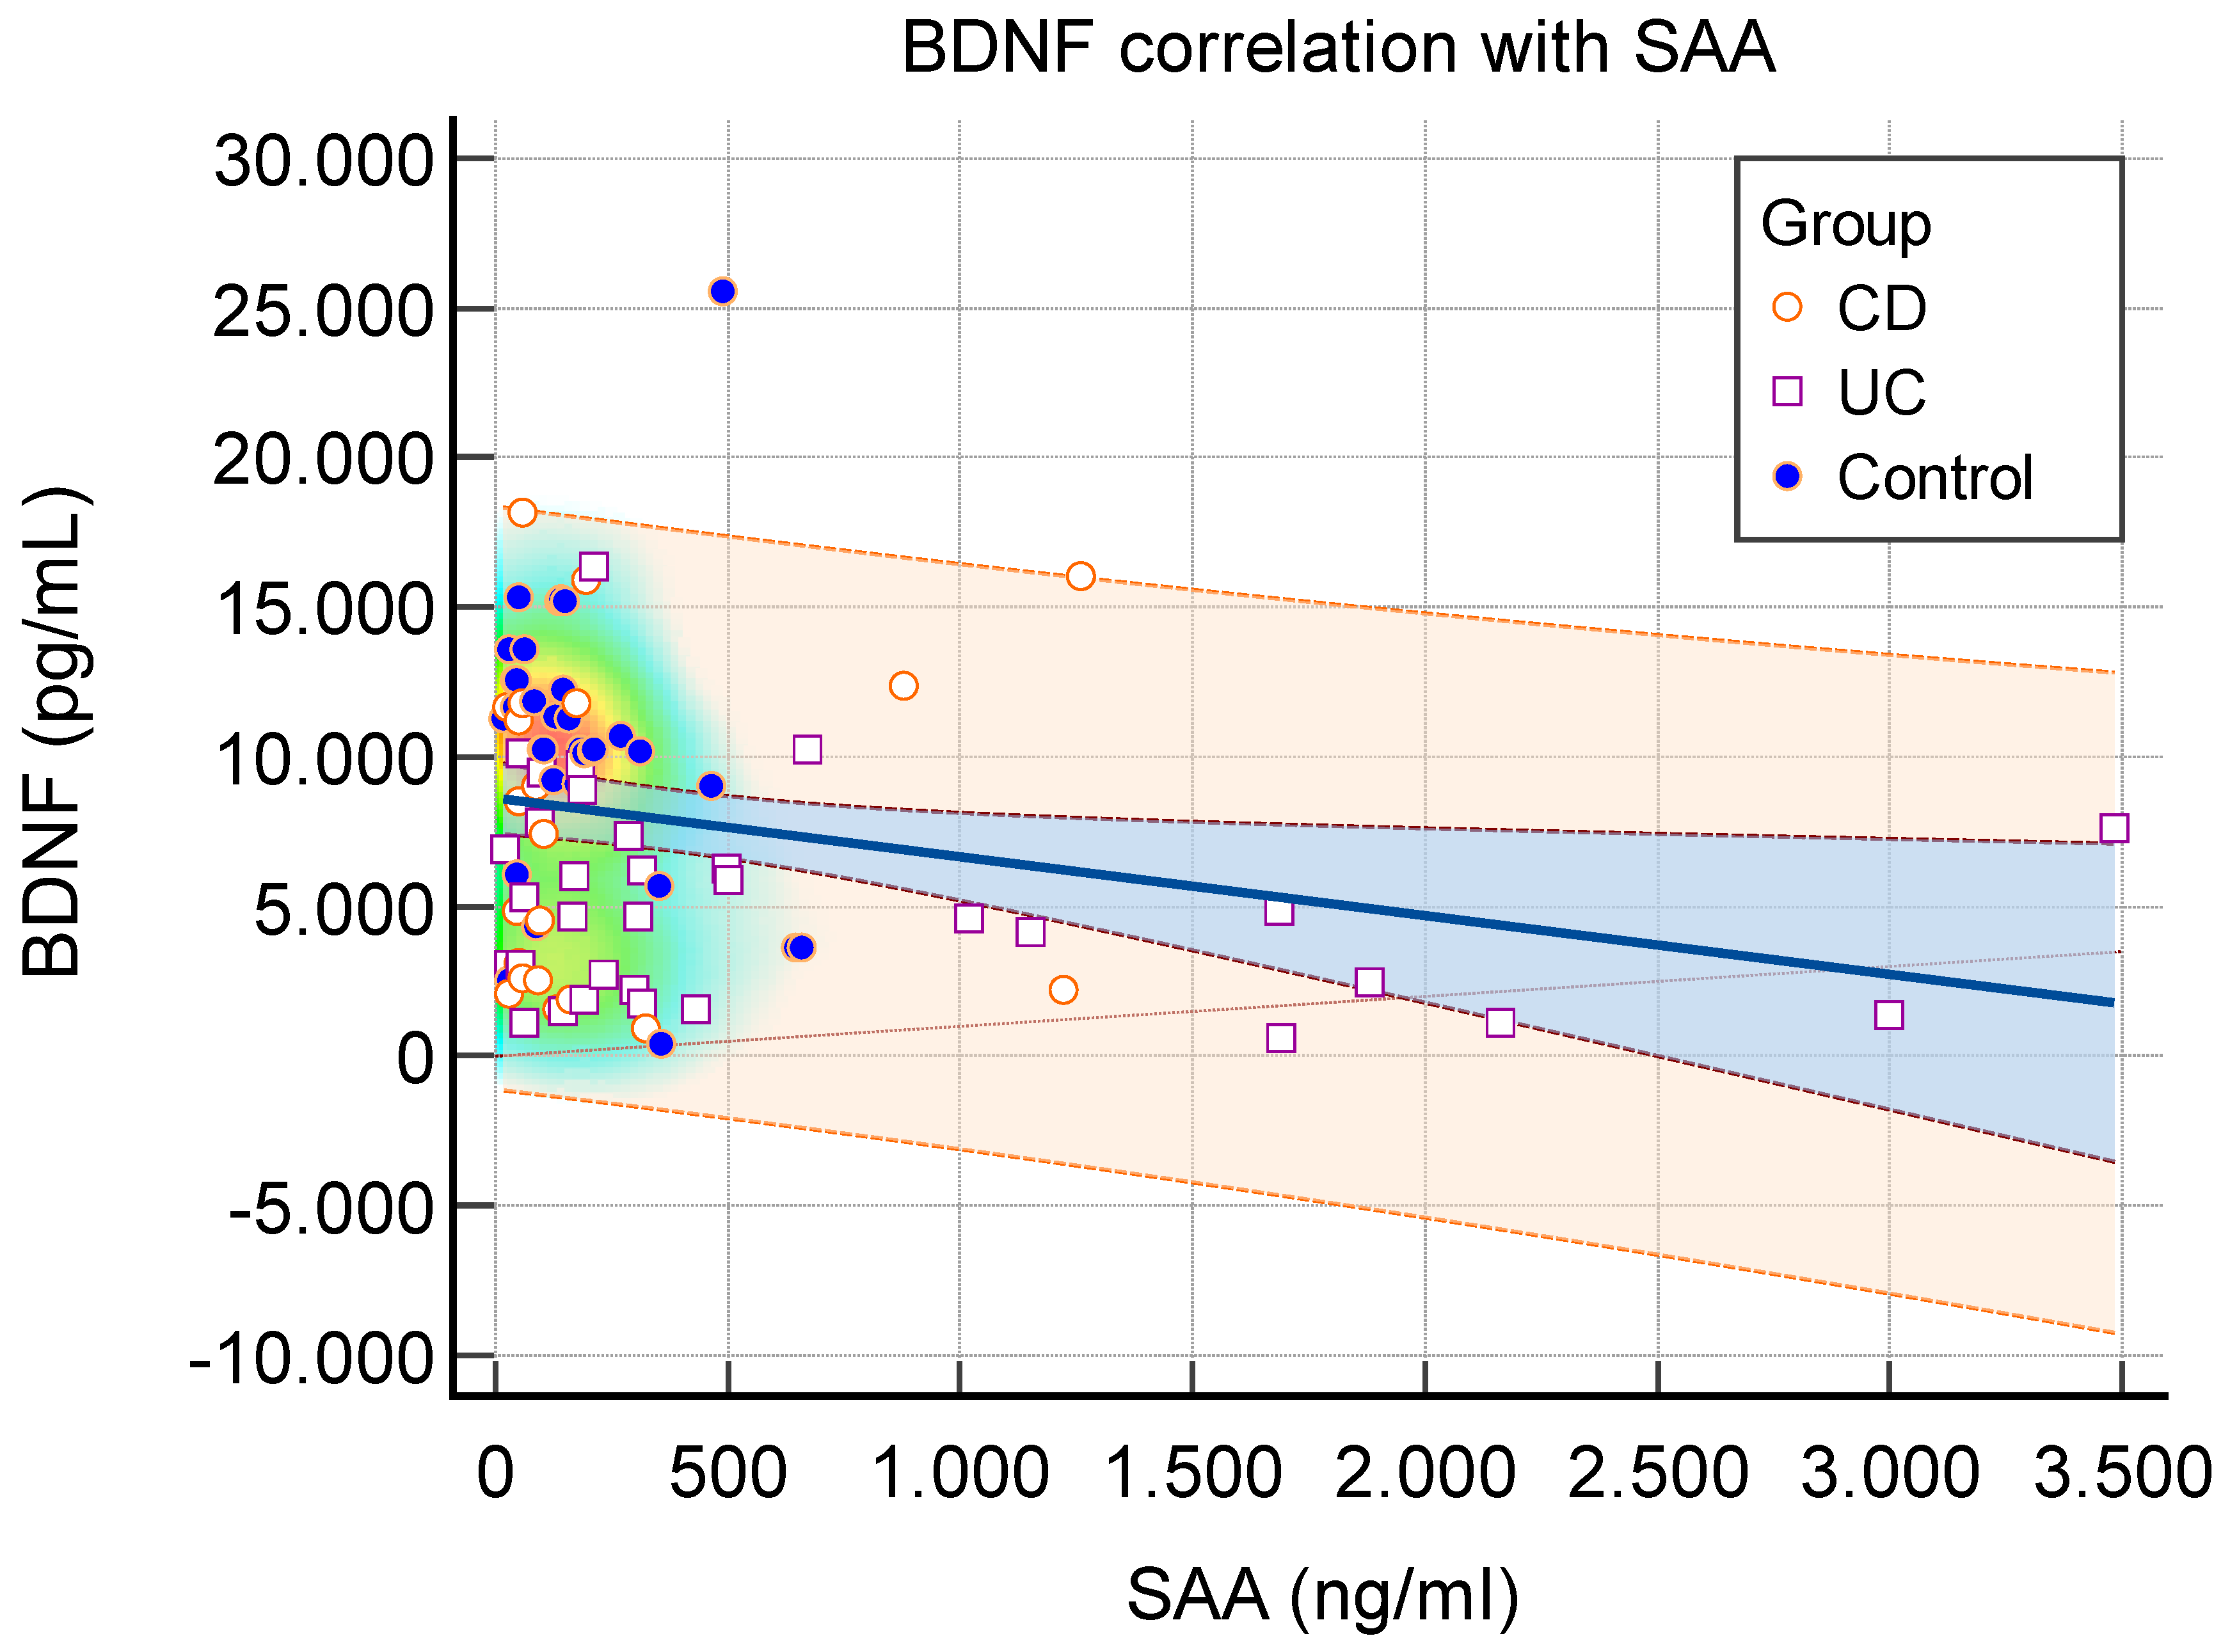
Figure 3.
Correlation Between Baseline MoCA Score and Serum BDNF Levels. Scatter plot illustrating the correlation between baseline MoCA scores and serum BDNF levels. A weak positive association was observed (R² = 0.023), indicating minimal correlation between cognitive function at baseline and BDNF levels. Blue represents the 95% confidence interval. Orange represents the 95% prediction interval. BDNF=Brain derived neurotrophic factor. CD=Crohn Disease. UC=Ulcerative collitis.
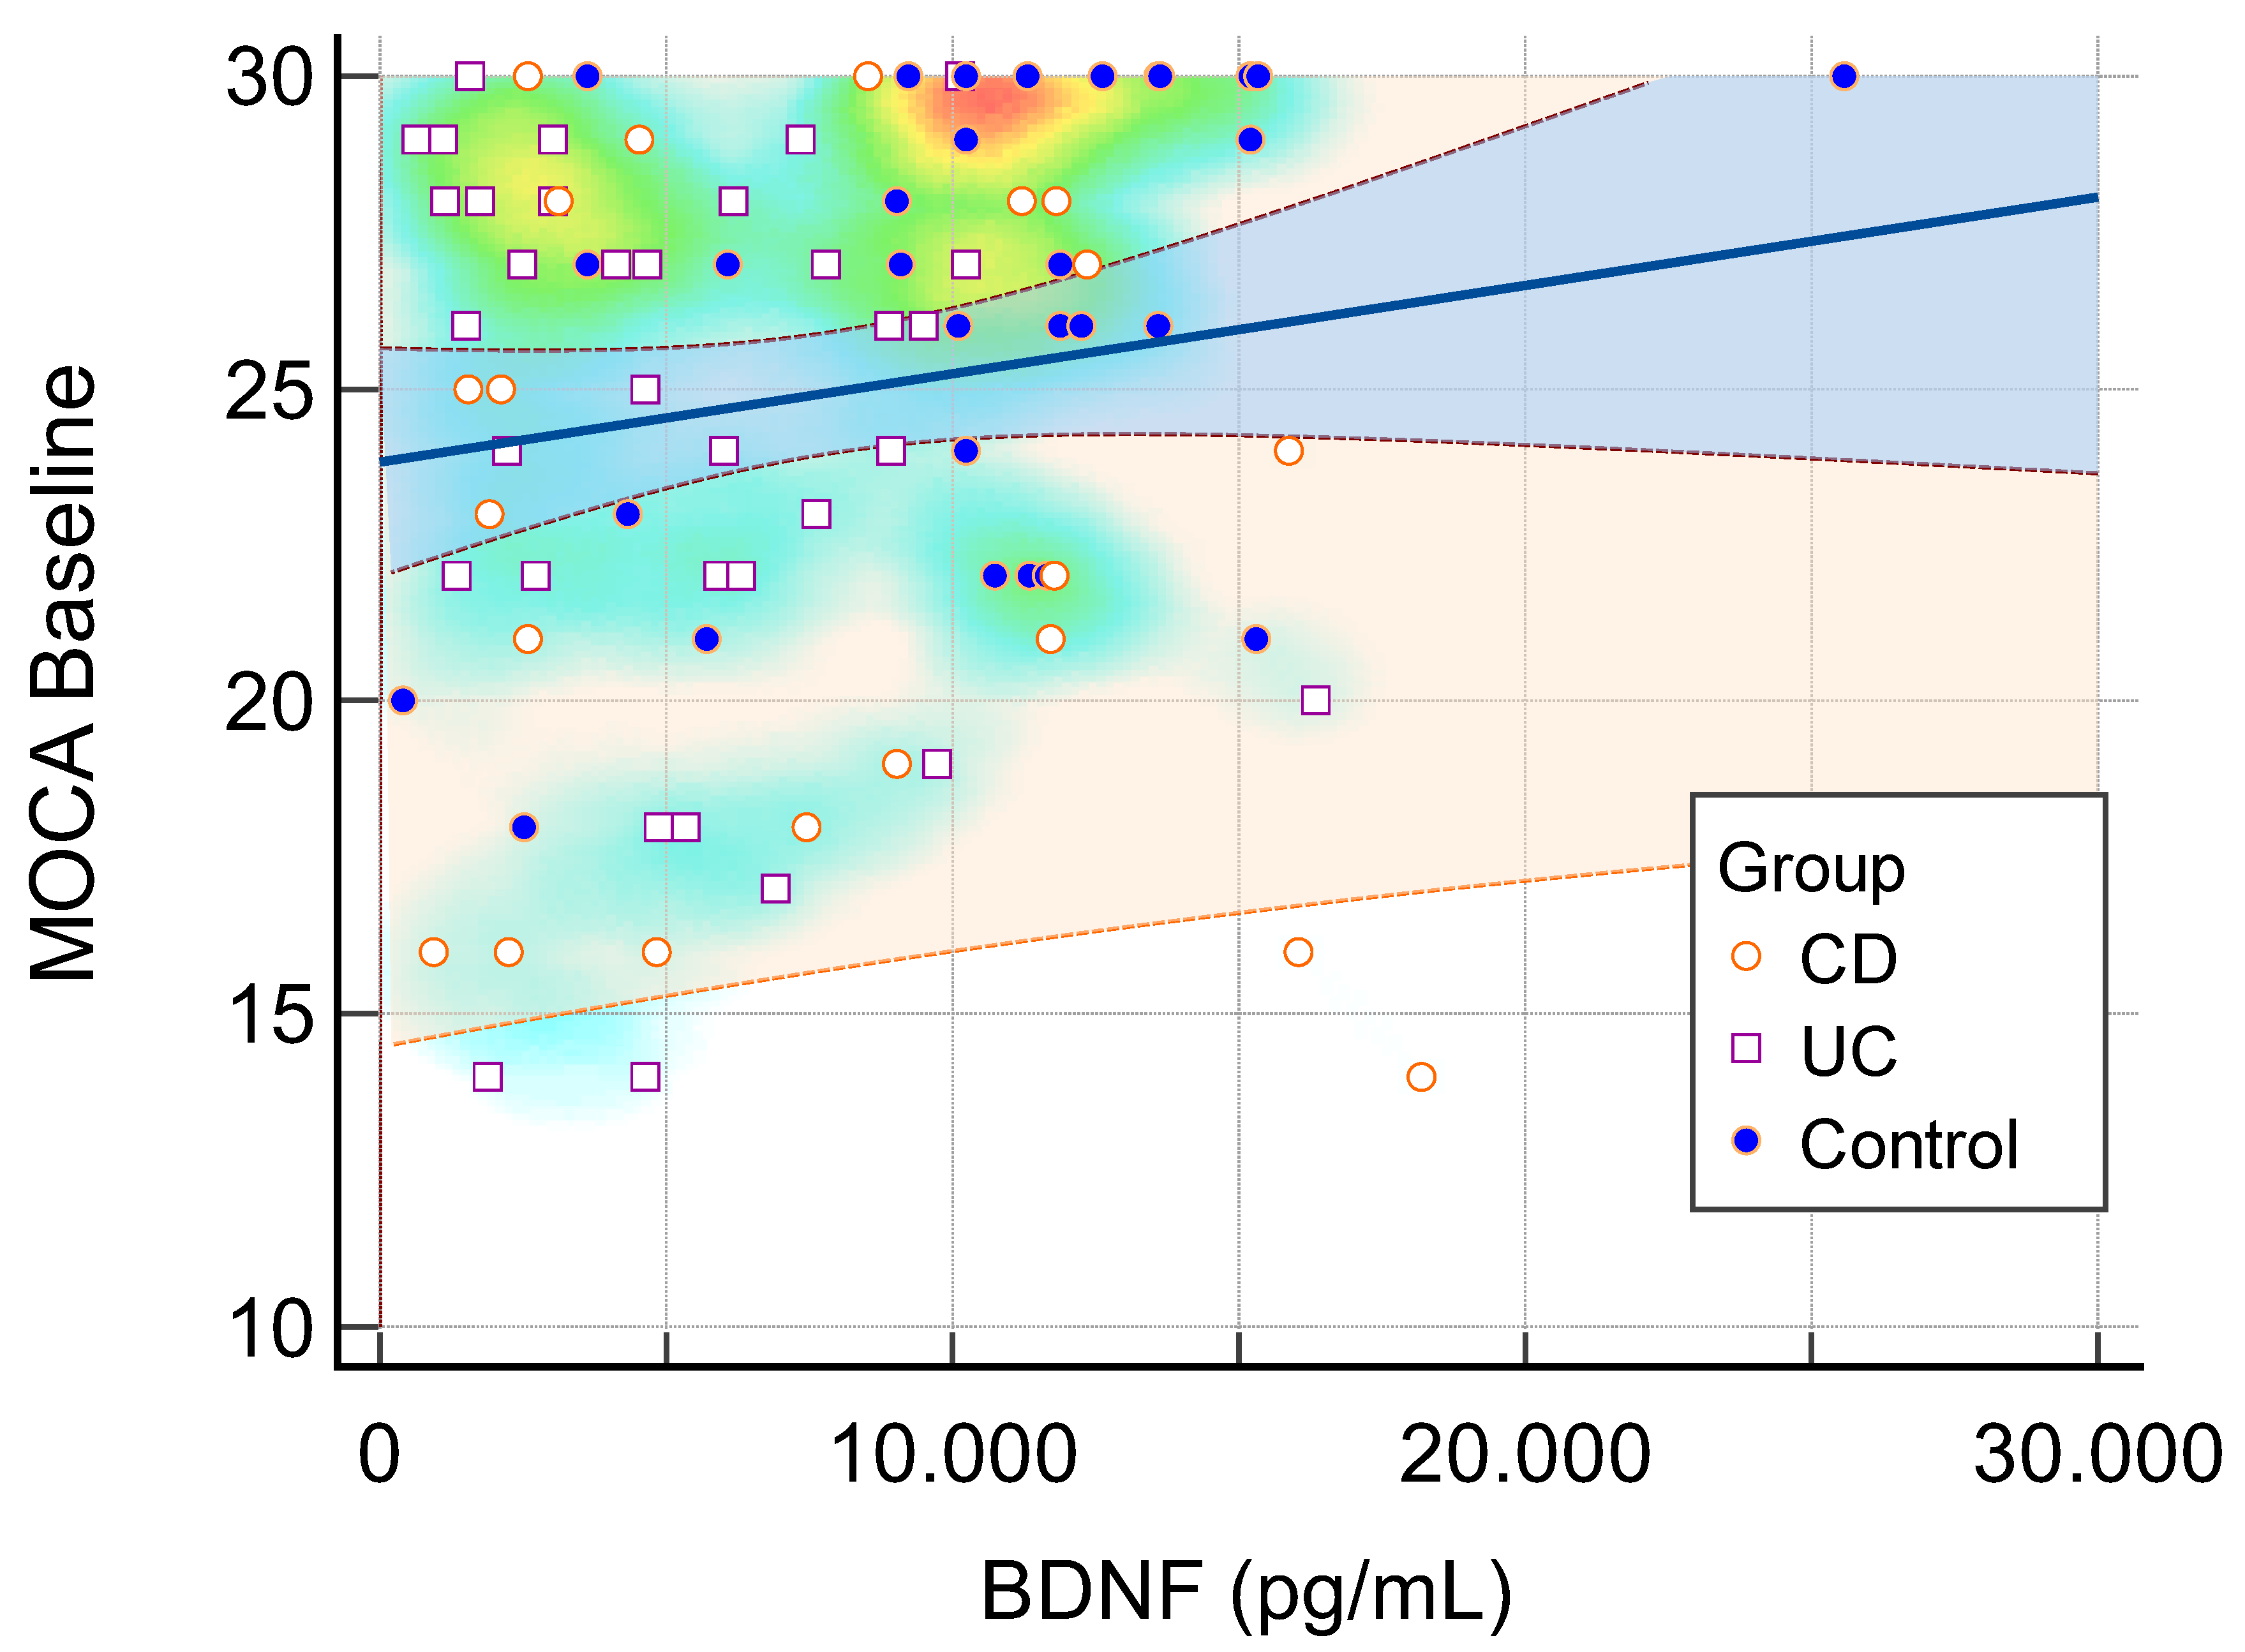
Figure 4.
Comparison of ROC Curves for BDNF, SAA, and Hcy in Diagnosing Cognitive Dysfunction. Receiver operating characteristic (ROC) curves illustrating the diagnostic performance of serum BDNF, SAA, and Hcy in identifying cognitive dysfunction. The area under the curve (AUC) values ranged from 0.5 to 0.6, indicating limited diagnostic utility, with no significant differences between the biomarkers. SAA=Serum amyloid A. BDNF=Brain derived neurotrophic factor. HCY=Homocysteine. CD=Crohn Disease. UC=Ulcerative collitis.
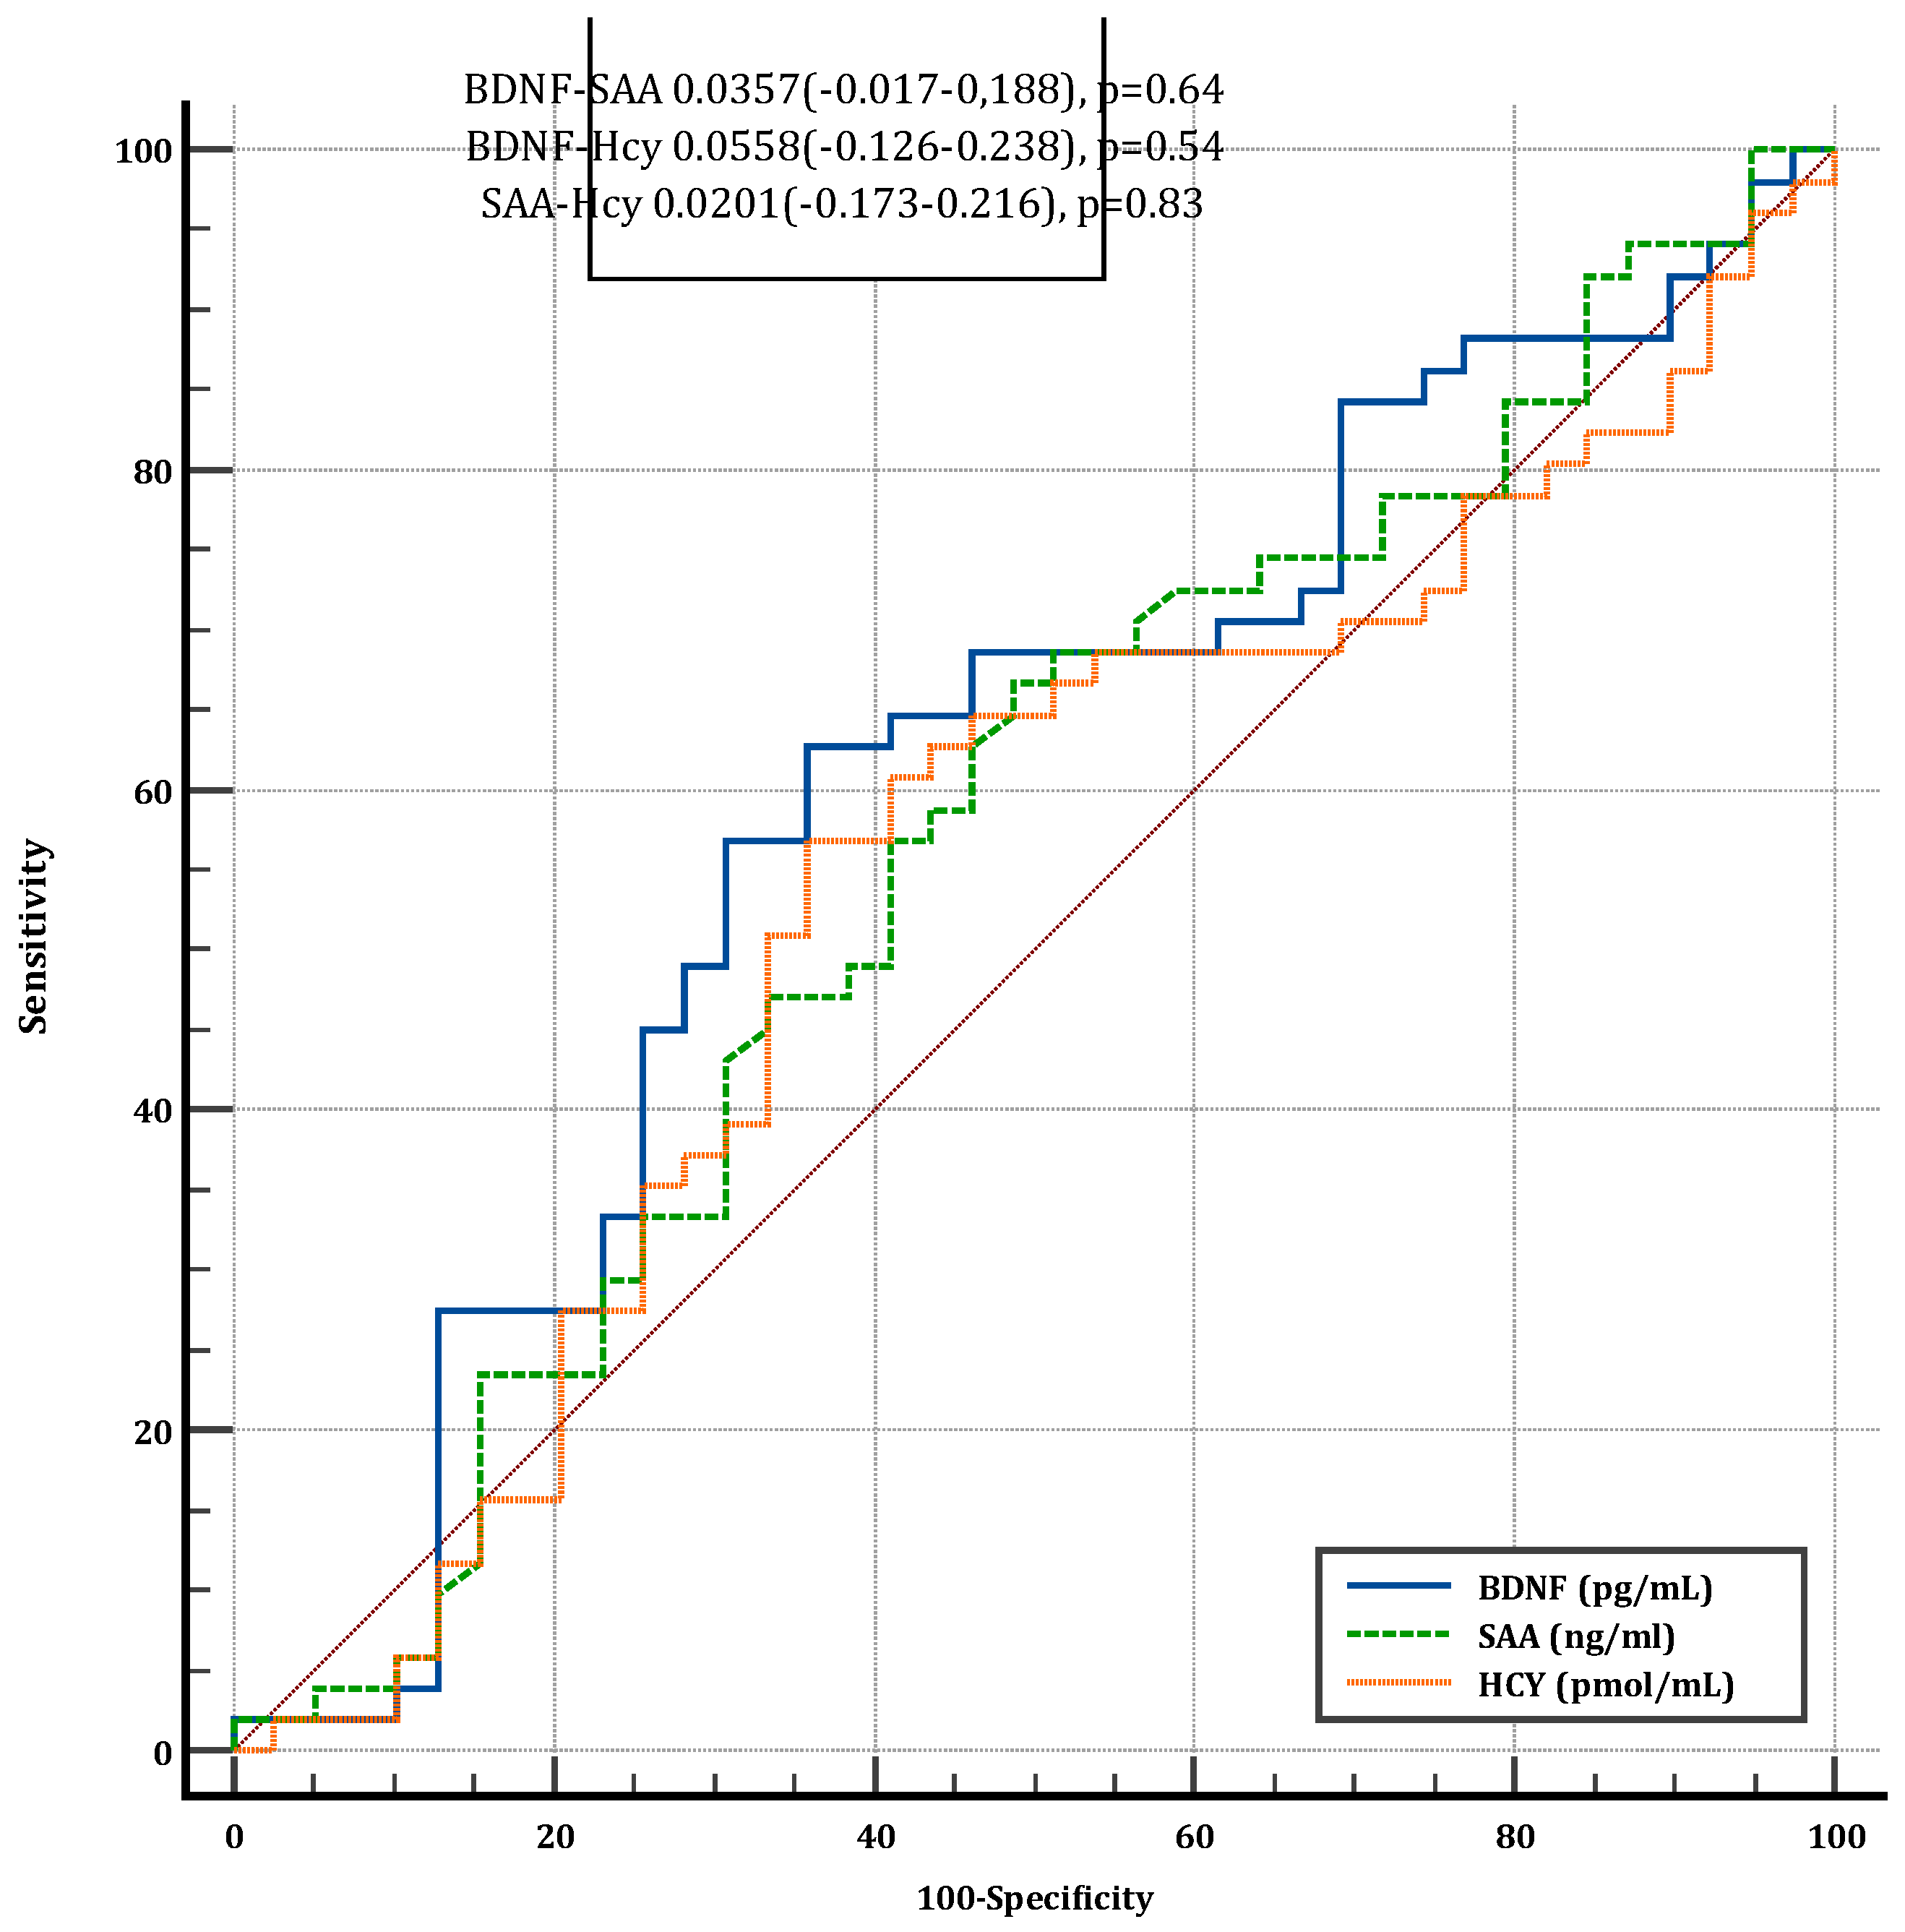
Table 1.
Specifications and Sources of ELISA Kits for Biomarker Measurement (CV=coefficient of variation;).
Table 1.
Specifications and Sources of ELISA Kits for Biomarker Measurement (CV=coefficient of variation;).
| Biomarker | ELISA Kit | Kit performance |
|---|---|---|
| HCY | AssayGenie, Dublin, Ireland, HUFI04768 | Detection range=7.813-500 pmol/mL; Sensitivity <4.688 pmol/mL Intra-assay precision CV < 8 %; Inter-assay precision CV <10 % |
| BDNF | ABclonal, WoburnMA, USA, RK00074 | Detection range = 23.4-1500 pg/mL Sensitivity < 6.3 pg/mL Intra-assay precision CV <10 %; Inter-assay precision CV <15 % |
| SAA | ABclonal, WoburnMA, USA, RK04228 | Detection range = 0.156-10 ng/mL ; Sensitivity < 0.071 ng/mL Intra-assay precision CV ≤10 %; Inter-assay precision CV ≤15 % |
| S100B | ABclonal, WoburnMA, USA, RK02234 | Detection range = 46.9-3000 pg/mL ; Sensitivity < 23.5 pg/mL Intra-assay precision CV ≤10 %; Inter-assay precision CV ≤15 %) |
Table 2.
Comparison of Demographics, Clinical Assessments, Cognitive Scores, and biomarkers Among the Three Groups (IQR=interquartile range; CI=confidence interval;).
Table 2.
Comparison of Demographics, Clinical Assessments, Cognitive Scores, and biomarkers Among the Three Groups (IQR=interquartile range; CI=confidence interval;).
| Group | CD Group (n=21) |
UC Group (n=34) |
CG (n=35) |
P (CD-UC, CD-CG, UC-CG) |
|---|---|---|---|---|
| Age (years), median (IQR) | 39 (29-49) | 44.5 (32.75-60.75) | 39 (32.5-59) | 0.528 (0.724, 0.568, 0.665) |
| Education (years), median (IQR) | 15 (12-16) | 15 (12-16) | 15 (12-18) | 0.376 (0.759, 0.615, 0.347) |
| Smoking index/year, median (IQR) | 0 (0-6) | 0 (0-0) | 0 (0-0) | 0.312 (0.355, 0.39, 0.553) |
| Body-mass index (BMI) (kg/m2), median (IQR) | 24.4 (22.6- 26.8) | 24.85 (23.13- 27.95) | 23.9 (21.45-27.95) | 0.789 (0.896, 0.829, 1) |
| Gender (Female), n(%) | 10 (47.62) | 14 (41.18) | 25 (71.43) | 0.032 |
| Living environment (Rural), n(%) | 2 (9.52) | 9 (26.47) | 5 (14.29) | 0.22 |
| Physical activity (No), n(%) | 15 (71.43) | 17 (50) | 29 (82.86) | 0.013 |
| ADL, median (IQR) | 6 (6) | 6 (6) | 6 (6) | 1 |
| IADL, median (IQR) | 8 (8) | 8 (8) | 8 (8) | 1 |
Table 3.
Comparison of medication of CD and UC patients.
| Treatment | CD (n=21) | UC (n=34) |
|---|---|---|
| Standard therapy, n(%) | 8(38%) | 15(44.1%) |
| Biologic, n(%) | 12(57%) | 16(47%) |
| None, n(%) | 1(4.7%) | 3(8.8%) |
Table 4.
Comparison of Cognitive Scores Among the Three Groups (IQR=interquartile range; CI=confidence interval).
Table 4.
Comparison of Cognitive Scores Among the Three Groups (IQR=interquartile range; CI=confidence interval).
| Group | CD Group (n=21) |
UC Group (n=34) |
CG (n=35) |
P (CD-UC, CD-CG, UC-CG) |
|---|---|---|---|---|
| MOCA test- baseline, median (IQR) | 23 (18-28) | 26 (22-28) | 28 (25-30) | 0.003 (0.301, 0.004, 0.017) |
| MIS- baseline, median (IQR) | 12 (8-14) | 13 (9.25-14) | 14 (12.5-15) | 0.015 (0.43, 0.022, 0.038) |
| FDS, median (IQR) | 10 (9-12) | 10 (8-12) | 10 (9.5-11) | 0.968 (1, 0.855, 1) |
| BDS, median (IQR) | 5 (4-8) | 6 (4-6.75) | 6 (5-8) | 0.6 (0.822, 1, 0.549) |
| Trail making A (seconds), median (IQR) | 43 (33-59.5) | 38.85 (31.05- 59) | 35 (26-42) | 0.186 (0.443, 0.215, 0.31) |
| Trail making B (seconds), median (IQR) | 107 (72- 155) | 100 (54.33- 154.25) | 72 (65-80.5) | 0.113 (0.269, 0.106, 0.339) |
| DSST, median (IQR) | 43 (28.5-48.5) | 40 (33-48.25) | 46 (39-51) | 0.374 (0.658, 0.186, 0.322) |
Table 5.
Cognitive Categories Comparison Among the Three Groups.
| Group | CD (n=21) |
UC (n=34) |
CG (n=35) |
P-value |
|---|---|---|---|---|
| Cognitive dysfunction (total), n(%) | 14 (66.67) | 16 (47.06) | 9 (25.71) | 0.006 |
| Mild cognitive impairment, n(%) | 9 (42.86) | 13 (38.24) | 9 (25.71) | |
| Moderate cognitive impairment, n(%) | 5 (23.81) | 3 (8.82) | 0 (0) | |
| Normal, n(%) | 7 (33.33) | 18 (52.94) | 26 (74.29) |
Table 6.
Comparison of Psychological Factors and Activities of Daily Living Among the Three Groups (IQR=interquartile range; CI=confidence interval;).
Table 6.
Comparison of Psychological Factors and Activities of Daily Living Among the Three Groups (IQR=interquartile range; CI=confidence interval;).
| Group | CD Group (n=21) |
UC Group (n=34) |
CG (n=35) |
P (CD-UC, CD-CG, UC-CG) |
|---|---|---|---|---|
| Stress score, median (IQR) | 6 (4-10) | 6 (2-13.5) | 8 (4–13) | 0.639 (0.884, 0.608, 1) |
| Anxiety score, median (IQR) | 6 (0-8) | 6 (0-8) | 8 (2–10) | 0.541 (0.834, 0.588, 0.821) |
| Depression score, median (IQR) | 2 (0-8) | 2 (0-6) | 4 (0–8) | 0.813 (0.716, 1, 1) |
Table 7.
Comparison of biomarkers Among the Three Groups (IQR=interquartile range; CI=confidence interval).
Table 7.
Comparison of biomarkers Among the Three Groups (IQR=interquartile range; CI=confidence interval).
| Group | CD Group (n=21) |
UC Group (n=34) |
CG (n=35) |
P (CD-UC, CD-CG, UC-CG) |
|---|---|---|---|---|
| SAA (ng/mL), median (IQR) | 92 (51-175) | 259.5 (150.75–629) | 136 (62.5-210) | 0.003 (0.009, 0.561, 0.007) |
| Hcy (pmol/mL), median (IQR) | 2802 (2028–5311) | 2500.5 (1639.5–6045.5) | 2287 (2012- 3172.5) | 0.369 (0.587, 0.501, 0.443) |
| BDNF (pg/mL), median (IQR) | 7437 (2570–11785) | 4771 (2289.25–7552.25) | 10735 (9160.5- 12602.5) | <0.001 (0.071, 0.035, <0.001) |
Table 9.
Comparison of MOCA and MIS score at 1 year follow-up.
| Group | MOCA test- baseline, median (IQR) | MOCA- 1 year visit, median (IQR) | P | MIS- baseline, median (IQR) | MIS- 1 year visit, median (IQR) | P |
|---|---|---|---|---|---|---|
| CD Group (n=21) |
23 (18-28) | 23 (18–27) | 0.9681 | 12 (8-14) | 10 (7–13) | 0.764 |
| UC Group (n=34) |
26 (22-28) | 25.5 (21–28) | 0.741 | 13 (9.25-14) | 12 (9–14) | 0.483 |
| CG (n=35) |
28 (25-30) | 27 (23.5–30) | 0.771 | 14 (12.5-15) | 14 (11–15) | 0.440 |
Table 10.
Multiple linear regression predicting the logarithm of SAA based on disease, and adjusted for body mass index, number of sleep hours and practice of sport.
Table 10.
Multiple linear regression predicting the logarithm of SAA based on disease, and adjusted for body mass index, number of sleep hours and practice of sport.
| Characteristic | B adjusted | (95% CI) | P value |
|---|---|---|---|
| Disease (CD vs. CG) | -0.05 | (-0.66–0.56) | 0.868 |
| Disease (UC vs. CG) | 0.93 | (0.37–1.49) | 0.002 |
| BMI (kg/m2) | -0.01 | (-0.06–0.03) | 0.579 |
| Sleep hours / 24h | 0.03 | (-0.23–0.3) | 0.811 |
| Physical activity | -0.23 | (-0.81–0.34) | 0.433 |
Table 11.
Multiple linear regression predicting the logarithm of Hcy based on disease, and adjusted for BMI, number of sleep hours and practice of sport.
Table 11.
Multiple linear regression predicting the logarithm of Hcy based on disease, and adjusted for BMI, number of sleep hours and practice of sport.
| Characteristic | B adjusted | (95% CI) | p |
|---|---|---|---|
| Disease (CD vs. CG) | 0.24 | (-0.05–0.54) | 0.113 |
| Disease (UC vs. CG) | 0.05 | (-0.25–0.35) | 0.741 |
| BMI (kg/m2) | 0.02 | (-0.01–0.05) | 0.156 |
| Sleep hours / 24h | -0.11 | (-0.24–0.02) | 0.114 |
| Physical activity | -0.05 | (-0.37–0.27) | 0.757 |
Table 12.
Multiple linear regression predicting the logarithm of BDNF based on disease, and adjusted for BMI, number of sleep hours and practice of sport.
Table 12.
Multiple linear regression predicting the logarithm of BDNF based on disease, and adjusted for BMI, number of sleep hours and practice of sport.
| Characteristic | B adjusted | (95% CI) | p |
|---|---|---|---|
| isease (CD vs. CG) | -0.45 | (-0.88–-0.02) | 0.042 |
| Disease (UC vs. CG) | -0.77 | (-1.17–-0.38) | <0.001 |
| BMI (kg/m2) | 0.03 | (0–0.07) | 0.055 |
| Sleep hours / 24h | -0.12 | (-0.3–0.06) | 0.201 |
| Physical activity | -0.09 | (-0.47–0.28) | 0.613 |
Disclaimer/Publisher’s Note: The statements, opinions and data contained in all publications are solely those of the individual author(s) and contributor(s) and not of MDPI and/or the editor(s). MDPI and/or the editor(s) disclaim responsibility for any injury to people or property resulting from any ideas, methods, instructions or products referred to in the content. |
© 2025 by the authors. Licensee MDPI, Basel, Switzerland. This article is an open access article distributed under the terms and conditions of the Creative Commons Attribution (CC BY) license (http://creativecommons.org/licenses/by/4.0/).
Copyright: This open access article is published under a Creative Commons CC BY 4.0 license, which permit the free download, distribution, and reuse, provided that the author and preprint are cited in any reuse.


