
Submitted:
05 March 2025
Posted:
06 March 2025
You are already at the latest version
Abstract
Avian reovirus (ARV) is an important pathogen of poultry, yet the molecular responses to ARV across cell-types remain unknown. The present study explores the differential transcriptomic responses to ARV S1133 infection in three cell types, i.e. chicken embryo kidney (CEK), chicken embryo liver (CELi), and macrophage-derived cells (HD11) at 6, 12 and 24 hours post-inoculation (hpi). CELi cells exhibited the highest viral replication rates at all timepoints, with maximal titer observed at 24 hpi, whereas HD11 cells showed limited viral replication but extensive host transcriptional activity. Differential gene expression analysis revealed that HD11 cells, despite the lower viral load, presented the most pronounced transcriptional changes. CEK cells demonstrated a unique activation of immune-related pathways, specifically those related to lymphocyte chemotaxis and type II interferon response. CELi cells showed upregulation of expression of genes involved in defense against viruses. Protein-protein interaction (PPI) analysis identified key antiviral genes, including IFI6, OASL, RSAD2, SAMD9L, and MX1, as central nodes. In CELi, significant alternative splicing events were observed in transcripts of several genes, including those implicated in immunity. Taken together, results indicate that inoculation of ARV entailed cell-type and time-dependent viral replication and triggered transcriptional activity linked with unique but functionally interconnected pathways.
Keywords:
avian reovirus
; transcriptome
; RNA-seq
; gene expression
; cell culture
1. Introduction
The Avian reovirus (ARV) remains relevant as a pathogen of significant interest as it affects poultry worldwide [1], causing substantial economic losses to the poultry industry [2,3]. The virus can cause various clinical manifestations, such as viral arthritis and tenosynovitis [4,5], intestinal lesions [6], hepatitis [7,8], pancreatic lesions [6,9,10], myocarditis and hydropericardium [11,12,13], and immunosuppression [14,15,16,17].
While the ARV-induced pathogenesis, symptoms, and lesions have been extensively reported and discussed, the transcriptome-wide cellular response, particularly in primary chicken embryo cell cultures, has not been investigated. In primary chicken embryo fibroblasts (CEFs), a direct relationship between autophagy and ARV replication [18] and apoptosis following intra-endosomal virion disassembly [19] have been reported. In a secondary fibroblast cell line (DF-1), a sustained antiviral response mediated by interferon-stimulated genes (ISGs) was observed [20].
While the relevance of interferons (IFNs) in the context of ARV infection has been studied, their function remains ambiguous. ARV protein σA-mediated antagonism to IFNs in CEFs [21,22] and no significant upregulation of IFNs in DF-1 cells [20] have been indicated. Despite the viral protein-mediated resistance, induction of both type-α and type-β IFNs in CEFs [23], as well as in joints of specific-pathogen-free (SPF) chickens [24] has been indicated following infection with ARV. A recent study investigating the transcriptome of spleens of chickens infected with ARV suggested a possible downregulation of IFN-β by overexpression of interleukin-4-induced-1 [25]. Earlier investigations had demonstrated an in vivo induction of IFNs following intratracheal or subcutaneous inoculation of pathogenic or attenuated ARV strains into white leghorn chickens [26]. Later, the same authors reported a lack of induction of IFNs by four virulent ARV strains in chicken kidney (CK) and chicken embryo kidney (CEK) cells [27]. Contrastingly, ultraviolet-inactivated ARV induced IFNs effectively in these two cell types and attenuated ARV induced priming-dependent IFN response in aged CEFs [27]. These discrepancies in reports suggest that the ARV-induced transcriptional changes could be cell-type-dependent and warrant a more comprehensive analysis.
The objective of the current study was to investigate the transcriptome-wide changes in gene expression patterns at various timepoints post-inoculation in three different cell types, i.e. primary CEK and chicken embryo liver cells (CELi) and , as well as a macrophage-derived continuous cell line (HD11).
2. Materials and Methods
2.1. Cell Culture
Chicken embryo kidney and liver cells were prepared from specific pathogen-free eggs at 19 and 15 days of embryonation (DOE), respectively. Briefly, kidneys and livers were collected at respective DOE, minced with scissors, and homogenized in 0.05 % Trypsin-EDTA solution (Gibco, Grand Island, New York). The homogenate was filtered with a 40-micron filter, centrifuged at 100 g for 10 minutes, and dissolved in 50 mL of growth medium (composition described below). HD11 cells were kindly provided by Dr. Li Zhang (Mississippi State University, MS).
All three cell types were cultured in Dulbecco’s Modified Eagle Medium (DMEM) (Corning, Corning, NY) supplemented with 10% fetal bovine serum (FBS) (HyClone, Logan, UT) and 2% Penicillin-Streptomycin with L-Glutamine (Corning, Corning, NY) and 3% sodium pyruvate (Corning). The cells were maintained at 37°C in a humidified incubator with 5% CO₂.
2.2. S1133 Inoculum Preparation and Dose Determination
The ARV S1133 strain from a stock prepared previously [28] was passaged once in CELi cells. The harvested cell lysate was freeze-thawed three times to release the virus. The virus was titrated on CELi cells with 8 replicates per dilution, and the titer was calculated to be 109.33 TCID50/mL, using the Reed and Muench method [29]. This supernatant was diluted in DMEM to prepare inoculum at the final dose of 106 TCID50/mL.
2.3. Virus Inoculation
The cells were grown in one six 6-well plates per cell type, each timepoint and treatment. The growth medium was removed, monolayers were washed with 1 mL of phosphate-buffered saline, and 100 μL of ARV S1133 at 106 TCID50/mL were inoculated onto the monolayers of each well. Control wells received the same volume of DMEM only. Immediately after inoculation of the virus, 1.5 mL of DMEM containing 2% FBS was added to each well for post-inoculation maintenance. At 6, 12, and 24 hours post-inoculation (hpi) each plate to be harvested was removed from the incubator one at a time, placed on ice, and the medium was removed. For immediate RNA release from the cells, 1 mL of RLT lysis buffer (Qiagen, Hilden, Germany) was added to each well. The cells were mixed with RLT using a 21-gauge needle syringe and pipetted into 1.5 mL tubes. The homogenate was frozen immediately at -80°C until RNA extraction.
2.4. Quantitative PCR for Viral Load
RNA was extracted from 5 of the 6 samples using the RNeasy Mini Kit (Qiagen, Hilden, Germany) as per the manufacturer’s instructions. Viral RNA load was quantified by targeting the M1 gene of ARV. Total RNA was denatured for 10 minutes at 95°C and RNA was reverse transcribed using the LunaScript RT SuperMix Kit (New England Biolabs, Ipswich, MA). The qPCR was performed using Forget-Me-Not™ Universal Probe qPCR Master Mix, with the following primers: forward (5’-ATG GCC TMT CTA GCC ACA CCT G-3’), reverse (5’-CAA CGA RAT RGC ATCA ATA GTAC-3’) and probe (5’-TGC TAG GAG TCG GTT CTC GTA-3’) [30]. GAPDH gene was targeted to normalize the viral loads, using the primers designed in-house as follows: forward (5’-TGG TGG CCA TCA ATG ATC CC-3’) and reverse (5’-ACC TGC ATC TGC CCA TTT GA-3’), and probe (5’-ACT GTC AAG GCT GAG AAC GG-3’). All PCRs were conducted using the qTOWER³ PCR Thermal Cycler (Analytik Jena, Jena, Germany). Amplification peaks were analyzed by qPCRSoft program version 4.1. Relative viral RNA loads were calculated using the formula: .
2.5. RNA Sequencing
Total RNA was submitted to GENEWIZ (South Plainfield, NJ), where the samples were quantified using a Qubit 2.0 Fluorometer (Life Technologies, Carlsbad, CA, USA). RNA integrity was checked using Agilent TapeStation 4200 (Agilent Technologies, Palo Alto, CA, USA). ERCC RNA Spike-In Mix ThermoFisher Scientific, Waltham, MA) was added to normalized total RNA before library preparation following the manufacturer’s protocol.
The RNA sequencing libraries were prepared using the NEBNext Ultra II RNA Library Prep Kit for Illumina, following the manufacturer’s instructions (New England Biolabs, Ipswich, MA, USA). Briefly, mRNAs were initially enriched with Oligod(T) beads. Enriched mRNAs were fragmented by heating for 15 minutes at 94°C. First-strand and second-strand cDNA were subsequently synthesized. cDNA fragments were end-repaired and adenylated at 3’ends, and universal adapters were ligated to cDNA fragments, followed by ligation of oligonucleotides for indexing (barcoding) and library enrichment by PCR with limited cycles. The sequencing libraries were validated on the Agilent TapeStation (Agilent Technologies, Palo Alto, CA, USA), and quantified by using Qubit 2.0 Fluorometer (ThermoFisher Scientific, Waltham, MA, USA) as well as by quantitative PCR (KAPA Biosystems, Wilmington, MA, USA).
The sequencing libraries were clustered on one flow-cell lane. After clustering, the flow cell was loaded on the Illumina instrument (4000 or equivalent) according to the manufacturer’s instructions. The samples were sequenced using a 2x150-bp paired-end configuration. Image analysis and base calling were conducted by the Control software. Raw sequence data (.bcl files) generated from the sequencer were converted into fastq files and de-multiplexed using Illumina's bcl2fastq 2.17 software. One mismatch was allowed for index sequence identification.
2.6. Read Alignment, Principal Component and Differential Expression Analyses
Raw sequencing reads were processed using fastp program [31], version v0.23.4, for quality control and trimming. Reads were then aligned to the Gallus gallus genome (GenBank accession GCA_016699485.1) using HISAT2 [32] version 2.2.1. For quantification, featureCounts [33] version 2.0.1 was used to count the number of reads aligned against the reference. The principal component analysis (PCA) plots were generated using built-in stats package in R, and PERMANOVA test [34] was utilized to assess statistical significance. The differential expression analysis was performed on the output of featureCounts [33] subread module version 2.0.1 using edgeR [35] version 4.2.1. The counts of differentially expressed genes (DEGs) were filtered at log2 fold change > 1 and P < 0.05 adjusted with Benjamini-Hochberg (BH) correction [36] to account for the false discovery rate. The output was used to create bar plots for the numbers of DEGs identified for each cell type and time point. Genes detected in each cell type were pooled across timepoints and used to generate an UpSet plot [37] using the UpSetR library [38] version 1.4.0. The statistical analyses and plotting were performed using RStudio version 2024.04.2+764 [39,40]. The scripts used for all the analyses is available at (https://github.com/Zubair2021/ARV_Cell_Transcriptomics_2024).
2.7. Pathway Annotation and Comparison
The lists of DEGs obtained from edgeR output were used as input to compare pathways enriched in each cell type using Metascape [41], version 3.5.20240901. The pathway networks were visually enhanced using Cytoscape version 3.10.1 [42], and the most significant pathway of the cluster was annotated using AutoAnnotate [43] version 1.3.0.
2.8. Protein-protein Interaction (PPI) Analysis
2.9. Isoform Switch Analysis
Quality trimmed reads were aligned using splice-aware mapper STAR [45] version 2.7.11b, followed by transcript assembly with StringTie [46] version 2.2.3. Ballgown-type outputs [47] were generated comprising transcript abundance estimates, and differential isoform expression was conducted with IsoformSwitchAnalyzeR [48] version 2.4.0 to predict isoform usage following ARV inoculation.
3. Results
3.1. Avian Reovirus Replication in Different Cell Types
Avian reovirus S1133 replication was evaluated across the three different cell types, CEK, CELi, and HD11, at multiple time points post-inoculation. Figure 1 shows the relative viral RNA levels, quantified using qPCR targeting the ARV M1 gene and normalized against the housekeeping gene GAPDH. The data revealed a time-dependent increase in viral RNA across all cell types, with the highest levels observed in CELi cells at 24 hpi. The replication was greater in CEK cells compared to HD11 cells.
3.2. Principal Component Analysis of Gene Expression
Principal component analysis was performed to explore the variance in gene expression profiles between infected and control samples across time points and cell types. The PCA plot (Figure 2) revealed distinct clustering based on cell type. Among CEK and HD11 samples, some clustering was observed based on timepoints (Figure 3).
The statistical analysis using PERMANOVA test revealed statistically significant (P < 0.001) Euclidean distance between cell types suggesting that the variance in gene expression was attributed to cell type differences. While CEK and HD11 samples had a time-dependent distribution of samples, the PERMANOVA showed these were not statistically significant (P = 0.307). The treatment had the least effect on the clustering patterns and did not achieve statistical significance (P = 0.401).
3.3. Differential Gene Expression Analysis
Differential gene expression compared to uninoculated control cells was assessed across the three cell types infected with ARV S1133 at 6, 12, and 24 hours post-inoculation. As summarized in the bar plot (Figure 4), CEK cells had 49 DEGs at 6 hpi, decreasing to 4 DEGs at 12 hpi, before rising again to 30 DEGs by 24 hpi. Similarly, CELi cells had 26, 13, and 31 DEGs at 6, 12, and 24 hpi, respectively.
Primary chicken embryo kidney (CEK) and liver (CELi) cells, and immortalized macrophage-like cells (HD11) were inoculated with either ARV S1133 or DMEM. In CEK and CELi cells, a decline in the number of DEGs was observed at 12 hpi. The highest number of DEGs was identified in HD11 cells, especially at 12 hpi.
In contrast, HD11 cells exhibited the highest DEG counts, with 57, 170, and 94 DEGs at 6, 12, and 24 hpi, respectively. As illustrated in Figure 5, a total of 82, 63, and 318 unique DEGs were identified for CEK, CELi, and HD11 respectively. Only one DEG, i.e., fatty acid-binding protein 4 (FABP4), was found to be common among all three cell types (Figure 5).
3.4. Protein-Protein Interaction Network
A PPI network was constructed to examine the interactions between genes involved in the cellular response to ARV S1133 at various timepoints post-inoculation. The analysis revealed key immune-related genes (Figure 6: interferon alpha-inducible protein 6 (IFI6) associated with inhibition of viral replication by promoting apoptosis; radical S-adenosyl methionine domain-containing 2 (RSAD2, viperin) involved in viral replication inhibition by disrupting lipid rafts necessary for virus budding; myxovirus resistance protein 1 (MX1), a GTPase linked to viral replication inhibition through interferons, and 2’-5’-oligoadenylate synthetase-like (OASL) which is involved in degradation of viral RNA by activating RNase, as key nodes in the network underscoring their importance in mediating the cellular defense against ARV S1133 infection
3.5. Pathway Enrichment: Gene Ontology Analysis
As illustrated in Figure 7, an analysis of unique DEGs for biological process enrichment indicated a distinct profile of significantly upregulated pathways for each cell type. In CEK cells, immune response-related pathways were significantly enriched, including lymphocyte chemotaxis (GO:0048247, P < 0.01) and cellular response to type-II interferon (GO:0071346, P < 0.01). Additional processes such as chemokine-mediated signaling and regulation of hydrolase activity were also enriched (P < 0.01).
In CELi cells, defense response pathways were strongly represented, with enrichment for defense response to symbiont (GO:0140546, P < 0.001) and external biotic stimulus (GO:0043207, P < 0.001). Response to virus and interspecies interaction processes were also significantly overrepresented (P < 0.001). In HD11 cells, coagulation-related processes were prominent, including blood coagulation (GO:0007596, P < 0.01) and negative regulation of endopeptidase activity (GO:0010951, P < 0.01). Similar processes like wound healing and regulation of body fluid levels were additionally enriched (P < 0.01).
3.6. Network Analysis of Pathways
The pathway analysis using DEGs from three cell types revealed distinct but interconnected pathways (Figure 8) that were significantly upregulated in different cell types following infection or treatment. The pie charts at each node indicate the variable percentage of DEGs from each cell type being representing enrichment of a certain pathway.
The clusters primarily associated with CELi cells displayed a significant enrichment in pathways related to viral replication, leukocyte differentiation, and host responses to viral invasion. Genes in this cluster are involved in processes such as viral genome replication, transcriptional regulation by viral proteins, and antiviral immune responses.
DEGs from CEK cells primarily contributed to pathways related to the complement and coagulation cascades. This indicates that these cells had enrichment of processes involved in coagulation and hemostasis, likely in response to inflammation or cell damage induced by infection. Pathways such as platelet degranulation and the response to elevated platelet cytosolic calcium levels were also prominent.
Interestingly, DEGs in HD11 cells contributed to pathways predominantly related to growth and metabolism. The pathways included axonogenesis and sensory organ development, among others.
3.7. Isoform Switching Analysis
Since CELi indicated upregulation of pathways related to defense against the virus, splicing isoform usage as investigated in the infected CELi cells. As shown in the volcano plot (Figure 9), significant isoform switches for transcripts from 16 genes (shown as red dots) were observed.
The top 10 exhibiting significant isoform switch based on q-value and their functions have been listed in Supplementary Table 1. Most of the genes showing changes in alternative RNA splicing patterns have been associated with cancer. One gene, ANKRD17, has been previously linked with antiviral immunity through RIG-1-like receptor-mediated signaling.
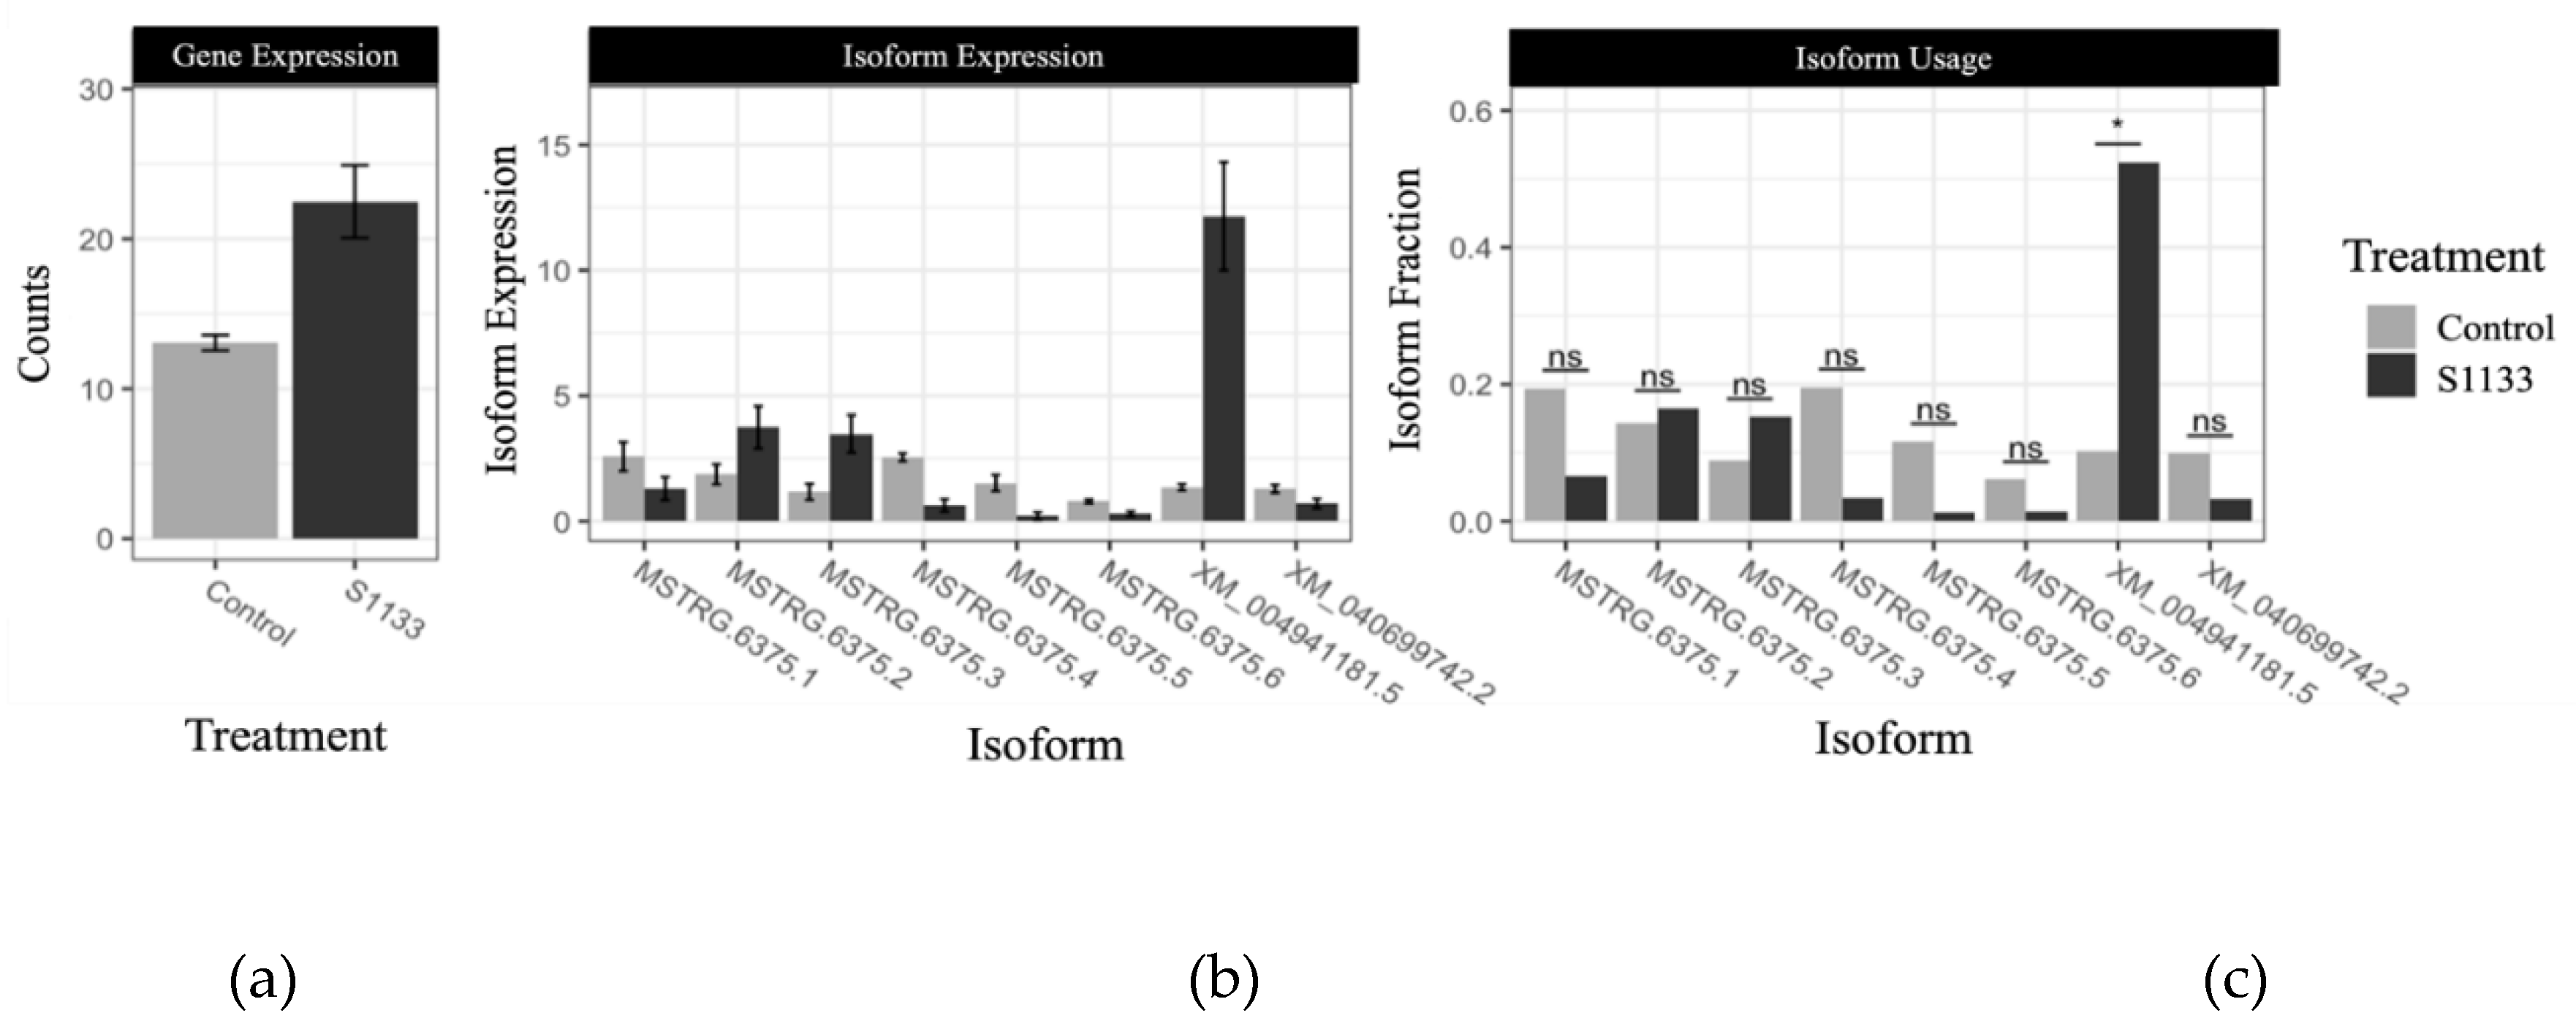
A notable switch in ANKRD17 isoform usage between control and ARV S1133-infected samples has been illustrated in Figure 10, where isoform XM_040694181.5 showed a substantial increase in expression following infection.
4. Discussion
The study aimed at exploring ARV-induced transcriptomic changes across three cell types CEK, CELi, and HD11 at 6, 12, and 24 hpi. The primary CEK and CELi cultures were selected because of their pathological relevance and heterogeneous cell populations [50,51], as they better represent gene expression patterns of a tissue compared to secondary cell lines with more homogeneous cell populations. The cell line HD11 was selected to ascertain the immune responses of macrophages due to their relevance in ARV dissemination across tissues [52], potential association with impaired phagocytosis [53,54] and immunosuppression [55,56].
The quantification of viral RNA levels at various timepoints demonstrated a cell-type-dependent replication efficiency of ARV S1133, with the highest viral loads observed in CELi cells, followed by CEK cells, and the least efficient replication in HD11 cells. A higher replication of ARV in CELi compared to CEK is concordant with the previous findings on differences in the sensitivity of these two cell types to ARV infection [57]. Moreover, these results corroborate the observations of lower ARV replication in kidneys compared to livers in vivo and hence, lesser induction of lesions in the former [58]. Conversely, a higher replication efficiency of infectious bronchitis virus (IBV) in CEK compared to CELi has been demonstrated previously [59], further affirming that replication efficiency of a virus in cultured cells could reflect its tissue tropism in vivo.
While ARV S1133 has been shown to replicate in peripheral blood monocyte cultures [60], and chicken bone marrow-derived macrophages as efficiently as in CK cells [61], a lower replication of S1133 in HD11 cells in our study showed a restricted efficiency of productive ARV infection in this secondary cell line [62]. Interestingly, despite exhibiting limited ARV replication, macrophage-like cell line had the highest number of DEGs at all time points. Such a negative correlation of viral loads with number of DEGs has been reported for swine macrophages infected with the African swine fever virus [63]. Contrastingly, this negative correlation of viral replication with host gene expression remains at odds with the observations on IBV-infected HD11 cells [64]. Since our approach included viral genomic RNA as well as mRNA quantification, the viral loads represent both viral genomic RNA copies as well as the viral mRNA, unlike minus-strand specific PCRs, which signify progeny virus genome replication [65].
Interestingly, a lower number of DEGs was observed at 12 hpi for CEK andCELi, with a subsequent increase again at 24 hpi. The balance between viral replication and host response in these cells could be a potential viral strategy to maintain a favorable environment for propagation while avoiding overwhelming host shut off [66,67]. Although neither CEK nor HD11 cells had any common DEGs across timepoints, three genes i.e. OASL, IFIT5, and IFI6, were consistently differentially regulated in CELi cells at all 3 timepoints tested. These interferon-stimulated genes (ISGs), along with others, were also part of the protein-protein interaction network generated using DEGs expressed in CELi cells at all timepoints. These genes appear to be a part of the core antiviral response against avian reovirus in vivo [24,25,68] and in vitro [20], as well as against other viruses [69,70,71,72,73,74]. Remarkably, despite the most efficient ARV replication in CELi cells, this cell type had the lowest counts of DEGs.
In the ARV-infected CEK cells, pathways pertaining to type-II IFNs and IL-1 were enriched, validating the findings of previous researchers [23,24,75]. This is in contrast with previous studies demonstrating ineffective induction of IFNs in CEK cells [27] and the downregulation of IFN-β in spleens of chickens infected with ARV [25]. The enrichment of pathways related to heterophil and lymphocyte chemotaxis and migration in CEK cells suggested chemokine-induced preferential recruitment of these immune cells [76].
Surprisingly, HD11 cells exhibited differential regulation of individual pathways associated with blood such as fibrinogenesis and complement cascade activation. Similar observations have been made with IBV-infected chicken kidneys, where DEGs related to complement factors and blood vessel-associated pathways were identified [77]. Moreover, the role of the complement system in immune responses has been described for the influenza virus [78], human immunodeficiency virus [79], Sindbis virus [80], and dengue virus [81] infections. Additionally, an enrichment in several pathways involved in the regulation of endopeptidase activity could be speculatively associated with reovirus replication. Cathepsins, a class of endopeptidases involved in lysosomal proteolysis, have been linked to reovirus entry and disassembly [82]. Since the outer capsid processing of various reoviruses in macrophage-like cells has been associated with endopeptidase cathepsin-S [83], the regulation of endopeptidase activity in ARV-infected HD11 cells suggests a potential cellular response to infection to prevent ARV entry and disassembly. These results contradict in vivo studies with other viruses where significantly increased endopeptidase activity was observed in the pancreas of reovirus type-3 infected suckling mice [84] and high endopeptidase expression was related to severe outcomes with SARS-CoV-2 infection [85].
The identification of fatty acid-binding protein 4 (FABP4) as the only common DEG among all three cell types is a novel finding in the context of ARV infection. While FABP4 has not been studied in the context of reovirus-induced arthritis or tenosynovitis, it has been described as a biomarker of human knee osteoarthritis, where patients exhibited significantly higher systemic and synovial FABP4 [86]. Interestingly, a pro-inflammatory role of FABP4 has been described in the pathogenesis of chronic tendinopathy in humans. The results were confirmed with experimental tendon degeneration in mice [87]. Moreover, a higher level of FABP4 in lungs and circulation of patients infected with SARS-CoV-2, and an experimental alleviation of viral loads, lung damage, and fibrosis in infected hamsters treated with FABP4 inhibitors underscored its importance as a biomarker [88]. Roles of FABP4 in cancer [89], neutrophil recruitment in Pseudomonas infections [90], and inflammatory gene expression in grass carp [91] have been described.
Effects on alternative splicing of host precursor mRNA, resulting in expression of different transcript isoforms and their ultimate translation into proteins with divergent functions, have been reported previously for a mammalian orthoreovirus [92], as well as for influenza viruses [93,94]. In the present study, a novel observation of significant isoform switches due to alternative splicing of host transcripts in infected CELi cells adds another layer of complexity to the current understanding of the host response against ARV. A notable switch in isoform of the ANKRD17 gene transcript was especially interesting, given the implication of the gene product in antiviral immune responses via the retinoic acid-inducible gene-I (RIG-I)-like receptor (RLR) signaling pathway in influenza virus infections [95,96], and pro-inflammatory responses in bacterial infections [97]. The human orthologues of some other DEGs exhibiting isoform switches in ARV-infected cells are associated with cellular response to cancer. Since the oncolytic potential of ARVs has been documented previously [98,99,100], the differential isoform usage among various cancer-linked genes found in the current study suggests that ARV-induced oncolysis could potentially be explained by further exploration of alternative splicing.
In conclusion, the study describes a detailed molecular snapshot of ARV infection in three cell types, where viral replication efficiency, host gene expression, and cellular responses remain cell-type-specific but somewhat interconnected and uniquely meaningful.
Supplementary Materials
The following supporting information can be downloaded at the website of this paper posted on Preprints.org.
Author Contributions
Conceptualization, Z.K., R.H.; methodology, Z.K.; formal analysis, Z.K.; resources, R.H.; data curation, Z.K.; writing—original draft preparation, Z.K.; writing—review and editing, R.H.; visualization, Z.K.; funding acquisition, R.H. All authors have read and agreed to the published version of the manuscript.
Funding
This research was funded by United States Department of Agriculture - Agricultural Research Service (USDA-ARS), project number 58-6040-3-016.
Data Availability Statement
The raw reads are available at Sequence Read Archive, National Center for Biotechnology Information (NCBI) under the accession PRJNA1102662.
Acknowledgments
We acknowledge the technical assistance of Dr. Teresa Dormitorio and Clarissa Fonseca-Ferguson from Department of Poultry Science, Auburn University, and Dr. Heather Walz and Emily Handley from Sate Diagnostic Lab at Auburn for their technical and logistic support with these experiments.
Conflicts of Interest
The authors declare no conflicts of interest.
References
- Kovács, E.; Varga-Kugler, R.; Mató, T.; Homonnay, Z.; Tatár-Kis, T.; Farkas, S.; Kiss, I.; Bányai, K.; Palya, V. Identification of the main genetic clusters of avian reoviruses from a global strain collection. Front. Vet. Sci. 2023, 9, 1094761. [Google Scholar] [CrossRef] [PubMed]
- Dobson, K.N.; Glisson, J.R. Economic impact of a documented case of reovirus infection in broiler breeders. Avian Dis. 1992, 36, 788–791. [Google Scholar] [CrossRef] [PubMed]
- French, D. Incidence and economic impact of reovirus in the poultry industries in the United States. Avian Dis. 2022, 66, 432–434. [Google Scholar] [CrossRef]
- Olson, N.O.; Kerr, K.M. Some characteristics of an avian arthritis viral agent. Avian Dis. 1966, 10, 470–476. [Google Scholar] [CrossRef]
- Olson, N.O.; Solomon, D.P. A natural outbreak of synovitis caused by the viral arthritis agent. Avian Dis. 1968, 12, 311–316. [Google Scholar] [CrossRef]
- Rosenberger, J.K.; Sterner, F.J.; Botts, S.; Lee, K.P.; Margolin, A. In vitro and in vivo characterization of avian reoviruses. I. pathogenicity and antigenic relatedness of several avian reovirus isolates. Avian Dis. 1989, 33, 535. [Google Scholar] [CrossRef]
- Kibenge, F.S.B.; Wilcox, G.E. Tenosynovitis in chickens. 1983, 53, 431–444.
- Mandelli, G.; Rampin, T.; Finazzi, M. Experimental reovirus hepatitis in newborn chicks. Vet. Pathol. 1978, 15, 531–543. [Google Scholar] [CrossRef] [PubMed]
- Choi, Y.-R.; Kim, S.-W.; Shang, K.; Park, J.-Y.; Zhang, J.; Jang, H.-K.; Wei, B.; Cha, S.-Y.; Kang, M. Avian reoviruses from wild birds exhibit pathogenicity to specific pathogen free chickens by footpad route. Front. Vet. Sci. 2022, 9, 844903. [Google Scholar] [CrossRef]
- Davis, J.F.; Kulkarni, A.; Fletcher, O. Reovirus infections in young broiler chickens. Avian Dis. 2013, 57, 321–325. [Google Scholar] [CrossRef]
- Davis, J.F.; Kulkarni, A.; Fletcher, O. Myocarditis in 9- and 11-day-old broiler breeder chicks associated with a reovirus infection. Avian Dis. 2012, 56, 786–790. [Google Scholar] [CrossRef]
- Jones, R.C. Reoviruses from chickens with hydropericardium. Vet. Rec. 1976, 99, 458. [Google Scholar] [CrossRef]
- Spradbrow, P.B.; Bains, B.S. Reoviruses from chickens with hydropericardium. Aust. Vet. J. 1974, 50, 179–179. [Google Scholar] [CrossRef] [PubMed]
- Montgomery, R.D.; Boyle, C.R.; Maslin, W.R.; Magee, D.L. Attempts to reproduce a runting/stunting-type syndrome using infectious agents isolated from affected mississippi broilers. Avian Dis. 1997, 41, 80–92. [Google Scholar] [CrossRef] [PubMed]
- Neelima, S.; Ram, G.C.; Kataria, J.M.; Goswami, T.K. Avian reovirus induces an inhibitory effect on lymphoproliferation in chickens. Vet. Res. Commun. 2003, 27, 73–85. [Google Scholar] [CrossRef]
- Wang, L.; Cui, Z.; Sun, A.; Sun, S.H. Influence of avian reovirus infection on the bursa and immune-reactions in chickens. Wei sheng wu xue bao. 2007, 47 3, 492–497. [Google Scholar]
- Zhang, C.C.; Zhang, Q.Q.; Hu, X.M.; Wei, L.; Zhang, X.R.; Wu, Y.T. IFI16 plays a critical role in avian reovirus induced cellular immunosuppression and suppresses virus replication. Poult. Sci. 2024, 103 4, 103506. [Google Scholar]
- Meng, S.S.; Jiang, K.; Zhang, X.R.; Zhang, M.; Zhou, Z.Z.; Hu, M.Z.; Yang, R.; Sun, C.L.; Wu, Y.T. Avian reovirus triggers autophagy in primary chicken fibroblast cells and vero cells to promote virus production. Arch. Virol. 2012, 157, 661–668. [Google Scholar] [CrossRef]
- Labrada, L.; Bodelón, G.; Viñuela, J.; Benavente, J. Avian reoviruses cause apoptosis in cultured cells: Viral uncoating, but not viral gene expression, is required for apoptosis induction. J. Virol. 2002, 76, 7932–7941. [Google Scholar] [CrossRef] [PubMed]
- Niu, X.S.; Wang, Y.Y.; Li, M.; Zhang, X.R.; Wu, Y.T. Transcriptome analysis of avian reovirus-mediated changes in gene expression of normal chicken fibroblast DF-1 cells. BMC Genomics 2017, 18, 911. [Google Scholar] [CrossRef]
- Gao, L.; Liu, R.; Luo, D.; Li, K.; Qi, X.L.; Liu, C.J.; Zhang, Y.P.; Cui, H.Y.; Wang, S.Y.; Gao, Y.L.; et al. Avian reovirus σA protein inhibits type I interferon production by abrogating interferon regulatory factor 7 activation. J. Virol. 2022, 97, e01785–22. [Google Scholar] [CrossRef]
- Martínez-Costas, J.; González-López, C.; Vakharia, V.N.; Benavente, J. Possible involvement of the double-stranded RNA-binding core protein σa in the resistance of avian reovirus to interferon. J. Virol. 2000, 74, 1124–1131. [Google Scholar] [CrossRef] [PubMed]
- Lostalé-Seijo, I.; Martínez-Costas, J.; Benavente, J. Interferon induction by avian reovirus. Virology 2016, 487, 104–111. [Google Scholar] [CrossRef]
- Wang, S.; Xie, L.J.; Xie, Z.X.; Wan, L.J.; Huang, J.L.; Deng, X.W.; Xie, Z. qin; Luo, S.S.; Zeng, T.T.; Zhang, Y.F.; et al. Dynamic changes in the expression of interferon-stimulated genes in joints of spf chickens infected with avian reovirus. Front. Vet. Sci. 2021, 8, 618124. [Google Scholar] [CrossRef] [PubMed]
- Wang, S.; Huang, T.D.; Wan, L.J.; Ren, H.Y.; Wu, T.; Xie, L.J.; Luo, S.S.; Li, M.; Xie, Z.Q.; Fan, Q.; et al. Transcriptomic and translatomic analyses reveal insights into the signaling pathways of the innate immune response in the spleens of SPF chickens infected with avian reovirus. Viruses 2023, 15, 2346. [Google Scholar] [CrossRef]
- Ellis, M.N.; Eidson, C.S.; Fletcher, O.J.; Kleven, S.H. Viral tissue tropisms and interferon production in White Leghorn chickens infected with two avian reovirus strains. Avian Dis. 1983, 644–651. [Google Scholar]
- Ellis, M.N.; Eidson, C.S.; Brown, J.; Kleven, S.H. Studies on interferon induction and interferon sensitivity of avian reoviruses. Avian Dis. 1983, 27, 927–936. [Google Scholar] [CrossRef] [PubMed]
- Khalid, Z.; Alvarez-Narvaez, S.; Harrell, T.L.; Chowdhury, E.U.; Conrad, S.J.; Hauck, R. Retention of viral heterogeneity in an avian reovirus isolate despite plaque purification. Preprints 2025. [Google Scholar] [CrossRef]
- Reed, L.J.; Muench, H. A simple method of estimating fifty percent endpoints. Am. J. Epidemiol. 1938, 27, 493–497. [Google Scholar] [CrossRef]
- Tang, Y.; Lu, H.G. Whole genome alignment based one-step real-time RT-PCR for universal detection of avian orthoreoviruses of chicken, pheasant and turkey origins. Infect., Genet. Evol. 2016, 39, 120–126. [Google Scholar] [CrossRef]
- Chen, S.F.; Zhou, Y.Q.; Chen, Y.R.; Gu, J. Fastp: an ultra-fast all-in-one fastq preprocessor. Bioinformatics 2018, 34, i884–i890. [Google Scholar] [CrossRef]
- Kim, D.; Paggi, J.M.; Park, C.; Bennett, C.; Salzberg, S.L. Graph-based genome alignment and genotyping with HISAT2 and HISAT-genotype. Nat. Biotechnol. 2019, 37, 907–915. [Google Scholar] [CrossRef] [PubMed]
- Liao, Y.; Smyth, G.K.; Shi, W. FeatureCounts: an efficient general purpose program for assigning sequence reads to genomic features. Bioinformatics 2014, 30, 923–930. [Google Scholar] [CrossRef] [PubMed]
- Anderson, M.J. A new method for non-parametric multivariate analysis of variance. Austral Ecol. 2001, 26, 32–46. [Google Scholar] [CrossRef]
- Robinson, M.D.; McCarthy, D.J.; Smyth, G.K. EdgeR: a bioconductor package for differential expression analysis of digital gene expression data. Bioinformatics 2010, 26, 139–140. [Google Scholar] [CrossRef]
- Benjamini, Y.; Hochberg, Y. Controlling the false discovery rate: A practical and powerful approach to multiple testing. J. R. Stat. Soc., B (Methodol.) 1995, 57, 289–300. [Google Scholar]
- Lex, A.; Gehlenborg, N.; Strobelt, H.; Vuillemot, R.; Pfister, H. UpSet: Visualization of intersecting sets. IEEE Trans. Vis. Comput. Graphics 2014, 20, 1983–1992. [Google Scholar] [CrossRef]
- Conway, J.R.; Lex, A.; Gehlenborg, N. UpSetR: an R package for the visualization of intersecting sets and their properties. Bioinformatics 2017, 33, 2938–2940. [Google Scholar] [CrossRef]
- Posit Team RStudio: Integrated development environment for R 2024.
- R Core Team R: A language and environment for statistical computing 2023.
- Zhou, Y.Y.; Zhou, B.; Pache, L.; Chang, M.; Khodabakhshi, A.H.; Tanaseichuk, O.; Benner, C.; Chanda, S.K. Metascape provides a biologist-oriented resource for the analysis of systems-level datasets. Nat. Commun. 2019, 10, 1523. [Google Scholar] [CrossRef]
- Shannon, P.; Markiel, A.; Ozier, O.; Baliga, N.S.; Wang, J.T.; Ramage, D.; Amin, N.D.; Schwikowski, B.; Ideker, T. Cytoscape: A software environment for integrated models of biomolecular interaction networks. Genome Res. 2003, 13, 2498–2504. [Google Scholar] [CrossRef]
- Kucera, M.; Isserlin, R.; Arkhangorodsky, A.; Bader, G.D. AutoAnnotate: A cytoscape app for summarizing networks with semantic annotations 2016.
- Szklarczyk, D.; Kirsch, R.; Koutrouli, M.; Nastou, K.; Mehryary, F.; Hachilif, R.; Gable, A.L.; Fang, T.; Doncheva, N.T.; Pyysalo, S.; et al. The string database in 2023: Protein–protein association networks and functional enrichment analyses for any sequenced genome of interest. Nucleic Acids Res. 2023, 51, D638–D646. [Google Scholar] [CrossRef]
- Dobin, A.; Davis, C.A.; Schlesinger, F.; Drenkow, J.; Zaleski, C.; Jha, S.; Batut, P.; Chaisson, M.; Gingeras, T.R. STAR: Ultrafast universal RNA-seq aligner. Bioinformatics 2013, 29, 15–21. [Google Scholar] [CrossRef]
- Pertea, M.; Pertea, G.M.; Antonescu, C.M.; Chang, T.-C.; Mendell, J.T.; Salzberg, S.L. StringTie enables improved reconstruction of a transcriptome from RNA-seq reads. Nat. Biotechnol. 2015, 33, 290–295. [Google Scholar] [CrossRef]
- Frazee, A.C.; Pertea, G.; Jaffe, A.E.; Langmead, B.; Salzberg, S.L.; Leek, J.T. Ballgown bridges the gap between transcriptome assembly and expression analysis. Nat. Biotechnol. 2015, 33, 243–246. [Google Scholar] [CrossRef]
- Vitting-Seerup, K.; Sandelin, A. IsoformSwitchAnalyzeR: Analysis of changes in genome-wide patterns of alternative splicing and its functional consequences. Bioinform. (Oxf. Engl.) 2019, 35, 4469–4471. [Google Scholar] [CrossRef]
- Khalid, Z. Tissue-specific transcriptomic responses to avian reovirus inoculation in ovo. 2025.
- Buckley, I.K.; Walton, J.R. A simple method for culturing chick embryo liver and kidney parenchymal cells for microscopic studies. Tissue Cell 1974, 6, 641–652. [Google Scholar] [CrossRef]
- Wang, H.M.; Liu, J.Y.; Zhu, P.H.; Shi, L.; Liu, Y.L.; Yang, X.J.; Yang, X. Single-nucleus transcriptome reveals cell dynamic response of liver during the late chick embryonic development. Poult. Sci. 2024, 103, 103979. [Google Scholar] [CrossRef]
- Chen, Y.S.; Shen, P.C.; Su, B.S.; Liu, T.C.; Lin, C.C.; Lee, L.H. Avian reovirus replication in mononuclear phagocytes in chicken footpad and spleen after footpad inoculation. Can. J. Vet. Res. 2015, 79, 87–94. [Google Scholar]
- Mills, J.N. Interactions between avian phagocytic leukocytes and microbiological agents associated with avian tenosynovitis, Murdoch University, 1990.
- Mills, J.N.; Wilcox, G.E. Replication of four antigenic types of avian reovirus in subpopulations of chicken leukocytes. Avian Pathol. 1993, 22, 353–361. [Google Scholar] [CrossRef]
- Pertile, T.L.; Sharma, J.M.; Walser, M.M. Reovirus infection in chickens primes splenic adherent macrophages to produce nitric oxide in response to T cell-produced factors. Cell. Immunol. 1995, 164, 207–216. [Google Scholar] [CrossRef]
- Pertile, T.L.; Karaca, K.; Walser, M.M.; Sharma, J.M. Suppressor macrophages mediate depressed lymphoproliferation in chickens infected with avian reovirus. Vet. Immunol. Immunopathol. 1996, 53, 129–145. [Google Scholar] [CrossRef]
- Guneratne, J.R.M.; Jones, R.C.; Georgiou, K. Some observations on the isolation and cultivation of avian reoviruses. Avian Pathol. 1982, 11, 453–462. [Google Scholar] [CrossRef]
- Ni, Y.W.; Kemp, M.C. A comparative study of avian reovirus pathogenicity: Virus spread and replication and induction of lesions. Avian Dis. 1995, 39, 554–566. [Google Scholar] [CrossRef]
- Lukert, P.D. Comparative sensitivities of embryonating chicken’s eggs and primary chicken embryo kidney and liver cell cultures to infectious bronchitis virus. Avian Dis. 1965, 9, 308–316. [Google Scholar] [CrossRef]
- Haffer, K. In vitro and in vivo studies with an avian reovirus derived from a temperature-sensitive mutant clone. Avian Dis. 1984, 28, 669–676. [Google Scholar] [CrossRef]
- von Bülow, V.; Klasen, A. Effects of avian viruses on cultured chicken bone-marrow-derived macrophages. Avian Pathol. 1983, 12, 179–198. [Google Scholar] [CrossRef]
- Swanson, G.J.; Meyers, J.; Huang, D.D. Restricted growth of avirulent avian reovirus strain 2177 in macrophage derived HD11 cells. Virus Res. 2001, 81, 103–111. [Google Scholar] [CrossRef]
- Zheng, Y.X.; Li, S.; Li, S.-H.; Yu, S.X.; Wang, Q.H.; Zhang, K.H.; Qu, L.; Sun, Y.; Bi, Y.H.; Tang, F.C.; et al. Transcriptome profiling in swine macrophages infected with african swine fever virus at single-cell resolution. Proc. Natl. Acad. Sci. U. S. A. 2022, 119, e2201288119. [Google Scholar] [CrossRef]
- Sun, X.Q.; Wang, Z.; Shao, C.H.; Yu, J.; Liu, H.Y.; Chen, H.J.; Li, L.; Wang, X.R.; Ren, Y.D.; Huang, X.D.; et al. Analysis of chicken macrophage functions and gene expressions following infectious bronchitis virus M41 infection. Vet. Res. 2021, 52, 14. [Google Scholar] [CrossRef]
- Wang, Z.P.; He, M.H.; He, H.; Kilby, K.; Antueno, R. de; Castle, E.; McMullen, N.; Qian, Z.Y.; Zeev-Ben-Mordehai, T.; Duncan, R.; et al. Nonenveloped avian reoviruses released with small extracellular vesicles are highly infectious. Viruses 2023, 15, 1610. [Google Scholar] [CrossRef]
- Li, J.Y.; Huang, W.-R.; Liao, T.L.; Nielsen, B.L.; Liu, H.J. Oncolytic avian reovirus p17-modulated inhibition of mTORC1 by enhancement of endogenous mTORC1 inhibitors binding to mTORC1 to disrupt its assembly and accumulation on lysosomes. J. Virol. 2022, 96, e00836–22. [Google Scholar] [CrossRef]
- Smith, J.A.; Schmechel, S.C.; Williams, B.R.G.; Silverman, R.H.; Schiff, L.A. Involvement of the interferon-regulated antiviral proteins PKR and RNase l in reovirus-induced shutoff of cellular translation. J. Virol. 2005, 79, 2240–2250. [Google Scholar] [CrossRef]
- Wang, S.; Wan, L.J.; Ren, H.Y.; Xie, Z.X.; Xie, L.J.; Huang, J.L.; Deng, X.W.; Xie, Z.Q.; Luo, S.S.; Li, M.; et al. Screening of interferon-stimulated genes against avian reovirus infection and mechanistic exploration of the antiviral activity of IFIT5. Front. Microbiol. 2022, 13, 998505. [Google Scholar] [CrossRef]
- Barber, M.R.W.; Aldridge, J.R.; Fleming-Canepa, X.; Wang, Y.-D.; Webster, R.G.; Magor, K.E. Identification of avian RIG-1 responsive genes during influenza infection. Mol. Immunol. 2013, 54, 89–97. [Google Scholar] [CrossRef]
- Dulwich, K.L.; Giotis, E.S.; Gray, A.; Nair, V.; Skinner, M.A.; Broadbent, A.J. Differential gene expression in chicken primary B cells infected ex vivo with attenuated and very virulent strains of infectious bursal disease virus (IBDV). J. Gen. Virol. 2017, 98, 2918–2930. [Google Scholar] [CrossRef]
- Gao, S.; Wang, Z.Z.; Jiang, H.; Sun, J.; Diao, Y.X.; Tang, Y.; Hu, J.D. Transcriptional analysis of host responses related to immunity in chicken spleen tissues infected with reticuloendotheliosis virus strain SNV. Infect., Genet. Evol. 2019, 74, 103932. [Google Scholar] [CrossRef]
- Lopes, T.S.B.; Nankemann, J.; Breedlove, C.; Pietruska, A.; Espejo, R.; Cuadrado, C.; Hauck, R. Changes in the transcriptome profile in young chickens after infection with LaSota Newcastle disease virus. Vaccines 2024, 12, 592. [Google Scholar] [CrossRef]
- O’Dowd, K.; Isham, I.M.; Vatandour, S.; Boulianne, M.; Dozois, C.M.; Gagnon, C.A.; Barjesteh, N.; Abdul-Careem, M.F. Host immune response modulation in avian coronavirus infection: Tracheal transcriptome profiling in vitro and in vivo. Viruses 2024, 16, 605. [Google Scholar] [CrossRef]
- Sajewicz-Krukowska, J.; Jastrzębski, J.P.; Grzybek, M.; Domańska-Blicharz, K.; Tarasiuk, K.; Marzec-Kotarska, B. Transcriptome sequencing of the spleen reveals antiviral response genes in chickens infected with CAstV. Viruses 2021, 13, 2374. [Google Scholar] [CrossRef]
- Wu, T.; Lv, Y.; Li, X.N.; Zhao, D.; Yi, D.; Wang, L.; Li, P.; Chen, H.B.; Hou, Y.Q.; Gong, J. Establishment of a recombinant Escherichia coli-induced piglet diarrhea model. Front. Biosci. 2018, 23, 1517–1534. [Google Scholar]
- Lam, K.M. Chemotactic activities of avian lymphocytes. Dev. Comp. Immunol. 1999, 23, 641–647. [Google Scholar] [CrossRef]
- Cong, F.; Liu, X.L.; Han, Z.X.; Shao, Y.H.; Kong, X.G.; Liu, W. Transcriptome analysis of chicken kidney tissues following coronavirus avian infectious bronchitis virus infection. BMC Genomics 2013, 14, 743. [Google Scholar] [CrossRef] [PubMed]
- Jayasekera, J.P.; Moseman, E.A.; Carroll, M.C. Natural antibody and complement mediate neutralization of influenza virus in the absence of prior immunity. J. Virol. 2007, 81, 3487–3494. [Google Scholar] [CrossRef] [PubMed]
- Aasa-Chapman, M.M.I.; Holuigue, S.; Aubin, K.; Wong, M.; Jones, N.A.; Cornforth, D.; Pellegrino, P.; Newton, P.; Williams, I.; Borrow, P.; et al. Detection of antibody-dependent complement-mediated inactivation of both autologous and heterologous virus in primary human immunodeficiency virus type 1 infection. J. Virol. 2005, 79, 2823–2830. [Google Scholar] [CrossRef]
- Hirsch, R.L.; Griffin, D.E.; Winkelstein, J.A. The effect of complement depletion on the course of Sindbis virus infection in mice. J. Immunol. 1978, 121, 1276–1278. [Google Scholar] [CrossRef]
- Avirutnan, P.; Malasit, P.; Seliger, B.; Bhakdi, S.; Husmann, M. Dengue virus infection of human endothelial cells leads to chemokine production, complement activation, and apoptosis. J. Immunol. 1998, 161, 6338–6346. [Google Scholar] [CrossRef] [PubMed]
- Ebert, D.H.; Deussing, J.; Peters, C.; Dermody, T.S. Cathepsin l and cathepsin B mediate reovirus disassembly in murine fibroblast cells. J. Biol. Chem. 2002, 277, 24609–24617. [Google Scholar] [CrossRef]
- Golden, J.W.; Bahe, J.A.; Lucas, W.T.; Nibert, M.L.; Schiff, L.A. Cathepsin S supports acid-independent infection by some reoviruses. J. Biol. Chem. 2004, 279, 8547–8557. [Google Scholar] [CrossRef]
- Branski, D.; Lebenthal, E.; Faden, H.S.; Hatch, T.F.; Krasner, J. Reovirus type 3 infection in a suckling mouse: The effects on pancreatic structure and enzyme content. Pediatr. Res. 1980, 14, 8–11. [Google Scholar] [CrossRef]
- Abdel-Aziz, M.I.; Kermani, N.Z.; Neerincx, A.H.; Vijverberg, S.J.H.; Guo, Y.K.; Howarth, P.; Dahlen, S.-E.; Djukanovic, R.; Sterk, P.J.; Kraneveld, A.D.; et al. Association of endopeptidases, involved in SARS-CoV-2 infection, with microbial aggravation in sputum of severe asthma. Allergy 2021, 76, 1917–1921. [Google Scholar] [CrossRef]
- Zhang, C.F.; Li, T.; Chiu, K.Y.; Wen, C.Y.; Xu, A.M.; Yan, C.H. FABP4 as a biomarker for knee osteoarthritis. Biomarkers Med. 2018, 12, 107–118. [Google Scholar] [CrossRef]
- Ma, Z.B.; Lee, A.Y.W.; Kot, C.H.; Yung, P.S.H.; Chen, S.; Lui, P.P.Y. Upregulation of FABP4 induced inflammation in the pathogenesis of chronic tendinopathy. J. Orthop. Transl. 2024, 47, 105–115. [Google Scholar] [CrossRef]
- Baazim, H.; Koyuncu, E.; Tuncman, G.; Burak, M.F.; Merkel, L.; Bahour, N.; Karabulut, E.S.; Lee, G.Y.; Hanifehnezhad, A.; Karagoz, Z.F.; et al. FABP4 as a therapeutic host target controlling SARS-CoV2 infection 2024.
- Gharpure, K.M.; Pradeep, S.; Sans, M.; Rupaimoole, R.; Ivan, C.; Wu, S.Y.; Bayraktar, E.; Nagaraja, A.S.; Mangala, L.S.; Zhang, X.N.; et al. FABP4 as a key determinant of metastatic potential of ovarian cancer. Nat. Commun. 2018, 9, 2923. [Google Scholar] [CrossRef]
- Liang, X.L.; Gupta, K.; Quintero, J.R.; Cernadas, M.; Kobzik, L.; Christou, H.; Pier, G.B.; Owen, C.A.; Çataltepe, S. Macrophage FABP4 is required for neutrophil recruitment and bacterial clearance in pseudomonas aeruginosa pneumonia. FASEB J. 2019, 33, 3562–3574. [Google Scholar] [CrossRef] [PubMed]
- Lei, C.; Xie, Y.; Li, S.; Jiang, P.; Du, J.; Tian, J. FABP4 contributes toward regulating inflammatory gene expression and oxidative stress in Ctenopharyngodon idella. Comp. Biochem. Physiol. B: Biochem. Mol. Biol. 2022, 259, 110715. [Google Scholar] [CrossRef]
- Boudreault, S.; Martenon-Brodeur, C.; Caron, M.; Garant, J.-M.; Tremblay, M.-P.; Armero, V.E.S.; Durand, M.; Lapointe, E.; Thibault, P.; Tremblay-Létourneau, M.; et al. Global profiling of the cellular alternative RNA splicing landscape during virus-host interactions. PLOS One 2016, 11, e0161914. [Google Scholar] [CrossRef]
- Baker, S.F.; Meistermann, H.; Tzouros, M.; Baker, A.; Golling, S.; Polster, J.S.; Ledwith, M.P.; Gitter, A.; Augustin, A.; Javanbakht, H.; et al. Alternative splicing liberates a cryptic cytoplasmic isoform of mitochondrial MECR that antagonizes influenza virus. PLOS Biol. 2022, 20, e3001934. [Google Scholar] [CrossRef]
- Thompson, M.G.; Dittmar, M.; Mallory, M.J.; Bhat, P.; Ferretti, M.B.; Fontoura, B.M.; Cherry, S.; Lynch, K.W. Viral-induced alternative splicing of host genes promotes influenza replication. eLife 2020, 9, e55500. [Google Scholar] [CrossRef]
- Li, M.; Qi, W.B.; Chang, Q.; Chen, R.H.; Zhen, D.L.; Liao, M.; Wen, J.K.; Deng, Y.Q. Influenza A virus protein PA-X suppresses host Ankrd17-mediated immune responses. Microbiol. Immunol. 2021, 65, 48–59. [Google Scholar] [CrossRef]
- Wang, Y.T.; Tong, X.M.; Li, G.; Li, J.H.; Deng, M.; Ye, X. Ankrd17 positively regulates RIG-I-like receptor (RLR)-mediated immune signaling. Eur. J. Immunol. 2012, 42, 1304–1315. [Google Scholar] [CrossRef]
- Menning, M.; Kufer, T.A. A role for the Ankyrin repeat containing protein Ankrd17 in Nod1- and Nod2-mediated inflammatory responses. FEBS Letters 2013, 587, 2137–2142. [Google Scholar] [CrossRef]
- Cai, R.M.; Meng, G.Y.; Li, Y.; Wang, W.Y.; Diao, Y.X.; Zhao, S.P.; Feng, Q.; Tang, Y. The oncolytic efficacy and safety of avian reovirus and its dynamic distribution in infected mice. Exp. Biol. Med. 2019, 244, 983–991. [Google Scholar] [CrossRef]
- Hsu, C.Y.; Huang, J.W.; Huang, W.R.; Chen, I.C.; Chen, M.S.; Liao, T.L.; Chang, Y.-K.; Munir, M.; Liu, H.-J. Oncolytic avian reovirus σa-modulated upregulation of the hif-1α/c-myc/glut1 pathway to produce more energy in different cancer cell lines benefiting virus replication. Viruses 2023, 15, 523. [Google Scholar] [CrossRef]
- Kozak, R.A.; Hattin, L.; Biondi, M.J.; Corredor, J.C.; Walsh, S.; Xue-Zhong, M.; Manuel, J.; McGilvray, I.D.; Morgenstern, J.; Lusty, E.; et al. Replication and oncolytic activity of an avian orthoreovirus in human hepatocellular carcinoma cells. Viruses 2017, 9, 90. [Google Scholar] [CrossRef]
- Key, M.D.; Andres, D.A.; Der, C.J.; Repasky, G.A. Characterization of RERG: An estrogen-regulated tumor suppressor gene. In Methods in Enzymology; Regulators and Effectors of Small GTPases: Ras Family; Academic Press, 2006; Vol. 407, pp. 513–527.
- Zhao, R.J.; Chen, S.L.; Cui, W.H.; Xie, C.Y.; Zhang, A.P.; Yang, L.; Dong, H.M. PTPN1 is a prognostic biomarker related to cancer immunity and drug sensitivity: From pan-cancer analysis to validation in breast cancer. Front. Immunol. 2023, 14. [Google Scholar] [CrossRef]
- Kanda, S.; Ohmuraya, M.; Akagawa, H.; Horita, S.; Yoshida, Y.; Kaneko, N.; Sugawara, N.; Ishizuka, K.; Miura, K.; Harita, Y.T.K.; et al. Deletion in the cobalamin synthetase W domain–containing protein 1 gene is associated with congenital anomalies of the kidney and urinary tract. J. Am. Soc. Nephrol. : JASN 2020, 31, 139–147. [Google Scholar] [CrossRef]
- Hartill, V.L.; van de Hoek, G.; Patel, M.P.; Little, R.; Watson, C.M.; Berry, I.R.; Shoemark, A.; Abdelmottaleb, D.; Parkes, E.; Bacchelli, C.; et al. DNAAF1 links heart laterality with the AAA+ ATPase RUVBL1 and ciliary intraflagellar transport. Hum. Mol. Genet. 2018, 27, 529–545. [Google Scholar] [CrossRef] [PubMed]
- Rong, L.; Chen, B.; Liu, K.; Liu, B.Y.; He, X.Y.; Liu, J.; Li, J.X.; He, M.D.; Zhu, L.; Liu, K.; et al. CircZDBF2 up-regulates RNF145 by ceRNA model and recruits CEBPB to accelerate oral squamous cell carcinoma progression via NFκB signaling pathway. J. Transl. Med. 2022, 20, 148. [Google Scholar] [CrossRef]
- Li, Z.Y.; Zhang, W.D.; Li, S.Q.; Tao, X.B.; Xu, H.W.; Wu, Y.T.; Chen, Q.; Ning, A.H.; Tian, T.; Zhang, L.; et al. Integration of apaQTL and eQTL analysis reveals novel snps associated with occupational pulmonary fibrosis risk. Arch. Toxicol. 2024, 98, 2117–2129. [Google Scholar] [CrossRef]
- Fehr, S.; Wilson, M.; Downs, J.; Williams, S.; Murgia, A.; Sartori, S.; Vecchi, M.; Ho, G.; Polli, R.; Psoni, S.; et al. The CDKL5 disorder is an independent clinical entity associated with early-onset encephalopathy. Eur. J. Hum. Genet. 2013, 21, 266–273. [Google Scholar] [CrossRef]
- Jiang, Y.Y.; Shang, L.; Shi, Z.Z.; Zhang, T.T.; Ma, S.; Lu, C.C.; Zhang, Y.; Hao, J.J.; Shi, C.; Shi, F.; et al. Microtubule-associated protein 4 is an important regulator of cell invasion/migration and a potential therapeutic target in esophageal squamous cell carcinoma. Oncogene 2016, 35, 4846–4856. [Google Scholar] [CrossRef]
Figure 1.
Avian Reovirus S1133 replication in various cell types over time (n = 5). X-axes indicate the sampling timepoint in hours post-inoculation. Y-axes represent relative viral RNA in terms of quantified using qPCR targeting ARV M1 gene and normalized against housekeeping gene GAPDH. The exponential increase in viral RNA levels can be appreciated for each cell type, with replication being the least efficient in HD11 cells. The highest viral RNA was detected in chicken embryo liver cells at 24 hours post-inoculation.
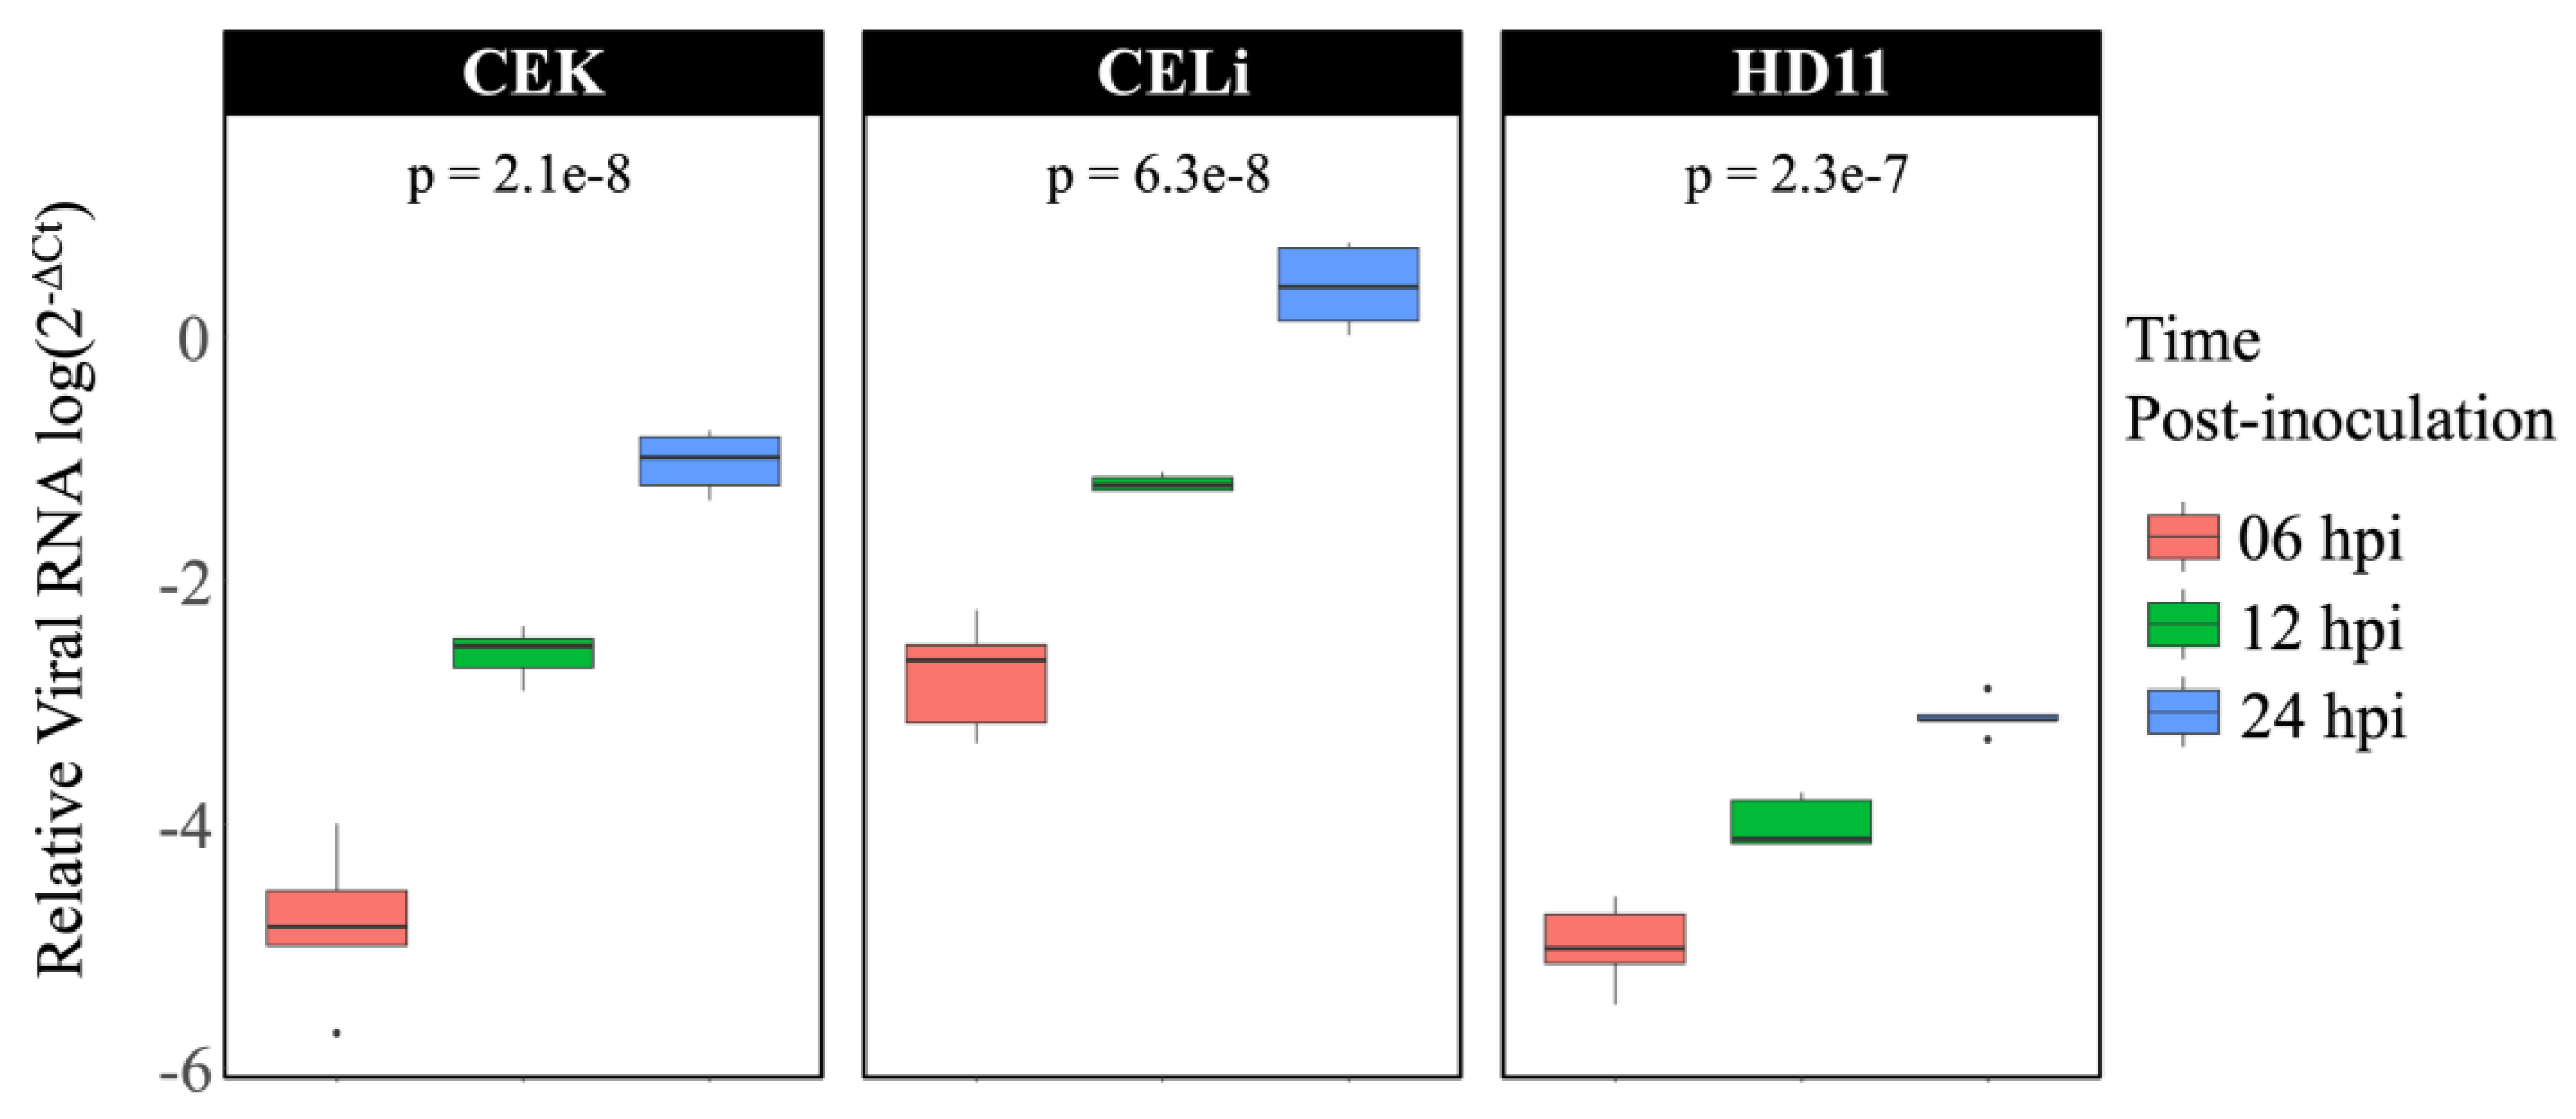
Figure 2.
Overall principal component analysis (PCA) of normalized gene count distribution for various cell types (n = 5). Points of various shapes represent the samples for cell types CEK, CELi, and HD11. The sizes represent 6, 12, and 24 hours post-inoculation (hpi). The control or ARV S1133-infected samples are represented by colors. Most of the variance on x- and y-axes, shown as principal components (PC) 1 and 2, explained the effect of cell type on gene expression profiles in various samples. Within each cell type, most samples from one timepoint clustered closer together indicating more similarity in expression profiles.
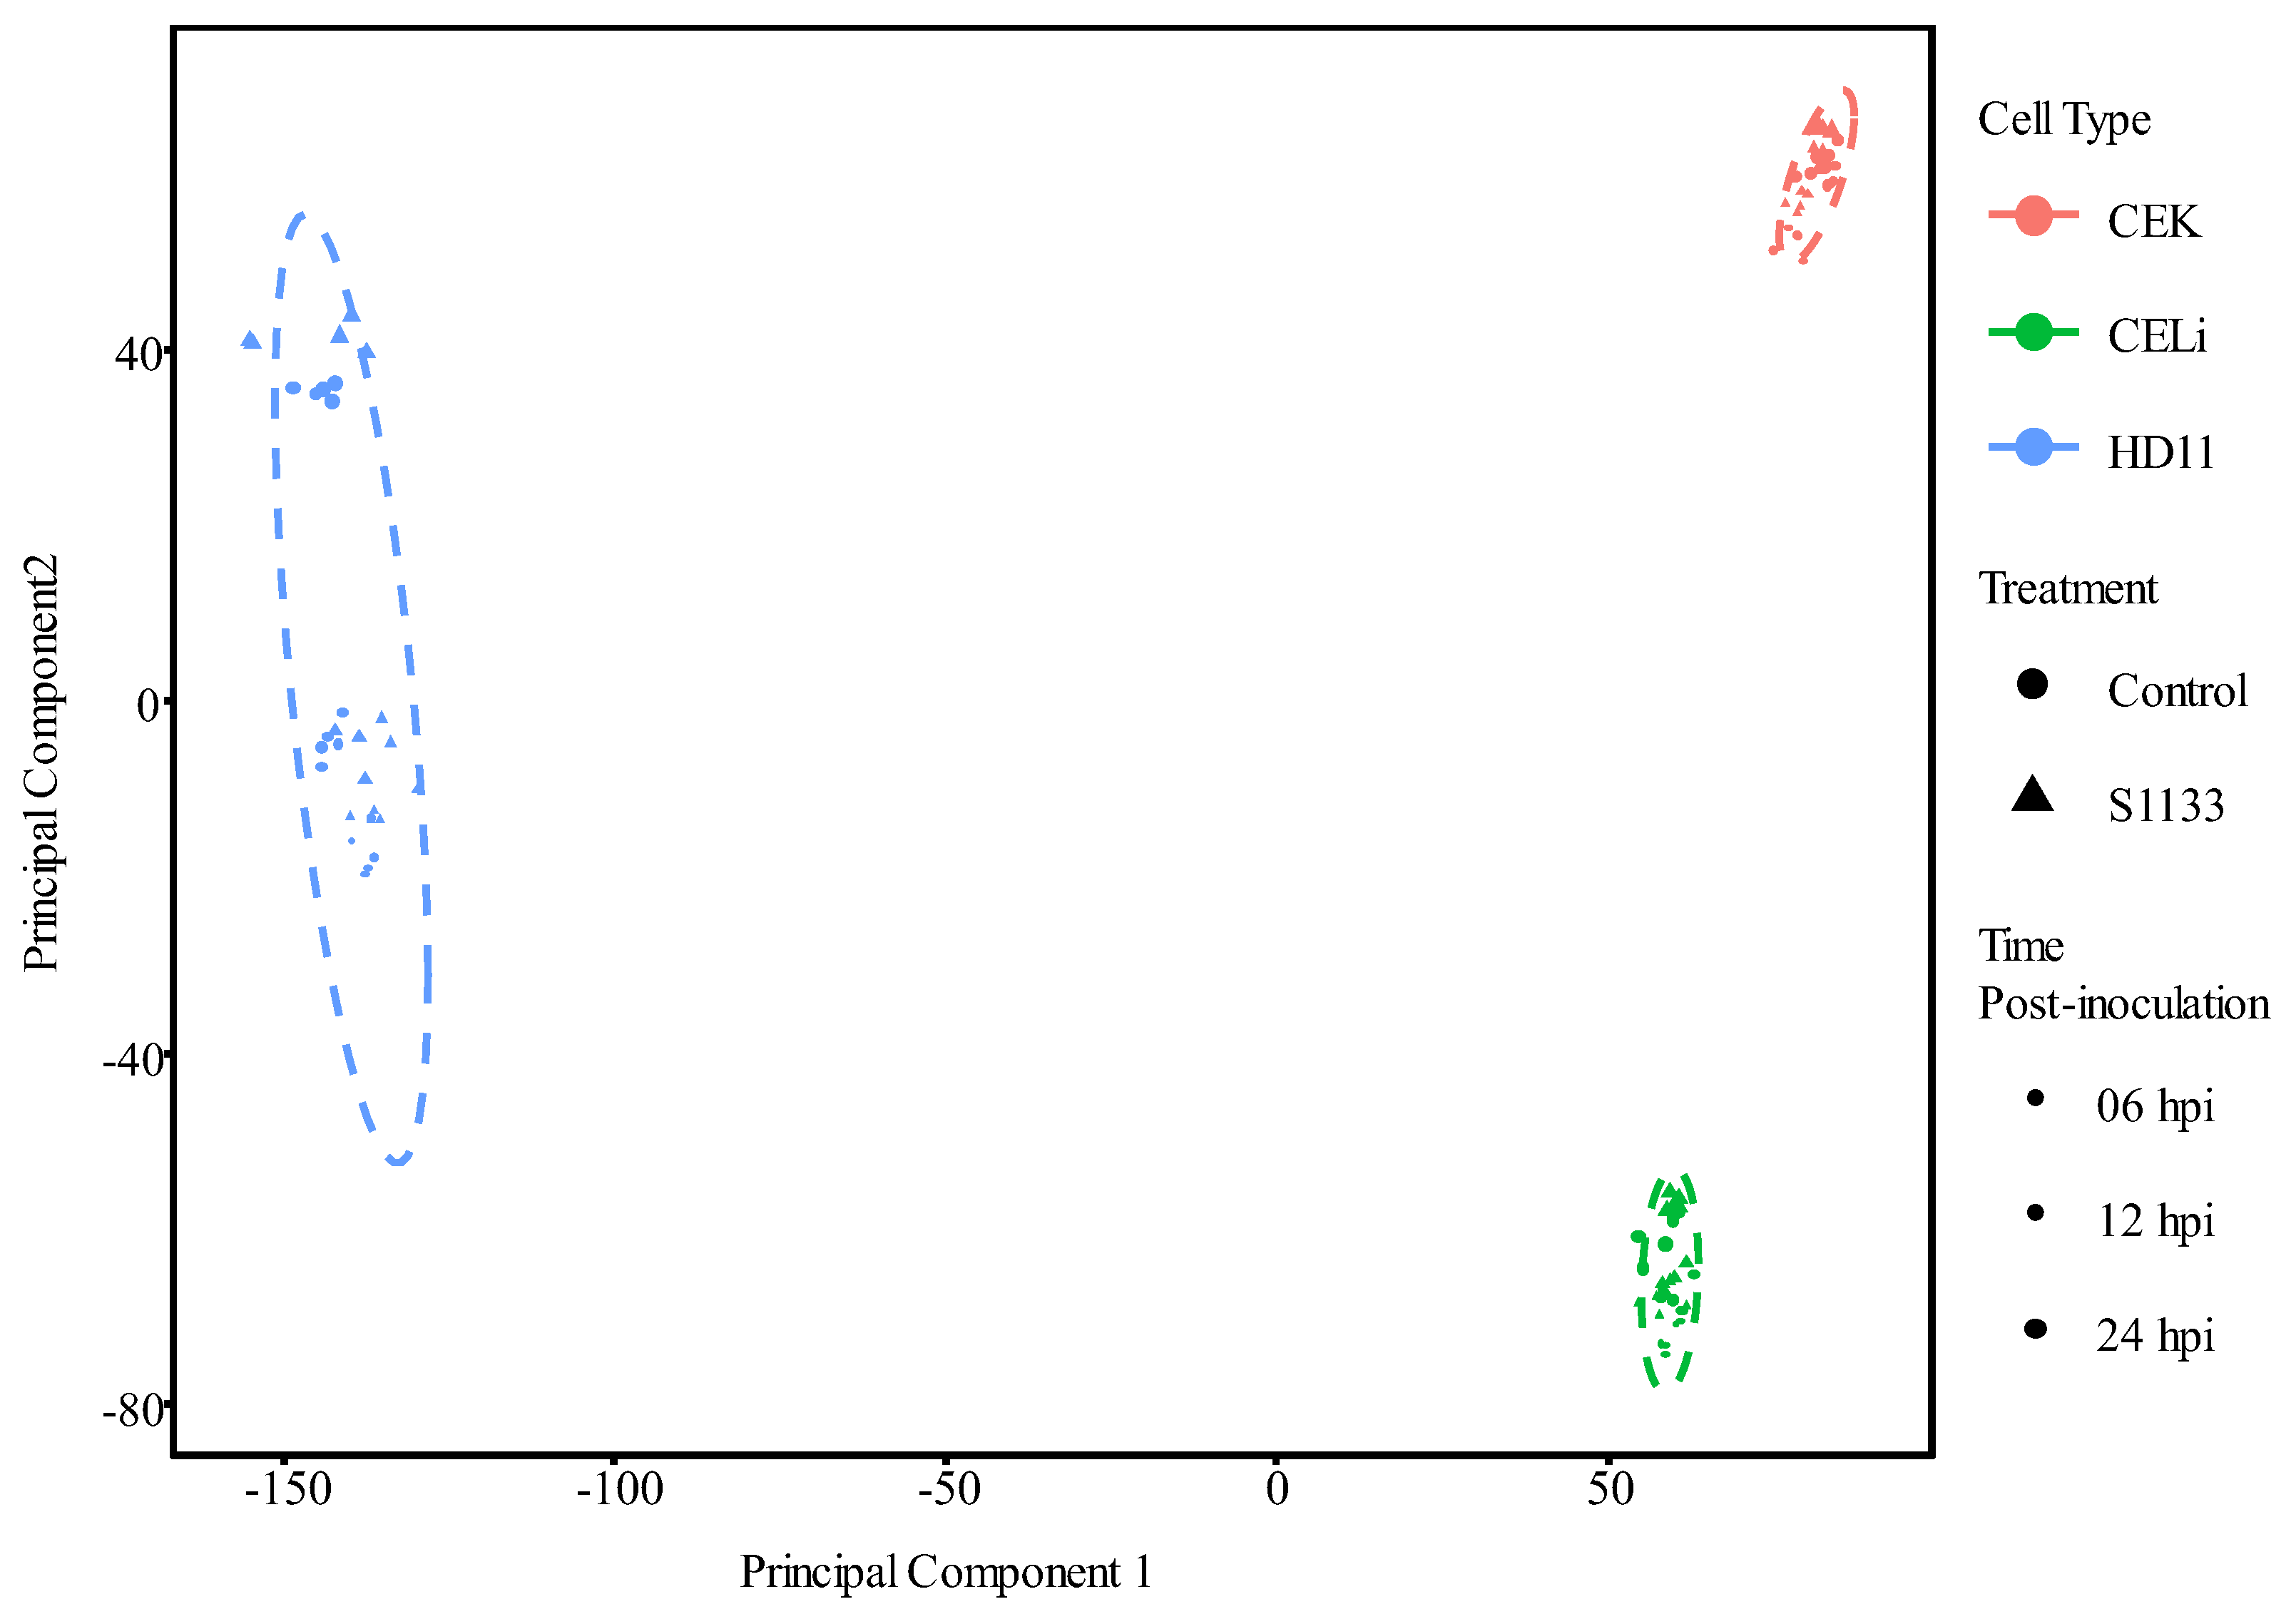
Figure 3.
Cell-type-specific principal component analysis (PCA) of normalized gene count distribution for various cell types (n = 5). Various shapes represent samples for the cell types CEK, CELi, and HD11,. The size represents 6-, 12-, and 24-hours post-inoculation. The control or ARV S1133-infected samples are represented by colors. Within CEK andHD11, most samples from one timepoint clustered closer together indicating more similarity in expression profiles.
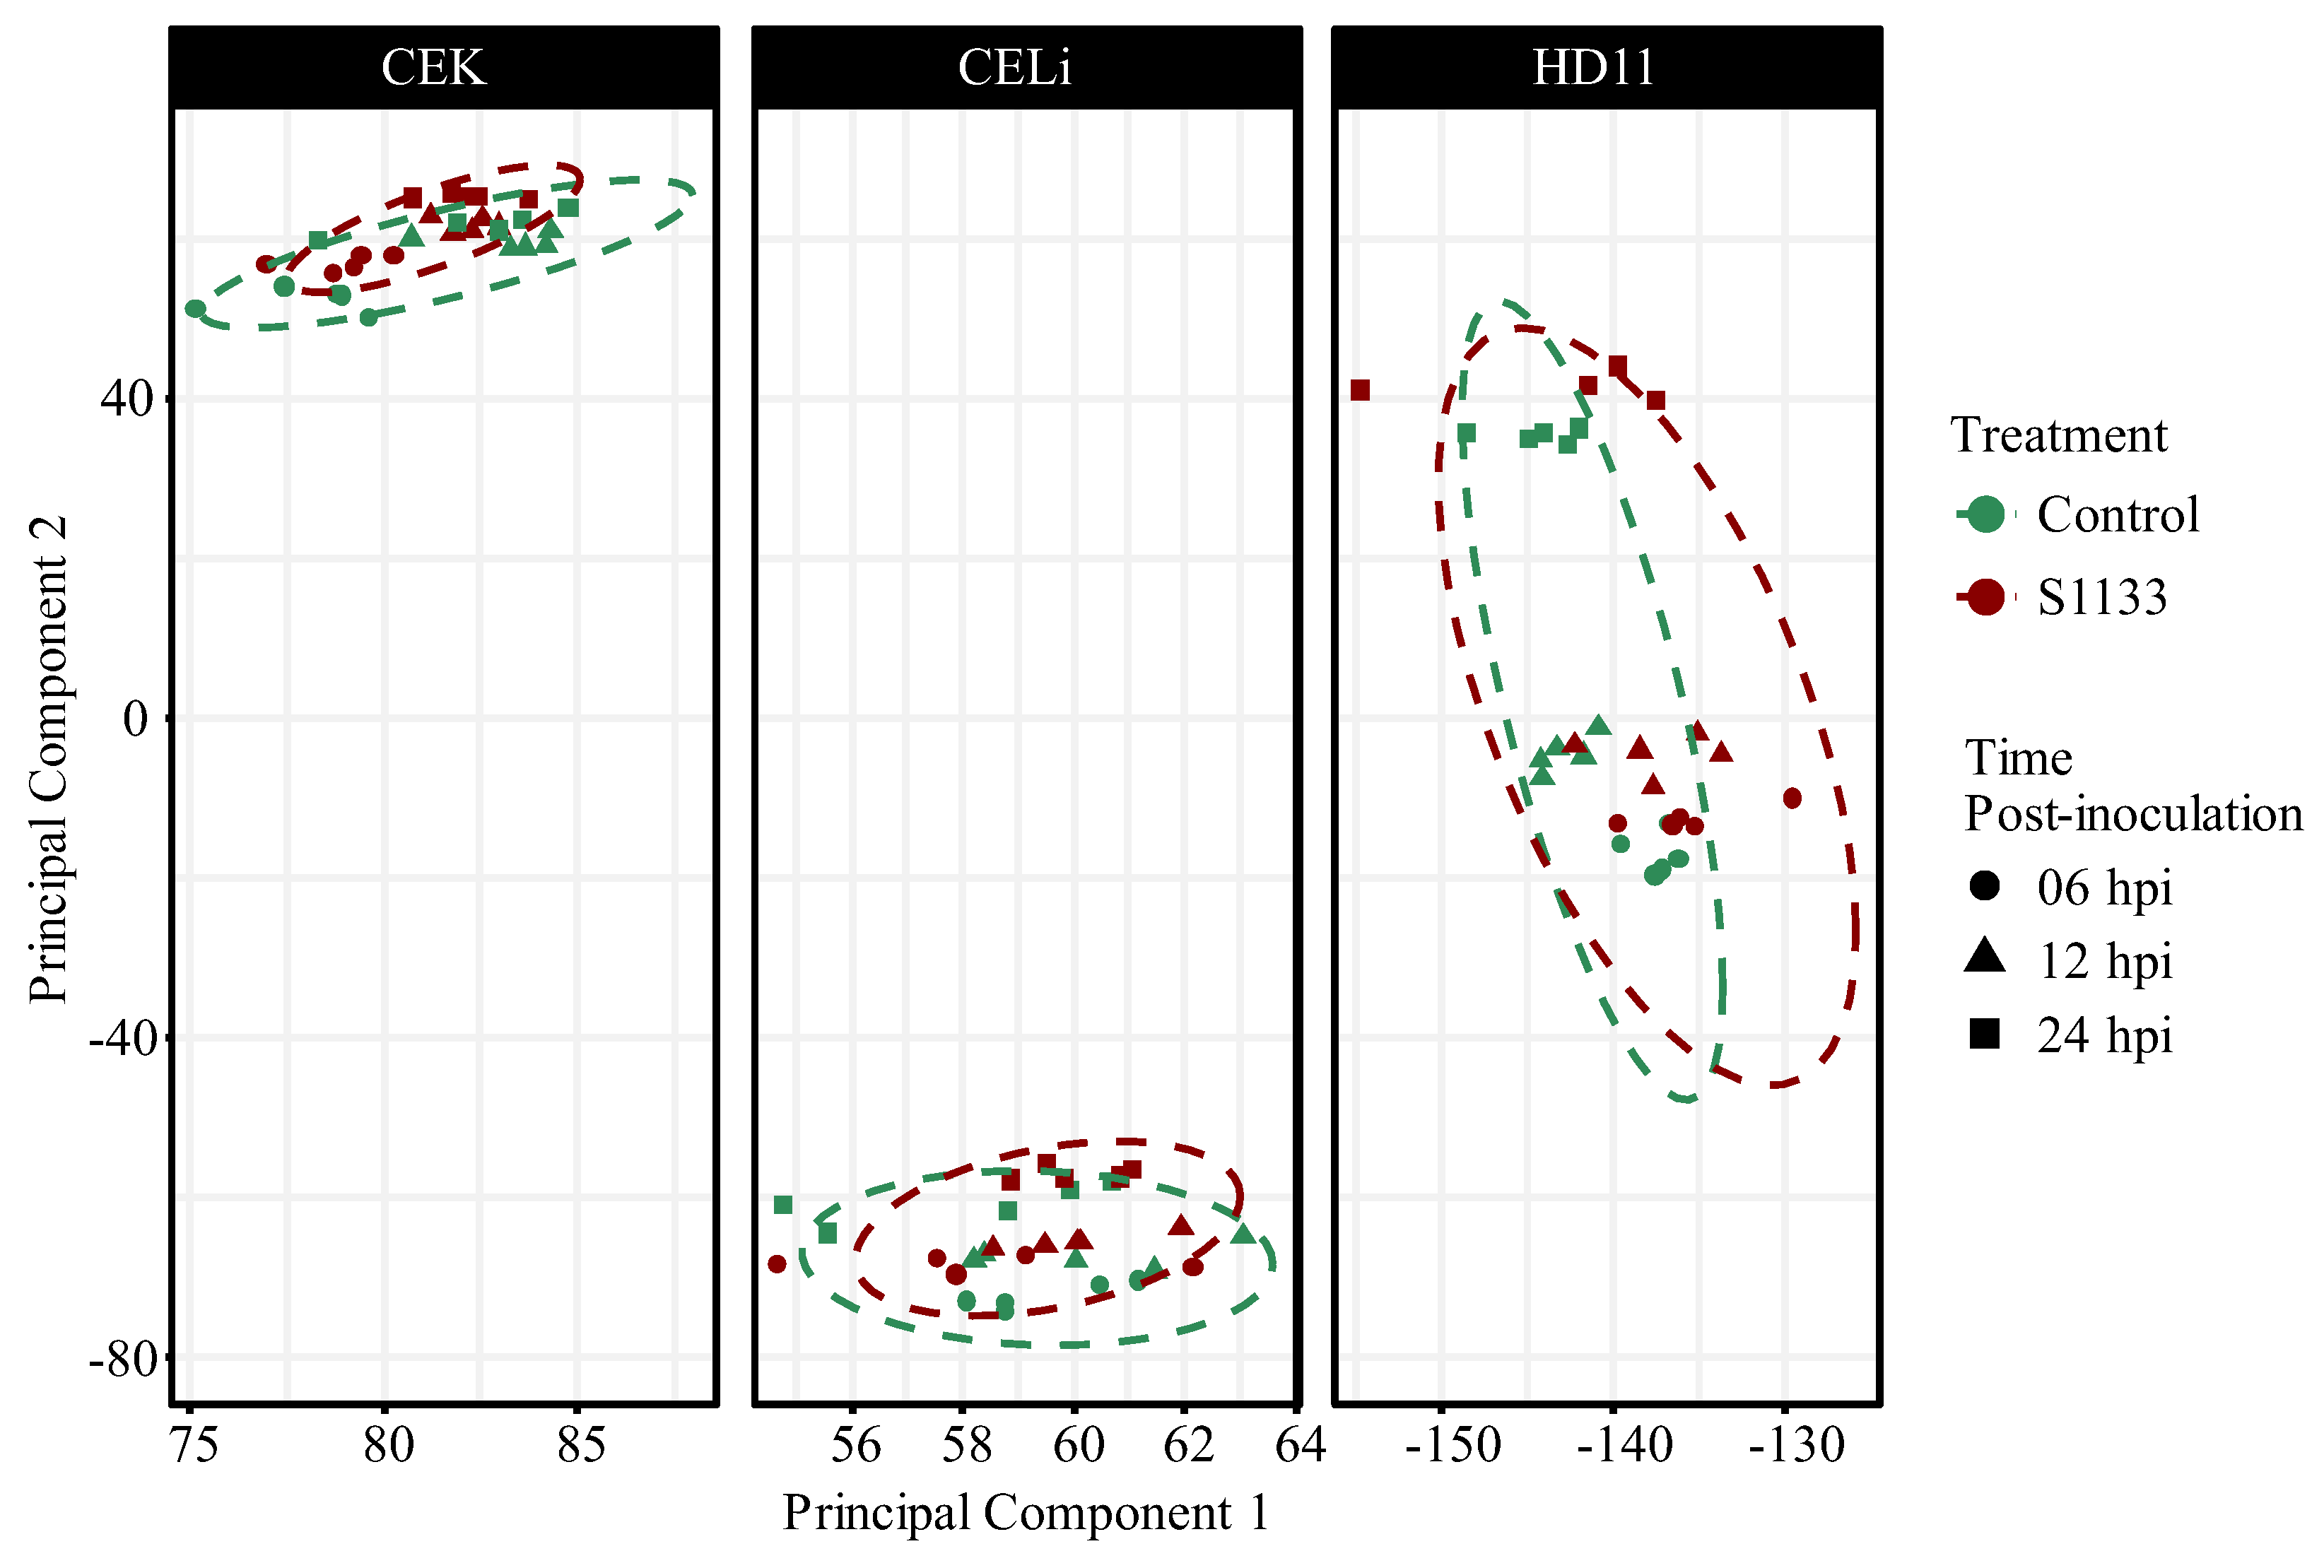
Figure 4.
Differentially expressed genes (DEGs) in avian reovirus (ARV) S1133-inoculated versus DMEM-inoculated control cells across timepoints (n = 5).
Figure 4.
Differentially expressed genes (DEGs) in avian reovirus (ARV) S1133-inoculated versus DMEM-inoculated control cells across timepoints (n = 5).
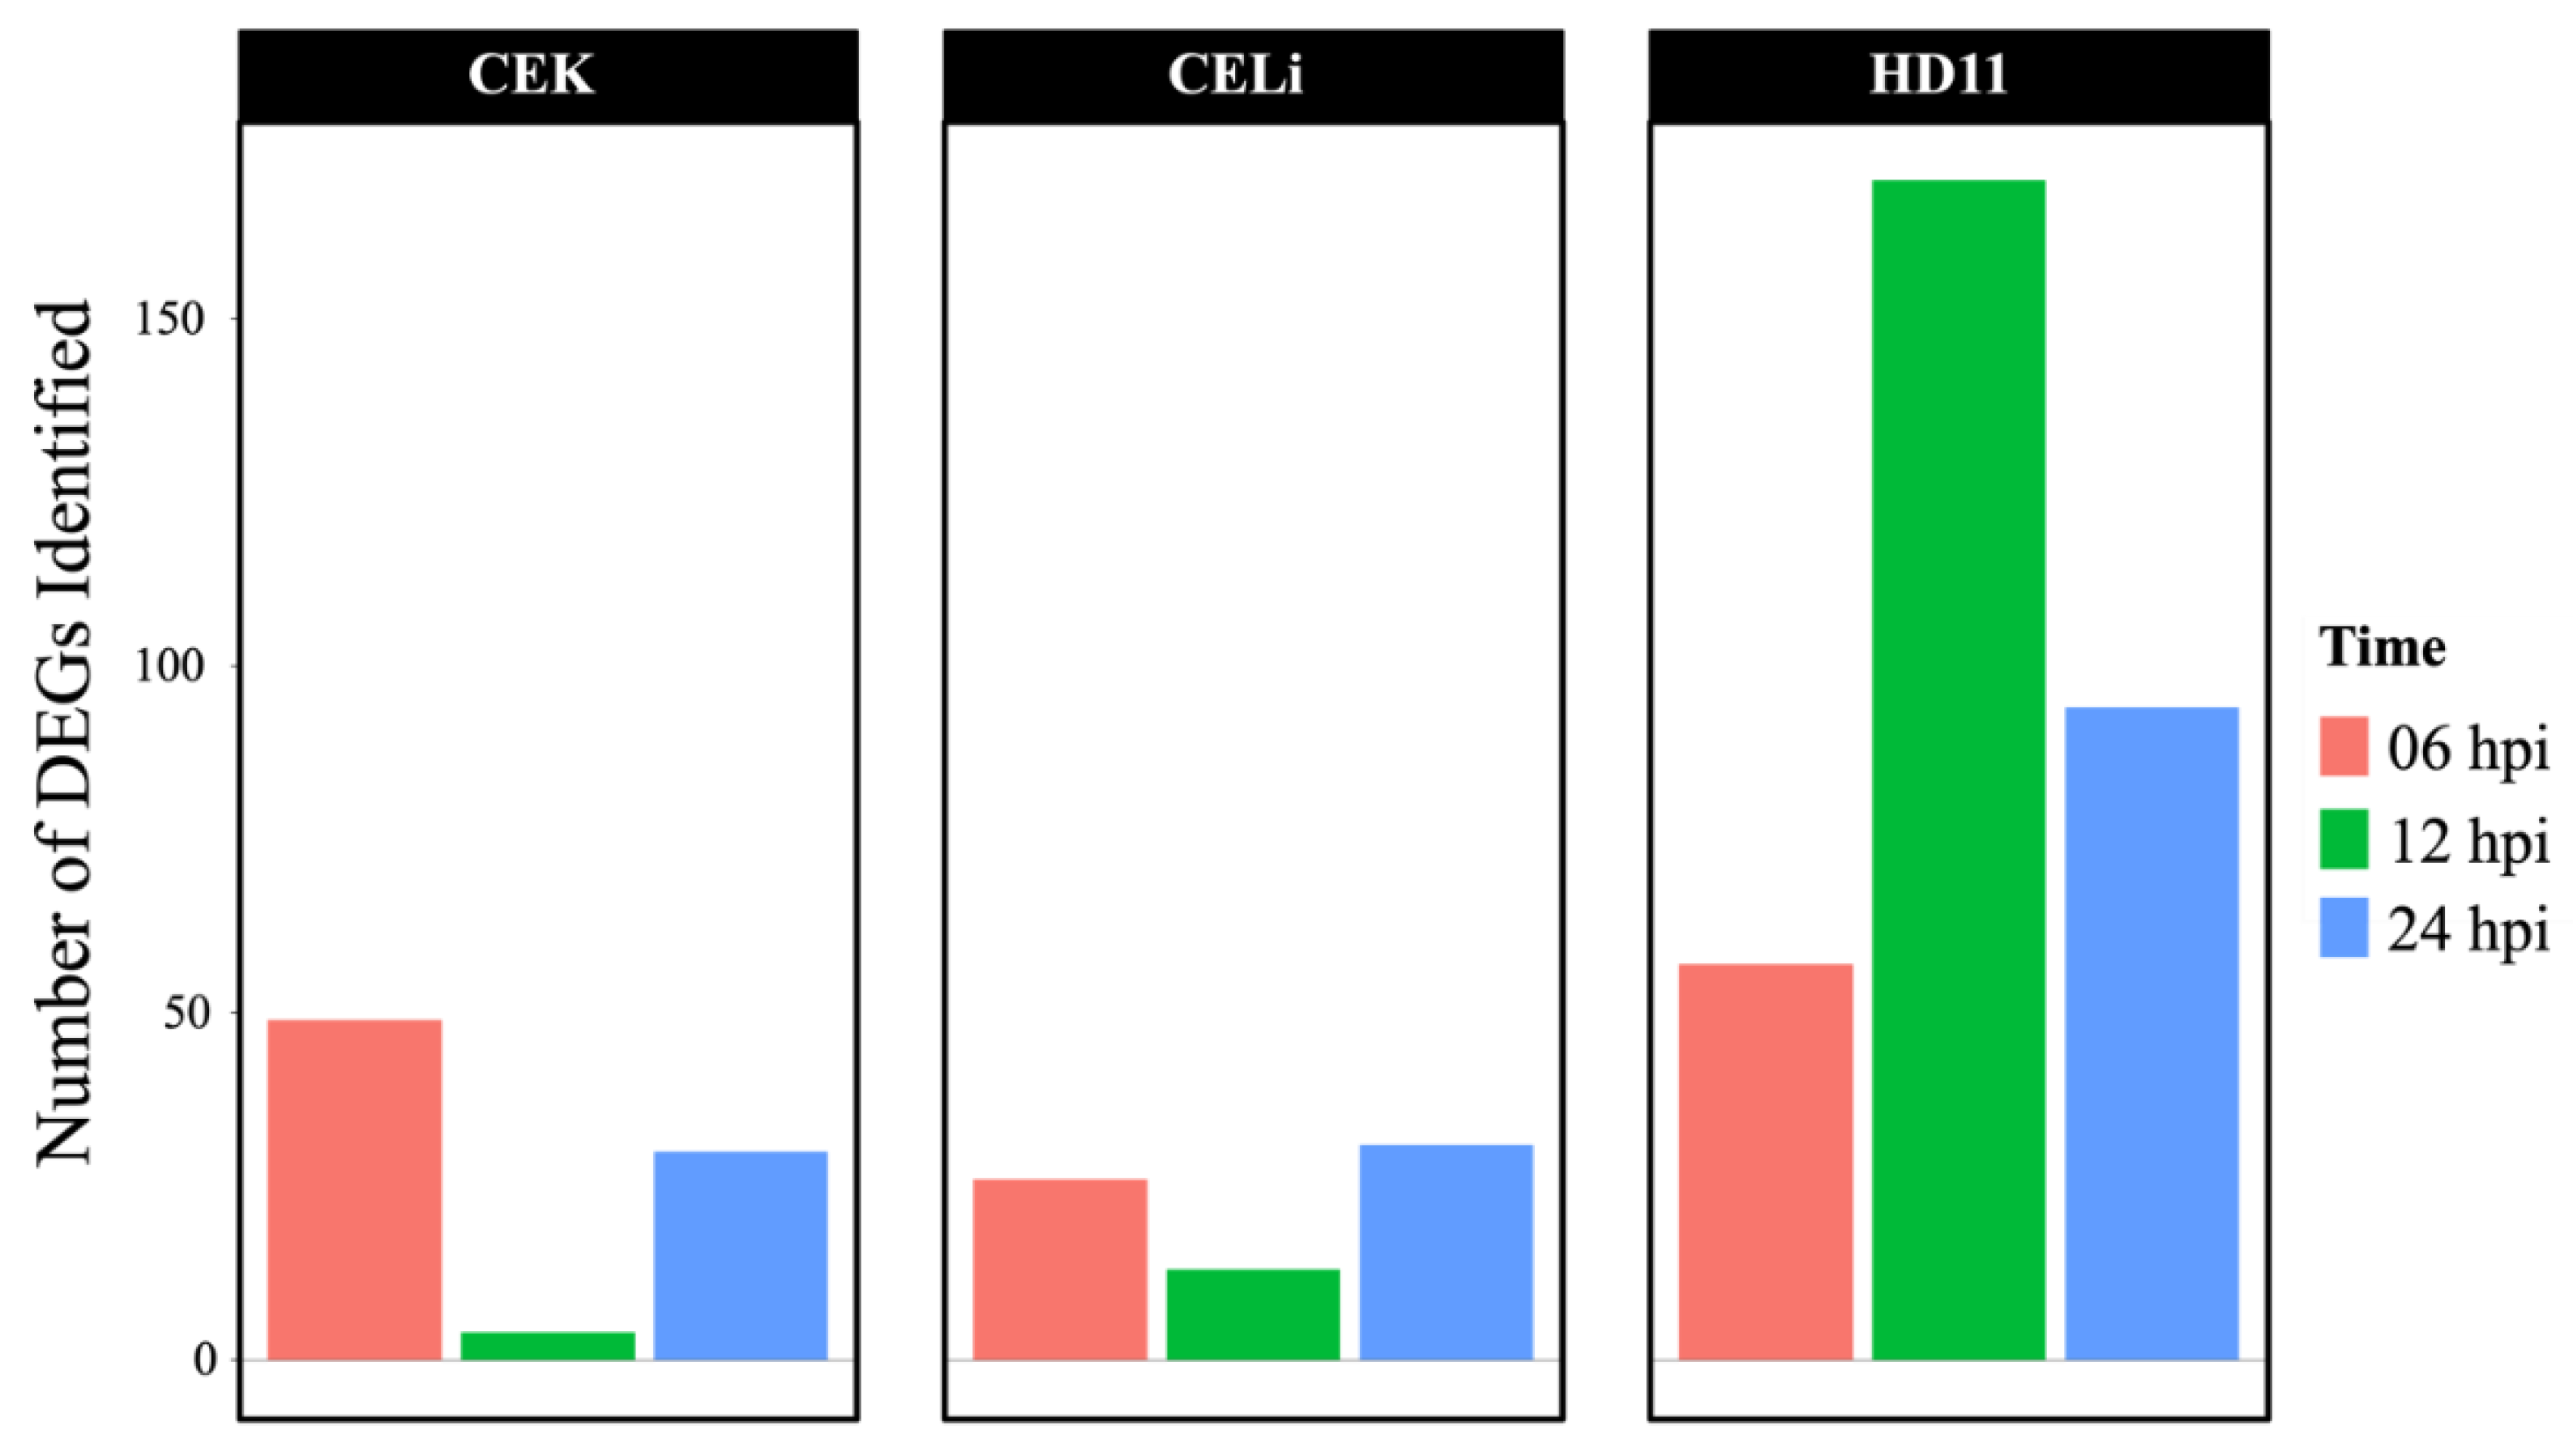
Figure 5.
UpSet plot of differentially expressed genes (DEGs) between avian reovirus S1133 infected and control samples in chicken embryo kidney (CEK) and liver (CELi) cells, and immortalized macrophage-like cells (HD11). The dots connected by lines on the x-axis indicate the cell types for which common DEGs were identified. The numbers above the blue bars represent the number of DEGs shared. Only one common DEG (representing FABP4, intersection colored red) was identified across all three cell types indicating a divergent transcriptional response.
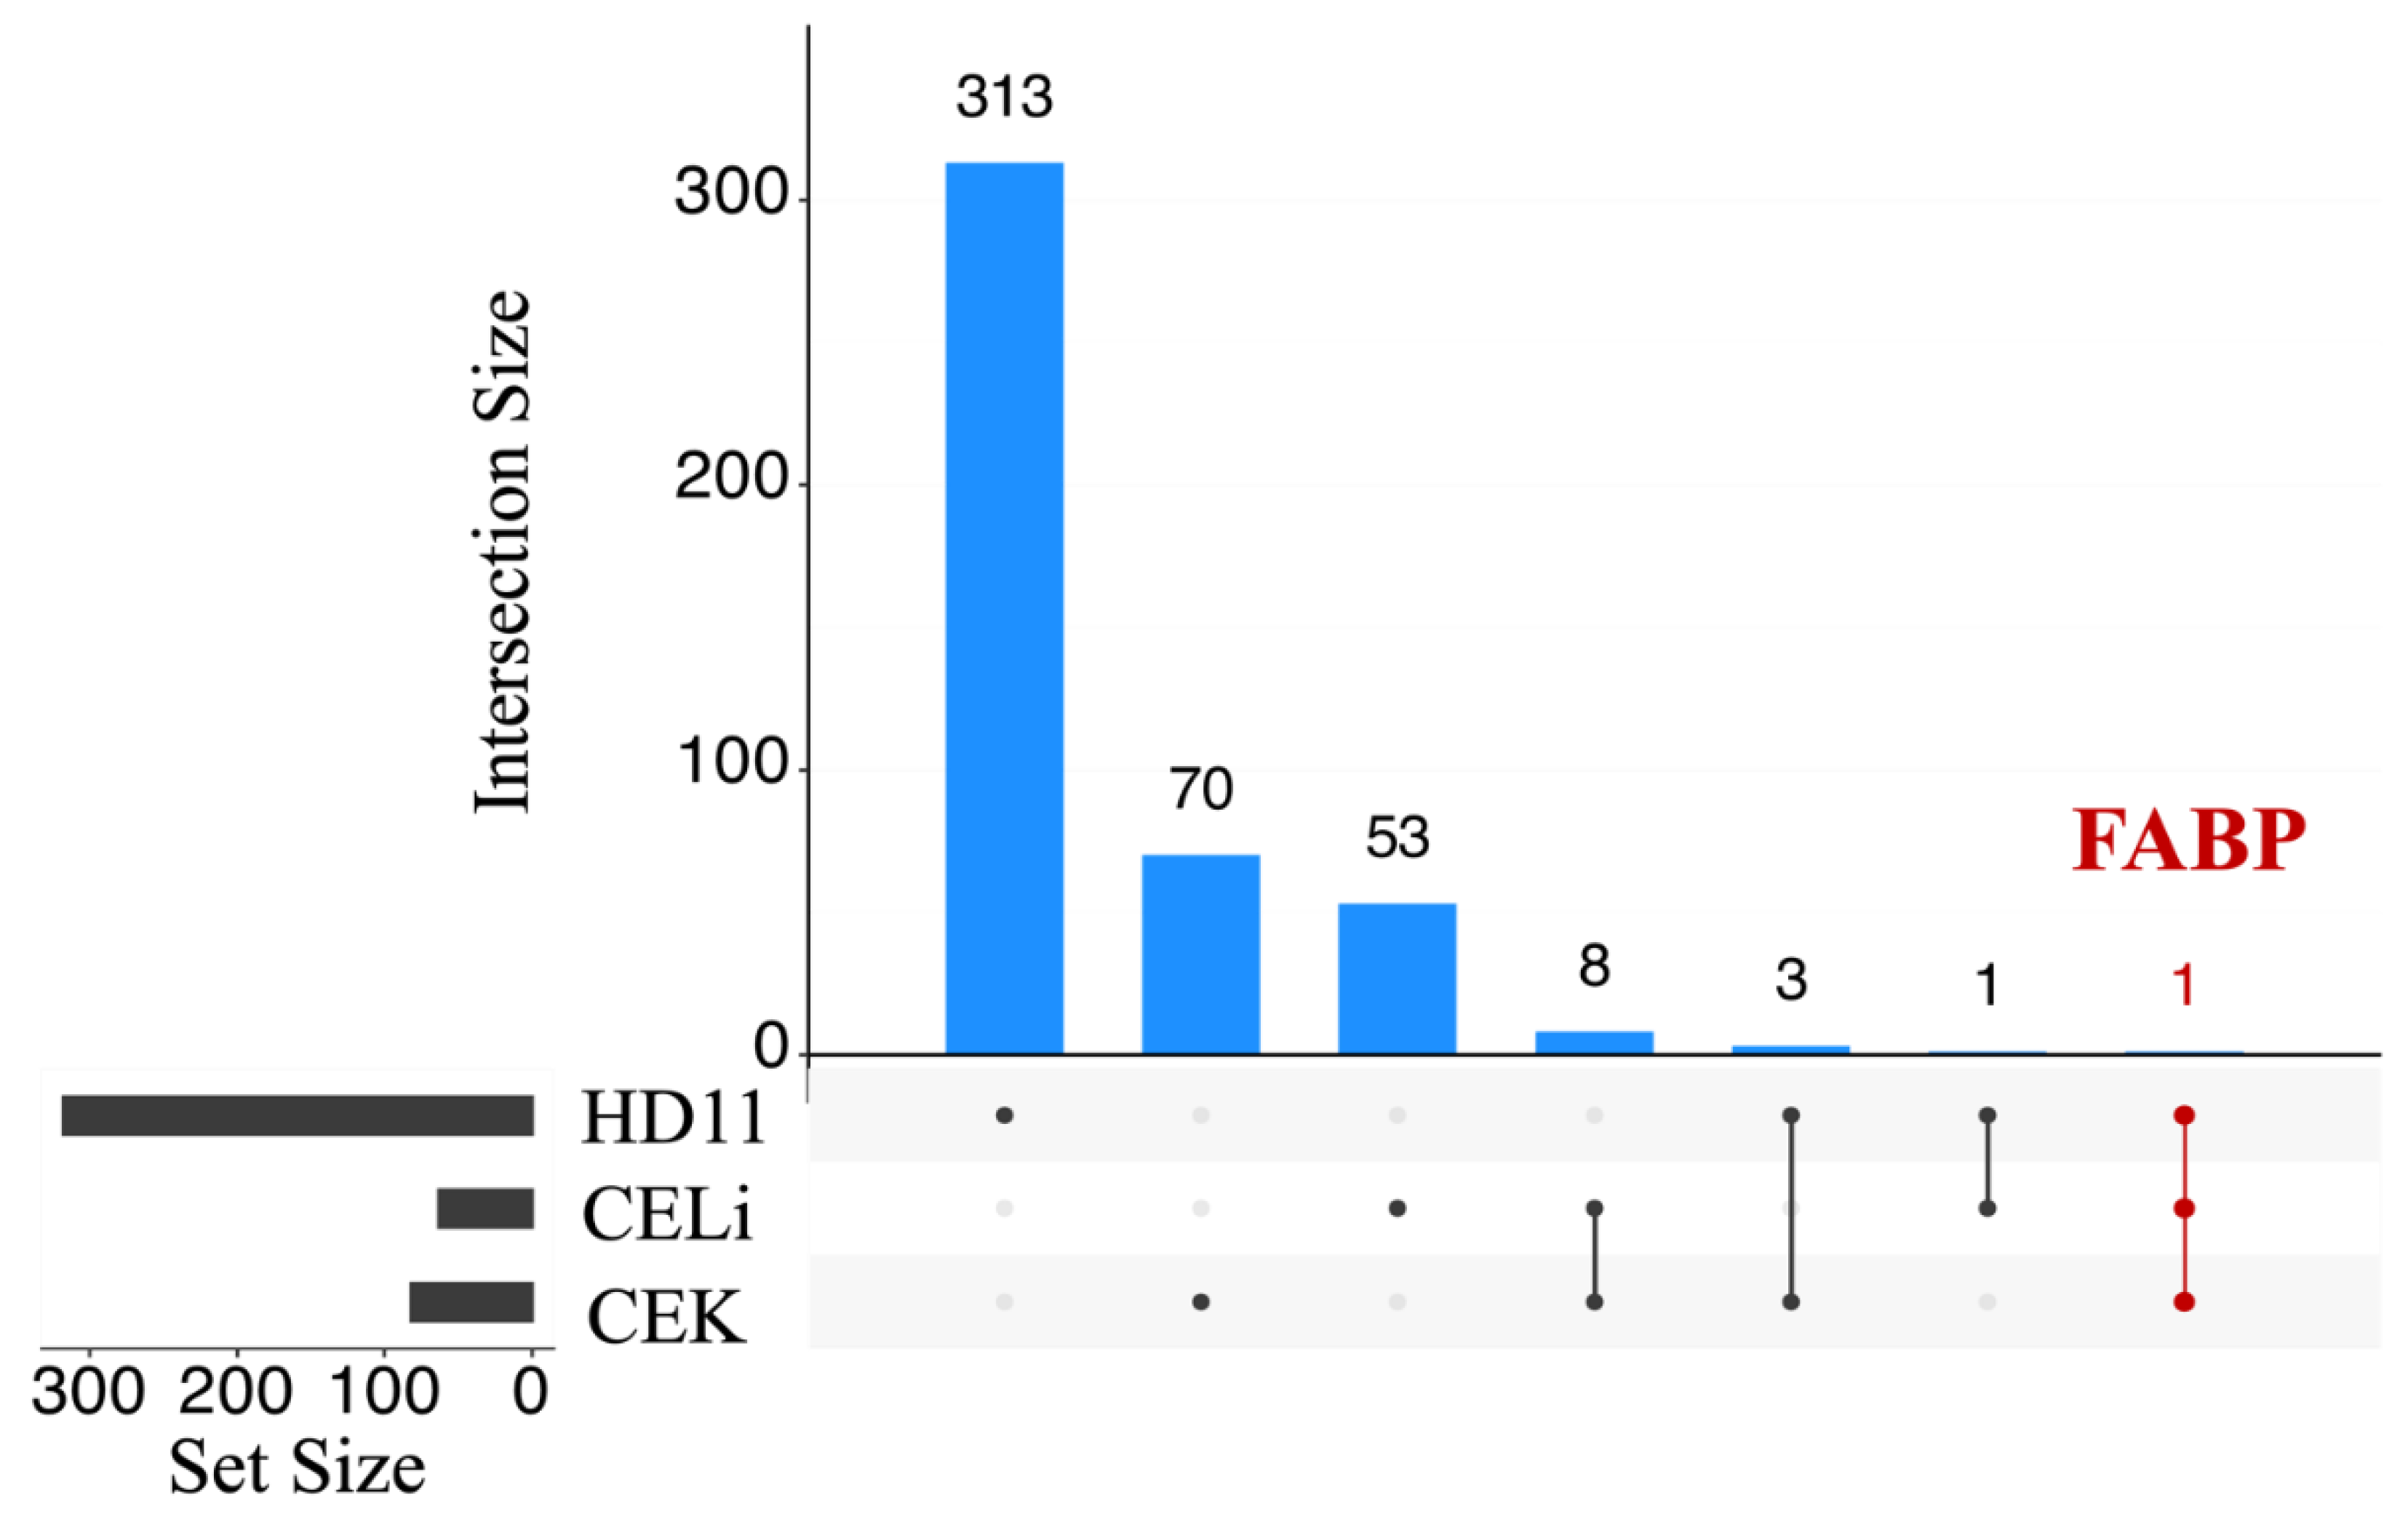
Figure 6.
Protein-protein interactions (PPI) network of genes involved in cellular antiviral response (STRING database analysis). Genes differentially expressed between control and S1133-treated chicken embryo liver cells (CELi) were analyzed to create a protein-protein interaction network. The red color indicates the genes commonly observed in CELi and embryonic liver tissue [49]. The network displays significant interactions among genes involved in innate antiviral immune responses, with key genes in red occupying common nodes, highlighting their importance in mediating the cellular response to ARV S1133 infection in liver cell culture.
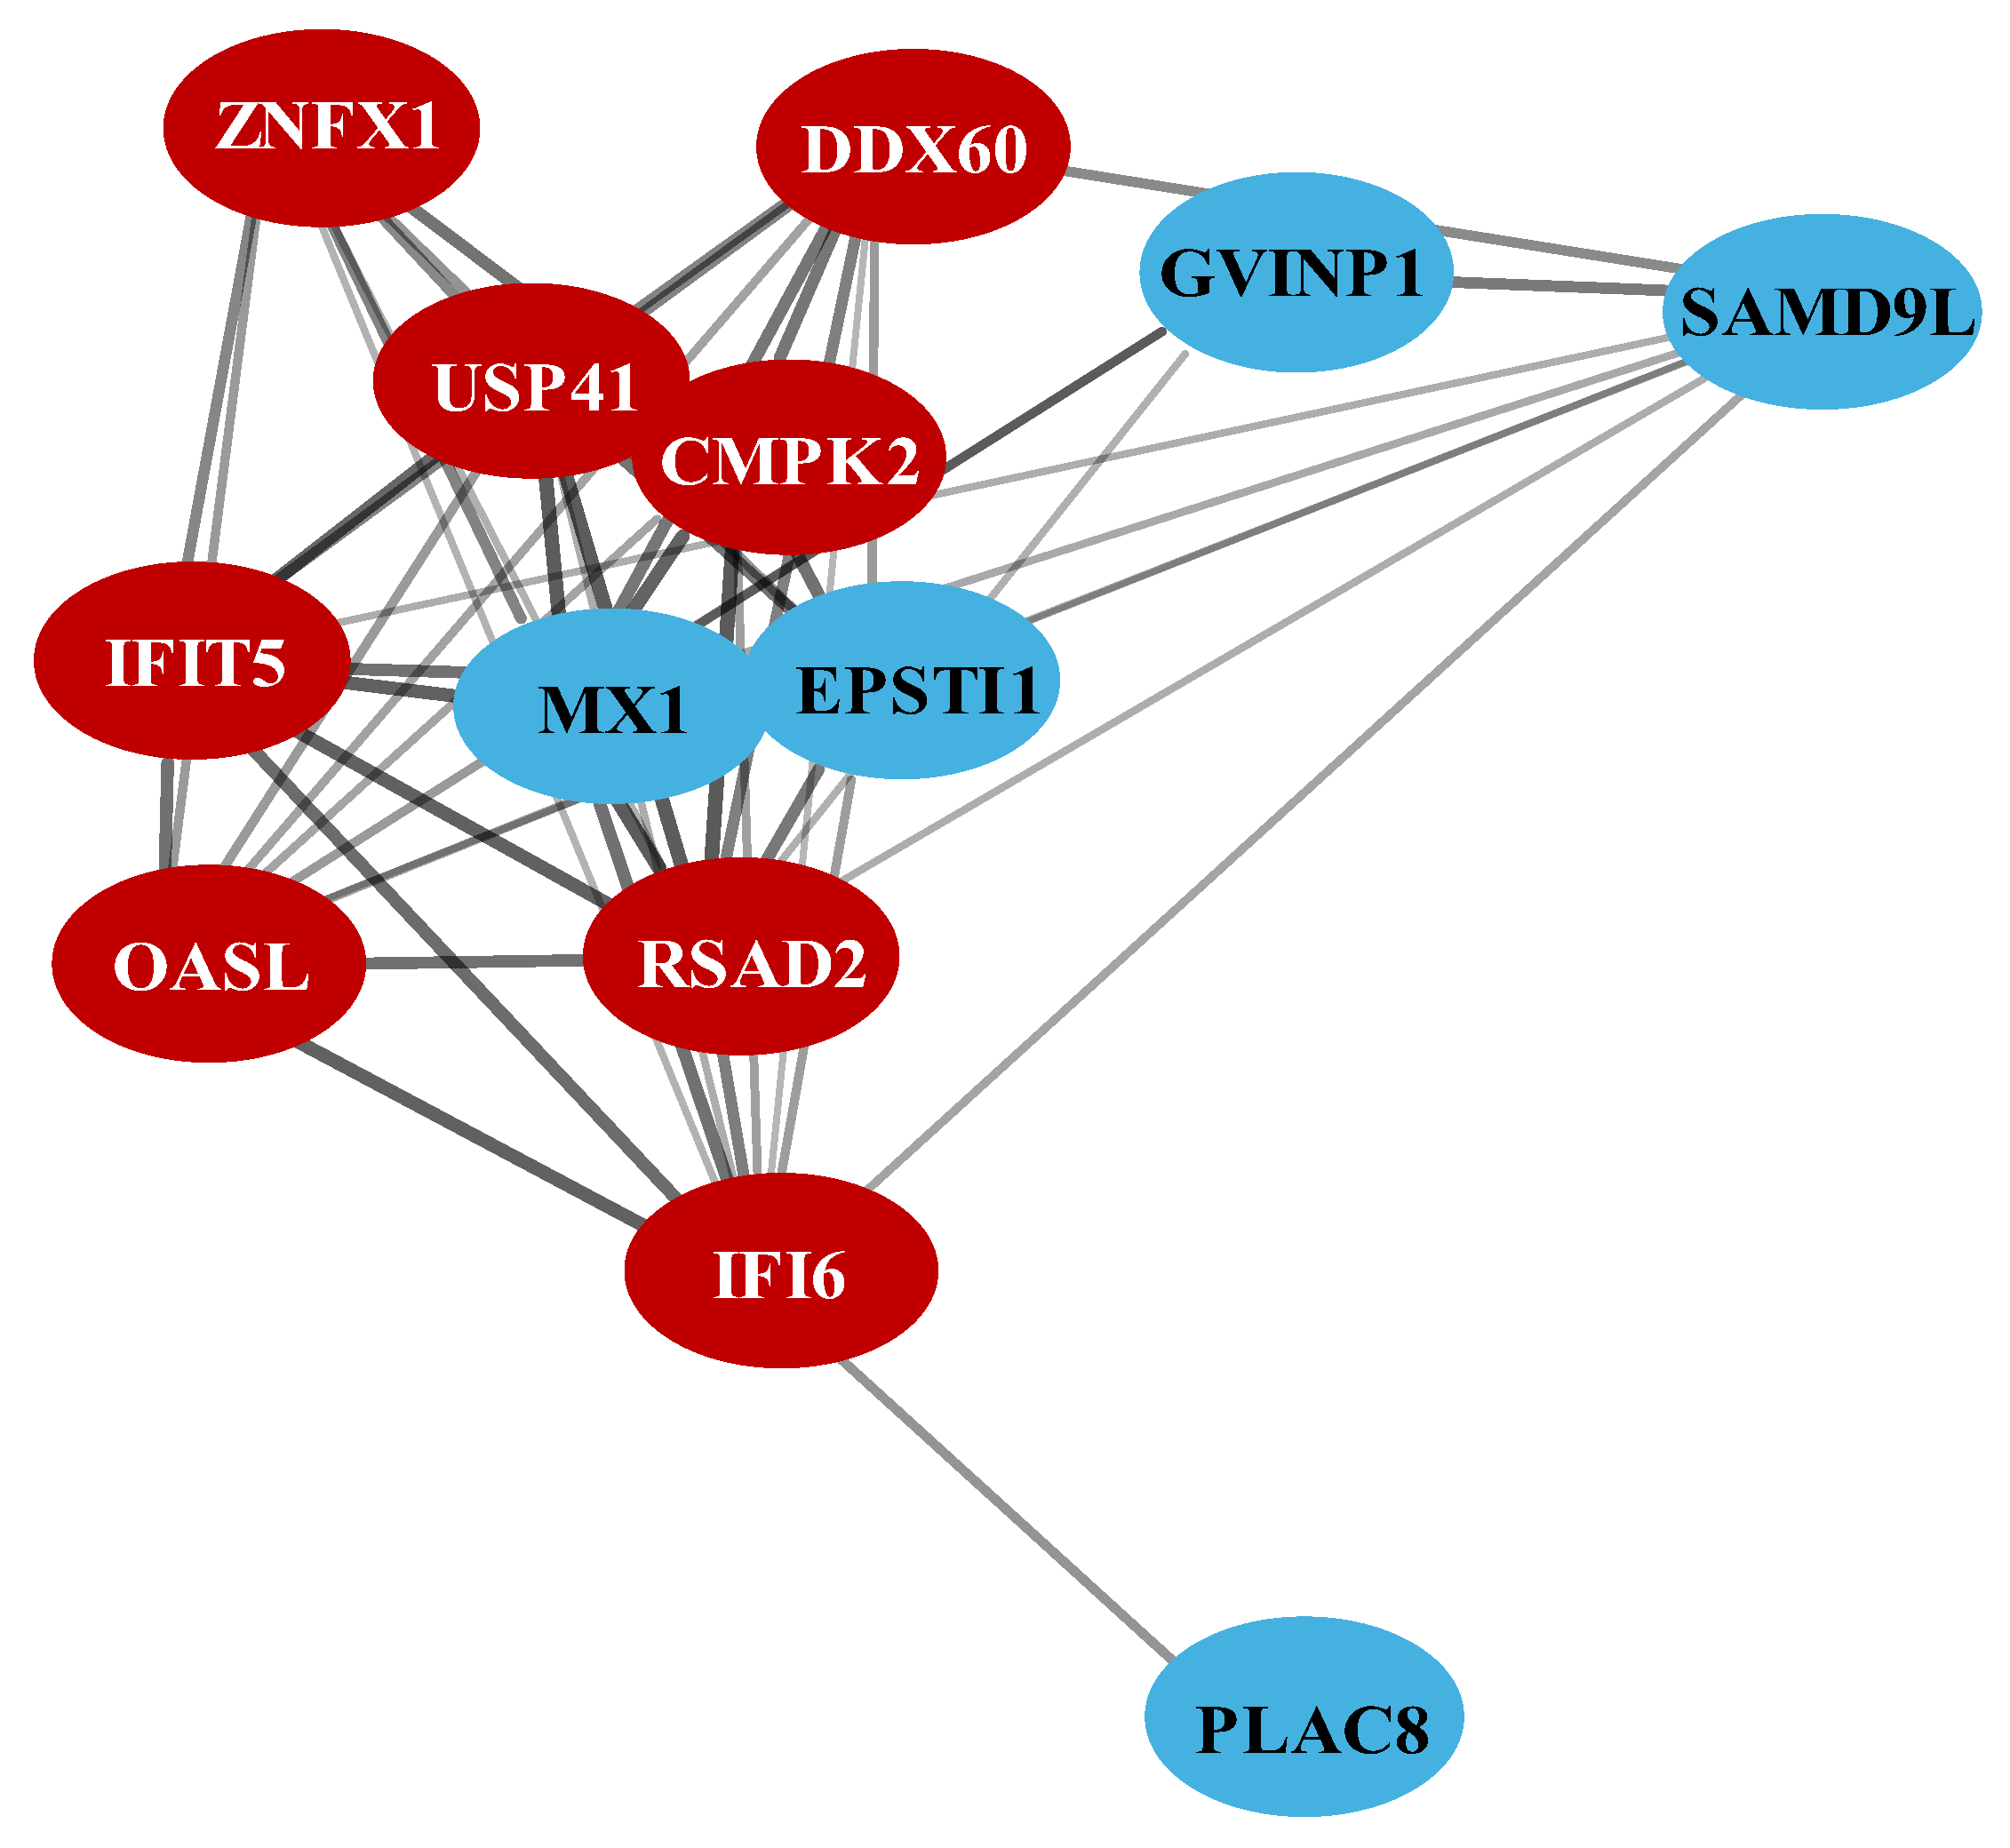
Figure 7.
Top 10 pathways enriched in different cell types following avian reovirus inoculation as determined using differentially expressed genes (DEGs). The plots indicate pathways representing Gene Ontology (GO) database terms enriched in each cell type, i.e., chicken embryo kidney cells (CEK), chicken embryo liver cells (CELi), and macrophage-derived cell line (HD11) following avian reovirus S1133 inoculation. The size of the dots indicates the ratio of differentially expressed genes (DEGs) vs. to the total number of DEGs annotated in the database for a given pathway. The red-to-blue color gradient indicates the distribution of p-values from lower to higher respectively.
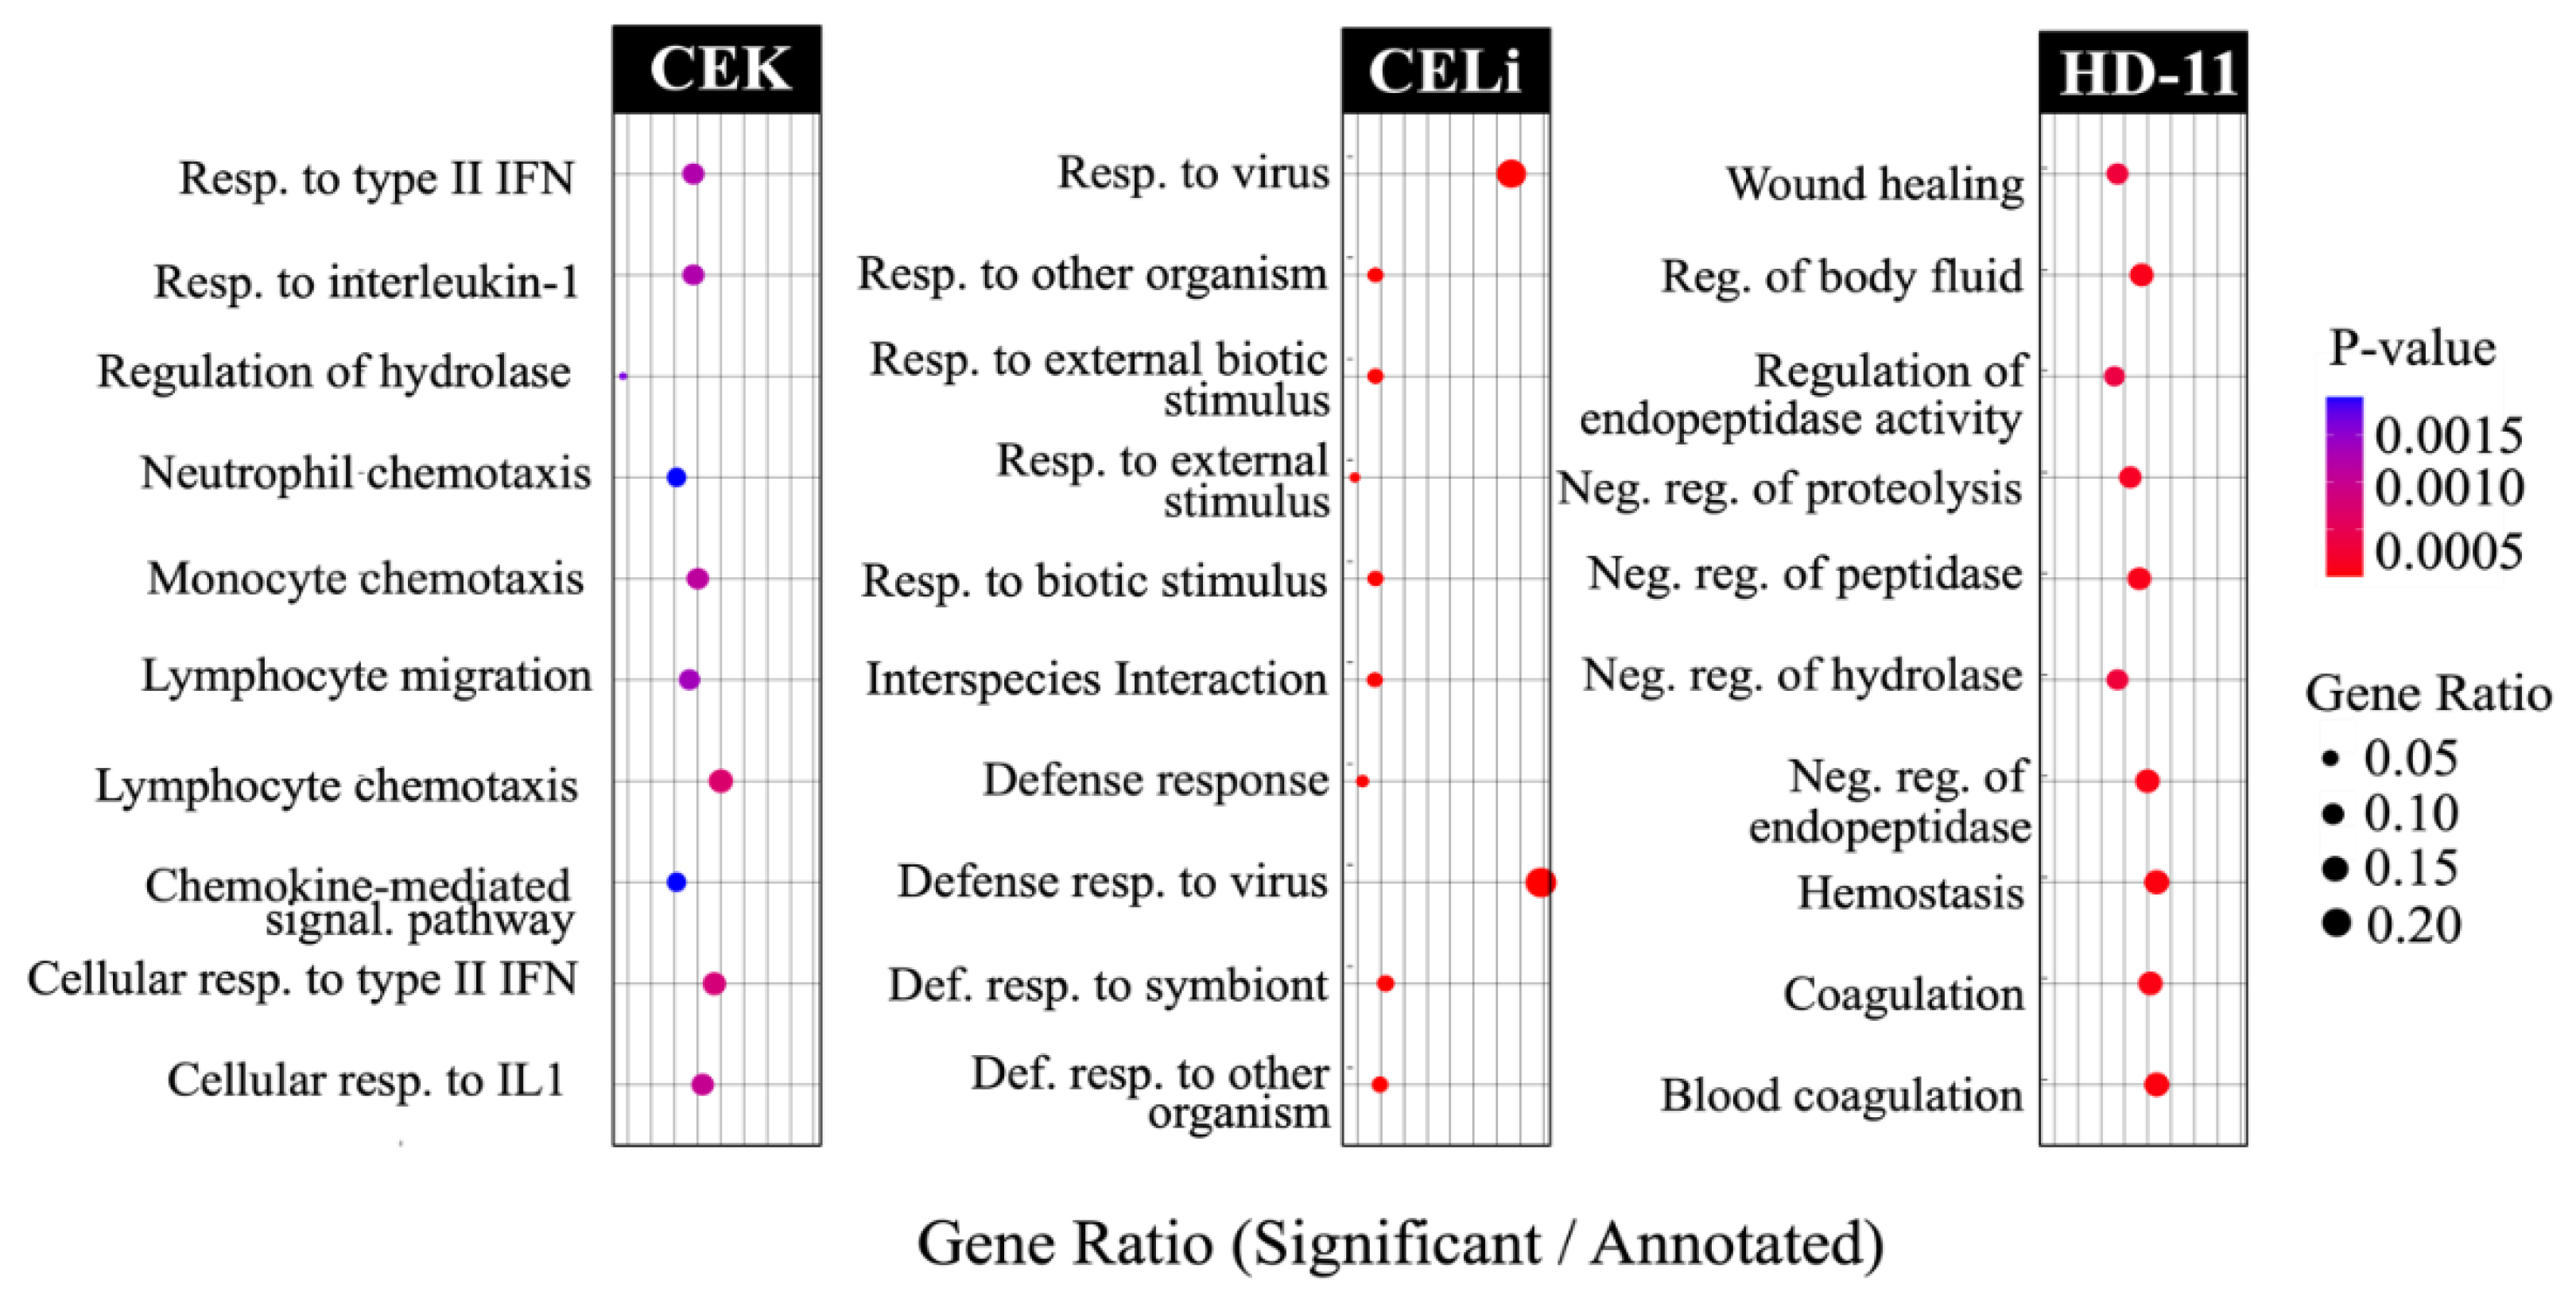
Figure 8.
Pathway connectedness network of differentially expressed genes (DEGs) from chicken embryo kidney cells (CEK), chicken embryo liver cells (CELi), and macrophage-derived cell line (HD11). Each circle represents a node, where each node corresponds to a cluster of DEGs (mapped against the human gene ontology database in Metascape). Nodes are linked by edges representing the distance between clusters, which is calculated based on pathway similarity. The size of each node is proportional to the number of DEGs within the cluster. The circles next to each pathway name indicate clusters of closely related pathways, highlighting functionally similar or overlapping biological processes (only the most significant pathway is shown here). The colors of the pies within the charts display the percentage of DEGs derived from each cell type (legend on the top right). The pathway connections indicate connectedness of the cellular response to avian reovirus infection despite a predominantly characteristic functional profile for each cell-type (dotted rectangles with respective colors).
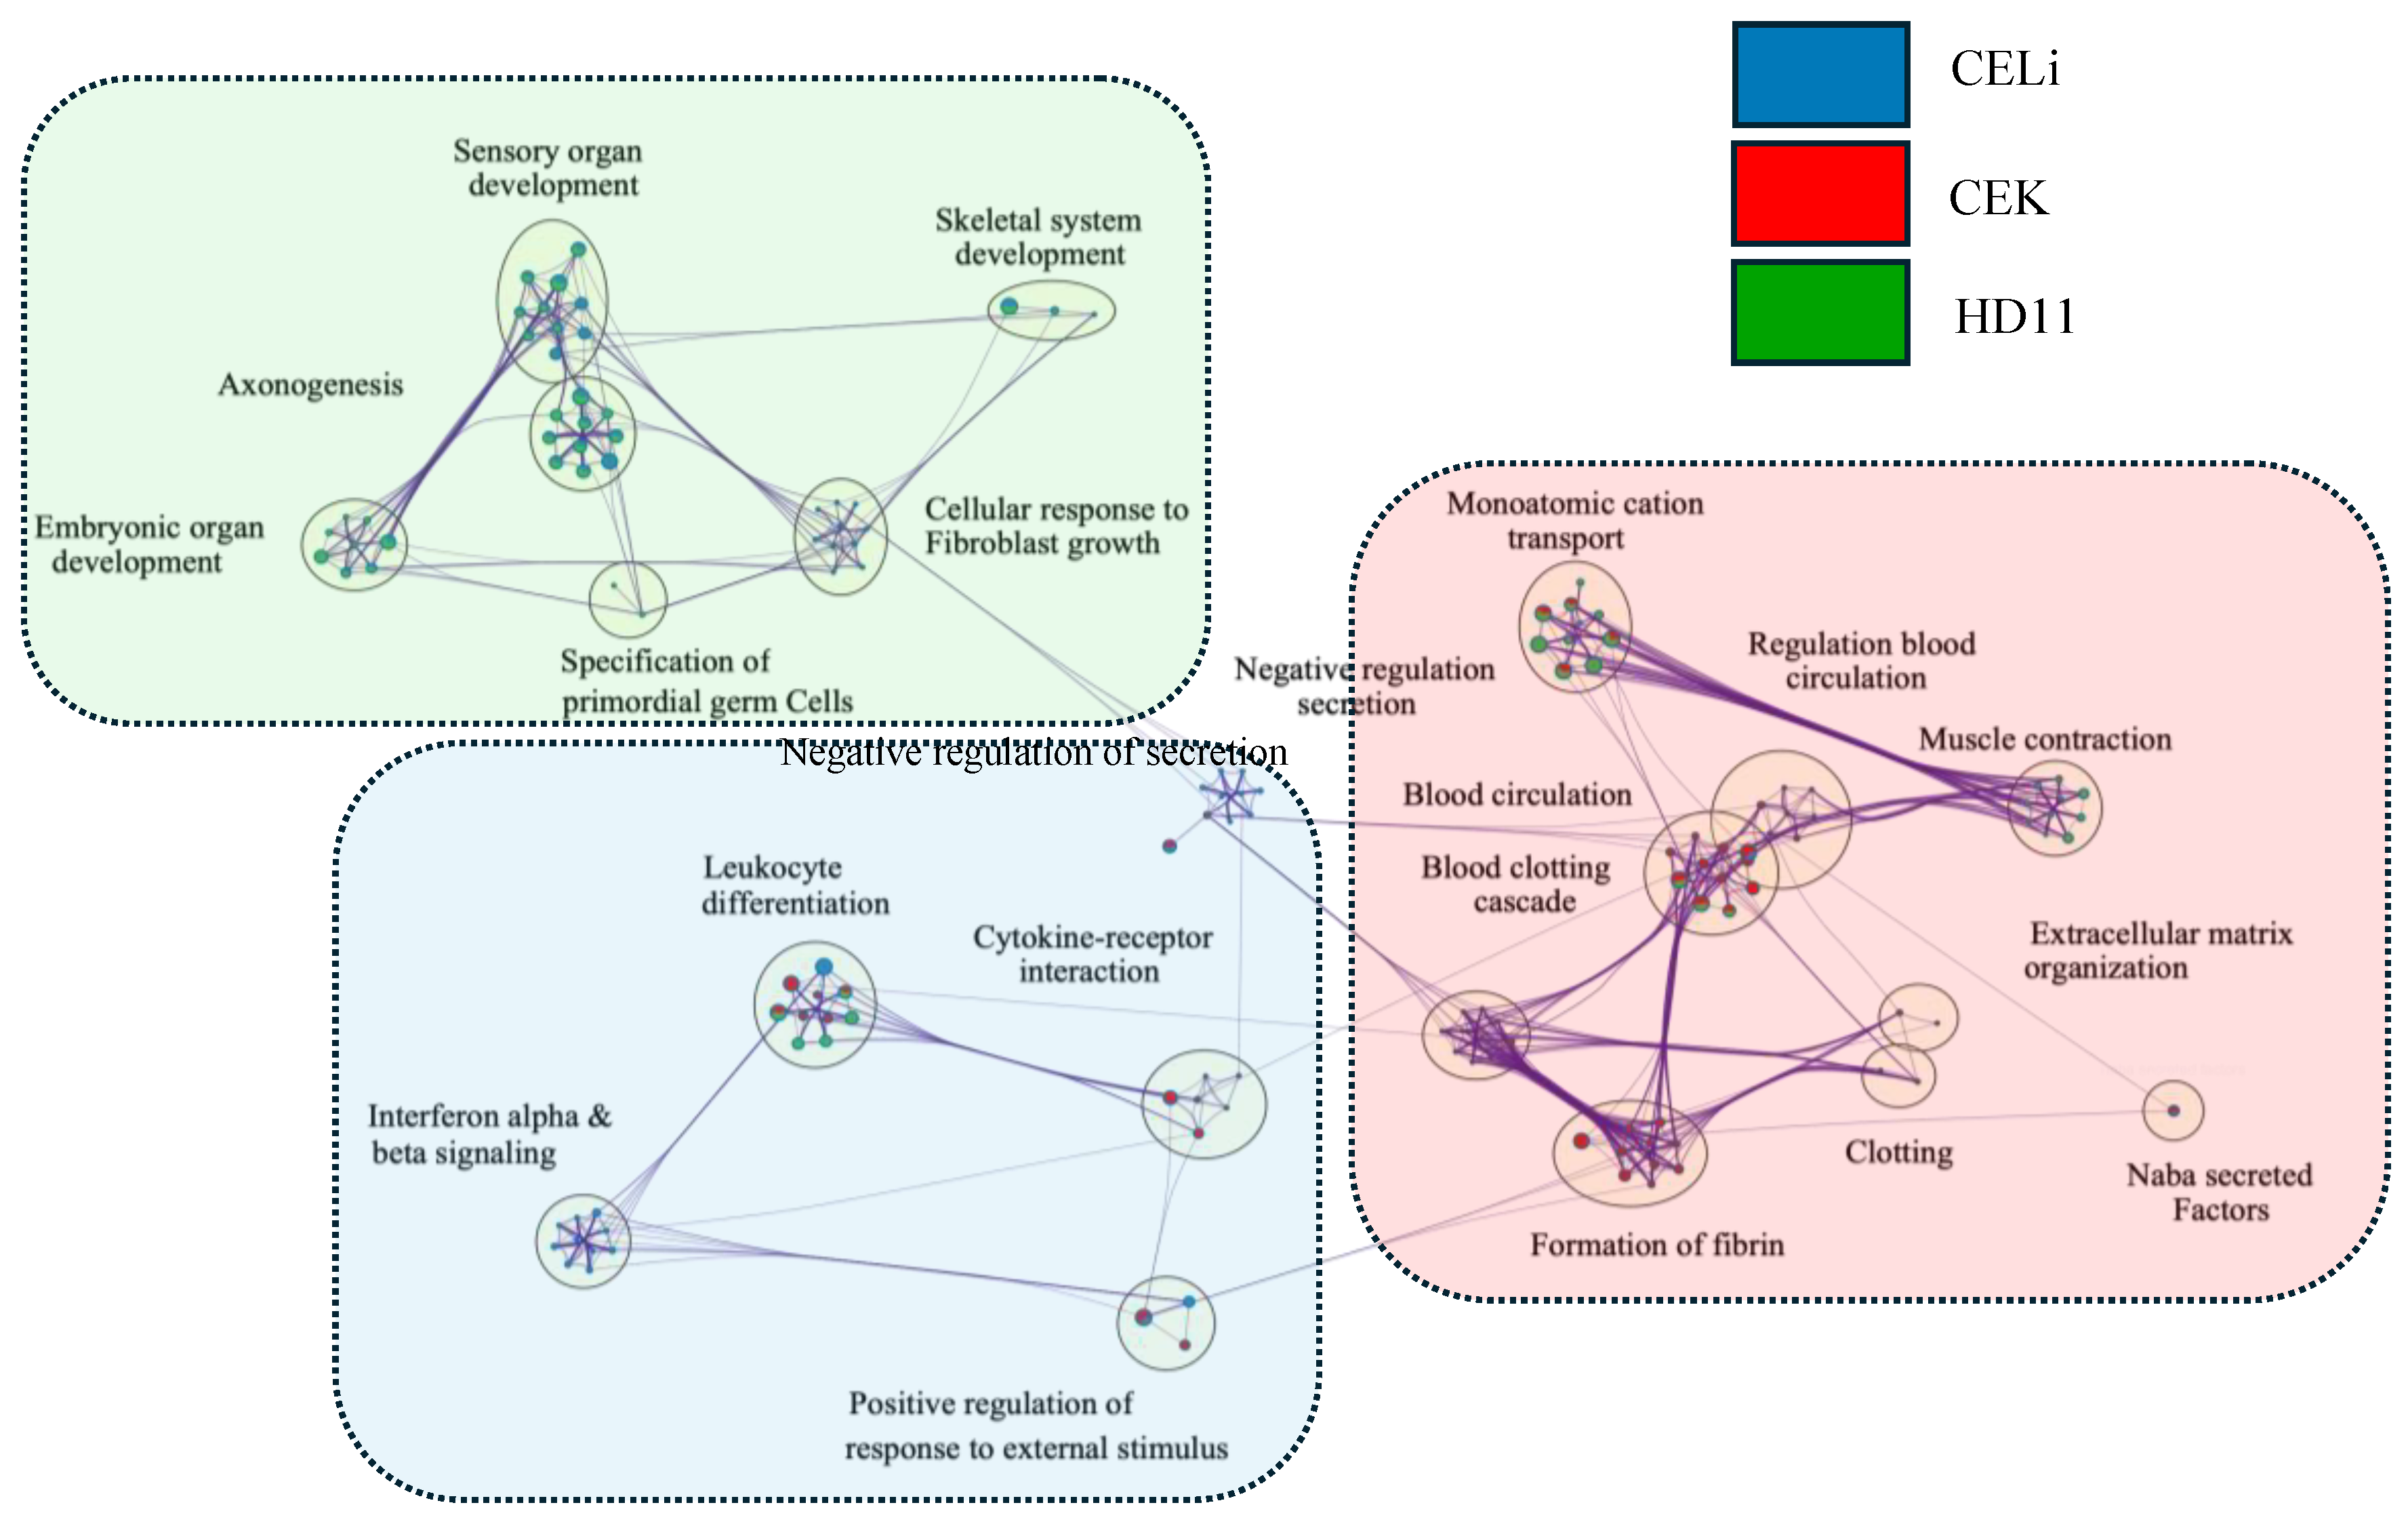
Figure 9.
Volcano plot depicting splicing isoform switch in chicken embryo liver cells (CELi) following ARV S1133 inoculation. Volcano plot highlighting the significant isoform switching between control and S1133-treated samples. Differential isoform fraction on x-axes constitutes the difference between ratios of isoform expression to total gene expression for control and S1133 inoculated samples. The red dots represent significant isoform switches with substantial changes in isoform fraction between control and S1133 infected samples. Those on the right or left show increase or decrease in overall isoform switch, respectively.
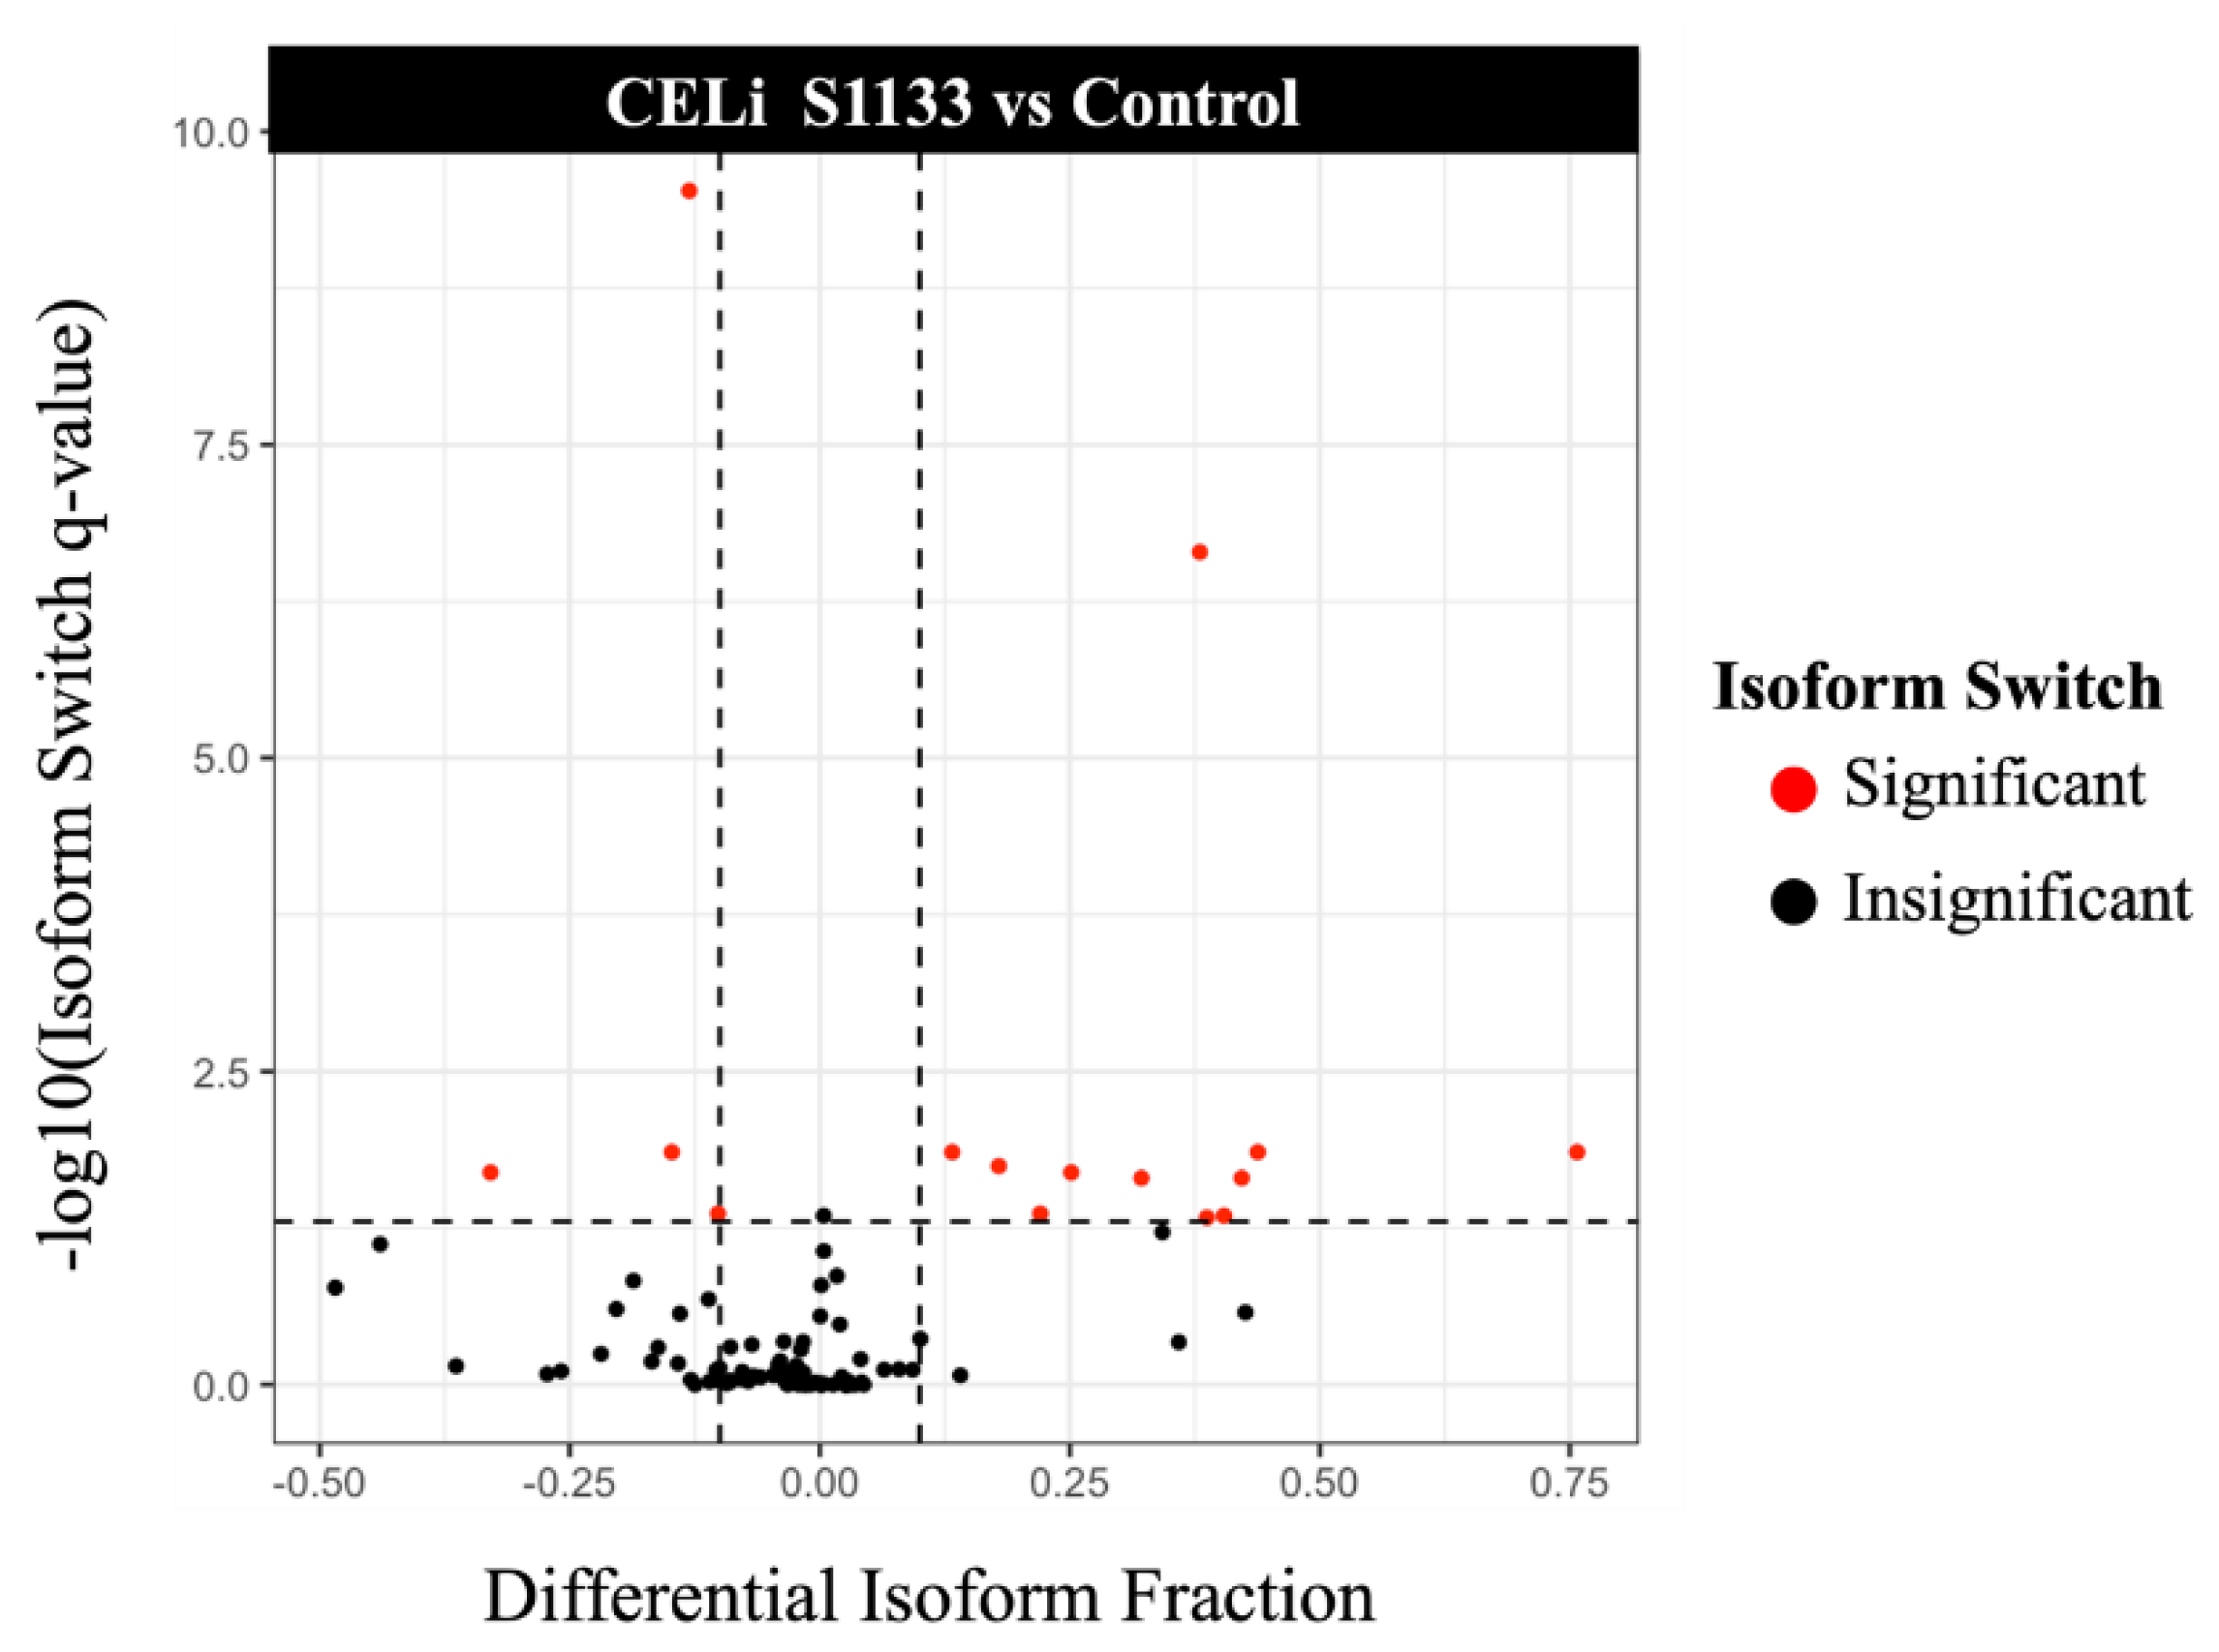
Figure 10.
Visualization of the splicing isoform differences for the ANKRD17 gene between control and S1133-infected chicken embryo liver cells. (a) The expression of the ANKRD17 gene has been shown. (b) Bar plots show counts of isoform transcripts for each treatment. (c) Bar plots showing the differential usage of the expressed isoforms isoform fraction. A significant increase in isoform XM_040694181.5 usage in S1133-inoculated groups was observed, suggesting differential alternative splicing events upon ARV infection.
Disclaimer/Publisher’s Note: The statements, opinions and data contained in all publications are solely those of the individual author(s) and contributor(s) and not of MDPI and/or the editor(s). MDPI and/or the editor(s) disclaim responsibility for any injury to people or property resulting from any ideas, methods, instructions or products referred to in the content. |
© 2025 by the authors. Licensee MDPI, Basel, Switzerland. This article is an open access article distributed under the terms and conditions of the Creative Commons Attribution (CC BY) license (http://creativecommons.org/licenses/by/4.0/).
Copyright: This open access article is published under a Creative Commons CC BY 4.0 license, which permit the free download, distribution, and reuse, provided that the author and preprint are cited in any reuse.


