
Submitted:
04 March 2025
Posted:
05 March 2025
You are already at the latest version
Abstract
Cardiovascular diseases stand as the leading cause of mortality worldwide, underscoring the urgent need for effective tools that enable early detection and monitoring of at-risk patients. This study combines Artificial Intelligence (AI) techniques—specifically K-means clustering algorithm—alongside dimensionality reduction methods like Principal Component Analysis (PCA) and Uniform Manifold Approximation and Projection (UMAP) to identify patient groups with varying levels of heart attack risk. We were using a publicly available clinical dataset with 1319 patient records, which included variables such as age, gender, blood pressure, glucose levels, KCM, and troponin levels. We normalized and prepared the data, then we employed PCA and UMAP to reduce dimensionality and facilitate visualization. Using the K-means algorithm, we segmented the patients into distinct groups based on their clinical features. Our analysis revealed two distinct patient groups. Group 2 exhibited significantly higher levels of troponin (mean 0.4761 ng/mL), KCM (18.65 ng/ml) and glucose (mean 148.19 mg/dL) and was predominantly composed of men (97%). These factors indicate an increased risk of cardiac events compared to Group 1, which had lower levels of these biomarkers and a slightly higher average age. Interestingly, no significant differences in blood pressure were observed between the groups. This study demonstrates the effectiveness of combining Machine Learning (ML) techniques with dimensionality reduction methods to enhance risk stratification accuracy in cardiology. By enabling more targeted interventions for high-risk patients, our approach contributes to improved prevention strategies.
Keywords:
Artificial Intelligence
; K-means clustering
; heart attacks
; dimensionality reduction
; troponin
; patient segmentation
; machine learning
1. Introduction
Cardiovascular diseases (CVDs) represent one of the most significant public health challenges of the 21st century. According to the World Health Organization (WHO), CVDs are the leading cause of death globally, accounting for approximately 31% of all deaths worldwide [1]. These conditions encompass a wide range of disorders affecting the heart and blood vessels, including coronary heart disease, cerebrovascular disease, rheumatic heart disease, and other conditions. The high prevalence and mortality associated with CVDs underscore the urgent need to improve strategies for prevention, diagnosis, and treatment.
The impact of CVDs extends beyond mortality; they also affect patients' quality of life and impose a considerable economic burden on healthcare systems. Risk factors such as high blood pressure, elevated blood glucose, high cholesterol levels, smoking, obesity, and physical inactivity significantly contribute to the development and progression of these diseases [2]. Moreover, the complex interplay between genetic, environmental, and lifestyle factors makes early identification of at-risk individuals challenging.
In this context, early detection and effective monitoring of patients at risk of heart attacks are crucial to reducing the incidence and mortality associated with CVDs. Preventive interventions and timely treatments can substantially improve clinical outcomes and alleviate the strain on healthcare systems. However, traditional risk assessment methods often fail to capture the full complexity of the factors involved, limiting their effectiveness.
Artificial Intelligence (AI) and Machine Learning (ML) emerge as promising tools to address these challenges. AI enables the analysis of large volumes of data and the discovery of hidden patterns that may go unnoticed using conventional statistical methods. ML, as a subfield of AI, focuses on developing algorithms capable of learning from data and improving their accuracy over time without being explicitly programmed for each task [3]. These techniques have proven effective in various medical applications, such as computer-assisted diagnosis, prediction of clinical outcomes, and treatment personalization [4], [5].
Specifically, the use of unsupervised learning algorithms, such as clustering, allows for the identification of patient groups with similar characteristics without the need for predefined labels. The K-means algorithm is one of the most widely used methods in this field due to its simplicity and efficiency in handling large datasets [6]. By combining it with dimensionality reduction techniques like Principal Component Analysis (PCA) and Uniform Manifold Approximation and Projection (UMAP), it is possible to simplify high-dimensional data and better visualize relationships between variables [7], [8].
The present study aims to apply AI techniques—specifically the K-means clustering algorithm along with PCA and UMAP—to identify groups of patients with different levels of risk for heart attacks. By analyzing clinical and laboratory variables such as age, gender, blood pressure, glucose levels, and troponin levels, we seek to detect patterns and groupings that may not be evident through traditional analyses. This approach can contribute to improving risk stratification and developing more effective prevention strategies in cardiology.
The main contributions of this study are as follows:
- ➢
- Effective Dimensionality Reduction Using UMAP: We successfully applied the nonlinear dimensionality reduction technique UMAP to the clinical dataset, reducing complexity while preserving essential data structures. This allowed for clearer visualization and better handling of nonlinear relationships between medical variables.
- ➢
- Identification of Patient Groups with Varying Cardiac Risk Levels: By utilizing the K-means clustering algorithm on the reduced dataset, we identified two distinct groups of patients with different levels of risk for heart attacks. This highlights the potential of unsupervised ML methods in uncovering hidden patterns in medical data.
- ➢
- Insights into Critical Biomarkers for Heart Attack Risk: We identified troponin, KCM, and glucose levels, along with gender, as significant factors in stratifying cardiovascular risk among patients. This finding can aid clinicians in focusing on key biomarkers for early detection and intervention.
- ➢
- Contribution to Personalized Medicine and Preventive Cardiology: Our approach demonstrates how AI and machine learning techniques can enhance risk stratification accuracy, leading to more targeted interventions for high-risk patients and improved prevention strategies in cardiology.
These results can benefit healthcare professionals by providing advanced tools for patient risk assessment and support the integration of AI in clinical decision-making processes.
This article is organized as follows: Section 2 details the methodology employed, including a description of the dataset and the analytical techniques used. Section 3 presents the results obtained and their interpretation. In Section 4, we discuss the clinical implications of our findings. Finally, Section 5 concludes by highlighting the main contributions of the study and suggesting directions for future research.
2. Materials and Methods
In this section, we detail the process we followed to evaluate the effectiveness of the clustering model and identify significant patterns in the medical variables of each patient. To achieve the study's objectives and validate our hypothesis, we developed a methodology that integrates several techniques, including Exploratory Data Analysis (EDA), dimensionality reduction, and machine learning algorithms. The focus of the study was to identify hidden patterns and natural groupings in a clinical dataset, aiming to classify patients into different risk groups for heart attacks.
Figure 1 presents a block diagram illustrating the workflow of the methodology used in this study. This diagram allows us to visualize the interrelationships between each stage of the process, facilitating replication of the methodology by other researchers.
We explain each of the phases in detail below, highlighting the key contributions and aspects of each process.
- Exploratory Data Analysis (EDA): We began the study with a thorough analysis of the medical data, identifying the most relevant features for subsequent analysis. During this phase, we evaluated the distribution of variables, checked for missing data, and explored possible relationships between variables. Our goal in the EDA was to gain a clear understanding of the data and prepare the dataset for the next phases of analysis. Detecting outliers and normalizing variables were critical steps to ensure data homogeneity and readiness for modeling. By thoroughly understanding the data's characteristics, we aimed to minimize biases and enhance the accuracy of our modeling efforts.
- Dimensionality Reduction: The original dataset contained multiple medical features that could have nonlinear relationships. To facilitate clustering and pattern visualization, we implemented dimensionality reduction techniques. We applied the Uniform Manifold Approximation and Projection (UMAP), a nonlinear dimensionality reduction method ideal for preserving both local and global data structures. We chose UMAP over linear techniques like Principal Component Analysis (PCA) due to its superior ability to maintain complex, nonlinear relationships within the data crucial aspect when dealing with medical datasets where variables often interact in intricate ways. This phase reduced the dataset's complexity to a two-dimensional space, simplifying the subsequent clustering stage and enhancing pattern discernibility.
- K-Means Clustering Algorithm: After reducing the data to two dimensions using UMAP, we applied the K-means clustering algorithm to identify natural groupings among the patients. K-means partitions the data into a predefined number of clusters, aiming to minimize intra-cluster distances and maximize separation between clusters. In this study, we chose to establish two clusters after evaluating several options and determining that this number provided the most meaningful segmentation of patients based on critical biomarkers like troponin, KCM and glucose levels. This decision was guided by methods such as the elbow method and silhouette analysis, ensuring that our clustering approach was both data-driven and clinically relevant.
- Validation and Visualization: After applying K-means, we validated the model using internal validation metrics and visual inspection of the clusters. We adjusted based on the cluster cohesion and separation observed in the visualization. Once satisfied with the cluster quality, we proceeded to interpret the clusters clinically, identifying relevant patterns and differences between patient groups that could inform risk stratification and intervention strategies.
This methodological approach enabled us to achieve a meaningful classification of patients based on their cardiac risk, highlighting the utility of AI techniques in the early identification of risk factors in the clinical setting. By combining UMAP and K-means, we effectively segmented the patient population and achieved clear visualization of the results, providing valuable insights that could enhance clinical decision-making and patient outcomes.
2.1. Medical Dataset and EDA
This work uses the clinical dataset Heart Attack Analysis & Prediction Dataset, provided by Rashik Rahman Pritom, available on Kaggle under the CC BY 4.0 license. The dataset contains comprising 1319 patient records, each containing eight relevant variables selected based on their significance in cardiovascular health assessment. These variables are [9], [10]:
- Age: Patient's age in years.
- Gender: Male or Female (represented as 0 and 1, respectively).
- Pulse Rate: Heart rate measured in beats per minute.
- High Blood Pressure (Systolic Pressure): Maximum arterial pressure during heart contraction.
- Low Blood Pressure (Diastolic Pressure): Minimum arterial pressure between heartbeats.
- Glucose Level: Blood glucose concentration in mg/dL.
- CK-MB (Creatine Kinase MB) (KCM): is an enzyme primarily found in the heart and, to a lesser extent, in skeletal muscles.
- Troponin Level: Blood troponin concentration in ng/mL, a specific biomarker for myocardial damage.
The dataset's dimensions (1319 samples × 8 features) provide a robust foundation for applying ML techniques. The data were retrospectively collected from electronic medical records of local hospitals, ensuring diversity and representativeness within the sample population.
We conducted an observational, descriptive, and cross-sectional study. No direct interventions were made with the patients; instead, we analyzed existing data to identify groupings based on similarities in clinical and laboratory variables.
An excerpt of the first ten rows of the dataset is presented in Appendix A, illustrating the structure and type of data used in this study.
Before proceeding with the modeling phase, we performed an extensive EDA to understand the underlying patterns and distributions within the dataset. This step was crucial for identifying data quality issues, uncovering relationships between variables, and informing subsequent analytical choices.
EDA
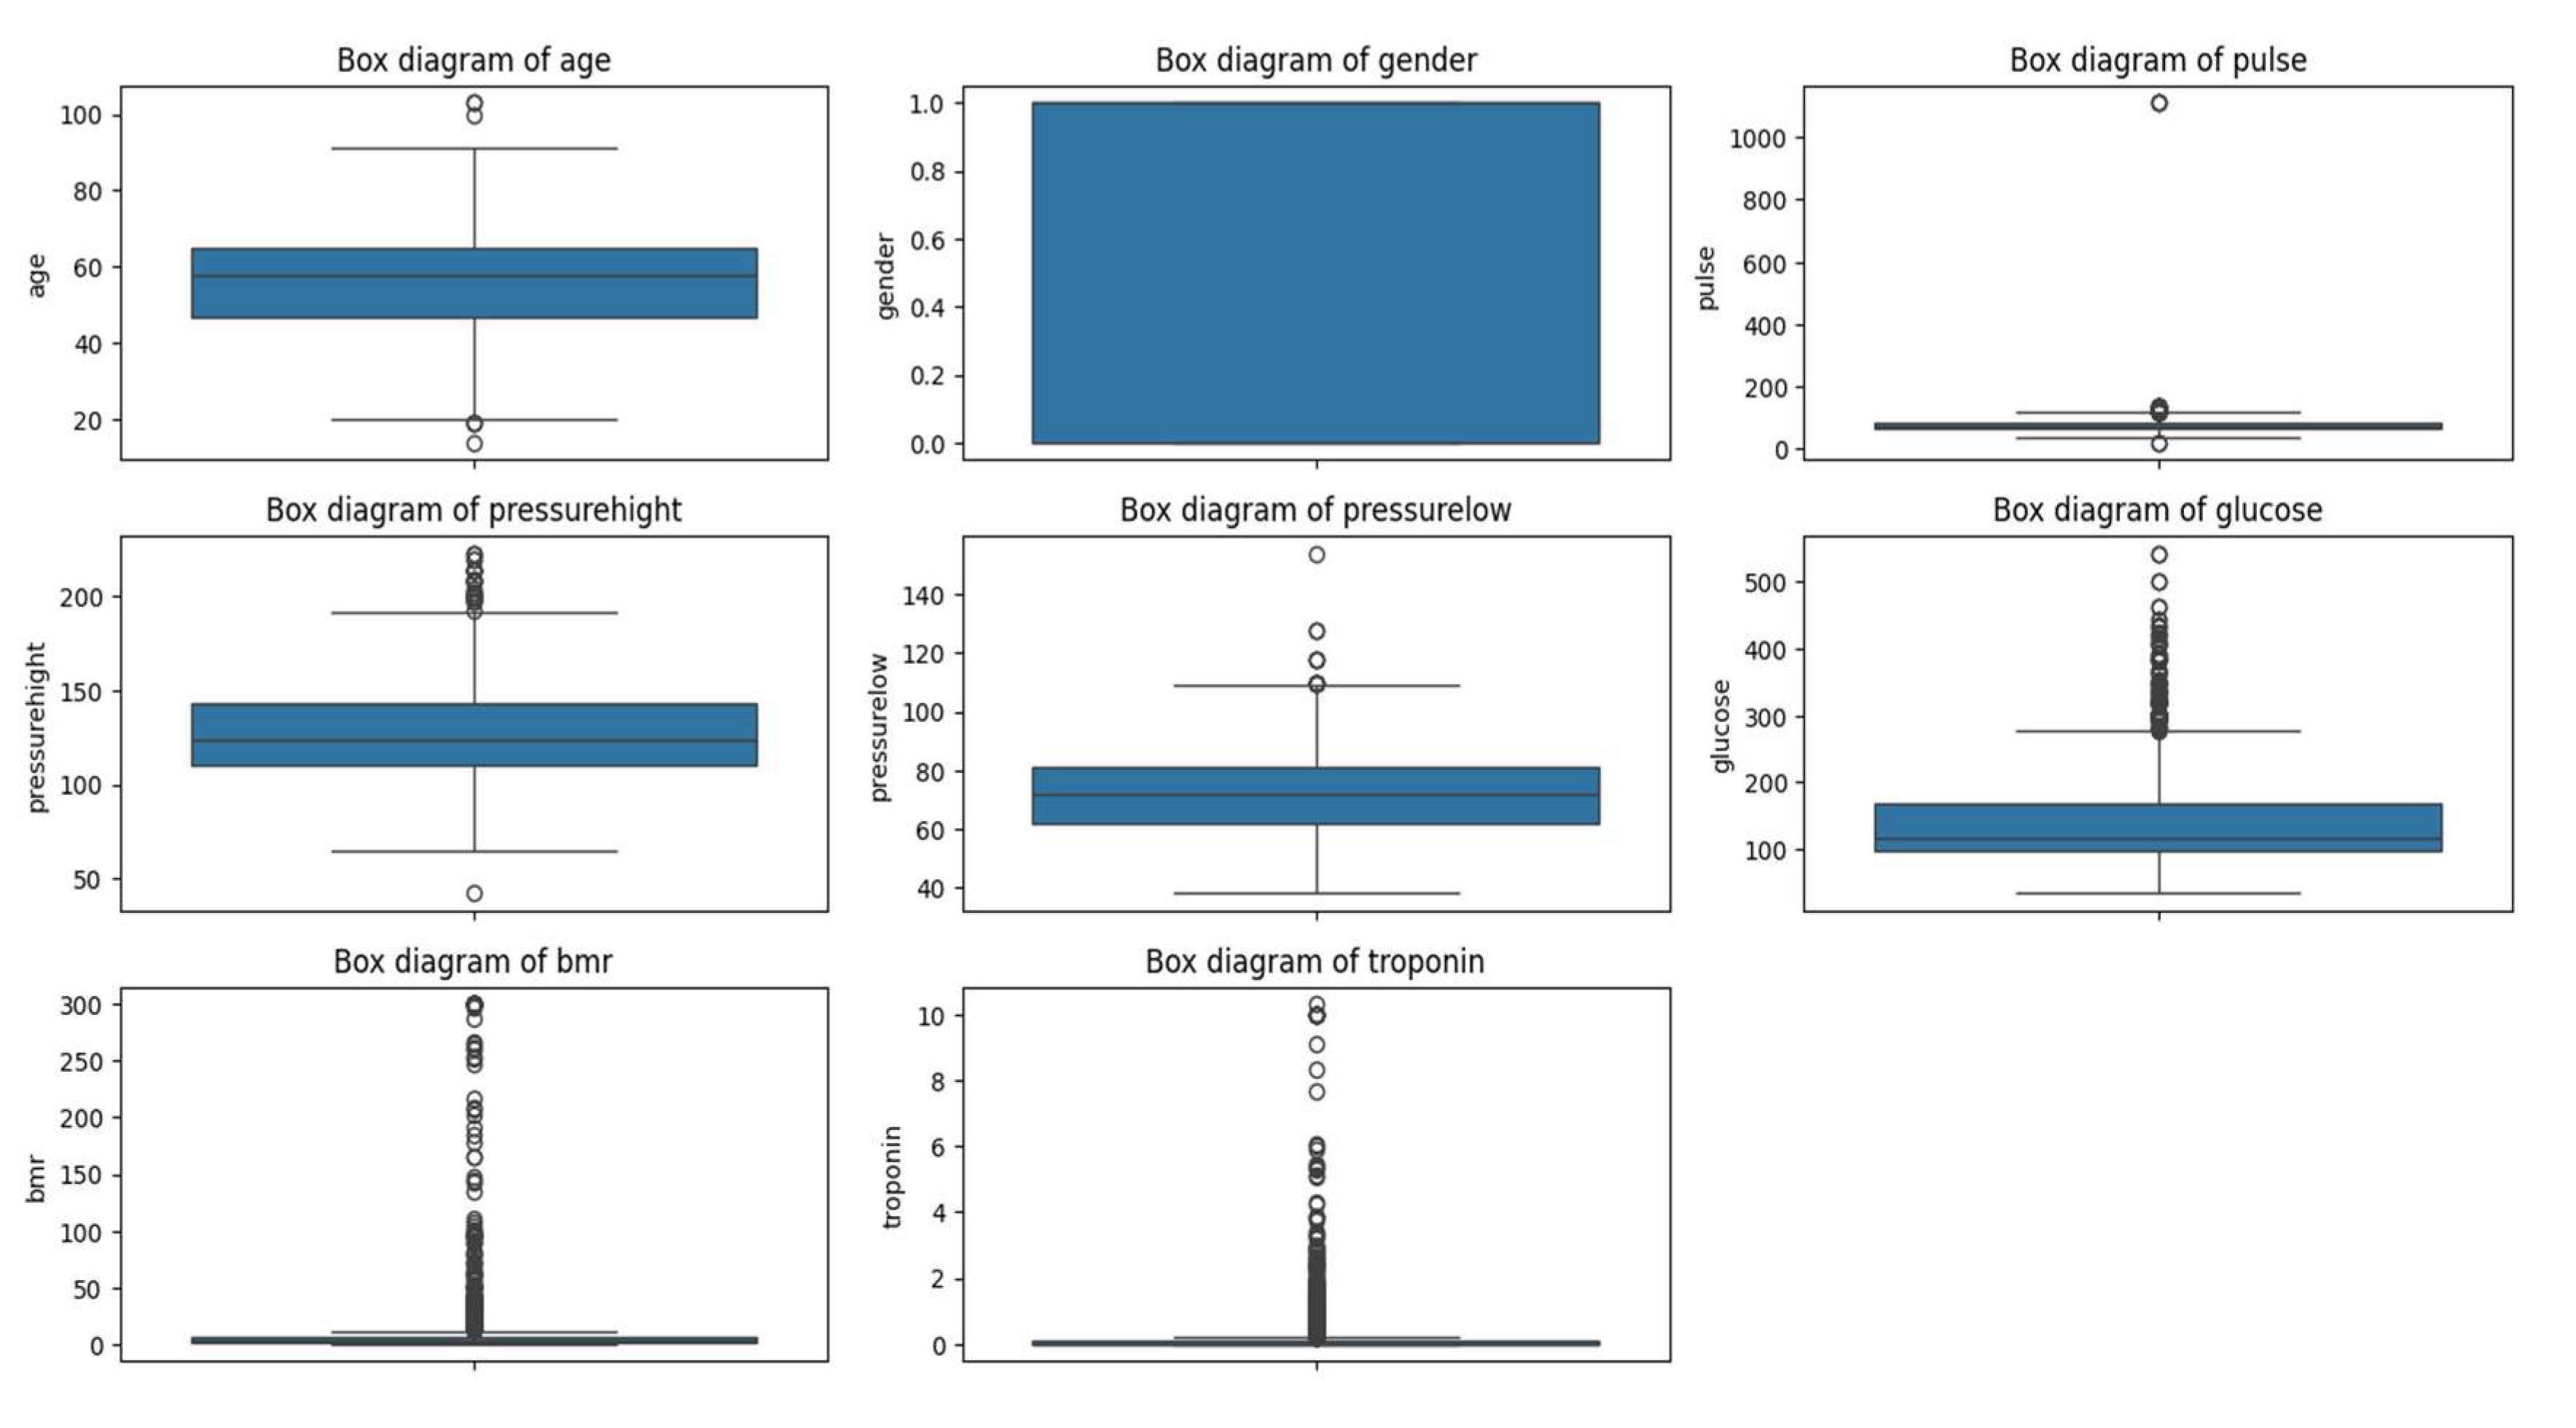
We conducted an EDA to understand the distribution and relationships among the variables. Using histograms, box-and-whisker plots, and correlation matrices, we identified patterns and potential outliers in the data.
Since the variables were on different scales, we applied normalization using StandardScaler method. This process allowed us to standardize the data, ensuring that each variable contributed equally to the analysis and enhancing the effectiveness of the clustering algorithms.
We identified and analyzed outliers to determine whether they should be excluded or if they provided relevant information. Outliers can offer valuable insights into extreme or unusual cases that might significantly influence the study's results. We decided to retain these outliers because they could represent patients with higher risk and are essential for the integrity of the analysis.
To identify linear relationships between variables, we calculated the Pearson correlation matrix. We observed a moderate correlation between systolic and diastolic blood pressure (r ≈ 0.59), suggesting that patients with high systolic pressure tend to have high diastolic pressure. The other variables showed low correlations, indicating that each contributes unique information to the dataset and is valuable for the clustering process.
By thoroughly understanding and preprocessing the data, we ensured that the dataset was suitable for dimensionality reduction and clustering. The insights gained from the EDA guided our methodological choices and helped us interpret the results within a clinical context.
2.2. Dimensionality Reduction
In clinical datasets with multiple variables, it's common for some variables to correlate with each other, leading to redundant information that can complicate analysis. Dimensionality reduction techniques help simplify high-dimensional data while preserving as much relevant information as possible. This simplification facilitates data processing, enhances the performance of machine learning algorithms, and makes data visualization more manageable [11].
Principal Component Analysis (PCA) is a widely used statistical method that transforms a set of possibly correlated variables into a set of uncorrelated variables known as principal components [12]. These components are linear combinations of the original variables and are ordered so that the first principal component captures the maximum possible variance in the data, the second component captures the next highest variance, and so on. We selected the initial components that explained at least 95% of the total variance, aiming to reduce dimensionality while retaining most of the information [13].
Uniform Manifold Approximation and Projection (UMAP) is a modern dimensionality reduction technique that preserves both local and global data structures [8]. Unlike PCA, which is a linear method [11], UMAP can capture nonlinear relationships in the data [14]. We used UMAP to visualize the data in a two-dimensional space, facilitating the identification of natural groupings among patients.
2.3. Application of KMeans
The K-means algorithm clusters data into K groups by minimizing the sum of squared distances between data points and the centroid of their assigned cluster [15]. This method aims to partition the dataset into distinct, non-overlapping subsets where each data point belongs to the cluster with the nearest mean value.
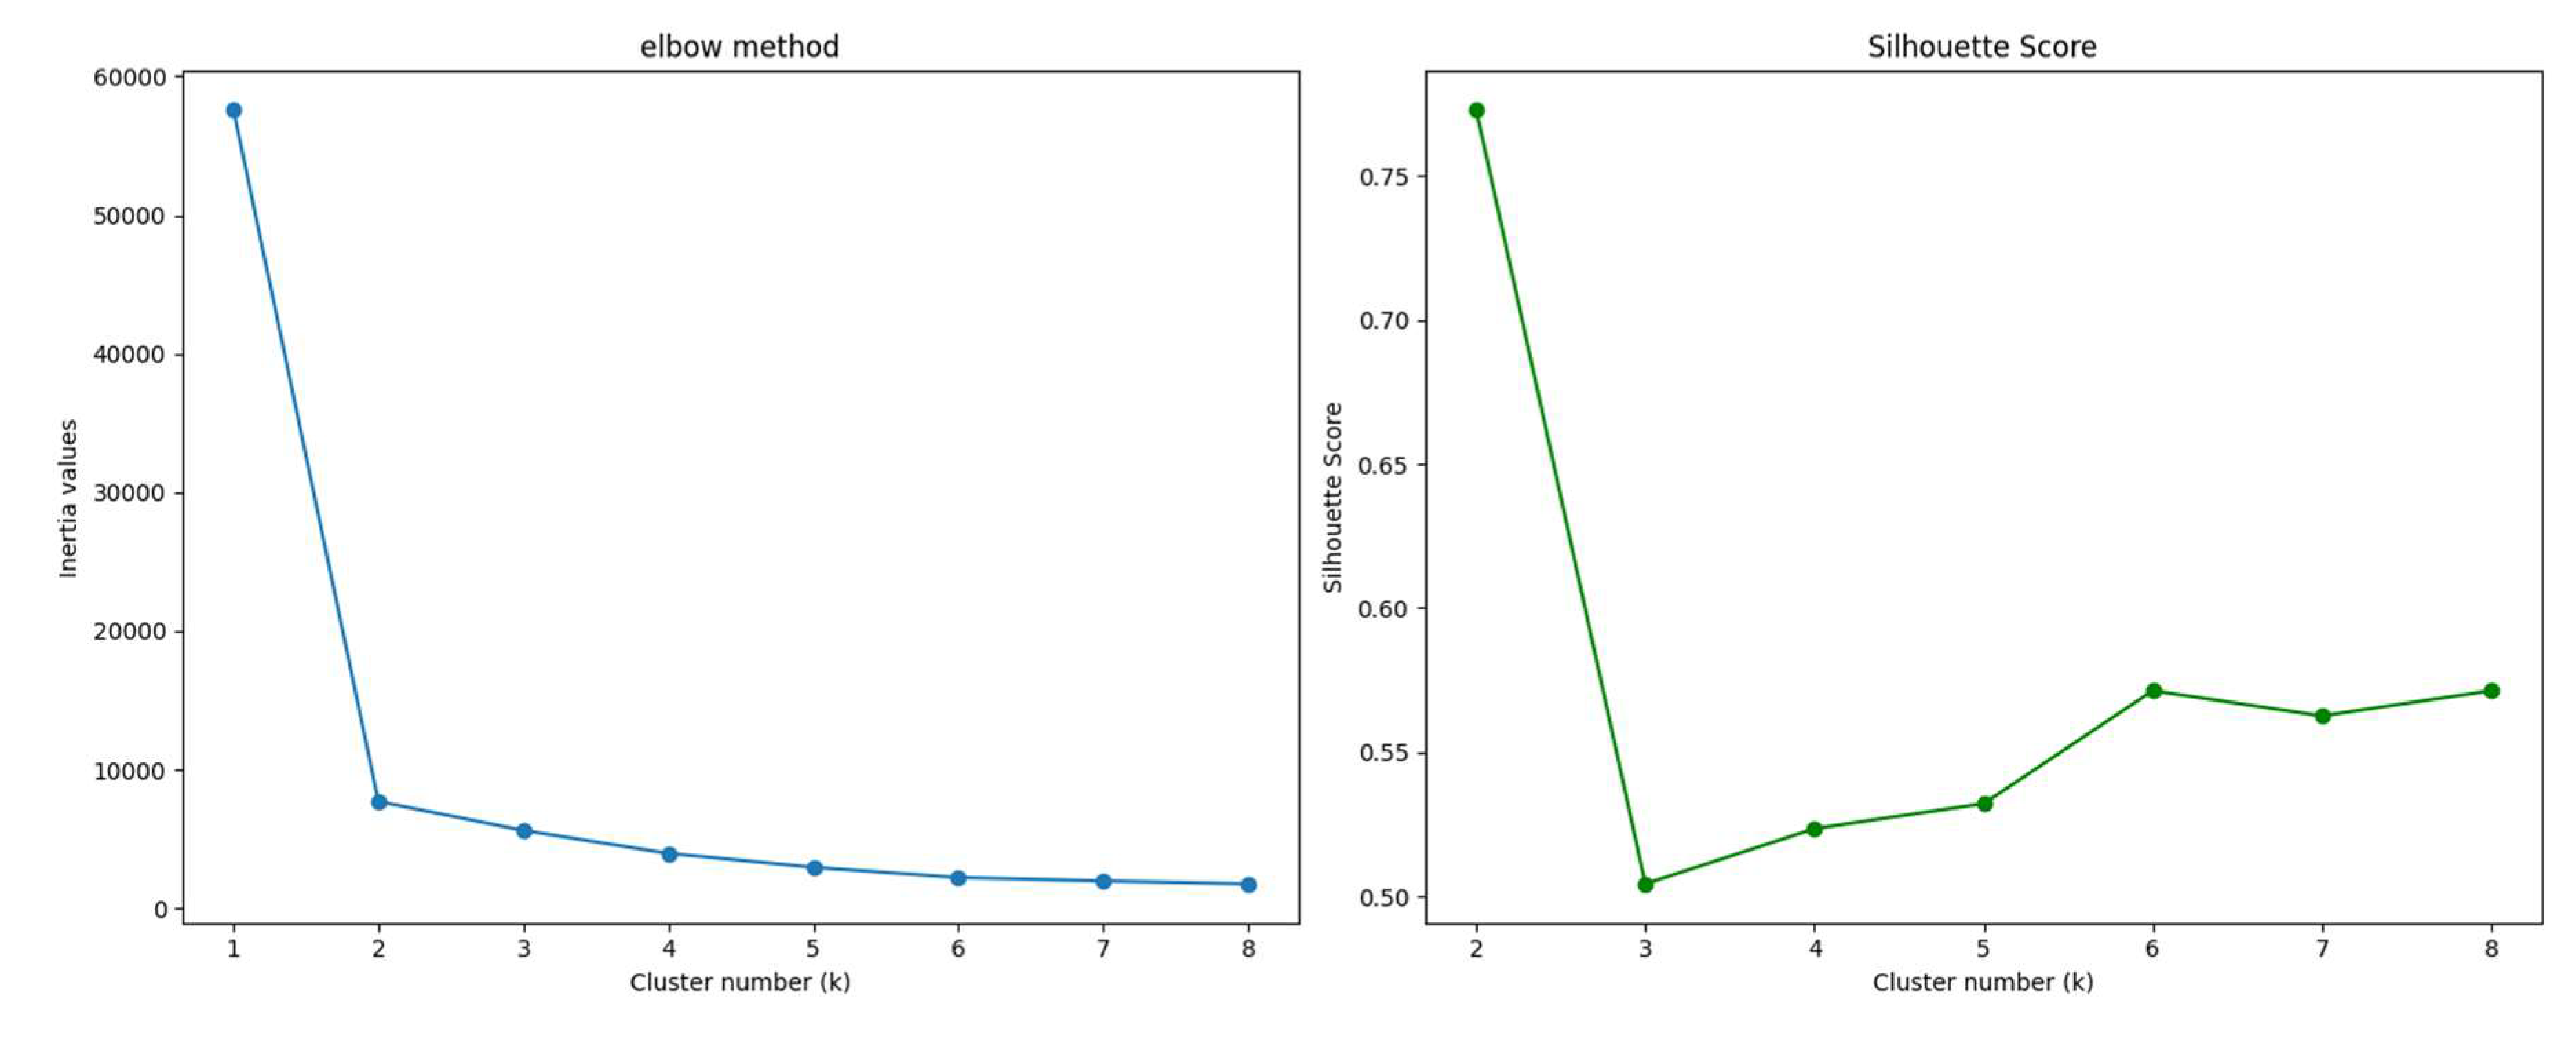
To identify the optimal number of clusters or groups (K), we employed the elbow method and the silhouette coefficient:
- Elbow Method: This technique involves running K-means clustering on the dataset for a range of K values and computing the within-cluster sum of squares (WCSS). By plotting WCSS against the number of clusters, we look for an "elbow" point where the rate of decrease sharply changes, indicating diminishing returns with additional clusters [16]. In our analysis, the elbow point suggested that K=2 was optimal.
- Silhouette Coefficient: This metric measures how well each data point fits within its assigned cluster compared to other clusters. It ranges from -1 to 1, where a higher value indicates better clustering quality [17]. We calculated the silhouette scores for different K values and found that the highest average silhouette score occurred at K=2, reinforcing the result from the elbow method.
By combining these two methods, we confidently determined that dividing the patients into two clusters was the most meaningful approach for our dataset. This allowed us to effectively group patients based on critical biomarkers such as troponin, KCM and glucose levels, which are significant indicators of cardiac risk.
3. Simulations Results
In this section, we explain the steps taken to execute the entire process outlined in the block diagram of Figure 1. The process is divided into three main parts: EDA, dimensionality reduction, and application of ML algorithms. Each subsection provides a detailed account of the methodologies employed and the results obtained, offering insights into how each step contributes to identifying patient groups with varying levels of cardiac risk.
We begin with the EDA to understand the dataset's characteristics and prepare the data for analysis. Next, we apply dimensionality reduction techniques to simplify the dataset while preserving essential information. Finally, we utilize machine learning algorithms to cluster the patients and interpret the results within a clinical context.
3.1. EDA Application
In this subsection, we present the correlation matrix between the features in the dataset. Also, we show a statistical summary of all variables in the dataset and the outliers analysis.
We plotted the correlation matrix to understand how closely related the variables are to each other. In a correlation matrix, values closer to 1 indicate a stronger positive correlation between variables, meaning they tend to increase together. Correlation matrices are fundamental tools in exploration data analysis, helping to identify relationships between variables and detect potential multicollinearity issues [18].
From the correlation matrix (see figure 2), we observed that the variables Pressure_High (systolic blood pressure) and Pressure_Low (diastolic blood pressure) have a correlation coefficient of approximately 0.59. Although this correlation is not extremely high, it indicates a moderate relationship between the two variables. This makes clinical sense, as patients with higher systolic pressure also have higher diastolic pressure [19]. This correlation reflects the physiological relationship between the two measures of blood pressure, influenced by factors such as arterial stiffness and vascular resistance.
Depending on the analytical approach, one might consider whether both variables are necessary or if one could suffice. However, since the correlation is moderate rather than strong, both variables may still provide unique information and contribute valuable insights to the analysis.
The other variables did not show significant correlations with each other (see figure 2), suggesting that there is no strong collinearity in the dataset. This lack of high correlation among most variables is advantageous for clustering purposes because it indicates that each variable contributes distinct information. When variables are not highly correlated, clustering algorithms like K-means can more effectively utilize the unique characteristics of each variable to segment patients into meaningful groups.
Understanding the correlations between variables helped us ensure that the dataset was suitable for clustering without the need to remove or combine variables due to redundancy [20]. It also provided confidence that each variable could potentially influence the formation of clusters, aiding in the identification of patient groups with different risk profiles.
To further understand the dataset, we performed a statistical analysis of all variables, focusing on measures such as mean, standard deviation, minimum and maximum values, and quartiles. Table 1 below presents a comprehensive summary of these statistical metrics, offering deeper insights into the distribution and variability within the data.
From the statistical data, we notice that the Pulse variable exhibits a high standard deviation (51.63) relative to its mean (78.34). Additionally, the maximum value of Pulse is 1111, which is significantly greater than the third quartile (85). This disparity suggests the presence of outliers that could be affecting the distribution of this variable.
Similarly, the variables Glucose, KCM, and Troponin show maximum values considerably higher than their respective third quartile values. This indicates the presence of outliers that might influence the interpretation of these variables.
By carefully analyzing these statistical summaries, we gained valuable insights into the dataset's characteristics, which guided our subsequent steps in the analysis. Recognizing the presence of outliers and understanding their potential significance helped us make informed decisions about data preprocessing and ensured that our clustering results would be meaningful in a clinical context. Appendix B shows all the outliers presented in the features of this dataset.
Given that our objective is to identify groups of patients, we decided to retain these outliers because they could represent a specific subgroup within the dataset. These extreme values might correspond to patients with higher risk profiles and excluding them could lead to a loss of critical information.
By maintaining the outliers, we aim to ensure that the clustering algorithm captures the full spectrum of patient data, potentially revealing important patterns associated with elevated cardiac risk.
3.2. Dimensionality Reduction Applications
In this section, we normalized all the data to the same scale. This step is essential because the algorithms need to interpret and differentiate the meaning of each numerical variable, given that they were originally on different scales. By standardizing the data using Standardscaler normalization, we ensured that each variable contributed equally to the analysis, preventing variables with larger scales from dominating the results.
With all data on the same scale, we proceeded to visualize the variance distributed among each principal component. PCA operates by transforming the original variables into a new set of uncorrelated variables called principal components, ordered by the amount of variance they capture from the data [12]. In other words, the more variance a component captures, the more it contributes to the segmentation and separation of the data.
In our study, since we have eight variables, we can obtain a maximum of eight principal components. However, the human eye can only visualize up to three dimensions effectively, making it challenging to interpret more than three components visually. Therefore, we focused on the first few components that capture the most variance.
Ideally, the first two or three principal components should capture a substantial portion of the total variance to allow for meaningful visualization and analysis [7]. In Figure 3, we present the variance of each principal component individually and how they accumulate to reach 100% of the total variance.
Observing the figure, we notice that the sum of the first two components barely reaches 40% of the accumulated variance. This low percentage indicates that the data are not well represented in just two dimensions using PCA, as a significant amount of information (variance) remains in the higher components.
The limited variance captured by the first two principal components suggests that PCA may not be the most effective dimensionality reduction technique for our dataset, especially if nonlinear relationships exist between variables [21]. This finding led us to consider alternative methods better suited for preserving complex data structures.
In Figure 4, we present the plot of the data distributed using the first two principal components, which account for almost 40% of the total variance. The figure shows a high concentration of data points clustered together, with a few points scattered away from this dense area. The points are quite dispersed overall, and there do not appear to be evident clusters indicating a natural separation between groups in the data.
This observation is consistent with our earlier findings, where we noted that the first two principal components capture a relatively small portion of the total variance. Because these components do not explain a significant amount of variance, important information may be lost when projecting the data onto this lower-dimensional space. This loss of information makes it difficult to distinguish distinct groups or patterns within the dataset using PCA.
Based on these insights, we conclude that PCA is not effective for reducing the dimensionality of our dataset in this specific problem. The ineffectiveness of PCA may be attributed to the data not exhibiting linear relationships among variables. Since PCA is a linear dimensionality reduction technique, it struggles to capture the complex, nonlinear structures that may exist in the data [12], [21]. This limitation suggests the need for alternative methods that can handle nonlinear relationships more effectively.
UMAP
We decided to apply the UMAP technique, which proved to be more effective for our problem due to two main reasons [8], [14]:
- Preservation of Local and Global Structure: UMAP is specifically designed to preserve both the local and global structures of the data. This means it attempts to maintain close relationships between similar data points as well as the broader relationships among groups of points in the high-dimensional space. By doing so, UMAP provides a more faithful representation of the data's intrinsic geometry in a lower-dimensional space. This characteristic is crucial when dealing with complex datasets where important patterns may exist at different scales.
- Manifold Approximation: UMAP operates under the assumption that the data lies on a low-dimensional manifold within the high-dimensional space. It seeks to find a representation of this manifold in a lower-dimensional space. This approach can result in a clearer separation of clusters or patterns, making it easier to identify distinct groups within the data. UMAP's ability to capture nonlinear relationships enhances the visualization and interpretability of data.
After applying UMAP to the normalized data, we obtained Figure 5. From this figure, we can clearly observe two distinct groups of patients, one on the left and one on the right. This outcome indicates that UMAP successfully reduced the dimensionality of the dataset while preserving meaningful structures relevant for clustering.
By using UMAP, we achieved our objective of dimensionality reduction for this dataset. The technique effectively unveiled the underlying structure of the data, showing the presence of two natural groupings among the patients. This result sets a strong foundation for the next step, which involves applying the K-means algorithm to divide the patients into clusters and interpret the findings.
3.3. KMeans Application
Although Figure 5 suggests the presence of two distinct patient groups, we verified this observation using the elbow method and the silhouette score, as explained in the methodology section. These methods helped us determine the optimal number of clusters (K) for our dataset.
After calculating and plotting these indicators, we found that both methods indicated that K=2 is the optimal number of clusters. This finding aligns with our initial hypothesis based on the UMAP visualization.
Figure 6.
Elbow method and Silhouette score.
With the optimal number of clusters determined, we applied the K-means algorithm to divide the patients into two groups. By confirming the optimal number of clusters through these methods, we ensured that our clustering approach was robust, and data driven. The resulting clusters provided a foundation for analyzing the characteristics of each group and interpreting their clinical significance. The clustering results are presented in Figure 7.
4. Discussion
In this section, we present a summarized comparison of the two patient groups identified and discuss the main differences observed. Table 2 shows the average values of key variables for each group.
The results obtained using UMAP and K-means clustering suggest that patients in Group 2 are at higher risk due to elevated levels of troponin, KCM and glucose, three significant indicators for cardiac issues. Although Group 1 has a slightly higher average age, it does not exhibit the same elevated levels of these critical biomarkers.
The stark difference in gender distribution between the two groups is noteworthy; Group 2 consists of 97% male patients, whereas only 3% of Group 1 are male. This disparity could be clinically significant and may relate to gender-specific risk factors for cardiovascular diseases. Existing literature indicates that men have a higher risk of certain cardiac events compared to women, potentially due to differences in hormonal profiles, lifestyle factors, and prevalence of risk behaviors [22]. Exploring this aspect further would be valuable in future studies.
Interestingly, both groups have similar average blood pressure readings, implying that blood pressure may not be the distinguishing factor between these clusters. Instead, biomarkers like troponin and glucose appear to play a more pivotal role in differentiating patient risk profiles in this dataset.
Applying UMAP as a dimensionality reduction technique was crucial for clearly identifying the differences between the groups. By preserving both local and global data structures, UMAP facilitated the effective use of the K-means algorithm for patient segmentation. The combination of these AI techniques allowed us to uncover patterns that might not have been apparent using traditional linear methods like PCA.
Our findings demonstrate the potential utility of integrating advanced ML techniques into clinical practice. By enabling the identification of high-risk patient groups based on specific biomarkers and demographic factors, clinicians can tailor prevention and monitoring strategies more effectively. This approach aligns with the principles of personalized medicine, where interventions are customized to individual patient profiles [23].
As a possible clinical implication, the Statistical and Clinical Analysis of Key Biomarkers may offer Clinical Significance such as Troponin is a highly specific biomarker of myocardial injury, is widely used in the diagnosis and prognosis of acute coronary syndromes. In this study, Group 2 patients show an average troponin level of 0.4761 ng/mL, significantly higher than the 0.1186 ng/mL observed in Group 1. This finding suggests possible underlying ischemia or latent myocardial damage in these patients, which could correlate with a higher risk of coronary events in the short to medium term [24].
The Clinical and Prognostic Implications: The elevated troponin levels in Group 2 support the hypothesis of a high cardiovascular risk profile. Recent studies indicate that even moderately elevated troponin levels are associated with increased all-cause and cardiovascular mortality [25]. Thus, patients in this group may benefit from close monitoring and intensive preventive interventions, such as angiotensin-converting enzyme inhibitors (ACEIs) or beta-blockers, to mitigate the risk of cardiac events.
On cross-check data, the Glucose levels and Metabolic Risk: Hyperglycemia is a key marker of insulin resistance and metabolic dysfunction, factors closely linked to cardiovascular risk [26]. In this study, Group 2 shows an average glucose level of 150 mg/dL, compared to 143 mg/dL in Group 1. Although both groups present hyperglycemia, the elevated levels in Group 2 suggest a possible coexistence of prediabetes or type 2 diabetes, conditions that exacerbate the risk of atherosclerosis and other adverse cardiovascular events [27].
Implications for Metabolic Health and Cardiovascular Risk: Sustained hyperglycemia, as observed in both groups, is a risk factor for microvascular and macrovascular complications. Studies indicate that dysglycemia promotes a chronic inflammatory state and increased oxidative stress, pathological processes that contribute to endothelial damage and atherosclerosis [28]. The combination of elevated troponin and glucose levels in Group 2 may indicate an increased risk of metabolic syndrome and coronary artery disease.
To continue the Comparison of Metabolic Repercussions Between Groups. In Group 1 it can be defined as a Lower Risk Profile. Clinical and Risk Profile: Patients in Group 1 exhibit moderately elevated glucose levels but relatively low troponin levels, suggesting a lower cardiovascular risk burden. Moderate hyperglycemia, in the absence of myocardial injury markers, may indicate an early phase of metabolic dysfunction without significant cardiovascular involvement. Intervention Strategies: Recommendations for these patients may focus on primary prevention strategies, such as lifestyle modifications (healthy diet, regular exercise) and the use of metformin to improve insulin sensitivity and reduce the risk of progression to type 2 diabetes and cardiovascular events [29].
Group 2 as a High-Risk Profile. Implications of High Cardiovascular and Metabolic Risk: The co-elevation of troponin and glucose in Group 2 suggests more severe metabolic dysregulation and a substantially increased cardiovascular risk. This clinical profile is consistent with metabolic syndrome and a state of low-grade chronic inflammation, conditions that increase the risk of atherothrombosis and cardiovascular events [30]. Priority Clinical Interventions: For patients in this group, intensive management is essential, which may include optimizing glycemic control through insulin therapy or newer antidiabetics (such as SGLT2 inhibitors or GLP-1 agonists) and the use of statins to reduce cardiovascular risk. Moreover, troponin monitoring could provide valuable information on the response to interventions and the risk of short-term cardiac events [31].
5. Conclusions
This study demonstrates the feasibility of using machine learning techniques to identify groups of patients with different levels of heart attack risk. Group 2, characterized by high troponin, KCM and glucose levels and a predominance of male patients, requires prioritized medical attention and specific intervention strategies. In contrast, patients in Group 1, although older, appear to have a lower risk based on these biomarkers.
Applying the K-means clustering algorithm alongside dimensionality reduction techniques like PCA and UMAP allowed us to effectively group patients and clearly visualize the data. These findings can assist healthcare professionals in clinical decision-making and in designing prevention and treatment programs.
Segmenting patients using AI techniques offers a promising avenue for improving the diagnosis and prevention of cardiovascular diseases. It provides significant advantages:
- Early Risk Identification: Enables the detection of patterns and risk factors that might go unnoticed in traditional analyses.
- Personalized Treatments: Facilitates patient stratification, potentially leading to more personalized and effective interventions.
- Impact on Precision Medicine: Incorporating biomarker analysis into risk assessment offers an opportunity to implement targeted and evidence-based interventions. For instance, patients in Group 2 could benefit from comprehensive management programs to reduce cardiovascular risk and improve long-term clinical outcomes, aligning with the principles of personalized medicine [32].
- Optimization of Healthcare Resources: Helps prioritize medical care toward patients at higher risk, enhancing efficiency in resource allocation.
However, this study has some limitations. We recommend expanding this study by incorporating more clinical variables and utilizing different clustering algorithms to validate and enrich the results. Additionally, future work should consider variables related to lifestyle habits, such as smoking, diet, physical activity, cholesterol levels, among others.
Author Contributions
Conceptualization, J.D.G.-F., R.R.-R. and J.E.L.-R.; Methodology, J.D.G.-F. and A.G.-M.; Software, J.D.G.-F., J.E.G.-T. and J.E.L.-R.; Validation, S.V.-R., A.-F.L.-N. and E.A.I.-F.; writing—original draft preparation, J.D.G.-F., R.R.-R. and J.E.L.-R; writing—review and editing, R.R.-R., J.E.L.-R, A.G.-M., A.-F.L.-N, J.L.-A. and E.A.I.-F.; funding acquisition, R.R.-R.; Investigation, J.E.G.-T. and E.A.I.-F.; Formal Analysis, E.A.I.-F. All authors have read and agreed to the published version of the manuscript.
Funding
This research received no funding.
Data Availability Statement
The data that support the findings of this study are available from the corresponding author, upon reasonable request.
Acknowledgments
The authors would like to thank the CICESE and the CONAHCYT for their support.
Conflicts of Interest
The authors declare no conflict of interest.
Appendix A

Table A1.
Fragment of ten entries of the medical dataset.
| Age | Gender | Impulse | Pressurehight | Pressurelow | Glucose | KCM | Troponin |
|---|---|---|---|---|---|---|---|
| 64 | 1 | 66 | 160 | 83 | 160 | 1.80 | 0.012 |
| 21 | 1 | 94 | 98 | 46 | 296 | 6.75 | 1.060 |
| 55 | 1 | 64 | 160 | 77 | 270 | 1.99 | 0.003 |
| 64 | 1 | 70 | 120 | 55 | 270 | 13.87 | 0.122 |
| 55 | 1 | 64 | 112 | 65 | 300 | 1.08 | 0.003 |
| 58 | 0 | 61 | 112 | 58 | 87 | 1.83 | 0.004 |
| 32 | 0 | 40 | 179 | 68 | 102 | 0.71 | 0.003 |
| 63 | 1 | 60 | 214 | 82 | 87 | 300 | 2.370 |
| 44 | 0 | 60 | 154 | 81 | 135 | 2.35 | 0.004 |
| 67 | 1 | 61 | 160 | 95 | 100 | 2.84 | 0.011 |
Appendix B
Figure A1.
Outliers in the medical dataset.
References
- World Health Organization (WHO), “Cardiovascular diseases (CVDs).” Accessed: Oct. 23, 2024. [Online]. Available: https://www.who.int/news-room/fact-sheets/detail/cardiovascular-diseases-(cvds).
- Y. Chen et al., “Rhodiola rosea: A Therapeutic Candidate on Cardiovascular Diseases,” Oxid Med Cell Longev, vol. 2022, 2022. [CrossRef]
- J. Heaton, “Ian Goodfellow, Yoshua Bengio, and Aaron Courville: Deep learning,” Genet Program Evolvable Mach, vol. 19, no. 1–2, pp. 305–307, Jun. 2018. [CrossRef]
- Esteva et al., “A guide to deep learning in healthcare,” Nat Med, vol. 25, no. 1, pp. 24–29, Jan. 2019. [CrossRef]
- E. J. Topol, “High-performance medicine: the convergence of human and artificial intelligence,” Nat Med, vol. 25, no. 1, pp. 44–56, Jan. 2019. [CrossRef]
- M. Capó, A. Pérez, and J. A. Lozano, “An efficient approximation to the K-means clustering for massive data,” Knowl Based Syst, vol. 117, no. 1, pp. 56–69, Feb. 2017. [CrossRef]
- T. Jolliffe and J. Cadima, “Principal component analysis: a review and recent developments,” Philosophical Transactions of the Royal Society A: Mathematical, Physical and Engineering Sciences, vol. 374, no. 2065, Apr. 2016. [CrossRef]
- L. McInnes, J. Healy, and J. Melville, “UMAP: Uniform Manifold Approximation and Projection for Dimension Reduction,” Journal of Machine Learning Research, Sep. 2020, [Online]. Available: http://arxiv.org/abs/1802. 0342.
- F. S. Apple, Y. Sandoval, A. S. Jaffe, and J. Ordonez-Llanos, “Cardiac Troponin Assays: Guide to Understanding Analytical Characteristics and Their Impact on Clinical Care,” Clin Chem, vol. 63, no. 1, pp. 73–81, Jan. 2017. [CrossRef]
- S. V Shah et al., “High sensitivity cardiac troponin and the under-diagnosis of myocardial infarction in women: prospective cohort study,” BMJ, vol. 350, no. 7992, p. g7873, Jan. 2015. [CrossRef]
- P. Cunningham and Z. Ghahramani, “Linear Dimensionality Reduction: Survey, Insights, and Generalizations,” Journal of Machine Learning Research, vol. 16, pp. 2859–2900, Jun. 2015.
- H. Abdi and L. J. Williams, “Principal component analysis,” WIREs Computational Statistics, vol. 2, no. 4, pp. 433–459, Jul. 2010. [CrossRef]
- D. Gonzalez-Franco, J. E. Preciado-Velasco, J. E. Lozano-Rizk, R. Rivera-Rodriguez, J. Torres-Rodriguez, and M. A. Alonso-Arevalo, “Comparison of Supervised Learning Algorithms on a 5G Dataset Reduced via Principal Component Analysis (PCA),” Future Internet, vol. 15, no. 10, Oct. 2023. [CrossRef]
- McInnes, J. Healy, N. Saul, and L. Großberger, “UMAP: Uniform Manifold Approximation and Projection,” J Open Source Softw, vol. 3, no. 29, p. 861, Sep. 2018. [CrossRef]
- D. Xu and Y. Tian, “A Comprehensive Survey of Clustering Algorithms,” Annals of Data Science, vol. 2, no. 2, pp. 165–193, Jun. 2015. [CrossRef]
- P. Bholowalia and A. Kumar, “EBK-Means: A Clustering Technique based on Elbow Method and K-Means in WSN,” Int J Comput Appl, vol. 105, no. 9, pp. 17–24, Nov. 2014, [Online]. Available: https://api.semanticscholar. 1759.
- O. Arbelaitz, I. Gurrutxaga, J. Muguerza, J. M. Pérez, and I. Perona, “An extensive comparative study of cluster validity indices,” Pattern Recognit, vol. 46, no. 1, pp. 243–256, Jan. 2013. [CrossRef]
- P. Schober, C. Boer, and L. A. Schwarte, “Correlation Coefficients: Appropriate Use and Interpretation,” Anesth Analg, vol. 126, no. 5, pp. 1763–1768, 18. 20 May. [CrossRef]
- P. K. Whelton et al., “ACC/AHA/AAPA/ABC/ACPM/AGS/APhA/ASH/ASPC/NMA/PCNA Guideline for the Prevention, Detection, Evaluation, and Management of High Blood Pressure in Adults,” J Am Coll Cardiol, vol. 71, no. 19, pp. e127–e248, 18. 20 May. [CrossRef]
- B. S. Everitt, S. Landau, M. Leese, and D. Stahl, Cluster Analysis, 5th ed. in Wiley Series in Probability and Statistics. UK: Wiley, 2011. [CrossRef]
- Van Der Maaten and, G. Hinton, “Visualizing Data using t-SNE,” Netherlands, Aug. 2008. Accessed: Oct. 25, 2024. [Online]. Available: https://jmlr.csail.mit.edu/papers/volume9/vandermaaten08a/vandermaaten08a.
- V. Regitz-Zagrosek and G. Kararigas, “Mechanistic Pathways of Sex Differences in Cardiovascular Disease,” Physiol Rev, vol. 97, no. 1, pp. 1–37, Jan. 2017. [CrossRef]
- E. A. Ashley, “The Precision Medicine Initiative,” JAMA, vol. 313, no. 21, p. 2119, Jun. 2015. [CrossRef]
- K. Thygesen et al., “Fourth Universal Definition of Myocardial Infarction (2018),” Circulation, vol. 138, no. 20, Nov. 2018. [CrossRef]
- Daccord et al., “High-quality de novo assembly of the apple genome and methylome dynamics of early fruit development,” Nat Genet, vol. 49, no. 7, pp. 1099–1106, Jul. 2017. [CrossRef]
- American Diabetes Association, “Standards of Medical Care in Diabetes—2021 Abridged for Primary Care Providers,” Clinical Diabetes, vol. 39, no. 1, pp. 14–43, Jan. 2021. [CrossRef]
- B. A. Swinburn et al., “The Global Syndemic of Obesity, Undernutrition, and Climate Change: The Lancet Commission report,” The Lancet, vol. 393, no. 10173, pp. 791–846, Feb. 2019. [CrossRef]
- M. Brownlee, “The Pathobiology of Diabetic Complications,” Diabetes, vol. 54, no. 6, pp. 1615–1625, Jun. 2005. [CrossRef]
- W. C. Knowler et al., “Reduction in the incidence of type 2 diabetes with lifestyle intervention or metformin.,” N Engl J Med, vol. 346, no. 6, pp. 393–403, Feb. 2002. [CrossRef]
- S. M. Grundy et al., “Diagnosis and management of the metabolic syndrome: an American Heart Association/National Heart, Lung, and Blood Institute Scientific Statement.,” Circulation, vol. 112, no. 17, pp. 2735–52, Oct. 2005. [CrossRef]
- V. Kumar, J. K. Thakur, and M. Prasad, “Histone acetylation dynamics regulating plant development and stress responses.,” Cell Mol Life Sci, vol. 78, no. 10, pp. 4467–4486, 21. 10.1007/s00018-021-03794-x. 20 May.
- E. J. Topol, “High-performance medicine: the convergence of human and artificial intelligence,” Nat Med, vol. 25, no. 1, pp. 44–56, Jan. 2019. [CrossRef]
Figure 1.
Block diagram of our proposal methodology.
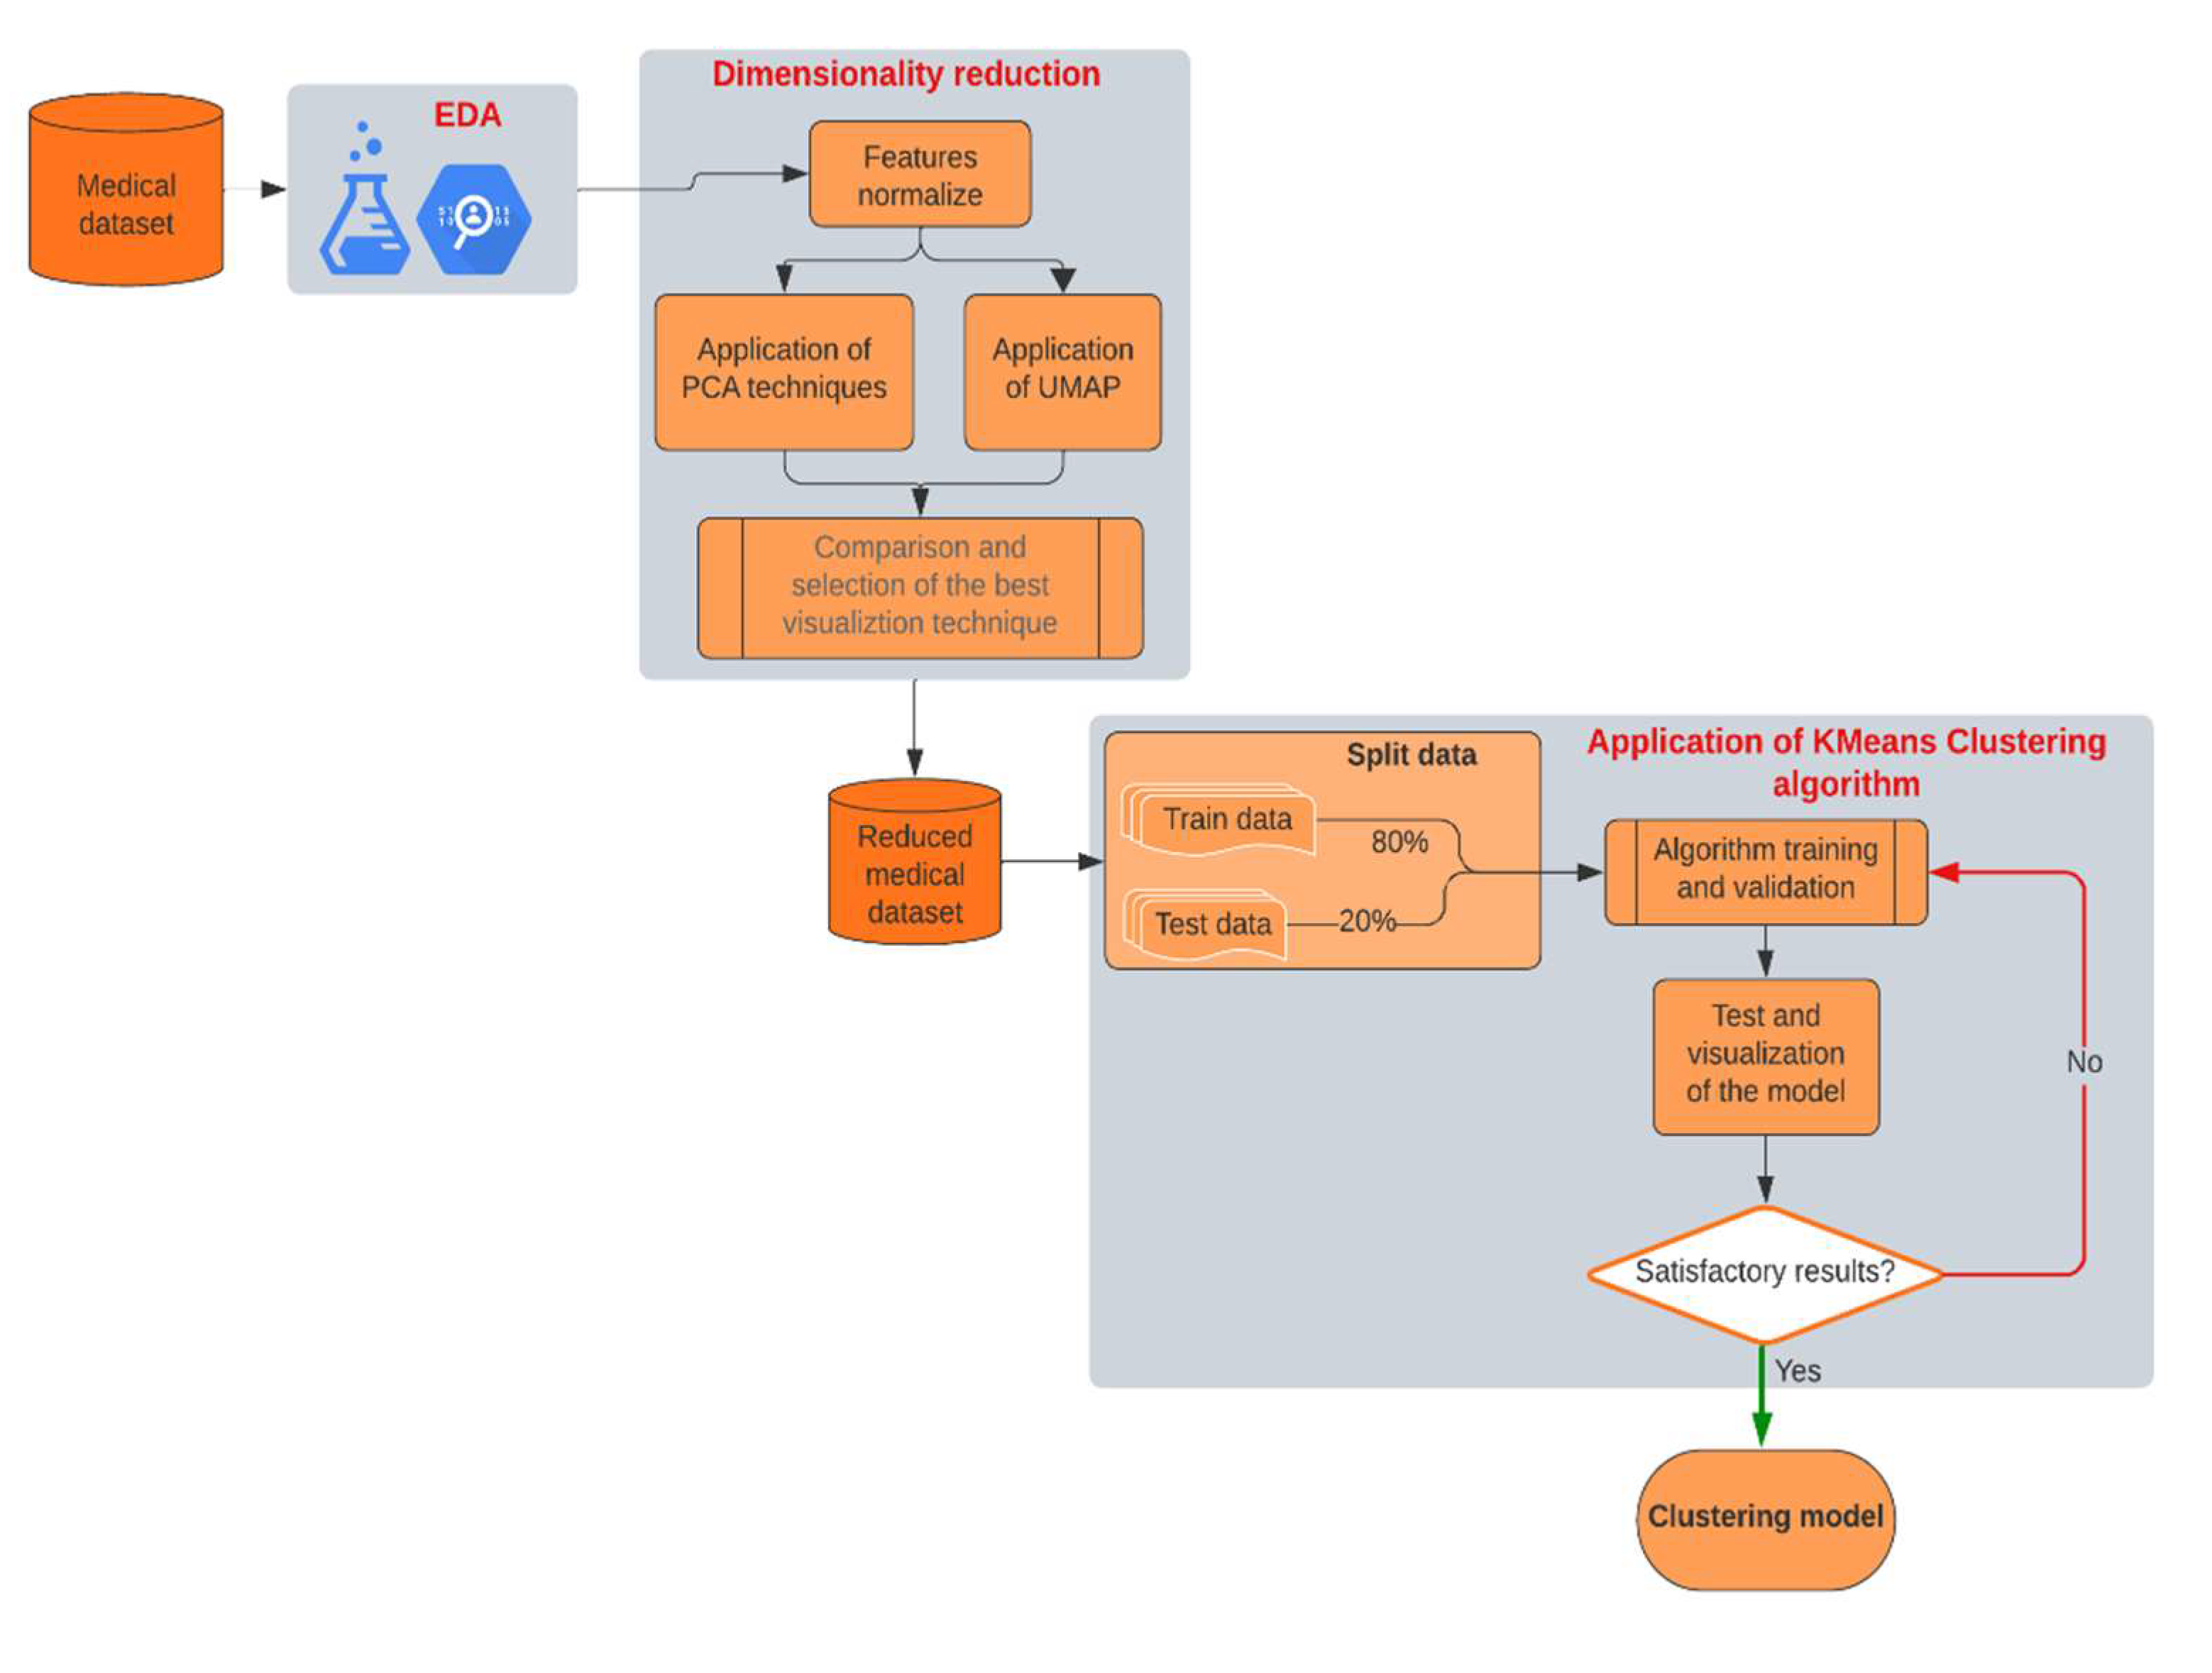
Figure 2.
Correlation matrix of the features.
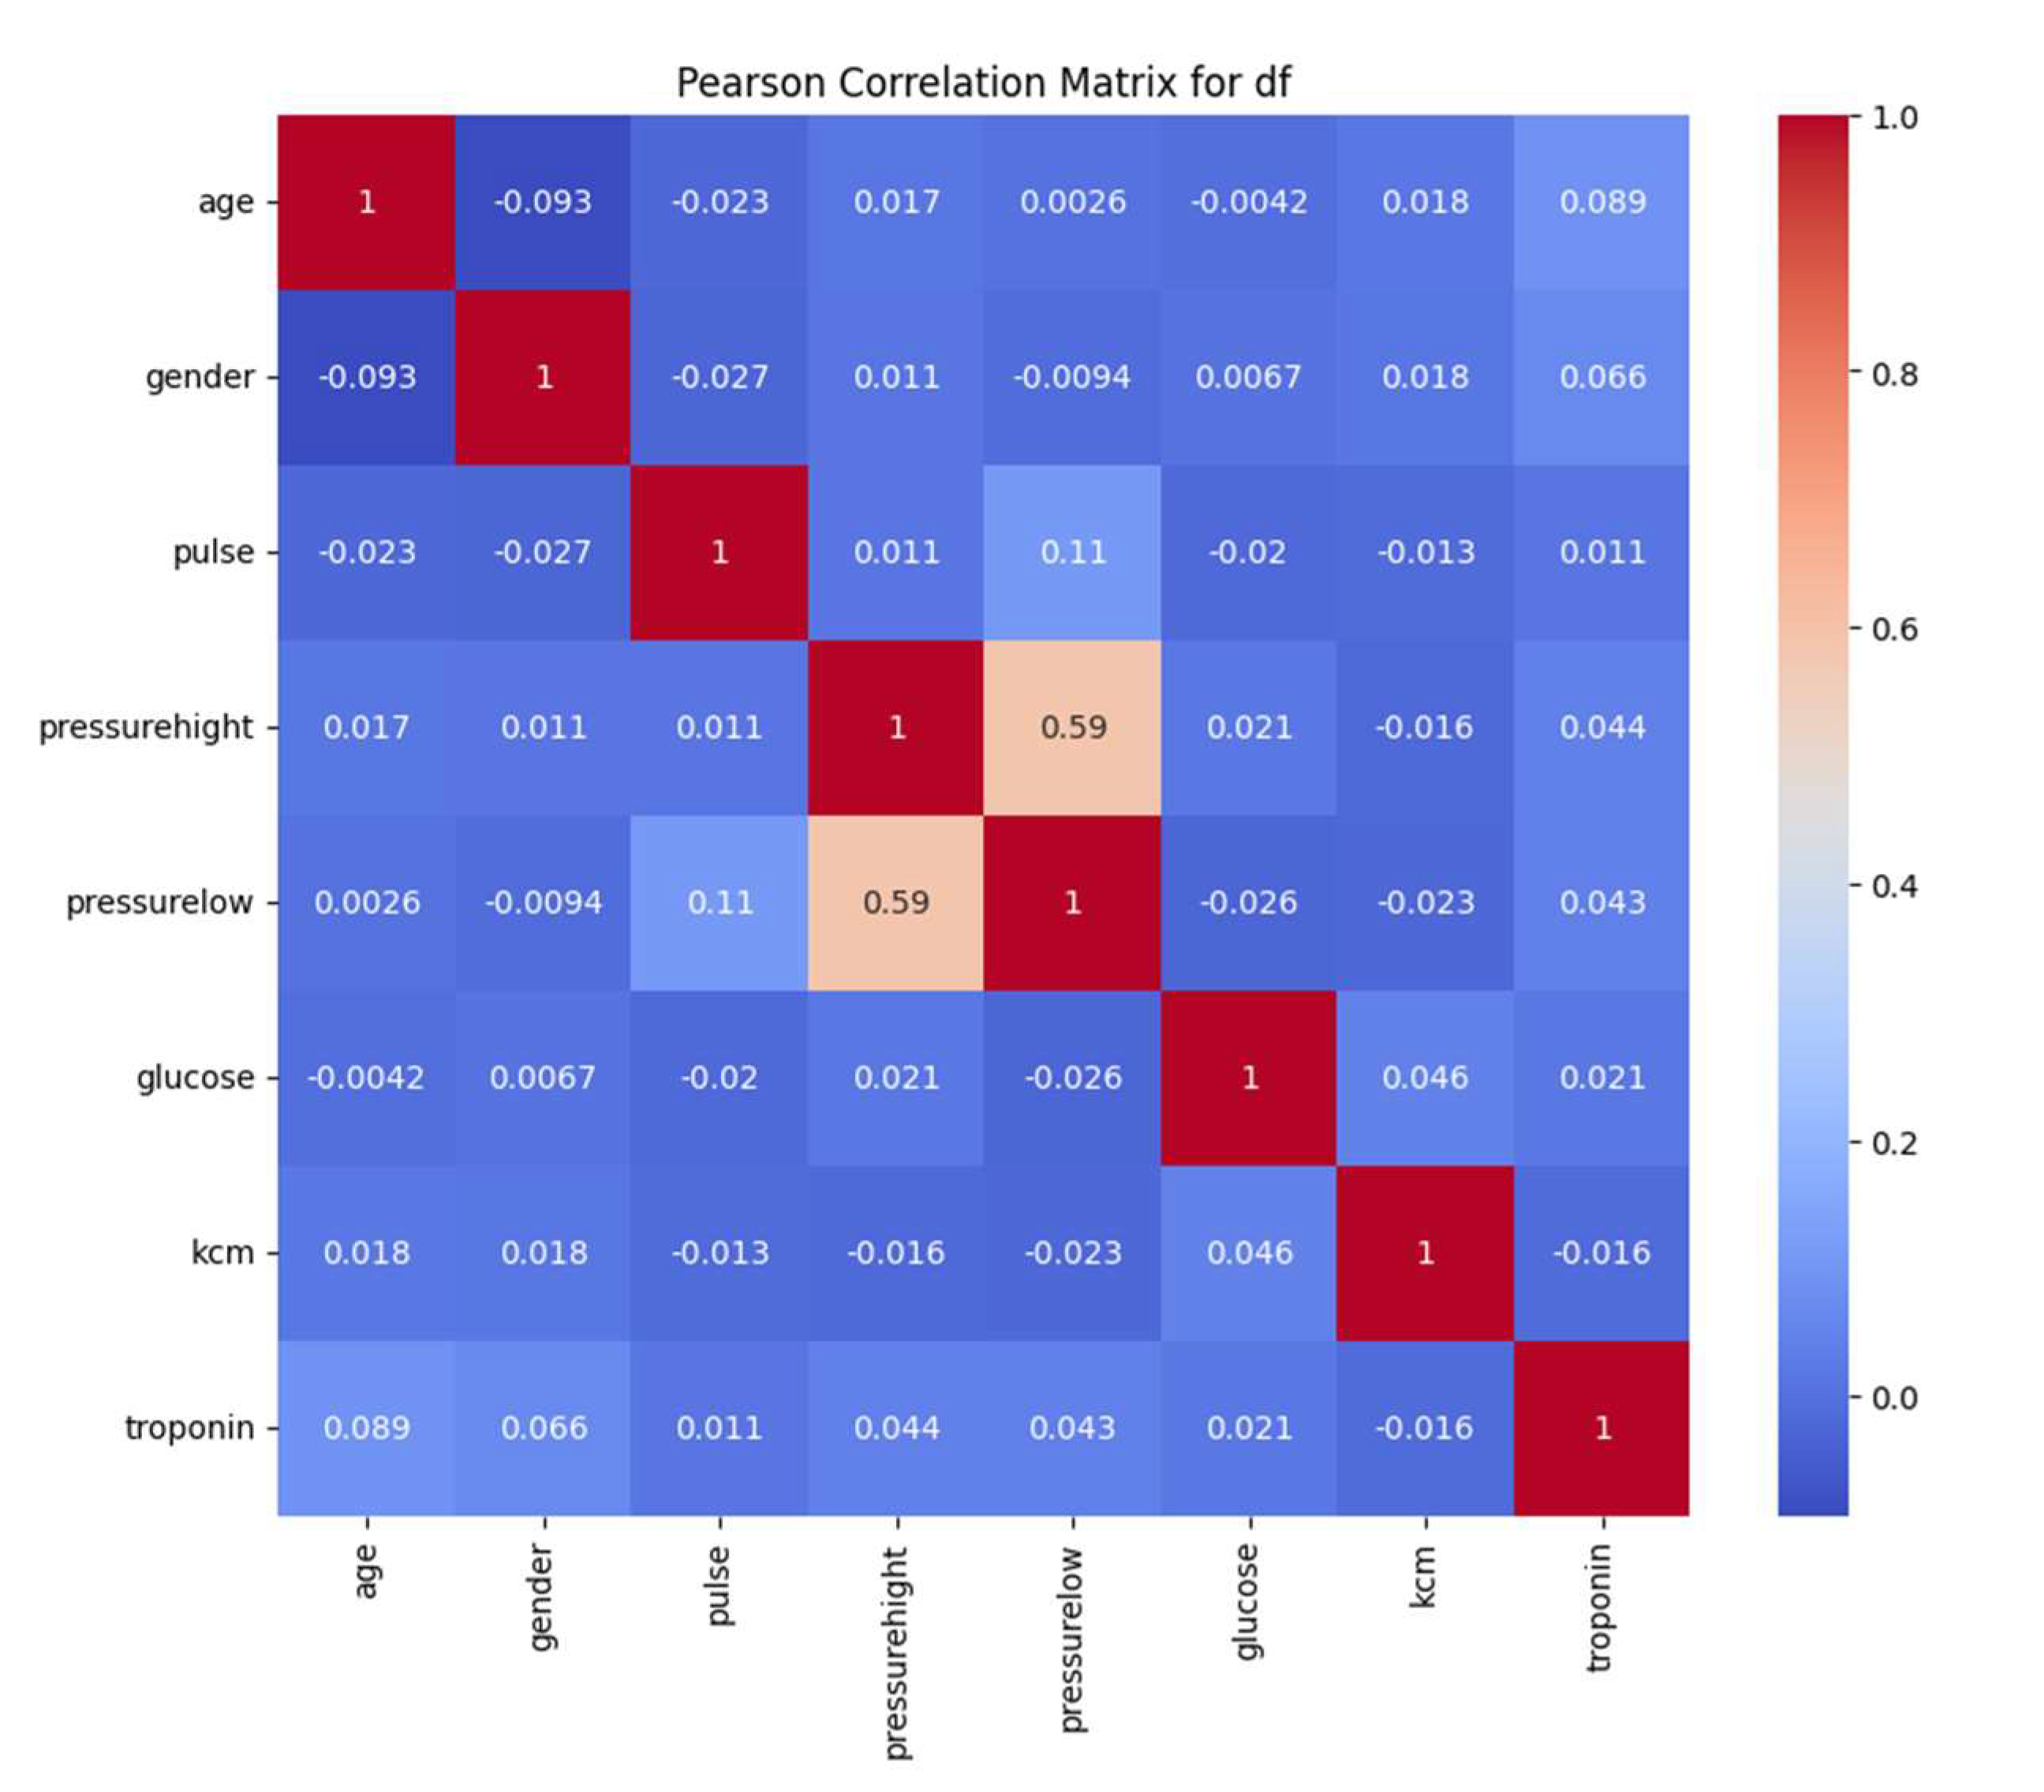
Figure 3.
Variance explained by each principal component.
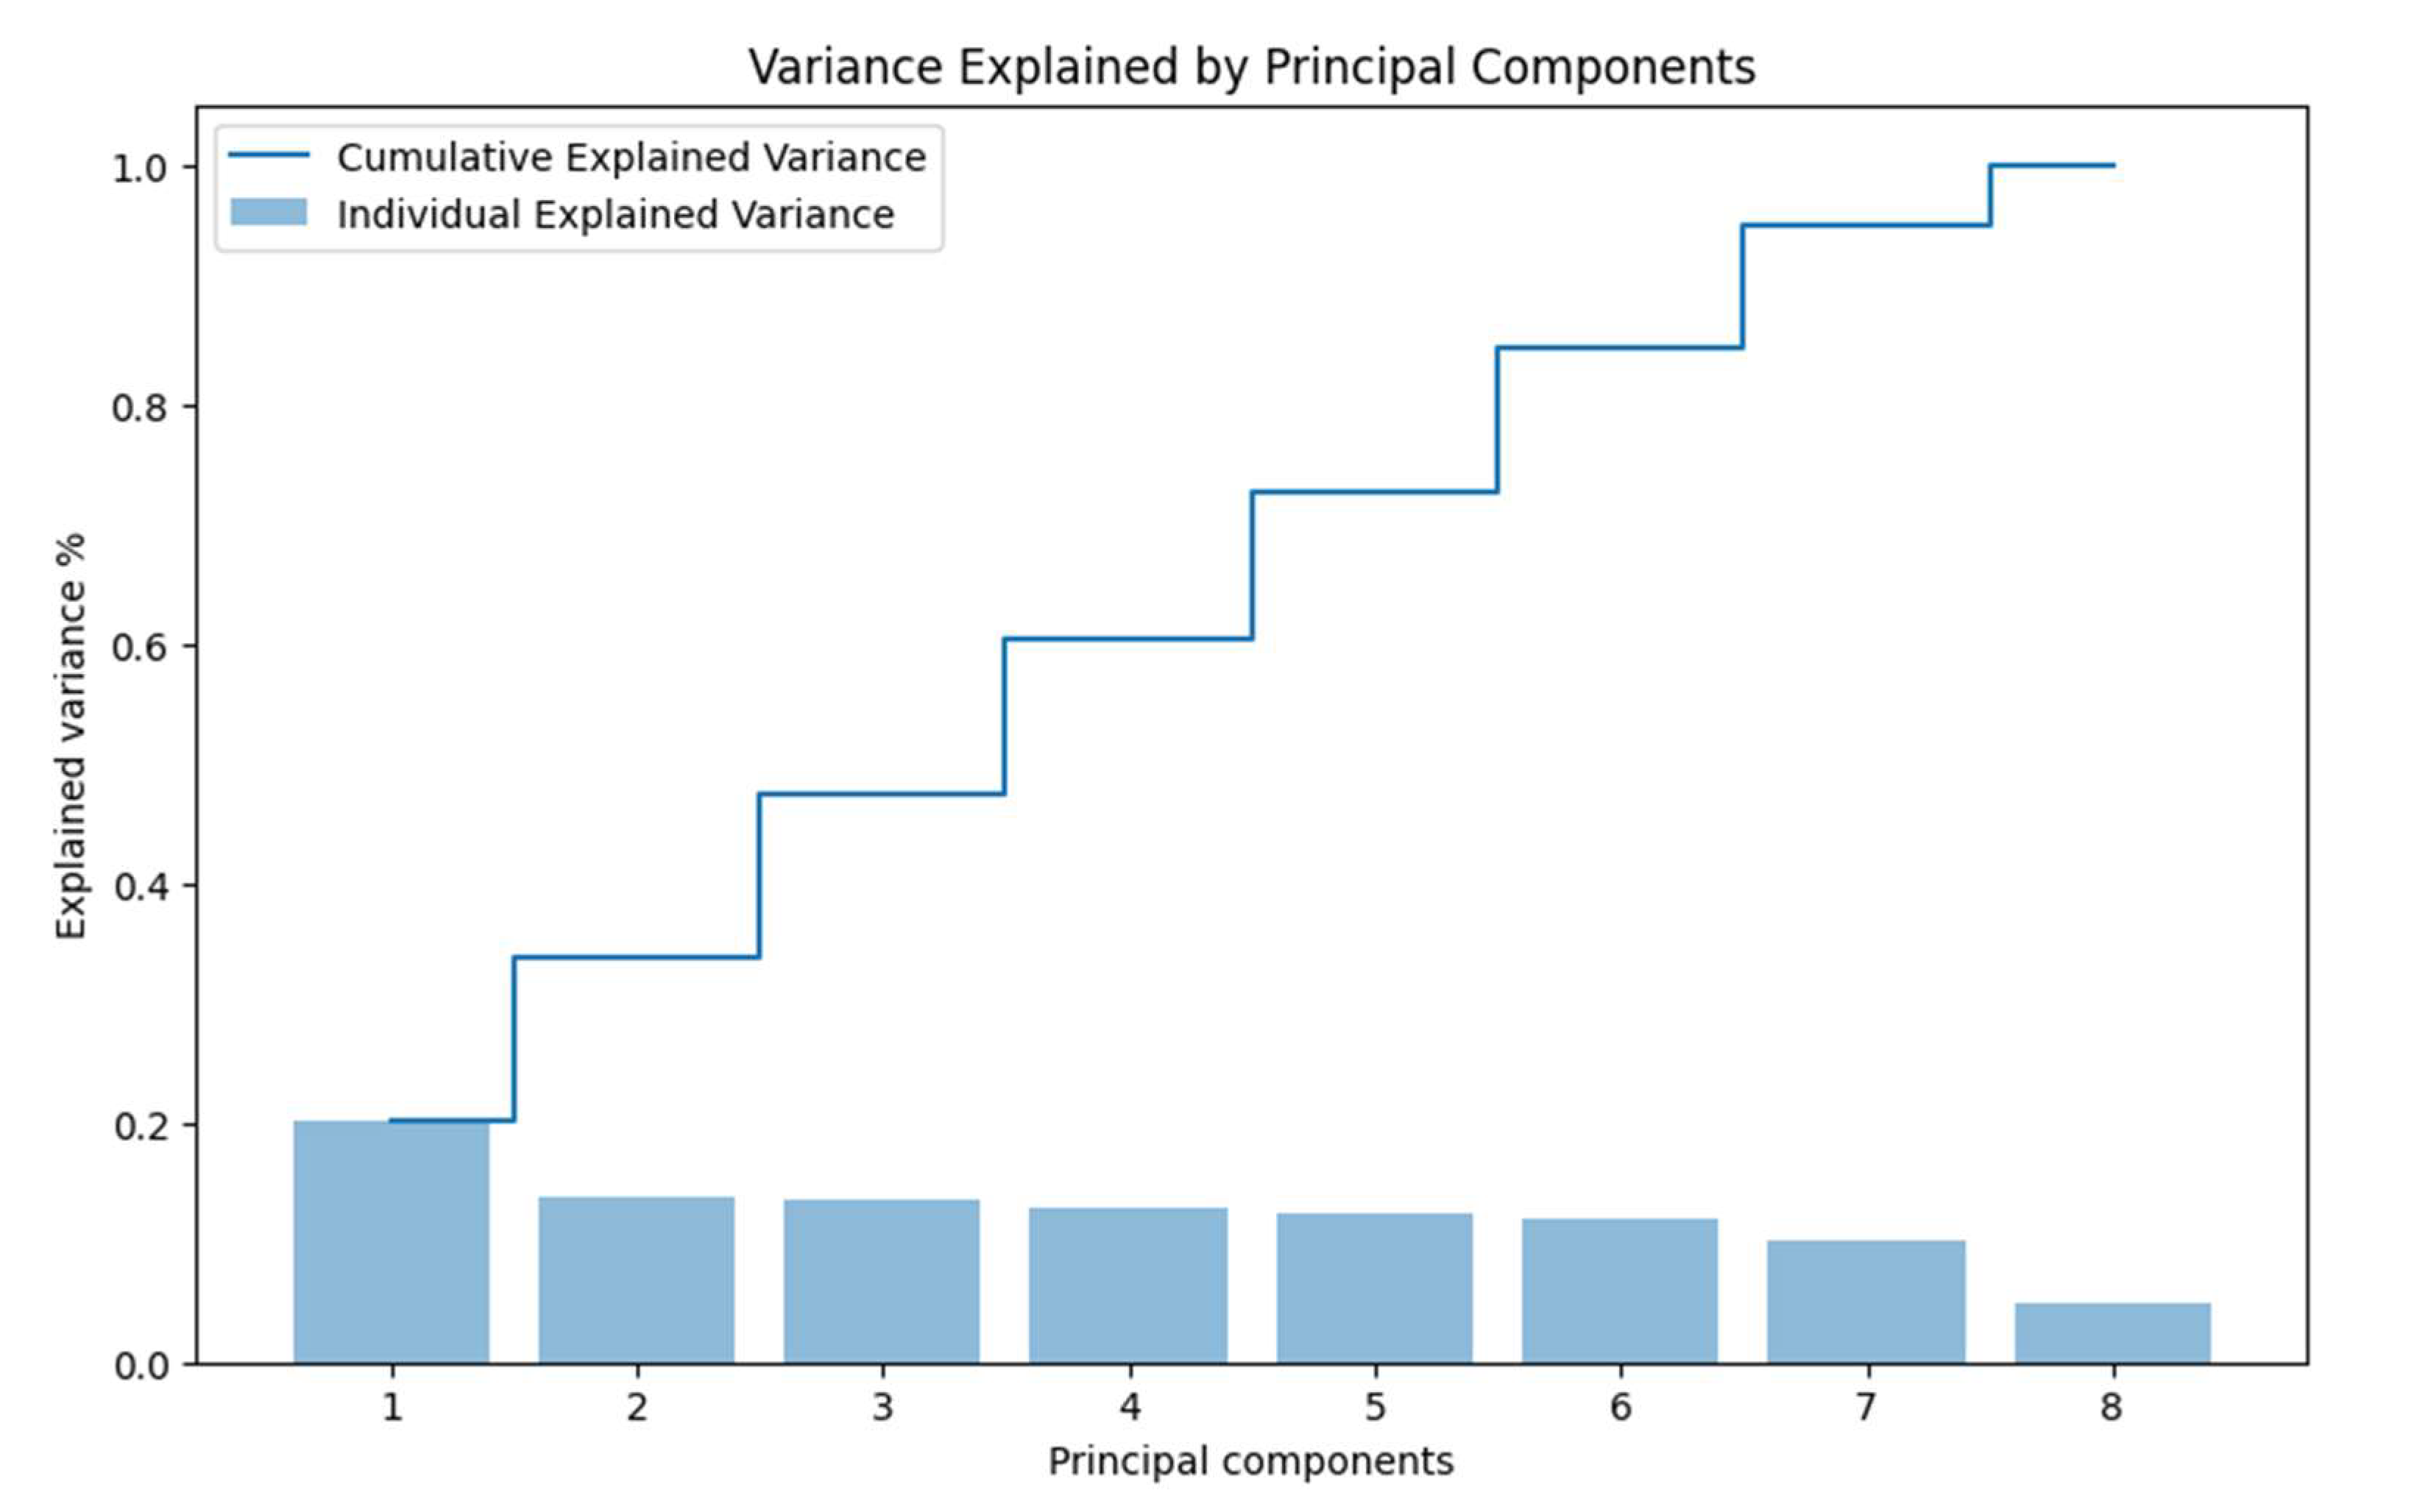
Figure 4.
Representation of two principal components.
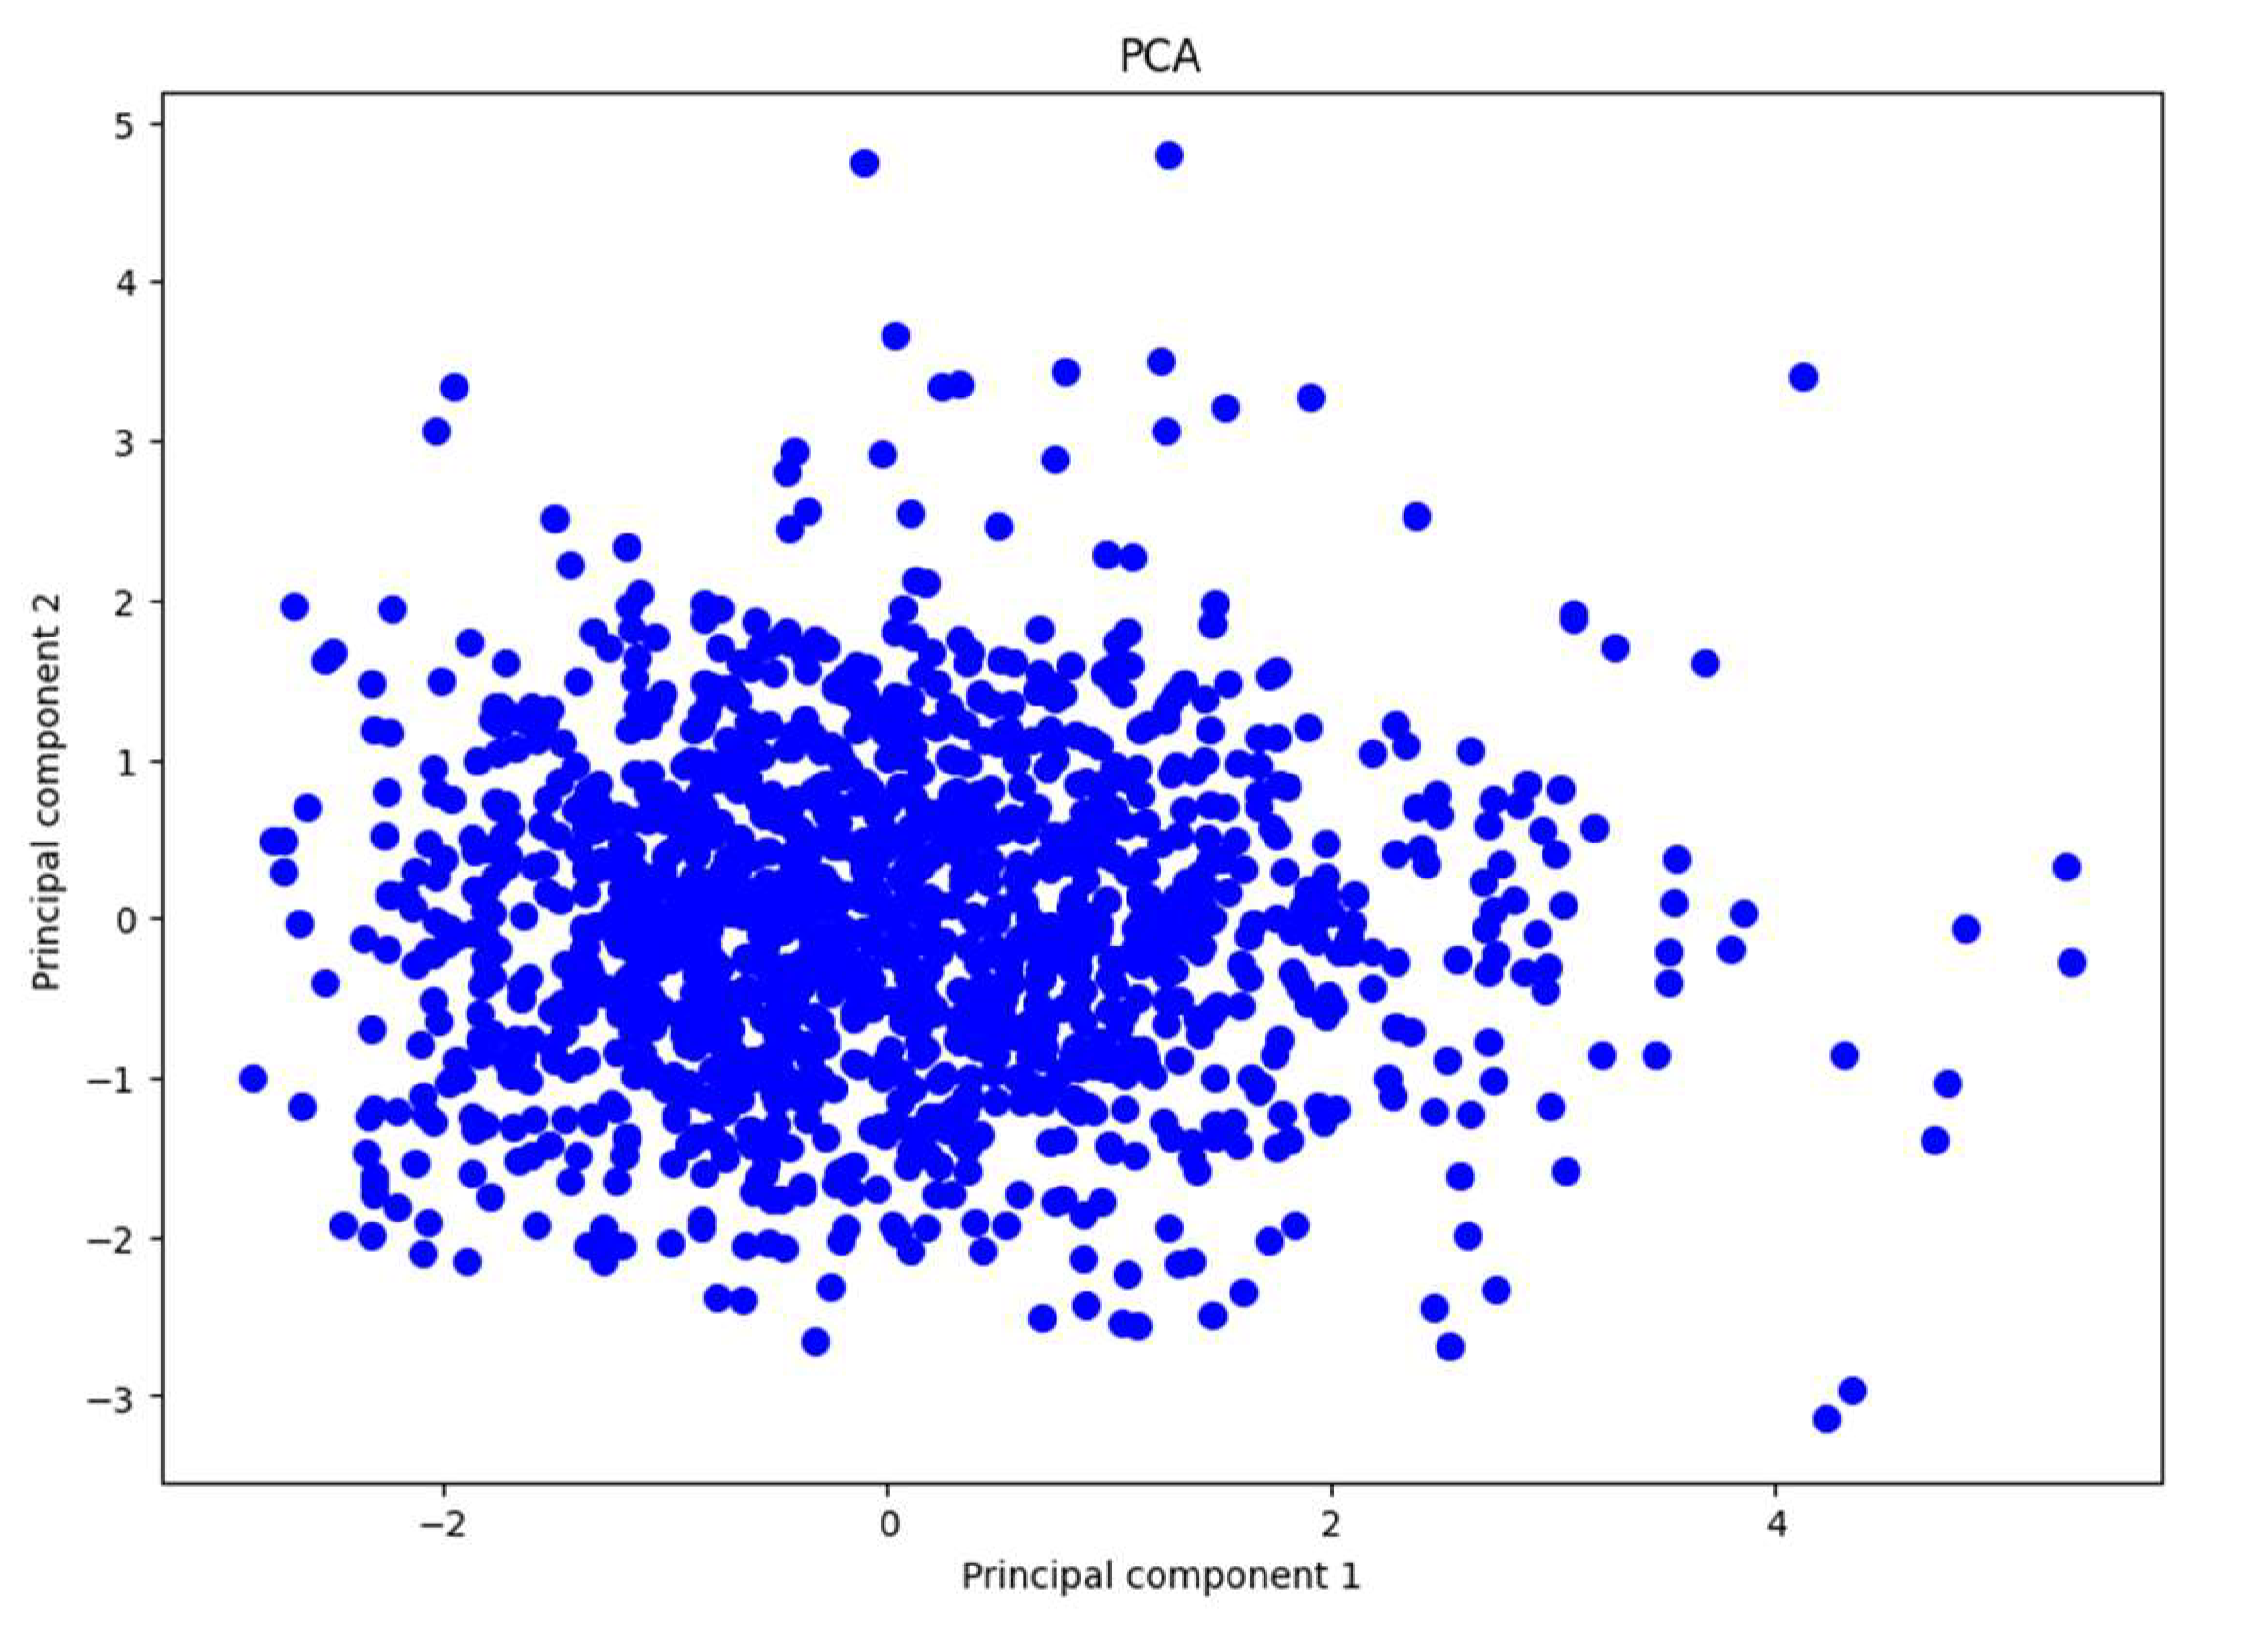
Figure 5.
UMAP representation by two components.
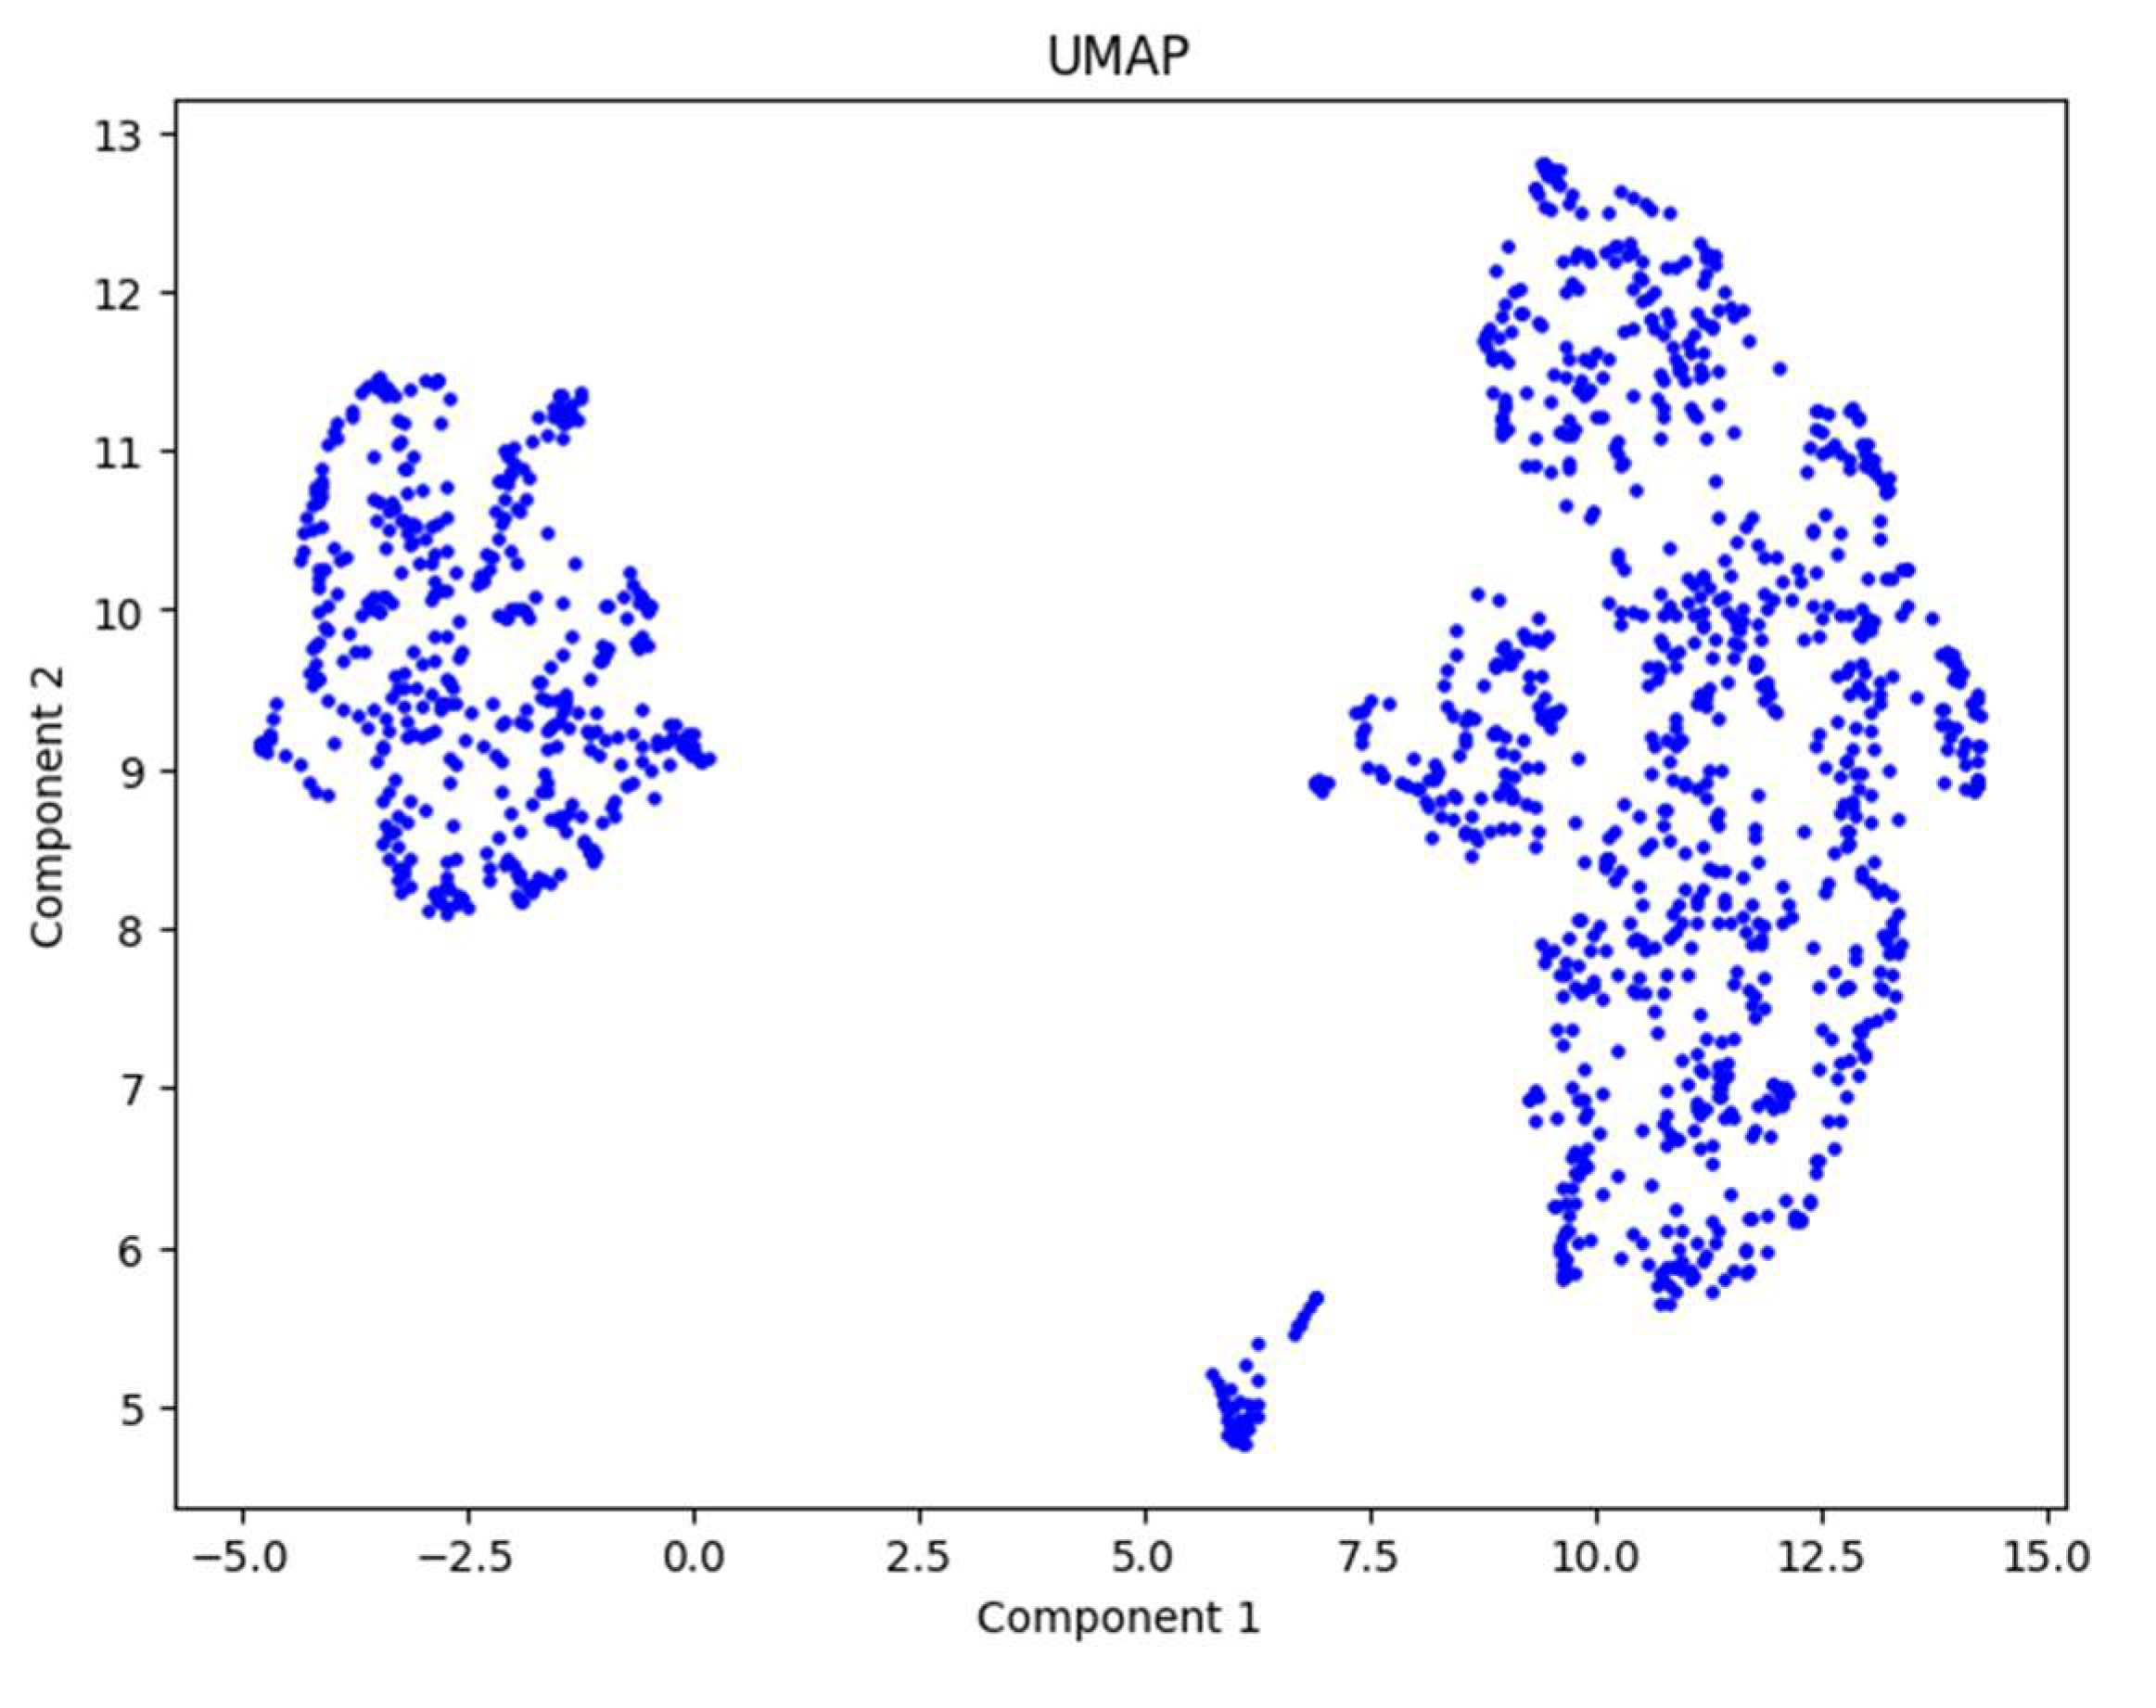
Figure 7.
Patients’ segmentation with K-means (K = 2).
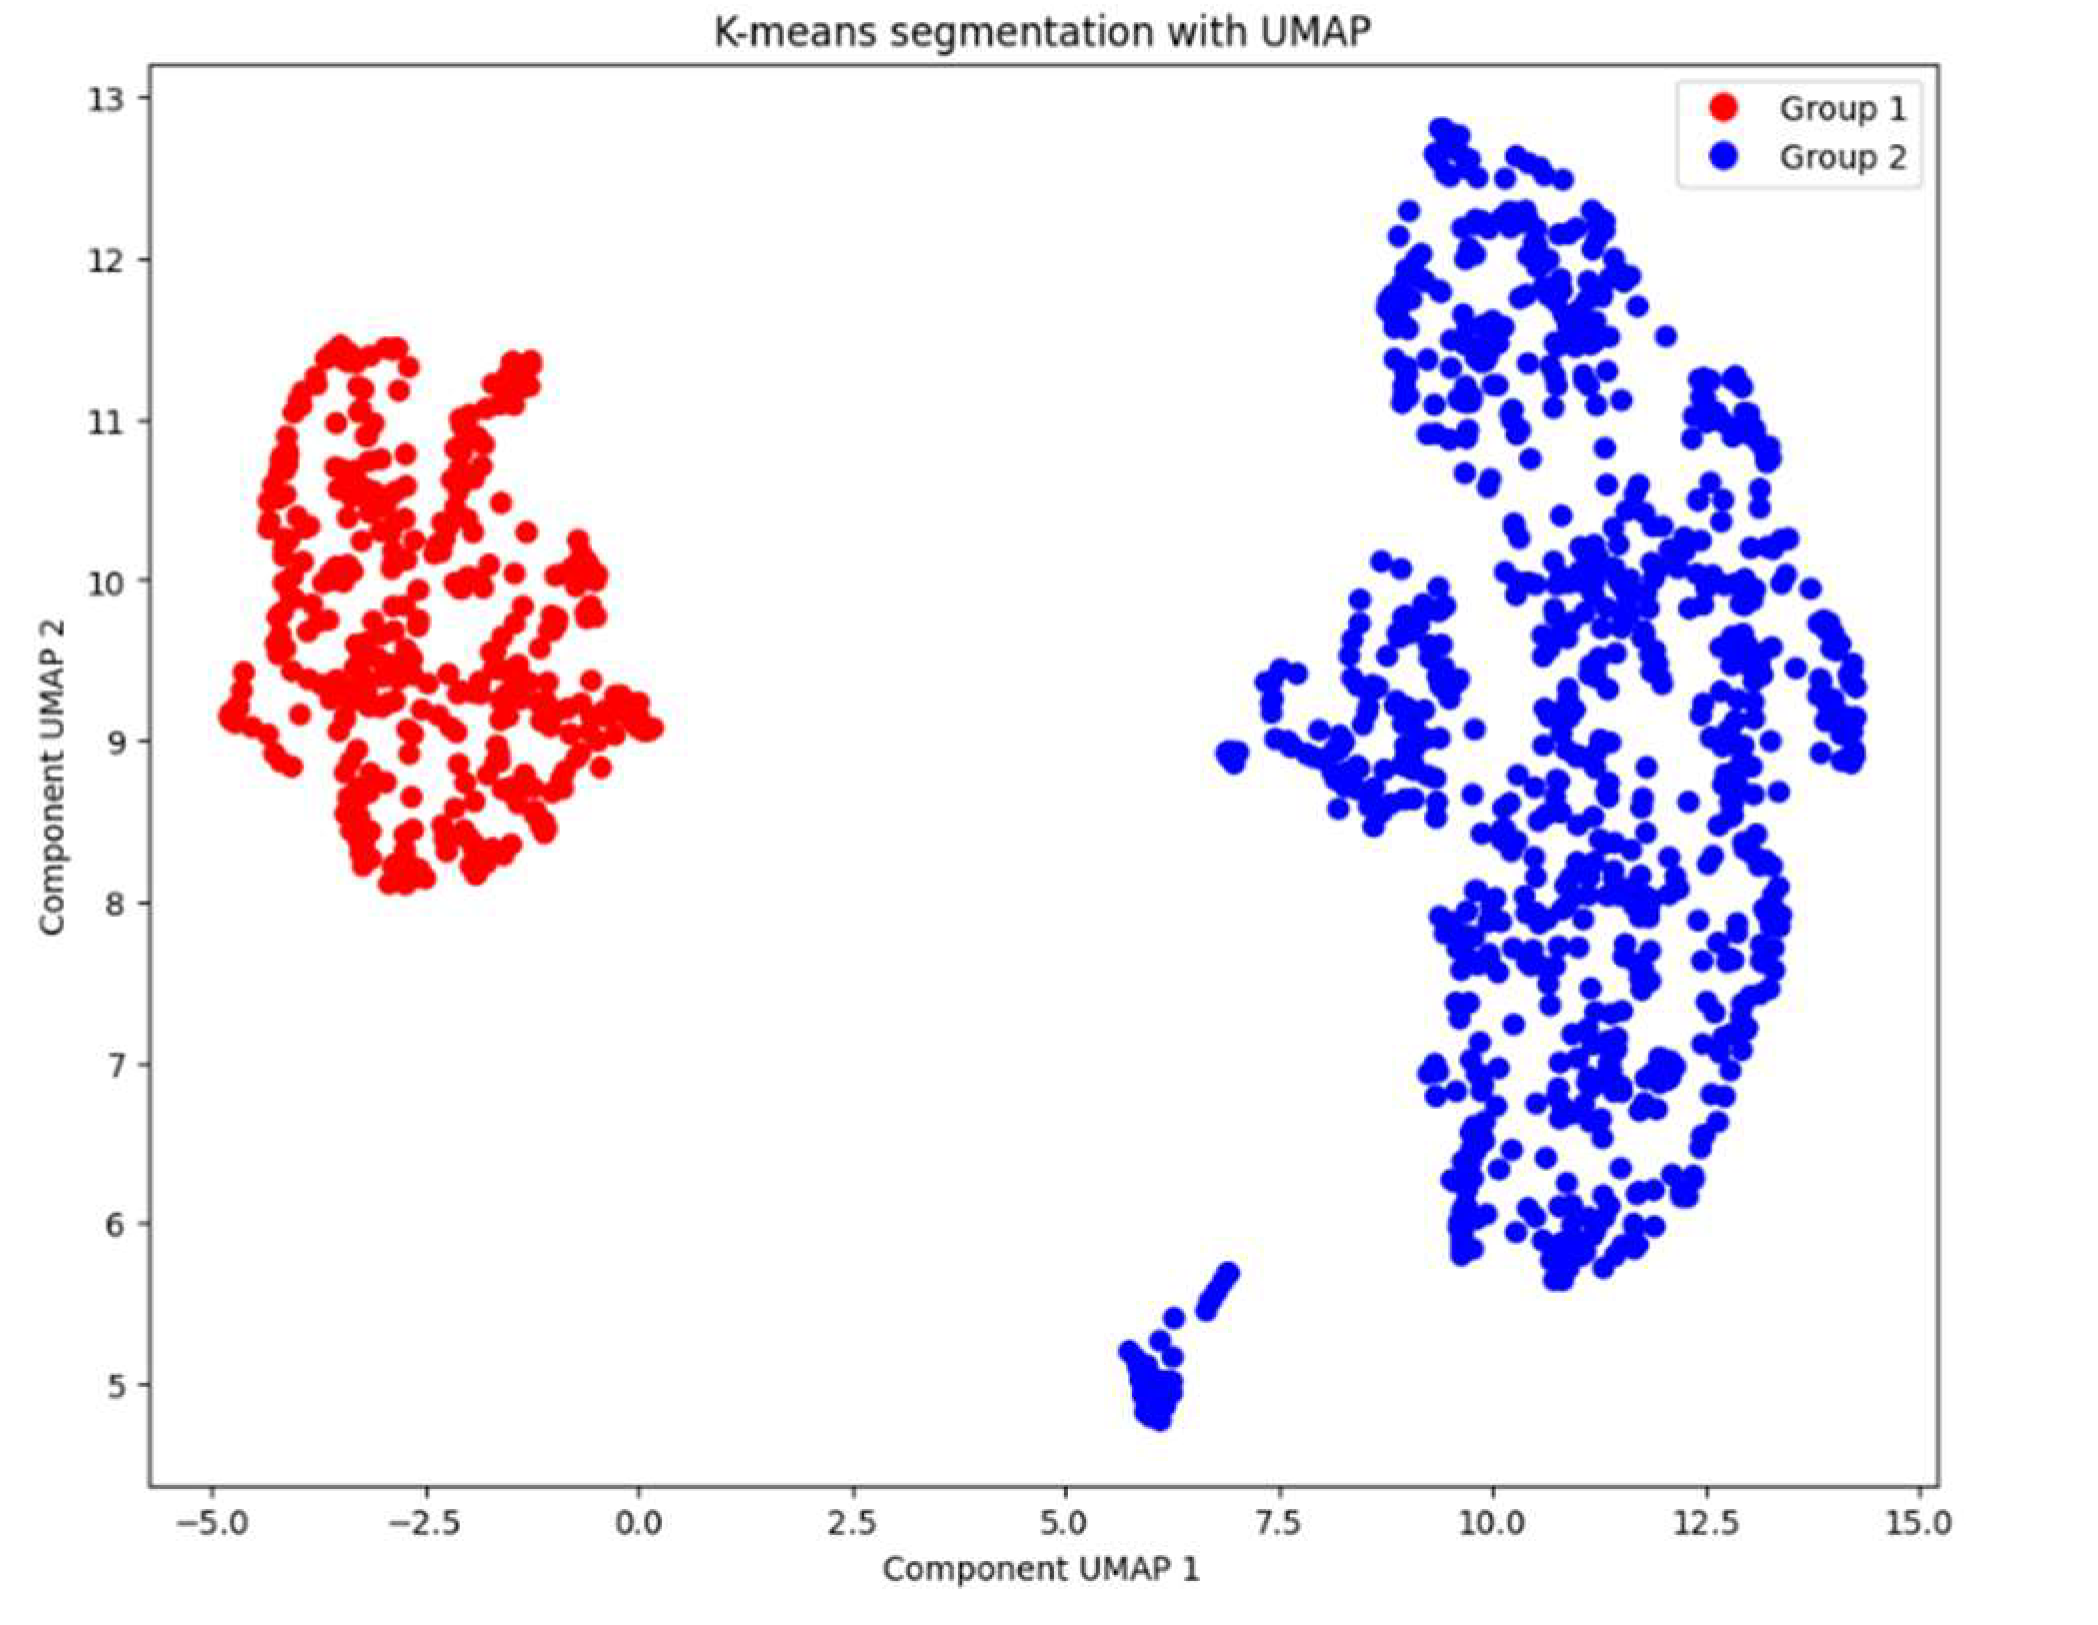
Table 1.
Statistical summary of dataset variables.
| age | pulse | Pressure_hight | Presurre_low | glucose | KCM | troponin | |
|---|---|---|---|---|---|---|---|
| Mean | 56.19 | 78.34 | 127.17 | 72.26 | 146.63 | 15.27 | 0.36 |
| Std | 13.65 | 51.63 | 26.12 | 14.03 | 74.92 | 46.33 | 1.15 |
| Min | 14 | 20 | 42 | 38 | 35 | 0.32 | 0.001 |
| 25% | 47 | 64 | 110 | 62 | 98 | 1.66 | 0.006 |
| 50% | 58 | 74 | 124 | 72 | 116 | 2.85 | 0.014 |
| 75% | 65 | 85 | 143 | 81 | 169 | 5.81 | 0.086 |
| max | 103 | 1111 | 223 | 154 | 541 | 300 | 10.3 |
Table 2.
Average Values of Key Variables in the Segmented Groups.
| Group 1 | Group 2 | |
|---|---|---|
| Age | 58 | 55 |
| Gender | Only 3% are men | 97% are men |
| Pressure_hight | 127 | 127 |
| Pressure_low | 73 | 72 |
| glucose | 143 | 150 |
| KCM | 8.18 | 18.65 |
| troponin | 0.1186 | 0.4761 |
Disclaimer/Publisher’s Note: The statements, opinions and data contained in all publications are solely those of the individual author(s) and contributor(s) and not of MDPI and/or the editor(s). MDPI and/or the editor(s) disclaim responsibility for any injury to people or property resulting from any ideas, methods, instructions or products referred to in the content. |
© 2025 by the authors. Licensee MDPI, Basel, Switzerland. This article is an open access article distributed under the terms and conditions of the Creative Commons Attribution (CC BY) license (http://creativecommons.org/licenses/by/4.0/).
Copyright: This open access article is published under a Creative Commons CC BY 4.0 license, which permit the free download, distribution, and reuse, provided that the author and preprint are cited in any reuse.


