Submitted:
04 March 2025
Posted:
05 March 2025
You are already at the latest version
Abstract
Medication adherence is a crucial factor for managing chronic conditions, especially in aging adults. Previous studies have identified predictors of medication adherence. However, current methods fail to capture the time-varying nature of how risk factors can influence adherence behavior. This objective of this study was to implement multitra-jectory group-based models to compare a time-varying to a time-fixed approach to identifying non-adherence risk factors. The study population were 11,068 Medicare beneficiaries aged 65 and older taking select medications for hypertension, high blood cholesterol, and oral diabetes medications, between 2008 and 2016. Time-fixed predictors (e.g., sex, education) were examined using generalized multinomial logistic regression, while time-varying predictors were explored through multitrajectory group-based modeling. Several predisposing, enabling, and need characteristics were identified as risk factors for following at least one non-adherence trajectory. Time-varying predictors displayed alternative representation of those risk factors, especially depression symptoms. This study highlights the dynamic nature of medication adherence predictors and the utility of multitrajectory modeling. Findings suggest targeted interventions can be developed by addressing the key time-varying factors affecting adherence.
Keywords:
Medication adherence [MeSH]
; Pharmacoepidemiology [MeSH]
; Aging
; multitrajectory group-based models
; group-based trajectory model
; risk-factors
1. Introduction
Non-adherence to medications is a major barrier to achieve desired outcomes, that improve clinical outcomes and improve health status.[1,2,3,4,5,6,7,8] In 2003, the World Health Organization issued a report in 2003 highlighting the multifactorial causes of non-adherence, including socioeconomic, health care team and health system, disease-related, therapy-related, and patient-related factors.[8,9] These factors align with the Andersen’s Behavior Model of Health Services Use (ABM), a widely used theoretical framework in health services research. Originally developed to study the family health service use, ABM is now used to explain interactions with medication use.[10,11] Its dimensions - predisposing characteristics (e.g., socio-demographic, social structure, and health beliefs), resources (personal, family, and community), and need (health status, comorbidities, treatment complexity, and patient’s independence) overlap conceptually with the WHO’s non-adherence factors (Table 1).
Researchers increasingly use group-based trajectory modeling (GBTM) to analyze patterns of medication adherence across various prescription drugs.[12,13,14,15,16,17,18] Unlike categorizing patients as adherent or non-adherent, GBTM identifies similar adherence trajectories over time.[19] Previous studies primarily focused on predisposing characteristics, such as education, sex, ethnicity and race, or a single need characteristic, like comorbidities. However, adherence trajectories and their predictors can change over time, as risk factors for non-adherence do not occur in isolation or simultaneously. Traditional methods identify predictors by estimating their effects while holding other variables constant, focusing on fixed aspects influencing behavior over time.[20,21] Yet, time-varying factors like income, Medicaid eligibility, family support (e.g., spouse loss, household changes), and ambulatory independence may have a fluid combined impact on adherence. Multitrajectory group-based modeling, an extension of GBTM, examines how such dynamic factors contemporaneously influence outcomes. This conceptual study used this method to describe the time-varying predictors of previously identified medication adherence trajectories. (Figure 1)
2. Methods
Group-Based Trajectory Models (GBTM) of Medication Adherence
This study ran a post-hoc analysis of GBTM models previously estimated from monthly measurements of the proportion of days covered (PDC) to describe the longitudinal patterns of medication adherence of Medicare beneficiaries ≥65 years old between January 2008 and December 2016.[22] The GBTM models were derived from participants from the Health and Retirement Study (HRS), which is a longitudinal panel study with a nationally representative sample of approximately 20,000 people in the United States sponsored by the National Institute of Aging (grant number NIA U01AG009740) and is conducted by the University of Michigan. Patients were taking select antihypertensives, including renin-angiotensin-aldosterone system inhibitors (RAAS), HMG Co-A reductase inhibitors (statins), or oral diabetes medications during the follow-up period.[22] The inclusion and exclusion criteria are described elsewhere, as well as complete list of drugs included in the GBTM models.[22] In short, the GBTM models yielded three different models based on the drug class: select antihypertensives, with 3 trajectories (high to very high adherence, slow decline, and rapid decline), statins, yielding 5 trajectories (high to very high adherence, slow decline, low then increasing adherence, moderate decline, and rapid decline), and oral antidiabetics, that revealed 6 trajectories (high to very high adherence, slow decline, high then increasing adherence, low then increasing, moderate decline, and rapid decline. This study was approved by the Virginia Commonwealth University Internal Review Board (IRB) and the University of Michigan. Linked administrative health claims data from Medicare were obtained through CMS’s 3rd party data providers ResDAC and MedRIC.
Predictors of Medication Adherence Trajectories
Measurements informing the covariates were obtained from the RAND longitudinal data file of the HRS public survey, including Sections A through K, respective to the period of analysis of medication adherence: 2008-2016.[23] The relationship between predisposing, antecedents, enabling, and need characteristics (Appendix A) was examined in two ways. Firstly, using a time-stable approach, in which the last observation of each characteristic was investigated in the appropriate risk factor variation regression model. Secondly, through a time-varying approach in which repeated measures of each characteristic were explored in a multi-trajectory group-based method. To minimize the impact of missing data, the last observation was carried forward in the time-varying approach. Only complete cases were considered in the final analysis. All statistical analyses were conducted using STATA MP 17.[24]
Time-Stable Predictors
A risk factor variation was implemented in the GBTM medication adherence model to examine which non-modifiable covariate was associated with membership to medication adherence trajectories for each of the 3 pharmacotherapeutic drug classes. This was achieved by performing a generalized logistic regression to each of the group-based trajectory models, in which time-stable covariates are tested for their ability to change group-membership probability.[25] Each covariate was investigated individually, followed by an adjusted model including all covariates found to be statistically significant in predicting membership at least one medication adherence trajectory. Regression estimates, odds ratios, standard errors, and p-values were estimated to demonstrate the strength of association between each covariate and trajectory membership. To examine the potential for multicollinearity, variance inflation factor (VIF) was computed to determine by how much each risk factor estimate is increased because of the high correlation with other risk factors. When VIF is equal to 1, the coefficient of determination (R2) = 0, which means that the risk factor is not linearly related to other variables.[26] Therefore, a VIF greater than 5 was considered to be an indication of multicollinearity.[27]
Time-Varying Predictors
A multi-trajectory group-based model was used to examine how time-varying covariates influence membership probabilities across medication adherence trajectories for hypertension, hypercholesterolemia, and diabetes. This model incorporates the previously identified adherence trajectories while simultaneously plotting changes in time-varying predictors.[20] Similar methods have been applied in studying chronic kidney disease.[28] Unlike standard GBTM, this approach calculates conditional probabilities of trajectory membership for additional predictors beyond the first, allowing for a more comprehensive description of multiple risk factors.[20,25] Finally, since measurements of the predictors of medication adherence were obtained every two years, each annual measurement was matched with every 24 months of medication adherence follow-up period.
3. Results
In total, 11,068 participants were included in this post-hoc analysis as those identified taking RAAS, statins, or oral diabetes medications between 2008 and 2016. The predisposing, enabling, and need characteristics are described in Table 2. Missingness was noteworthy in all the characteristics. The number of observations (n) indicated for each characteristic and the proportion of missingness are represented in Table 2.
Time-Fixed Predictors of Medication Adherence Trajectories
A risk factor variation implemented in each group-based trajectory model of medication adherence estimated elsewhere.[22] All risk factors included in each trajectory model displayed a VIF < 5, suggesting negligible evidence of multicollinearity (Appendix B). The risk factor variation was achieved by performing a generalized logistic regression with each of the group-based trajectory models, in which time-stable covariates are tested for their ability to change group-membership probability, considering high to very adherence trajectory group as reference. Regression estimates, adjusted odds ratios (aOR), standard errors, and p-values were estimated to demonstrate the strength of association between each predisposing, enabling, or need characteristic and the likelihood of medication adherence trajectory membership, assuming the high to very adherence trajectory as the reference group in each model (Table 3, Table 4, Table 5, Table 6 and Table 7).
Time-Varying Predictors of Medication Adherence Trajectories
A multi group-based trajectory analysis was implemented to investigate if and to what extent each of the time-varying enabling and need characteristics are associated with changes in medication adherence trajectories in each medication adherence model. Figure 2, Figure 3 and Figure 4 describe the multi group-based trajectory models for the select antihypertensives, statins, and diabetes medications respectively.
- 1. Enabling characteristics
- Self-reported health status
In the antihypertensives model, better health status correlated with high adherence, with minimal shifts across trajectories. Slow decline showed worse health than high adherence but better than rapid decline. For statins and diabetes models, health status remained stable across trajectories, ranging from Good to Fair.
- Depression Symptoms
In the antihypertensives model, depression increased in rapid decline, remained stable in slow decline, and declined sharply in high adherence. Statins and diabetes models showed similar patterns, with low, stable depression in high adherence, and sharp increases in moderate and rapid decline trajectories.
- Life satisfaction
High adherence groups improved in life satisfaction over time, while slow decline showed stability. Statins showed the sharpest decline in moderate decline trajectories. Diabetes models exhibited no major changes, with all groups scoring as very satisfied.
- Retirement satisfaction
No significant trends emerged across trajectories in any model, with retirement satisfaction remaining constant for every trajectory in all three models.
- Limitations in work due to health
High to very high adherence groups showed declining limitations, while slow decline and other trajectories increased. Trajectories in the statins model saw rising limitations overall, with high adherence starting from the lowest baseline. The diabetes models displayed similar increases across all trajectory groups.
- 2. Needs characteristics
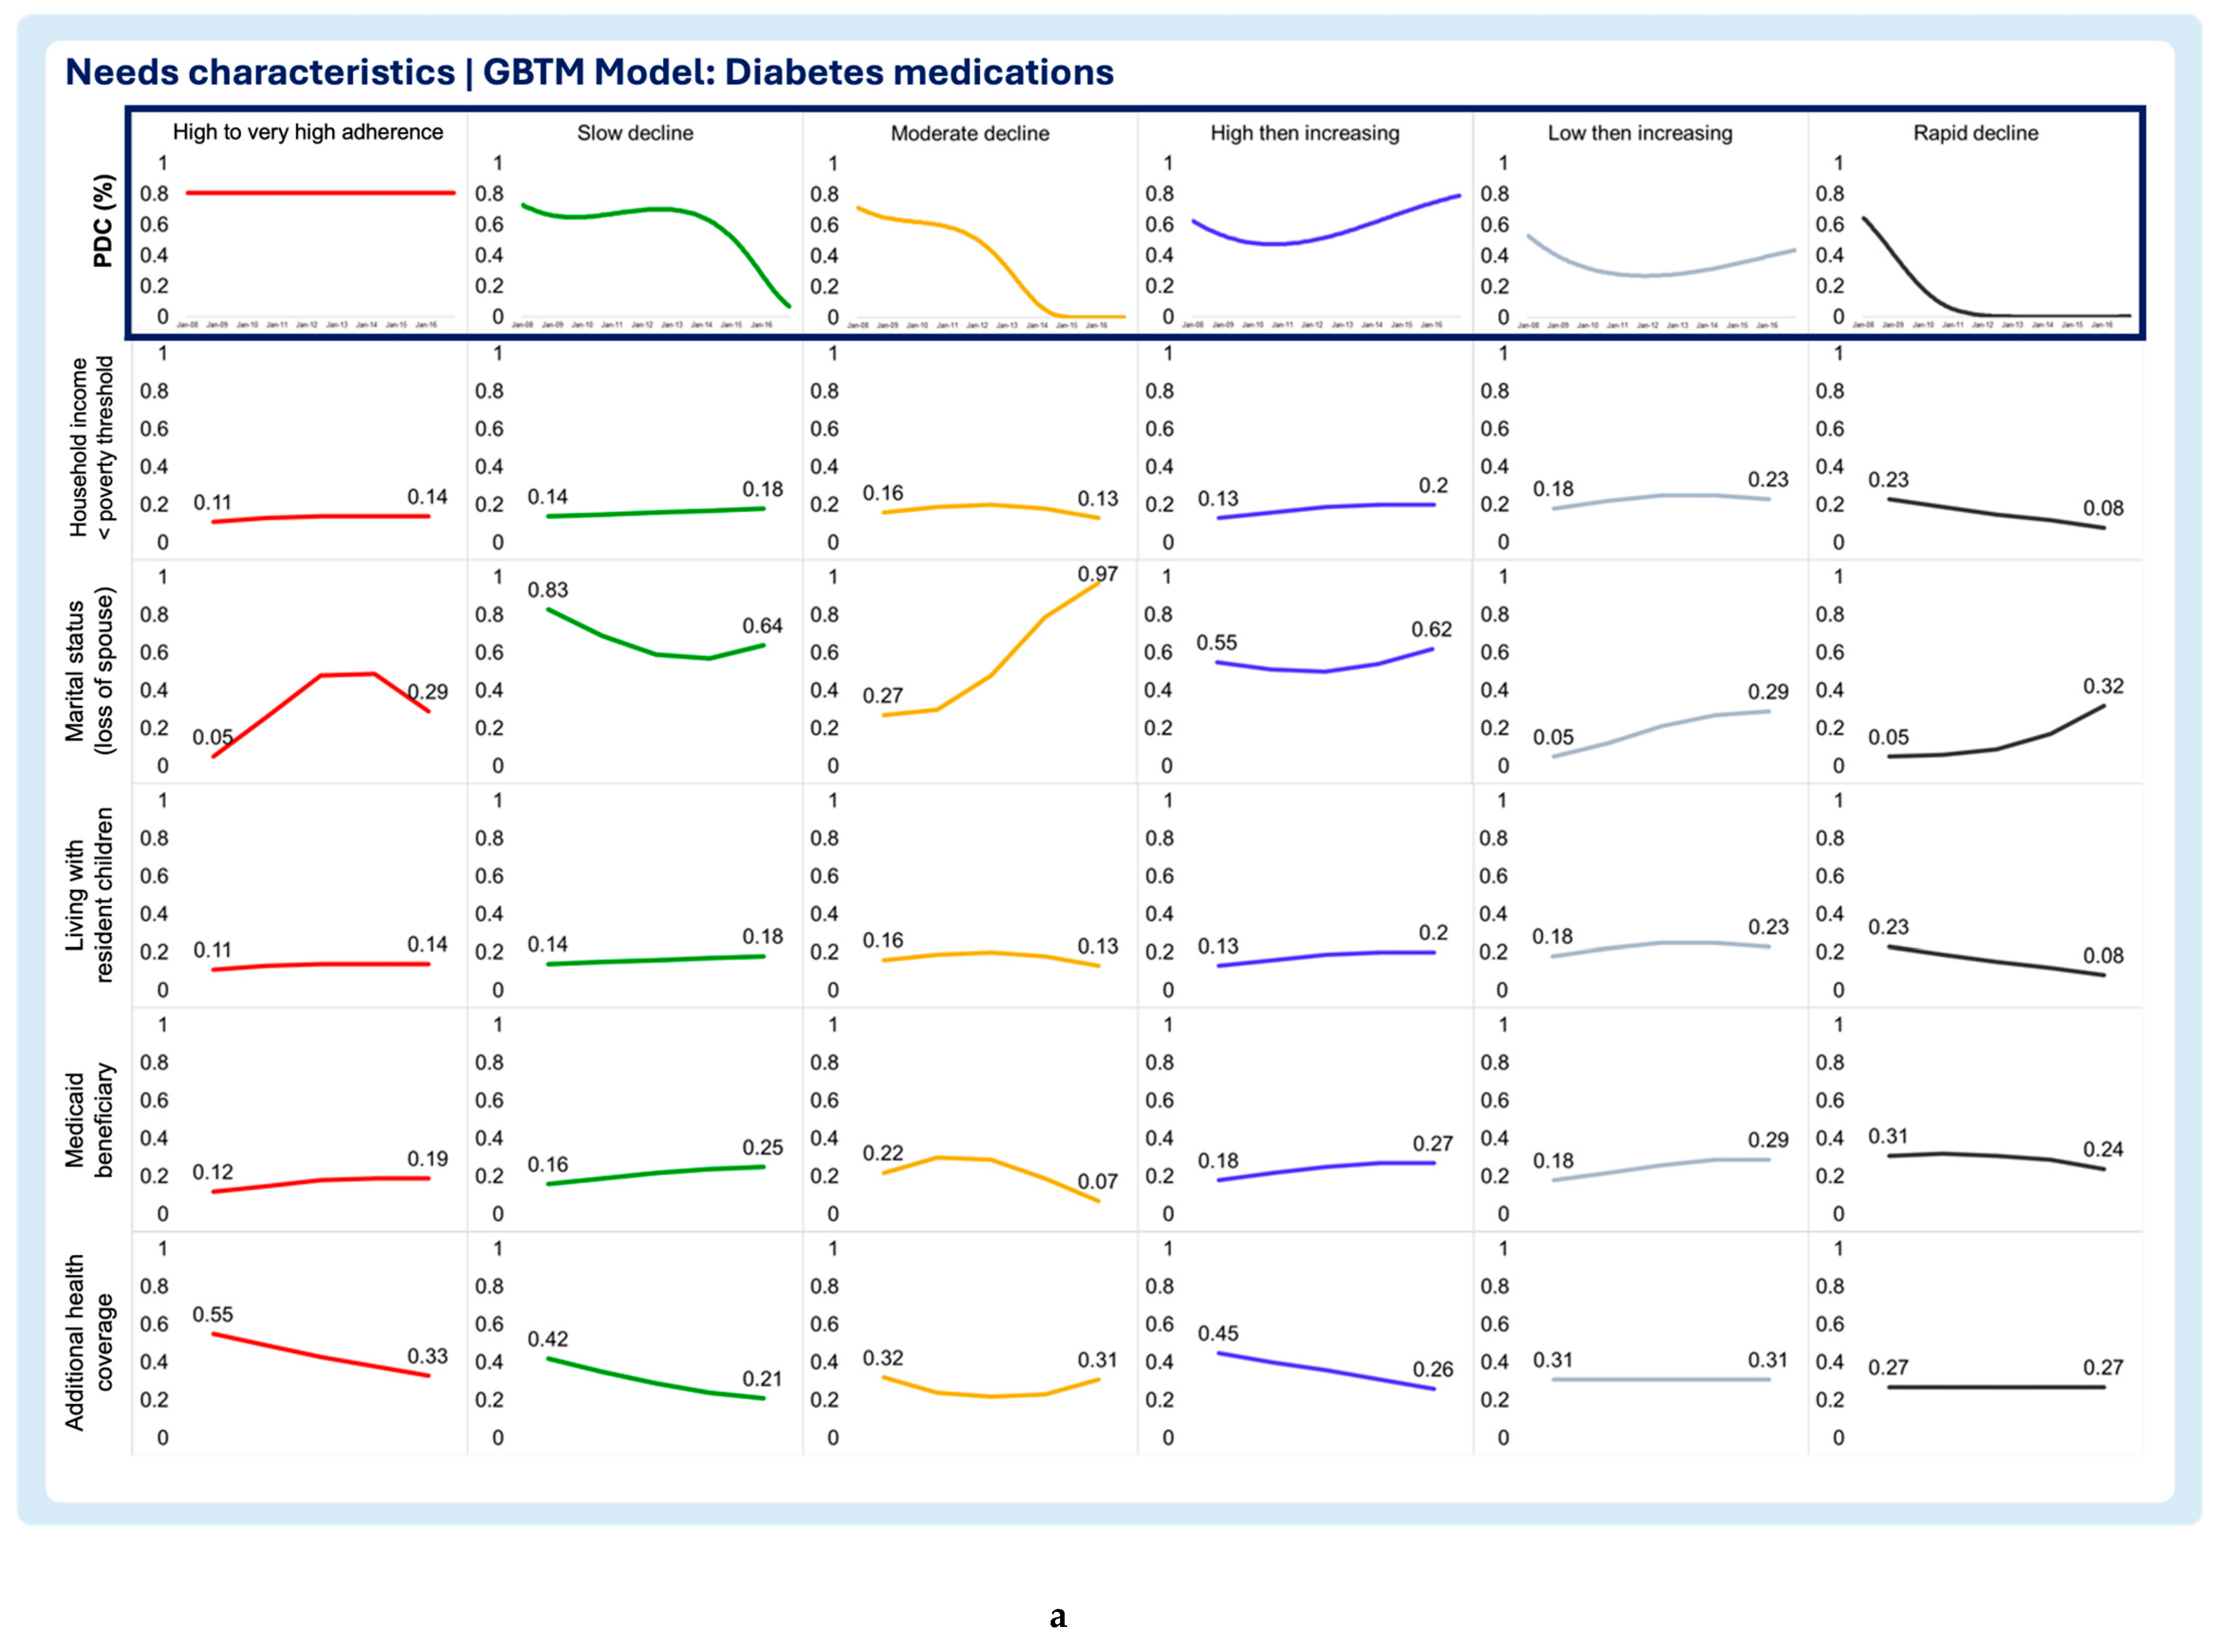
- Household income below poverty threshold
The select antihypertensives model, the high to very high adherence group displayed a clear decline in the probability of living below the poverty threshold, even though other trajectory groups exhibited lower probabilities of living below the poverty threshold throughout the period of analysis. The high to very high and low then increasing trajectories of the statins model display sharp decreases in the likelihood of living below the poverty threshold. The rapid decline trajectory of the statins exhibited a slight decrease, although the likelihood of living below the poverty threshold was minimal at the beginning of the study. Additionally, the slow decline trajectory displayed a slight increase in the likelihood of living below the poverty threshold. In the diabetes medication model, all trajectories exhibit constant low probability of living below the poverty threshold throughout the follow-up period.
- Marital status (loss of spouse)
The select antihypertensives model showed that the probability of living without a spouse decreased in the high to very high adherence group and for the slow decline group. Contrastingly, patients in the rapid decline group exhibited growing probability of being without a spouse. The statins model showed no differences between trajectory groups, as all reported slight increases in the probability of losing a spouse over time. In the diabetes medications model, all but the slow decline trajectories display increasing chances of losing a spouse during the follow-up period. The sharpest increase in the probability of losing a spouse was observed in the moderate decline trajectory. Notably, the small increase was observed in the high to very high adherence (“inverted U” shaped curve) and the low then increasing adherence trajectories. Even though the slow decline trajectory of the diabetes medication model exhibited an decrease in the likelihood of losing a spouse, the probability of living without a spouse at the baseline and end of the follow-up period of one the highest.
- Living with resident children
The results show that the probability of living with resident children in the household remained stable throughout the follow-up period with no clear trends or shifts in the select antihypertensives model. In the statins model, all trajectories exhibiting declining probability of residing with children in the household. The high to very high trajectory in the statins model exhibits the largest probability of living with children at the beginning of the study and also the sharpest decline throughout the follow-up period, followed by the slow decline trajectory group. Like the select antihypertensives, the diabetes medication model displayed no clear trends with all trajectories displaying low probability of participants living with their children.
- Medicaid beneficiary
The probability of being a Medicaid beneficiary was consistently low across all trajectories in the select antihypertensives model, with minimal variation throughout the follow-up. In the statins model, the high to very high adherence trajectory initially had the highest probability, followed by the sharpest decline. The lower then increasing trajectory showed a smaller decline, while the slow decline trajectory exhibited a notable increase in likelihood. The moderate and rapid decline trajectories maintained consistently low probabilities. Similarly, all trajectories in the diabetes medications model displayed consistently low probabilities of Medicaid beneficiary status.
- Additional health coverage
In the antihypertensives model, the high to very high adherence trajectory showed the steepest decline in additional health insurance benefits, with slow decline following a similar but less pronounced pattern. The rapid decline group remained stable, with minimal benefits. In the statins model, high adherence showed a notable increase in additional coverage, while slow decline and lower then increasing trajectories decreased. Moderate and rapid decline groups had consistently low, stable probabilities. In the diabetes model, additional health insurance benefits declined overall, with high adherence maintaining the highest probability at both baseline and follow-up, while rapid decline showed the lowest.
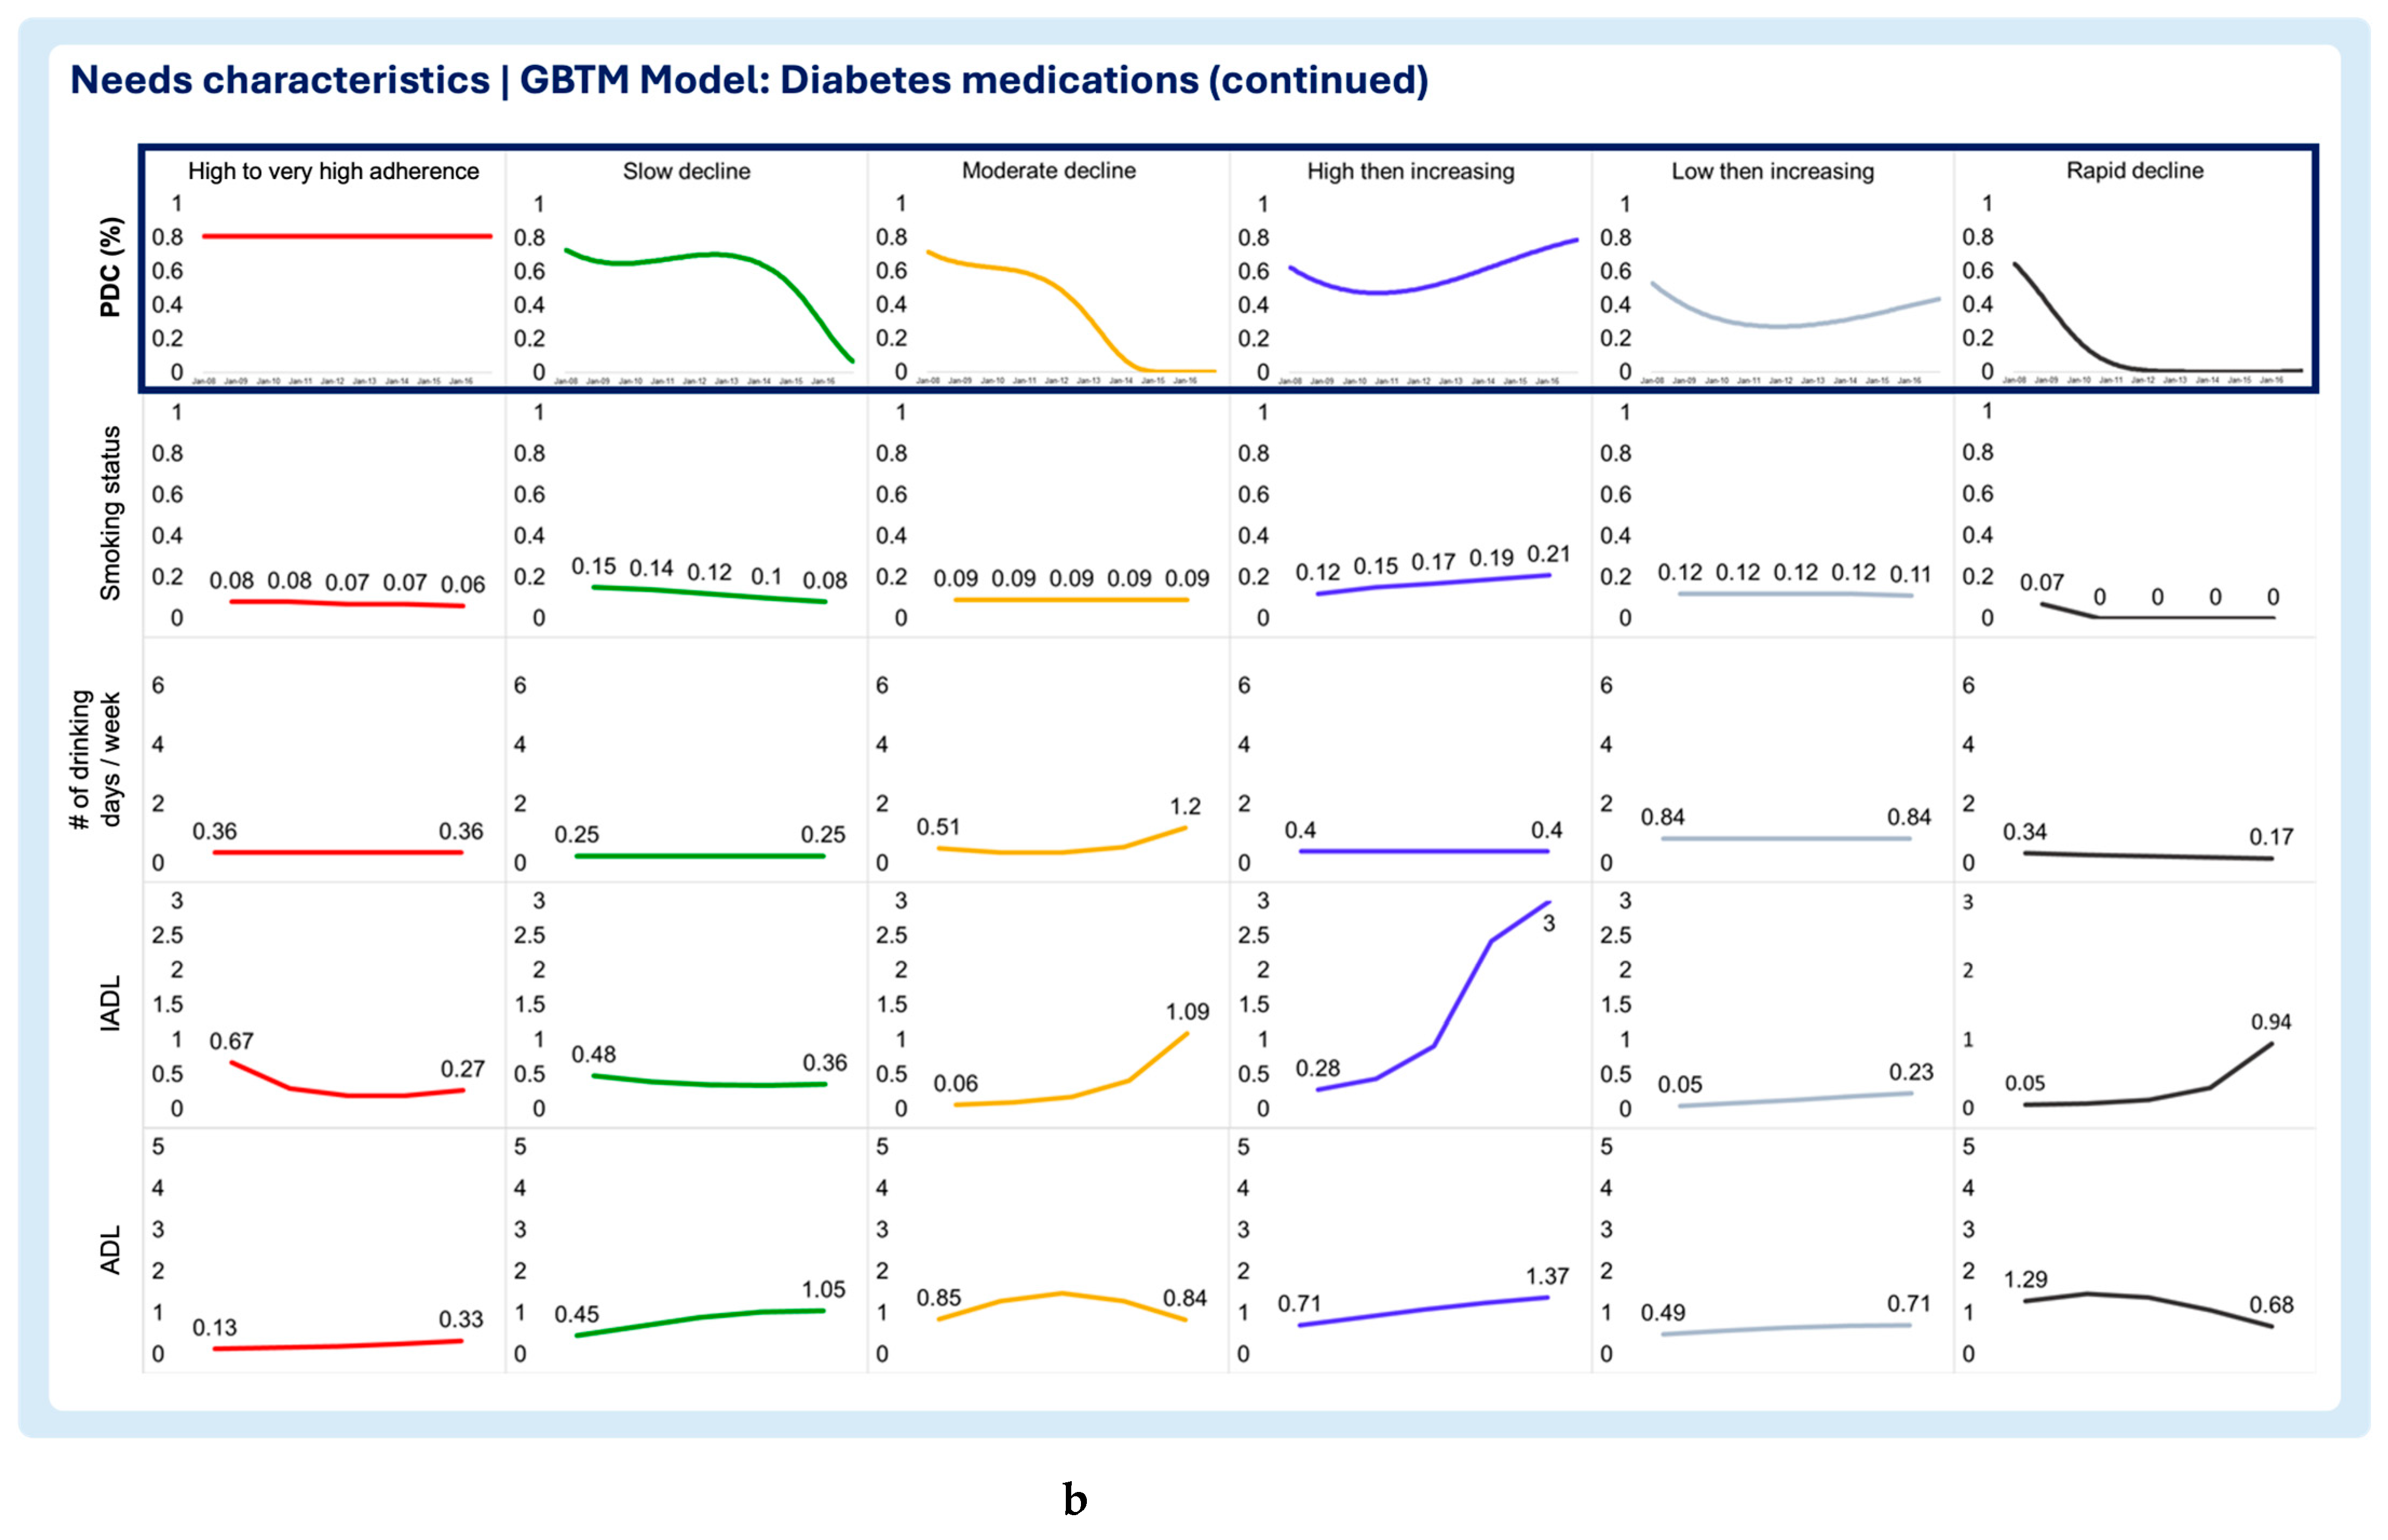
- Smoking status
The high to very high adherence in the select antihypertensives model displayed the sharpest decline in the likelihood of being a smoker, while the remaining trajectories of this model exhibited sustained low probability of being smokers. In the statins, all trajectories displayed a very small and constant probability of being smokers throughout the follow-up period. The same was observed in the diabetes medications model.
- Number of drinking days / week
The number of drinking days per week was overall low in all trajectories of the select antihypertensives, statins, and diabetes medication models, with all trajectories exhibiting a constant measure of no more than 1 drinking day per week.
- Instrumental Activities of Daily Living (IADL)
Difficulty with instrumental activities of daily living seem to generally increase with time, with the rapid decline trajectory exhibiting the sharpest surge in the select antihypertensives model. Similarly, in the statins model all but the lower then increasing adherence and rapid decline trajectories exhibit an increase in difficulty with instrumental activities of daily. The lower then increase trajectory of the statins remained constant throughout the follow-up period, whereas the rapid decline trajectory seems to report slightly less difficulty with instrumental activities of daily during the follow-up period. Nevertheless, the baseline score of IADL of the rapid decline in statins model was the highest compared to all other trajectories in the model. The diabetes medications model exhibited similar results as the select antihypertensives model, except for the high to very high adherence and slow decline trajectories.
- Activities of Daily Living (ADL)
In the select antihypertensives model, the high to very high adherence and rapid decline trajectories showed slight decreases in difficulty with activities of daily living (ADL), while the slow decline trajectory exhibited an increase in tasks requiring assistance. In the statins model, all trajectories except rapid decline showed increases in ADL difficulty, with the high to very high adherence group having the lowest baseline score and smallest increase. ADL difficulty decreased over time in the statins rapid decline trajectory but started with the highest baseline score. In the diabetes medications model, ADL scores generally increased, with sharpest rises in the slow decline and high then increasing trajectories. The rapid decline group, despite improvement, had the highest baseline difficulty at the start of follow-up.
Figure 2.
Multitrajectory model of enabling chracteristics and select anithypertensives medication adherence trajectory.
Figure 2.
Multitrajectory model of enabling chracteristics and select anithypertensives medication adherence trajectory.
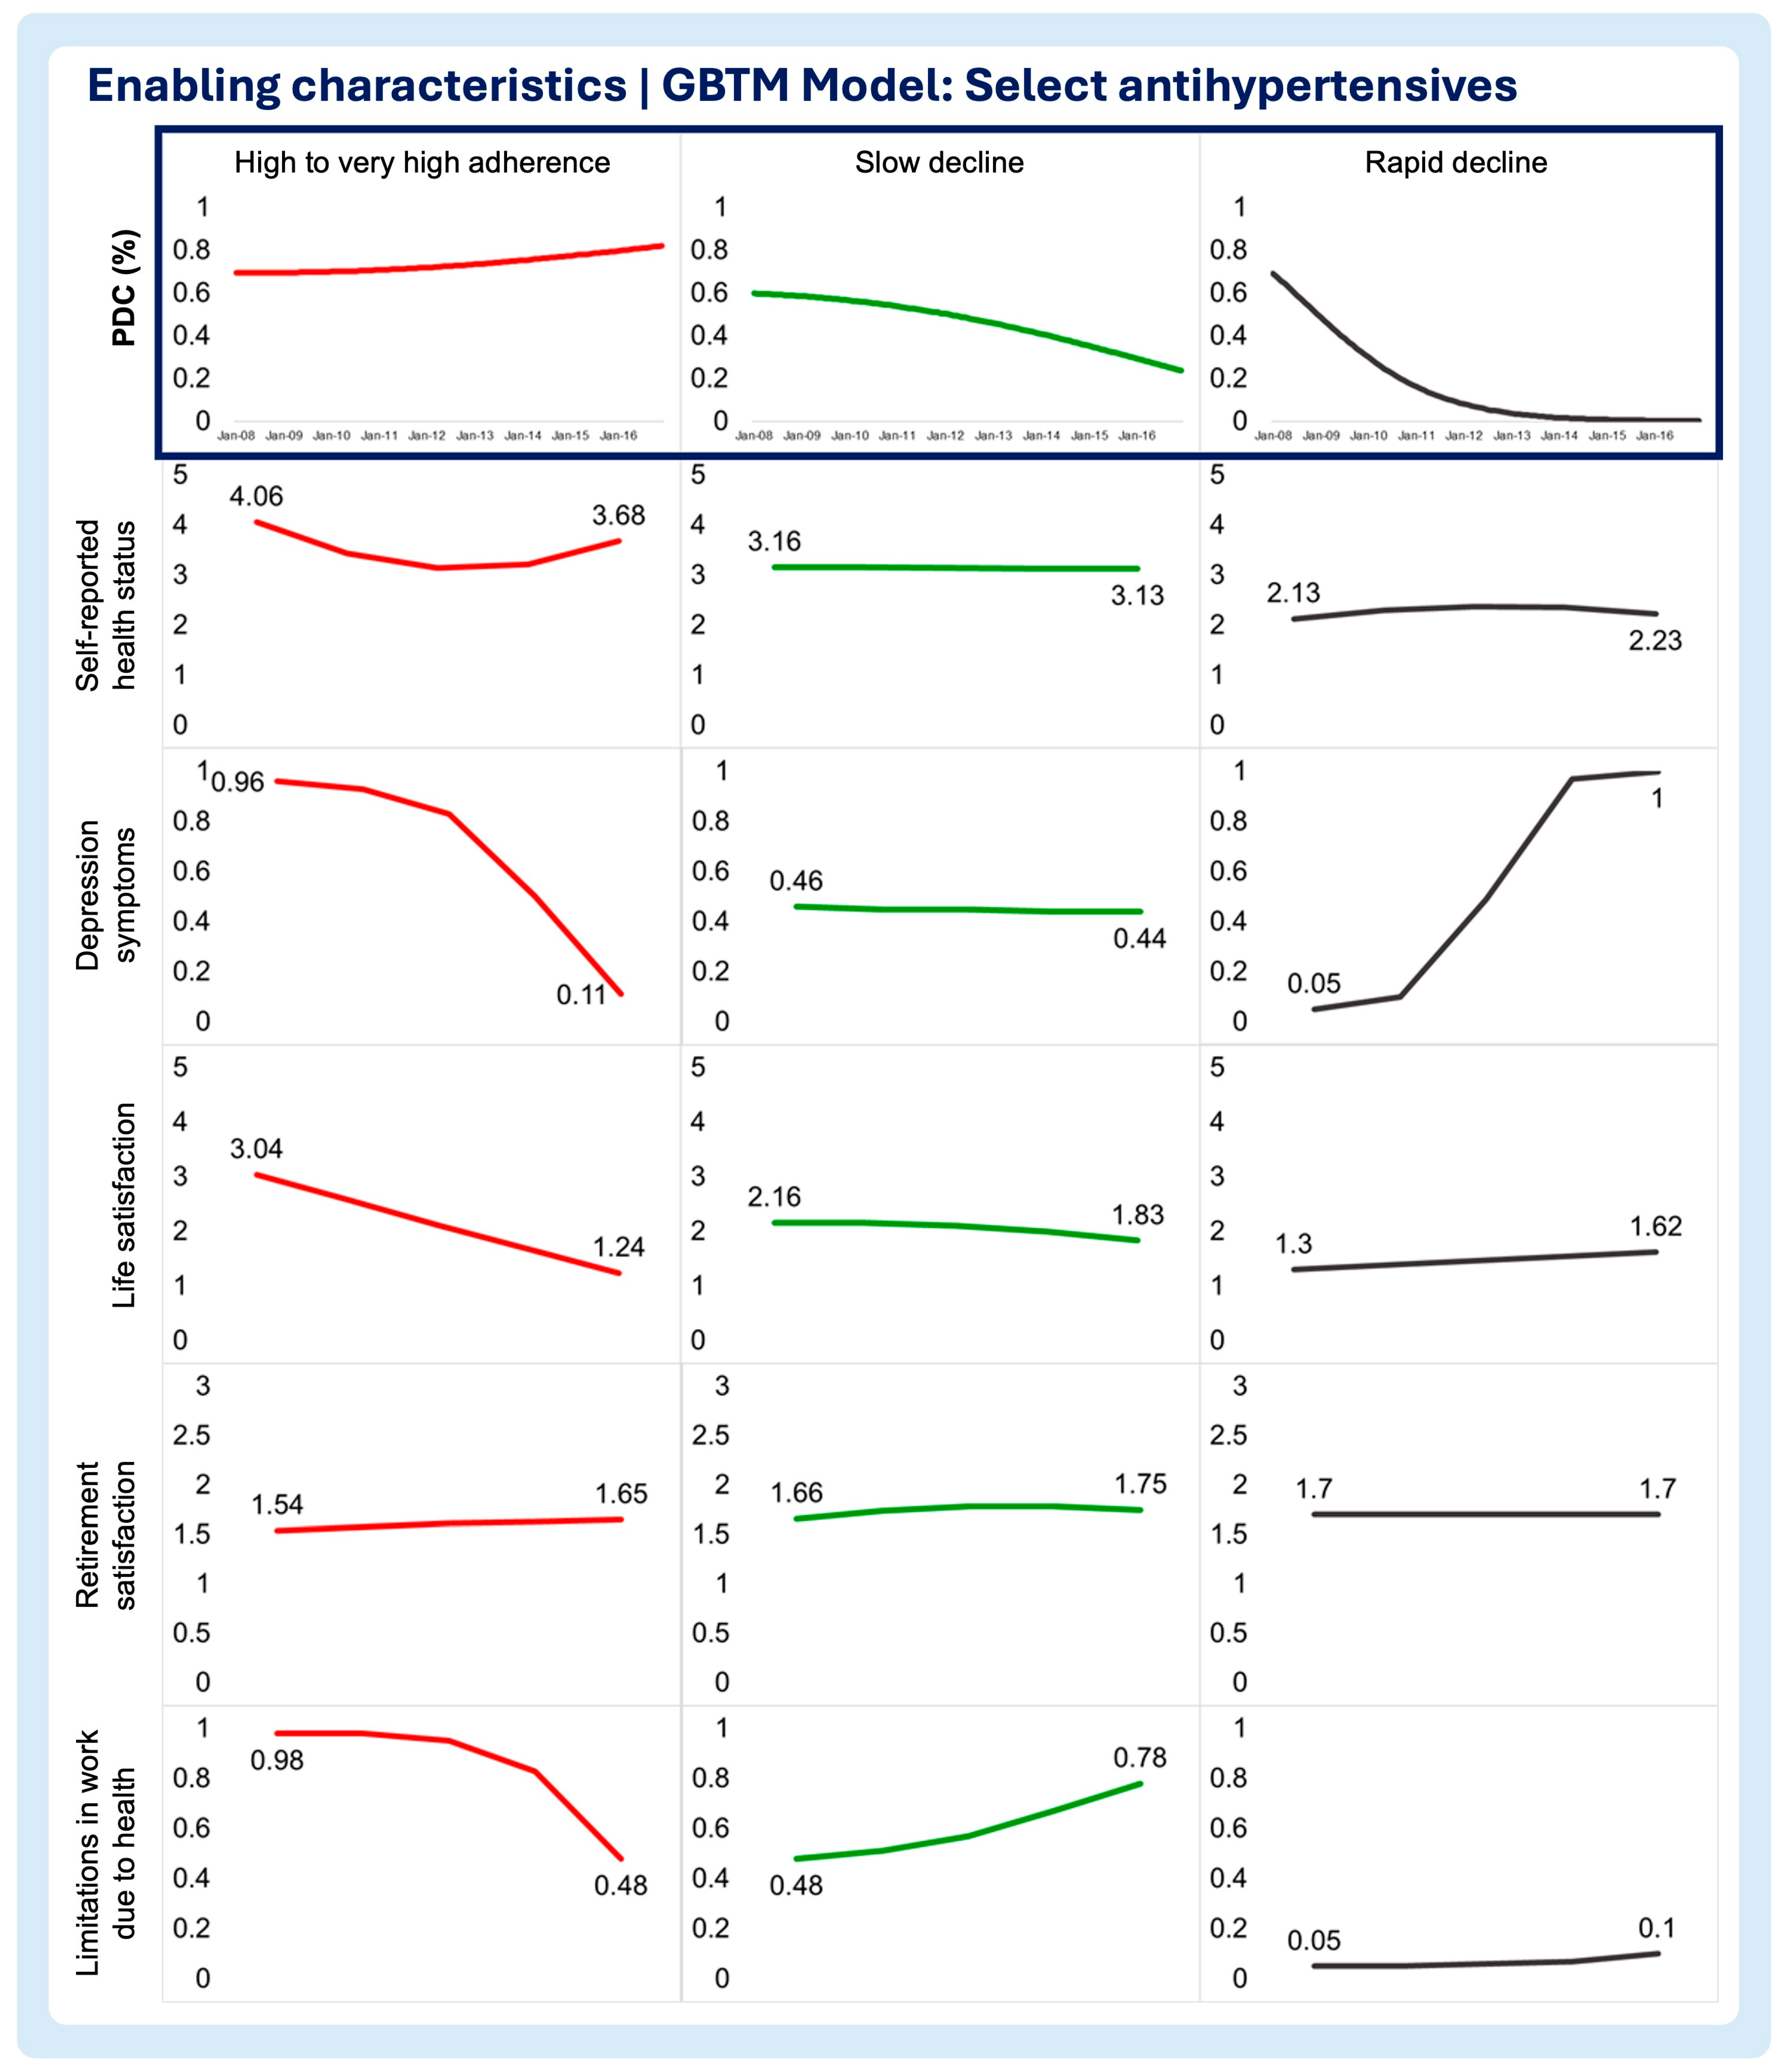
Figure 3.
Multitrajectory model of enabling chracteristics and statins medication adherence trajectory.
Figure 3.
Multitrajectory model of enabling chracteristics and statins medication adherence trajectory.
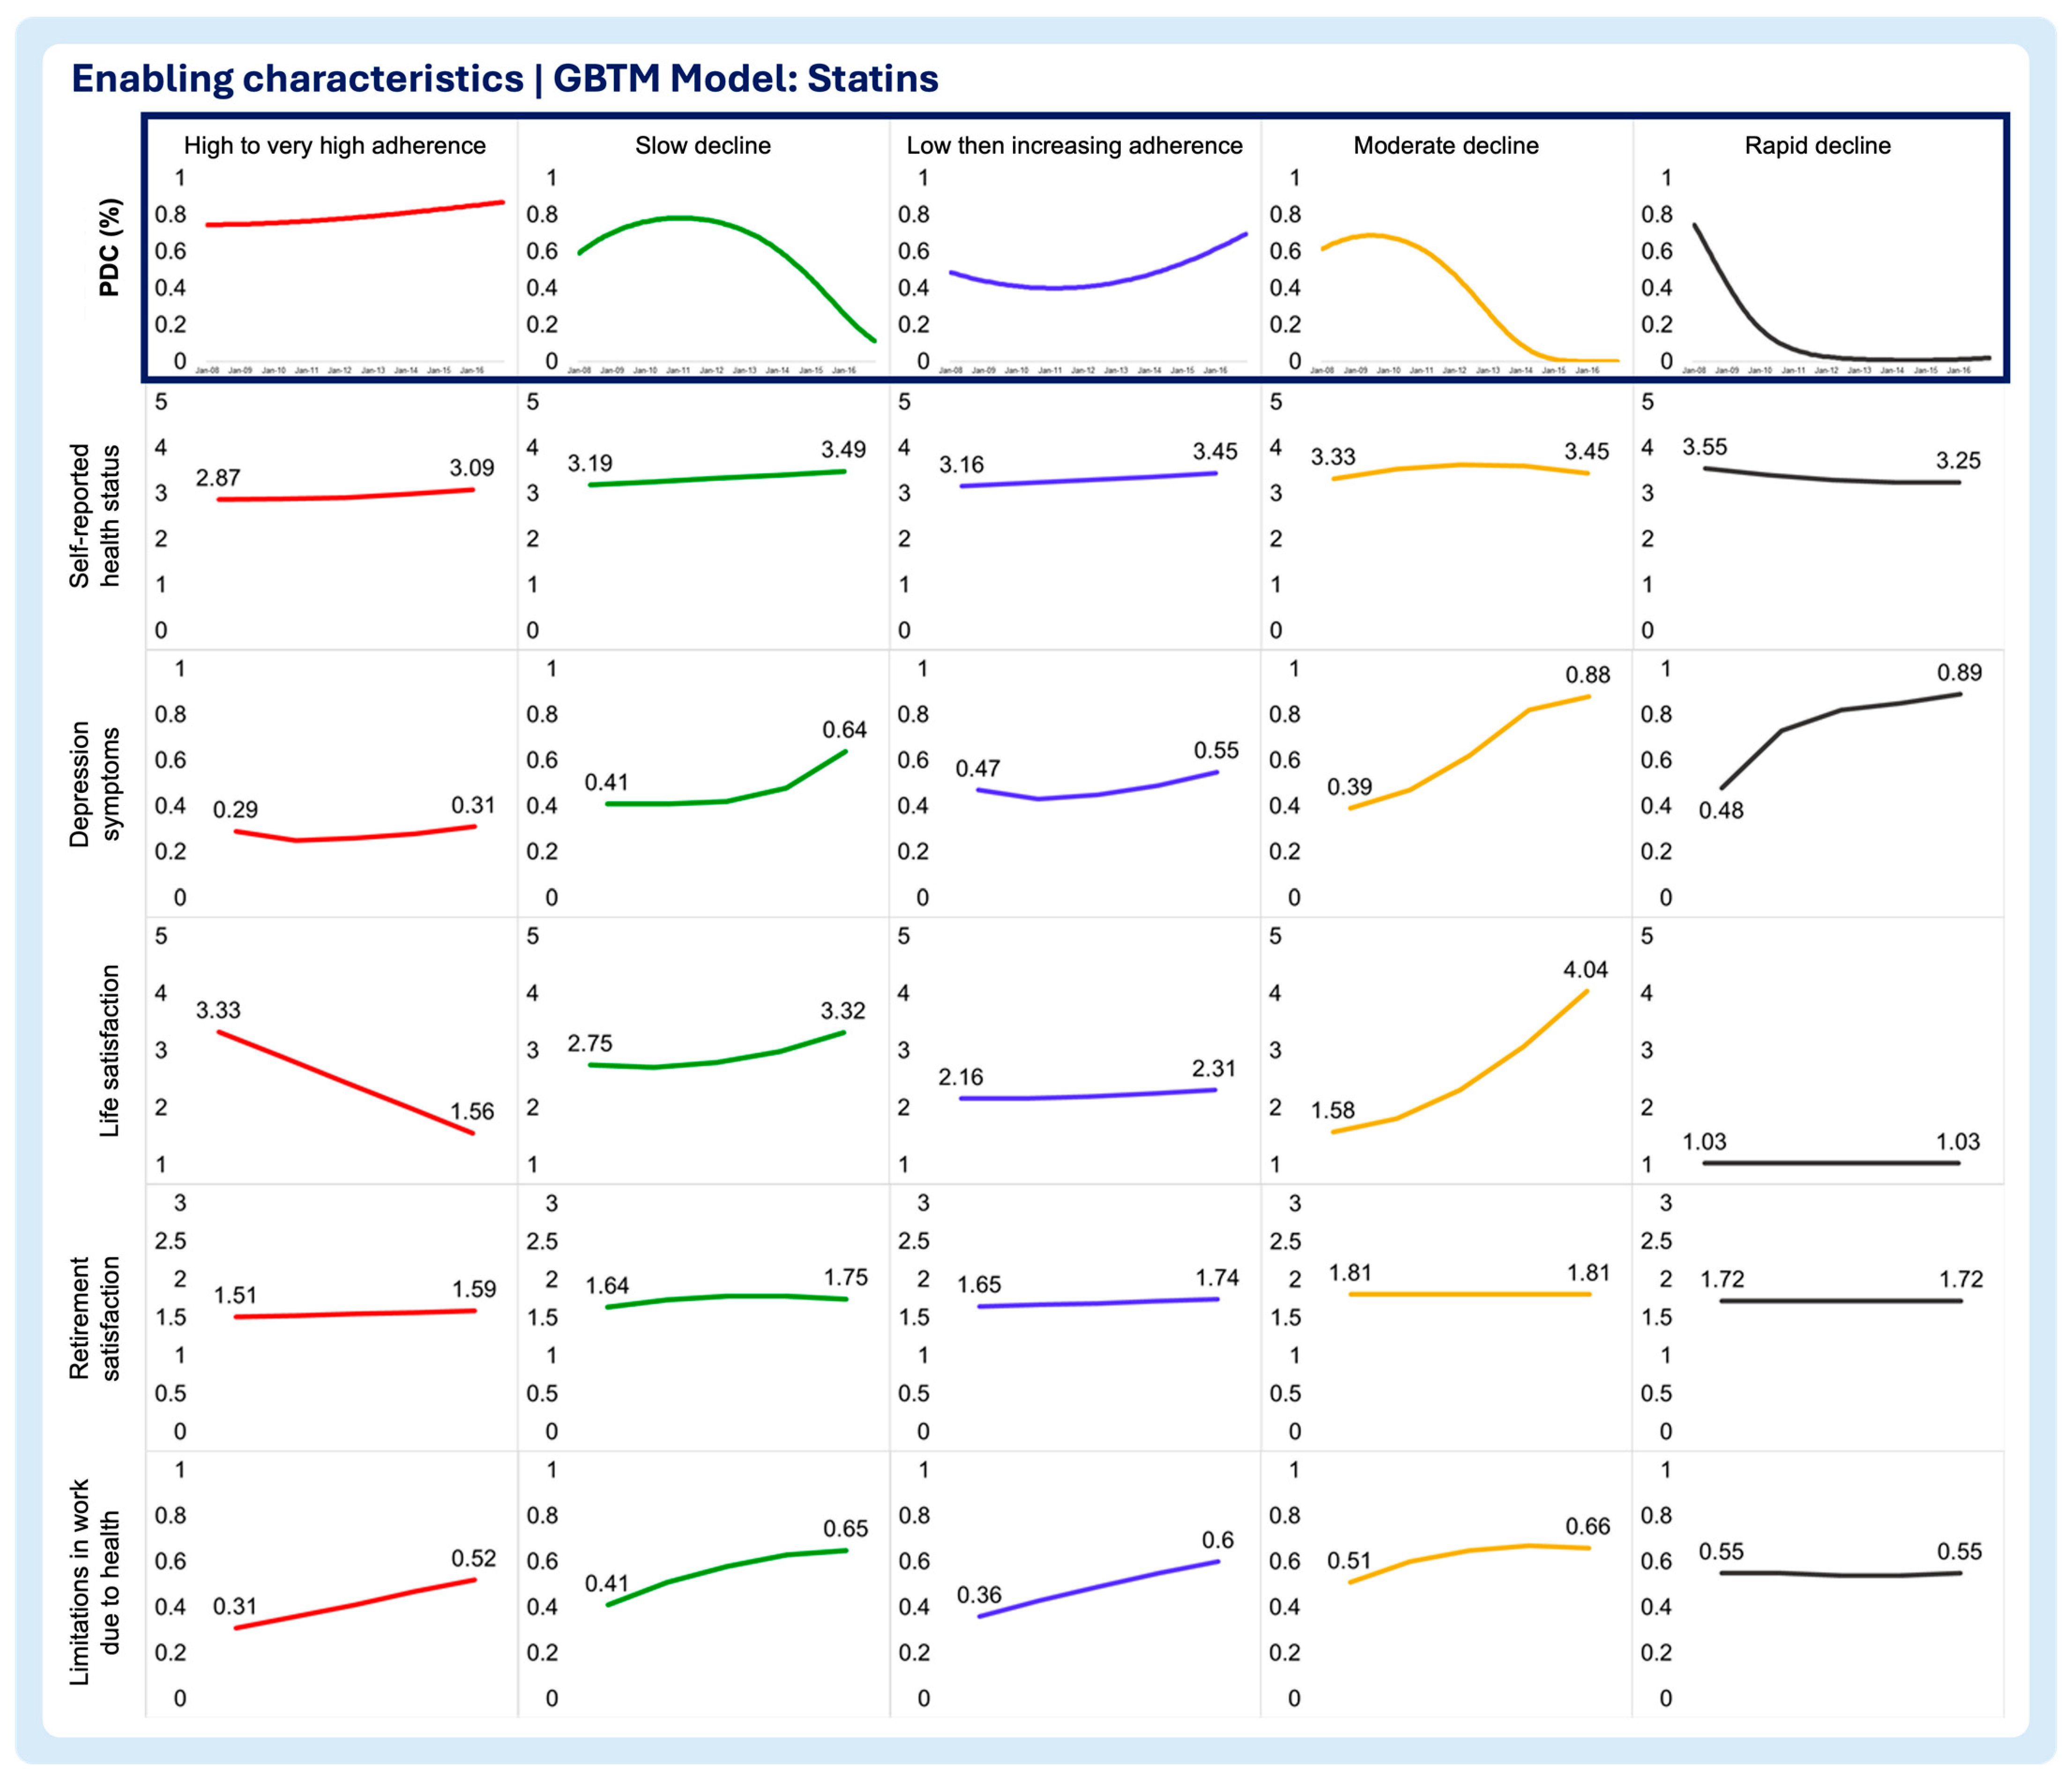
Figure 4.
Multitrajectory model of enabling chracteristics and ora diabetes drugs medication adherence trajectory.
Figure 4.
Multitrajectory model of enabling chracteristics and ora diabetes drugs medication adherence trajectory.
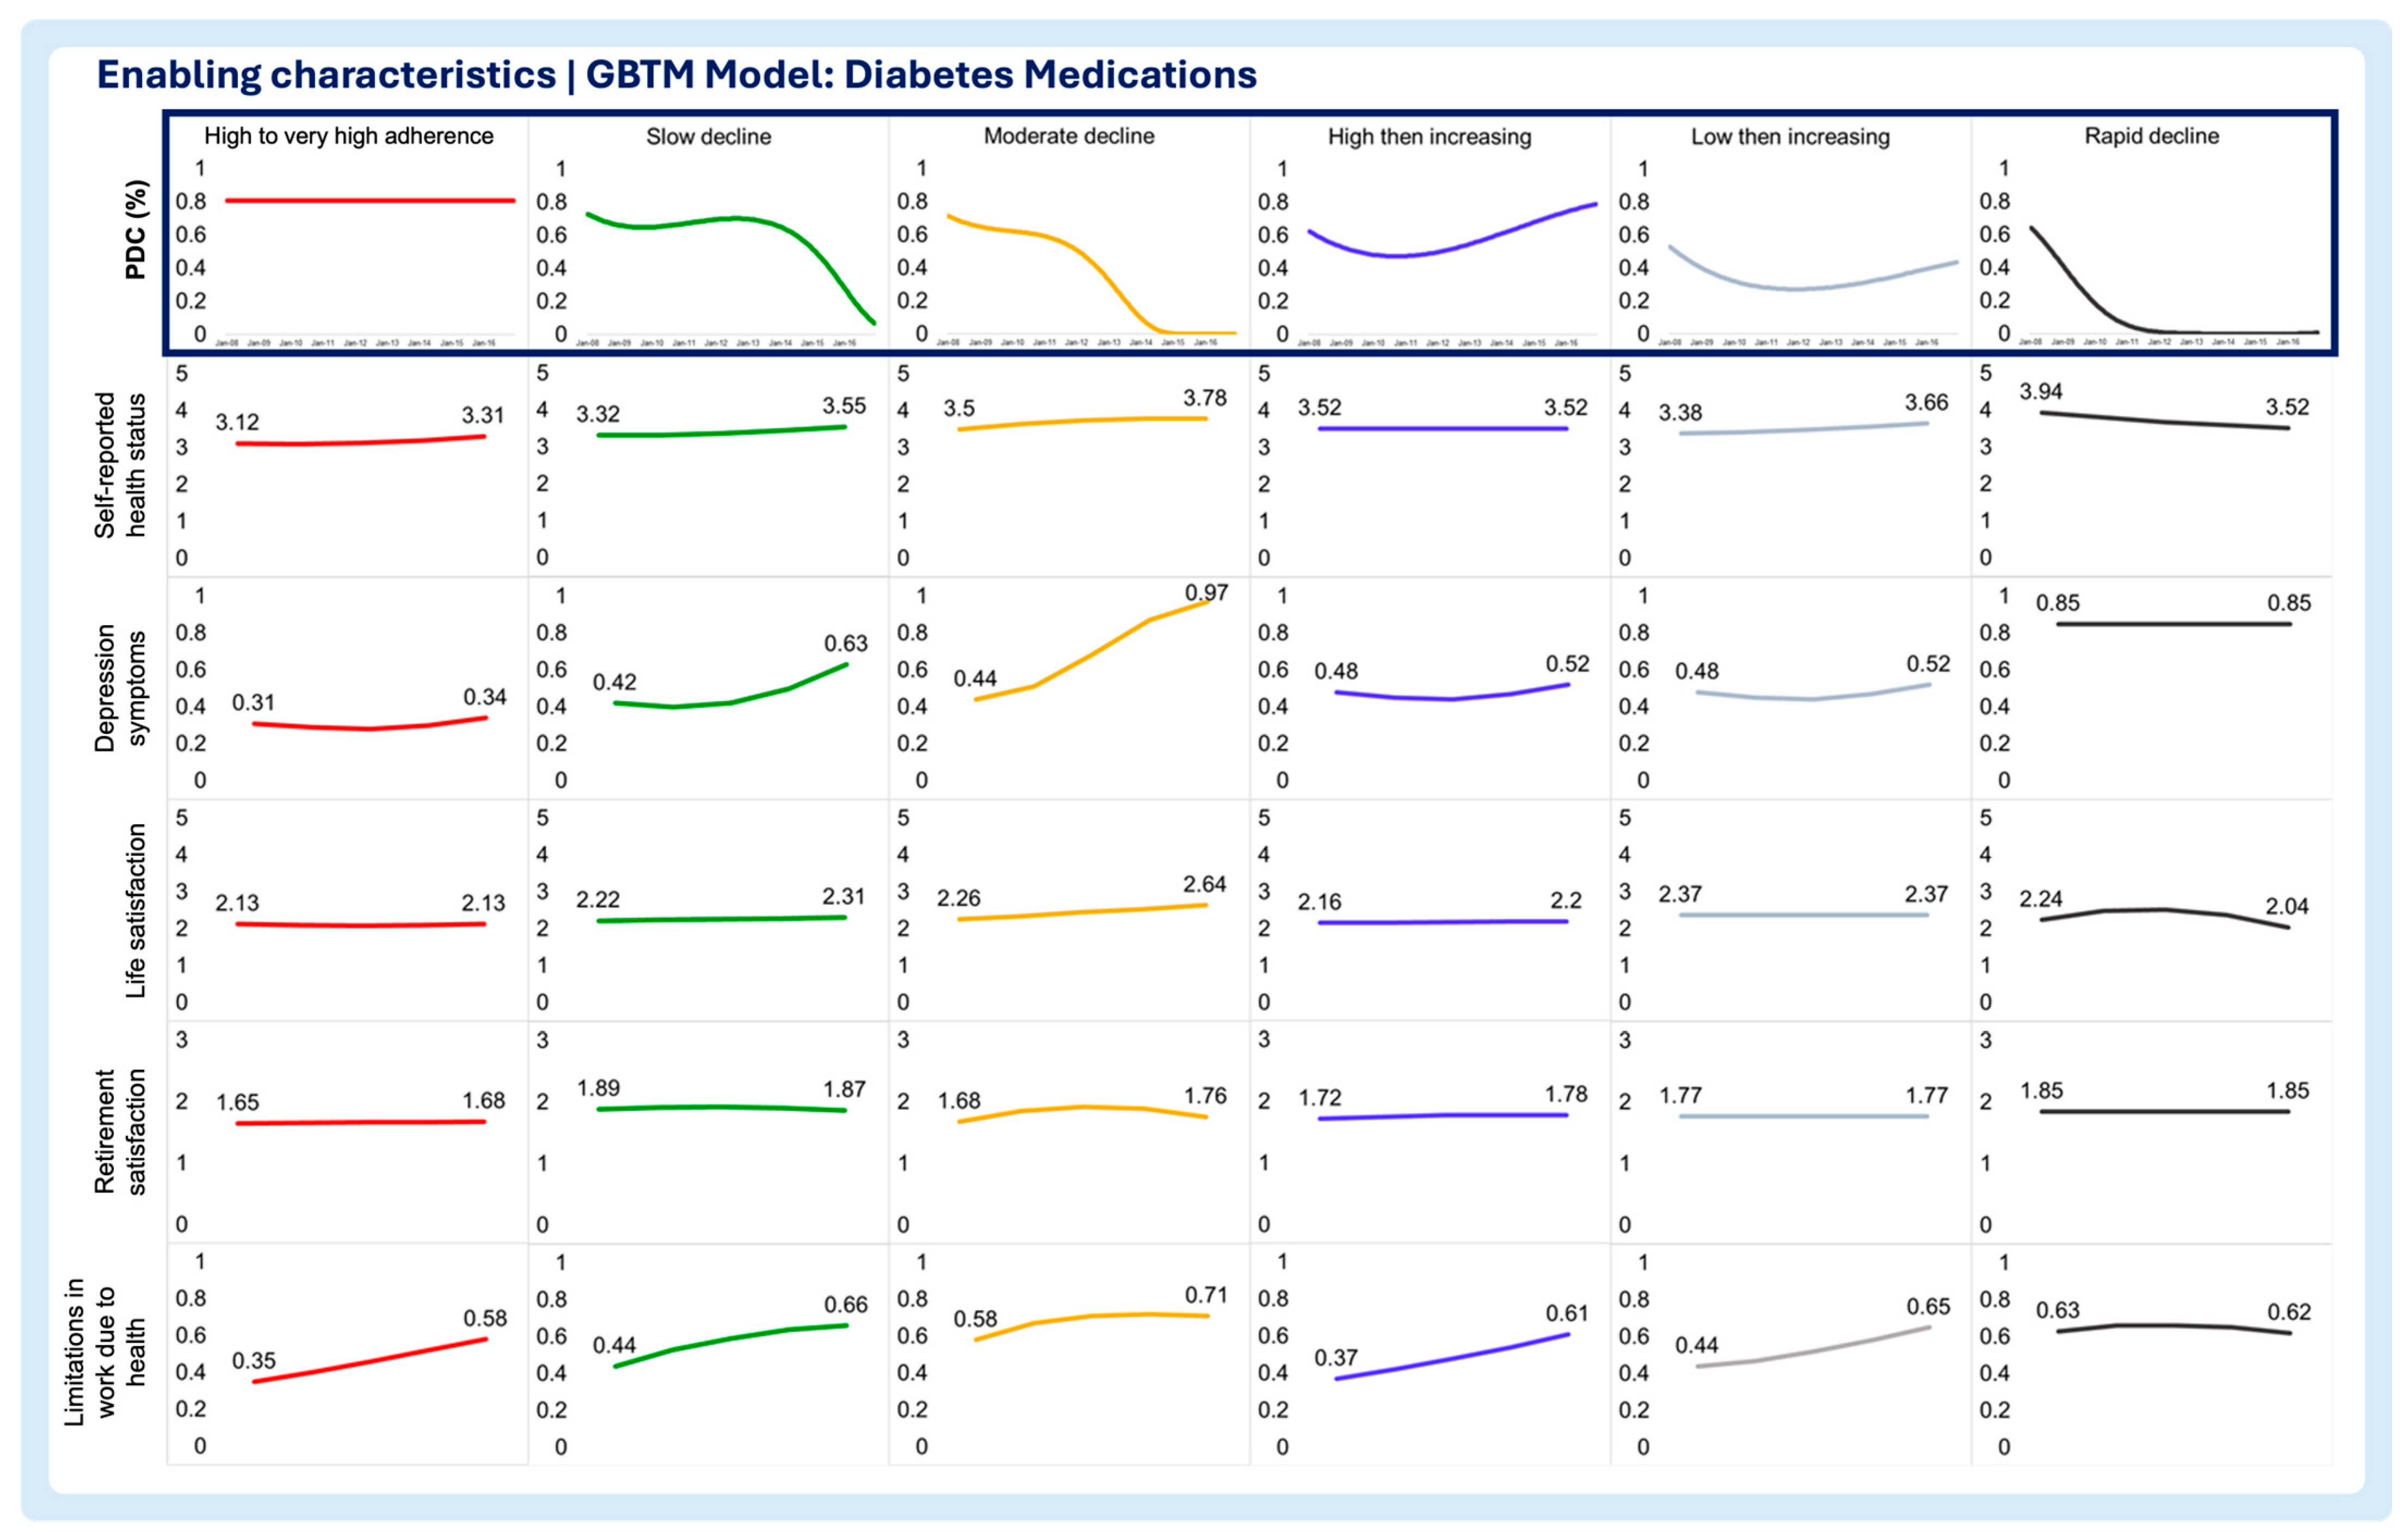
Figure 5.
a. Multitrajectory model of needs chracteristics and select anithypertensives medication adherence trajectory. b. Multitrajectory model of needs chracteristics and select anithypertensives medication adherence trajectory (continued).
Figure 5.
a. Multitrajectory model of needs chracteristics and select anithypertensives medication adherence trajectory. b. Multitrajectory model of needs chracteristics and select anithypertensives medication adherence trajectory (continued).
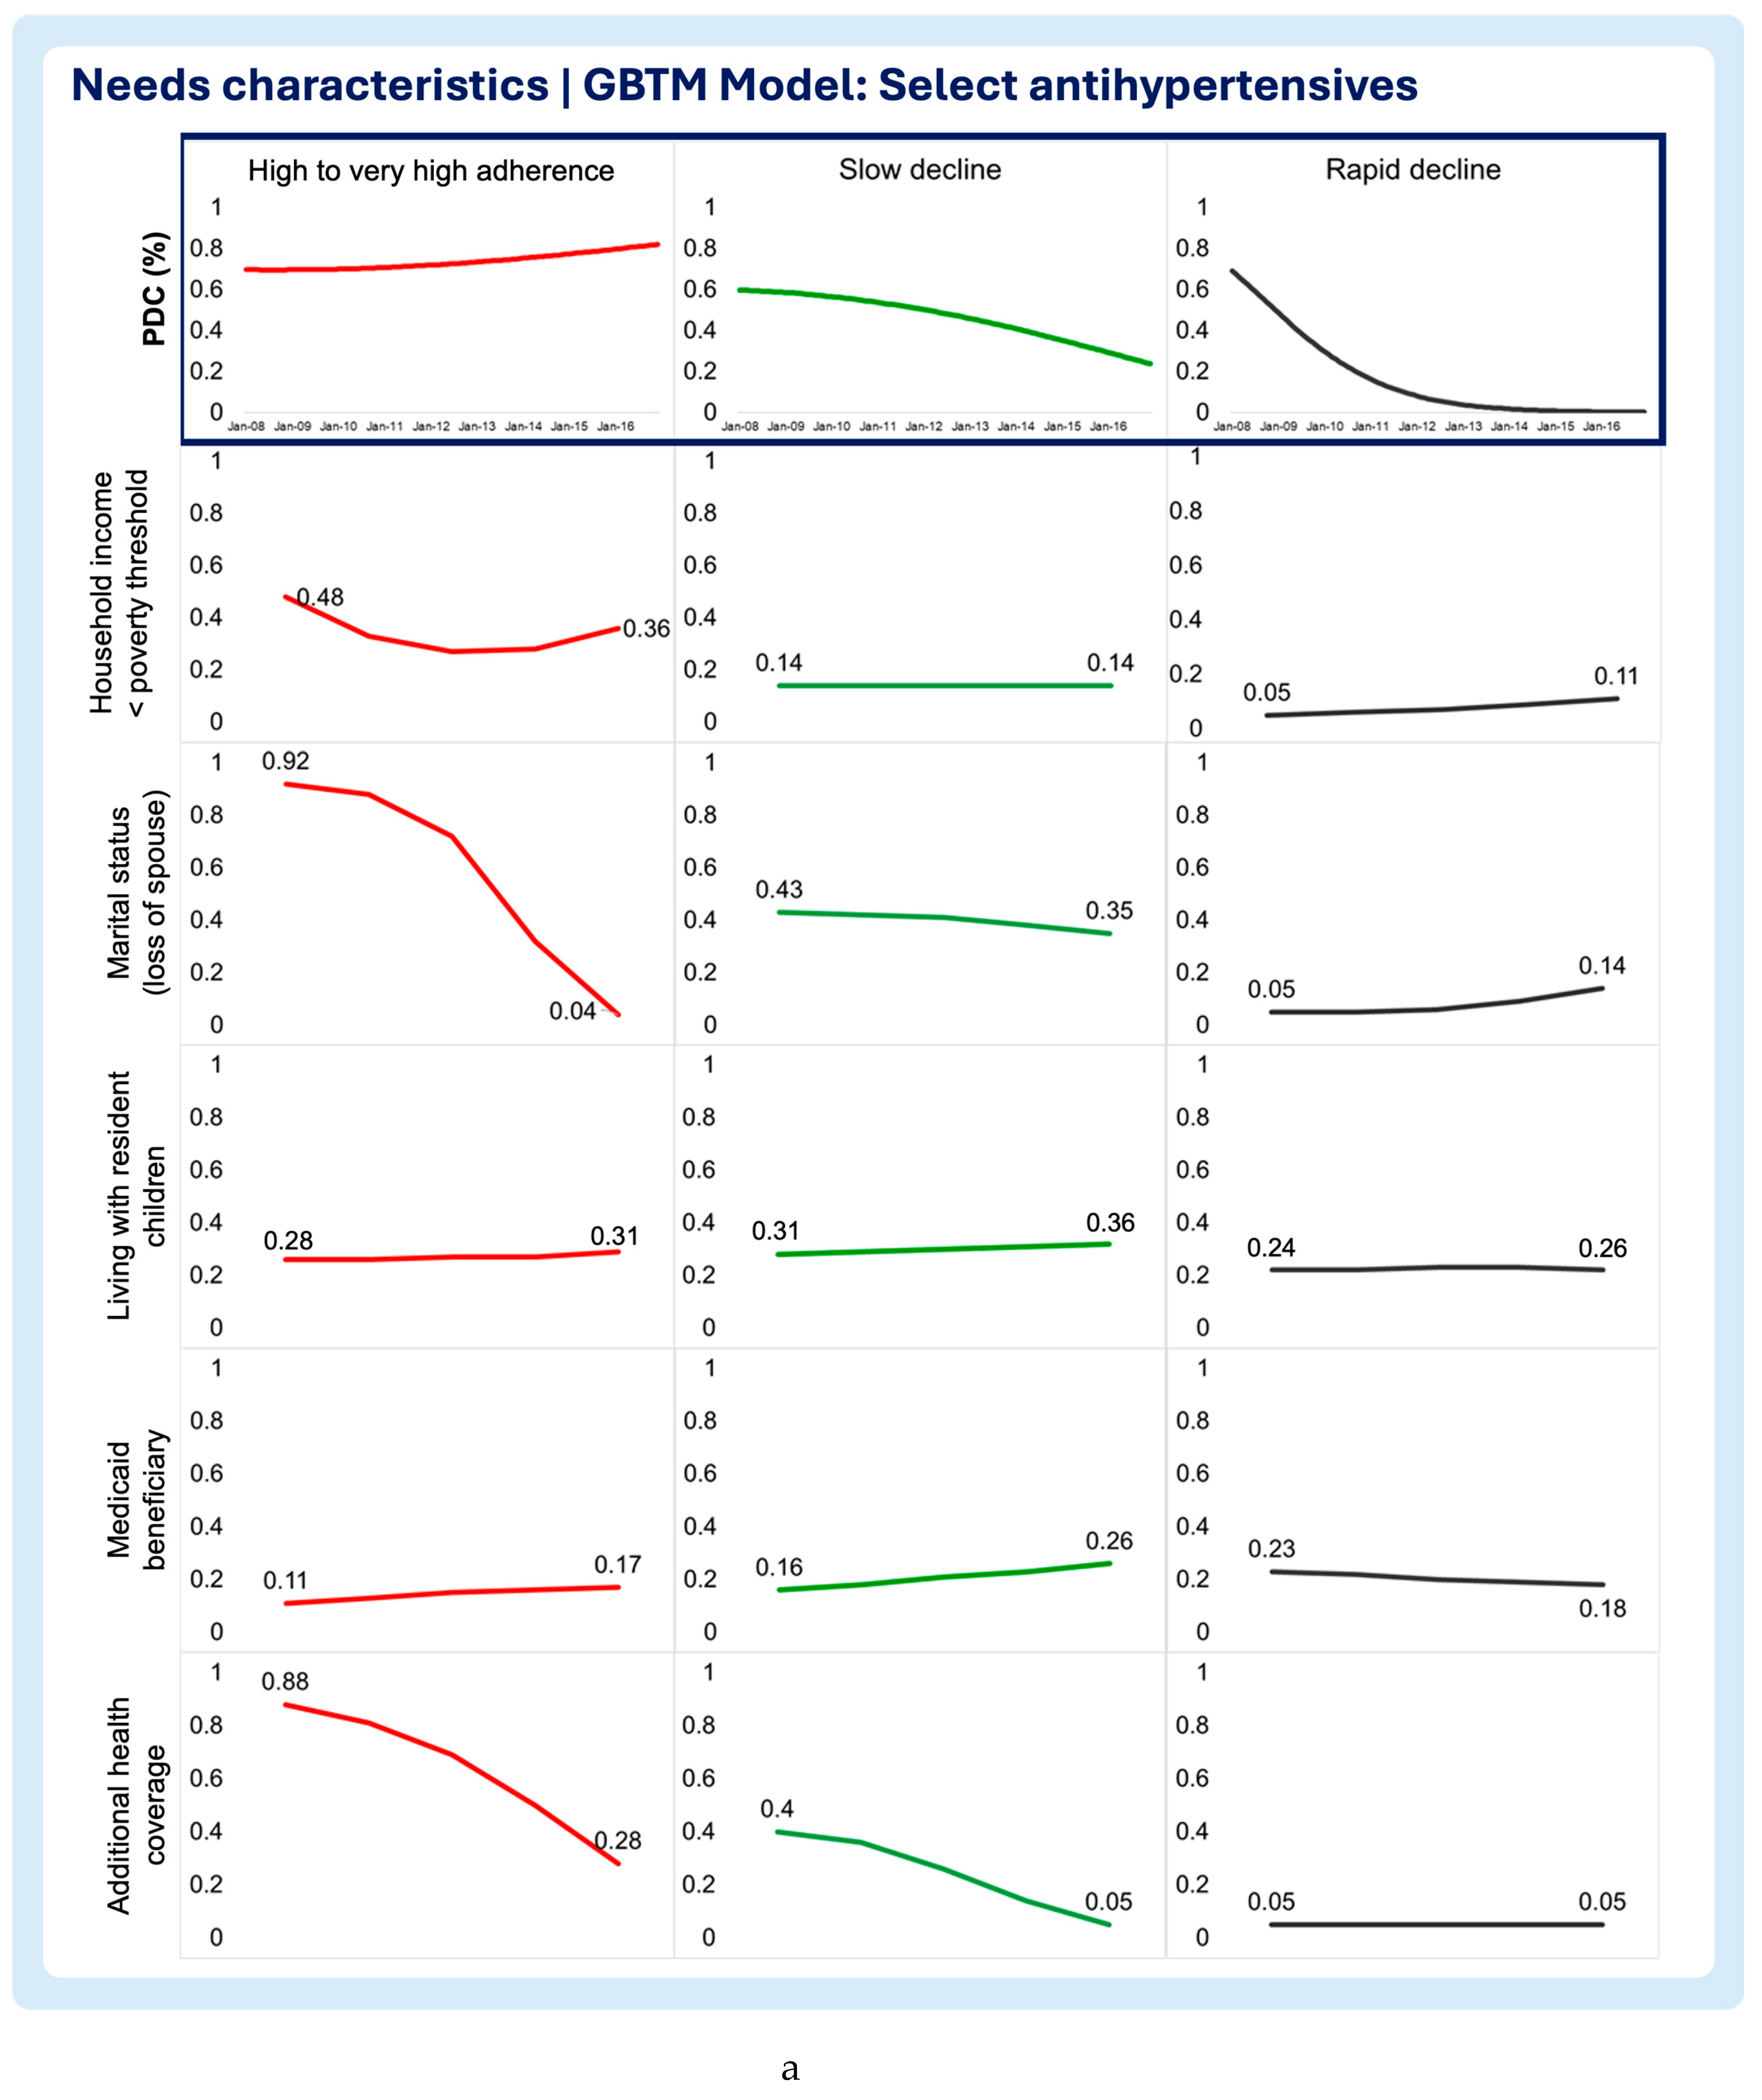
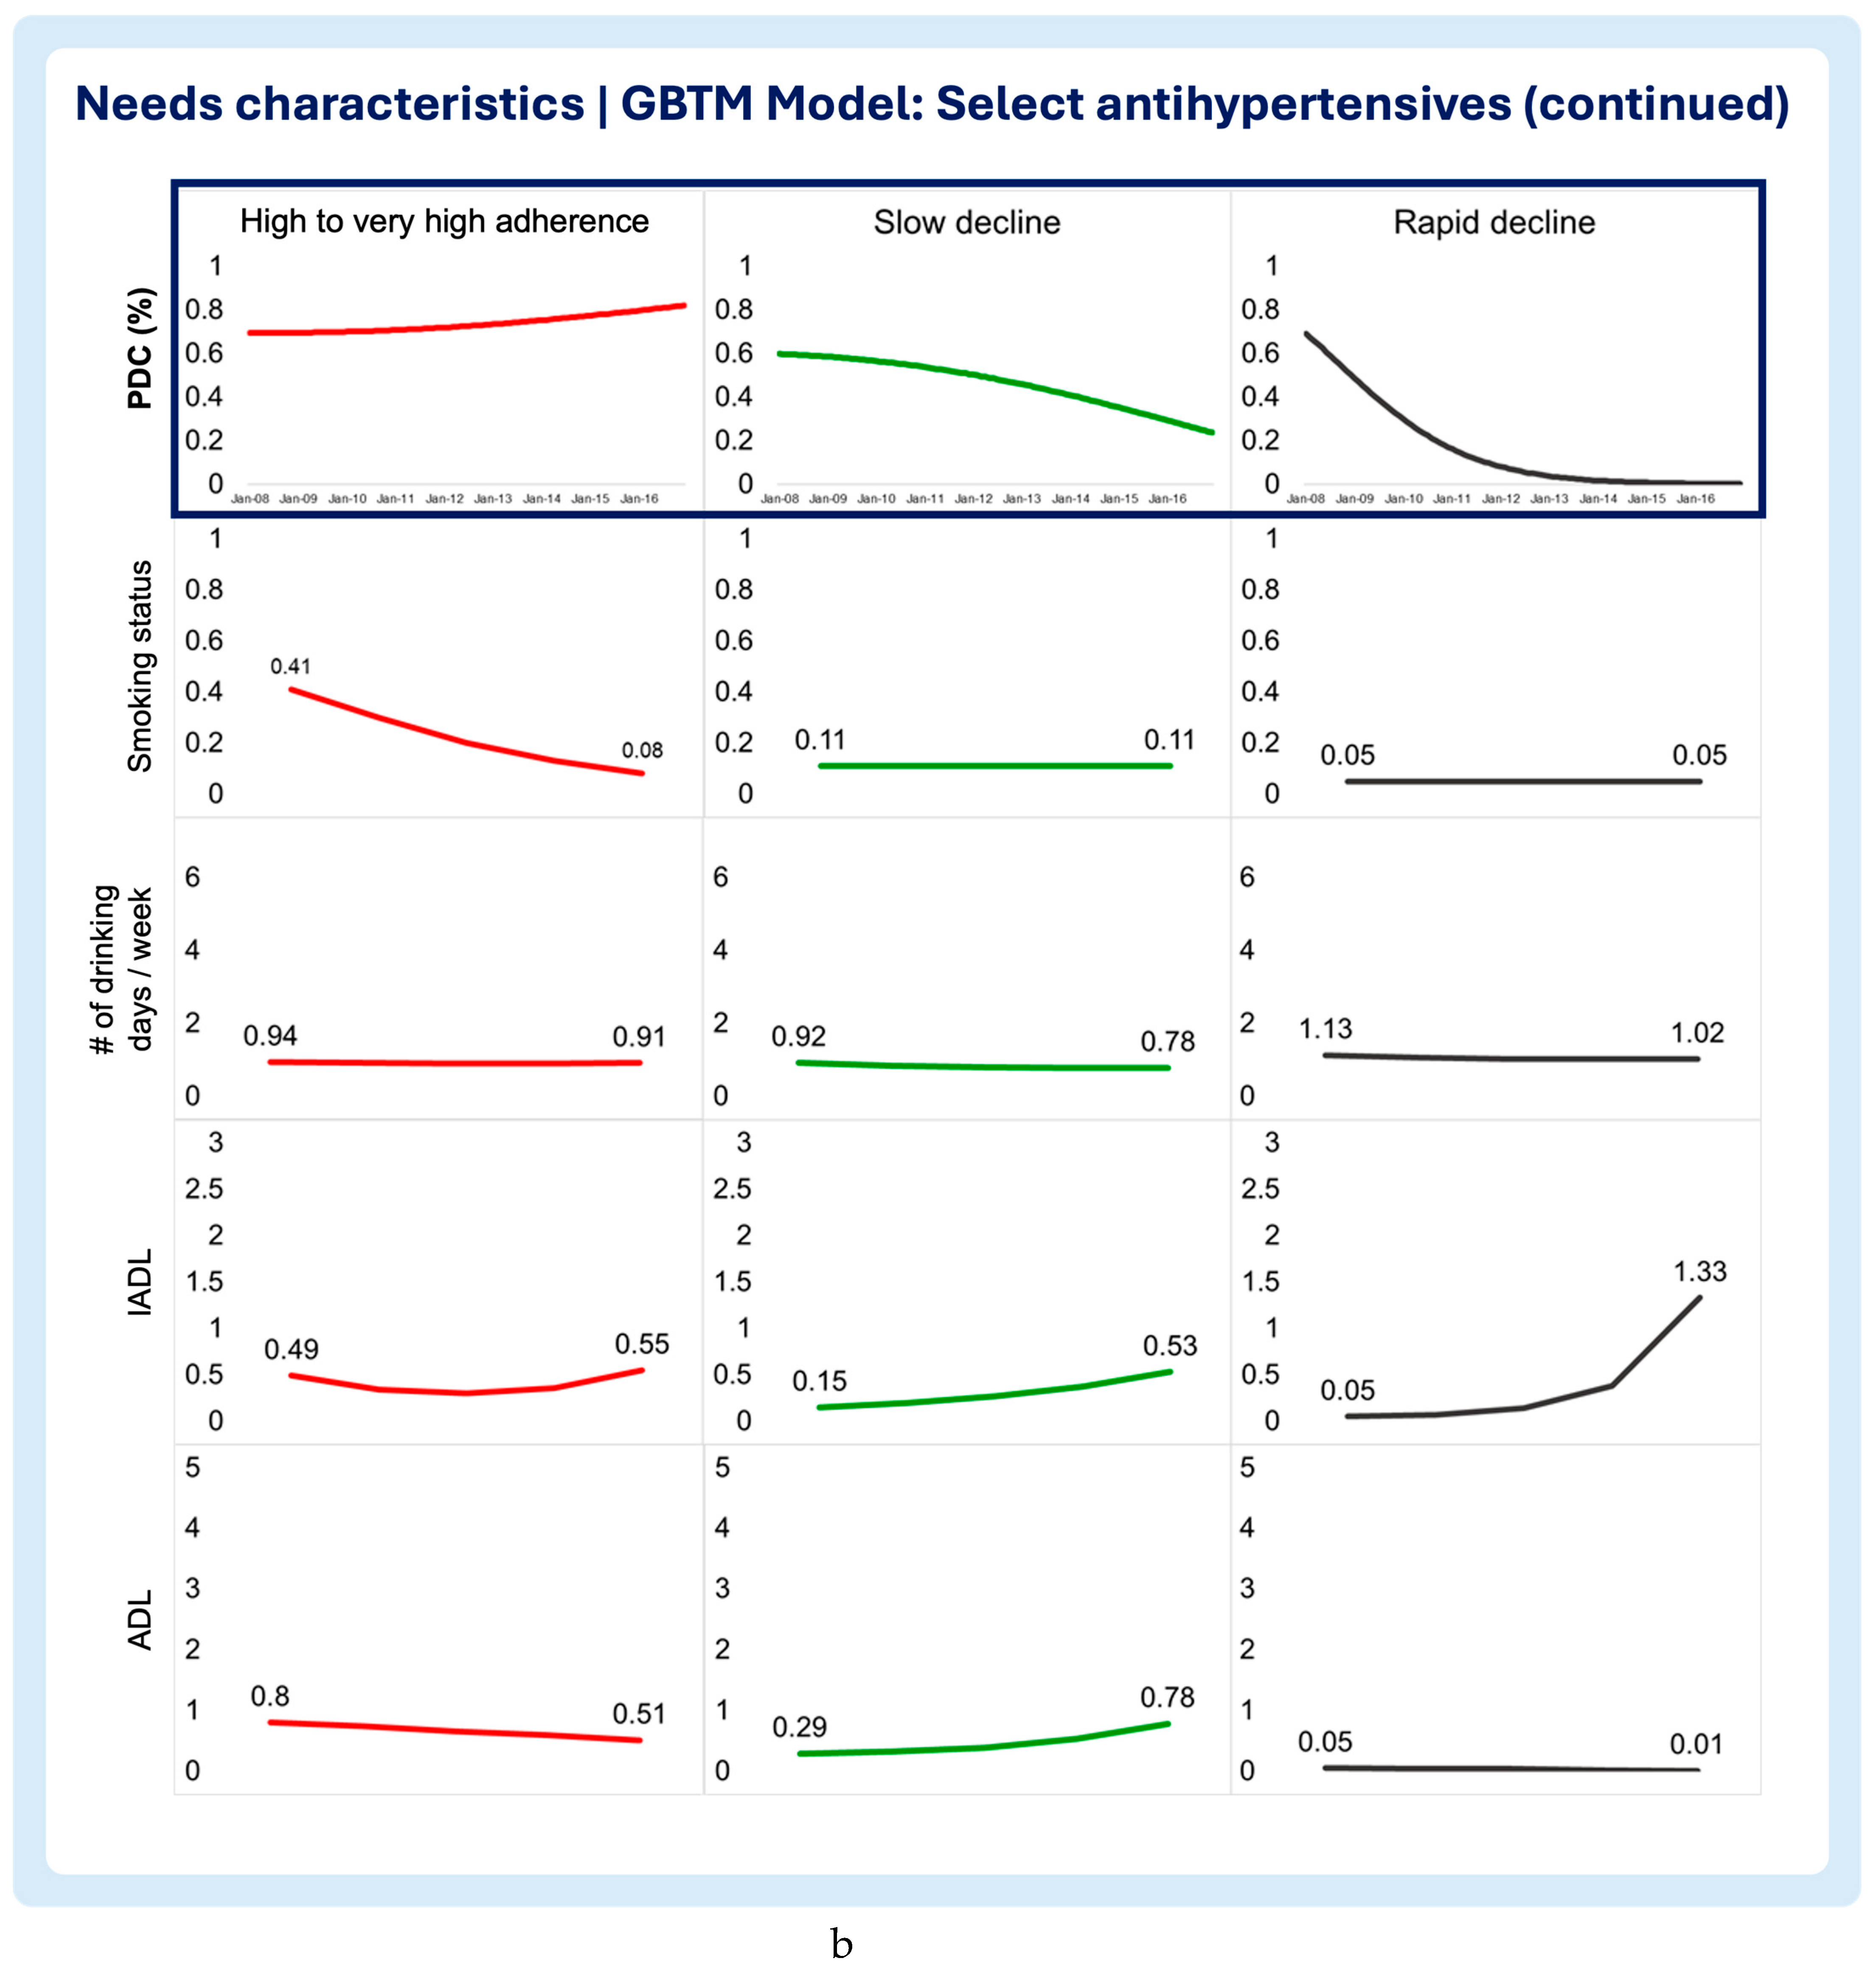
Figure 6.
a. Multitrajectory model of needs chracteristics and statins medication adherence trajectory. b. Multitrajectory model of needs chracteristics and statins medication adherence trajectory (continued).
Figure 6.
a. Multitrajectory model of needs chracteristics and statins medication adherence trajectory. b. Multitrajectory model of needs chracteristics and statins medication adherence trajectory (continued).
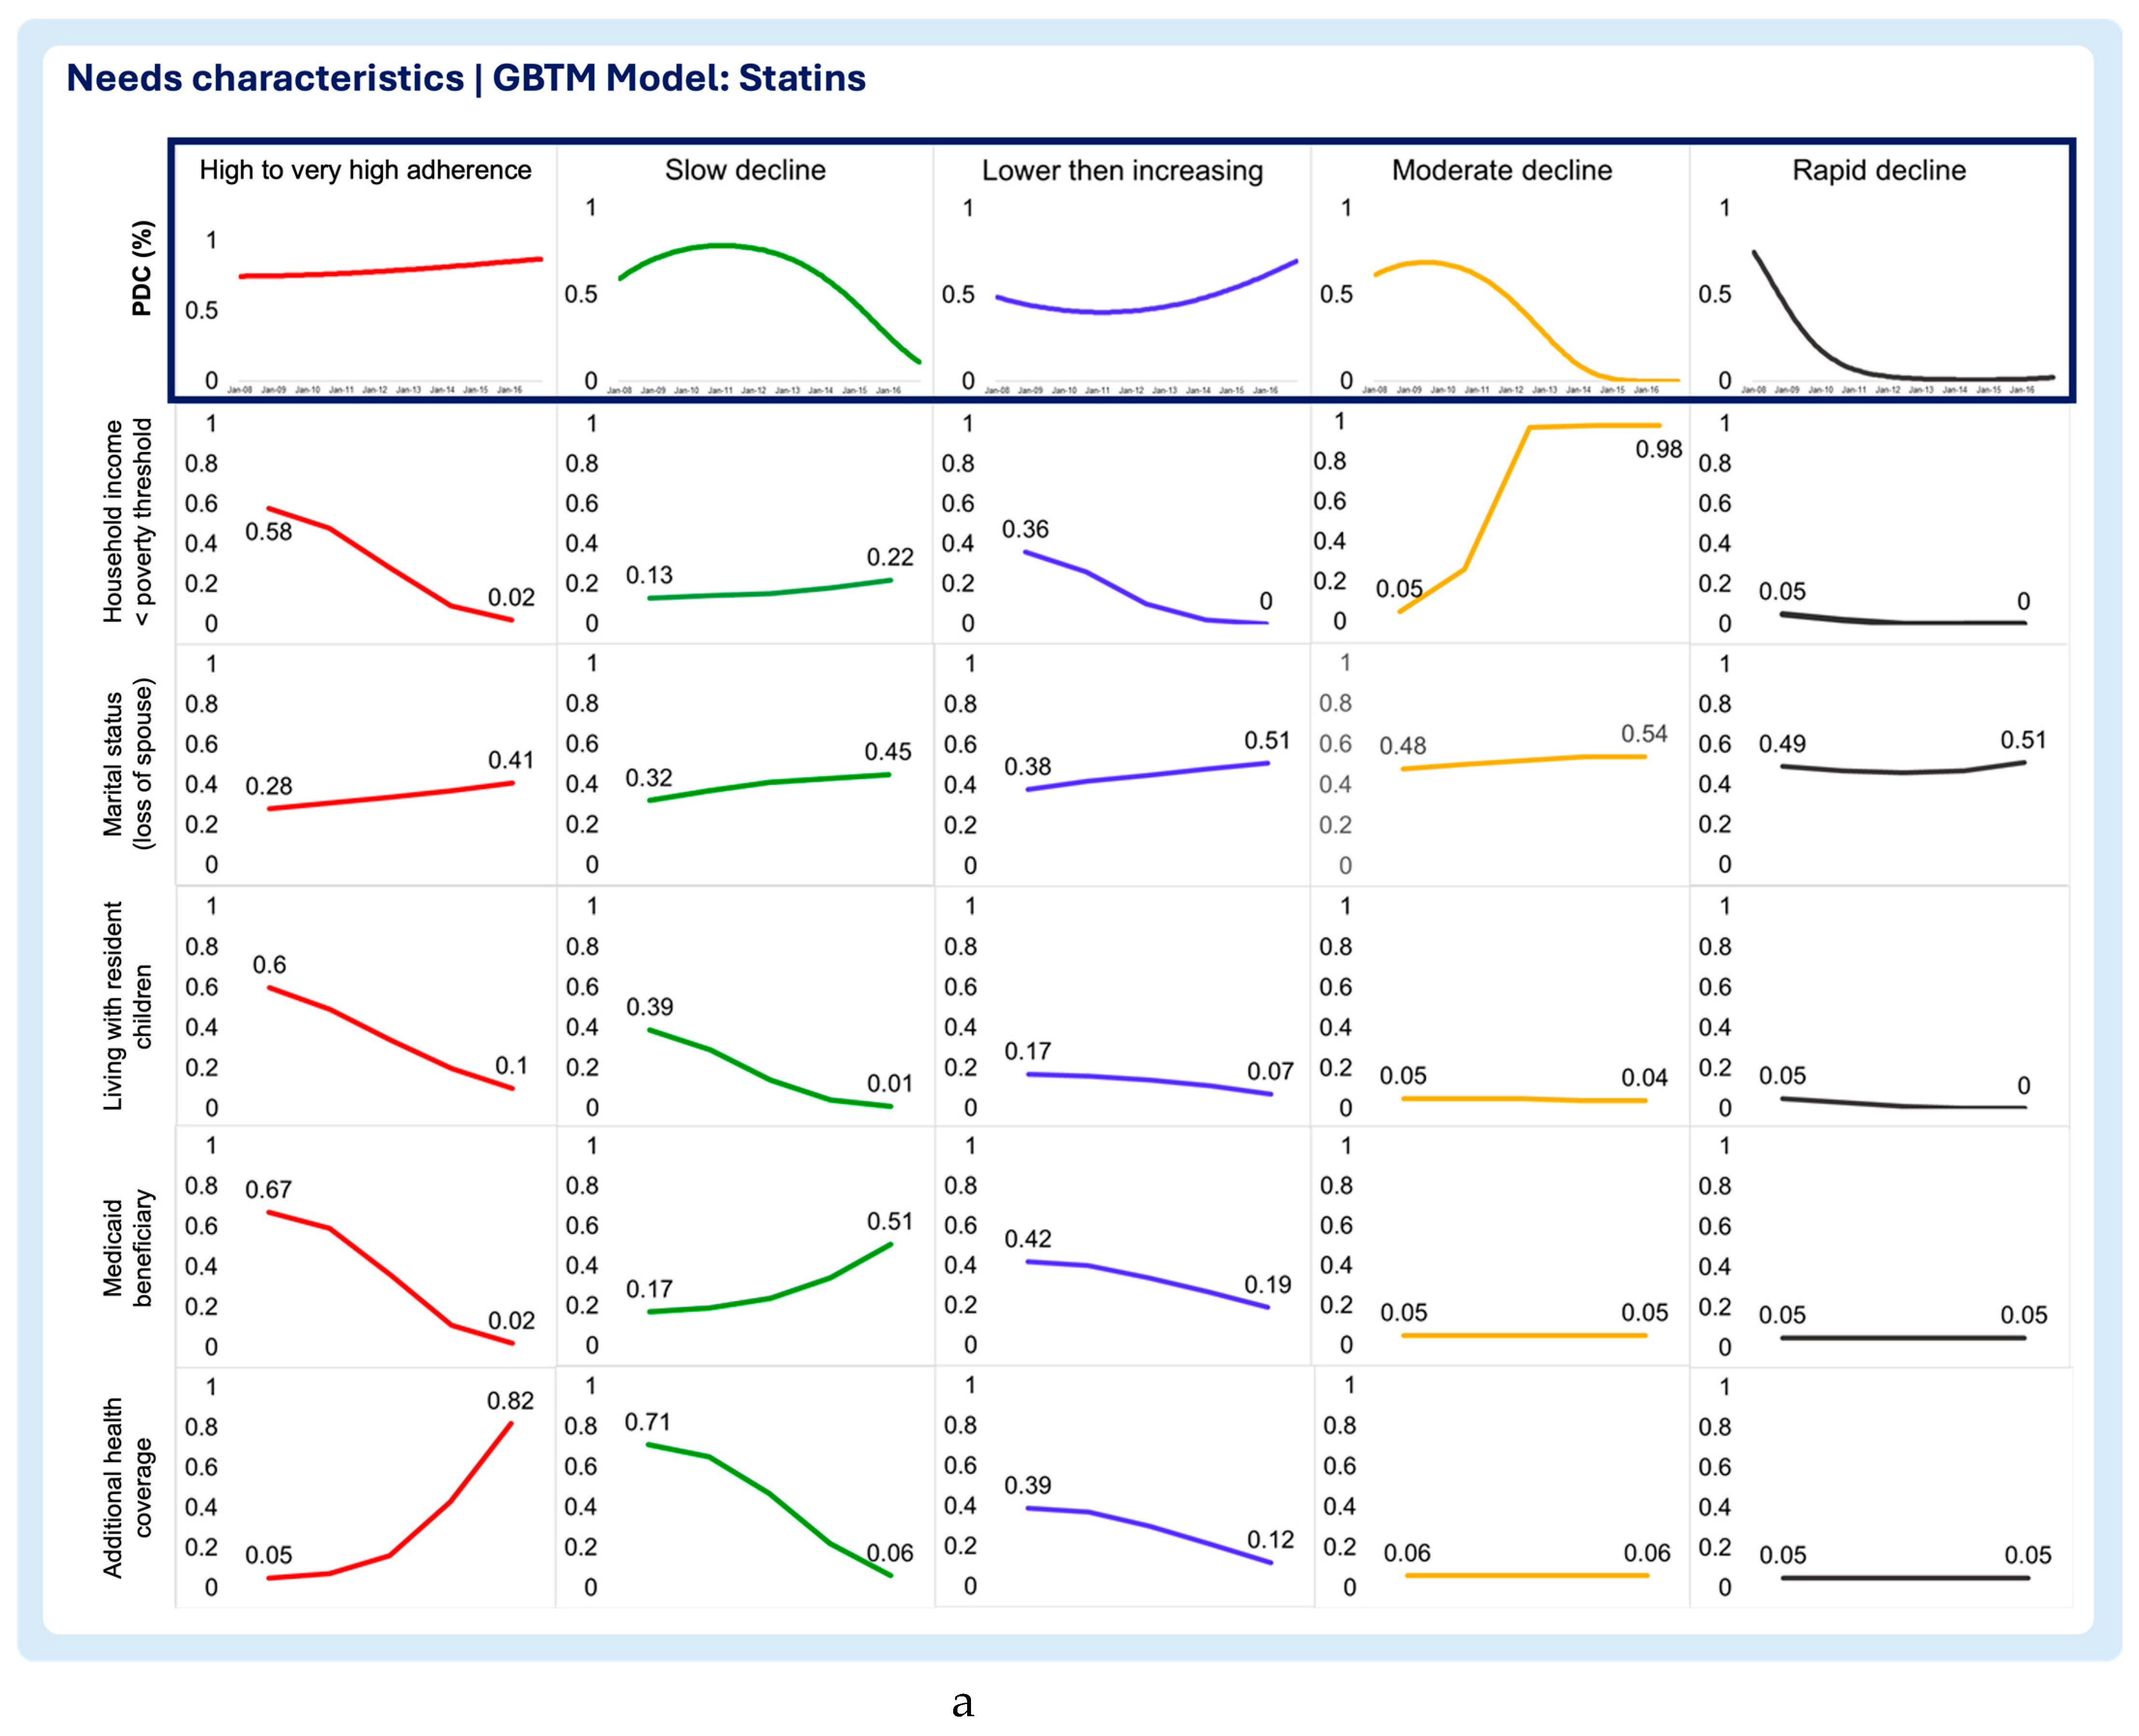
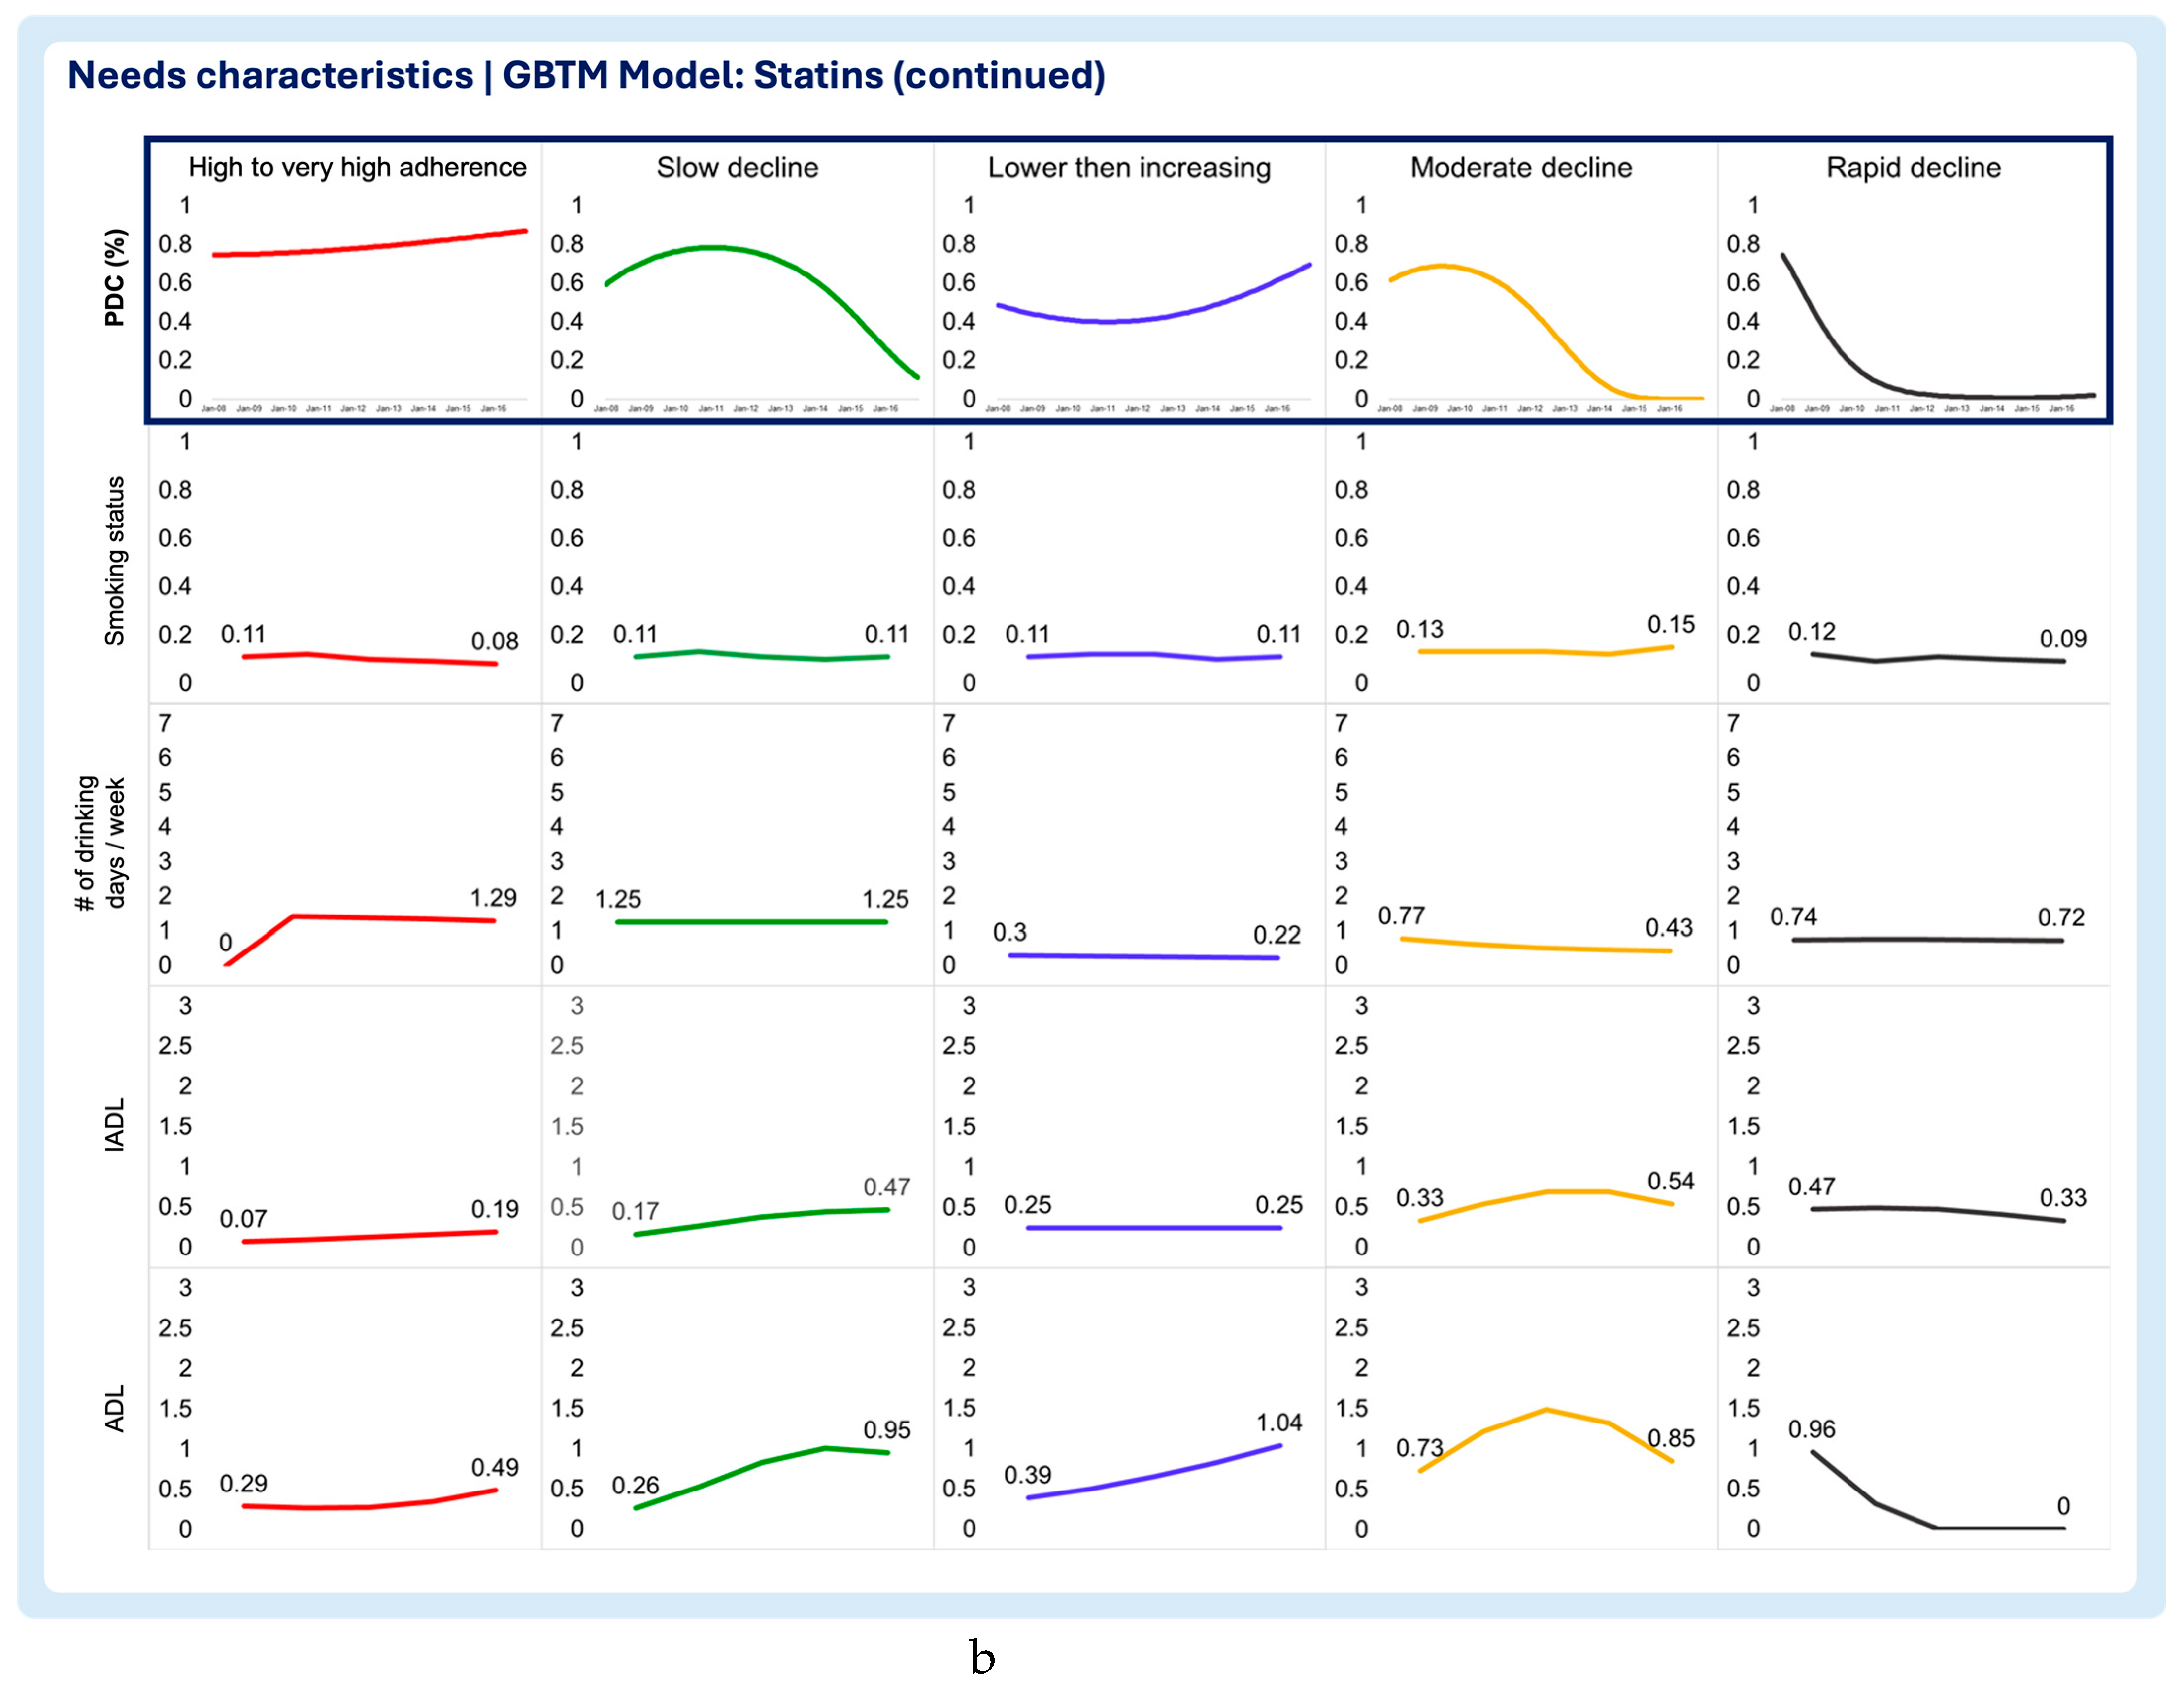
Figure 7.
a. Multitrajectory model of needs chracteristics and diabetes drugs medication adherence trajectory. b. Multitrajectory model of needs chracteristics and diabetes drugs medication adherence trajectory (continued).
Figure 7.
a. Multitrajectory model of needs chracteristics and diabetes drugs medication adherence trajectory. b. Multitrajectory model of needs chracteristics and diabetes drugs medication adherence trajectory (continued).
4. Discussion
This study applied a multitrajectory group-based model, guided by the ABM framework, to analyze how predisposing, enabling, and need characteristics influence membership in medication adherence trajectory groups. Unlike prior models based solely on administrative claims, this study used HRS survey data to capture enabling and need characteristics. Predictors of medication adherence trajectories were assessed using two approaches: a time-fixed risk model examining the association between predictors and trajectory membership, and a multitrajectory model exploring how adherence trajectories align with changes in time-varying need and enabling characteristics.
The numerous recent studies examining medication adherence patterns using GBTM is proof that research recognize that medication adherence is a dynamic behavior that can change with time.[22,29,30,31,32,33,34,35,36,37,38,39] Nevertheless, if one recognizes that medication adherence can change with time, the same can be said about the factors that influence it. Recent studies implementing a risk-model based on multinomial logistic regressions do not allow this type of characterization.[29,30,31,33] This is because traditional approach is limited to reporting adjusted odds ratios representing the association between predictors and trajectory memberships, all else equal. [40,41]
Time-fixed models found several risk factors associated with non-adherence, including predisposing characteristics such as being female, foreign-born, or non-white. These results align with previous studies linking non-adherence to demographic factors.[7,18,42,43,44,45] Even though college education was not found to be a significant risk factor for belonging to at least one non-adherent trajectory in any of the three models, a similar study linking administrative healthcare claims to a population-level survey from Australia reported similar findings when education was adjusted for covariates similar to ones considered in this study.[42]
The multitrajectory model revealed that enabling characteristics like self-reported health, depression symptoms, and life satisfaction significantly predicted non-adherence. While time-fixed models linked non-adherence to depression, smoking, and drinking, multitrajectory analysis showed stable probabilities for smoking and drinking but highlighted dynamic shifts in Medicaid eligibility, additional health coverage, and independence levels (IADL/ADL). Notably, additional health coverage, non-significant in time-fixed models, was strongly linked to high adherence in multitrajectory analysis. It is important to clarify that variations in these characteristics do not imply a causal relationship but rather a longitudinal description of how each adherence trajectories and covariates trajectories progressed with time
In essence, the time-fixed approach exhibited inconsistency in identifying which predictors were statistically significant factors of each medication adherence trajectory across pharmacotherapy classes. If researchers use only a time-fixed approach, results can exhibit statistical significance or not, like in this study. In case of non-statistical significance, the strength of evidence to guide actual practice innovations could be hampered. However, using the time-varying approach, researchers can look at the trajectory of individual predictors and determine if there is an actual variation over time that could be clinically meaningful. Practitioners can then investigate whether those predictor variations over time are worth tackling in practice to improve medication adherence.
This study emphasizes the value of multitrajectory modeling in identifying predictors of non-adherence linked to significant changes over time. This approach helps healthcare providers pinpoint key aspects of a patient’s life requiring intervention, such as the loss of a caregiving spouse, secondary health coverage, or autonomy. By characterizing these predictors throughout time, multitrajectory analysis can guide targeted interventions and referrals, tailoring care to the specific needs of the patient population.
Limitations
Several limitations exist. Risk factors were drawn from the HRS using the ABM framework, but the HRS was not specifically designed to measure medication adherence predictors. High rates of missing data may have affected significance in time-fixed models and biased multitrajectory analysis. Additionally, there was a mismatch in measurement periods - adherence was estimated monthly using PDC, while risk factors were measured biennially in the HRS. Despite these limitations, the study highlights multitrajectory analysis as a promising method for exploring the impact of time-varying predictors on adherence. Finally, this study included data obtained from HRS, which was obtained via surveys, which could be subject to potential recall bias.
5. Conclusions
This study demonstrated the potential of multitrajectory modeling to identify time-varying risk factors for non-adherence. Unlike traditional multinomial regression, this approach identifies both static and dynamic predictors, offering insights into which factors meaningfully change over time. Such methods can guide targeted interventions, improve medication adherence, and better support at-risk patient populations.
Author Contributions
Conceptualization, VMP, KBF, and DAH; methodology, VMP, JAP, NVC, KBF, and DAH; validation, VMP, KBF, DLD, and DAH; formal analysis, VMP; investigation, VMP, KBF, NVC, and DAH; resources, DAH, KBF; data curation, VMP, JAP, and KBF; writing—original draft preparation, VMP; writing—review and editing, JAP, NVC, DLD, DM, KBF, DAH; visualization, VMP; supervision, KBF and DAH; project administration, VMP, KBF, and DAH; funding acquisition, VMP and DAH. All authors have read and agreed to the published version of the manuscript.
Funding
This research was partly funded by the PhRMA Foundation through the Predoctoral Fellowship in Value Assessment & Health Outcomes Research.
Institutional Review Board Statement
The study was conducted in accordance with the Declaration of Helsinki and approved by the Institutional Review Board of the Virginia Commonwealth University (protocol code HM20020850 approved on 10/23/2020).
Informed Consent Statement
This study was not considered human subject research by the IRB, since it used anonymized secondary data sources.
Data Availability Statement
We encourage all authors of articles published in MDPI journals to share their research data. In this section, please provide details regarding where data supporting reported results can be found, including links to publicly archived datasets analyzed or generated during the study. Where no new data were created, or where data is unavailable due to privacy or ethical restrictions, a statement is still required. Suggested Data Availability Statements are available in section “MDPI Research Data Policies” at https://www.mdpi.com/ethics.
Conflicts of Interest
Dr. Dixon has received grant funding from Boehringer Ingelheim. All other authors declare no relevant conflicts of interest or financial relationships. The funders had no role in the design of the study; in the collection, analyses, or interpretation of data; in the writing of the manuscript; or in the decision to publish the results.
Abbreviations
The following abbreviations are used in this manuscript:
| GBTM | Group-based trajectory modeling |
| PDC | Proportion of Days Covered |
| HRS | Health & Retirement Study |
| VIF | Variance Inflation Factor |
| ADL | Activities of Daily Living |
| IADL | Instrumental Activities of Daily Living |
Appendix A
Operationalization of Enabling and Need Characteristics Covariates

| Characteristic | Covariates | Measurement approach |
|---|---|---|
| Enabling characteristics | Self-reported health status | 5-point scale: 1 - Excellent 2 – Very good 3 - Good 4 - Fair 5 - Poor |
| Depression symptoms | CES-D 8-Item Scale. Per Steffick and colleagues, a score > 3 is indicative of clinical depression24 0 – No depression symptoms (CES-D score ≤3) 1 – With depression symptoms (CES-D score >3) |
|
| Life Satisfaction | 5-point scale: 1 – Completely satisfied 2 – Very satisfied 3 – Somewhat satisfied 4 – Not very satisfied 5 – Not at all satisfied |
|
| Retirement Satisfaction | 3-point scale: 1 – Very satisfying 2 – Moderately satisfying 3 – Not at all satisfying |
|
| Limitations in work due to health | Yes (1) / No (0) | |
| Need characteristics | Poverty threshold | Below (1) / Above (0) |
Family structure
|
Yes (1) / No (0) Yes (1) / No (0) |
|
| Medicaid beneficiary | Yes (1) / No (0) | |
| Additional health coverage | Yes (1) / No (0) | |
Substance abuse
|
Yes (1) / No (0) Number of drinking days / week |
|
Assistance with activities
|
Number of activities requiring assistance/can’t perform |
|
| CES-D: 8-item Center for Epidemiological Studies Depression Scale [46] | ||
Appendix B
Given the possibility of multicollinearity, the variance inflation factor (VIF) was computed to determine by how much each risk factor estimate is increased because of high correlation with other risk factors. VIF and R2 were computed to examine the presence of Multicollinearity for the risk factors in each adjusted group-based trajectory model. In general, a VIF greater than 5 is indicative of multicollinearity.
| GBTM MODEL | Select hypertensives | Statins | Diabetes | |||
|---|---|---|---|---|---|---|
| Covariate | VIF | R-Squared | VIF | R-Squared | VIF | R-Squared |
| Predisposing and antecedents | ||||||
| Sex: Female | 1.170 | 0.144 | 1.150 | 0.130 | 1.220 | 0.179 |
| Birthplace: Foreign born | 1.430 | 0.299 | 1.470 | 0.320 | 1.590 | 0.372 |
| Race: Non-white | 1.200 | 0.165 | 1.180 | 0.153 | 1.190 | 0.162 |
| Ethnicity: Hispanic | 1.530 | 0.347 | 1.550 | 0.357 | 1.740 | 0.425 |
| Education: Not College educated | 1.820 | 0.451 | 1.850 | 0.459 | 1.790 | 0.440 |
| Enabling characteristics | ||||||
| Self-reported Health Status | 1.550 | 0.355 | 1.500 | 0.332 | 1.470 | 0.319 |
| Depression Symptoms | 1.930 | 0.482 | 2.010 | 0.502 | 1.960 | 0.490 |
| Life Satisfaction | 1.280 | 0.216 | 1.260 | 0.204 | 1.260 | 0.205 |
| Retirement Satisfaction | 1.310 | 0.237 | 1.320 | 0.242 | 1.240 | 0.191 |
| Limitations in work due to health | 1.270 | 0.211 | 1.290 | 0.224 | 1.300 | 0.232 |
| Need characteristics | ||||||
| Household income below poverty index | 1.340 | 0.252 | 1.330 | 0.251 | 1.340 | 0.256 |
| Marital spouse: Loss of spouse | 1.220 | 0.182 | 1.200 | 0.169 | 1.280 | 0.218 |
| Number of resident children | 1.080 | 0.074 | 1.080 | 0.075 | 1.060 | 0.057 |
| Medicaid eligibility | 1.320 | 0.245 | 1.320 | 0.241 | 1.360 | 0.263 |
| Additional health coverage | 1.130 | 0.118 | 1.120 | 0.110 | 1.180 | 0.155 |
| Smoking status: Smoker | 1.050 | 0.051 | 1.060 | 0.054 | 1.030 | 0.029 |
| Number of drinking days / week | 1.140 | 0.119 | 1.100 | 0.093 | 1.080 | 0.070 |
| Instrumental Activities of Daily Living | 1.360 | 0.263 | 1.410 | 0.289 | 1.550 | 0.356 |
| Activities of Daily Living | 1.510 | 0.336 | 1.510 | 0.339 | 1.760 | 0.432 |
| Mean VIF | 1.381 | 1.389 | 1.410 | |||
References
- Arlt S, Lindner R, Rosler A, von Renteln-Kruse W. Adherence to medication in patients with dementia: predictors and strategies for improvement. Drugs Aging. 2008;25(12):1033-47. [CrossRef]
- Bowry AD, Shrank WH, Lee JL, Stedman M, Choudhry NK. A systematic review of adherence to cardiovascular medications in resource-limited settings. J Gen Intern Med. Dec 2011;26(12):1479-91. [CrossRef]
- Coletti DJ, Stephanou H, Mazzola N, Conigliaro J, Gottridge J, Kane JM. Patterns and predictors of medication discrepancies in primary care. J Eval Clin Pract. Oct 2015;21(5):831-9. [CrossRef]
- Gard PR. Non-adherence to antihypertensive medication and impaired cognition: which comes first? Int J Pharm Pract. Oct 2010;18(5):252-9. [CrossRef]
- Hudani ZK, Rojas-Fernandez CH. A scoping review on medication adherence in older patients with cognitive impairment or dementia. Res Social Adm Pharm. Nov-Dec 2016;12(6):815-829. [CrossRef]
- Lenti MV, Selinger CP. Medication non-adherence in adult patients affected by inflammatory bowel disease: a critical review and update of the determining factors, consequences and possible interventions. Expert Rev Gastroenterol Hepatol. Mar 2017;11(3):215-226. [CrossRef]
- Warren JR, Falster MO, Fox D, Jorm L. Factors influencing adherence in long-term use of statins. Pharmacoepidemiol Drug Saf. Dec 2013;22(12):1298-307. [CrossRef]
- World Health Organization. Adherence to Long-Term Therapies: Evidence for action. World Health Organization. Accessed 20/01/2020. https://apps.who.int/medicinedocs/pdf/s4883e/s4883e.pdf.
- Brown MT, Bussell JK. Medication adherence: WHO cares? Mayo Clin Proc. Apr 2011;86(4):304-14. [CrossRef]
- Andersen RM. Revisiting the behavioral model and access to medical care: does it matter? J Health Soc Behav. Mar 1995;36(1):1-10.
- Andersen RM, Davidson PL, Baumeister SE. Improving access to care in America. Changing the US health care system: key issues in health services policy and management. 3rd ed. Jossey-Bass; 2007:3-31.
- Alhazami M, Pontinha VM, Patterson JA, Holdford DA. Medication Adherence Trajectories: A Systematic Literature Review. J Manag Care Spec Pharm. Sep 2020;26(9):1138-1152. [CrossRef]
- Ajrouche A, Estellat C, De Rycke Y, Tubach F. Trajectories of Adherence to Low-Dose Aspirin Treatment Among the French Population. J Cardiovasc Pharmacol Ther. Jan 2020;25(1):37-46. [CrossRef]
- Dillon P, Stewart D, Smith SM, Gallagher P, Cousins G. Group-Based Trajectory Models: Assessing Adherence to Antihypertensive Medication in Older Adults in a Community Pharmacy Setting. Clin Pharmacol Ther. Jun 2018;103(6):1052-1060. [CrossRef]
- Feldman CH, Collins J, Zhang Z, et al. Dynamic patterns and predictors of hydroxychloroquine nonadherence among Medicaid beneficiaries with systemic lupus erythematosus. Semin Arthritis Rheum. Oct 2018;48(2):205-213. [CrossRef]
- Franklin JM, Krumme AA, Shrank WH, Matlin OS, Brennan TA, Choudhry NK. Predicting adherence trajectory using initial patterns of medication filling. Am J Manag Care. Sep 1 2015;21(9):e537-44.
- Franklin JM, Shrank WH, Pakes J, et al. Group-based trajectory models: a new approach to classifying and predicting long-term medication adherence. Med Care. Sep 2013;51(9):789-96. [CrossRef]
- Hernandez I, He M, Chen N, Brooks MM, Saba S, Gellad WF. Trajectories of Oral Anticoagulation Adherence Among Medicare Beneficiaries Newly Diagnosed With Atrial Fibrillation. J Am Heart Assoc. Jun 18 2019;8(12):e011427. [CrossRef]
- Nagin DS, Jones BL, Passos VL, Tremblay RE. Group-based multi-trajectory modeling. Stat Methods Med Res. Jul 2018;27(7):2015-2023. [CrossRef]
- Nagin DS. Group-based modeling of development. Harvard University Press; 2005.
- Nagin DS. Group-based trajectory modeling: an overview. Ann Nutr Metab. 2014;65(2-3):205-10. [CrossRef]
- Pontinha VM, Patterson JA, Dixon DL, et al. Longitudinal medication adherence group-based trajectories of aging adults in the US: A retrospective analysis using monthly proportion of days covered calculations. Res Social Adm Pharm. Dec 27 2023;doi:10.1016/j.sapharm.2023.12.008.
- RAND Center for the Study of Aging. RAND HRS Longitudinal File 2016 (V2) Documentation. Accessed 03/05/2020. https://hrsdata.isr.umich.edu/sites/default/files/documentation/codebooks/randhrs1992_2016v2.pdf.
- Stata Statistical Software: Release 17. StataCorp LLC; 2021.
- Jones BL, Nagin DS. A Note on a Stata Plugin for Estimating Group-based Trajectory Models. Sociological Methods & Research. 2013/11/01 2013;42(4):608-613. [CrossRef]
- Montgomery DC. Introduction to linear regression analysis. Fifth edition. ed. Wiley; 2013.
- Kutner MH, Nachtsheim C, Neter J. Applied linear regression models. 4th / ed. vol Boston ; New York :. McGraw-Hill/Irwin; 2004.
- Burckhardt P, Nagin DS, Padman R. Multi-Trajectory Models of Chronic Kidney Disease Progression. AMIA Annu Symp Proc. 2016;2016:1737-1746.
- Woolpert KM, Schmidt JA, Ahern TP, et al. Clinical factors associated with patterns of endocrine therapy adherence in premenopausal breast cancer patients. Breast Cancer Res. Apr 8 2024;26(1):59. [CrossRef]
- Fatima B, Mohan A, Altaie I, Abughosh S. Predictors of adherence to direct oral anticoagulants after cardiovascular or bleeding events in Medicare Advantage Plan enrollees with atrial fibrillation. J Manag Care Spec Pharm. May 2024;30(5):408-419. [CrossRef]
- Chang CY, Jones BL, Hincapie-Castillo JM, et al. Association between trajectories of adherence to endocrine therapy and risk of treated breast cancer recurrence among US nonmetastatic breast cancer survivors. Br J Cancer. Jun 2024;130(12):1943-1950. [CrossRef]
- Wabe N, Timothy A, Urwin R, Xu Y, Nguyen A, Westbrook JI. Analysis of Longitudinal Patterns and Predictors of Medicine Use in Residential Aged Care Using Group-Based Trajectory Modeling: The "MEDTRAC-Cardiovascular" Longitudinal Cohort Study. Pharmacoepidemiol Drug Saf. Aug 2024;33(8):e5881. [CrossRef]
- Schmidt JA, Woolpert KM, Hjorth CF, Farkas DK, Ejlertsen B, Cronin-Fenton D. Social Characteristics and Adherence to Adjuvant Endocrine Therapy in Premenopausal Women With Breast Cancer. J Clin Oncol. Jun 25 2024:JCO2302643. [CrossRef]
- Mohan A, Chen H, Deshmukh AA, et al. Group-based trajectory modeling to identify adherence patterns for direct oral anticoagulants in Medicare beneficiaries with atrial fibrillation: a real-world study on medication adherence. Int J Clin Pharm. Aug 27 2024;doi:10.1007/s11096-024-01786-y.
- Ishiwata R, AlAshqar A, Miyashita-Ishiwata M, Borahay MA. Dispensing patterns of antidepressant and antianxiety medications for psychiatric disorders after benign hysterectomy in reproductive-age women: Results from group-based trajectory modeling. Womens Health (Lond). Jan-Dec 2024;20:17455057241272218. [CrossRef]
- Huang W, Ahmed MM, Morris EJ, et al. Trajectories of Sacubitril/Valsartan Adherence Among Medicare Beneficiaries With Heart Failure. JACC Adv. Jul 2024;3(7):100958. [CrossRef]
- Abegaz TM, Shehab A, Gebreyohannes EA, Bhagavathula AS, Elnour AA. Nonadherence to antihypertensive drugs: A systematic review and meta-analysis. Medicine (Baltimore). Jan 2017;96(4):e5641. [CrossRef]
- Ruksakulpiwat S, Schiltz NK, Irani E, Josephson RA, Adams J, Still CH. Medication Adherence of Older Adults with Hypertension: A Systematic Review. Patient Prefer Adherence. 2024;18:957-975. [CrossRef]
- Stentzel U, van den Berg N, Schulze LN, et al. Predictors of medication adherence among patients with severe psychiatric disorders: findings from the baseline assessment of a randomized controlled trial (Tecla). BMC Psychiatry. May 29 2018;18(1):155. BMC Psychiatry. [CrossRef]
- Cummings P. The relative merits of risk ratios and odds ratios. Arch Pediatr Adolesc Med. May 2009;163(5):438-45. [CrossRef]
- Greenland S. Interpretation and choice of effect measures in epidemiologic analyses. Am J Epidemiol. May 1987;125(5):761-8. [CrossRef]
- Park KH, Tickle L, Cutler H. Identifying temporal patterns of adherence to antidepressants, bisphosphonates and statins, and associated patient factors. SSM - Population Health. 2022/03/01/ 2022;17:100973. [CrossRef]
- Wang CH, Huang LC, Yang CC, et al. Short- and long-term use of medication for psychological distress after the diagnosis of cancer. Support Care Cancer. Mar 2017;25(3):757-768. [CrossRef]
- Hsu YH, Mao CL, Wey M. Antihypertensive medication adherence among elderly Chinese Americans. J Transcult Nurs. Oct 2010;21(4):297-305. [CrossRef]
- Bird GC, Cannon CP, Kennison RH. Results of a survey assessing provider beliefs of adherence barriers to antiplatelet medications. Crit Pathw Cardiol. Sep 2011;10(3):134-41. [CrossRef]
- Turvey CL, Wallace RB, Herzog R. A revised CES-D measure of depressive symptoms and a DSM-based measure of major depressive episodes in the elderly. Int Psychogeriatr. Jun 1999;11(2):139-48. [CrossRef]
Figure 1.
Study conceptual framework.
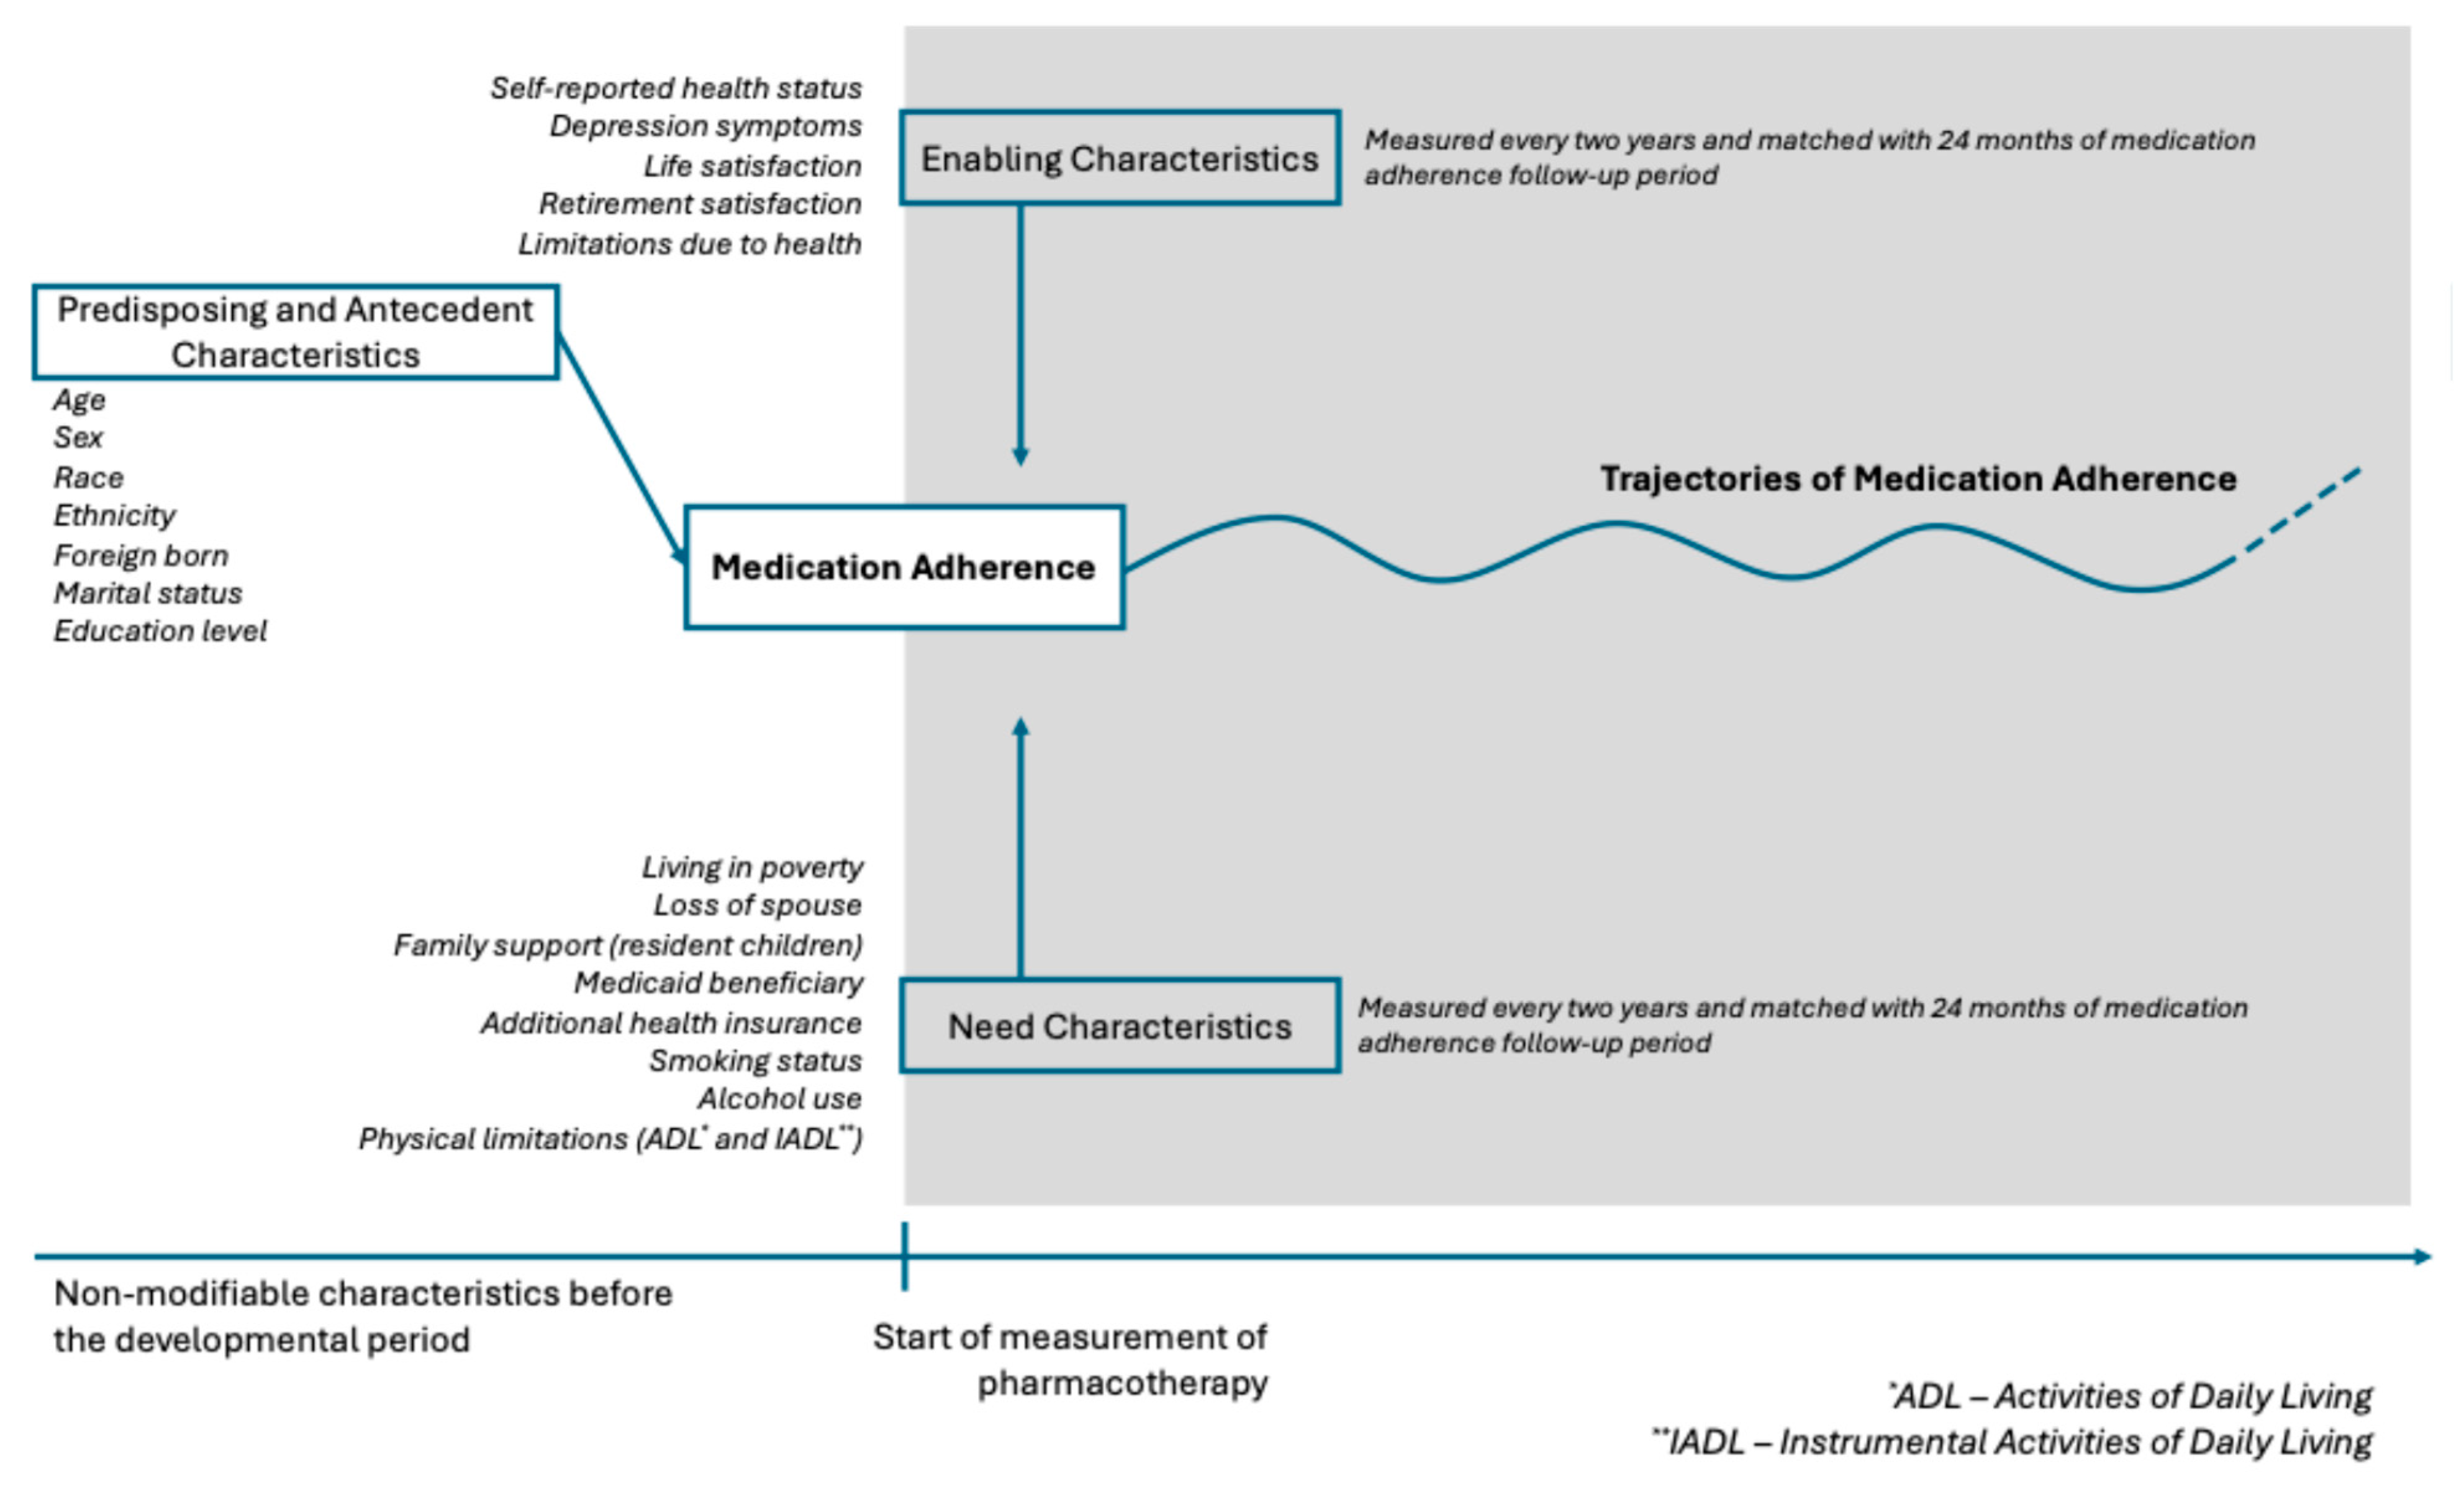
Table 1.
Operationalization of the dimensions of two conceptual frameworks: the Andersen's Behavioral Model of Health Services Use and the Causes of Non-Adherence summarized by the World Health Organization.
Table 1.
Operationalization of the dimensions of two conceptual frameworks: the Andersen's Behavioral Model of Health Services Use and the Causes of Non-Adherence summarized by the World Health Organization.
| WHO Report: Causes of Non-Adherence | ||||||
| Socioeconomic | Health care team / Health care system | Disease-related factors | Therapy-related factors | Patient-related factors | ||
| Andersen's Behavioral Model of Health Services Use | Predisposing characteristics | Education, race, ethnicity, income, occupation, marital status | Trust in medical organizations/health care team | Health-beliefs | Transportation, distance to health services, substance abuse | |
| Enabling factors | Urbanicity, Medicaid eligibility | Access to health care services, wait times, difficulty filling prescriptions, cost, health information, integration of health care team, physician-patient communication, facetime with health care providers | Health insurance, social/family support, health literacy | |||
| Need characteristics | Evaluated health-status, comorbidities (MI, stroke, cancer), severity, symptoms | Treatment complexity, route of administration, side effects, duration, degree of behavioral change required | Activities of daily living, limitations in activities/profession, risk-factors (obesity, smoking, alcohol use) | |||
Table 2.
Study sample Sociodemographic, Enabling, and Need Characteristics.
| Sample Characteristics | Frequency of study participants (n,%) | Missing Data |
| N = 11,068 | (n, %) | |
| Predisposing and antecedents | ||
| Sex (n=11,068) | 0, 0% | |
| Female | 6,724, 60.75% | |
| Birthplace (n=9,564) | 1,504, 13.58% | |
| US-born | 8,475, 88.61% | |
| Race (n=11,057) | 11, 0.09% | |
| Non-white | 2,597, 23.49% | |
| Ethnicity (n=11,058) | 10, 0.09% | |
| Hispanic | 1,302, 11.77% | |
| Education (n=11,068) | 0, 0% | |
| Has college degree or higher | 2,263, 20.45% | |
| Enabling characteristics | ||
| Self-reported health status (n=6,308) | 4,760, 43.01% | |
| Excellent | 282, 4.47% | |
| Very good | 1,349, 21.39% | |
| Good | 2,127, 33.72% | |
| Fair | 1,826, 28.95% | |
| Poor | 724, 11.48% | |
| Depression symptoms (n=9,432) | 1,636, 14.78% | |
| With clinical depression* | 1,919, 20.35% | |
| Life Satisfaction (n=1,761) | 9,307, 84.09% | |
| Completely satisfied | 395, 22.43% | |
| Very satisfied | 726, 41.23% | |
| Somewhat satisfied | 528, 29.98% | |
| Not very satisfied | 85, 4.83% | |
| Not at all satisfied | 27, 1.53% | |
| Retirement Satisfaction (n=4,667) | 6,401, 57.83% | |
| Very Satisfied | 2,132, 45.68% | |
| Moderately satisfied | 2,048, 43.88% | |
| Not at all satisfied | 487, 10.43% | |
| Limitations in work due to health (n=5,977) | ||
| Yes | 3,435, 57.47% | 5,091, 46.00% |
| Need characteristics | ||
| Poverty Index (n=9,609) | 1,459, 13.18% | |
| Household income below poverty threshold | 1,426, 14,84% | |
| Marital Status (n=9,805) | 1,263, 11.41% | |
| Loss of spouse or never married** | 5,404, 55.11% | |
| Lives with spouse, partner | 4,401, 44.89% | |
| Number of resident children (n=6,320) | 4,748, 42,90% | |
| Does not live with resident children | 4,852, 76.77% | |
| Lives with resident children | 1,468, 23.23% | |
| Medicaid eligibility (n=9,798) | 1270, 11.47% | |
| Medicaid beneficiary | 2,007, 20.48% | |
| Additional health insurance coverage (n=6,216) | 4,852, 43,84% | |
| Has additional insurance | 1,920, 30.89% | |
| Smoking status (n=9,749) | 1319, 11.91% | |
| Smokers | 986, 10.11% | |
| Number of drinking days per week (n=6,294) | 4,774, 43.13% | |
| 0 or doesn’t drink | 4,473, 71.07% | |
| 1 | 658, 10.45% | |
| 2 | 304, 4.83% | |
| 3 | 245, 3.89% | |
| 4 | 102, 1.62% | |
| 5 | 124, 1.97% | |
| 6 | 52, 0.83% | |
| 7 | 336, 5.34% | |
| Instrumental Activities of Daily Living (n=9,822) | 1,246, 11.25% | |
| 0 (Highly functional) | 7,458, 75.93% | |
| 1 | 1,035, 10.54% | |
| 2 | 605, 6.16% | |
| 3 (Not functional) | 724, 7.37% | |
| Activities of Daily Living (n=9,822) | 1,246, 11.25% | |
| 0 (Completely independent) | 6,316, 64.3% | |
| 1 | 1,160, 11.81% | |
| 2 | 735, 7.48% | |
| 3 | 504, 5.13% | |
| 4 | 486, 4.95% | |
| 5 (Totally dependent) | 621, 6.32% | |
| Pharmacotherapeutic class*** | ||
| Select antihypertensives | 7,727, 69.81% | |
| Blood cholesterol lowering drugs | 8,221, 74.28% | |
| Oral diabetes medications | 3,214, 29.04% | |
| * The CESD-8 (Center for Epidemiologic Studies Depression 8-item) scale is a validated instrument to measure depressive symptoms. Per Steffick and colleagues, a score > 3 is indicative of clinical depression24 | ||
| ** Loss of spouse due to death, separation, or divorce | ||
| *** Participants could be taking concomitant drug from more than one pharmacotherapeutic class | ||
Table 3.
Time-fixed predictors of the rapid decline trajectory of the select antihypertensives, statins, and diabetes medications medication adherence trajectory models.
Table 3.
Time-fixed predictors of the rapid decline trajectory of the select antihypertensives, statins, and diabetes medications medication adherence trajectory models.
| TRAJECTORY | Rapid Declinea | |||||||||||
|---|---|---|---|---|---|---|---|---|---|---|---|---|
| GBTM MODEL | Select antihypertensives | Statins | Oral diabetes medications | |||||||||
| Coeff. | S.E. | aOR | p-value | Coeff. | S.E. | aOR | p-value | Coeff. | S.E. | aOR | p-value | |
| Predisposing and antecedents | ||||||||||||
| Sex: Female | 0.11 | 0.12 | 1.11 | 0.392 | 0.16 | 0.15 | 1.18 | 0.273 | -0.01 | 0.29 | 0.99 | 0.980 |
| Birthplace: Foreign born | 0.00 | 0.21 | 1.00 | 0.988 | 0.91 | 0.24 | 2.48 | 0.000* | 0.19 | 0.44 | 1.21 | 0.673 |
| Race: Non-white | -0.01 | 0.14 | 0.99 | 0.938 | 0.16 | 0.18 | 1.18 | 0.374 | 0.15 | 0.30 | 1.16 | 0.630 |
| Ethnicity: Hispanic | -0.25 | 0.22 | 0.78 | 0.247 | -0.13 | 0.26 | 0.88 | 0.619 | 0.08 | 0.42 | 1.08 | 0.848 |
| Education: Not College educated | -0.03 | 0.18 | 0.97 | 0.858 | 0.52 | 0.22 | 1.67 | 0.018* | 0.21 | 0.40 | 1.23 | 0.606 |
| Enabling characteristics | ||||||||||||
| Self-reported Health Status | 0.03 | 0.07 | 1.03 | 0.646 | 0.00 | 0.08 | 1.00 | 0.98 | 0.10 | 0.17 | 1.11 | 0.540 |
| Depression Symptoms | 0.60 | 0.17 | 1.82 | 0.000* | 0.39 | 0.22 | 1.48 | 0.07 | 0.16 | 0.41 | 1.18 | 0.691 |
| Life Satisfaction | 0.16 | 0.07 | 1.17 | 0.025* | 0.02 | 0.09 | 1.02 | 0.86 | 0.14 | 0.16 | 1.15 | 0.392 |
| Retirement Satisfaction | -0.03 | 0.10 | 0.97 | 0.753 | 0.09 | 0.12 | 1.10 | 0.45 | 0.17 | 0.22 | 1.18 | 0.455 |
| Limitations in work due to health | 0.17 | 0.13 | 1.19 | 0.181 | 0.22 | 0.16 | 1.25 | 0.16 | 0.31 | 0.30 | 1.37 | 0.306 |
| Need characteristics | ||||||||||||
| Household income below poverty index | 0.12 | 0.18 | 1.13 | 0.512 | 0.00 | 0.24 | 1.00 | 1.00 | 0.13 | 0.42 | 1.14 | 0.756 |
| Marital status: Loss of spouse | 0.01 | 0.02 | 1.01 | 0.617 | -0.01 | 0.03 | 0.99 | 0.81 | 0.06 | 0.05 | 1.06 | 0.293 |
| Lives with resident children | 0.03 | 0.11 | 1.03 | 0.769 | 0.09 | 0.14 | 1.10 | 0.51 | -0.16 | 0.25 | 0.85 | 0.509 |
| Medicaid beneficiary | -0.11 | 0.17 | 0.90 | 0.539 | 0.13 | 0.22 | 1.14 | 0.55 | -1.39 | 0.54 | 0.25 | 0.010* |
| Additional health coverage | -0.02 | 0.13 | 0.98 | 0.869 | 0.01 | 0.15 | 1.01 | 0.95 | 0.30 | 0.30 | 1.35 | 0.307 |
| Smoking status: Smoker | 0.40 | 0.18 | 1.49 | 0.028* | 0.76 | 0.22 | 2.13 | 0.00* | 0.85 | 0.43 | 2.35 | 0.046* |
| Number of drinking days / week | 0.04 | 0.03 | 1.04 | 0.159 | -0.02 | 0.04 | 0.98 | 0.58 | -0.11 | 0.10 | 0.89 | 0.263 |
| Instrumental Activities of Daily Living | 0.01 | 0.12 | 1.01 | 0.937 | 0.63 | 0.15 | 1.88 | 0.00* | -0.09 | 0.31 | 0.91 | 0.768 |
| Activities of Daily Living | 0.09 | 0.06 | 1.09 | 0.158 | -0.14 | 0.08 | 0.87 | 0.10 | -0.01 | 0.16 | 0.99 | 0.937 |
| aThe trajectory of rapid decline in medication adherence was observed all of the models of select antihypertensives, statins, and diabetes medications | ||||||||||||
Table 4.
Time-fixed predictors of the slow decline trajectory of the select antihypertensives, statins, and diabetes medications medication adherence trajectory models.
Table 4.
Time-fixed predictors of the slow decline trajectory of the select antihypertensives, statins, and diabetes medications medication adherence trajectory models.
| TRAJECTORY | Slow declinea | |||||||||||
|---|---|---|---|---|---|---|---|---|---|---|---|---|
| GBTM MODEL | Select antihypertensives | Statins | Oral diabetes medications | |||||||||
| Coeff. | S.E. | aOR | p-value | Coeff. | S.E. | aOR | p-value | Coeff. | S.E. | aOR | p-value | |
| Predisposing and antecedents | ||||||||||||
| Sex: Female | 0.10 | 0.09 | 1.11 | 0.254 | -0.02 | 0.11 | 0.98 | 0.846 | 0.21 | 0.18 | 1.24 | 0.245 |
| Birthplace: Foreign born | 0.03 | 0.14 | 1.03 | 0.831 | 0.10 | 0.20 | 1.10 | 0.637 | 0.66 | 0.28 | 1.93 | 0.017* |
| Race: Non-white | 0.37 | 0.10 | 1.44 | 0.000* | 0.23 | 0.13 | 1.26 | 0.084 | -0.09 | 0.20 | 0.91 | 0.645 |
| Ethnicity: Hispanic | 0.04 | 0.14 | 1.04 | 0.784 | 0.15 | 0.19 | 1.17 | 0.421 | -0.56 | 0.28 | 0.57 | 0.050* |
| Education: Not College educated | 0.06 | 0.13 | 1.06 | 0.633 | 0.24 | 0.16 | 1.27 | 0.143 | 0.34 | 0.27 | 1.40 | 0.212 |
| Enabling characteristics | ||||||||||||
| Self-reported Health Status | 0.22 | 0.05 | 1.24 | 0.000* | 0.15 | 0.06 | 1.16 | 0.013* | 0.14 | 0.10 | 1.14 | 0.188 |
| Depression Symptoms | 0.23 | 0.13 | 1.26 | 0.066 | 0.21 | 0.16 | 1.23 | 0.198 | 0.50 | 0.25 | 1.65 | 0.042* |
| Life Satisfaction | -0.04 | 0.05 | 0.96 | 0.398 | 0.02 | 0.06 | 1.02 | 0.817 | 0.05 | 0.10 | 1.05 | 0.654 |
| Retirement Satisfaction | -0.04 | 0.07 | 0.96 | 0.588 | 0.09 | 0.09 | 1.09 | 0.325 | -0.09 | 0.14 | 0.91 | 0.510 |
| Limitations in work due to health | 0.04 | 0.09 | 1.04 | 0.700 | 0.17 | 0.11 | 1.19 | 0.133 | 0.35 | 0.19 | 1.42 | 0.065 |
| Need characteristics | ||||||||||||
| Household income below poverty index | 0.05 | 0.13 | 1.05 | 0.697 | 0.31 | 0.18 | 1.37 | 0.075 | -0.30 | 0.26 | 0.74 | 0.259 |
| Marital status: Loss of spouse | 0.01 | 0.02 | 1.01 | 0.562 | -0.01 | 0.02 | 0.99 | 0.506 | 0.01 | 0.03 | 1.01 | 0.693 |
| Lives with resident children | 0.09 | 0.08 | 1.09 | 0.254 | 0.15 | 0.10 | 1.16 | 0.145 | 0.13 | 0.13 | 1.14 | 0.322 |
| Medicaid beneficiary | -0.11 | 0.12 | 0.90 | 0.384 | 0.02 | 0.17 | 1.02 | 0.931 | 0.01 | 0.24 | 1.01 | 0.982 |
| Additional health coverage | -0.18 | 0.09 | 0.84 | 0.057 | 0.17 | 0.11 | 1.19 | 0.112 | 0.46 | 0.19 | 1.59 | 0.016* |
| Smoking status: Smoker | -0.03 | 0.15 | 0.97 | 0.855 | 0.11 | 0.19 | 1.12 | 0.543 | 0.09 | 0.32 | 1.09 | 0.784 |
| Number of drinking days / week | 0.05 | 0.02 | 1.06 | 0.017* | 0.00 | 0.03 | 1.00 | 0.986 | 0.04 | 0.05 | 1.04 | 0.459 |
| Instrumental Activities of Daily Living | 0.05 | 0.09 | 1.06 | 0.557 | 0.42 | 0.12 | 1.52 | 0.000 | 0.27 | 0.17 | 1.31 | 0.104 |
| Activities of Daily Living | 0.01 | 0.05 | 1.01 | 0.783 | -0.09 | 0.06 | 0.92 | 0.151 | -0.01 | 0.09 | 0.99 | 0.949 |
| aThe trajectory of slow decline in medication adherence was observed all of the models of select antihypertensives, statins, and diabetes medications | ||||||||||||
Table 5.
Time-fixed predictors of the moderate decline trajectory of the select antihypertensives, statins, and diabetes medications medication adherence trajectory models.
Table 5.
Time-fixed predictors of the moderate decline trajectory of the select antihypertensives, statins, and diabetes medications medication adherence trajectory models.
| TRAJECTORY | Moderate Declinea | |||||||||||
|---|---|---|---|---|---|---|---|---|---|---|---|---|
| GBTM MODEL | Select antihypertensives | Statins | Oral diabetes medications | |||||||||
| Coeff. | S.E. | aOR | p-value | Coeff. | S.E. | aOR | p-value | Coeff. | S.E. | aOR | p-value | |
| Predisposing and antecedents | ||||||||||||
| Sex: Female | - | - | - | - | 0.40 | 0.12 | 1.50 | 0.001* | 0.25 | 0.17 | 1.28 | 0.149 |
| Birthplace: Foreign born | - | - | - | - | 0.56 | 0.20 | 1.75 | 0.006* | 0.05 | 0.27 | 1.05 | 0.862 |
| Race: Non-white | - | - | - | - | 0.69 | 0.14 | 2.00 | 0.000* | -0.37 | 0.19 | 0.69 | 0.054 |
| Ethnicity: Hispanic | - | - | - | - | 0.20 | 0.20 | 1.23 | 0.311 | 0.14 | 0.25 | 1.15 | 0.564 |
| Education: Not College educated | - | - | - | - | 0.07 | 0.18 | 1.07 | 0.704 | 0.25 | 0.26 | 1.28 | 0.333 |
| Enabling characteristics | ||||||||||||
| Self-reported Health Status | - | - | - | - | 0.09 | 0.07 | 1.09 | 0.196 | 0.14 | 0.10 | 1.15 | 0.153 |
| Depression Symptoms | - | - | - | - | 0.23 | 0.17 | 1.26 | 0.175 | 0.79 | 0.23 | 2.20 | 0.001* |
| Life Satisfaction | - | - | - | - | 0.10 | 0.07 | 1.10 | 0.159 | 0.13 | 0.10 | 1.14 | 0.187 |
| Retirement Satisfaction | - | - | - | - | 0.14 | 0.10 | 1.15 | 0.137 | -0.01 | 0.14 | 0.99 | 0.966 |
| Limitations in work due to health | - | - | - | - | 0.02 | 0.13 | 1.02 | 0.889 | 0.08 | 0.18 | 1.08 | 0.677 |
| Need characteristics | ||||||||||||
| Household income below poverty index | - | - | - | - | 0.25 | 0.18 | 1.29 | 0.163 | -0.30 | 0.25 | 0.74 | 0.231 |
| Marital status: Loss of spouse | - | - | - | - | -0.02 | 0.02 | 0.98 | 0.326 | 0.00 | 0.03 | 1.00 | 0.973 |
| Lives with resident children | - | - | - | - | 0.02 | 0.11 | 1.02 | 0.836 | 0.00 | 0.13 | 1.00 | 0.997 |
| Medicaid beneficiary | - | - | - | - | 0.21 | 0.17 | 1.23 | 0.223 | -0.09 | 0.23 | 0.92 | 0.706 |
| Additional health coverage | - | - | - | - | -0.08 | 0.13 | 0.92 | 0.529 | 0.01 | 0.19 | 1.01 | 0.978 |
| Smoking status: Smoker | - | - | - | - | 0.38 | 0.19 | 1.46 | 0.049* | 0.18 | 0.31 | 1.19 | 0.566 |
| Number of drinking days / week | - | - | - | - | -0.05 | 0.03 | 0.96 | 0.165 | -0.08 | 0.06 | 0.92 | 0.149 |
| Instrumental Activities of Daily Living | - | - | - | - | 0.24 | 0.13 | 1.27 | 0.061 | -0.07 | 0.17 | 0.93 | 0.684 |
| Activities of Daily Living | - | - | - | - | -0.09 | 0.07 | 0.92 | 0.179 | 0.01 | 0.09 | 1.01 | 0.871 |
| aThe trajectory of moderate decline in medication adherence was observed only in the models of statins and diabetes medications | ||||||||||||
Table 6.
Time-fixed predictors of the low then increasing adherence trajectory of the statins, and diabetes medications medication adherence trajectory models.
Table 6.
Time-fixed predictors of the low then increasing adherence trajectory of the statins, and diabetes medications medication adherence trajectory models.
| TRAJECTORY | Low then increasing adherencea | |||||||||||
|---|---|---|---|---|---|---|---|---|---|---|---|---|
| GBTM MODEL | Select antihypertensives | Statins | Oral diabetes medications | |||||||||
| Estimate | S.E. | aOR | p-value | Estimate | S.E. | aOR | p-value | Estimate | S.E. | aOR | p-value | |
| Predisposing and antecedents | ||||||||||||
| Sex: Female | - | - | - | - | 0.06 | 0.10 | 1.06 | 0.561 | 0.71 | 0.20 | 2.02 | 0.001* |
| Birthplace: Foreign born | - | - | - | - | 0.48 | 0.18 | 1.62 | 0.009* | 0.05 | 0.29 | 1.05 | 0.868 |
| Race: Non-white | - | - | - | - | 0.30 | 0.13 | 1.35 | 0.019* | 0.26 | 0.20 | 1.30 | 0.189 |
| Ethnicity: Hispanic | - | - | - | - | 0.02 | 0.18 | 1.02 | 0.930 | 0.14 | 0.27 | 1.15 | 0.599 |
| Education: Not College educated | - | - | - | - | 0.15 | 0.15 | 1.16 | 0.334 | -0.47 | 0.32 | 0.63 | 0.136 |
| Enabling characteristics | ||||||||||||
| Self-reported Health Status | - | - | - | - | 0.08 | 0.06 | 1.08 | 0.168 | 0.01 | 0.11 | 1.01 | 0.946 |
| Depression Symptoms | - | - | - | - | 0.19 | 0.15 | 1.21 | 0.213 | 0.71 | 0.26 | 2.04 | 0.005* |
| Life Satisfaction | - | - | - | - | -0.11 | 0.06 | 0.90 | 0.078 | 0.32 | 0.11 | 1.37 | 0.004* |
| Retirement Satisfaction | - | - | - | - | 0.16 | 0.08 | 1.17 | 0.055 | 0.02 | 0.15 | 1.02 | 0.897 |
| Limitations in work due to health | - | - | - | - | 0.17 | 0.11 | 1.18 | 0.114 | 0.15 | 0.21 | 1.17 | 0.456 |
| Need characteristics | ||||||||||||
| Household income below poverty index | - | - | - | - | -0.12 | 0.17 | 0.88 | 0.473 | 0.00 | 0.26 | 1.00 | 0.990 |
| Marital status: Loss of spouse | - | - | - | - | -0.03 | 0.02 | 0.97 | 0.098 | -0.03 | 0.04 | 0.97 | 0.420 |
| Lives with resident children | - | - | - | - | 0.07 | 0.10 | 1.07 | 0.467 | -0.24 | 0.16 | 0.79 | 0.121 |
| Medicaid beneficiary | - | - | - | - | 0.16 | 0.15 | 1.17 | 0.310 | -0.34 | 0.25 | 0.71 | 0.174 |
| Additional health coverage | - | - | - | - | -0.06 | 0.10 | 0.94 | 0.574 | -0.32 | 0.23 | 0.73 | 0.168 |
| Smoking status: Smoker | - | - | - | - | 0.16 | 0.18 | 1.17 | 0.368 | 0.46 | 0.32 | 1.58 | 0.150 |
| Number of drinking days / week | - | - | - | - | -0.02 | 0.03 | 0.98 | 0.454 | 0.01 | 0.06 | 1.01 | 0.885 |
| Instrumental Activities of Daily Living | - | - | - | - | 0.08 | 0.12 | 1.09 | 0.490 | -0.07 | 0.18 | 0.93 | 0.681 |
| Activities of Daily Living | - | - | - | - | 0.01 | 0.06 | 1.01 | 0.843 | 0.10 | 0.09 | 1.10 | 0.283 |
| aThe trajectory of low then increasing medication adherence was observed only in the models of statins and diabetes medications | ||||||||||||
Table 7.
Time-fixed predictors of the high then increasing adherence trajectory of the diabetes medications medication adherence trajectory models.
Table 7.
Time-fixed predictors of the high then increasing adherence trajectory of the diabetes medications medication adherence trajectory models.
| TRAJECTORY | High then increasing adherencea | |||||||||||
|---|---|---|---|---|---|---|---|---|---|---|---|---|
| GBTM MODEL | Select antihypertensives | Statins | Oral diabetes medications | |||||||||
| Estimate | S.E. | aOR | p-value | Estimate | S.E. | aOR | p-value | Estimate | S.E. | aOR | p-value | |
| Predisposing and antecedents | ||||||||||||
| Sex: Female | - | - | - | - | - | - | - | - | 0.23 | 0.19 | 1.26 | 0.221 |
| Birthplace: Foreign born | - | - | - | - | - | - | - | - | 0.20 | 0.30 | 1.22 | 0.511 |
| Race: Non-white | - | - | - | - | - | - | - | - | -0.36 | 0.21 | 0.70 | 0.092 |
| Ethnicity: Hispanic | - | - | - | - | - | - | - | - | -0.43 | 0.30 | 0.65 | 0.146 |
| Education: Not College educated | - | - | - | - | - | - | - | - | -0.31 | 0.30 | 0.74 | 0.313 |
| Enabling characteristics | ||||||||||||
| Self-reported Health Status | - | - | - | - | - | - | - | - | 0.08 | 0.10 | 1.08 | 0.444 |
| Depression Symptoms | - | - | - | - | - | - | - | - | 0.29 | 0.25 | 1.34 | 0.253 |
| Life Satisfaction | - | - | - | - | - | - | - | - | 0.01 | 0.11 | 1.01 | 0.947 |
| Retirement Satisfaction | - | - | - | - | - | - | - | - | -0.19 | 0.15 | 0.83 | 0.212 |
| Limitations in work due to health | - | - | - | - | - | - | - | - | 0.11 | 0.20 | 1.12 | 0.571 |
| Need characteristics | ||||||||||||
| Household income below poverty index | - | - | - | - | - | - | - | - | -0.40 | 0.27 | 0.67 | 0.147 |
| Marital status: Loss of spouse | - | - | - | - | - | - | - | - | 0.03 | 0.04 | 1.03 | 0.465 |
| Lives with resident children | - | - | - | - | - | - | - | - | -0.09 | 0.15 | 0.91 | 0.527 |
| Medicaid beneficiary | - | - | - | - | - | - | - | - | 0.08 | 0.25 | 1.08 | 0.747 |
| Additional health coverage | - | - | - | - | - | - | - | - | 0.09 | 0.21 | 1.09 | 0.686 |
| Smoking status: Smoker | - | - | - | - | - | - | - | - | 0.22 | 0.33 | 1.25 | 0.504 |
| Number of drinking days / week | - | - | - | - | - | - | - | - | -0.06 | 0.06 | 0.94 | 0.342 |
| Instrumental Activities of Daily Living | - | - | - | - | - | - | - | - | 0.05 | 0.18 | 1.05 | 0.770 |
| Activities of Daily Living | - | - | - | - | - | - | - | - | 0.12 | 0.09 | 1.12 | 0.201 |
| aThe trajectory of high then increasing medication adherence was observed only in the models of diabetes medications | ||||||||||||
Disclaimer/Publisher’s Note: The statements, opinions and data contained in all publications are solely those of the individual author(s) and contributor(s) and not of MDPI and/or the editor(s). MDPI and/or the editor(s) disclaim responsibility for any injury to people or property resulting from any ideas, methods, instructions or products referred to in the content. |
© 2025 by the authors. Licensee MDPI, Basel, Switzerland. This article is an open access article distributed under the terms and conditions of the Creative Commons Attribution (CC BY) license (http://creativecommons.org/licenses/by/4.0/).
Copyright: This open access article is published under a Creative Commons CC BY 4.0 license, which permit the free download, distribution, and reuse, provided that the author and preprint are cited in any reuse.


