
Submitted:
05 March 2025
Posted:
05 March 2025
You are already at the latest version
Abstract
In this article, nanopowder zinc sulfide (ZnS) was chemically precipitated starting from Zn powder and diluted HCl to make a ZnCl2 solution followed by a reduction process using a laboratory-prepared Na2S. Na2S was produced by dissolving NaOH in distilled water. Then, according to the stochiometric values of the compound, high-purity S powder was added while heating and stirring the mixture to a temperature of approximately 105 oC. The mixture was finally dried under a vacuum at 200 oC. The produced ZnS was studied using SEM coupled with EDS, XRD analysis, UV-Vis, and FTIR techniques. The results confirmed the synthesis of nanoscale ZnS powder and its chemical composition. To prepare ZnS pellets, the ZnS nanopowder was compacted and sintered under an Argon atmosphere at 400°C for 8 hours. The SEM and EDS examined the microscopic structure of the sintered pellets. The sintered ZnS pellets were also used as an evaporation source for thin deposition via E-beam evaporation. Furthermore, the optical properties of the deposited thin films were studied using UV-Visible spectroscopy in the wavelength range of 190 -1100 nm, where the energy gaps (Eg) were calculated for thin films with thicknesses of 111 nm and 40 nm, and they were around 4.72 eV and 5.82 eV, respectively. This article offers a facile production route of a high-purity ZnS nanopowder and its application as an evaporation source for the E-beam deposition of ZnS thin films.
Keywords:
ZnS nanopowder
; Na2S production
; sintering
; E-beam evaporation
1. Introduction
Zinc sulfide (ZnS) with nanoscale crystal has received unusual attention because of its properties and the wide range applications in numerous fields, such as electronics, optics, photocatalysis, infrared devices, solar cells, and purification of wastewater [1,2,3,4,5,6,7]. ZnS inorganic nanoparticles can be produced using different methods and with various microstructures, which leads to different properties of this compound.
A review of the production of nanoscale ZnS by green routes has been reported in 2023 [8]. The proposed methods are considered environmentally friendly which allows using these inorganic nanoparticle compounds with a minimal environmental footprint for many applications in many fields, such as medicine, optical devices, and engineering applications. In 2024, a comprehensive review of ZnS synthesis using various methods to give different nanostructures with their applications was reported by Chakrabarti et al. [9]. They confirmed that the nanoparticle shapes and properties of the ZnS determine its uses in various fields, such as catalysts, solar cells, optoelectronics, biomedical, sensors, and batteries. ZnS is highly transparent to infrared radiation (IR) in the wavelength range of 8-12 µm due to its large energy gap (Eg ≥ 3.6 eV). Therefore, this material is widely used in IR sensors such as those found in defensive missile applications [10]. Zinc blende, which is symbolized as ZnS sphalerite is a stable cubic structure from room temperature to approximately 1000 oC, where this phase starts to change into the hexagonal close pack structure (hcp) at higher temperatures to form ZnS wurtzite [11]. Furthermore, doping of the ZnS changes its energy gap and leads to improved sensitivity to the visible light spectrum. In addition, the degradation of dye efficiency can be controlled by metal doping of the plain ZnS nanoparticle’s structure. This subject has been fully reviewed by Khan et al. [12].
The chemical precipitation method of ZnS is one of the most widely used due to the ease of controlling of its preparation factors, such as the purity of the starting materials, pH, temperature, and mechanical agitation during precipitation [13,14,15,16,17,18,19,20]. ZnS thin film technology is also used in various research lines and practical applications since it consumes little material to cover large areas, which makes this technique very suitable for the manufacturing stage [21,22,23,24]. Another route for producing ZnS is powder metallurgy, which starts with mechanical stoichiometric mixing of bare Zn and S powders to form the compound. The process ends with compaction and sintering to obtain solid and sintered parts of the targeted compound. Sometimes, two types or more powders are milled together under a particular atmosphere for a long time to induce mutual diffusion between the mixed powder particles to yield the required alloy. Such alloying method is called mechanical alloying (MA) [25,26,27]. This method can be generalized to produce several compounds starting from powder components. Most researchers in this field use ready chemical compounds to produce ZnS using different production techniques.
It is rare to start with Zinc (Zn) metal, either powder or bulk pieces, to synthesize ZnS by preparing the required solution, such as Zinc Chloride (ZnCl2), and subsequently reduce it to form ZnS nanoparticles. This subject needs to be investigated as an easy route, probably with less time and cost, to produce ZnS nanopowders. Furthermore, the sintering of ZnS powders to form pellets, as a starting material for thin film deposition, needs also a special attention.
This research project aims to produce ZnS starting from Zn powder. The plan includes the preparation of a ZnCl2 by dissolving Zn powder or Zn in a diluted HCl of 37% concentration. Meanwhile, the plan also involves synthesizing Na2S as a reducing agent for the ZnCl2 solution. A scanning electron microscope (SEM) with its attached energy-dispersive X-ray spectroscopy (EDS) is employed to examine the starting materials, the synthesized ZnS nanopowders, and their thin films. X-ray diffraction (XRD) is used to test the synthesized ZnS and to determine its crystalline structure. The prepared ZnS powder is compacted and sintered under an Argon atmosphere to prepare solid pieces prior to thin film production using the electron-beam (E-beam) evaporation technique. The thin film, compacted pellets, and sintered pellets are imaged by SEM for microstructure exploration. XRD is also used for thin film phase investigations. Finally, the chemical bonding and the optical properties of the thin films are studied using UV–Visible and Fourier Transform Infrared (FTIR) spectroscopies.
2. Materials and Methods
2.1. Instruments and Deceives
- Hot plat with magnetic stirring (HS-3000, S/N 0407-13, Camlab Ltd., Cambridge B24 5WE, UK) for heating and mixing as required.
- Four-digit analytical microbalance (Model SEJ-205, Taipei-Taiwan) for high accuracy weighting.
- pH meter (EUTEGH, Serial Number 897911, part of Thermos Scientific, Republic of Singapore, Singapore) for solutions pH measurement.
- Scanning electron microscope (SEM) (Inspect F50-FEI company, Eindhoven, The Netherlands) for high magnification and resolution imaging.
- Agar sputter coater instrument (Agar Scientific, Model AGB7340, Essex, UK) for specimens coating.
- Vacuum oven (JEIO TECH, MODEL OV-11, AAH13115K, Republic of Korea, Seoul) for drying under vacuum.
- Centrifugate system (HERMILE Labortechnik GmbH, Type Z 326 K, REF 311.00 V05, SN 66A1800211, Wehingen, Germany) for powder separation.
- Tube furnace (Protherm alumina tube furnace, Model PTF 12/50/450, serial No. 0907234, Protherm Inc, Ankara, Turkey) with a combined home-designed argon gas line and vacuum fitting for powder sintering.
- Digital caliper (Total, TMT 322001, Guangzhou, China) for high accuracy dimension measurements.
- Milling machine with variable speed (Changsha Tiachuang, Powder Technology Co., Changsha, China) for milling process.
- Compaction system consists of a homemade stainless-steel die integrated with a CARVER press (model 4350. L, S/N 4350-1401, CARVER, INC., Wabash, IN, USA) for powder compaction.
- Electron-Beam evaporation system (SCT-1800, SCT, System Control Technologies, sctec.com, Battle Ground, WA 98604, USA) for thin film deposition.
- UV–Visible spectrophotometer (UV-1601 (PC) S, CAT No. 206-67501-93, SERIAL No. A1077-3300310S2, Shimadzu Corporation, Tokyo, Japan) for optical properties investigation.
- Optical reflectance Spectrometer (FilmTek 3000, Scientific Computing International, Carlsbad, CA, USA) spectrometer for thin film thickness measurements.
- Fourier Transform Infrared Spectroscopy (FTIR, NEXUS, EPS-87, Thermo Fisher Scientific, Waltham, MA) in the wavenumber range of 400–4000 cm-1 for powder and thin film FTIR tests.
- X-ray diffraction (XRD) instrument (Malvern Panalytical, Aeris, monochromatic Cu kα1, 1.5406 Å, 0.02 step angle, with 2θ ranging from 10◦—60◦, Almelo, The Netherlands) for phase and unit cell investigation.
All instruments and devices above are referred to wherever they are used in the text.
2.2. Materials
Zinc (Zn) power of 99.5% purity, hydrochloric acid (HCl) of 37% concentration, sulfur powder of 99.9% purity, and sodium hydroxide (NaOH) of 99.5% purity were used as-received. Distilled water and absolute ethanol (99.9%) were used according to the required preparation procedure. All chemicals were purchased from local providers. Glassware, filter papers of 110 mm diameter (Schleicher & Schüll GmbH, 595, Ref: No311610, Dassei, Germany), and ceramic funnels were used as required. Glass slides, quartz slides, and silicon wafers as substrates were used for the E-beam evaporation of the thin films. Argon gas with a purity of 99.99% was used in these experiments. The research plan implementation is illustrated in Figure 1.
2.3. Production of Na2S Compound
Na2S was produced at our laboratory according to the following stoichiometric equation:
In view of the above equation, 2 moles of NaOH react with 1 mole of S to form 1 mole of Na2S. The molar mass of NaOH is 39.997 g/mol (~40 g/mol), and the molar mass of S is 32.0650 g/mol (~32 g/mol). 20.0 g of NaOH was weighed using the analytical balance for high accuracy and then dissolved in 250 mL of distilled water. The formed alkaline solution was then heated to ~105 oC using the hot plate. With continuous magnetic stirring, 8.0 g of S powder were gradually added to the solution to produce a reddish-purple solution. A yellow-orange solid of Na2S was produced with the continued heating at ~105 oC. To get an anhydrous Na2S, a vacuum oven was used to heat the produced Na2S to ~200 oC at a heating rate of approximately 2 oC/min in a vacuum of around 10-3 Torr for 2 h. This laboratory produced Na2S is ready as a reducing compound to synthesize ZnS from ZnCl2 solution. More information about the production of Na2S can be found elsewhere [19].
2.4. Synthesis of ZnS
Zn powder was first dissolved in dilute HCl to produce ZnCl2 solution according to equation (2).
Zn powder was washed with a solution made of mixing 1 mL of 37% HCl solution with 100 mL water in order to remove the oxide layer, if any, during the manufacturing process so that the surface of the particles would be clean and ready for the reaction. Bubbles of H2 gas were observed during the reaction and a clear ZnCl2 solution was obtained at the end of the process. The pH of the solution, measured using a pH meter, was approximately 1.4.
It is necessary to perform a theoretical calculation to determine the expected amount of Zn metal dissolved in a given concentration of diluted HCl and then choose the required mass of the reducing agent to convert the dissolved Zn ions into a ZnS. According to the used HCl concentration (37%), each 100 ml contains 37 g of HCl. The average molar masses of H and Cl elements are 1.008 g/mol and 36.46 g/mol, respectively. Thus, the mass % of each component in HCl can be determined using the following equation [28]:
where n is the number of H and Cl atoms in HCl, and the results were ~2.765% and ~97.235 % for H and Cl, respectively.
Based on the preceding calculation, each 100 ml of 37 % HCl contains ~35.978 g of Cl- ions. This amounts to about 18 g of Cl- ions in each 50 ml of 37 % HCl. Therefore, the number of atoms in this mass of Cl can be determined as follows:
This number represents the Cl- ions in 50 ml of HCl at 37% concentration. Thus, the number of Zn atoms needed to react with Cl- to form ZnCl2 is half of this number (~1.49 ×10²³ atoms), because each Zn ion needs two Cl- ions. Accordingly, the mass of Zn metal to dissolve in 50 ml of diluted HCl (37%) is the total mass of dissolved Zn atoms, which can be theoretically found by multiplying (~1.49 ×10²³ atoms) times the mass of Zn atoms (~1.086×10⁻²² g), and the result is ~16.18 g. For all Cl- in the diluted HCl solution to be fully consumed to form ZnCl2, an additional quantity of Zn metal must be added to the calculated Zn amount as an excess.
The first run of ZnS precipitation was started by dissolving 10 g of Zn powder in 250 ml of 10% solution of the diluted 37% HCl to form soluble ZnCl2 (225 mL distilled water + 25 ml of 37% HCl). The powder was weighed using the analytical balance. After the reaction ceased and no more H2 bubbles are seen, the residual unreacted Zn was dried and weighed to be subtracted from 10 g to find the exact amount of the dissolved Zn. The result of this process was that the undissolved Zn powder was 0.9382 g, so the actual dissolved mass of Zn was 9.0618 g (~9 g) in 25 mL of 37% HCl, which is higher than the theoretical value calculated above.
The obtained ZnCl2 solution was filtered twice using filter papers into a ceramic funnel to remove any traces of undissolved solids. The pH of the obtained solution was measured to be 1.4. The produced Na2S was used as a reducing agent to synthesize ZnS from the prepared ZnCl2 solution according to the following equation:
The needed Na2S to convert the prepared ZnCl2 into ZnS was also calculated. Each 100 g of ZnS contains 67 g of Zn and 33 g of S, so the required S to convert 10 g of Zn into ZnS is 4.93 g. Therefore, the quantity of Na2S that contains 4.93 g of S is ~12 g, as each 100 g of Na2S includes 41 g of S (Na2S: ~59% Na, ~41% S). The Na2S required was weighed using the four-digit microbalance and dissolved in 200 ml of distilled water, filtered, then dropped wise (50 drops/min.) to the prepared ZnCl2 solutions to form the white ZnS powder. The powder was separated from its solution after the supernatant discharged utilizing the HERMILE centrifugate instrument and it was washed five times with distilled water and twice with ethanol. The wet powder was then dried under vacuum at ~105 oC for 1h using the vacuum oven. The dried ZnS was aggregated to form a flake-like material after drying, which was milled to produce ZnS fine powder. Figure 2 contains photographs of the produced Na2S, synthesized ZnS white powder in the intermediate solution, and the dried milled ZnS powder. The procedure was repeated more than once to produce ZnS powder to ensure its reproducibility and as required.
2.5. Sintering of ZnS Powder
The dried flake-like aggregated ZnS powder was milled before compaction. The ZnS fine powder was compacted at a pressure of 400 MPa with a dwell time of 2 min utilizing a homemade stainless-steel die of 1.2 cm diameter coupled with the CARVER press. The compacted pellets were then sintered at 400 ◦C for 8h with a heating rate of approximately 5 oC/min. until reaching the sintering temperature, using the Protherm tube furnace. The sintered pellets were then left to cool down in the furnace overnight. The process was performed under an argon atmosphere with a flow rate of 1 L/min to prevent oxidation. The tube furnace was evacuated first to approximately 10-3 Torr before introducing the argon gas to reduce the oxygen as much as possible. Figure 3 is a photograph of three compacted pellets at a pressure of 400 MPa.
The green and sintered densities (ρg and ρs) of the sintered pellets were determined using a digital caliper and the analytical balance. The sintering step was crucial for studying the microstructure of sintered ZnS powder and using the sintered solid pellets for the subsequent E-beam evaporation for thin film deposition.
2.6. Thin Film Deposition and UV–Visible Spectrophotometry
Thin films of ZnS were deposited on pre-cleaned silicon, glass, and quartz substrates using the E-beam evaporation technique mentioned in section 2.1. Sintered pellets of ZnS were loaded into a Boron Nitride crucible and the deposition chamber was evacuated to a base pressure of the order of 7.0 × 10⁻⁶ Torr prior to the E-beam evaporation process. The deposited thin films’ optical properties were studied using UV–Visible spectrophotometry in the wavelength range of 190-1100 nm. The thin film thicknesses were determined using the quartz monitor in the evaporation instrument and confirmed by the FilmTek 3000 spectrometer.
2.7. Characterizations of the Starting Powders, Synthesized ZnS, and ZnS Thin Films
The XRD pattern of the synthesized ZnS powder and ZnS thin films were measured by the Malvern Panalytical diffractometer (monochromatic Cukα1, 1.5406 Å, 0.02o step, with 2θ ranging from 10◦—60◦) using a scanning speed 0.02 o/s with a beam current and an acceleration voltage of 7.5 mA and 40 kV, respectively. Pieces of about 1.5 cm2 of the 111 nm thickness thin film were heat-treated at 250 oC and 400 oC for 6h in a vacuum of 10-3 Torr for contrast viewing with the as-evaporated thin films. The results were then analyzed using the software accompanying the XRD system (HighScore Plus version 5.2).
Fourier-transform infrared (FTIR) profiles were measured for both ZnS powder and thin films using ThermoFisher Scientific FTIR spectrometer in the wavenumber range of 400–4000 cm-1.
SEM was employed for microstructure investigation of the Zn and S powders, synthesized ZnS powder, sintered specimens, and the deposited thin films. An Agar sputter coater was used for coating with a thin platinum (Pt) film to enhance the image quality and for earthing the specimens with the SEM stage. Specimens were mounted on aluminum stubs of 1.2 cm diameter using double-sided adhesive carbon tapes. Zn powder was examined directly with no coating needed, while the S powder, being almost an insulator, was coated. The synthesized ZnS powder was Pt sputter-coated and examined for microstructure and chemical analysis. Square pieces of approximately 1 cm2 from the thin film of ZnS were also Pt coated and examined for microstructure and nano-scale particle imaging. The SEM was used to analyze the fractured surface of the sintered pellet. The selected fractured surface was made as planar as possible for easy examination in the SEM and to produce a high-quality image.
3. Result and Discussion
3.1. SEM of Zn Powder, S Powder, and Synthetized ZnS Investigations
Using the SEM was vital for studying the microstructure and chemical analysis of the starting materials. Figure 4 (a-d) shows the shape, size, and EDS spectra of compacted Zn powder at a pressure of 300 MPa and annealed-compacted S powder at 110 oC for an hour under a vacuum of about 10-3 Torr. This temperature was chosen a bit below the melting point of S element (~115 oC) to have a solid pellet with minimum molten S powder. The S powder was compacted and heat-treated to prepare a flat specimen for easier examination in the SEM. Likewise; Zn powder was also compacted at a pressure of 300 MPa for the same purpose above. The result confirmed that both starting powders are almost pure with no impurities as revealed by the EDS spectra. This result encourages the production of the high-purity compounds Na2S and ZnS.
The obtained ZnS powder was investigated using SEM for its microstructure and also to determine the particle size distribution. Figure 5 (a-d) illustrates the images of the produced ZnS nanopowder, its EDS profile with an inserted table of chemical analysis, and the XRD pattern of the powder. The figure shows that the particles are of spherical shape, and the particle size is around 50 nm or smaller. Also, the EDS spectrum and the chemical analysis table confirmed the formation of ZnS with at. % of 47.87 and 52.13 for Zn and S, respectively. Since EDS chemical analysis is semi-quantitative, these values are in very good agreement with the nearly 50 at. % theoretical values for each of Zn and S in ZnS. The same validation applies to the measured weight conc.% in Figure 5c. This result confirms that our ZnS production method used here is accurate, relatively easy, and effective.
In addition, the XRD profile peaks in the 2θ range of 10o-60o fits the sphalerite cubic crystalline structure with the reflection planes indexing of (111), (220), and (311) at 2θ of 28.78o, 47.22o, and 56.02o, respectively. The results are more or less similar to published values [5,17,29,30]. Moreover, the unit cell of the synthesized ZnS was found to be 5.36271 Å as compared to the standard corresponding value of 5.4750 Å (COD 96-153-9415), space group F-43m. This finding supports the EDS analysis which confirmed that the produced ZnS was almost a pure compound. Crystallinity can be improved by heat treatment under a high vacuum to avoid any transformation to ZnO [30,31]. The synthesized ZnS nanopowder measured by the XRD unit was annealed at 200 oC for 2h in a vacuum of approximately 10-3 Torr for better drying and to avoid unwanted Zn oxidation.
3.2. SEM Images of sintered ZnS Powder
The SEM investigation of the under-argon 400 oC sintered ZnS nanopowder showed particle growth, as can be easily seen in Figure 6 (a-d), which includes the imaging of the starting nanopowder and the sintered specimen. The starting nanoparticles of ZnS powder (Figure 6a) were mutually diffused together by solid-state sintering, forming larger particles, in the rage of 140 nm (Figure 6c-6d), which is the usual case during the sintering of a powdered material. More information about the sintering process in different environments has been reported recently [32].
Sintering under a high vacuum or high-purity argon atmosphere is vital to prevent the transformation of ZnS powder into ZnO, as reported by Chankhanittha et al. [30]. They showed that ZnS prepared by the hydrothermal method was entirely converted into ZnO at annealing under atmosphere at a temperature of approximately 550 oC and above. Therefore, sintering under a high vacuum of approximately 10-6 Torr or less is required to maintain the ZnS as the sole synthesized compound. The sintered samples were subsequently used for E-beam thin film evaporation process. Table 1 includes the green and sintered densities of ZnS pellets produced at a sintering temperature of 400 oC for 8h. The sintered density mean value is low compared to the theoretical density of the bulk ZnS (4.09 g/cm3) due to the low sintering temperature. In general, the sintering temperature of any bare powder is at least 0.7 of its melting point, which should be around ~ 1300 oC for ZnS powder, as its melting point is ~1830 °C [32].
3.3. Thin Film Microstructure at High Magnification
SEM was used to examine the microstructure of the ZnS thin film produced by E-beam evaporation as can be seen in Figure 7a-d. Image (a) shows a mat-like structure with a rough surface at a magnification of 40,000×, while image (b) displays the microstructure at a higher magnification of 80,000× from which it can be seen that the particle size is in the nanoscale with an almost spherical shape. The high roughness may be due to the evaporation discontinuity, as the densities of the sintered ZnS pellets were lower than the theoretical values. The images (c and d) reveal labeled cross-sections of the thin film for thickness measurement, which was about 120 nm. The SEM results confirmed that the 400 oC-sintered ZnS samples can be used for E-beam thin film deposition.
XRD examination of the room temperature, E-beam deposited, 111 nm ZnS thin film did not show any peaks indicative of crystallization in the as-evaporated or in film annealed at 250 oC and 400 oC for 6h under vacuum. The measured thin films showed an amorphous structure, which could be attributed to the low substrate deposition temperature. The heating of the substrate is probably a crucial factor for the crystallization for these thin films, which was not studied in this work. Figure 8 shows the XRD patterns of the three thin films.
3.4. UV-Visible and FTIR Spectroscopy of the Produced ZnS
3.4.1. UV-Visible of the Thin Film Samples
The Percent Transmittance (T%) for the UV-Visible spectrum for two evaporated samples is shown in Figure 9. This figure shows clearly that both samples, the 40 nm and the 111 nm sample, are transparent in the near-IR, Visible and most of the UV regions. This makes ZnS thin film as a very good window material and a good protective coating in the described region. The thickness dependence of T% is also obvious in this figure.
The Tauc’s equation was used as the basis to calculate the bandgap (Eg) from the T% data [33,34,35,36,37,38,39].
where is the absorption coefficient (in cm-1), h is the Planck’s constant, is the light frequency, B is a constant, Eg is the bandgap energy of the material, and r is a constant that depends on the nature of the bandgap, whether direct or indirect, and whether allowed or forbidden. For ZnS, r = 2 was used for direct allowed transitions.
Figure 10 and Figure 11 present the Tauc’s plots, and the linear region fit for the 40-nm and the 111-nm samples respectively. The bandgap calculations show a direct dependance of the bandgap value on the thickness of the deposited film. It was found that Eg increases as the thickness decreases. The reported bulk Eg for ZnS is around 3.6 eV, while the values of the studied thin films were 4.82 eV and 5.82 eV for the 111-nm and 40-nm thin films respectively. The thin films Eg values are 31 - 62% higher than those of thick films and the bulk ZnS material. This thickness dependance of the bandgap was also reported by other researchers [33,34,35,36,39]. This attractive feature makes ZnS films a good choice for applications where bandgap engineering is needed. The bandgap of ZnS thin film can be simply controlled by varying its thickness.
3.4.2. FTIR of ZnS Powder and its Thin Film
The FTIR spectra for the powder and thin films of ZnS are shown in Figure 12. The correspondence between the powder samples and the thin film samples is clearly seen in this figure. The main peaks associated to ZnS powder are slightly shifted in the thin film samples which can be attributed to changes of the environment around the ZnS molecules. The peaks observed at 478 cm-1 in the powder sample and the at 533 cm-1, 646 cm-1 are assigned to ZnS stretching vibrations, the peak at around 1005 cm-1 is also attributed to ZnS, while the peak at around 905 cm-1 is attributed to metal oxides vibrations. The peaks at around 2370 cm-1 are mainly assigned to C=O of the atmospheric CO2, while the bands at around 3480 cm-1 are usually assigned to O-H stretching. The powder sample also shows C-Hx stretching shoulder in the region at around 2900 cm-1. The FTIR spectra confirm the presence of ZnS in the studied samples [40,41,42,43,44,45,46].
4. Conclusions
The current research project exposes a relatively simple but efficient method to chemically synthesize nanoscale ZnS powder. The produced ZnS was characterized using SEM with EDS, XRD, and FTIR. The results confirmed the formation of the compound. The EDS showed that atomic percentages (at. %) of Zn and S elements were 47.87% and 52.13%, respectively. The nanoparticle powder was compacted and sintered under vacuum for microstructure investigation, and the sintered pieces were subsequently used to produce thin films using E-beam deposition. The microstructural investigation showed that sintering led to the growth of the initial nanoparticles and that they remained within the nanoscale limit. Two thicknesses of ZnS thin films were deposited, namely ~40 nm and ~111 nm, which were optically studied using UV-Visible and FTIR spectroscopies. They showed two different values of Eg, 4.72 eV for the thicker sample (~111 nm) and 5.82 eV for the thinner one (~40 nm), which makes ZnS thin films suitable candidates for application requiring bandgap control. In addition, SEM imaging showed that the particle size of the film layer was also in the nano-range after E-beam deposition at room temperature with an amorphous state, as elucidated by the XRD test results.
Author Contributions
Conceptualization, Ehab AlShamaileh and Iessa Moosa; Data curation, Mariam Al-Qderat and Wadah Mahmoud; Formal analysis, Bashar Lahlouh, Wadah Mahmoud, muayad esaifan and Iessa Moosa; Funding acquisition, Ahmed Al-Mobydeen and Ahmed N. AL-Masri; Investigation, Bashar Lahlouh, Wadah Mahmoud, Imad Hamadneh and Iessa Moosa; Methodology, Ahmed Al-Mobydeen, Bashar Lahlouh, Ahmed N. AL-Masri, muayad esaifan and Iessa Moosa; Project administration, Ehab AlShamaileh and Iessa Moosa; Resources, Ahmed Al-Mobydeen, Ehab AlShamaileh, Mariam Al-Qderat and Wadah Mahmoud; Software, Bashar Lahlouh, Wadah Mahmoud and muayad esaifan; Supervision, Ehab AlShamaileh, Wadah Mahmoud and Iessa Moosa; Validation, Iessa Moosa; Visualization, Mariam Al-Qderat, muayad esaifan and Iessa Moosa; Writing – original draft, Ehab AlShamaileh and Iessa Moosa; Writing – review & editing, Ehab AlShamaileh, Bashar Lahlouh, Mariam Al-Qderat, Ahmed N. AL-Masri, Wadah Mahmoud, Imad Hamadneh and Iessa Moosa.
Funding
This research received no external funding.
Acknowledgments
The authors would like to acknowledge the deanship of scientific research at the University of Jordan for funding this research project. Thanks go to the University of Petra, Jordan for their kind help in the SEM measurements.
Conflicts of Interest
The authors declare no conflict of interest.
Data Availability Statement
The original contributions presented in the study are included in the article; further inquiries can be directed to the corresponding author.
References
- Mana, P.M.; Bhujbal, P.K.; and Pathan, H.M. Fabrication and Characterization of ZnS based Photoelectrochemical Solar Cell. ES Energy Environ 2021, 12, 77–85. [Google Scholar] [CrossRef]
- Isac, L.; and Enesca, A. Recent Developments in ZnS-Based Nanostructures Photocatalysts for Wastewater Treatment. Int. J. Mol. Sci. 2022, 23, 15668. [Google Scholar] [CrossRef]
- Khan, A.U.; Tahir, K.; Albalawi, K.; Khalil, M.Y.; Almarhoon, Z.M.; Zaki, M.E.A.; Latif, S.; Hassan, H.M.A.; Refat, M.S.; and Munshi, A.M. Synthesis of ZnO and ZnS nanoparticles and their structural, optical, and photocatalytic properties synthesized via the wet chemical method. Materials Chemistry and Physics 2022, 219, 126667. [Google Scholar] [CrossRef]
- Faita, F.L.; Ersching, K.; Poffo, C.M.; Benetti, L.C.; Trichês, D.M.; Souza, S.M.; Viegas, A.D.C.; and de Lima, J. C. Structural, thermal, magnetic and optical characterization of undoped nanocrystalline ZnS prepared by solid state reaction. Journal of Alloys and Compounds 2014, 590, 176–183. [Google Scholar] [CrossRef]
- Wei, Z.; Lu, Y.; Zhao, J.; Zhao, S.; Wang, R.; Fu, N.; Li, X.; Guan, L.; and Teng, F. Synthesis and Luminescent Modulation of ZnS Crystallite by a Hydrothermal Method. ACS Omega 2018, 3, 137−143. [CrossRef]
- Kaur, H.; Kumar, S.; Kumar, P.; Ghfar, A. A.; and Bouzid, G. Tailoring ZnS nanostructures through precipitation-cum-hydrothermal synthesis for enhanced wastewater purification and antibacterial treatment. Environmental Research 2024, 259, 119534. [Google Scholar] [CrossRef]
- Lee, G.J.; and Wu, J.J. Recent developments in ZnS photocatalysts from synthesis to photocatalytic applications — A review. Powder Technology 2017, 318, 8–22. [Google Scholar] [CrossRef]
- Sonawane, H.; Deore, J.; Rajshri, S.; and Chavan, P. Synthesis of ZnS Nanomaterials and Their Applications via Green Approaches: An Overview. BioNanoScience 2023, 13, 879–890. [Google Scholar] [CrossRef]
- Chakrabarti, A; and Alessandri, E. Syntheses, Properties, and Applications of ZnS-Based Nanomaterials. Appl. Nano 2024, 5, 116–142. [CrossRef]
- Lee, K.T.; Choi, B.H.; Woo, J.U.; Kang, J.S.; Paik, J.H.; Byoung-Uck Chu, B.U.; and Nahm, S. Microstructural and optical properties of the ZnS ceramics sintered by vacuum hot-pressing using hydrothermally synthesized ZnS powders. Journal of the European Ceramic Society 2018, 38(12), 4237–4244. [Google Scholar] [CrossRef]
- Sadovnikov, S.I.; Ishchenko, A.V. ; and Weinstein,I. A. Synthesis and optical properties of nanostructured ZnS and heteronanostructures based on zinc and silver sulfides. Journal of Alloys and Compounds 2020, 831, 154846. [Google Scholar] [CrossRef]
- Khan, J.A.; Ahamad, S.; Ansari, M.A.H.; Tauqeer, M.; Park, C.H.; Park, J.P.; Choi. C.H.; and Mohammad, A. State-of-the-art in ZnS-based nanoarchitects for visible-light photocatalytic degradation of antibiotics and organic dyes. Journal of Water Process Engineering 2024, 67, 106151. [CrossRef]
- Navaneethan, M.; Archana, J.; Nisha, K.D.; Hayakawa, Y.; Ponnusamy, S.; and Muthamizhchelvan, C. Temperature dependence of morphology, structural and optical properties of ZnS nanostructures synthesized by wet chemical route. Journal of Alloys and Compounds 2010, 506, 249–252. [Google Scholar] [CrossRef]
- Yin, L.; Zhang, D.; Wang, D.; Kong, X.; Huang, J.; Wang, F.; and Wu, Y. Size dependent photocatalytic activity of ZnS nanostructures prepared by a facile precipitation method. Materials Science and Engineering: B 2016, 208, 15 –21. [CrossRef]
- Shobana, T.; Venkatesan, T.; and Kathirvel, D. A Comprehensive Review on Zinc Sulphide Thin Film by Chemical Bath Deposition Techniques. J. Environ. Nanotechnol 2020, 9(1), 50–59. [Google Scholar] [CrossRef]
- Arsad, A.Z.; Zuhdi, A.W.M.; Abdullah, F.A.; Chau, C.F.; Ghazali, A.; Ahmad, I.; and Abdullah, W.S.W. Effect of Chemical Bath Deposition Variables on the Properties of Zinc Sulfide Thin Films: A Review. Molecules 2023, 28, 2780. [Google Scholar] [CrossRef]
- Ali, A.H.; Hashem, H.A.; and Elfalaky, A. Preparation, Properties, and Characterization of ZnS Nanoparticles. Eng. Proc. 2023, 31, 74. [Google Scholar] [CrossRef]
- SHAHJAHAN, M.; KABIR, R.; HOSSAIN, M.S.; HAQUE, M.A.; and Prasad PAUL, D. EFFECT OF pH ON OPTICAL PROPERTIES OF NANOSTRUCTURED Cu-DOPED ZnS THIN FILMS FOR PHOTOVOLTAIC APPLICATIONS. EUROPEAN JOURNAL OF MATERIALS SCIENCE AND ENGINEERING 2024, 8 (4). 226-239. [CrossRef]
- AlShamaileh, E.; Lahlouh, B.; AL-Masri, A.N.; Al-Qderat, M.; Wadah Mahmoud, W.; Alrbaihat, M.; and Moosa, I.S. Comparative Microstructure Characteristics of Synthesized PbS Nanocrystals and Galena. Sci 2024, 6, 61. [Google Scholar] [CrossRef]
- Ebnelwaled, A. A; Elsheikh, H.H.A; and Hamed, Z.H. Synthesis and characterization of ZnS nanoparticles by chemical precipitation method. Aswan University Journal of Environmental Studies (AUJES) 2021, 2(2), 147–154. [Google Scholar] [CrossRef]
- Nagamani, K.; Prathap, P.; Lingappa, Y.; Miles, R.W.; and Reddy, K.T.R. Properties of Al-doped ZnS Films Grown by Chemical Bath Deposition. Physics Procedia 2012, 25, 137–142. [Google Scholar] [CrossRef]
- Shakil, M.A.; Sangita Das, Rahman, M.A.; Akther, U.S.; Majumdar, M.K.H.; and Rahman, M.K. A Review on Zinc Sulphide Thin Film Fabrication for Various Applications Based on Doping Elements. Materials Sciences and Applications 2018, 9, 751–778. [CrossRef]
- Ahn, H.; and Um, Y. Post-annealing Effects on ZnS Thin Films Grown by Using the CBD Method. Journal of the Korean Physical Society 2015, 67(6), 1045–1050. [Google Scholar] [CrossRef]
- Karimi, M.; Mirkazemi, S.M.; Vahidshad, Y.; and Javadpour, J. Preparation and characterization of zinc sulfide thin film by electrostatic spray deposition of nano-colloid. Thin Solid Films 2021, 737(1), 138929. [Google Scholar] [CrossRef]
- Faita, F.L.; Ersching, K.; Poffo, C.M.; Benetti, L.C.; Trichês, D.M.; Souza, S.M.; Viegas, A.D.C.; and de Lima, J.C. Structural, thermal, magnetic and optical characterization of undoped nanocrystalline ZnS prepared by solid state reaction. Journal of Alloys and Compounds 2014, 590, 176 –183. [CrossRef]
- Krystýnová, M.; Doležal, P.; Fintová, S.; Březina, M.; Zapletal, J.; and Wasserbauer, J. Preparation and Characterization of Zinc Materials Prepared by Powder Metallurgy. Metals 2017, 7, 396. [Google Scholar] [CrossRef]
- Petersen, H.; Reichle, S.; Leiting, S.; Losch, P.; Kersten, W.; Rathmann, T.; Tseng, J.; Etter, M.; Schmidt, W.; and Weidenthaler, C. In Situ Synchrotron X-ray Diffraction Studies of the Mechanochemical Synthesis of ZnS from its Elements. Chem. Eur. J. 2021, 27, 12558–12565. [Google Scholar] [CrossRef] [PubMed]
- Moosa. I.S.; Kazem, H.A.; and Al-Iessi, L.M.R. Production of Hydrogen via Renewable Energy and Investigation of Water Molecular Changes During Electrolysis Process. JREE: 2021, 8 (4) 19-28. [CrossRef]
- Labiadh, H.; Moualhi,Y.; Moualhi, K.; Abdelhak Othmani, A.; Zouaoui, M. Synthesis of ZnS nanoparticles and the investigation of their structural, optical and electrical properties. Euro-Mediterr J Environ Integr 2025, 10, 119–130. [CrossRef]
- Chankhanittha, T.; Watcharakitti, J.; Piyavarakorn, V.; Johnson, B.; Bushby, R.J.; Chuaicham, C.; Sasaki, K.; Nijpanich, S.; Nakajima, H.; Chanlek, N.; and Nanan, S. ZnO/ZnS photocatalyst from thermal treatment of ZnS: Influence of calcination temperature on development of heterojunction structure and photocatalytic performance. Journal of Physics and Chemistry of Solids 2023, 179, 111393. [Google Scholar] [CrossRef]
- Yang, K.; Li, B.; and Zeng, G. Effects of temperature on properties of ZnS thin films deposited by pulsed laser deposition. Superlattices and Microstructures 2019, 130, 409–415. [Google Scholar] [CrossRef]
- Al-Saqarat, B.S.; Al-Mobydeen, A.; Al-Dalahmeh, Y.; AL-Masri, A.N.; Altwaiq, A.M.; Hamadneh, I.; Abu-Afifeh, Q.; Zoubi, M.M.; Esaifan, M.; and Moosa, I.S. Study of Galena Ore Powder Sintering and Its Microstructure. Metals 2024, 14, 439. [Google Scholar] [CrossRef]
- Grayeli, A.; Sadeghi, M.; Shakoury, R.; Matos, R.S.; Filho, H.D.F; Arman, A. Structural, morphological, and optical bandgap properties of ZnS thin films: a case study on thickness dependence. Optical and Quantum Electronics 2024, 56, 1142. [Google Scholar] [CrossRef]
- Grayeli, A.; Sadeghi, M.; Shakoury, R.; Matos, R.S.; Filho, H.D.F.; and Arman, A. Structural, morphological, and optical bandgap properties of ZnS thin films: a case study on thickness dependence. Optical and Quantum Electronics 2024, 56, 1142. [Google Scholar] [CrossRef]
- Jafarov, M.A.; Nasirov, E.F.; Jahangirova, S.A.; and Jafarli, R. Nano-ZnS thin films for solar cell. NANOSYSTEMS: PHYSICS, CHEMISTRY, MATHEMATICS 2015, 6 (5), 644–649. [CrossRef]
- Choudapura, V.H.; Kapatkara, S.B.; and Rajub, A.B. STRUCTURAL AND OPTOELECTRONIC PROPERTIES OF ZINC SULFIDE THIN FILMS SYNTHESIZED BY CO-PRECIPITATION METHOD. ACTA CHEMICA IASI 2019, 2, 287–302. [Google Scholar] [CrossRef]
- Djelloul, A.; Adnane, M.; Larbah, Y.; Sahraoui, T.; Zegadi, C.; Maha, A.; and Rahal, B. Properties Study of ZnS Thin Films Prepared by Spray Pyrolysis Method. JOURNAL OF NANO- AND ELECTRONIC PHYSICS 2015, 7 (4), 04045. https://jnep.sumdu.edu.ua/download/numbers/2015/4/articles/jnep_2015_V7_04045.pdf.
- NADEEM, M.Y.; and AHMED, W. Optical Properties of ZnS Thin Films. Turkish Journal of Physics 2000, 24, 5, 651 -659. https://journals.tubitak.gov.tr/physics/vol24/iss5/6.
- Alzaid, M.; Mohamed, W.S.; El-Hagary, M.; Shaaban, E.R.; and Hadia, N.M.A. Optical properties upon ZnS film thickness in ZnS/ITO/glass multilayer films by ellipsometric and spectrophotometric investigations for solar cell and optoelectronic applications. Optical Materials 2021, 118, 111228. [Google Scholar] [CrossRef]
- Jothibas, M.; Jeyakumar, S. J.; Manoharan, C.; Punithavathy, I.K.; Praveen, P.; and Richard, J.P. Structural and optical properties of zinc sulphide nanoparticles synthesized via solid state reaction method. J Mater Sci: Mater Electron 2017, 28, 1889–1894. [CrossRef]
- Mani, S.K.; Manickam, S.; Muthusamy, V.; and Thangaraj, R. Antimicrobial Activity and Photocatalytic Degradation Properties of Zinc Sulfide Nanoparticles Synthesized by Using Plant Extracts. J Nanostruct 2018, 8(2), 107–118. [Google Scholar]
- Tounsi, A.; Talantikite-Touati, D.; Merzouk, H.; Haddad, H.; and Khalfi, R. Study of the properties of La-doped ZnS thin Films synthesized by Sol-gel method. Advanced Materials Letters, 2018, 9 (3) 216-219. [CrossRef]
- Włodarski, M.; Putkonen, M.; and Norek, M. Infrared Absorption Study of Zn–S Hybrid and ZnS Ultrathin Films Deposited on Porous AAO Ceramic Support. Coatings 2020, 10, 459. [Google Scholar] [CrossRef]
- Hameed, O.M. Synthesis of Zinc Sulfide Nanocrystals by Chemical Bath Deposition Methods. E3S Web of Conferences 2023, 391, 01134. ICMED-ICMPC 2023. [CrossRef]
- Hameed, O.M. Synthesis of Zinc Sulfide Nanocrystals by Chemical Bath Deposition Methods. E3S Web of Conferences 2023, 391, 01134. [Google Scholar] [CrossRef]
- Khosravi, S.; Chaibakhsh, N.; S. Jafari, S.; and M. Nilkar, M. Enhanced photocatalytic activity of ZnS/TiO2 nanocomposite by nitrogen and tetrafluoromethane plasma treatments. Scientific Reports 2024, 14, 28385. [CrossRef]
Figure 1.
Schematic of research running procedure.
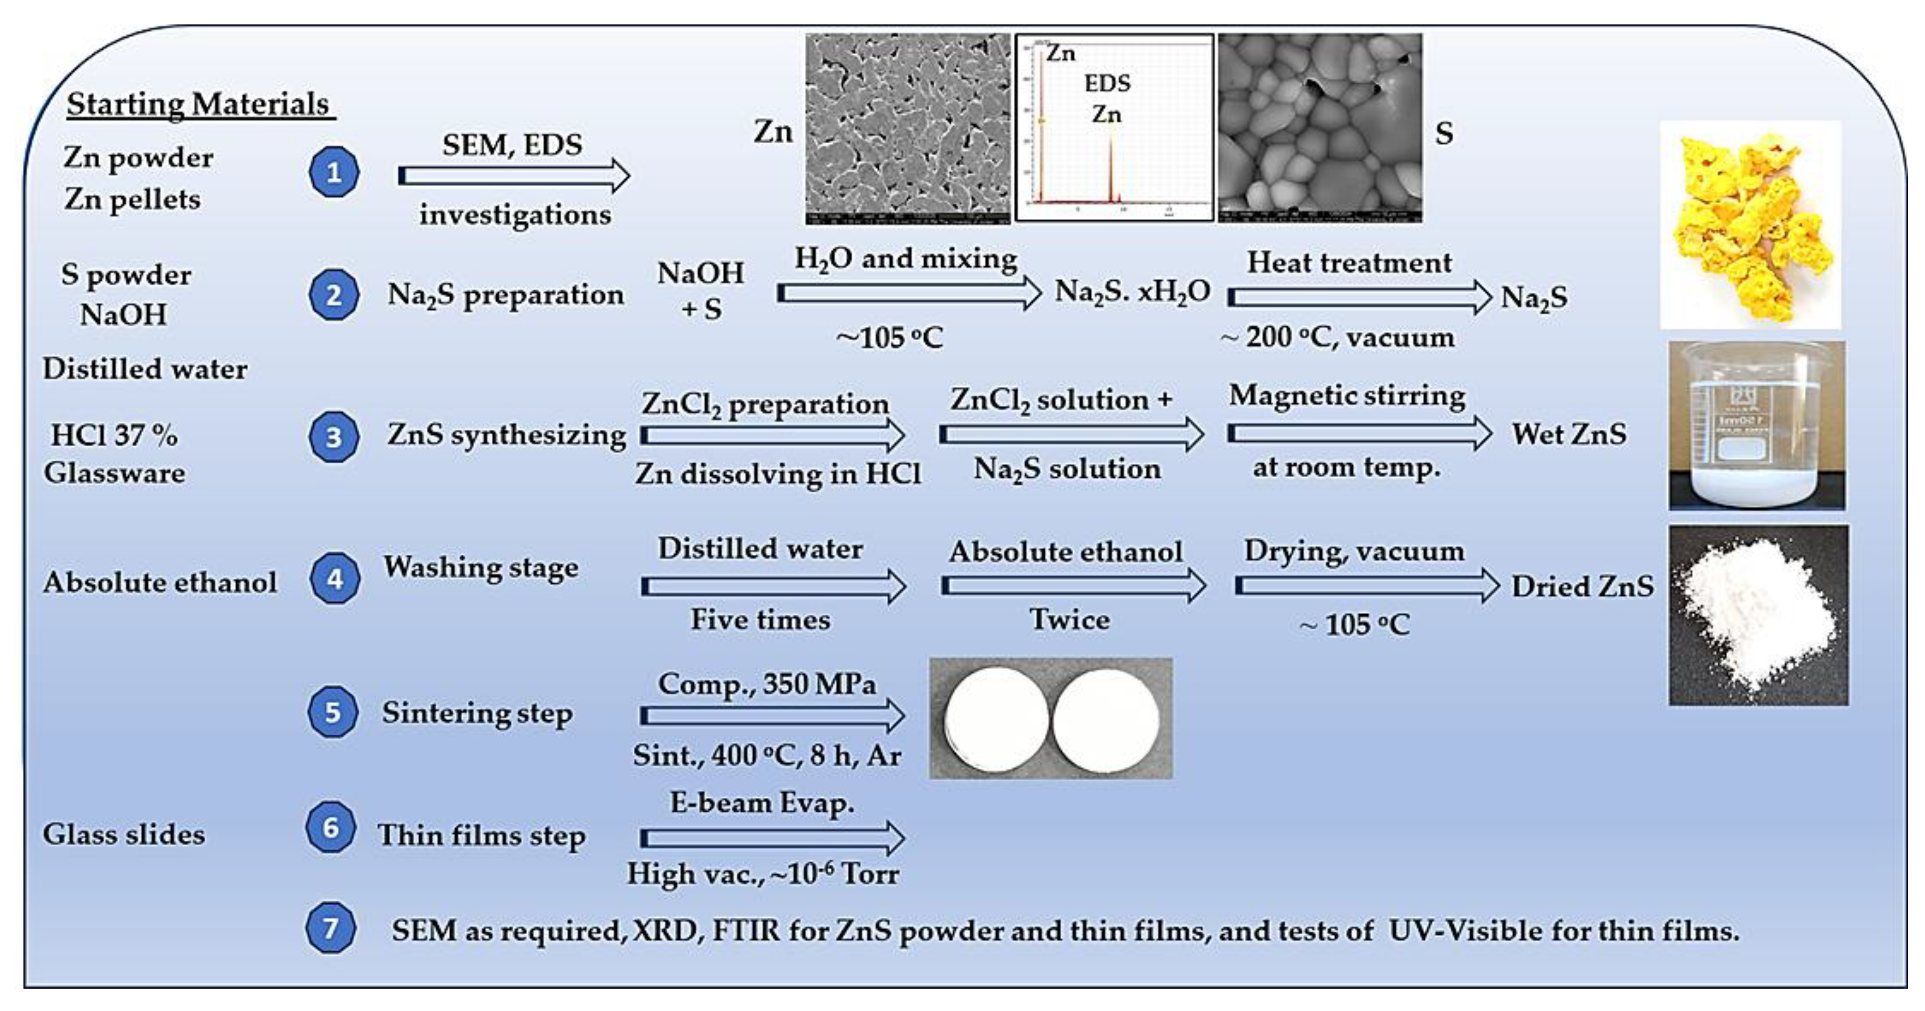
Figure 2.
Produced Na2S to the left, synthesized ZnS fine white powder in its precipitation solution in the middle, and dried ZnS powder to the right.
Figure 2.
Produced Na2S to the left, synthesized ZnS fine white powder in its precipitation solution in the middle, and dried ZnS powder to the right.
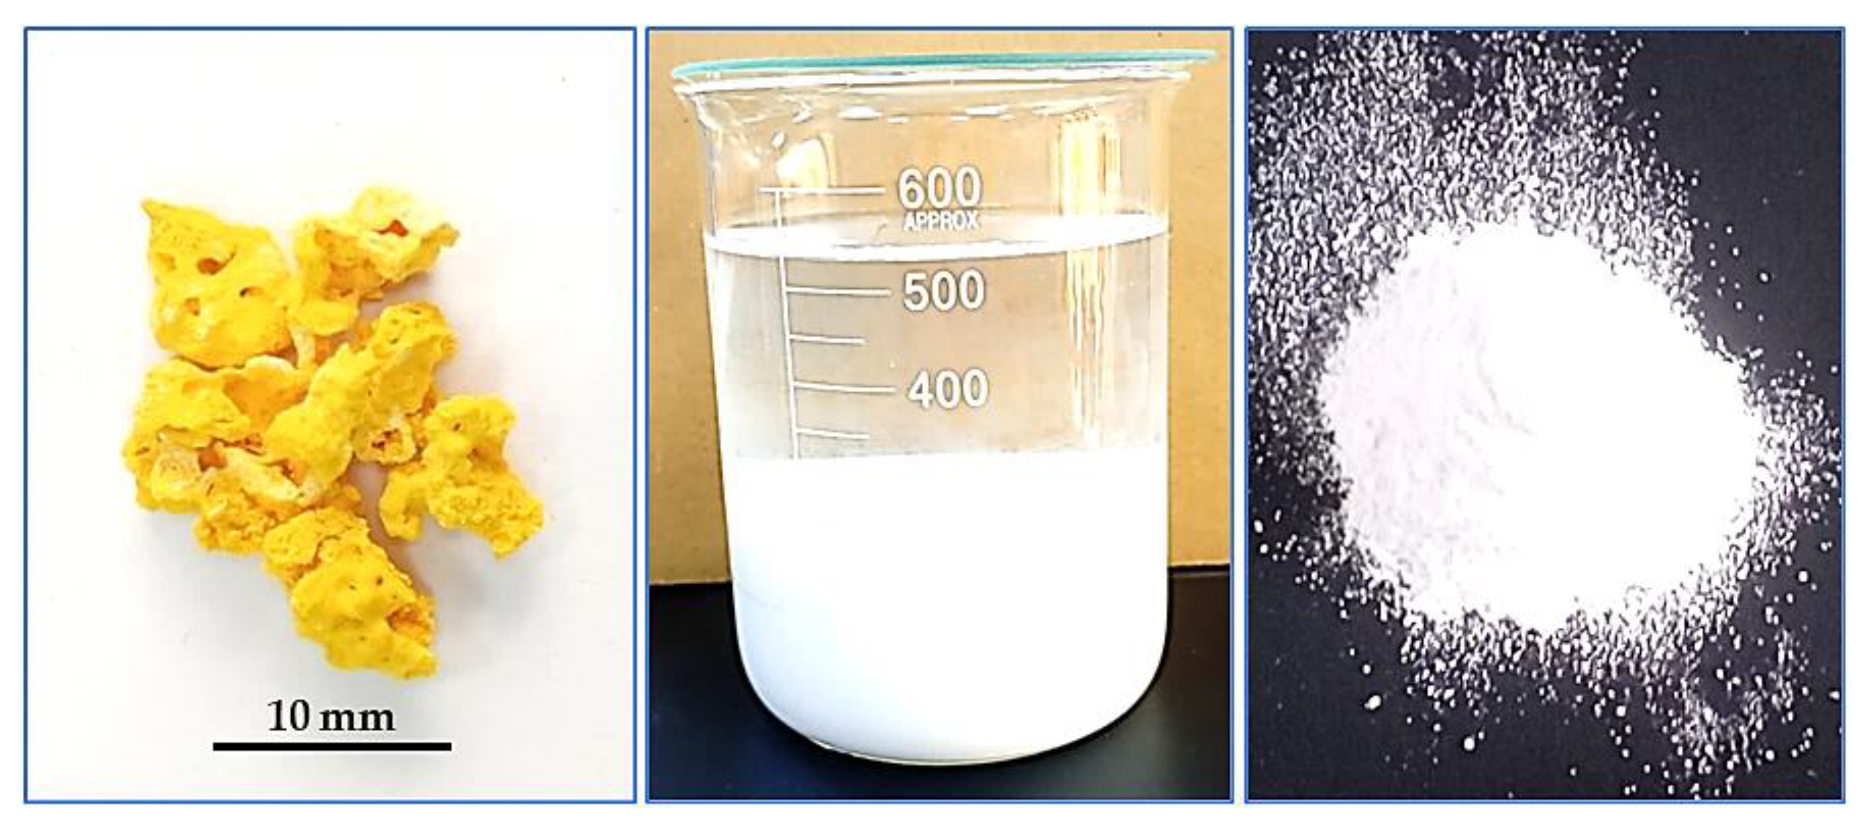
Figure 3.
Photograph of three compacted pellets of ZnS at a pressure of 400 MPa. The numbers on the scale are in centimeters.
Figure 3.
Photograph of three compacted pellets of ZnS at a pressure of 400 MPa. The numbers on the scale are in centimeters.
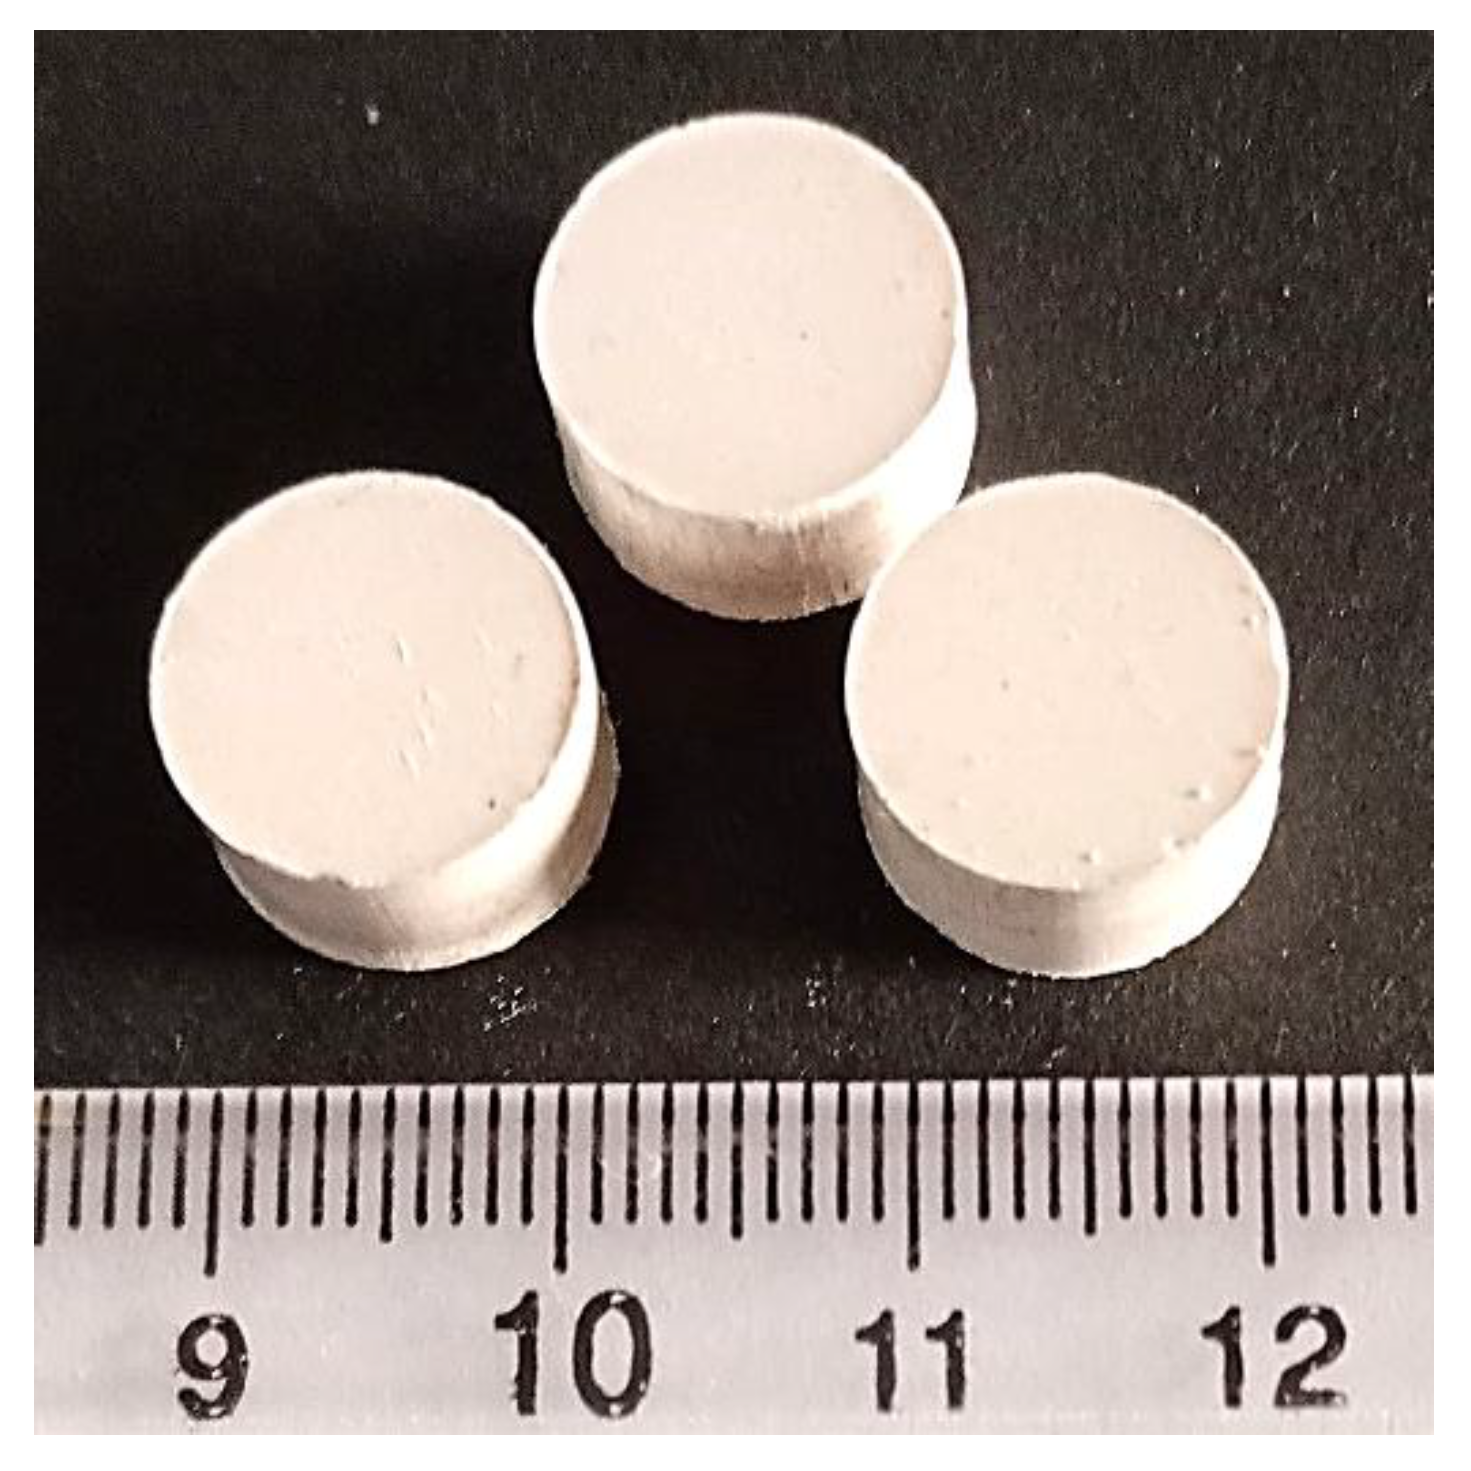
Figure 4.
SEM micrographs of Zn and S powders with their EDS spectra, (a) SEI-mode micrograph of Zn powder, (b) The EDS of micrograph (a), (c) SEI-mode micrograph of S powder, (d) The EDS of micrograph (c).
Figure 4.
SEM micrographs of Zn and S powders with their EDS spectra, (a) SEI-mode micrograph of Zn powder, (b) The EDS of micrograph (a), (c) SEI-mode micrograph of S powder, (d) The EDS of micrograph (c).
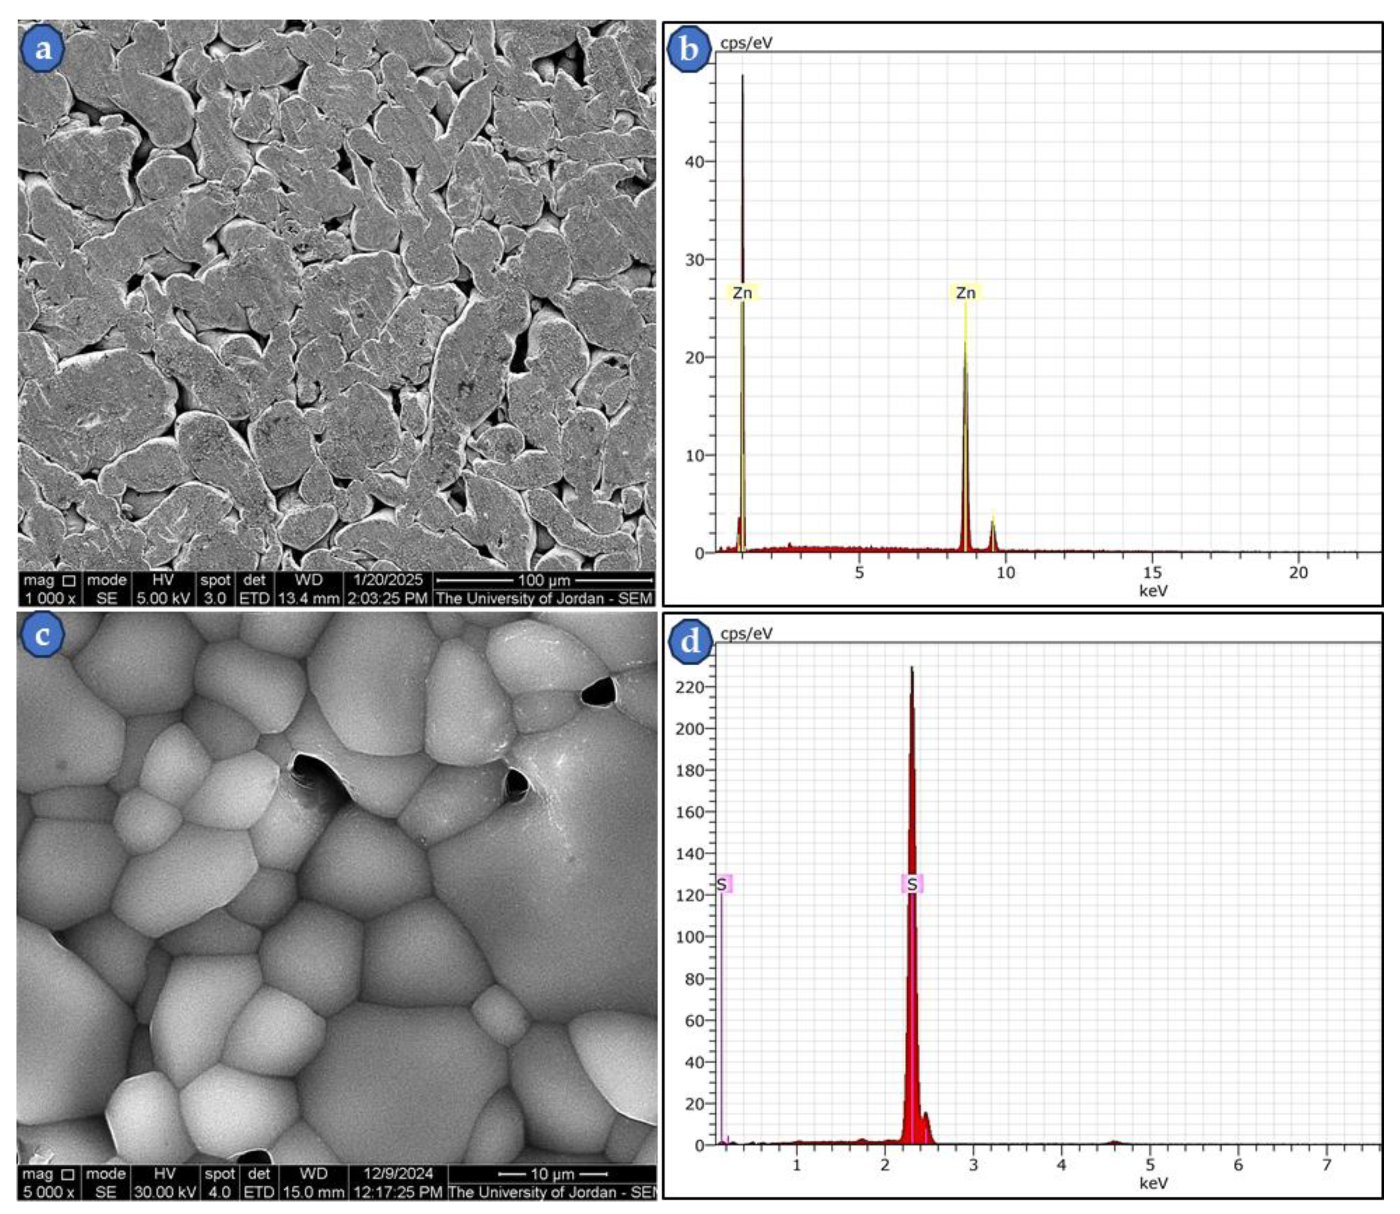
Figure 5.
SEM micrographs (SEI-mode) of synthesized ZnS at two high magnifications, (a) 80,000×, (b)100,000× with green labeled nanoparticles, (c) the EDS spectrum with chemical analysis table, and (d) powder XRD pattern of powder that was heat treated at 200 oC.
Figure 5.
SEM micrographs (SEI-mode) of synthesized ZnS at two high magnifications, (a) 80,000×, (b)100,000× with green labeled nanoparticles, (c) the EDS spectrum with chemical analysis table, and (d) powder XRD pattern of powder that was heat treated at 200 oC.
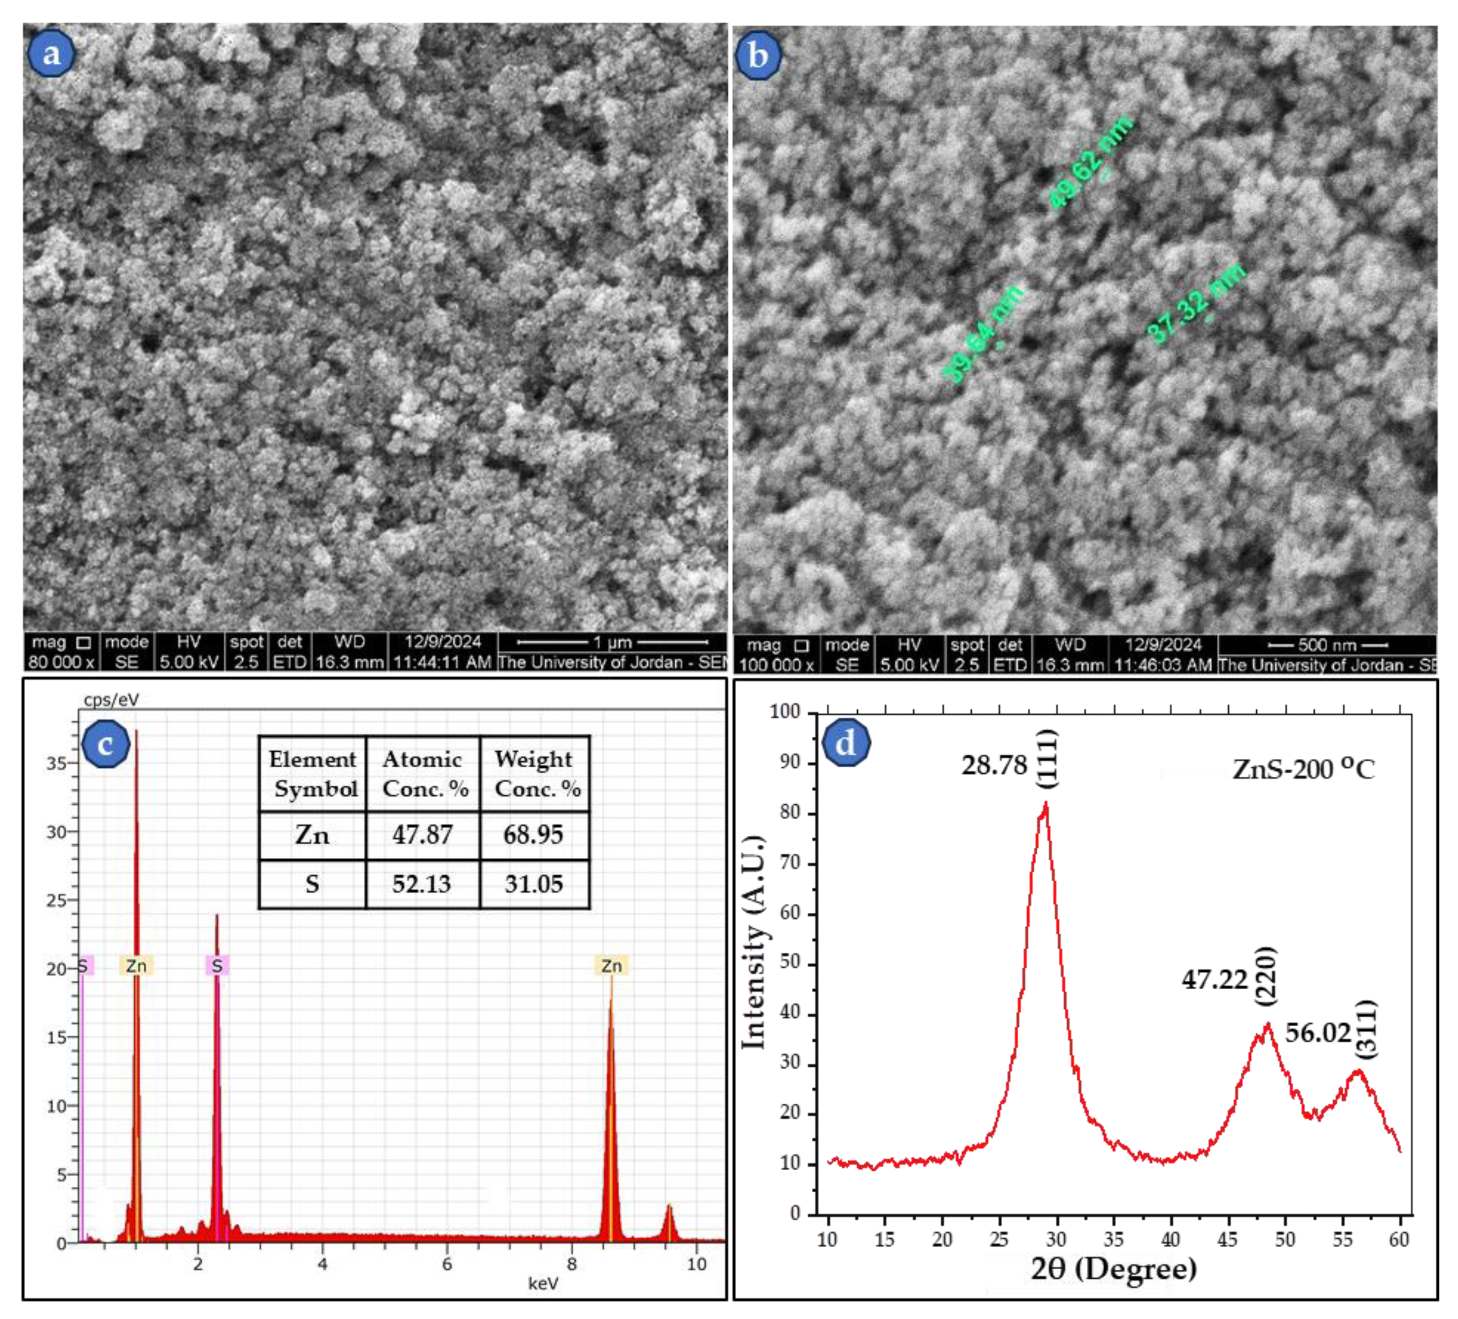
Figure 6.
SEM micrographs (SEI-mode) of synthetized nanopowder and fracture surface of sintered sample at 400 oC, (a) as- synthetized ZnS powder at 40,000× magnification, (b and c) fracture surfaces at 20,000× and 40,000× magnifications, (d) fracture surface at 80,000× magnification with green color labeled particles.
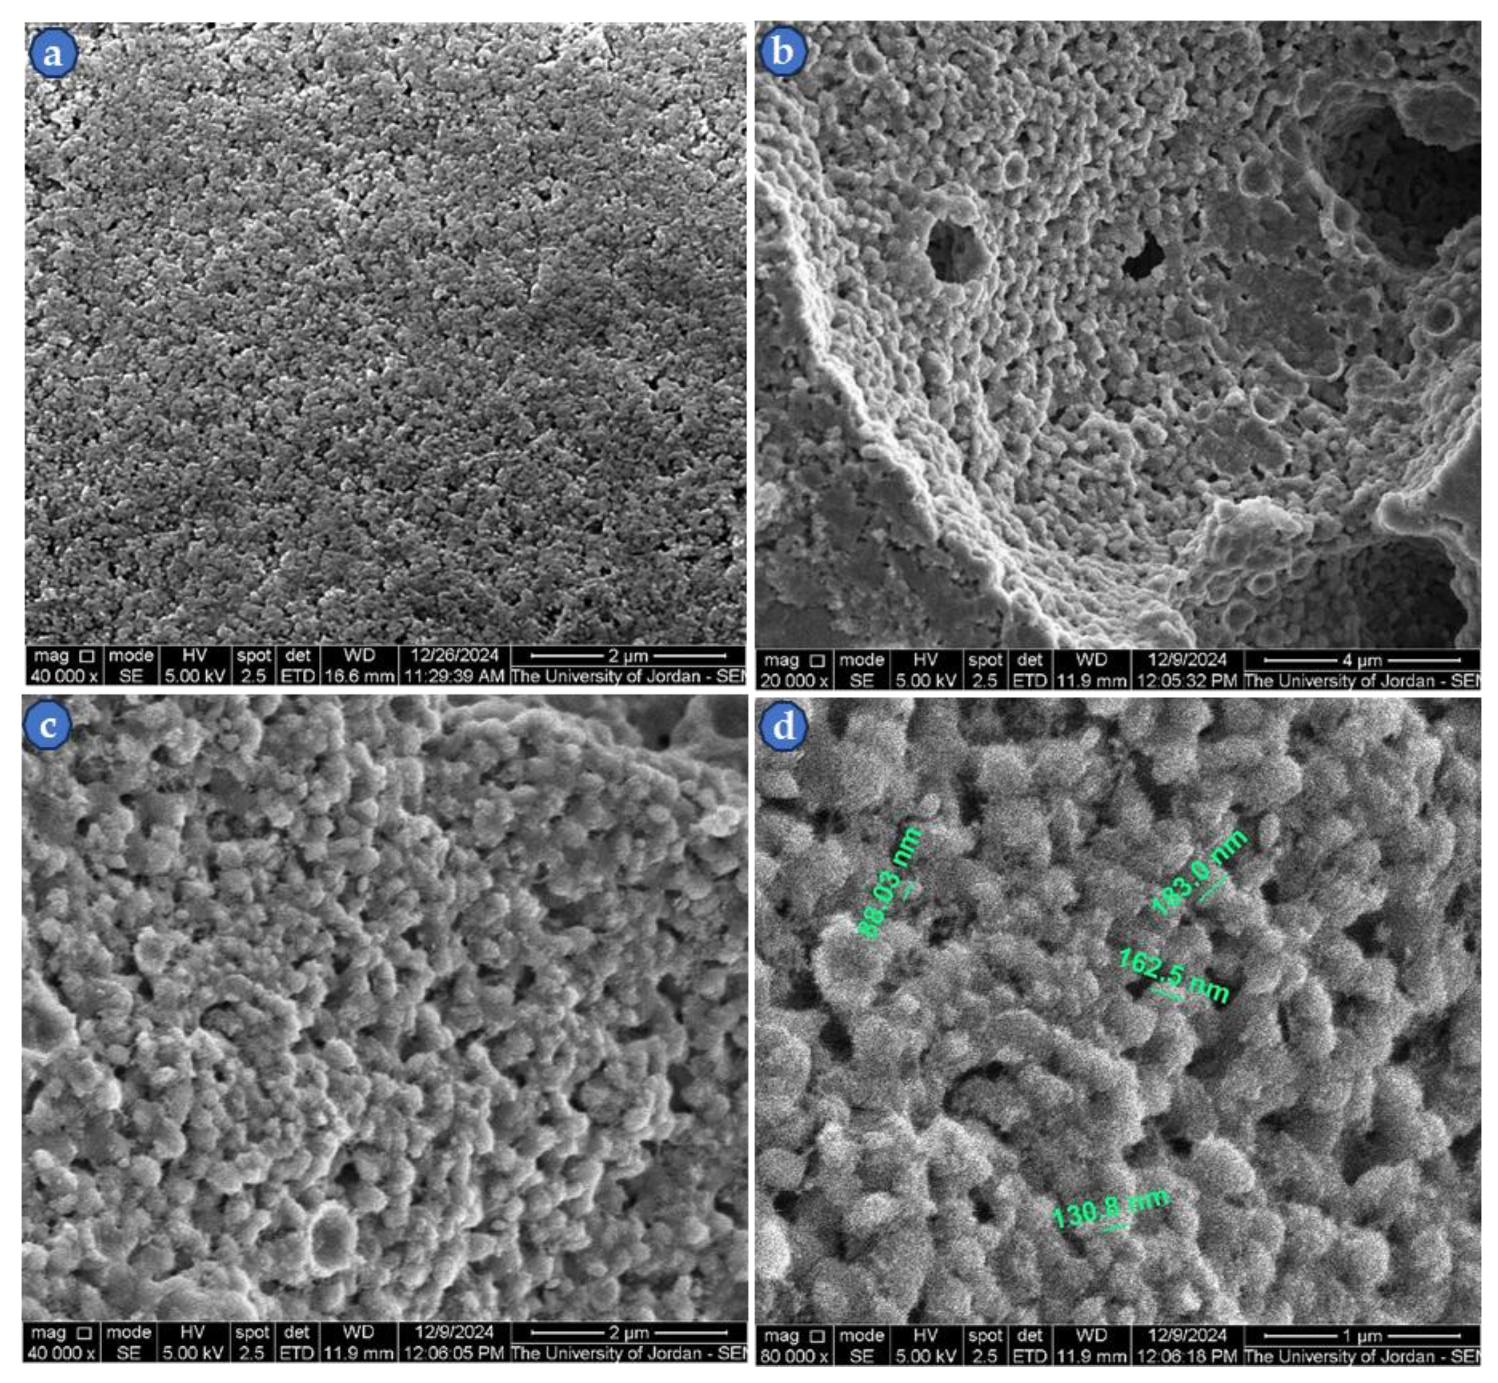
Figure 7.
SEM micrographs (SEI-mode) of ZnS E-beam evaporated 111 nm thin film, (a) at 40,000× magnification, (b) at 80,000× magnification, (c and d) cross-sections of the thin film with green labeled thickness measurement at 80,000× magnification.
Figure 7.
SEM micrographs (SEI-mode) of ZnS E-beam evaporated 111 nm thin film, (a) at 40,000× magnification, (b) at 80,000× magnification, (c and d) cross-sections of the thin film with green labeled thickness measurement at 80,000× magnification.
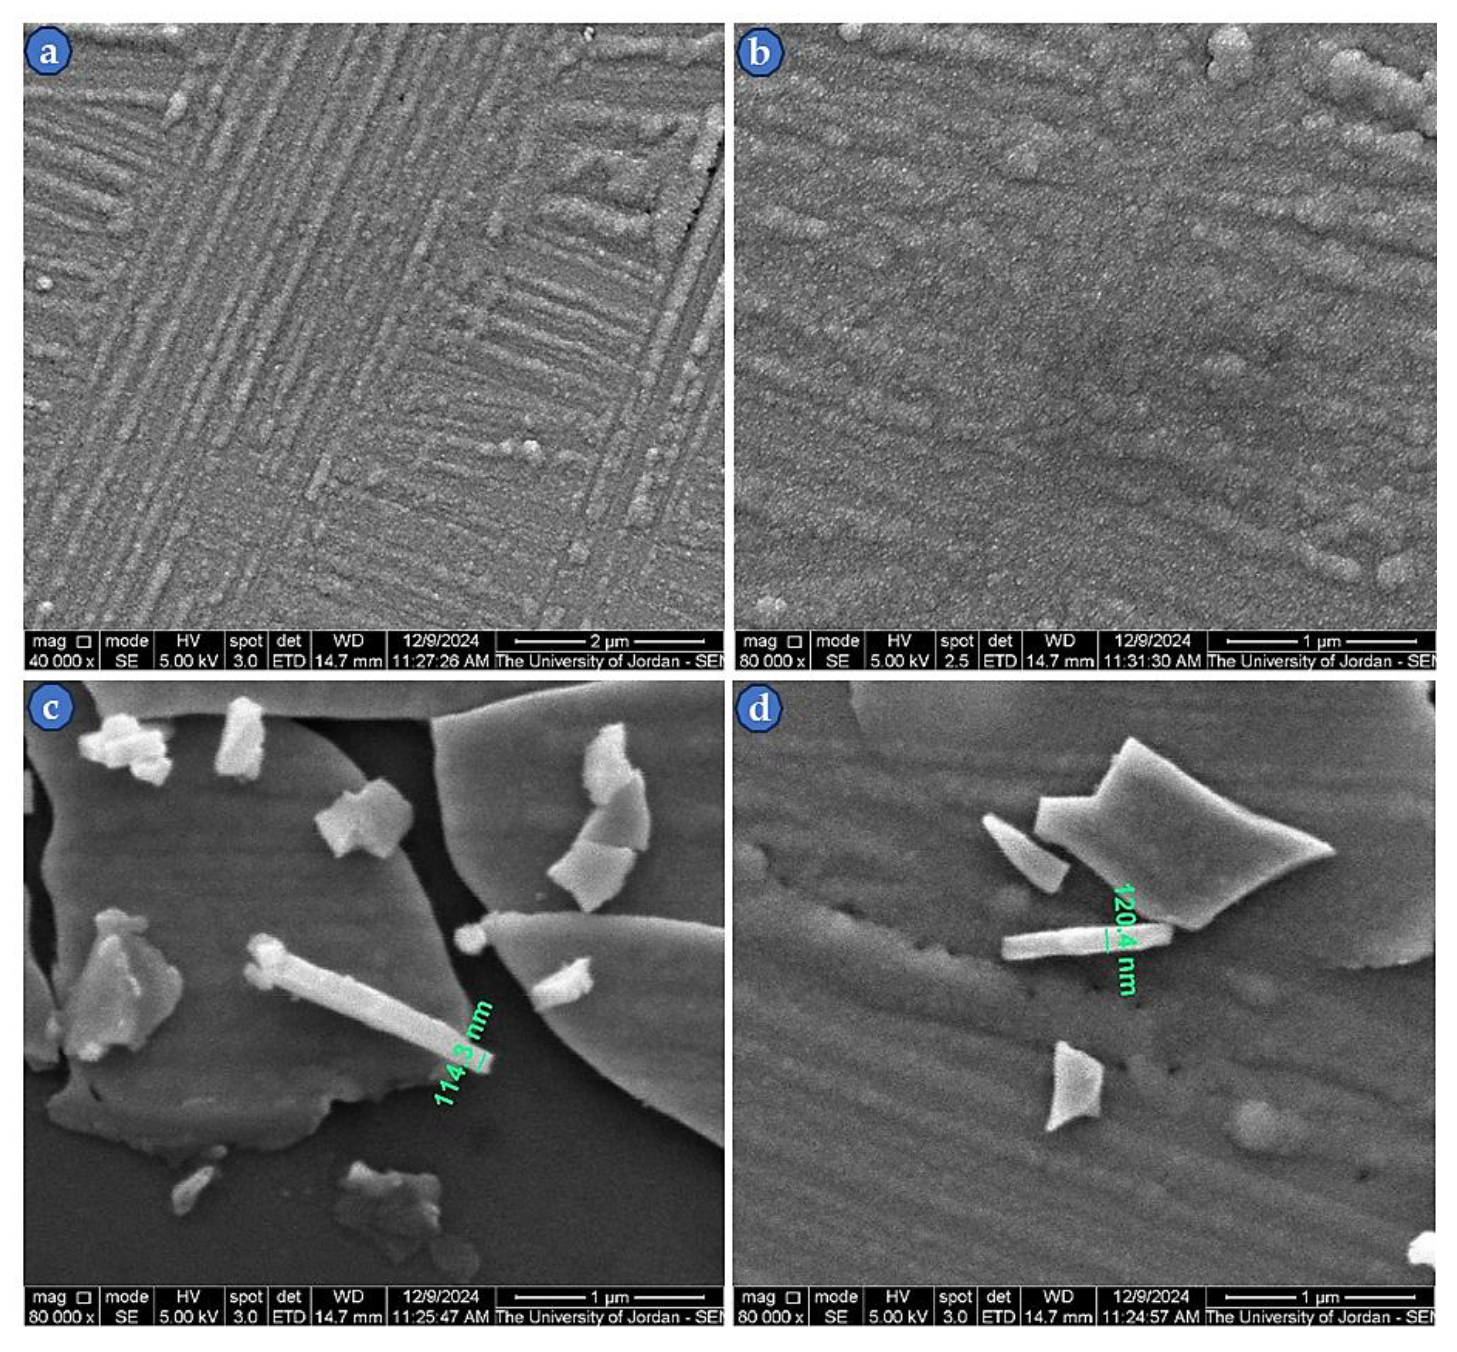
Figure 8.
XRD patterns of 111 nm ZnS thin films of three cases, as-evaporated, annealed at 250 oC and 400 oC for 6h, as recorded in the figure.
Figure 8.
XRD patterns of 111 nm ZnS thin films of three cases, as-evaporated, annealed at 250 oC and 400 oC for 6h, as recorded in the figure.
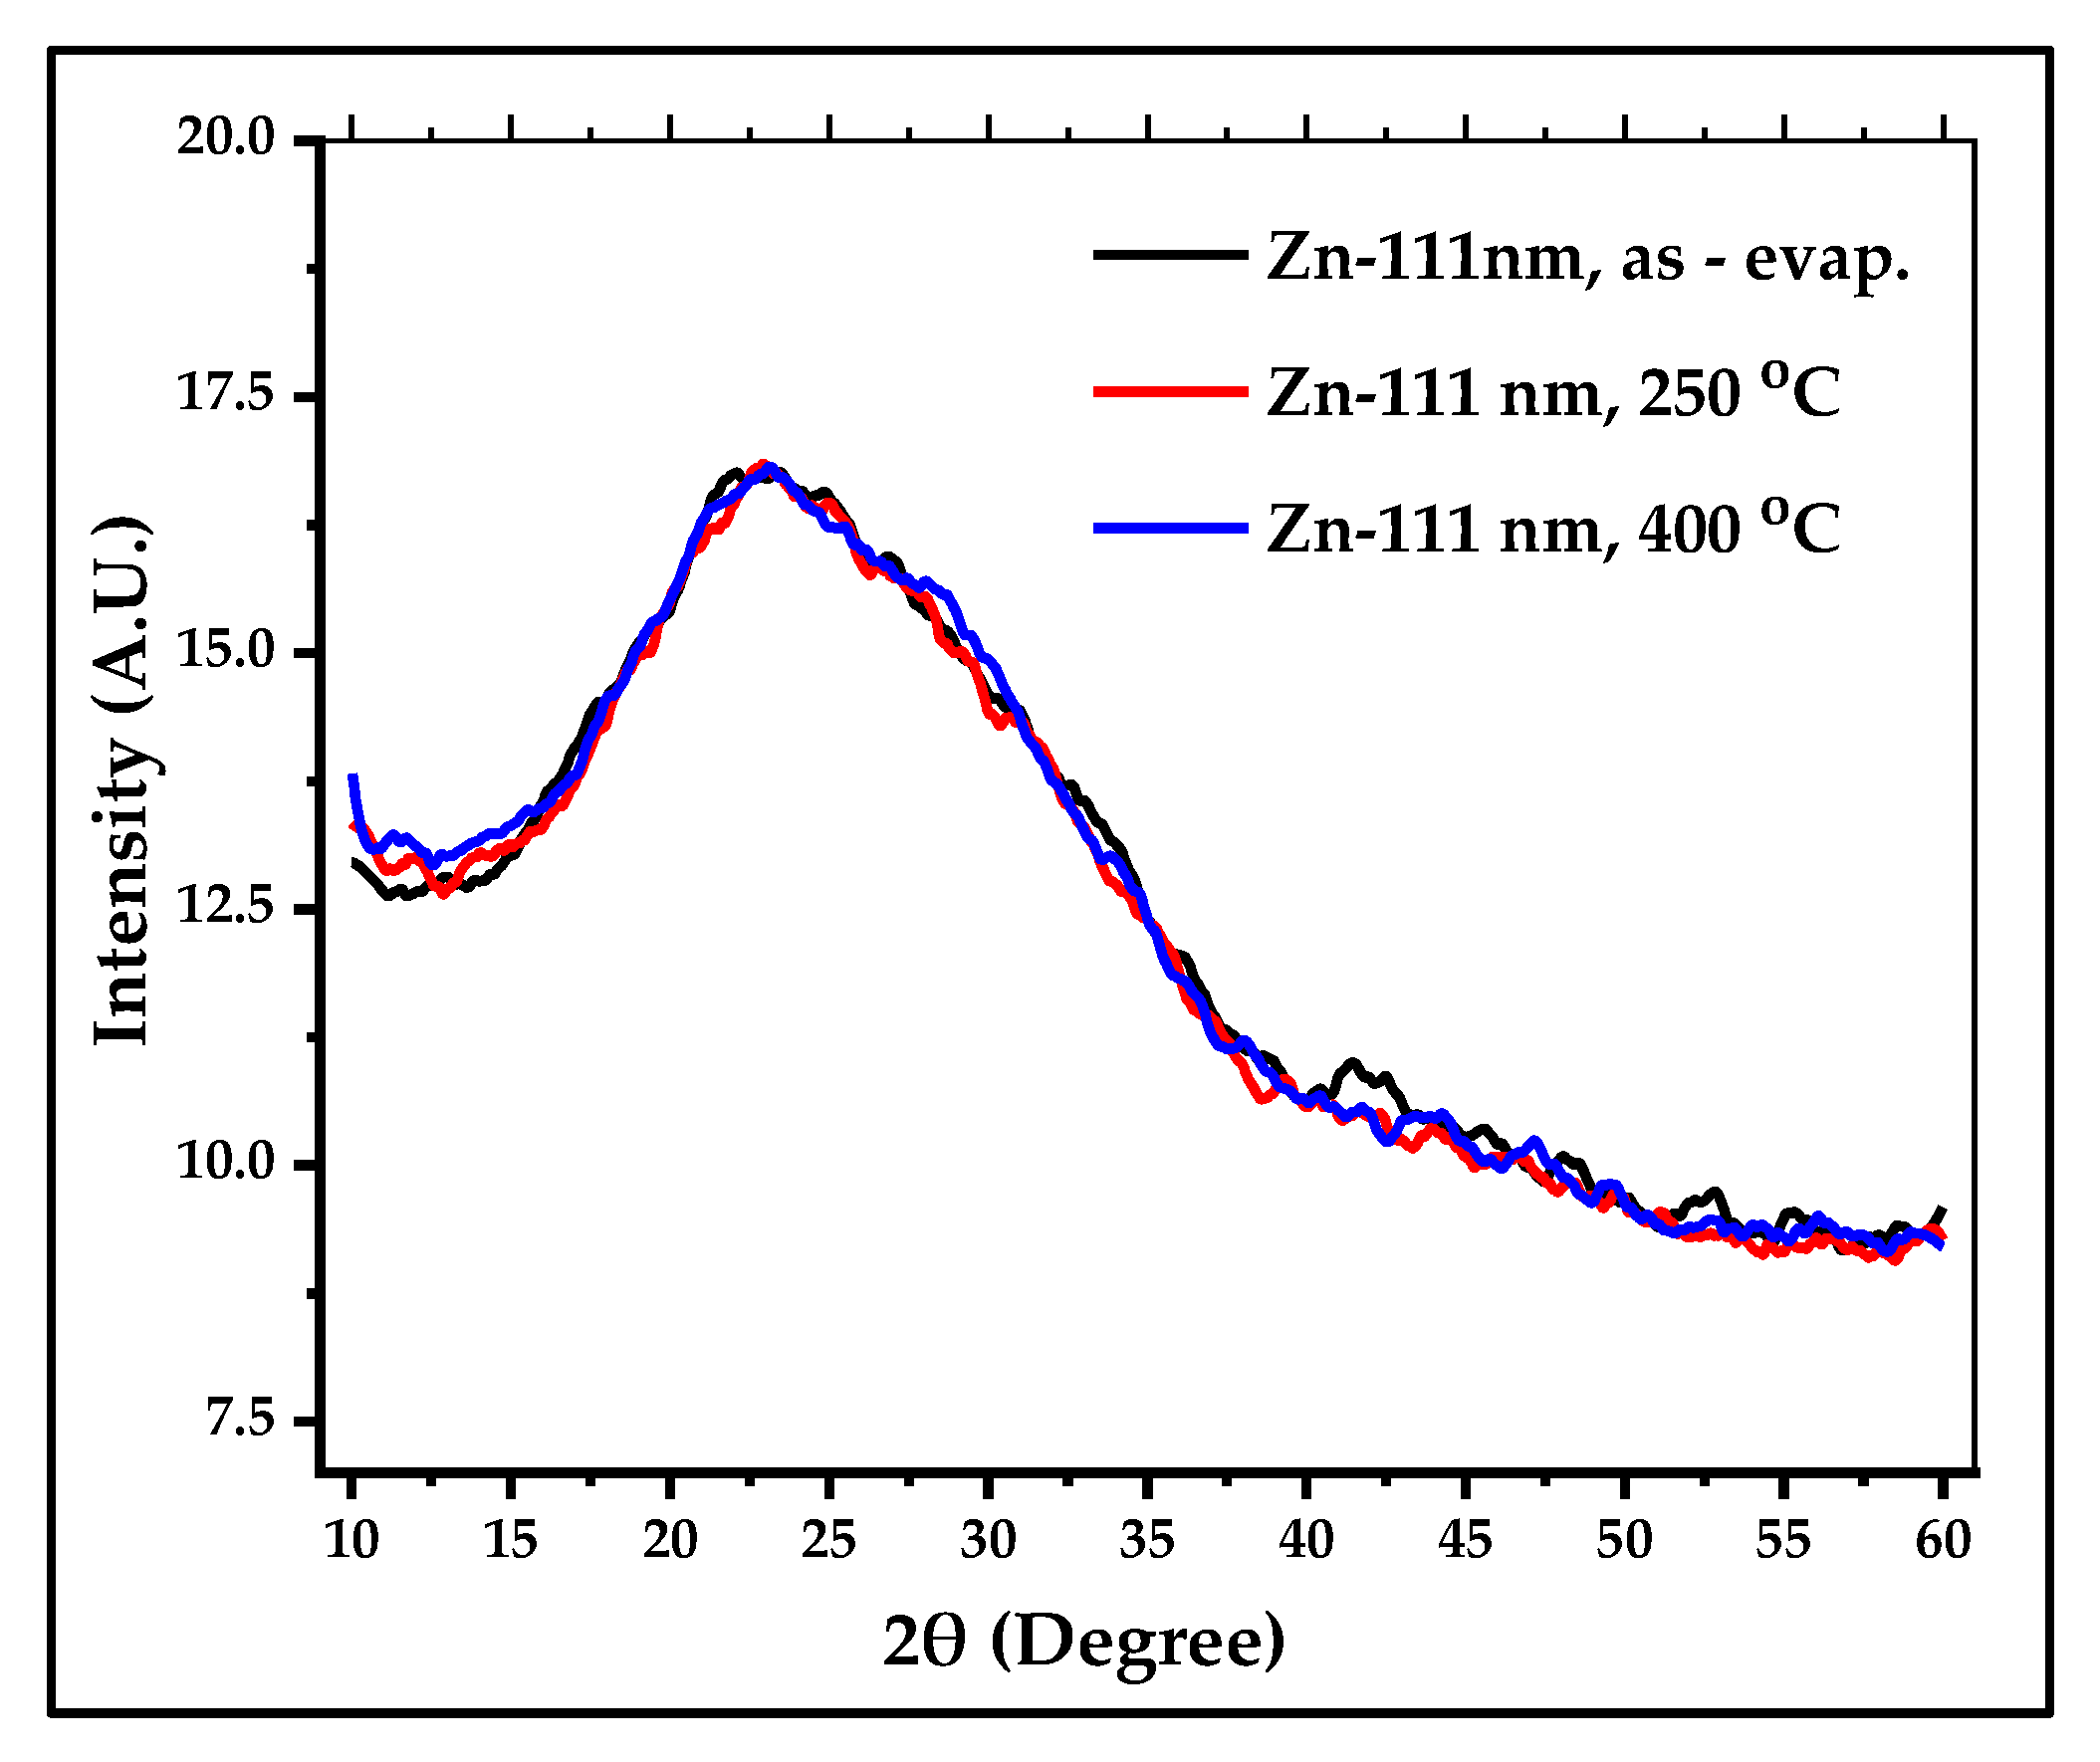
Figure 9.
UV-Visible curves of ZnS thin films, (a) T% of ~40nm, and (b) T% of ~111 nm.
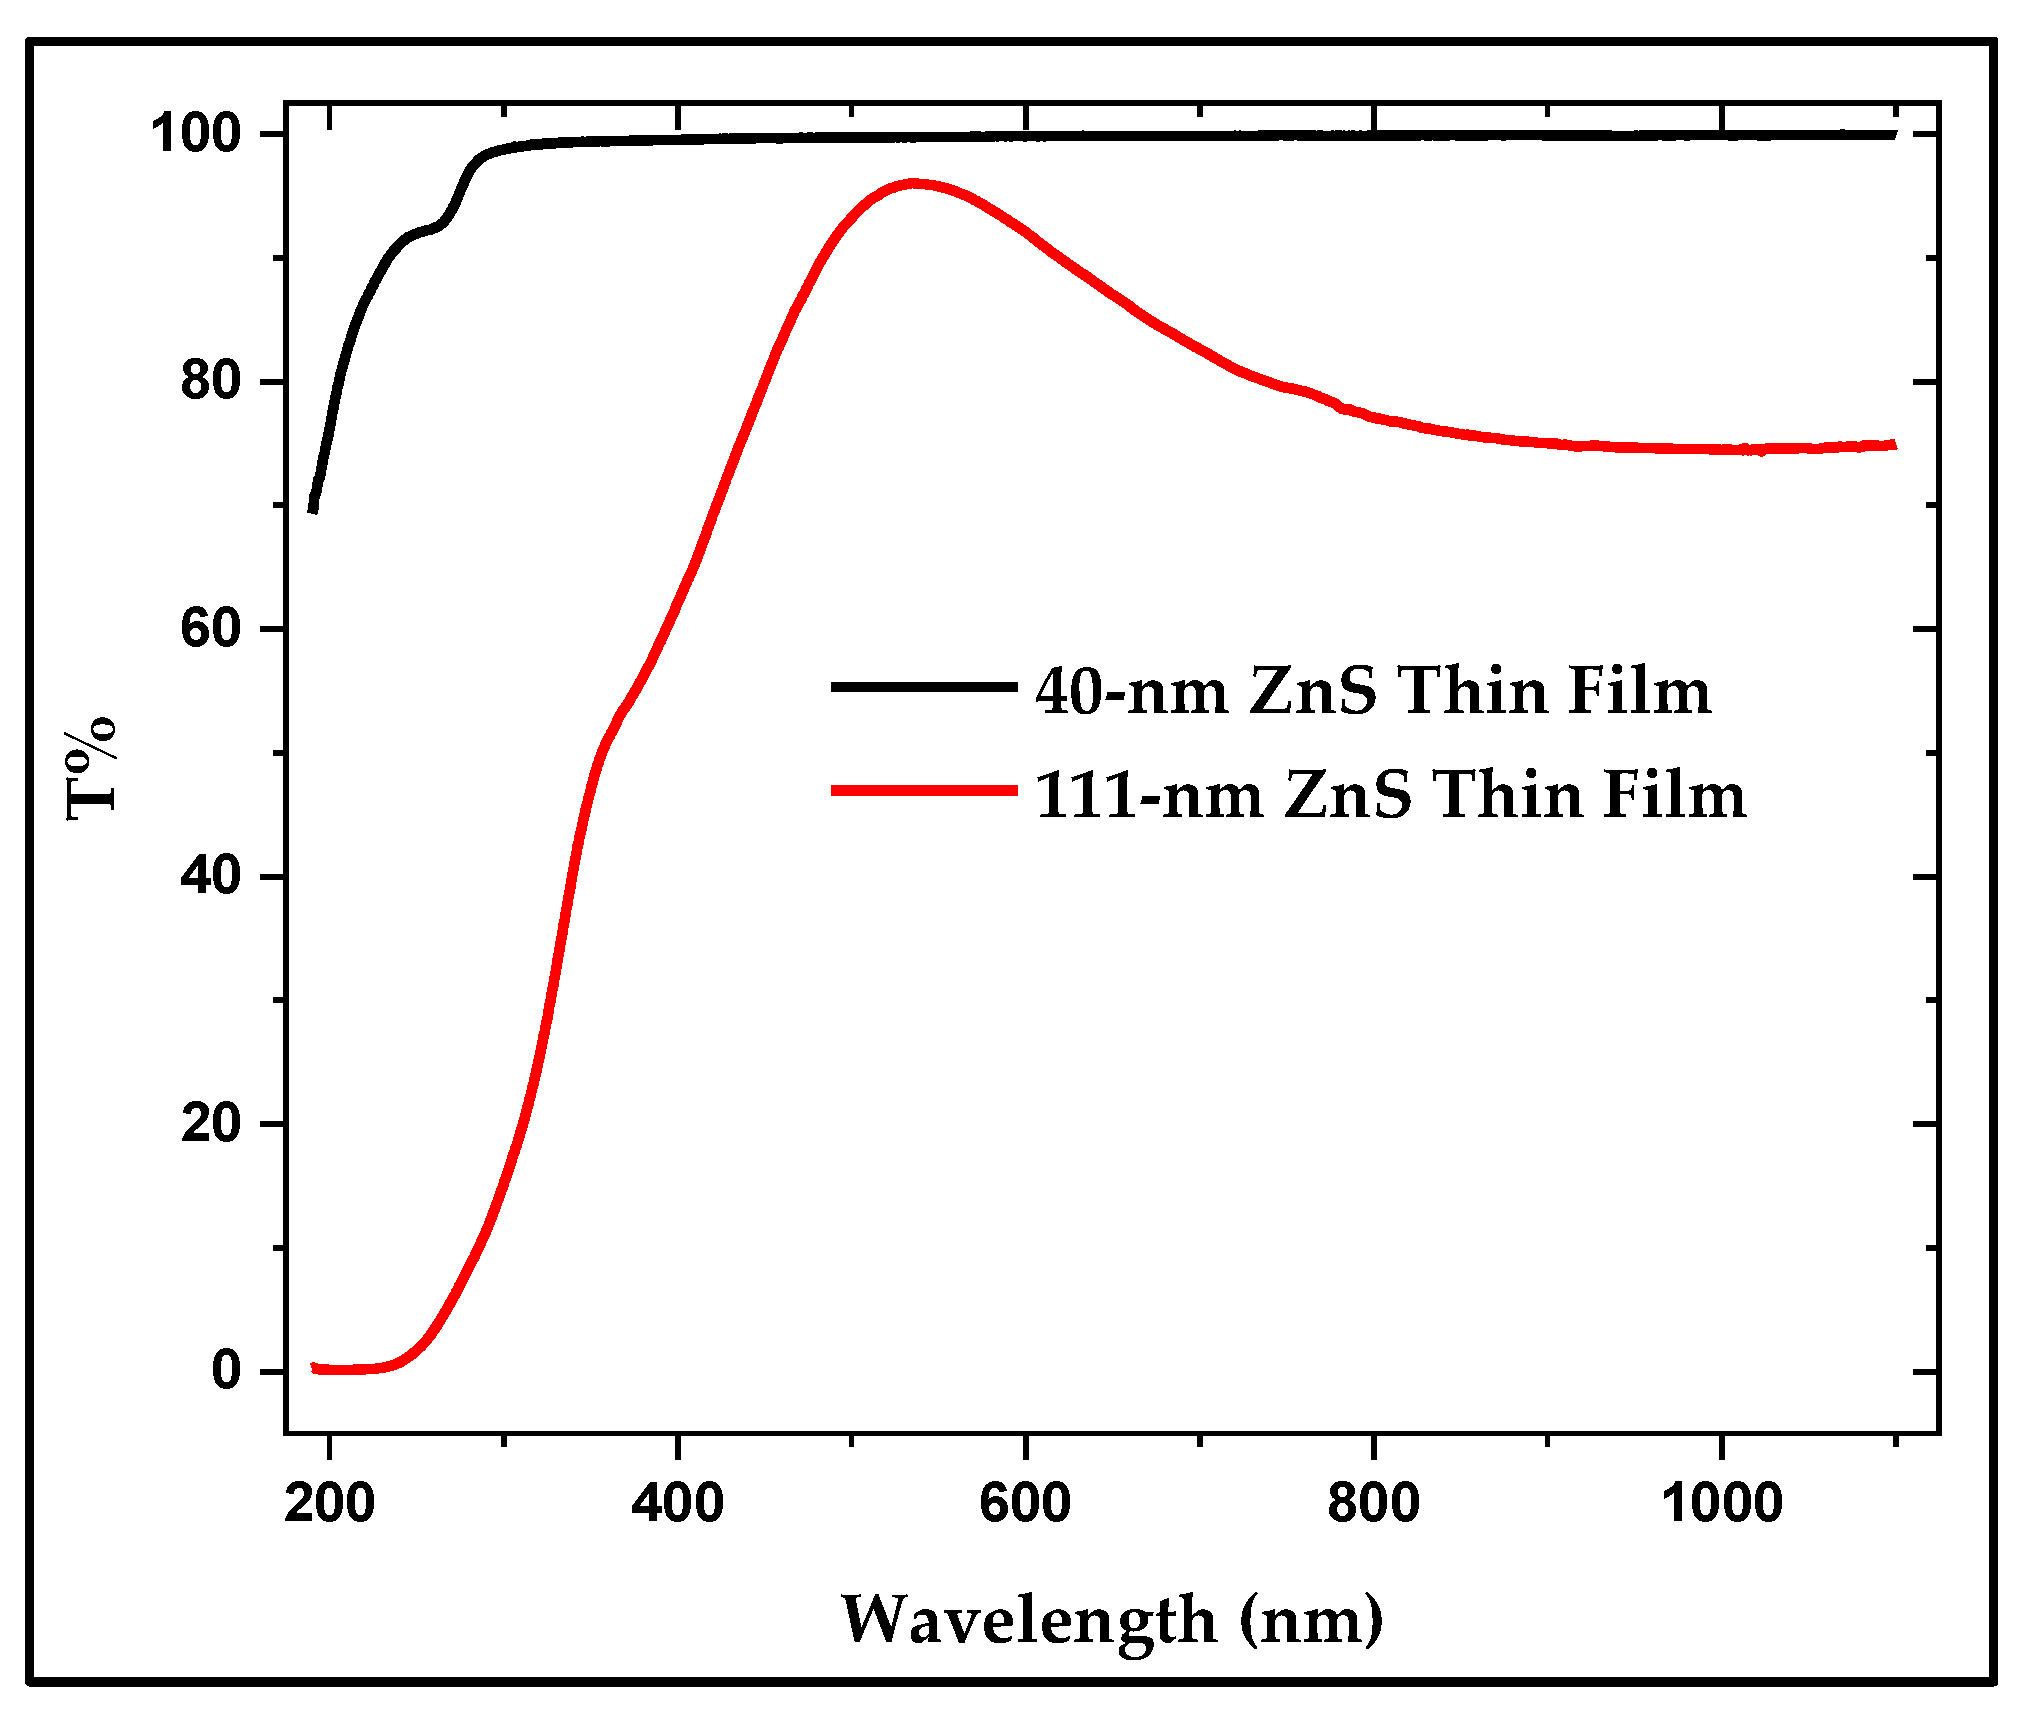
Figure 10.
(a) Tauc’s plot of the 40-nm thin film with a bandgap of 5.82 eV., and (b) the linear fit for the linear region of the Tauc’s plot for a better fit and a more accurate bandgap calculation.
Figure 10.
(a) Tauc’s plot of the 40-nm thin film with a bandgap of 5.82 eV., and (b) the linear fit for the linear region of the Tauc’s plot for a better fit and a more accurate bandgap calculation.
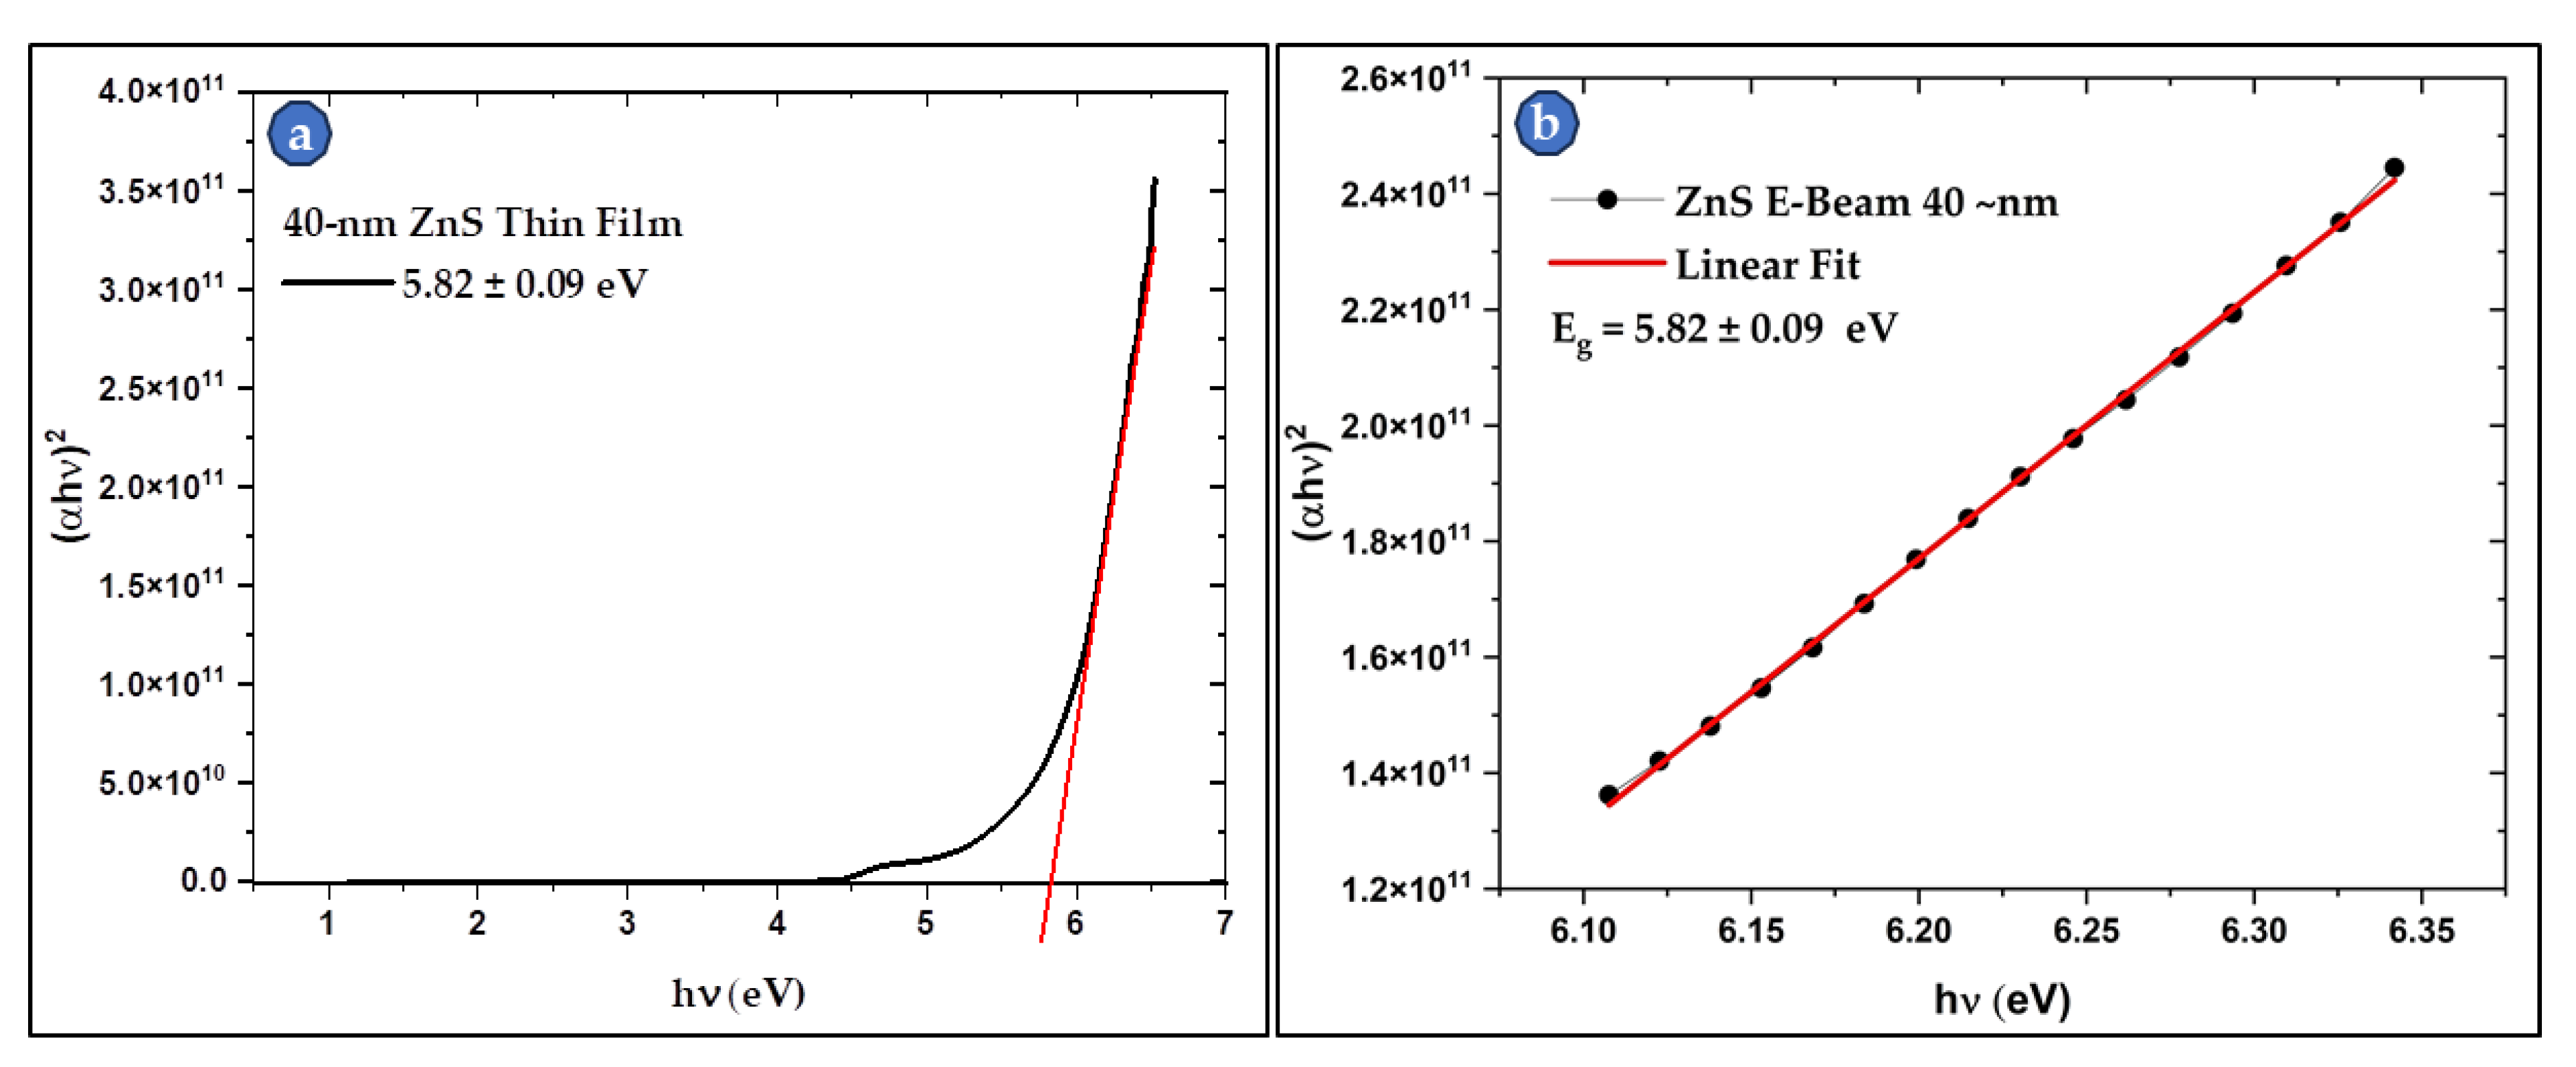
Figure 11.
(a) Tauc’s plot of the 111-nm thin film with a bandgap of 4.72 eV. And (b) the linear fit for the linear region of the Tauc’s plot for a better fit and a more accurate bandgap calculation.
Figure 11.
(a) Tauc’s plot of the 111-nm thin film with a bandgap of 4.72 eV. And (b) the linear fit for the linear region of the Tauc’s plot for a better fit and a more accurate bandgap calculation.
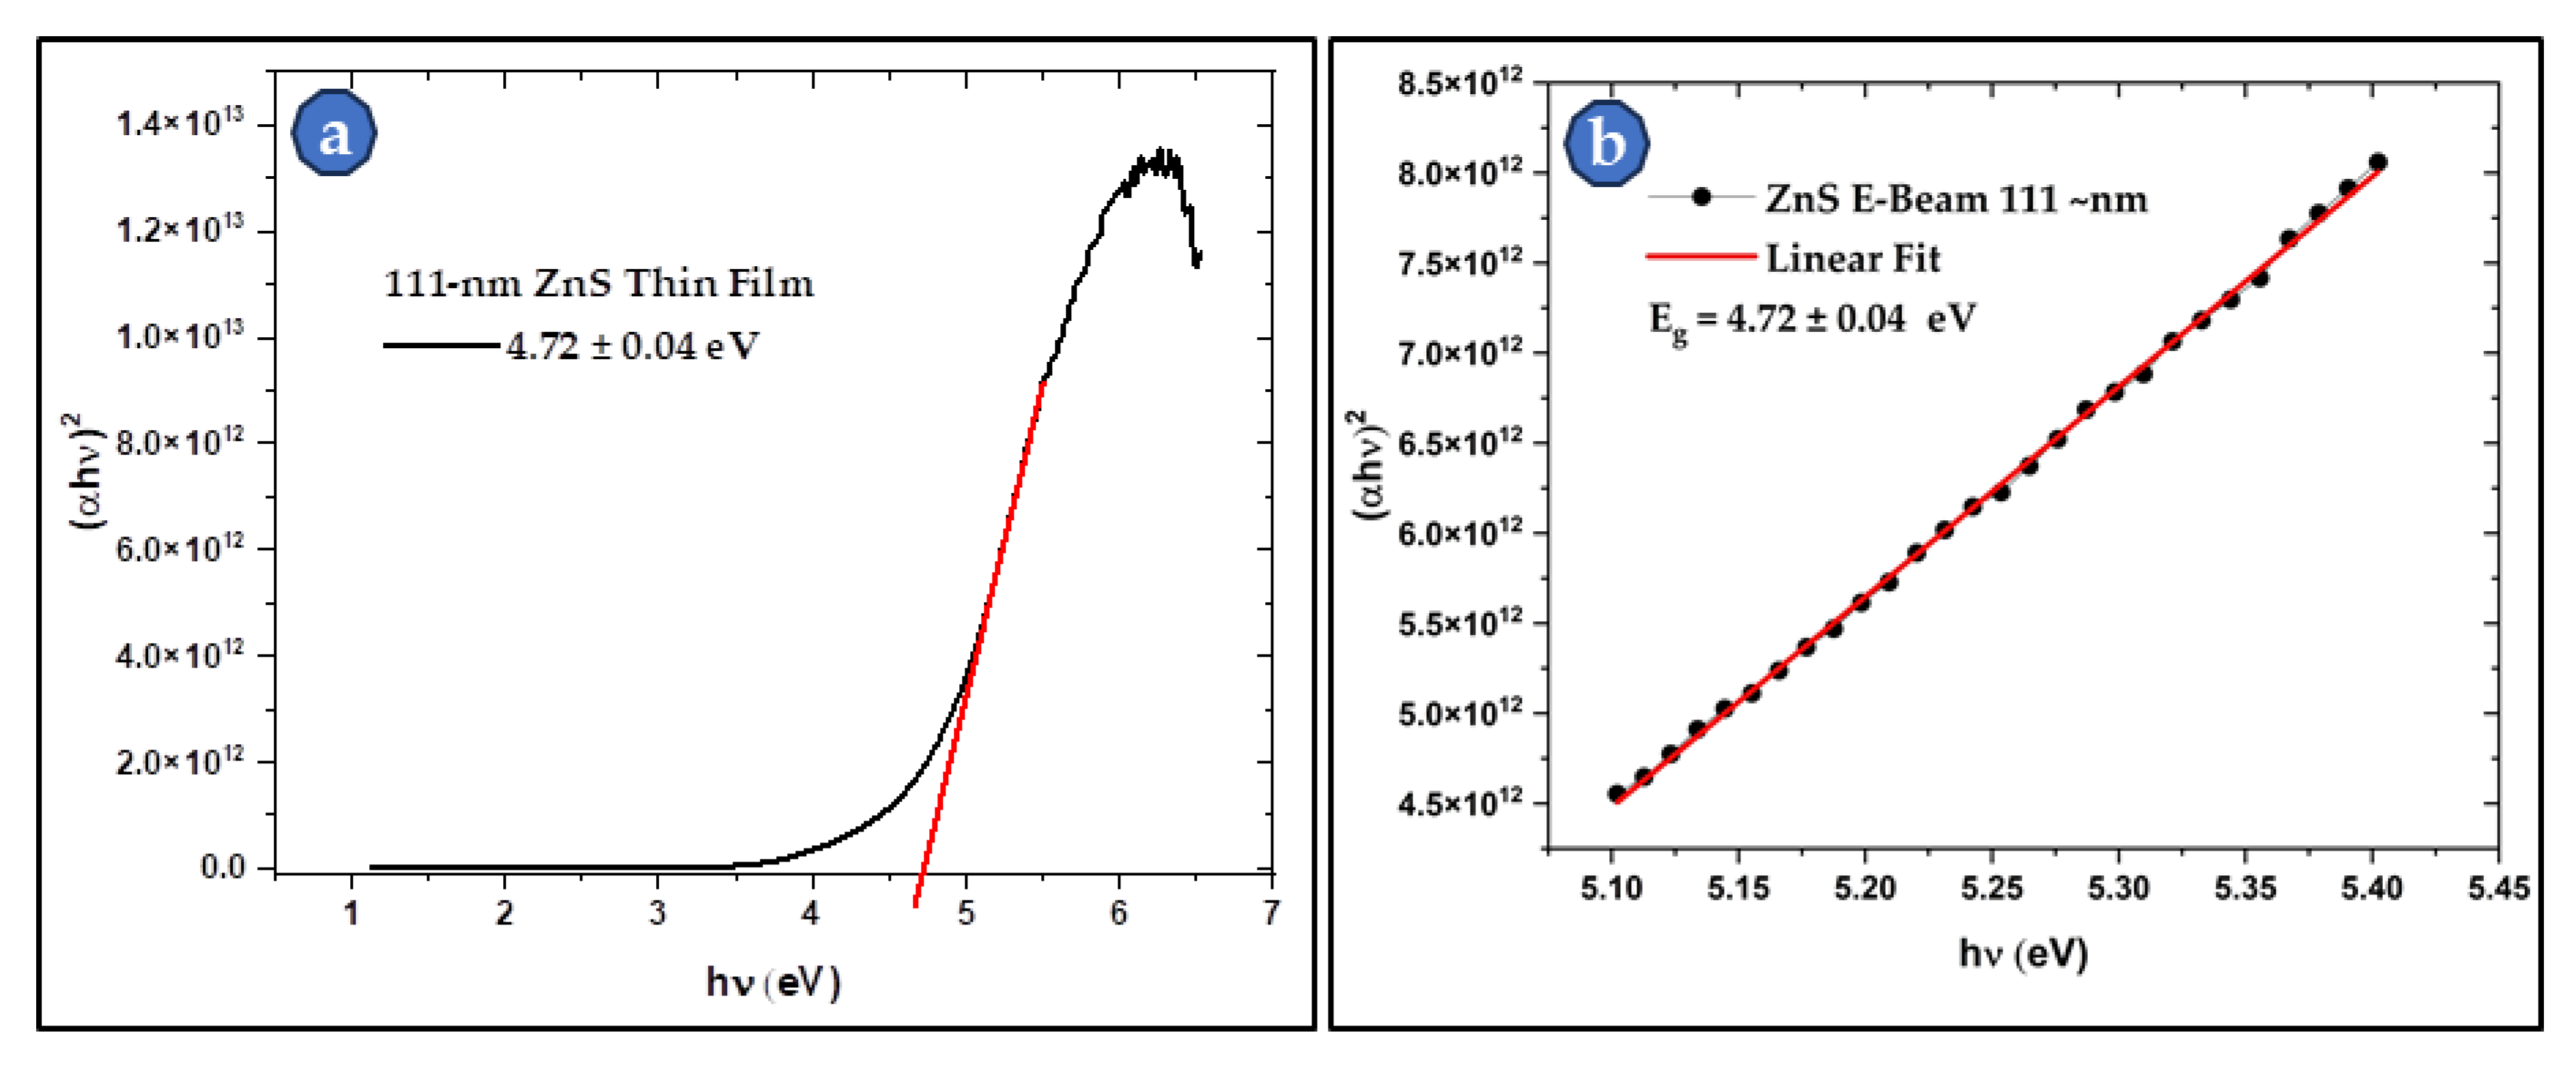
Figure 12.
FTIR profiles of synthesized ZnS powder and the two thicknesses of the E-beam evaporated thin films.
Figure 12.
FTIR profiles of synthesized ZnS powder and the two thicknesses of the E-beam evaporated thin films.
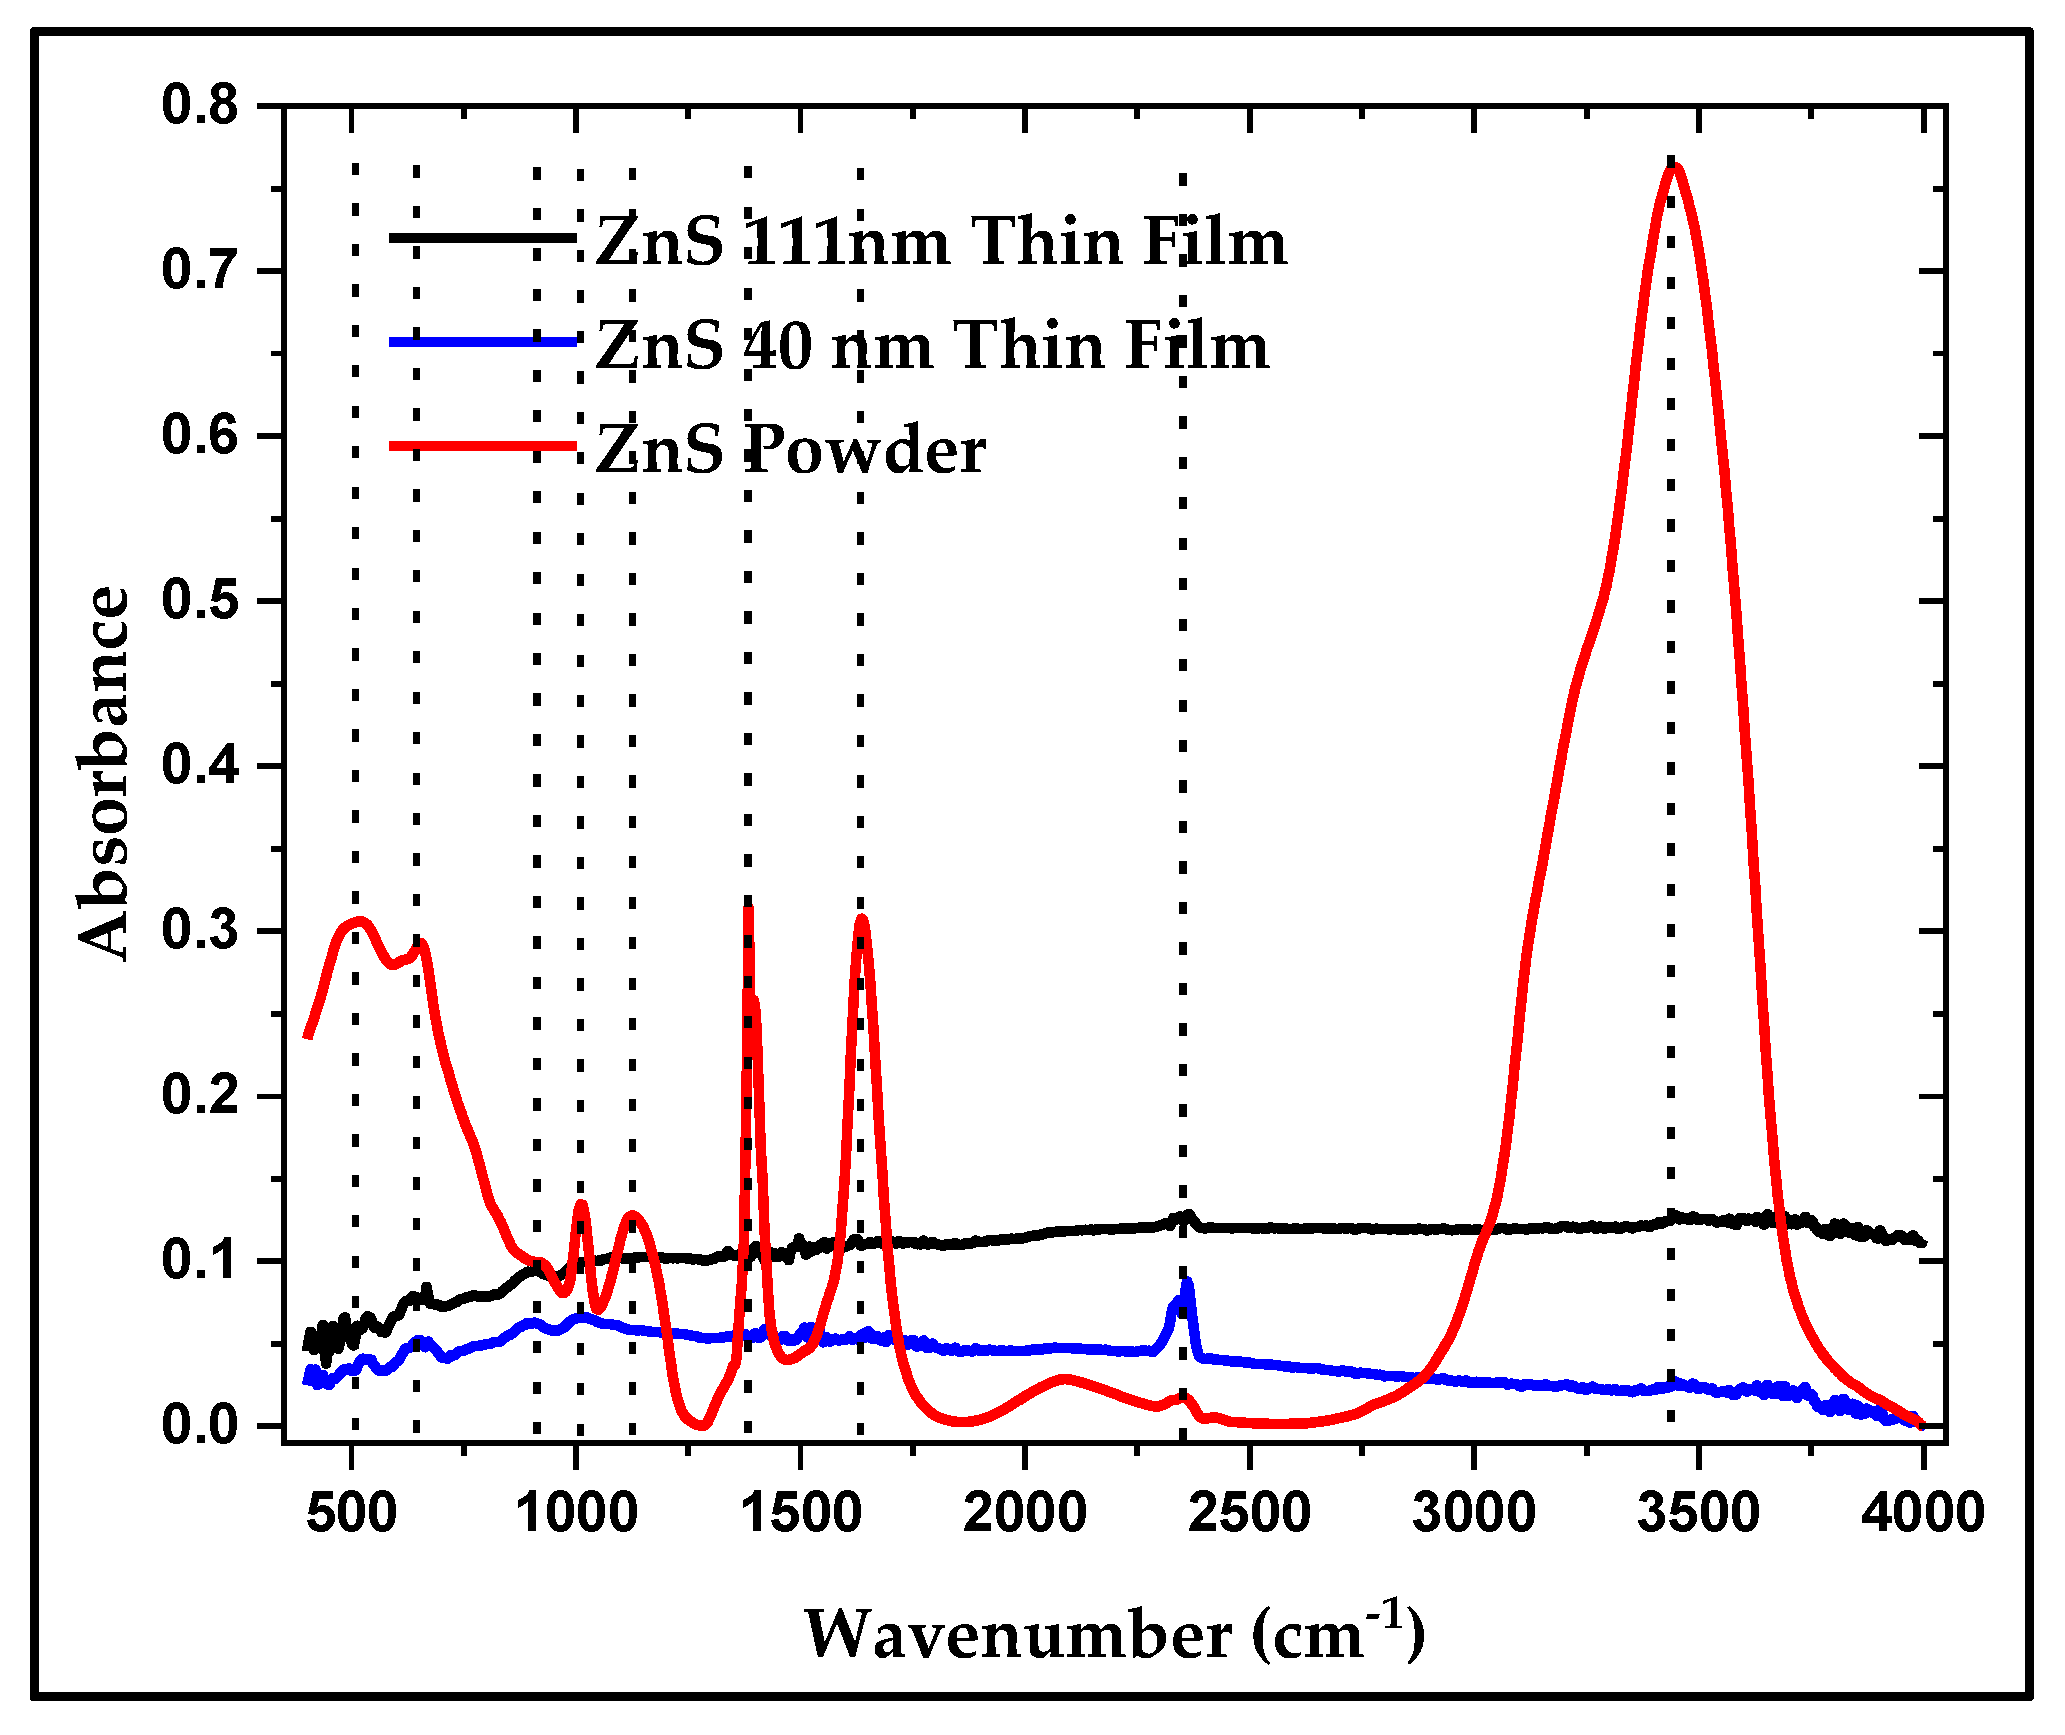

Table 1.
Green (ρg) and sintered (ρs.) densities of ZnS produced powder with compaction and sintering conditions.
Table 1.
Green (ρg) and sintered (ρs.) densities of ZnS produced powder with compaction and sintering conditions.
| Sample No. | ρg. (g/cm3) | ρs. (g/cm3) | Compaction and sintering conditions |
| 1 | 2.64 | 3.19 | Compaction pressure 400 MPa, sintering temp. 400 oC for 8h under an Argon atmosphere with a flow rate of approximately 1 L/min., heating rates of 5 oC/min., furnace cool. |
| 2 | 2.61 | 3.15 | |
| 3 | 2.69 | 3.32 | |
| 4 | 2.61 | 3.18 | |
| Mean Value | 2.64 | 3.21 |
Disclaimer/Publisher’s Note: The statements, opinions and data contained in all publications are solely those of the individual author(s) and contributor(s) and not of MDPI and/or the editor(s). MDPI and/or the editor(s) disclaim responsibility for any injury to people or property resulting from any ideas, methods, instructions or products referred to in the content. |
© 2025 by the authors. Licensee MDPI, Basel, Switzerland. This article is an open access article distributed under the terms and conditions of the Creative Commons Attribution (CC BY) license (http://creativecommons.org/licenses/by/4.0/).
Copyright: This open access article is published under a Creative Commons CC BY 4.0 license, which permit the free download, distribution, and reuse, provided that the author and preprint are cited in any reuse.


