Submitted:
05 March 2025
Posted:
05 March 2025
You are already at the latest version
Abstract
Oncomelania hupensis quadrasi is the intermediate host of S. japonicum, the causative species for schistosomiasis in the Philippines. The World Health Organization promotes snail control with molluscicides, physical removal, and environmental modification to eliminate this neglected tropical disease as a public health problem. Conventionally, risk areas are identified by a series of malacological surveys, microscopic testing, and stool collection to confirm transmission of the disease in humans. However, these procedures require highly skilled personnel and regularly conducting them for higher surveillance efficiency. Recent developments in disease diagnostics explore the utilization of environmental DNA as targets for polymerase chain reactions for disease surveillance. In this study, a low-cost, specific, and efficient SYBR Green-based real-time PCR assay to detect O. h. quadrasi DNA from water samples was developed, optimized, and validated. Primers were designed from a microsatellite region of O. h. quadrasi. Amplification is optimum at 5µM primer concentration with 63°C annealing temperature. The optimized PCR reaction condition is 95°C for 3 minutes of enzyme activation, and 40 cycles of template denaturation, annealing, and extension at 95°C for 30 seconds and 63°C for 25 seconds, respectively, followed by a melt curve analysis. The assay exhibited a detection limit of 1 copy number per microliter. The assay furthermore exhibited 99.4% efficiency, R2= 0.999, which specifically amplifies O .h. quadrasi DNA only. Validation of this assay in environmental water samples demonstrated 100% PPV and 100% NPV values, suggesting a potential tool for identifying risk areas, pathogen-directed surveillance, policy making, and disease control.
Keywords:
schistosomiasis
; oncomelania hupensis quadrasi
; environmental DNA
; Real-time PCR
Introduction
Schistosomiasis japonica remains a significant public health threat in the Philippines, causing morbidities in most endemic rural communities and usually affecting school-aged children, farmers, and fishermen. This parasitic infection is considered both a water-borne and a snail-borne zoonosis. Despite the national schistosomiasis prevalence in the Philippines of less than 1%, the variation remains very high, with some areas in Northern Samar reporting a 48% prevalence of the disease (Olveda et al., 2016, Fornillos et al., 2019). The presence of the snail intermediate host in water sources implies potential transmission of the disease to humans since the infective larval stage, called cercaria, develops inside the snail and is shed into the surrounding freshwater (Nelwan, 2019). In the Philippines, the pomatiopsid snail Oncomelania hupensis quadrasi serves as the intermediate host of Schistosoma japonicum. These snails can be found in both natural and man-made waterlogged and shady areas characterized by lush vegetation (Leonardo et al., 2020).
Effective monitoring and disease surveillance for schistosomiasis in the Philippines should be established alongside stringent control measures such as case detection, chemotherapy (mass drug administration and selective treatment), health education, environmental sanitation, and snail control to control the disease (Leonardo et al., 2016). Most monitoring strategies for estimating the progress of disease intervention are through prevalence surveys in both human and other animal reservoir hosts using various diagnostic techniques such as stool microscopy, stool concentration techniques, and serological tests (Wu et al., 2018). Searching and mapping of snail habitats are labor-intensive due to wide areas where snail sites are located and other factors such as highly varied landscapes. Aside from the problem of inaccessibility of snail sites, conducting a snail survey poses hazards such as treading on slippery slopes or getting stuck in muddy substrates that can be deep. In some sites, the snail population density has gone to very low levels making detection of snails extremely difficult (Zhang et al., 2024).
Advances in molecular biology have been recently explored in disease diagnostics, particularly the use of polymerase chain reaction (PCR). Guan et al. (2016) illustrated the effects of significant genetic variations among different geographic populations on the distribution of O. hupensis using multiplex PCR of eight screened polymorphic microsatellite DNA loci. Ever since the microsatellite DNAs were isolated from thousands of microorganisms including mollusks, the library of O. hupensis microsatellite DNA has been the basis for the development of molecular methods targeting the DNA of O. h. quadrasi in water where they could thrive or in monitoring areas which have been previously considered as free from the parasite. These microsatellite DNAs have served as important molecular markers since these are ubiquitous (occur throughout the eukaryotic genome) and have a high copy number. Developing a PCR-based detection assay for O. h. quadrasi in environmental samples like water provide results of high specificity and accuracy, hence a potential parameter to predict and identify snail habitats as well as schistosomiasis high-risk areas.
In developing a qPCR assay, two methods can be utilized: SYBR Green and Taqman probes. SYBR Green is relatively cost-effective and easy to use and technically based on binding the fluorescent dye to double-stranded deoxyribonucleic acid (dsDNA), whereas TaqMan method is relatively more expensive and is based on dual-labeled oligonucleotide and exonuclease activity of Taq polymerase enzyme (Hung & Remais, 2008, Tajadini et al., 2014).
Environmental DNA (eDNA) detection is a very useful tool for examining the biota present in a sample such as air, soil, and water for the detection of macroscopic and microscopic organisms (Ficetola et al., 2008; Minamoto et al., 2012, Hashizume et al., 2017, Thomsen & Willerslev, 2014). eDNA analysis provides the advantage of a fast and cost-effective survey on the presence of organisms of interest in an environmental sample. Environmental DNA analysis has been reported in many studies for the detection of pathogenic organisms. In the context of helminths, to date, detection of trematodes S. japonicum in China (Worrell et al., 2011) and O. viverrini in Lao PDR (Hashizume et al., 2017) from water samples has been successfully done. A study was done in the Philippines wherein field water samples from snail sites tested positive for both S. japonicum and O. h. quadrasi (Fornillos et al., 2019). Calata et al. (2019) also showed that aside from water samples, soil samples can be used for the detection of eDNA of O. h. quadrasi.
The use of eDNA from water samples is therefore a safer and more reliable alternative in field surveys for schistosomiasis. This can minimize the potential risk associated with exposure to cercariae-contaminated waters during malacological surveys. This study was done to develop and optimize a SYBR Green real-time PCR detection assay to detect the presence of O. h. quadrasi DNA in collected water samples. This would eliminate the need for probe design and synthesis hence, the cost-effectivity. With the development of a qPCR assay for eDNA detection from freshwater samples, effective monitoring of areas with significant transmission and near elimination status of the disease may be obtained, which sometimes cannot be addressed through conventional methods.
Methods
- Ethical considerations
The biosafety clearance for utilization of this protocol has been granted by the Research Institute for Tropical Medicine Biorisk Management Office (Muntinlupa City, Philippines). The gratuitous permit was acquired from the Bureau of Fisheries Region 2 (R02-0009-18). An Institutional Animal Care and Use Committee certification was deemed unnecessary because there were no live vertebrates used in the conduct of this study.
- Primer design
A18 microsatellite sequence (166 bp, accession number: GU204047.1), specific for O. h. quadrasi DNA served as the reference sequence to design the primers. Forward and reverse primers were then individually picked according to recommended optimal primer conditions. Primer-BLAST was used to initially check the specificity of the chosen primers for the target, considering the number of hits (organisms aligning to the target) and the percent identity of the hits or amplified targets. The chosen sequences were then sent out for sequencing (Integrated DNA Technologies, Inc., United States).
- PCR controls
Genomic DNA isolates from O. h. quadrasi snails were used as positive controls (104 DNA copy number), extracted artificial pond water (APW) on the other hand was the utilized negative control.
- Water samples from snail aquaria
The wastewater of snail aquaria in the Immunology Department of the RITM was collected. Three collections were done in each aquarium. For the negative control, artificial pond water was used. The water samples were then filtered.
- Water filtration and sample fixation
Water samples collected were filtered using a handheld portable pump (Nalgene, Thermo Fisher Scientific Inc., USA). Each water sample (500 mL) was filtered using 1 filter paper disc (GF/F, 0.7μm; Whatman, UK). Before filtration, an equipment blank was made by filtering 500 mL of distilled water in the filtration device. Then, a batch of samples was run subsequently. One equipment blank corresponded to a batch of samples processed. This step was done until all the samples were filtered. After filtration, fixation of the samples was done by adding 70% ethanol, just enough to submerge the filter paper. The ethanol-fixed filter papers were packed individually in an aluminum foil sheet, labeled, and then stored at -20°C until further processing (Fornillos et al., 2019).
- DNA extraction and quantification
Genomic DNA extraction was done using DNeasy® Blood & Tissue Kit (QIAGEN, Germany), with few modifications in the homogenization and lysis steps. The filter paper was cut into small pieces using sterilized scissors and then inserted into a clean 2.0 mL microcentrifuge tube. Five hundred microliters of Buffer AL and 50 µL of Proteinase K were then added into the tube. The mixture was vortexed until completely mixed. The tube was then incubated at 56°C for 30 minutes. After the incubation period, the rest of the extraction process was done following the manufacturer’s instructions. Extracted DNAs were quantified using DS-11 Series UV-Vis (DeNovix Inc., Wilmington, Delaware) spectrophotometer. The elution buffer of the extraction kit was used to blank the equipment. All quantification readings in ng/µl were noted. Only samples with positive quantification readings were used for downstream processing.
- Master mix preparation
Quantitative polymerase chain reaction (qPCR) was employed using CFX96 Touch Real-Time PCR Detection System (BioRad Laboratories, USA). PCR master mix was prepared using 10 µl SsoAdvanced™ Universal SYBR® Green Supermix PCR kit (BioRad Laboratories, USA), 1 µl of each forward and reverse primer, and 5 µL of nuclease-free water. Three microliters of the extracted DNA were individually added as a template to make up a 20 µL-volume reaction.
- Initial qPCR conditions
The initial cycling profile used was a 95°C activation step for 3 minutes followed by 40 cycles of denaturation, annealing, and extension steps, 95°C (30 sec), and 60°C (15 sec) respectively, followed by the instrument’s default melt curve setting. Annealing and extension times were adjusted accordingly to the thermal cycler used and the product length. These adjustments were made about the kit’s troubleshooting guide.
- Optimization of qPCR reaction conditions
Multiple parameters were considered and tested to obtain the optimal reaction conditions of the assay. These include primer concentration, primer annealing temperature, primer stability, assay specificity, assay limit of detection, and assay repeatability. Parameters were tested in triplicate using only positive controls and no template control. Corresponding Ct values, mean, and standard deviation were noted accordingly.
- Annealing temperature
The optimal annealing temperature was determined using a temperature gradient ranging from 56°C to 65 °C. Specific temperatures within the gradient were pre-determined by the CFX96 PCR thermocycler (56.0°C, 56.6°C, 57.8°C, 59.6°C, 61.7°C, 63.0°C, 64.5°C, 65.0°C). The optimal temperature was determined by the one that exhibited the lowest Ct value without non-specific amplifications and with the lowest standard deviation.
- Optimal primer concentrations
A primer concentration gradient from varying dilutions (10µM, 5µM, and 2µM) of the stock primers (100 µM) was done to determine the optimal primer concentration for the assay under development. The lowest working concentration, without non-specific amplifications and with the lowest standard deviation, was assigned as the optimal primer concentration (Zhao et al., 2021).
- Primer stability
After determining the optimal primer concentration, primer stability was tested by running one positive control against 20 no-template controls (NTC) using the optimized annealing temperature.
- Assay specificity, sensitivity, and efficiency
The optimized assay conditions were utilized on all downstream processes to further evaluate the assay’s laboratory performance: specificity to its target DNA, detection sensitivity, as well as its efficiency.
- Assay specificity
Aside from a previously performed BLAST (https://blast.ncbi.nlm.nih.gov/Blast.cgi) search, laboratory specificity of the assay was also determined. This was done by evaluating the ability of the assay to distinguish among positive and negative samples. Moreover, DNA extracts from other snails that might co-habit O. h. quadrasi were used as negative controls. The snail used were: Jagora asperata, Vivipara zamboagensis surigensis, Radix quadrasi, and Pomacea canaliculata. All samples were run in triplicates.
- Assay sensitivity
The sensitivity of the assay was determined by its limit of detection (LOD). A serial dilution (10⁶, 105,10⁴, 103, 102, 101, 100, 10-1, and 10-2 copies/µL) of the positive control of a known DNA copy number was tested in eight replicates each. The lowest dilution with a detection rate of 8/8 is determined as the limit of detection.
- Assay efficiency
A standard curve using dilutions of the positive control was established to determine assay efficiency. The dilutions were based on the LOD determined and were used as templates. One PCR reaction mix for each template dilution was prepared and tested using the optimized thermocycling conditions. PCR characteristics such as percent efficiency, correlation coefficient (R2), and the slope of the linear regression line were also obtained from the standard curve.
- Assay validation using environmental samples
The diagnostic specificity and sensitivity of the optimized assay were validated using thirty O. h. quadrasi-infected water samples collected from laboratory-maintained snail aquaria of the Immunology department of RITM as positive samples. On the other hand, thirty O. h. quadrasi negative samples were collected from freshwater bodies along known non-endemic areas in Muntinlupa and Los Baños, Laguna. DNA Extraction and PCR methods were employed as described above.
- Assay diagnostic performance
Positive Predictive Value (PPV) and Negative Predictive Value (NPV) were calculated to validate the assay’s diagnostic performance. PPV was calculated as the proportion of the true positives correctly detected as positive by the method under evaluation, while NPV was calculated as the proportion of true negatives correctly detected as negative by the assay under validation.
Results and Discussion
Schistosomiasis continues to pose a major public health burden in the Philippines. Part of this problem could be attributed to the zoonotic nature of the disease and the prevalence of the parasite’s unique intermediate host, Oncomelania hupensis quadrasi (Madsen et al., 2007; Lv et al., 2023). To control the intermediate host means to disrupt the life cycle of S. japonicum, thus impeding the parasite’s survival. The main objective of this study is to develop, optimize, and validate a real-time PCR detection assay for O. h. quadrasi eDNA in water samples.
- Primers
Primers were designed in reference to an A18 microsatellite sequence (166 bp, accession number: GU204047.1). Primer-BLAST results showed a specificity of the primers to only 1 hit with 100% identity to an 184bp product length for Oncomelaniaquadrasi (accession number: LC276227.1). Forward and reverse primer sequences are presented in Table 1.
Primer design and its optimization are some of the most critical steps in attaining a successful PCR assay. Several criteria described in the literature (Hyndman & Mitsuhash, 2003) such as the length (bp), primer melting temperature (Tm), and the %GC content were considered in designing and choosing the appropriate primer sequence to be synthesized and utilized.
The forward primer is 20 bp in length, while the reverse primer is 21. The ideal primer length is 18-24 bp to maximize primer-template hybridization at a highly specific manner. When primers are designed longer than the ideal, slower hybridization may happen. Slower hybridization poses inadequate specificity and efficiency resulting from inadequate binding to the target sequence (Rodríguez et al., 2015, Raymaekers et al., 2009). Shorter primers, however, produce inaccurate, nonspecific DNA amplification (Wu et al., 2010).
Melting temperature is described as the temperature wherein the DNA duplex is denatured into single strands. The primers for this assay have an almost similar Tm at 60.18°C (forward) and 59.79°C (reverse) to efficiently amplify a DNA sequence by molecularly binding in sync.
The oligonucleotides designed have a %GC content of 55% and 52% for the forward and reverse primers, respectively. Stable binding of primer to template is mostly achieved when primers contain 40-60% GC. GC bonds contribute more to the stability (increased melting temperatures) of primer/template binding than that of the AT bonds. Higher GC content however can cause mismatches and the formation of primer-dimers (Kumar & Kaur, 2014; Piovesan et al., 2019), effecting low assay specificity.
- Optimization of qPCR reaction conditions
The assay development started with optimizing the primer annealing temperature (Table 2) and working concentrations (Table 3). Optimized conditions were determined by identifying the set-up with the lowest Ct value, with no contamination in all replicates, and with the lowest standard deviation values (Zhao et al., 2021).
The optimal annealing temperature (Ta) of this assay is 63°C (Table 2). This was determined through a temperature gradient in the PCR cycling condition. The lowest Ta utilized was 56°C, while the highest is 65°C. As a general rule, the annealing temperature should be started at 3–5°C lower than the lowest Tm of the primers. The PCR kit used initially suggested an annealing temperature of 60°C; however, during the optimization process, a more specific amplification was exhibited at 63°C. A higher temperature improves the specificity since it boosts the discrimination against incorrectly annealed primers and increases the stringency of primer annealing. Furthermore, it minimizes the mis-incorporation of incorrect nucleotides at the 3’ end of primers (DNA Amplification | Thermal Cycling Parameters & Optimization | National Institute of Justice, n.d.). Increasing the annealing temperature however would result in a relatively lower yield, thus annealing time is increased from 15 seconds to 30 seconds.
Consequently, a concentration gradient was employed to determine the optimal primer concentration of the assay. From a 100 µM stock primer concentration, dilutions were made (10 µM, 5 µM and 2 µM). Considering the Ct values, their mean, and standard deviation, a primer concentration of 5 µM (Mean Ct= 19.68, SD= 0.130) is optimal. All tests showed no amplification to the no template control, validating the accuracy and correctness of the PCR process.
Primer stability was tested to demonstrate that there is no primer dimer formation in large amounts of master mix preparation. One O. h. quadrasi DNA was run against 20 with no template control (Figure 1). Results showed only amplification of the O. h. quadrasi DNA (Ct= 22.57) and no amplification on all the no template controls, hence a stable primer set.
After establishing the optimal PCR conditions, the assay’s laboratory performance was further validated in terms of specificity, sensitivity, and efficiency. The assay’s analytical specificity pertains to its ability to identify a negative result from samples without the target analyte (Bolin & Lam, 2013). The developed qPCR assay specifically detects O. h. quadrasi DNA from an extracted O. h. quadrasi snail (positive control) and snail aquaria wastewater.
- Assay specificity
The specificity of the assay was determined by initially running extracted water samples from the snail aquaria. Artificial pond water was used as a negative control. The amplification curve (Figure 2) shows that only the positive control (Ct= 19.67) and the water from the snail aquaria (Ct= 32.02) tested positive for the assay. Both the negative control and the no template control showed no amplification, hence a valid run.
The assay was also used in distinguishing the O. h. quadrasi DNA from other snails that might co-inhabit with them in the natural environment (Table 4). The O. h. quadrasi DNA was run with the DNAs of J. asperata, V. z. surigensis, R. quadrasi, and P. canaliculata, and amplification was only observed in the O. h. quadrasi DNA (3 out of 3). Non amplification of non-Oncomelania snails and artificial pond water with no snails present further validates assay specificity.
- Assay limit of detection (LOD)
The sensitivity of the assay is defined by its ability to detect a positive result from a sample that has the target analyte (Bolin & Lam, 2013). This was demonstrated by determining its limit of detection (LOD). A lower limit of detection indicates a more sensitive assay (Xia et al., 2018). For qPCR, the limit of detection can indicate the minimum concentration of nucleic acid that can be detected. The assay can detect up to 1 copy number per microliter. The qPCR results should always yield a positive result when the samples are, at least, at this concentration (Kralik & Ricchi, 2017). Dilutions of the positive control were used as templates and were replicated 8 times. Table 5 shows the limit of detection as the lowest dilution with 8/8 (100%) amplification. The assay LOD is determined as 100 copies/ µL or 1 DNA copy number.
Establishing a PCR standard curve demonstrates the efficiency of the assay. The PCR standard curve plots the threshold cycle (Ct) values against the logarithm of known input amounts of a standard material to quantify the amount of target nucleic acid present in the sample (Bustin, 2004). The assay obtained a standard curve slope of -3.336 with a 99.4% efficiency and a coefficient of correlation (R2) of 0.999 (Figure 3).
Generally, a slope of –3.322 means that the PCR has an efficiency of 1, or 100%, and the amount of PCR product doubles during each cycle. A slope of less than –3.322, as observed in this assay indicates a PCR efficiency less than 1. Generally, most amplification reactions do not reach 100% efficiency due to experimental limitations. A slope greater than –3.322, on the other hand, indicates a PCR efficiency that appears to be greater than 100%. This indicates the presence of inhibitors in the reaction. The R2 value generally demonstrates that a specific value fits an observed trend (Navidshad & Jahromi, 2012), which can further imply the efficiency of the assay regardless of the amount of target analyte present in the sample.
- Assay verification using environmental waters
The verification of the assay’s diagnostic performance was done by using environmental waters from snail aquaria (positive samples) and water from non-endemic areas (O. h. quadrasi are not found; negative samples). Thirty positive water samples from O. h. quadrasi snail aquaria and thirty negative water samples from freshwater bodies from non-endemic areas were used to evaluate diagnostic performance. The extracted water samples used in the validation process were initially quantified using DeNovix spectrophotometer. This would validate successful DNA extraction from the water samples. Only those with positive spectrophotometric readings were used as PCR templates. A negative extraction control (NEC) was also included to detect possible contamination in the extraction process. No amplifications were observed in the NTC and NEC validates the PCR run.
Table 6 illustrates the diagnostic accuracy of the assay in detecting true positives as positive, and true negatives as negative. A 100% PPV and 100% NPV value and the acceptable PPV and NPV values at a 95% confidence interval were demonstrated by the assay (Table 7).
To further validate the correctness of the detection in environmental water samples in a SYBR Green detection platform, a melt curve analysis was employed. The similarity in the melt peak implies the similarity of the amplified target. Figure 4 shows a uniform 82.5°C melt peak for all samples, demonstrating specificity and accuracy in the detection of the target in the water samples.
Conclusion
These findings further verify the assay’s capability to be a diagnostic tool in detecting the presence of Oncomelania hupensis quadrasi snails in a body of water, which in return would suggest possible Schistosoma japonicum infection. It is then recommended that the assay is further validated using a larger sample size from S. japonicum endemic areas. With the development of this qPCR assay for eDNA detection from freshwater samples, and by improving and further validating its detection capabilities, effective monitoring of areas with significant transmission of the disease can be achieved. Furthermore, near elimination status of the disease, if not full eradication, may be obtained. In summary, the utilization of this qPCR assay will play a vital role in identifying risk areas, pathogen-directed surveillance, policy making, and disease control.
References
- Bolin, E., & Lam, W. (2013). A review of sensitivity, specificity, and likelihood ratios: evaluating the utility of the electrocardiogram as a screening tool in hypertrophic cardiomyopathy. Congenital heart disease, 8(5), 406–410. [CrossRef]
- Bustin, S.A., ed. (2004) A-Z of Quantitative PCR. La Jolla, CA: International University Line.
- Calata, F. I. C., Caranguian, C. Z., Mendoza, J. E. M., Fornillos, R. J. C., Tabios, I. K. B., Fontanilla, I. K. C., Leonardo, L. R., Sunico, L. S., Kawai, S., Chigusa, Y., Kikuchi, M., Sato, M., Minamoto, T., Baoanan, Z. G., & Sato, M. O. (2019). Analysis of Environmental DNA and Edaphic Factors for the Detection of the Snail Intermediate Host Oncomelania hupensis quadrasi. Pathogens, 8(4), 160. [CrossRef]
- DNA Amplification Thermal Cycling Parameters & Optimization National Institute of Justice. (n.d.). National Institute of Justice. http://nij.ojp.gov/nij-hosted-online-training-courses/dna-amplification/overview/thermal-cycling-parameters-optimization.
- Ficetola, G. F., Poulenard, J., Sabatier, P., Messager, E., Gielly, L., Leloup, A., Etienne, D., Bakke, J., Malet, E., Fanget, B., Støren, E., Reyss, J., Taberlet, P., & Arnaud, F. (2018). DNA from lake sediments reveals long-term ecosystem changes after a biological invasion. Science Advances, 4(5). [CrossRef]
- Fornillos, R. J. C., Sato, M. O., Tabios, I. K. B., Sato, M., Leonardo, L. R., Chigusa, Y., Minamoto, T., Kikuchi, M., Legaspi, E. R., & Fontanilla, I. K. C. (2019). Detection of Schistosoma japonicum and Oncomelania hupensis quadrasi environmental DNA and its potential utility to schistosomiasis japonica surveillance in the Philippines. PLoS ONE, 14(11), e0224617. [CrossRef]
- Guan, W., Li, S., Abe, E. M., Webster, B. L., Rollinson, D., & Zhou, X. (2016). The genetic diversity and geographical separation study of Oncomelania hupensis populations in mainland China using microsatellite loci. Parasites & Vectors, 9(1). [CrossRef]
- Hashizume, H., Sato, M., Sato, M. O., Ikeda, S., Yoonuan, T., Sanguankiat, S., Pongvongsa, T., Moji, K., & Minamoto, T. (2017b). Application of environmental DNA analysis for the detection of Opisthorchis viverrini DNA in water samples. Acta Tropica, 169, 1–7. [CrossRef]
- Hung, Y. W., & Remais, J. (2008). Quantitative Detection of Schistosoma japonicum Cercariae in Water by Real-Time PCR. PLoS Neglected Tropical Diseases, 2(11), e337. [CrossRef]
- Hyndman DL, & Mitsuhashi M. (2003). PCR primer design. Methods Mol Biol;226:81–88.
- Kumar, A., & Kaur, J. (2014) Primer Based Approach for PCR Amplification of High GC Content Gene: Mycobacterium Gene as a Model. Molecular biology international 937308.
- Kralik, P., & Ricchi, M. (2017). A basic guide to real time PCR in microbial diagnostics: definitions, parameters, and everything. Frontiers in Microbiology, 8. [CrossRef]
- Leonardo, L., Chigusa, Y., Kikuchi, M., Kato-Hayashi, N., Kawazu, S.-I., Angeles, J., Fontanilla, I., Tabios, I., Moendeg, K., Goto, Y., Fornillos, R., Tamayo, G., Chua, J., & Manila, P. (2016). Review schistosomiasis in the Philippines: challenges and some successes in control. Schistosomiasis in the Philippines, 47(4). https://www.tm.mahidol.ac.th/seameo/2016-47-4/11-CPH1413p651.pdf.
- Leonardo, L., Varona, G., Fornillos, R. J., Manalo, D., Tabios, I. K., Moendeg, K., De Cadiz, A., Kikuchi, M., Chigusa, Y., Mistica, M., Hernandez, L., Palasi, W., & Fontanilla, I. K. (2020). Oncomelania hupensis quadrasi: Snail intermediate host of Schistosoma japonicum in the Philippines. Acta Tropica, 210, 105547. [CrossRef]
- Lv, C., Li, Y., Deng, W., Bao, Z., Xu, J., Lv, S., Li, S., & Zhou, X. (2023). The Current Distribution of Oncomelania hupensis Snails in the People’s Republic of China Based on a Nationwide Survey. Tropical Medicine and Infectious Disease, 8(2), 120. [CrossRef]
- Madsen, H., Carabin, H., Balolong, D., Tallo, V. L., Olveda, R., Yuan, M., & McGarvey, S. T. (2007). Prevalence of Schistosoma japonicum infection of Oncomelania quadrasi snail colonies in 50 irrigated and rain-fed villages of Samar Province, the Philippines. Acta Tropica, 105(3), 235–241. [CrossRef]
- Minamoto, T., Yamanaka, H., Takahara, T., Honjo, M. N., & Kawabata, Z. (2011b). Surveillance of fish species composition using environmental DNA. Limnology, 13(2), 193–197. [CrossRef]
- Navidshad, B., Liang, J. B., & Jahromi, M. F. (2012). Correlation coefficients between different methods of expressing bacterial quantification using real time PCR. International journal of molecular sciences, 13(2), 2119–2132. [CrossRef]
- Nelwan, M. L. (2019). Schistosomiasis: life cycle, diagnosis, and control. Current Therapeutic Research, 91, 5–9. [CrossRef]
- Olveda, R. M., Tallo, V., Olveda, D. U., Inobaya, M. T., Chau, T. N., & Ross, A. G. (2016). National survey data for zoonotic schistosomiasis in the Philippines grossly underestimates the true burden of disease within endemic zones: implications for future control. International Journal of Infectious Diseases, 45, 13–17. [CrossRef]
- PCR Cycling Parameters—Six Key Considerations for Success Thermo Fisher Scientific - IE. (n.d.). https://www.thermofisher.com/ph/en/home/life-science/cloning/cloning-learning-center/invitrogen-school-of-molecular-biology/pcr-education/pcr-reagents-enzymes/pcr-cycling-considerations.html.
- Piovesan, A., Pelleri, M. C., Antonaros, F., Strippoli, P., Caracausi, M., & Vitale, L. (2019) On the length, weight and GC content of the human genome. BMC Research Notes, 12(1).
- Raymaekers, M., Smets, R., Maes, B., & Cartuyvels, R. (2009). Checklist for optimization and validation of real-time PCR assays. Journal of Clinical Laboratory Analysis, 23(3), 145–151. [CrossRef]
- Rodríguez, A., Rodríguez, M., Córdoba, J. J., & Andrade, M. J. (2015) Design of primers and probes for quantitative real-time PCR methods. Methods in molecular biology (Clifton, N.J.) 1275, 31–56.
- Schoonjans, F. (2023, October 9). MedCalc’s Diagnostic test evaluation calculator. MedCalc. https://www.medcalc.org/calc/diagnostic_test.php.
- Tajadini, M., Panjehpour, M., & Javanmard, S. (2014). Comparison of SYBR Green and TaqMan methods in quantitative real-time polymerase chain reaction analysis of four adenosine receptor subtypes. Advanced Biomedical Research, 3(1), 85. [CrossRef]
- Thomsen, P. F., & Willerslev, E. (2015). Environmental DNA – An emerging tool in conservation for monitoring past and present biodiversity. Biological Conservation, 183, 4–18. [CrossRef]
- Worrell, C., Xiao, N., Vidal, J. E., Chen, L., Zhong, B., & Remais, J. (2011). Field Detection of Schistosoma japonicum Cercariae in Environmental Water Samples by Quantitative PCR. Applied and Environmental Microbiology, 77(6), 2192–2195. [CrossRef]
- Wu, Y., Liu, J., Lin, Y., Weng, R., Chen, R., Li, J., & Lv, Z. (2018). Diagnosis, Monitoring, and Control of Schistosomiasis—An update. Journal of Biomedical Nanotechnology, 14(3), 430–455. [CrossRef]
- Wu, J. Y., Jiang, X. T., Jiang, Y. X., Lu, S. Y., Zou, F., & Zhou, H. W. (2010) Effects of polymerase, template dilution and cycle number on PCR based 16 S rRNA diversity analysis using the deep sequencing method. BMC microbiology, 10. 255.
- Xia, Z., Johansson, M. L., Gao, Y., Zhang, L., Haffner, G. D., MacIsaac, H. J., & Zhan, A. (2018). Conventional versus real-time quantitative PCR for rare species detection. Ecology and Evolution, 8(23), 11799–11807. [CrossRef]
- Zhang, X., Lv, Z., Dai, J., Ke, Y., Chen, X., & Hu, Y. (2024). Precision mapping of snail habitat in lake and marshland areas: integrating environmental and textural indicators using Random Forest modeling. Heliyon, 10(16), e36300. [CrossRef]
- Zhao, F., Maren, N.A., Kosentka, P.Z. et al. An optimized protocol for stepwise optimization of real-time RT-PCR analysis. Hortic Res 8, 179 (2021). [CrossRef]
Figure 1.
Amplification curve of A18 primers on O. h. quadrasi DNA against 20 no template controls. (PC = positive control).
Figure 1.
Amplification curve of A18 primers on O. h. quadrasi DNA against 20 no template controls. (PC = positive control).
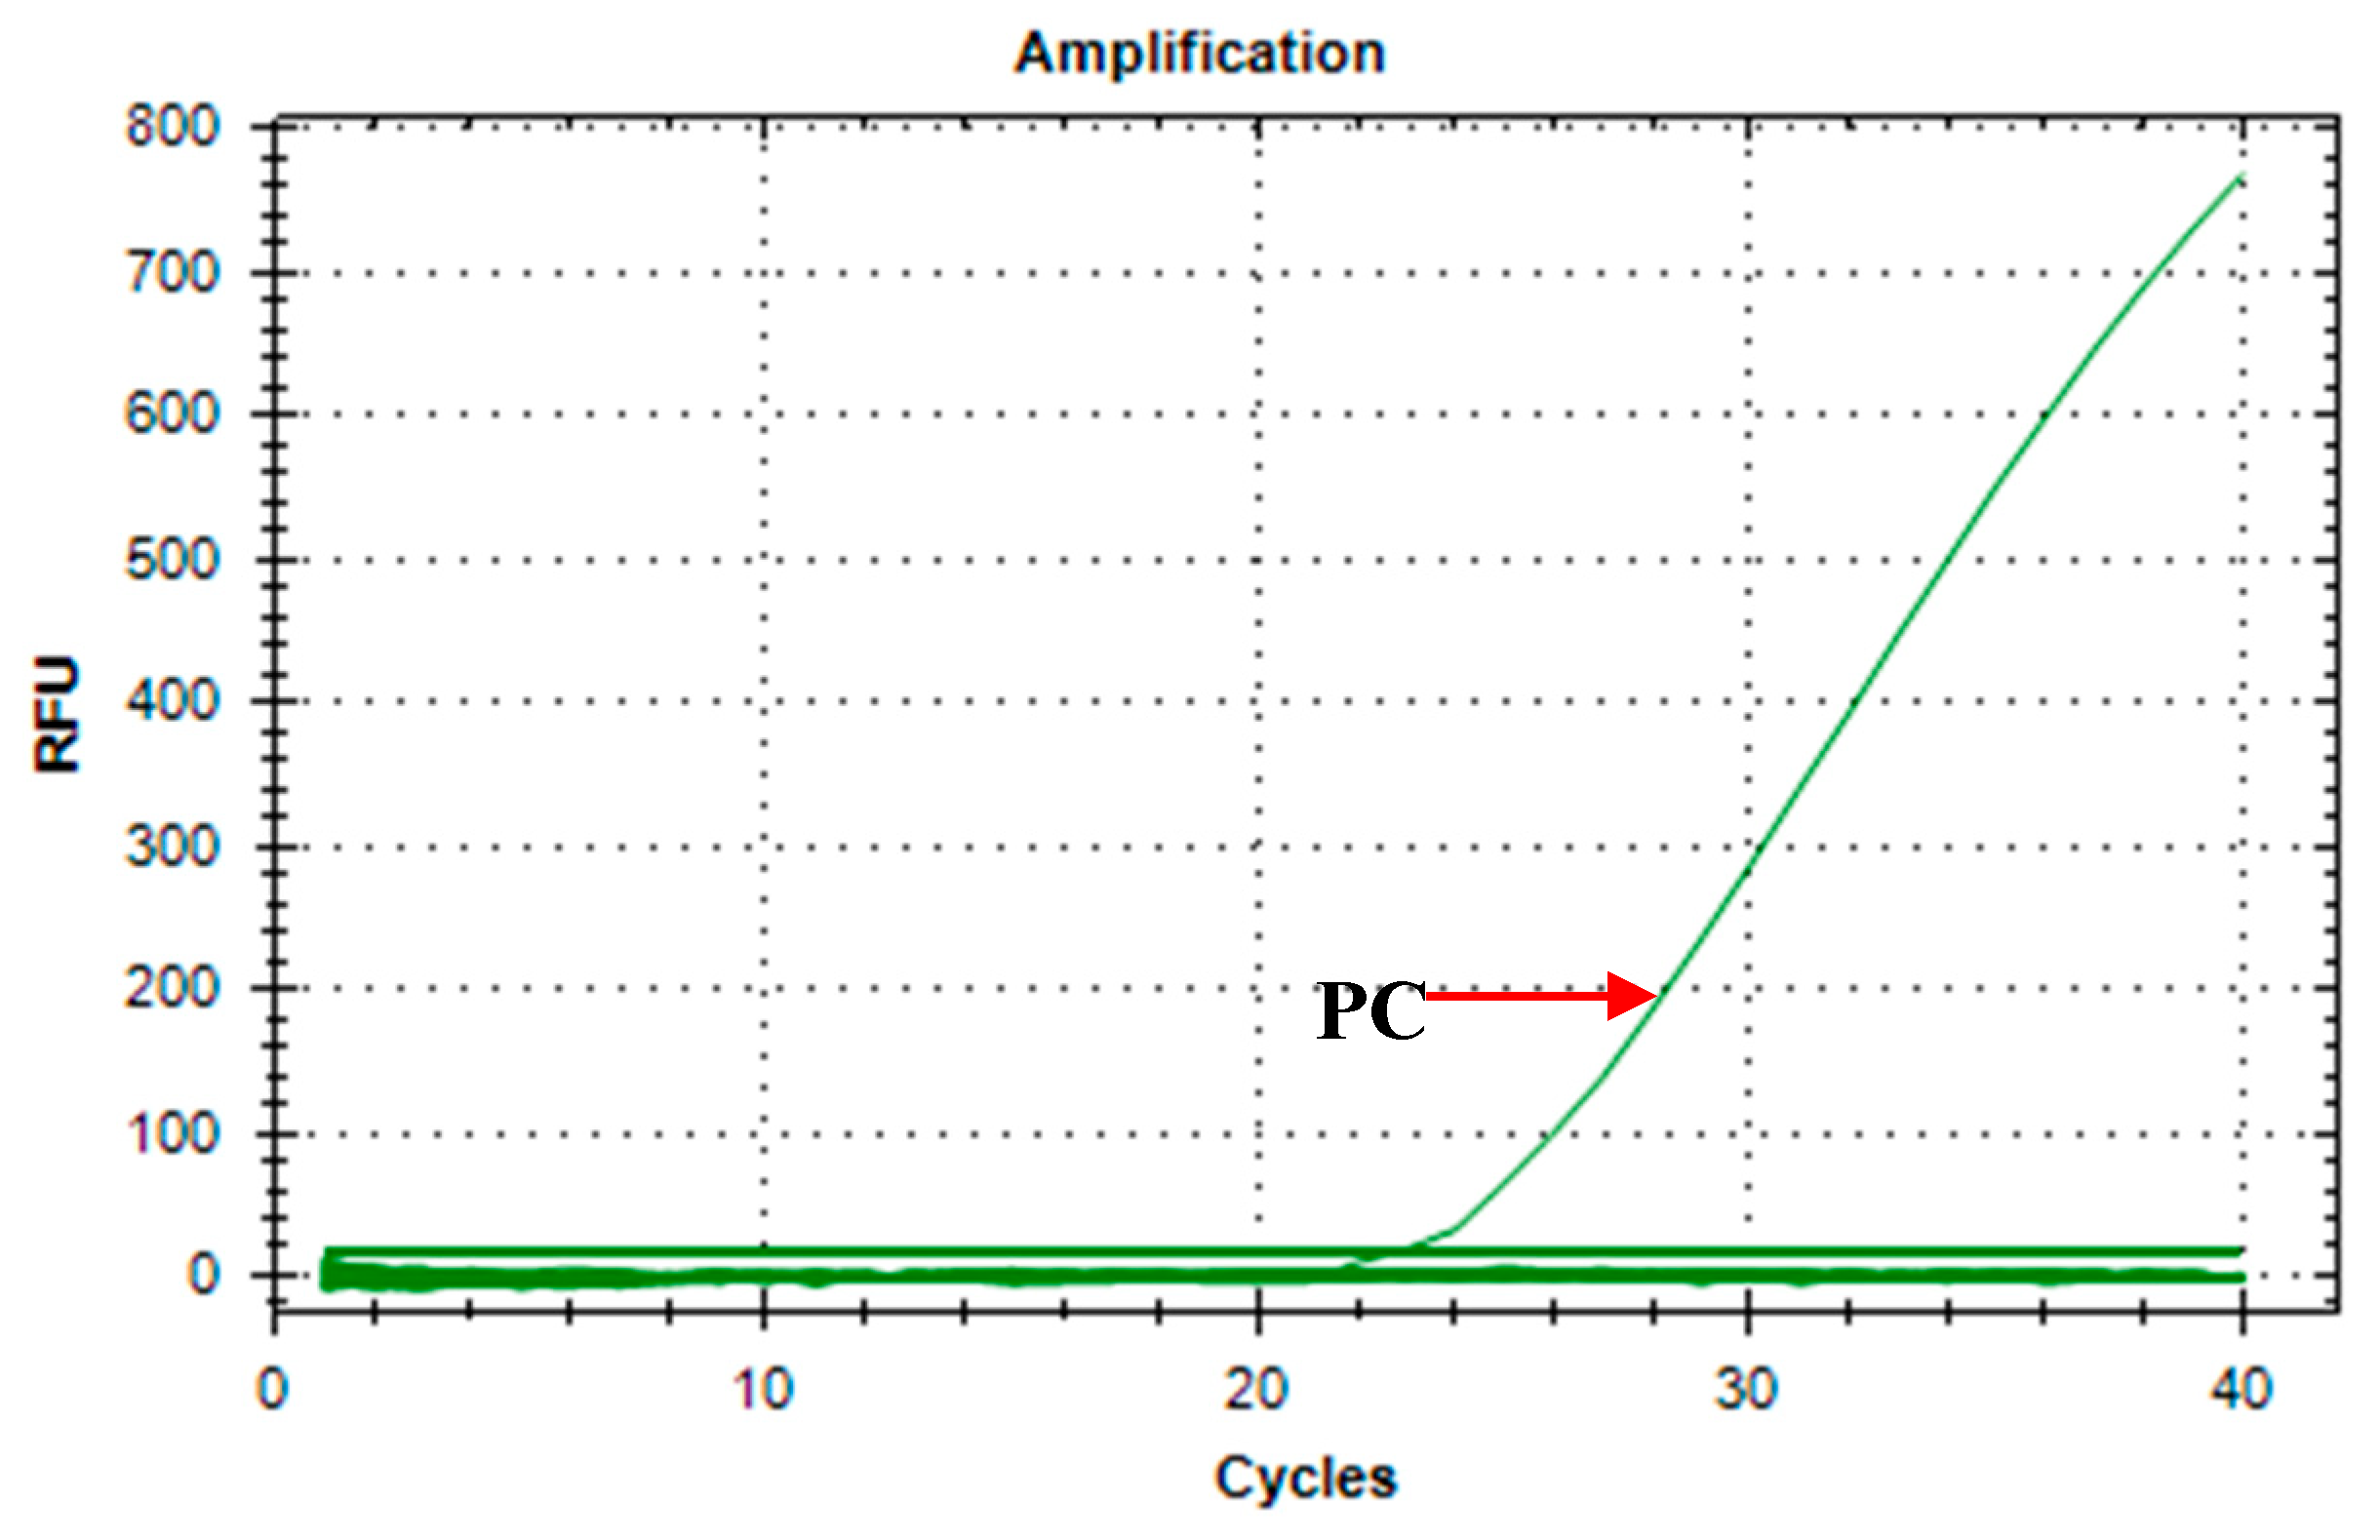
Figure 2.
Amplification curve of A18 primers on O. h. quadrasi DNA and snail water. (PC = positive control; Snail water = water from aquaria).
Figure 2.
Amplification curve of A18 primers on O. h. quadrasi DNA and snail water. (PC = positive control; Snail water = water from aquaria).
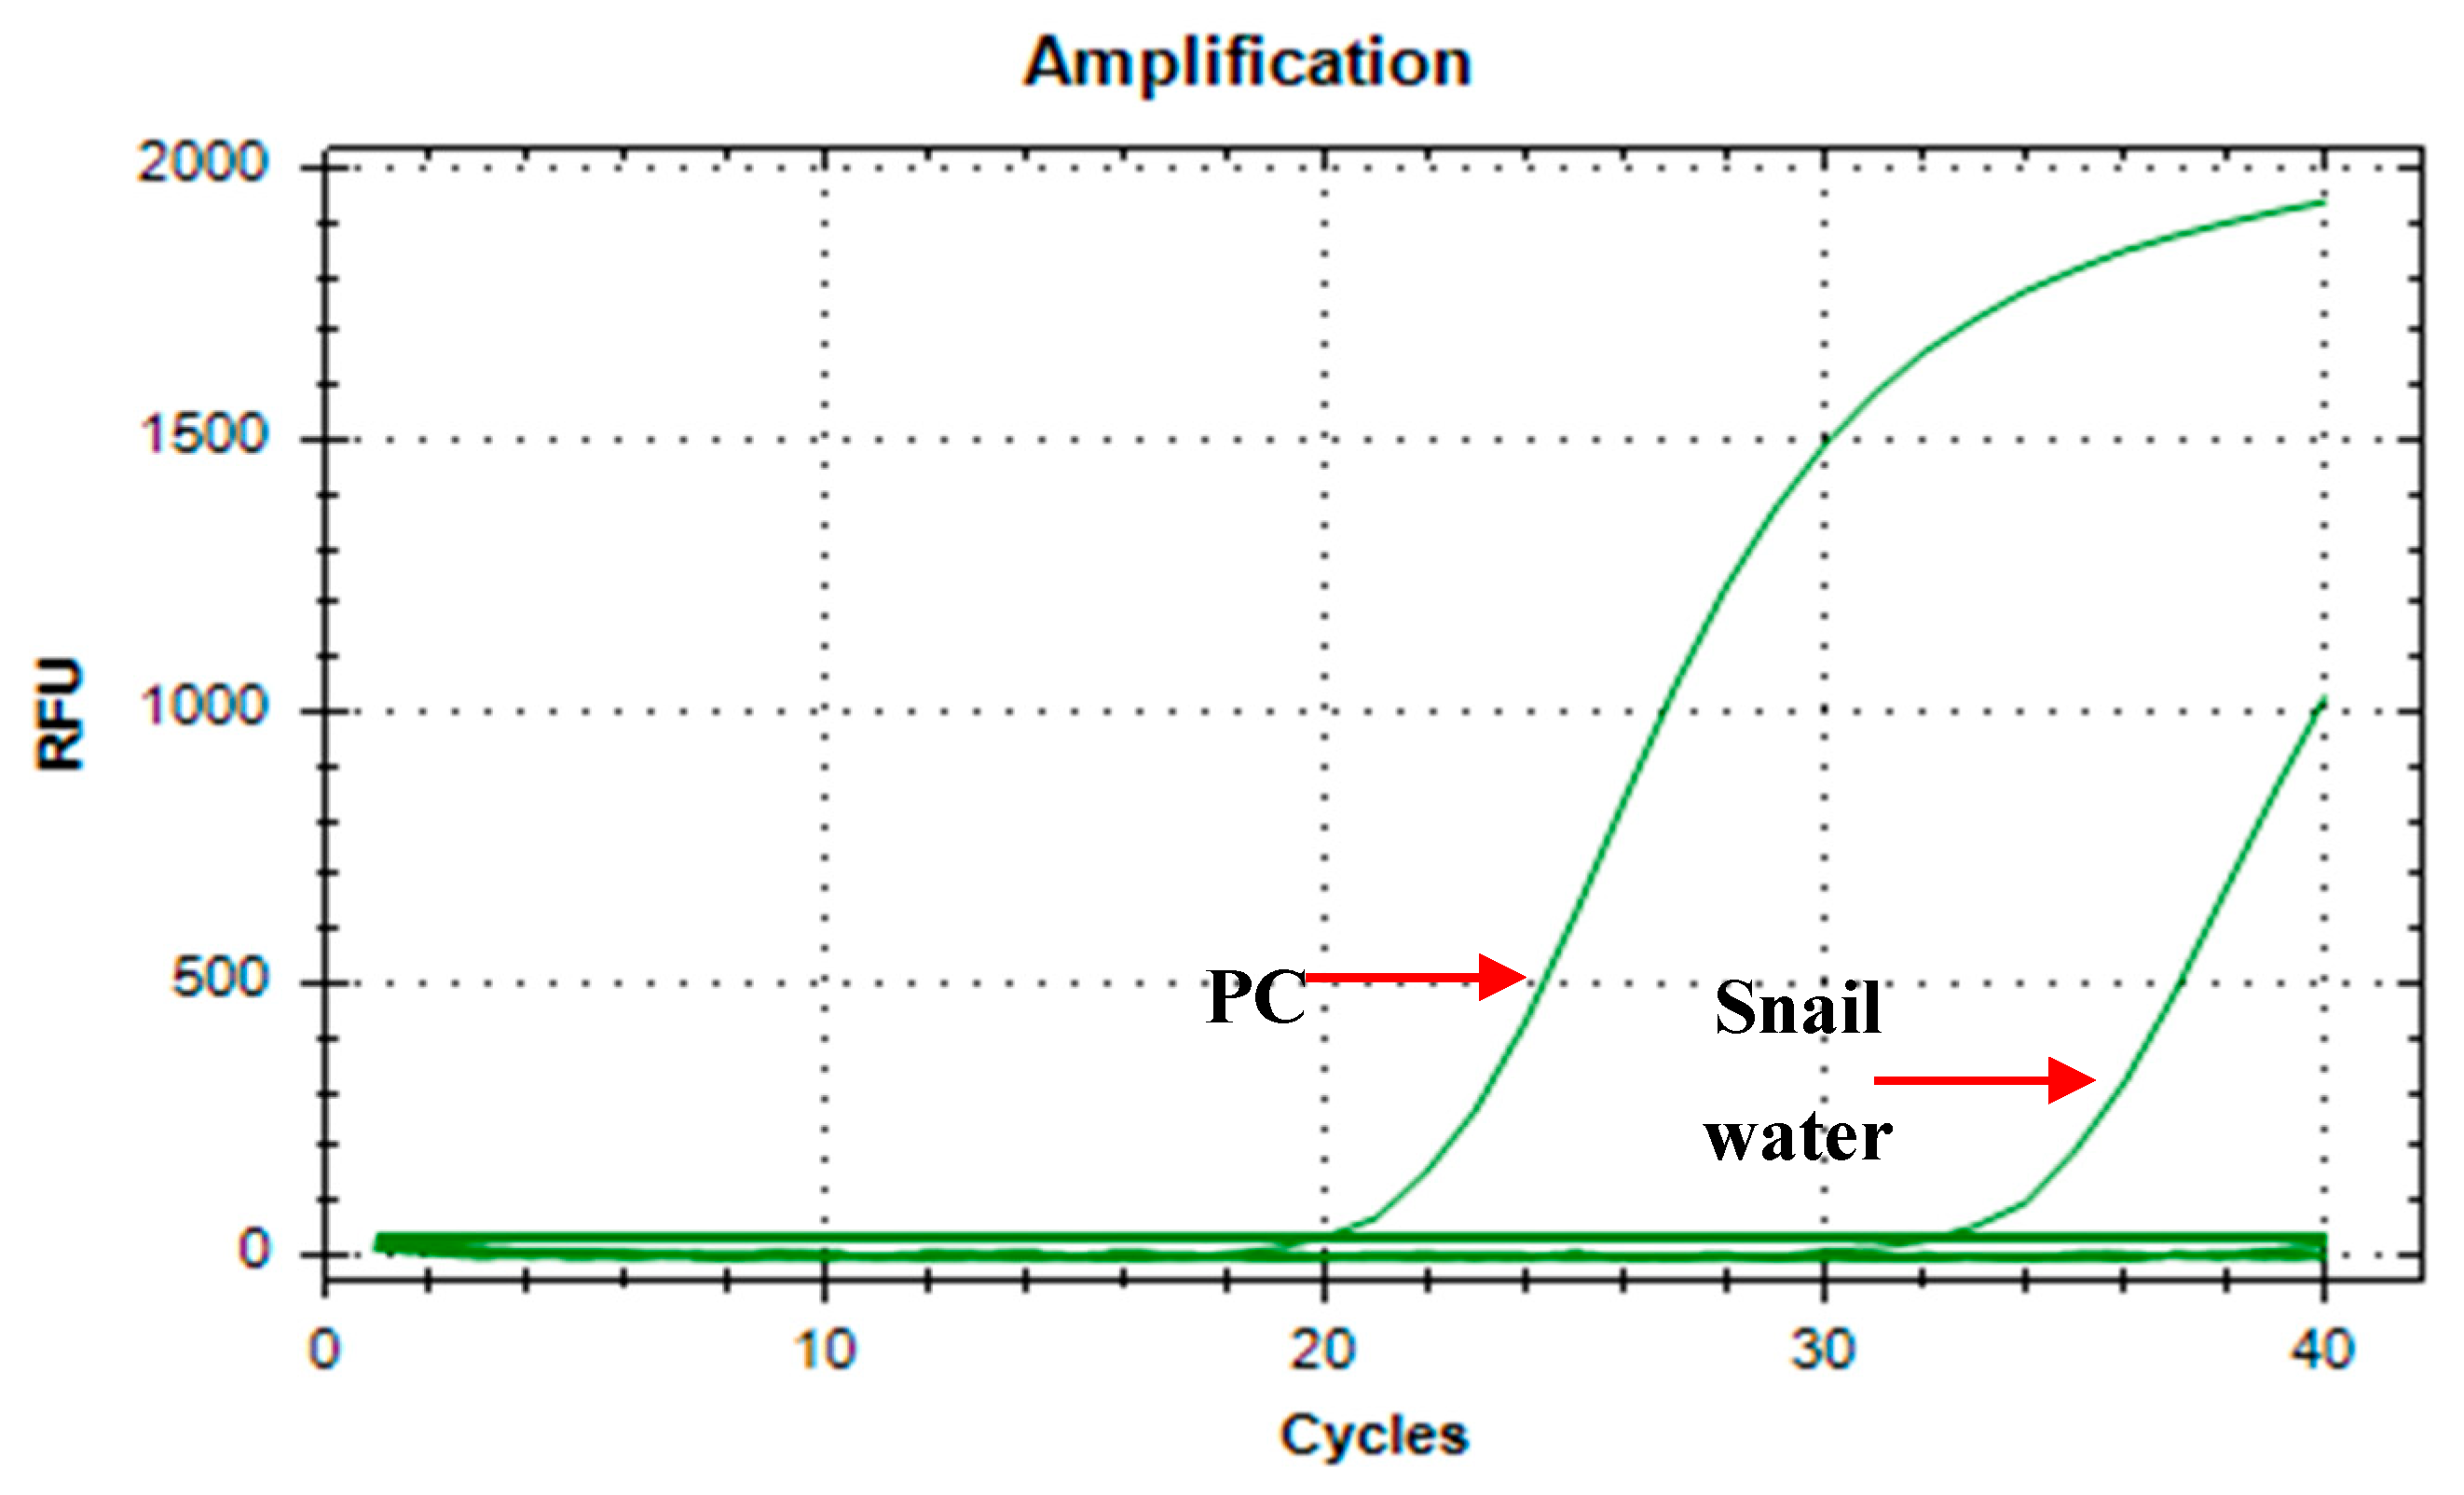
Figure 3.
Standard curve of the O.h. quadrasi qPCR assay.
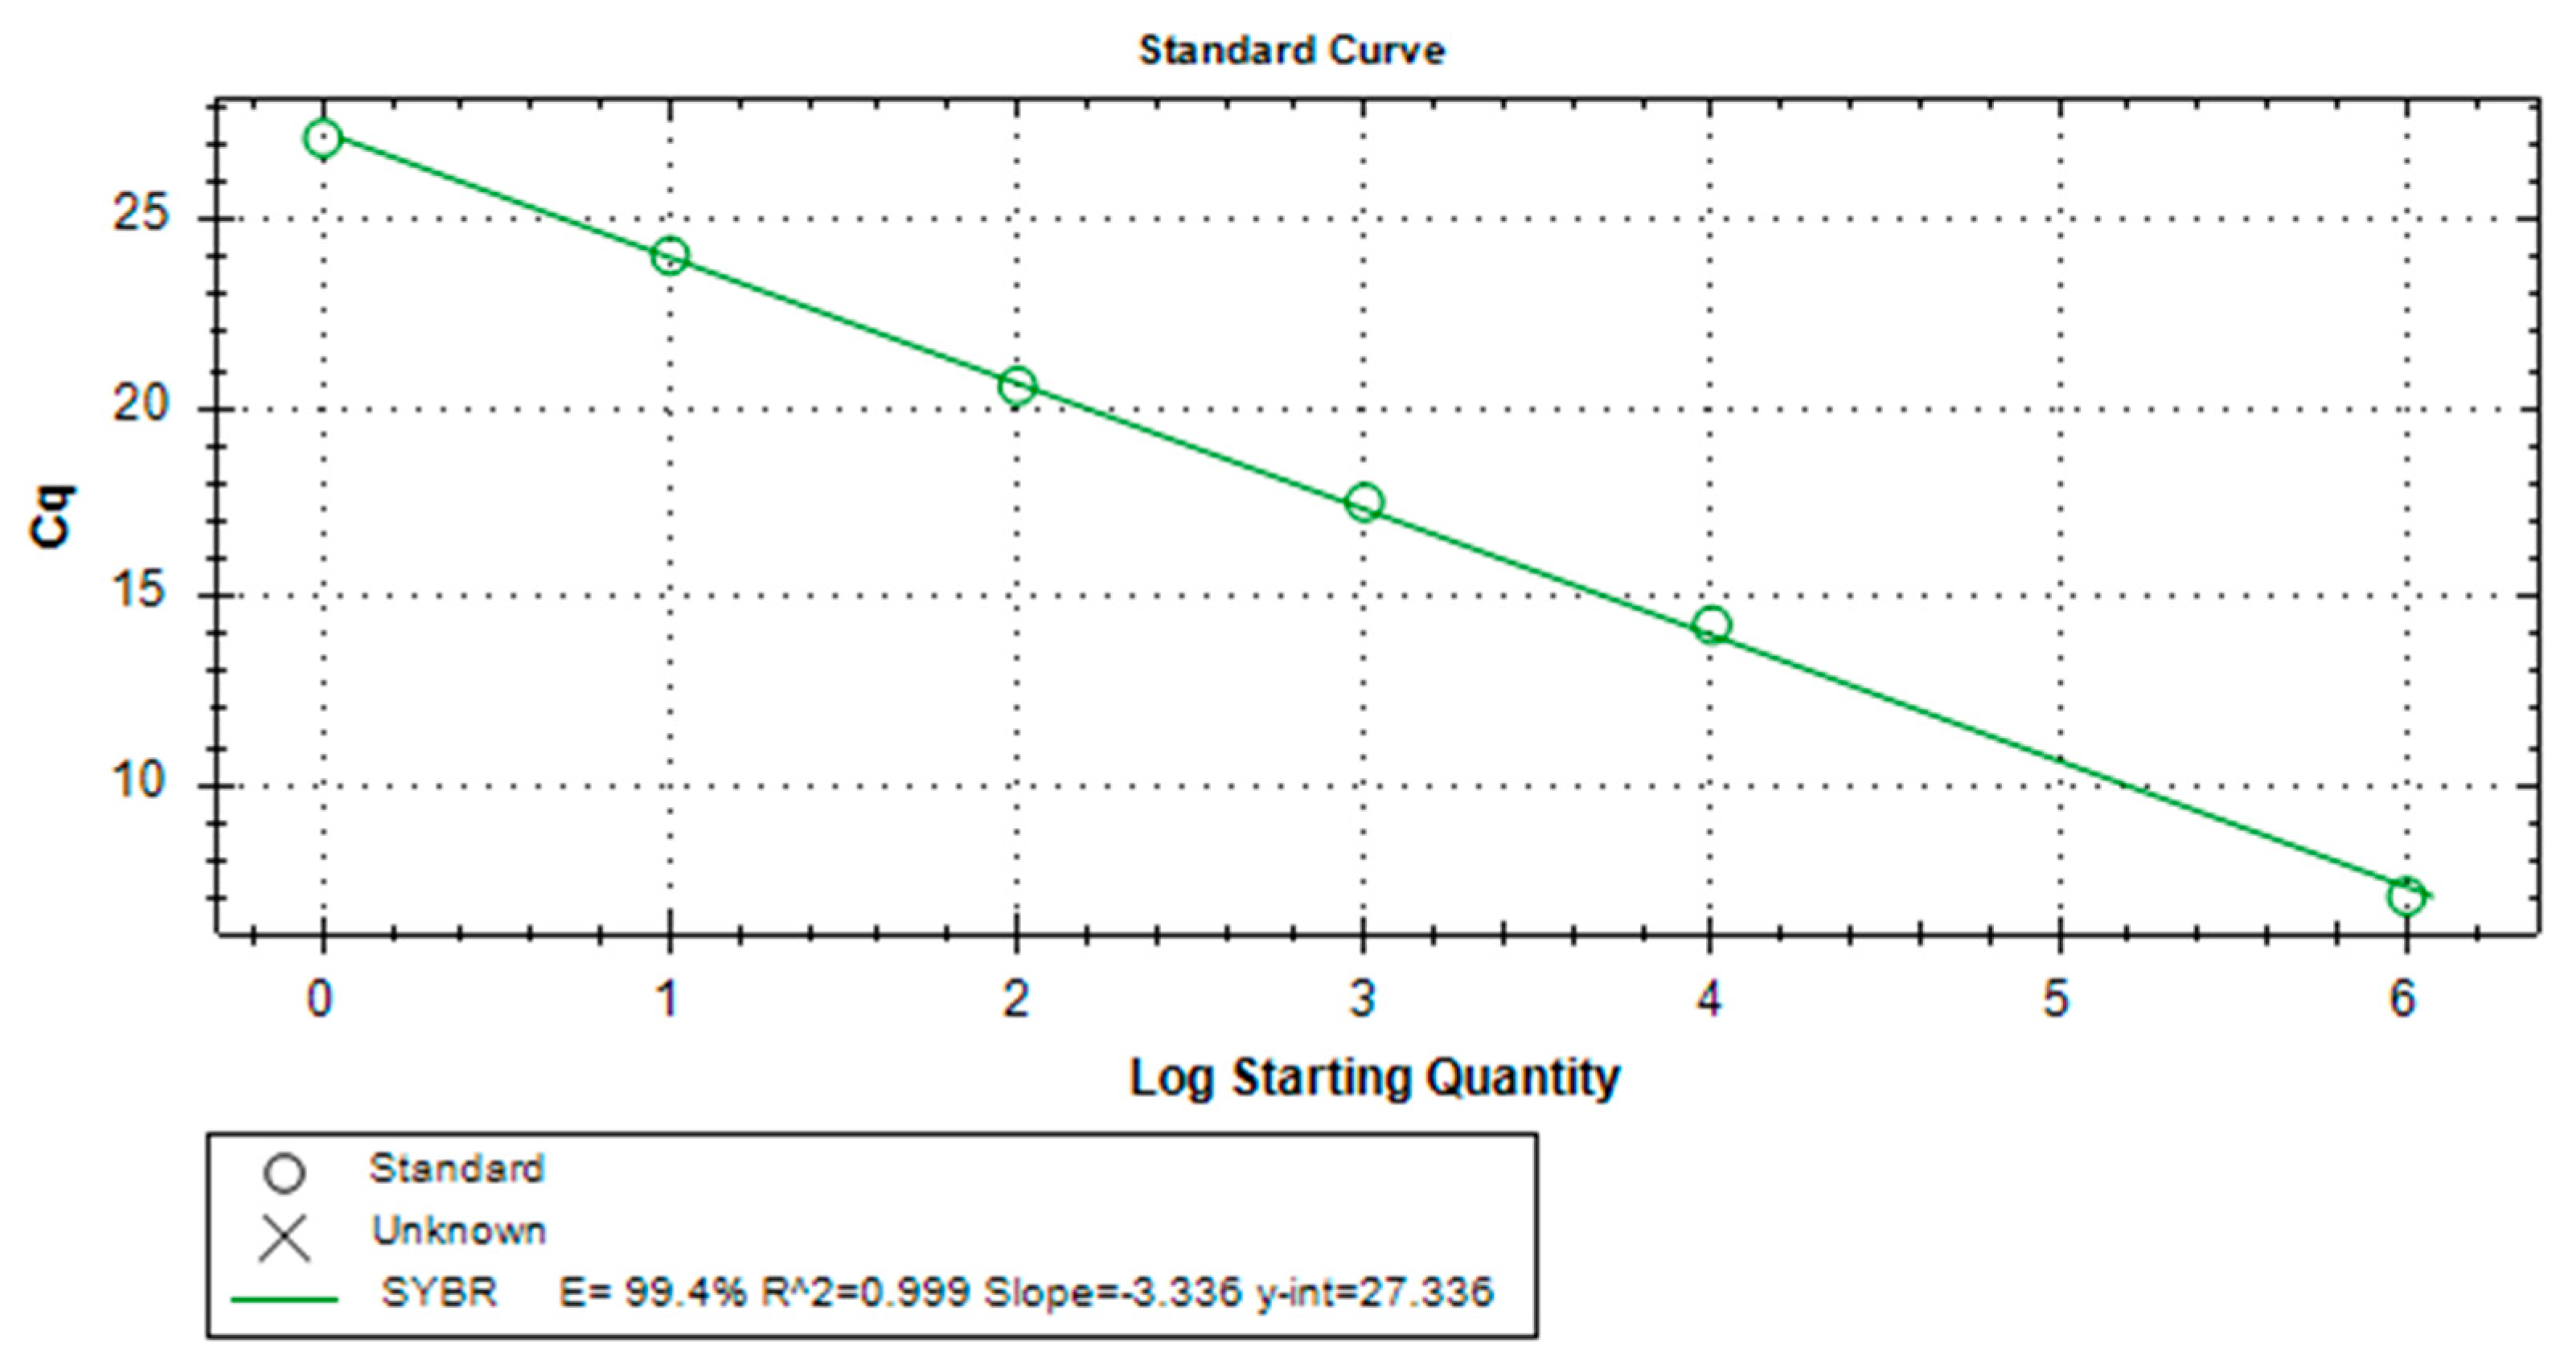
Figure 4.
Melt curve analysis of amplified O.h.quadrasi PCR products, melt temperature at 82.5°C.
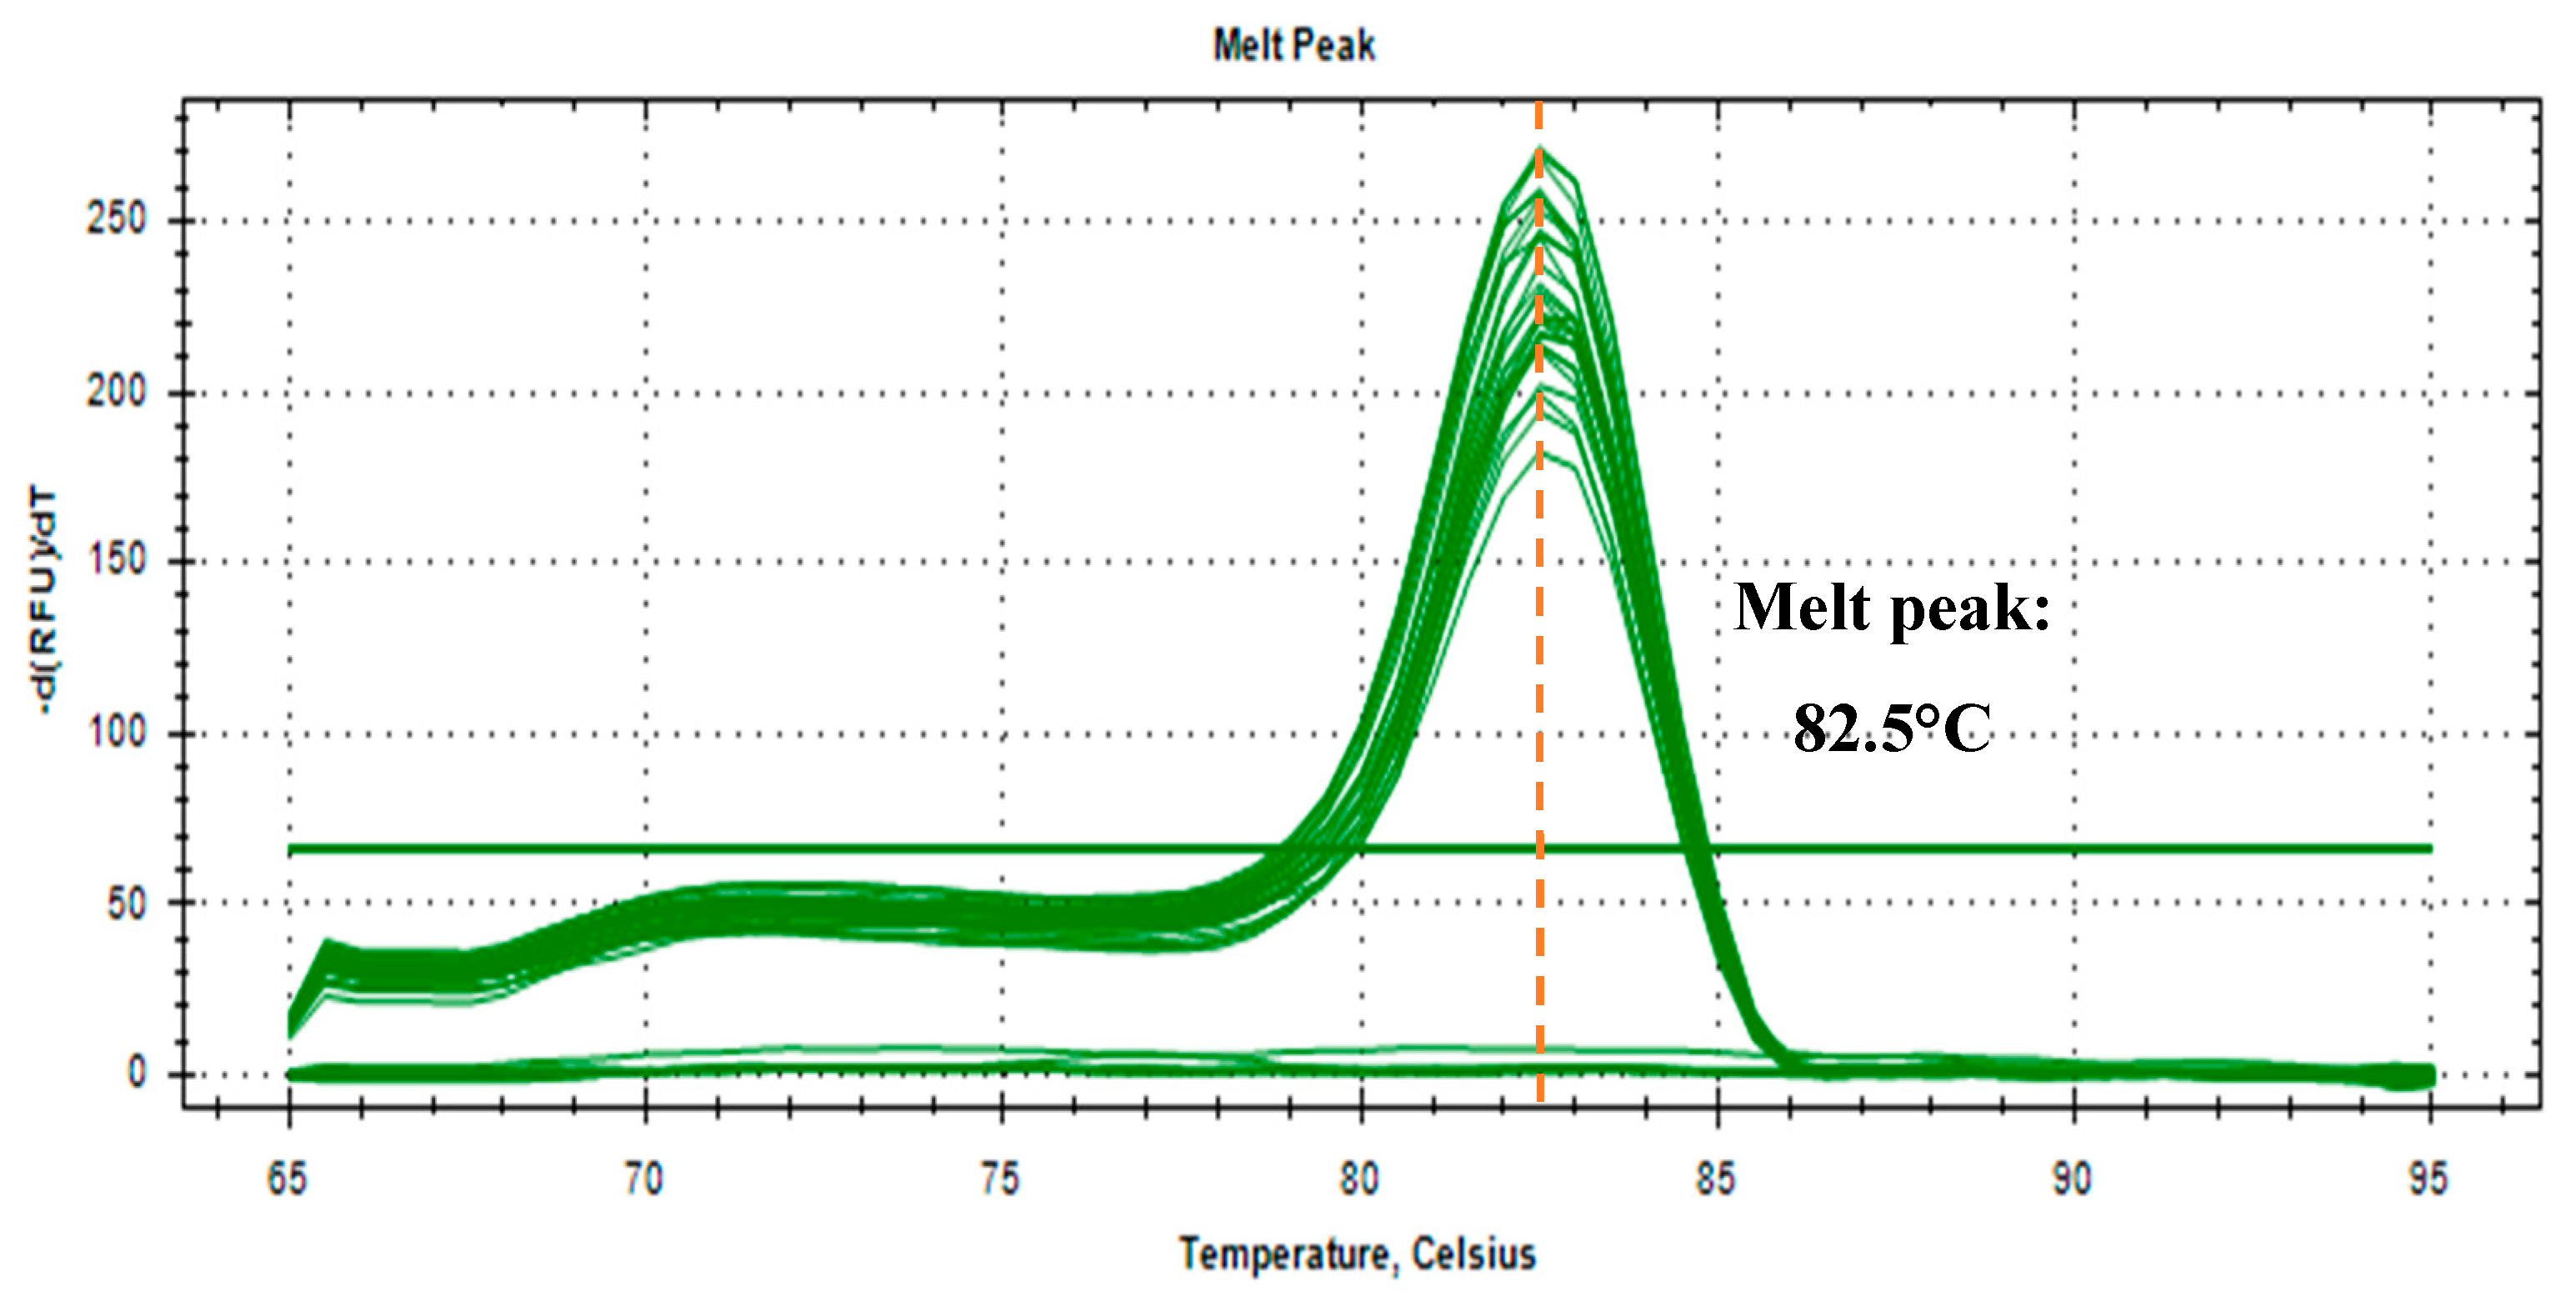

Table 1.
Forward and reverse Oncomelania hupensis quadrasi A18 primers.
| Primer | Sequence | Length (bp) | Tm (°C) | %GC |
|---|---|---|---|---|
| Forward | 5’-CCAGCGCAAAGCTCGTTTAG-3’ | 20 | 60.18 | 55 |
| Reverse | 5’-TCAAGAGAATCTCCAGGCACG-3’ | 21 | 59.79 | 52 |
Table 2.
Determination of optimum annealing temperature (Ta) of A18 primers on Oncomelania hupensis quadrasi (Ohq) DNA using a temperature gradient (Positive control at 104 copies/µL).
Table 2.
Determination of optimum annealing temperature (Ta) of A18 primers on Oncomelania hupensis quadrasi (Ohq) DNA using a temperature gradient (Positive control at 104 copies/µL).
| Annealing temperature (°C) | No template control | Ohq Positive control (Ct values) | ||||
| Replicate 1 | Replicate 2 | Replicate 3 | Mean | Standard Deviation | ||
| 56.0 | Invalid | 20.59 | 21.11 | 21.07 | 20.92 | 0.289 |
| 56.6 | Invalid | 20.53 | 20.96 | 21.22 | 20.90 | 0.348 |
| 57.8 | Valid | 20.61 | 20.74 | 21.6 | 20.98 | 0.538 |
| 59.6 | Valid | 19.51 | 19.06 | 20.11 | 19.56 | 0.527 |
| 61.7 | Valid | 19.63 | 19.83 | 19.65 | 19.70 | 0.110 |
| 63.0 | Valid | 19.51 | 19.53 | 19.47 | 19.50 | 0.031 |
| 64.5 | Valid | 19.67 | 19.65 | 19.83 | 19.72 | 0.099 |
| 65.0 | Valid | 19.51 | 19.62 | 19.61 | 19.58 | 0.061 |
Table 3.
Determination of optimal concentration of A18 primers on Oncomelania hupensis quadrasi (Ohq) DNA using a concentration gradient (Positive control at 104 copies/µL, annealing temperature= 63°C).
Table 3.
Determination of optimal concentration of A18 primers on Oncomelania hupensis quadrasi (Ohq) DNA using a concentration gradient (Positive control at 104 copies/µL, annealing temperature= 63°C).
| Primer concentration (µM) | No template control | Ohq Positive control (Ct Values) | ||||
| Replicate 1 | Replicate 2 | Replicate 3 | Mean | Standard Deviation | ||
| 1.0 | Valid | 31.11 | 30.09 | 30.26 | 30.49 | 0.546 |
| 2.0 | Valid | 21.49 | 21.78 | 21.39 | 21.55 | 0.202 |
| 5.0 | Valid | 19.81 | 19.67 | 19.55 | 19.68 | 0.130 |
| 10.0 | Valid | 19.52 | 19.27 | 19.02 | 19.27 | 0.250 |
Table 4.
Determination of assay specificity using DNAs from co-existing snails as negative control.
| Snail species | Ct value | ||
| Replicate 1 | Replicate 2 | Replicate 3 | |
| Oncomelania hupensis quadrasi | 19.37 | 19.44 | 19.41 |
| Jagora asperata | NA | NA | NA |
| Vivipara zamboagensis surigensis | NA | NA | NA |
| Radix quadrasi | NA | NA | NA |
| Pomacea canaliculata | NA | NA | NA |
| No template control | Valid | Valid | Valid |
Table 5.
Replicate testing in determining the limit of detection of the qPCR assay.
| Mean concentration (copies/uL) | % Replicate detection N=8 |
Mean Ct | Ct SD (≥ 95% CI) |
|---|---|---|---|
| 106 | 100 (8/8) | 7.14 | 0.18 |
| 105 | 100 (8/8) | 14.57 | 0.50 |
| 104 | 100 (8/8) | 17.63 | 0.15 |
| 103 | 100 (8/8) | 21.03 | 0.18 |
| 102 | 100 (8/8) | 24.21 | 0.11 |
| 101 | 100 (8/8) | 26.84 | 0.30 |
| 100 | 100 (8/8) | 28.78 | 1.01 |
| 10-1 | 100 (7/8) | 30.79 | 1.34 |
| 10-2 | 100 (7/8) | 31.47 | 1.39 |
| No template control | 0 (0/8) | NA | NA |
Table 6.
Results of diagnostic accuracy evaluation of the Ohq qPCR assay using environmental samples.
Table 6.
Results of diagnostic accuracy evaluation of the Ohq qPCR assay using environmental samples.
|
Ohq infected environmental water sample |
|||
| Positive | Negative | ||
|
Ohq qPCR assay detection |
Positive | 30 | 0 |
| Negative | 0 | 30 | |
Table 7.
Diagnostic performance (PPV and NPV) of the Ohq qPCR assay using environmental samples.
| Performance criteria | Estimated value (%) | 95% CI (%) |
|---|---|---|
| Positive Predictive Value (PPV) | 100 | 88.43 to 100.00 |
| Negative Predictive Value (NPV) | 100 | 88.43 to 100.00 |
| Computed using: https://www.medcalc.org/calc/diagnostic_test.php | ||
Disclaimer/Publisher’s Note: The statements, opinions and data contained in all publications are solely those of the individual author(s) and contributor(s) and not of MDPI and/or the editor(s). MDPI and/or the editor(s) disclaim responsibility for any injury to people or property resulting from any ideas, methods, instructions or products referred to in the content. |
© 2025 by the authors. Licensee MDPI, Basel, Switzerland. This article is an open access article distributed under the terms and conditions of the Creative Commons Attribution (CC BY) license (http://creativecommons.org/licenses/by/4.0/).
Copyright: This open access article is published under a Creative Commons CC BY 4.0 license, which permit the free download, distribution, and reuse, provided that the author and preprint are cited in any reuse.


