Submitted:
04 March 2025
Posted:
05 March 2025
You are already at the latest version
Abstract
Biosensor technologies in medicine, as in many other areas, are replacing labor-intensive methods of monitoring human health. In this paper, the results of experimental studies of label-free sensors based on hollow-core microstructured optical waveguide (HC-MOW) for human blood serum analysis obtained. The HC-MOWs with a hollow core of 247,5 µm in diameter were manufactured and used in our work. These parameters make it possible to fill the hollow core with high-viscosity solutions due to the capillary properties of the fiber waveguide. Calculations of the spectral properties of HC-MOW fiber were carried out and experimentally confirmed. 21 blood serum samples from volunteers were examined using standard photometry (commercial kits) and an experimental biosensor. The obtained transmission spectra were processed by the principal component analysis method and conclusions were drawn about the possibility of using this biosensor in point-of-care medicine. A significant difference was shown between the blood serum of patients with normal and abnormal blood levels. Algorithms for spectra processing using the Origin program are presented..
Keywords:
hollow-core microstructured optical waveguides
; HC-MOW
; blood serum
; biosensor
; point-of-care diagnostics
; principal component analysis
1. Introduction
Disease prevention is an important trend in the development of modern medicine. The life span of patients with some non-infectious diseases with high mortality can be significantly increased with timely diagnosis of these diseases and medical maintenance of the patient’s health. For instance, these are disorders such as various cardiovascular diseases, diabetes mellitus, kidney disease etc. [1,2,3,4].
For example, according to WHO, 17.9 million people die every year from cardiovascular diseases [5]. This number could be significantly reduced if pathological changes were detected as part of screening at any patient’s visit to a medical clinic. The reason for screening is that if the disease or its precursor is detected early (before symptoms appear), treatment can be started earlier, which in turn leads to a cure or improved quality of life or survival [6].
The physical, chemical, and biological properties of the blood are varied depending of the many factors, like sex, age, and also diseases. However, there are established standards for blood properties, difference from them indicates a disease [7,8]. The most indicative for identifying pathological metabolic disorders during screening is the human blood serum. Devoid of formed elements and fibrinogen, this liquid component of blood contains many markers, reflects the state of health of the body [9]. Along with the data of clinical laboratory and functional routine studies, hospitals are also widely using a clinical blood test to assess the condition of patients. There are a number of diseases that necessarily lead to changes in blood properties, often before the onset of symptoms.
To identify deviations in blood parameters, various automatic and semi-automatic biochemical analyzers are used, as well as kits, based on methods such as affinity chromatography, photometry, colorimetry, turbidimetry, etc. These methods are labor-intensive, require qualified personnel, are not very accurate, have problems with sensitivity and specificity, are aimed at identifying only one analyzed parameter, and usually have an insufficiently accurate control system. In addition, the analysis for the desired parameter may not be carried out or being ignored [10].
Optical biosensors are modern analytical devices most of which employ light-guiding technologies as their transducer part. Microstructural and photonic-crystal waveguides with a hollow core make it possible to combine the methods of refractometry, spectroscopy and nephelometry [11,12].
Over the past 10 years, many articles devoted to the study of the properties of micro- and nanostructured glass fibers and the possibilities of their use for biomedical applications have been published [13]. Detection of such organic components of blood serum, like cholesterol [14], glucose [15], albumin [16], as well as identifying antibody/antigen interactions using microstructured glass fibers has been studied [17,18]. For a comprehensive assessment of the state of the blood, it is necessary to study entire blood serum spectrum.
The advantages of biosensors lie in their accuracy, speed and ease of use. Interest in these objects is also based on the possibility of introducing the studied materials into the internal channels of the fibers and thereby ensuring their interaction with the light propagating through the core along the entire length of the fiber [19]. The operating principle of the HC-MOW used in this study is based on the detection of shifts of the maxima and minima in the transmission spectrum of the HC-MOW and changes in their relative intensity, which are associated with changes in the refractive index and absorption coefficient of the bioanalyte and the presence of scattering particles in it [20]. Unlike conventional photometric systems, HC-MOW have greater sensitivity due to an increase in the optical path, which is formed due to multiple total internal reflection of the beam from the walls of the waveguide. The presence of 1-5 layers of capillaries surrounding the central hollow core ensures minimal signal loss on the way to the reading device, and an additional outer layer of capillaries ensures structural integrity during the drawing process. This design provides a higher sensitivity of the sensors compared to analogues and standard cuvettes [21].
Data obtained using HC - MOWs does not represent the result explicitly and requires mathematical and statistical processing. There are several methods for analyzing multidimensional data, differing from each other in the parameters of the input data and the nuances of the analysis performed.
Principal factor analysis generates common factors that explain correlations between variables [22].
Correspondence analysis suitable for analyzing contingency tables (a large number of qualitative variables) [23].
Canonical correlation analysis - using for analyzing two blocks of variables and analyzing the correlation between them [24].
Redundancy analysis - predicts a linear combination of dependent variables from a combination of independent ones [25].
Independent component analysis another method of component analysis. It allows one to identify latent factors that explain observed data [26].
Principal component analysis is associated with a certain proportion of the total variance of the original data set. Dispersion, which is a measure of data variability, can reflect the level of their information content [27]. The principal component method has proven itself in many studies related to various spectroscopy methods as a method of “grouping data” according to various indicators. This statistical method was used specifically for processing spectral data in UV [28], in terahertz spectrum [29] and in IR spectrum [30]. We considered this method the most suitable for processing our data.
The goal of this study is to identify differences in the transmission spectra of blood serum of healthy volunteers and individuals with pathological blood parameters using specifically manufactured HC-MOWs and processing obtained data with Principal component analysis.
Devices created on the base of the proposed biosensor could be used not only in medical laboratories, but also for point–of–care health monitoring in hospitals. They would make it possible to quickly and accurately determine the state of human health.
2. Materials and Methods
2.1. Blood Samples
Investigated blood serum samples were taken from 21 female volunteers of 35 to 45 year old. Samples 1-11 of «healthy group» were taken from healthy women who were prepared to an in vitro fertilization (IVF) procedure and had no diagnosed cardiovascular diseases. Samples 12-21 of «sick group» were taken from recruited volunteers with a number of chronic diseases – patients of a cardiology clinic. To preserve anonymity, each sample was assigned a number.
Venous whole blood samples were collected after 8–13 hours of fasting. Separated by standart protocol blood serum was examined using certified kits produced by ABRIS+, Ltd., Russia, for albumin, cholesterol, glucose, iron, magnesium etc. in accordance with the instructions for the kits. Optical density was registered on the wavelength 400-1000 nm using a Spectrophotometer Evolution One, Thermo FS, USA. To measure transmission spectra of blood serum in the HC-MOW, it was diluted 1:20 with saline solution and incubated at room temperature (22°C) for 15 minutes. The analysis requires no more than 30 µl of diluted serum.
2.2. Optical Instrumentation
HC-MOW were manufactured using stack-and-draw technique by SPE LLC «Nanostructured Glass Technology», Saratov, Russia. HC-MOW had one concentric circle of capillaries that surround a hollow core. Length of all samples was 6 cm, other parameters of the waveguide are on the picture (Figure 1).
The scheme of the experimental setup is presented in Figure 2
The radiation from the halogen lamp Avalight-HAL-S-MINI 2, (“Avantes”, the Netherlands) (1) enters the collimator (2) through a fiber optical cable, the output end of which is fixed on the adjusting slide, then, the radiation enters the microobjective (3) used to focus radiation and create a focal spot of a small diameter HC-MOW placed in a special plastic cuvette (4). The radiation beam is introduced precisely into the hollow core of the waveguide and collected by the second microobjective (5) and enters the collimator (6) and fed to the AvaSpec-ULS4096CL-EVO spectrum analyzer (Avantes, Netherlands) (7), which is directly connected to a personal computer (8).
2.3. Data processing
Standard MS Office and Origin Pro 2021 were used for data processing, plotting and statistical analysis.
The measured optical spectra were processed in two ways for spectral analysis and for Principal component analysis.
Data processing for spectral analysis:
- For processing, a section of the transmission spectrum was selected in the wavelength range of 350-1050 nm.
- The spectra were smoothed using a Savitzky–Golay filter (second order, window width 29).
- The spectra were normalized to the maximum value.
Data processing for Principal component analysis:
- For processing, a section of the transmission spectrum was selected in the wavelength range of 350 - 1050 nm.
- The spectra were smoothed using a Savitzky–Golay filter (second order, window width 29).
- All data of transmission spectra were divided to the corresponding integration times.
- Transmission spectra of HC-MOWs, filled with blood serum or solvent were divided by the spectrum of the lamp.
- All spectra were converted to optical density.
- The transmission spectrum of the solvent (saline) were subtracted from the transmission spectrum of the diluted serum.
- The spectra were Smoothed once again using a Savitzky–Golay filter (second order, window width - 29).
- Origin Pro 2021 function Principal component analysis (PCA) used to separate serum transmittance spectra into groups in the vectron view.
3. Results
3.1. Study of the Properties of the HC-MOW
The structural shell of the HC-MOW is made of periodically stacked glass capillaries. The main geometric parameter that affects the spectral characteristics of the waveguide is the thickness of the capillary walls of the structural shell. The transmission spectrum of the HC-MOW contains, usually one or several maxima. The wavelengths of the maxima in the spectrum can be calculated using two HC-MOW parameters: the thickness of the shell capillary walls and the refractive index of the material the waveguide was made [31]:
where d is the wall thickness of the shell capillaries, µm; n1 is the refractive index of the medium filling the waveguide structure (in this case, air, i.e., n1 = 1); n2 is the refractive index of glass (1.473). In the middle between two maxima there is a spectral minimum.
Тhe experimentally obtained average values of the minima and maxima of the transmission spectrum were compared with the theoretically calculated ones (Table 1). The measurements were carried out for all waveguides used in the experiment. Statistical processing of measurement data showed that the agreement of the calculated parameters with the experimentally obtained values of the wavelengths of the resonant-comb with the smallest standart deviation (SD) values was recorded in the middle part of the spectrum in the wavelength range 576 – 701 nm. Figure 3(а) shows the transmission spectrum of the empty HC-MOW and filled with water 3(b), saline solution 3(c), diluted serum 3(d).
3.2. Biochemical Analysis of Blood Serum
At the first stage of the research, biochemical analysis of serum was performed using standard kits, as described in subsection 2.1. Table 2 presents the blood serum parameters of volunteers without deviation from norm, while Table 3 presents parameters for which at least one volunteer had an abnormal value (all abnormal values are highlighted in bold and gray for clarity).
Thus, conditionally healthy women had slight excesses of cholesterol levels within the range of 0.88, the rest of the studied parameters were normal. Among the group of patients, only samples 14 and 20 showed no deviations of the studied parameters. However, these patients cannot be considered healthy, because they received compensatory treatment in accordance with their disease.
3.3. Spectral Analysis of Human Serum
Figure 4 a and b shows the transmission spectra of blood serum samples from volunteers in a waveguide and in the photometric cell. It is impossible to explicitly divide the samples to healthy and sick groups based on the spectra in the photometric cuvette. However, the transmission spectra of the sera in the waveguide are clearly divided into two groups, which corresponds to their actual division into «healthy» and «sick».
As noted earlier, the position of transmission peaks, their absolute intensity, and the intensity of individual peaks relative to neighboring peaks are determined by the optical parameters of the medium filling the waveguides. Blood serum is a complex multicomponent medium. The influence of blood serum components on its transmission spectrum varies over the entire wavelength range. For example, there is almost no absorption in the wavelength range from 600 nm to 800 nm (optical density spectra for samples in the cell are shown in Figure 5). One of the transmission maxima is located in this wavelength range. Figure 6 shows the values of the position of this transmission peak and the refractive index of the samples.
The blood serum is characterized by the presence of absorption bands in the wavelength up to 600 nm. Potentially this is associated with the presence of residual hemoglobin. Its various forms have a high absorption capacity at many wavelengths (oxyhemoglobin 415, 542 and 577, deoxyhemoglobin 431 and 556 nm, glycated hemoglobin 545 and 579 nm, methemoglobin 500 nm [32]. However, there are no explicit transmission minima in the spectra in the cuvette at the corresponding wavelengths, because of the low concentration of blood and the short length of the interaction path between radiation and the solution. The design features of the waveguides provide a significant increase in the length of the radiation-substance interaction path (due to the larger actual size compared to the thickness of the cuvette and the multiple re-reflection of radiation in the core), as a result, the influence of absorbing substances on the transmission spectrum in the waveguide is enhanced, as can be seen from the transmission spectra in Figure 4a. The radiation intensity at the corresponding wavelengths for the samples is shown in Figure 7. The presented data demonstrate a significant difference in the degree of absorption at these wavelengths for groups of «healthy» and «sick» volunteers.
3.3. Principal Component Analysis
For creation the initial data set for applying the principal component method, we selected the region of interest in the spectrum where we intend to look for the difference in the measured blood serum samples.
The transmission spectra of blood serum samples are presented in Figure 4a.
Next, the processing described in the subsection 2.3 of Materials and Methods was carried out; it was required to reduce noise and remove external factors that influence the spectrum (Figure 8).
For clarity, the transmission spectra of the samples with normal blood serum properties (“healthy group”) and with some deviations (“sick group”) were averaged separately. Figure 9 shows the differences in the intensities of these averaged transmission spectra.
Figure 10 shows that the principal component method has found significant differences between the samples between the first three components (eigenvectors).
From the fourth principal component onwards, the presence of meaningful information seems unlikely. Therefore, significant information in a spectral data matrix of dimensions 21*2099 can be described by a maximum of three components, where in the matrix, 21 is the number of samples, 2099 is the number of features (intensities at wavelengths). The Figure 11 (a, b, c) shows graphs of scores in a two-dimensional space of 3 principal components.
4. Discussion
Some diseases, such as cancer, cardiovascular, etc., lead to changes in the composition of blood serum, which is reflected in the parameters of light scattering. The study of diluted samples of blood serum and plasma, as well as their models, led to the development of diagnostic methods of oncological, cardiovascular and other diseases [33, 34. Сharacteristics of particle Studies(size, molecular weight, concentration, etc.) in human biological fluids using light scattering methods are in great interest, because the results have practical importance for medicine [35].
Being inside a microstructured hollow-core waveguide, the diluted serum affects the wave comb of the waveguide and changes its configuration. [11,36,37]. Experiments with whole and diluted serums have proven that dilution of blood serum does not affect the determination of the concentrations of substances in these solutions, since all parameters of the particle content in serums change proportionally. [35]. HC-MOWs, due to their structure, provide multiple reflections and a long path length for the interaction of radiation with the analyte with a minimum volume, which makes it possible to record even the slightest fluctuations in the transmission spectrum of blood serum depending on changes in the component composition of the solution.[11,12]. The use of a non-coherent radiation source makes it possible to work in a wide range of wavelengths and obtain multispectral data with each measurement. Absorption has little effect on the measurement of the spectrum in the investigated system, and two parameters play a major role in the formation of the serum spectrum: the refractive index and scattering of the medium [36].
Blood serum contains particles of various nature, size and shape. These are glucose, low-density lipoproteins, high-density lipoproteins, triglycerides, albumin (has different sizes, since it is a carrier protein and can change depending on the molecules attached to it), cholesterol. According to the literature, the sizes of scattering particles in blood serum are divided into the following ranges: I – 1-10 nm, which corresponds to low-molecular albumin monomers and free glycolipid complexes; II – 11-30 nm – globulins and lipoprotein complexes with low molecular weight; III – 31-70 nm – fibrinogen and its complexes, as well as low-molecular immune complexes; IV – 71-150 nm – medium-molecular immune complexes; V – greater than 150 nm – high-molecular immune complexes arising as a result of activation of allergic or autoimmune processes. Fibrin aggregates (~125 nm) may also be present in blood serum. [34]. The largest particles are chylomicrons (70–1000 nm), which are potentially responsible for sample turbidity and can be visually detected if the triglyceride concentration exceeds 3.4 mmol/L. [38,39]. Turbidity and lipemia can be explained by the presence of lipid particles that scatter light and lead to obvious absorption in a wide range of UV/visible spectrum (from 400 nm to 800+ nm). The color of the serum is due to residual bilirubin (icterus) and hemoglobin. These components provide absorption in the range of 415 - 579 nm and due to their proximity the peaks of hemoglobin and bilirubin partially overlap with each other. Enzymes are present in the blood in insignificant quantities compared to other components, and metal ions are too small to influence the transmission spectra in this system. [36,40].
Previous studies have shown that the glucose content in solutions studied using MOWs shifts the waveguide comb to the left towards shorter wavelengths, since glucose has a higher refractive index than other components [41]. The study of liquids with different refractive indices in waveguides, carried out in this work, shows that with an increase in the refractive index of the liquid, the waveguide comb shifts towards shorter wavelengths. This is also consistent with the data of the article obtained using a waveguide with a smaller hollow core diameter, but with similar waveguide properties, where the authors compared the comb spectra obtained as a result of filling the waveguides with water and ethanol of different concentrations, that is, the principle of the comb shift is preserved depending on the refractive index, and regardless of the class of the dissolved substance [19].
Thus, much is known from previous studies about the behavior patterns of solutions of different compositions when introduced into the HC-MOW structure, but the data on the absorption maxima are not applicable when we work with microstructured waveguides filled with such a complex solution as blood serum. When comparing the transmission spectra obtained using microstructured waveguides and the transmission spectra data in a photometric cuvette, as well as when comparing with refractometry data, no obvious differences were found between “sick” and “healthy”, so additional statistical processing and visual presentation of the results were required.
At this stage of the research, we came to the conclusion that the assessment of the state of blood serum can be carried out only by the transmission spectrum of the serum as a whole, without taking into account individual peaks. In this case, as an additional tool, it is necessary to use computer programs and methods that allow analyzing multiparametric systems. PCA has successfully proven itself as such a tool.
PCA is one of the main ways to reduce the dimensionality of data while losing the least amount of information. The main task of the principal component method is to replace the original data with certain aggregated values in a new space, while solving two problems - the first of which is to combine the most important (from the point of view of minimizing the mean square error) values into a smaller number of parameters, but more informative (reducing the dimension of the data space), and the second is to reduce noise in the data [42]. PCA is based on transforming the original variables into new variables called principal components. PCA allows to transform correlated variables into a smaller number of uncorrelated variables, which explain the largest share of variance in the original data.
PCA works by identifying the direction in a multidimensional data space that has the greatest variance. This direction is called the first principal component. Then the second direction with the greatest dispersion, but which is orthogonal to the first principal component, is found - this is the second principal component. The process continues until all the main components are identified. In our investigation there are 3 main components.
The application of the principal component method helped to distribute the serum samples into “sick” and “healthy”, but we got several outliers. For example, samples 12, 16 and 21 stand apart from the groups. Analyzing the data obtained, it can be noted that samples 12 and 16, falling out of the clusters when using the PCA, combined overestimated glucose and creatinine values. 122.2 µmol/l for sample 12 is an indicator at the upper limit of the norm, and 142 µmol/l for sample 16 is 18 µmol/l higher than the norm, which is a significant excess. In addition, both of these volunteers had almost twofold increase of glucose level in their blood.
Sample 21 had normal glucose level however, the level of creatinine was also quite high and reached the upper limit of the norm. Also, in sample 21, cholesterol is slightly exceeded, which, as for the “healthy” samples 4, 6, 10, did not affect the location of the point on the diagram. However, sample 21 has an excess of the value for the parameter low density lipoproteins, these are large molecules that have a significant effect on the spectrum, which obviously affected its loss from the general mass. Also, it is possible that the list of biochemical parameters we monitored did not include the one that affected such a sample location on the diagram, which indicates broader capabilities of this express diagnostic method than a biochemical study, which may not take into account some blood parameters. Despite the fact that we did not study all known biochemical parameters, and for some samples (14 and 20) we cannot reliably explain the reason why they were classified as “sick”, we initially selected patients of the cardiology clinic with a history of deviation in the cardiovascular system and blood parameters may have normal values due to the drug treatment. This can explain their distribution using the principal component method to the “sick” group.Thus, using the PCA method, cluster analysis of HC-MOW spectra of blood serum samples made it possible to divide volunteers into “sick” and “healthy” with 100% accuracy. The analysis showed that some blood parameters, such as creatinine and glucose, have a greater impact on the blood serum spectrum, than others.
Likewise, the study of blood sera using HC-MOWs with a hollow core requires additional research and collection of statistical data, but today we can recognize the fact that the system accurately determines even minor deviations of indicators between volunteers and from the norm.
5. Conclusions
Interesting data of the relationship of the optical properties of a liquid medium (diluted blood serum) and health of volunteers were obtained. It has been experimentally established that data of transmission spectra, received in HC-MOWs, and then processed with Principal Component Analysis makes it possible to determine deviations in the parameters of blood serum of volunteers.
Applied approach opens up the prospect of creating an easy-to-use and accurate label-free sensor for identifying abnormalities in human health, which can be used in mass screening of the population for certain diseases. The method does not require special reagents, complex equipment or highly qualified personnel. One analysis takes no more than 3 minutes.
The use of artificial intelligence to analyze transmission spectra and its training will make it possible to identify even minor changes in blood parameters and compare them over time to accurately determine changes in the composition of the blood.Collection of databases of patients and blood spectra will make it possible to track global changes in the health of the population caused, caused, for example, by environmental changes or in the context of global pandemics. This approach can also be applied to global planning of healthcare and pharmaceutical company strategies.
Author Contributions
Conceptualization, J.S.S., V.V.T.; Methodology, J.S.S.; Formal analysis, Yu.S.S. and S.S.K.; Investigation S.S.K., P.A.L., A.A.Z., A.Y.G., N.A.K., S.A.A. and V.P.I.; Resources, Yu.S.S. and V.V.T.; Writing—original draft preparation, S.S.K, V.V.T., A.A.Z. A.Y.G.; Writing—review and editing, J.S.S. and V.V.T.; Project administration, Yu.S.S. and V.V.T.; Funding acquisition, J.S.S. and V.V.T. All authors have read and agreed to the published version of the manuscript.
Funding
Ministry of Science and Higher Education of the Russian Federation within the framework of a state assignment (project No. FSRR-2023-0007) (V.V.T.).
Institutional Review Board Statement
The study was conducted in accordance with the Declaration of Helsinki, and approved by the Ethics Committee of Saratov State Medical University named after V. I. Razumovsky (No. 741 dated 13 November 2022).
Informed Consent Statement
Not applicable.
Data Availability Statement
Data are available from the authors.
Acknowledgments
V.V.T. was supported by the Ministry of Science and Higher Education of the Russian Federation within the framework of a state assignment (project No. FSRR-2023-0007).
Conflicts of Interest
The authors declare no conflict of interest. The funders had no role in the design of the study; in the collection, analyses, or interpretation of data; in the writing of the manuscript; or in the decision to publish the results.
References
- Kaminsky, L.A.; German, C.; Imboden, M.; Ozemek, C.; Peterman, J.E.; Brubaker, P.H. The importance of healthy lifestyle behaviors in the prevention of cardiovascular disease. Prog. Cardiovasc. Dis. 2022, 70, 8–15. [Google Scholar] [CrossRef]
- Araujo, L.F.; de Matos Soeiro, A.; Fernandes, J.L.; Pesaro, A.E.; Serrano, C.V. Jr. Coronary artery disease in women: a review on prevention, pathophysiology, diagnosis, and treatment. Vasc. Health Risk Manag. 2006, 2, 465–475. [Google Scholar] [CrossRef] [PubMed]
- Crandall, J.P.; Knowler, W.C.; Kahn, S.E.; Marrero, D.; Florez, J.C.; Bray, G.A.; Haffner, S.M.; Hoskin, M.; Nathan, D.M. Diabetes Prevention Program Research Group. The prevention of type 2 diabetes. Nat. Clin. Pract. Endocrinol. Metab. 2008, 4, 382–393. [Google Scholar] [CrossRef] [PubMed]
- Kramer, H. Diet and Chronic Kidney Disease. Adv.Nutr. S: (Suppl_4). [CrossRef]
- World Health organization. Available online: https://www.who.int/ru. (accessed on 20/02/2025).
- Aggarwal, R.; Ranganathan, P.; Pramesh, C.S. Research studies on screening tests. Perspect. Clin. Res. 2022, 13, 168–171. [Google Scholar] [CrossRef] [PubMed]
- Arunkumar, R.; Suaganya, T.; Robinson, S. Design and Analysis of 2D Photonic crystal based biosensor to detect different blood components. Photonic. Sens. 2019, 9, 69–77. [Google Scholar] [CrossRef]
- Enejder, A.M.K.; Swartling, J.; Aruna, P.; Engels, S.A. Influence of cell shape and aggregate formation on the optical properties of flowing whole blood. Applied Optics 2003, 42, 1384–1394. [Google Scholar] [CrossRef]
- Liu, S.; Gao, W.; Li, H.; Dong, Y.; Zhang, H. Liquid-filled simplified hollow-core photonic crystal fiber. Opt. Laser Technol. 2014, 64, 140–144. [Google Scholar] [CrossRef]
- Hoffmann, J.J.M.L.; Urrechaga, E. Recent advances in laboratory hematology reflected by a decade of CCLM publications. Clin. Chem. Lab. Med. 2022, 61, 829–840. [Google Scholar] [CrossRef]
- Skibina, Y.S. ; Tuchin,V.V.; Beloglazov, V.I.; Shteinmaeer, G.; Betge, I.L.; Wedell, R.; Langhoff, N. Quantum Electron. 2011,.
- Ayyanar, N.; Thavasi Raja, G.; Skibina, Y.S.; Monfared, Y.E.; Zanishevskaya, A.A.; Shuvalov, A.A.; Gryaznov, A. Yu. Hollow-core microstructured optical fiber based refractometer: numerical simulation and experimental studies. IEEE Trans. Nanobioscience 2022, 21, 194–198. [Google Scholar] [CrossRef]
- Portosi, V.; Laneve, D.; Falconi, M.C.; Prudenzano, F. Advances on photonic crystal fiber sensors and applications. Sensors (Basel) 2019, 19, 1892. [Google Scholar] [CrossRef]
- Kumar, S.; Kaushik, B.K.; Singh, R.; Chen, N.K.; Yang, Q.S.; Zhang, X.; Wang, W.; Zhang, B. LSPR-based cholesterol biosensor using a tapered optical fiber structure. Biomed. Opt. express 2019, 10, 2150–2160. [Google Scholar] [CrossRef]
- Zanishevskaya, A.A.; Malinin, A.V.; Skibina, Y.S.; Tuchin, V.V.; Chainikov, M.V.; Beloglazov, V.I.; Silokhin, I.Yu.; Ermakova, A.M. Determination of glucose concentration in biological liquids using photonic crystal waveguides. Optics and Spectroscopy 2013, 115, 228–232. [Google Scholar] [CrossRef]
- Ermatov, T.; Noskov, R.E.; Machnev, A.A.; Gnusov, I.; Аtkin, V.; Lazareva, E.N.; German, S.V.; Kosolobov, S.S.; Zatsepin, T.S.; Sergeeva, O.V.; Skibina, J.S.; Ginzburg, P.; Tuchin, V.V.; Lagoudakis, P.G.; Gorin, D.A. Multispectral sensing of biological liquids with hollow-core microstructured optical fibres. Light Sci Appl. [CrossRef]
- Haes, A.J.; Chang, L.; Klein, W.L.; Van Duyne, R.P. Detection of a biomarker for Alzheimer’s disease from synthetic and clinical samples using a nanoscale optical biosensor. J. Am. Chem. Soc. 2005, 127, 2264–2271. [Google Scholar] [CrossRef] [PubMed]
- Kudryavtseva, O.M.; Skibina, Yu.S.; Kozhevnikov, V.A.; Bugorkova, S.A.; Chainikov, M.V.; Gryaznov, А.Yu.; Glukhov, D.E.; Konnova, S.S.; Shuvalov, A.A.; Shchukovskaya, T.N. Direct detection of antibodies to Yersinia pestis using glass microstructural waveguides as an express method for assessing seroconversion in individuals vaccinated against plague. Epidemiology and vaccinal prevention 2022, 21, 89–96. [Google Scholar] [CrossRef]
- Bzheumikhov, K.A.; Gurtueva, I.A.; Margushev, Z.Ch.; Savoysky, Yu.V. Features of the spectral properties of photonic crystal fibers with a hollow core filled with liquid. News of the Kabardino-Balkarian Scientific Center of the Russian Academy of Sciences 2012, 3, 26–29. [Google Scholar]
- Chen, Y.; Liu, J.; Yang, Z.; Wilkinson, J.S.; Zhou, X. Optical biosensors based on refractometric sensing schemes: A review. Biosens. Bioelectron. 2019, 144, 111693. [Google Scholar] [CrossRef] [PubMed]
- Alam, M.K.; Vadivel, K.; Natesan, A.; Sghaireen, M.G.; Ganji, K.K.; Srivastava, K.C.; Nashwan, S.; Khader, Y. Design of highly sensitive biosensors using hollow-core microstructured fibers for plasma sensing in aids with human metabolism. Opt Quantum Electron. 2023, 55, 188. [Google Scholar] [CrossRef]
- Schreiber, J.B. Issues and recommendations for exploratory factor analysis and principal component analysis. Res. Social Adm. Pharm. 2021, 17, 1004–1011. [Google Scholar] [CrossRef]
- Ritov, Y.; Gilula, Z. Analysis of contingency tables by correspondence models subject to order constraints. Am. Stat. Assoc. 1993, 88, 1380–1387. [Google Scholar] [CrossRef]
- Du, L.; Liu, K.; Yao, X.; Risacher, S.L.; Han, J.; Saykin, A.J.; Guo, L.; Shen, L. Multi - task sparse canonical correlation analysis with application to multi-modal brain imaging genetics. Trans. Comput. Biol. Bioinform. 2021, 18, 227–239. [Google Scholar] [CrossRef]
- Leistritz, L.; Weiss, T.; Bär, K.J.; De Vico Fallani, F.; Babiloni, F.; Witte. H.; Lehmann. T. Network redundancy analysis of effective brain networks: a comparison of healthy controls and patients with major depression. PLoS One, 2013, 8, e60956. [Google Scholar] [CrossRef] [PubMed]
- Ashenova, A.; Daniyarov, A.; Molkenov, A.; Sharip, A.; Zinovyev, A.; Kairov, U. Meta-analysis of esophageal cancer transcriptomes using independent component analysis. Front. Genet. 2021, 12, 683632. [Google Scholar] [CrossRef] [PubMed]
- David, C.C.; Jacobs, D.J. Principal component analysis: a method for determining the essential dynamics of proteins. Methods Mol. Biol. 2014, 1084, 193–226. [Google Scholar] [CrossRef] [PubMed]
- Wang, C.; Chen, Q.; Hussain, M.; Wu, S.; Chen, J.; Tang, Z. Application of principal component analysis to classify textile fibers based on UV-vis diffuse reflectance spectroscopy. Zhurnal Prikladnoii Spektroskopii 2017, 84, 368–372. [Google Scholar] [CrossRef]
- Cao, Y.; Chen, J.; Zhang, G.; Fan, S.; Ge, W.; Hu, W.; Huang, P.; Hou, D.; Zheng, S. Characterization and discrimination of human colorectal cancer cells using terahertz spectroscopy. Spectrochim Acta A Mol. Biomol. Spectrosc. 2021, 256, 119713. [Google Scholar] [CrossRef]
- Basova, E.M.; Litvinenko, Yu. N.; Polotnyanko, N.A. Identification of drug manufacturers using IR spectroscopy and the principal component method. Journal Bulletin of the International University of Nature 2021, 2, 7–15. [Google Scholar]
- Zheltikov, A.M. Colors of thin films, antiresonant phenomena in optical systems, and the limiting loss of modes in hollow optical waveguides. Physics-Uspekhi 2008, 51, 591–600. [Google Scholar] [CrossRef]
- Dhanabalan, S.S.; Sriram, S.; Walia, S.; Raja Avaninathan, S.; Flores Carrasco, M.; Bhaskaran, M. Wearable Label–Free Optical Biodetectors: Progress and Perspectives. Advanced Photonics Research 2020, 2000076. [Google Scholar] [CrossRef]
- Alekseev, S.G.; Ivanov, A.V.; Sviridov, S.V.; Petrova, G.P. ; PetrusevicM.; Boiko, A.V.; Ten, D.I. Multiparametrical Testing of Blood Proteins Solutions with Diagnostic Purpose. Proceedings of SPIE, 5973. [Google Scholar]
- Chaikov, L.L. Dynamics of statistically confident particle sizes and concentrations in blood plasma obtained by the dynamic light scattering method Journal of biomedical optics 2015, 20, 57003. 20.
- Kirichenko, M.N.; Chaikov, L.L.; Kazaryan, M.A.; Bulychev, N.A. Application of light scattering methods in biomedicine and ecology International Scientific Journal “Alternative Energy and Ecology” 2019, 80-103.
- Márquez-Islas, R.; Pérez-Pacheco, A.; Quispe-Siccha, R.; Salazar-Nieva, L.B.; García-Valenzuela, A. Visual assessment of blood plasma versus optical transmittance and refractive index measurements for quantifying lipemia. Diagnostics (Basel) 2022, 12, 510. [Google Scholar] [CrossRef]
- Khozeymeh, F.; Melli, F.; Capodaglio, S.; Corradini, R.; Benabid, F.; Vincetti, L.; Cucinotta, A. Hollow-core fiber-based biosensor: a platform for lab-in-fiber optical biosensors for DNA detection. Sensors (Basel) 2022, 22, 5144. [Google Scholar] [CrossRef]
- Nikolac, N. Lipemia: Causes, Interference Mechanisms, Detection and Management. Biochem. Med. 2014; 57–67. [CrossRef]
- Febryani, N.; Amalia, I.N.; Anggraeni, I.D.; Nugraha, G. Study of hemoglobin levels on hemolysis sample. Indonesian Journal of Medical Laboratory Science and Technology. [CrossRef]
- Huynh, T.; Lai, M.J.; Liu, Y.L. Spectral Analysis Methods Based on Background Subtraction and Curvature calculation used in the detection or quantification of hemolysis and icterus in Blood-derived clinical samples. Cureus 2017, 9, 1965. [Google Scholar] [CrossRef] [PubMed]
- Zanishevskaya, A.A.; Malinin, A.V.; Skibina, Yu. S.; Tuchin, V.V.; Chaynikov, M.V.; Beloglazov, V.I.; Silokhin, I. Yu.; Ermakova, A.M. Determination of glucose concentration in biological fluids using photonic crystal waveguides. Optics and Spectroscopy 2013, 115, 266–271. [Google Scholar] [CrossRef]
- Esbensen, K. Analysis of Multidimensional Data. Selected Chapters. Publishing House IPCP RAS: Chernogolovka, Russia, 2005, pp. 160–170.
Figure 1.
Cross-sectional photo of a one-row chirped HC-MOW.
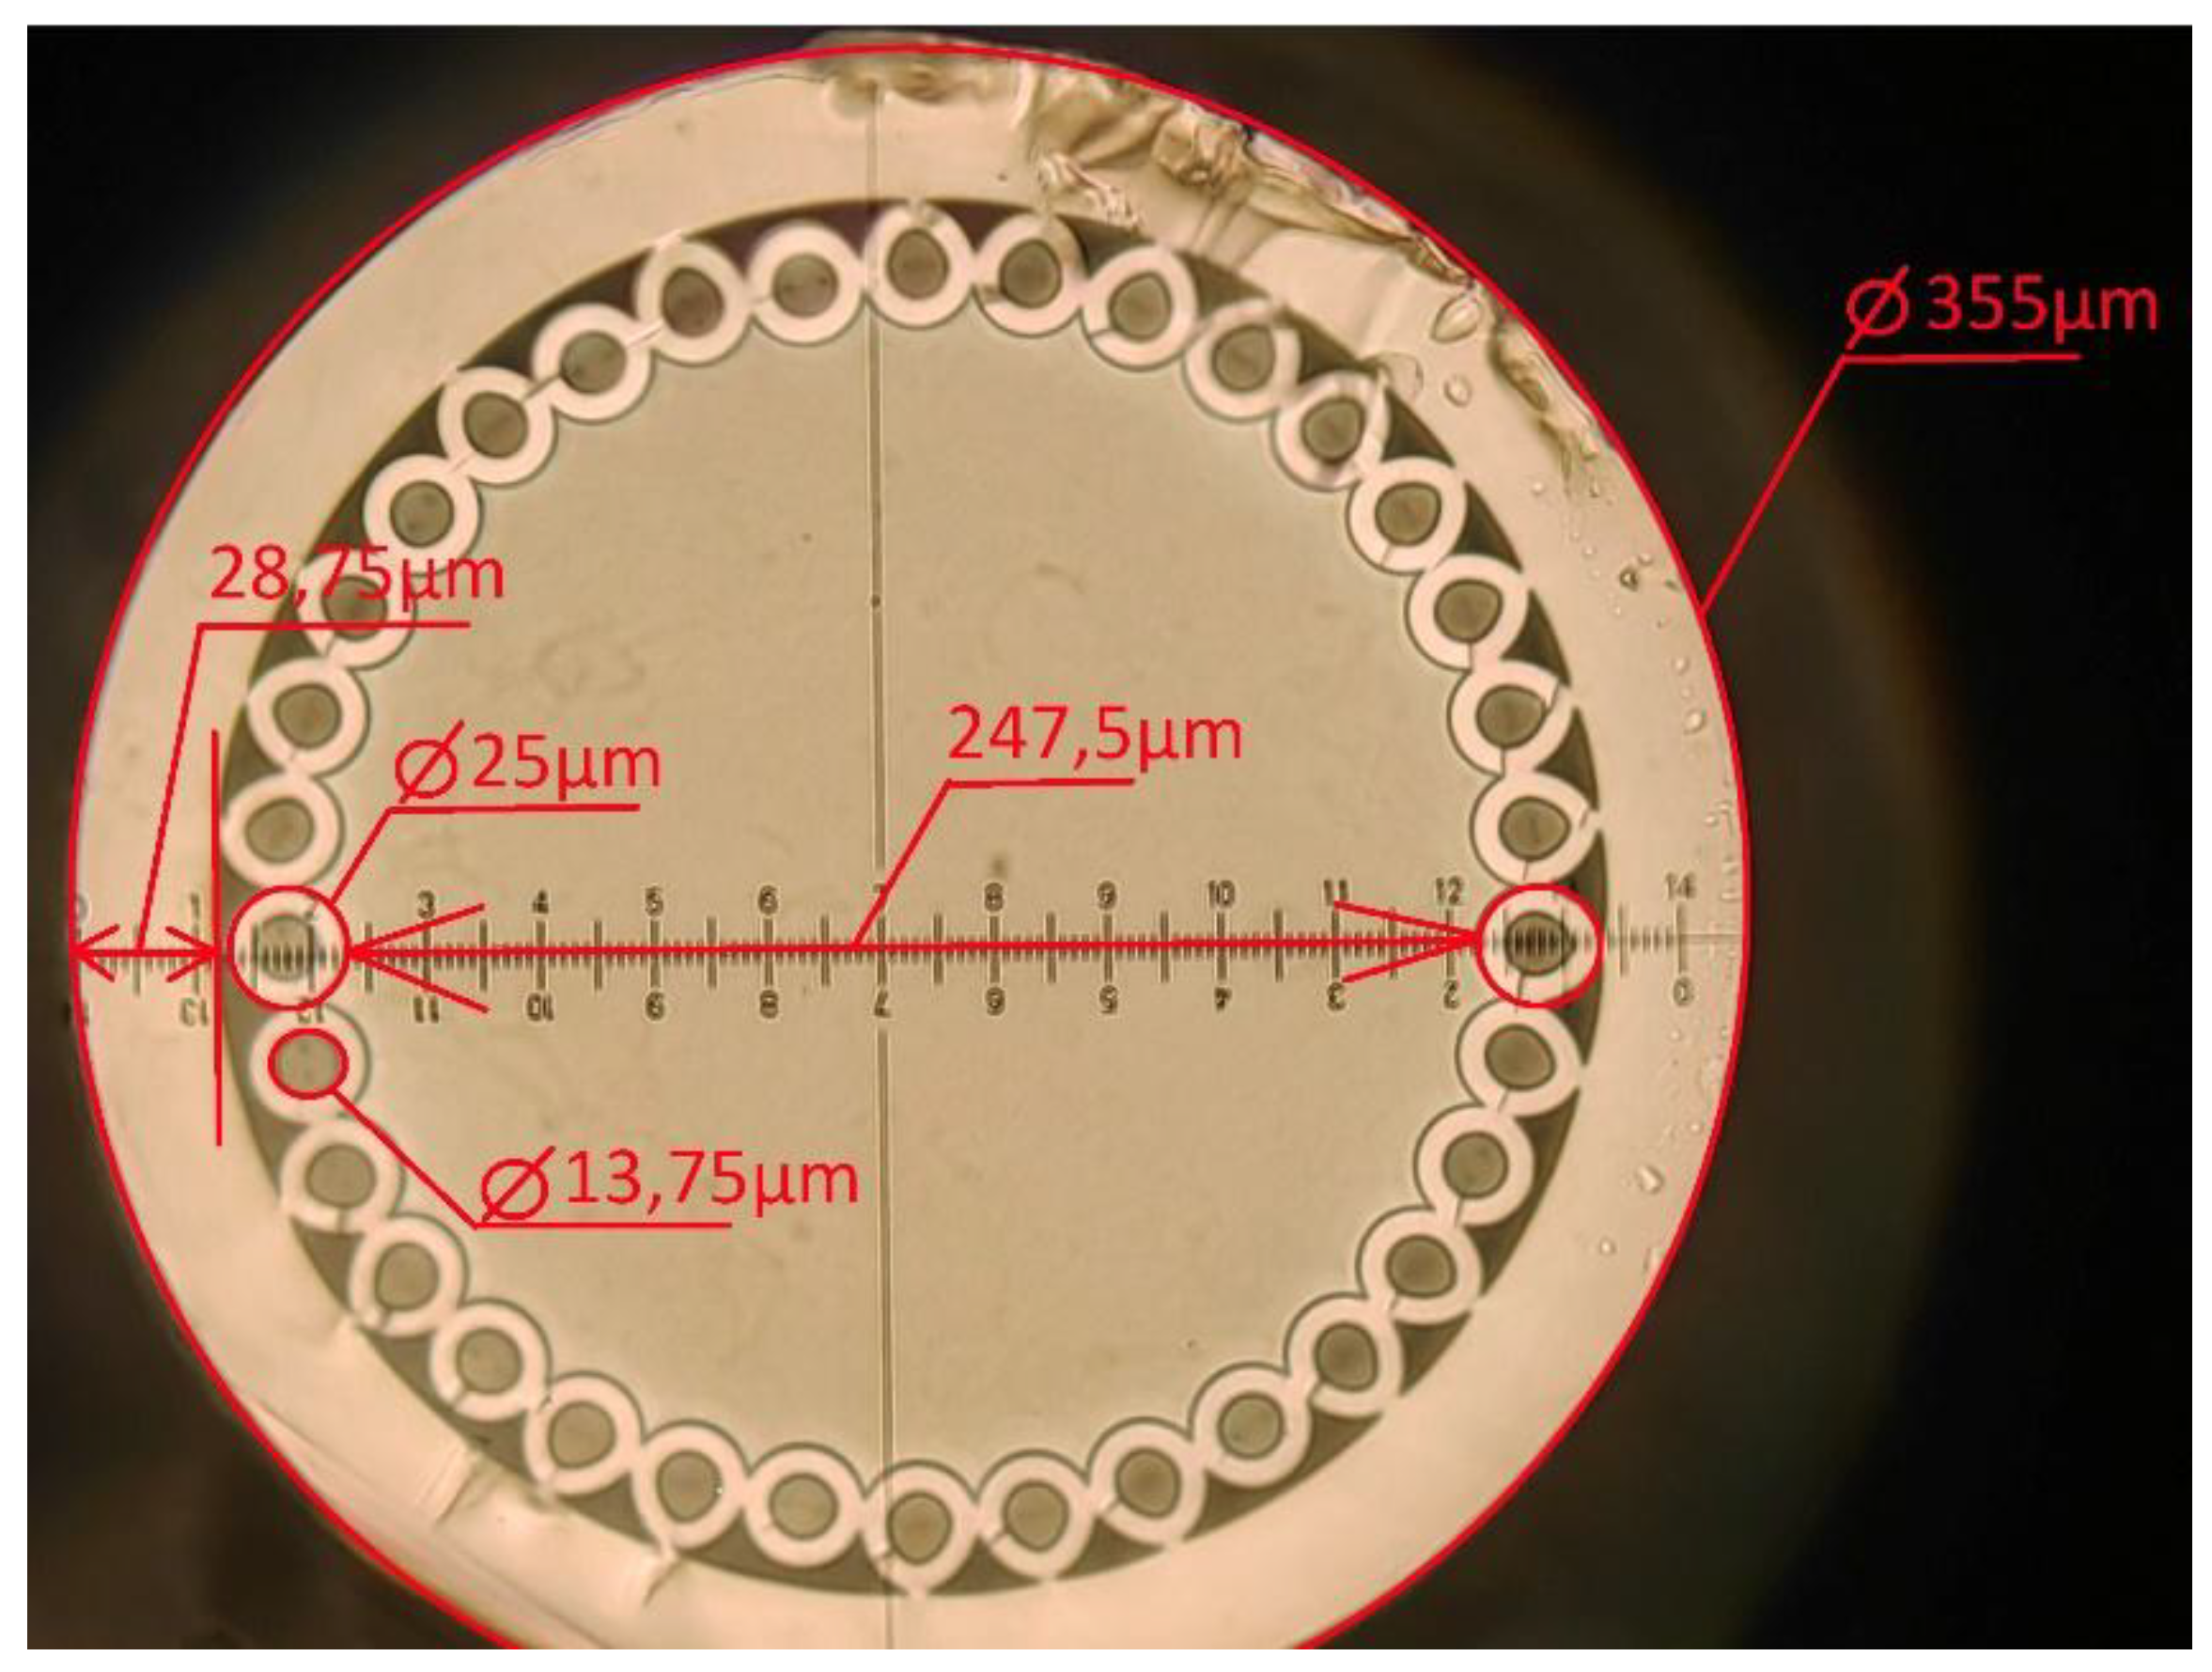
Figure 2.
Scheme of the experimental setup for studying the transmission spectra of blood serum: 1 - lamp Avalight-HAL-S-MINI2; 2,3/5,6– collimator and microobjective on adjusting platforms, 4 - HC-MOW integrated into the cuvette; 7 - spectrum analyzer AvaSpec-ULS4096CL-EVO; 8 - personal computer for data processing.
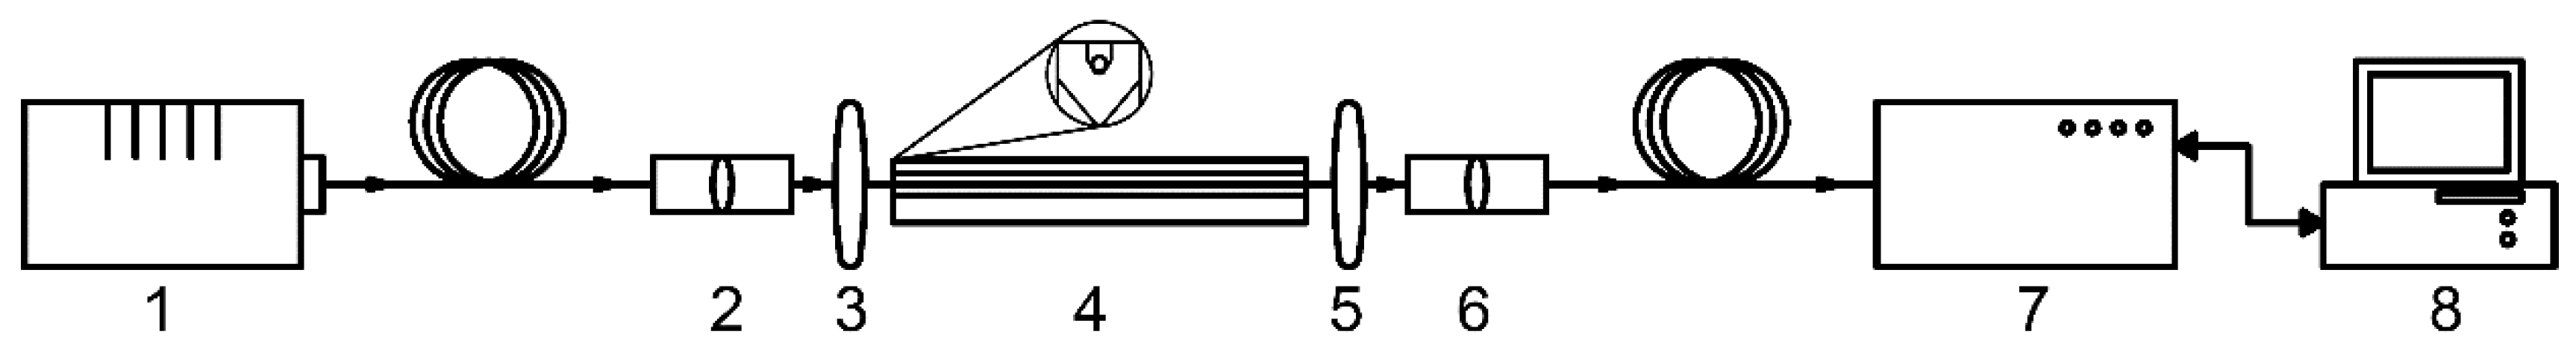
Figure 3.
Transmission spectrum of the empty HC-MOW (RI 1,000293 )(a), filled with water (RI 1,333) (b), filled with saline (RI 1,3345) (c), filled with serum 14 (RI 1,3349) (d).
Figure 3.
Transmission spectrum of the empty HC-MOW (RI 1,000293 )(a), filled with water (RI 1,333) (b), filled with saline (RI 1,3345) (c), filled with serum 14 (RI 1,3349) (d).
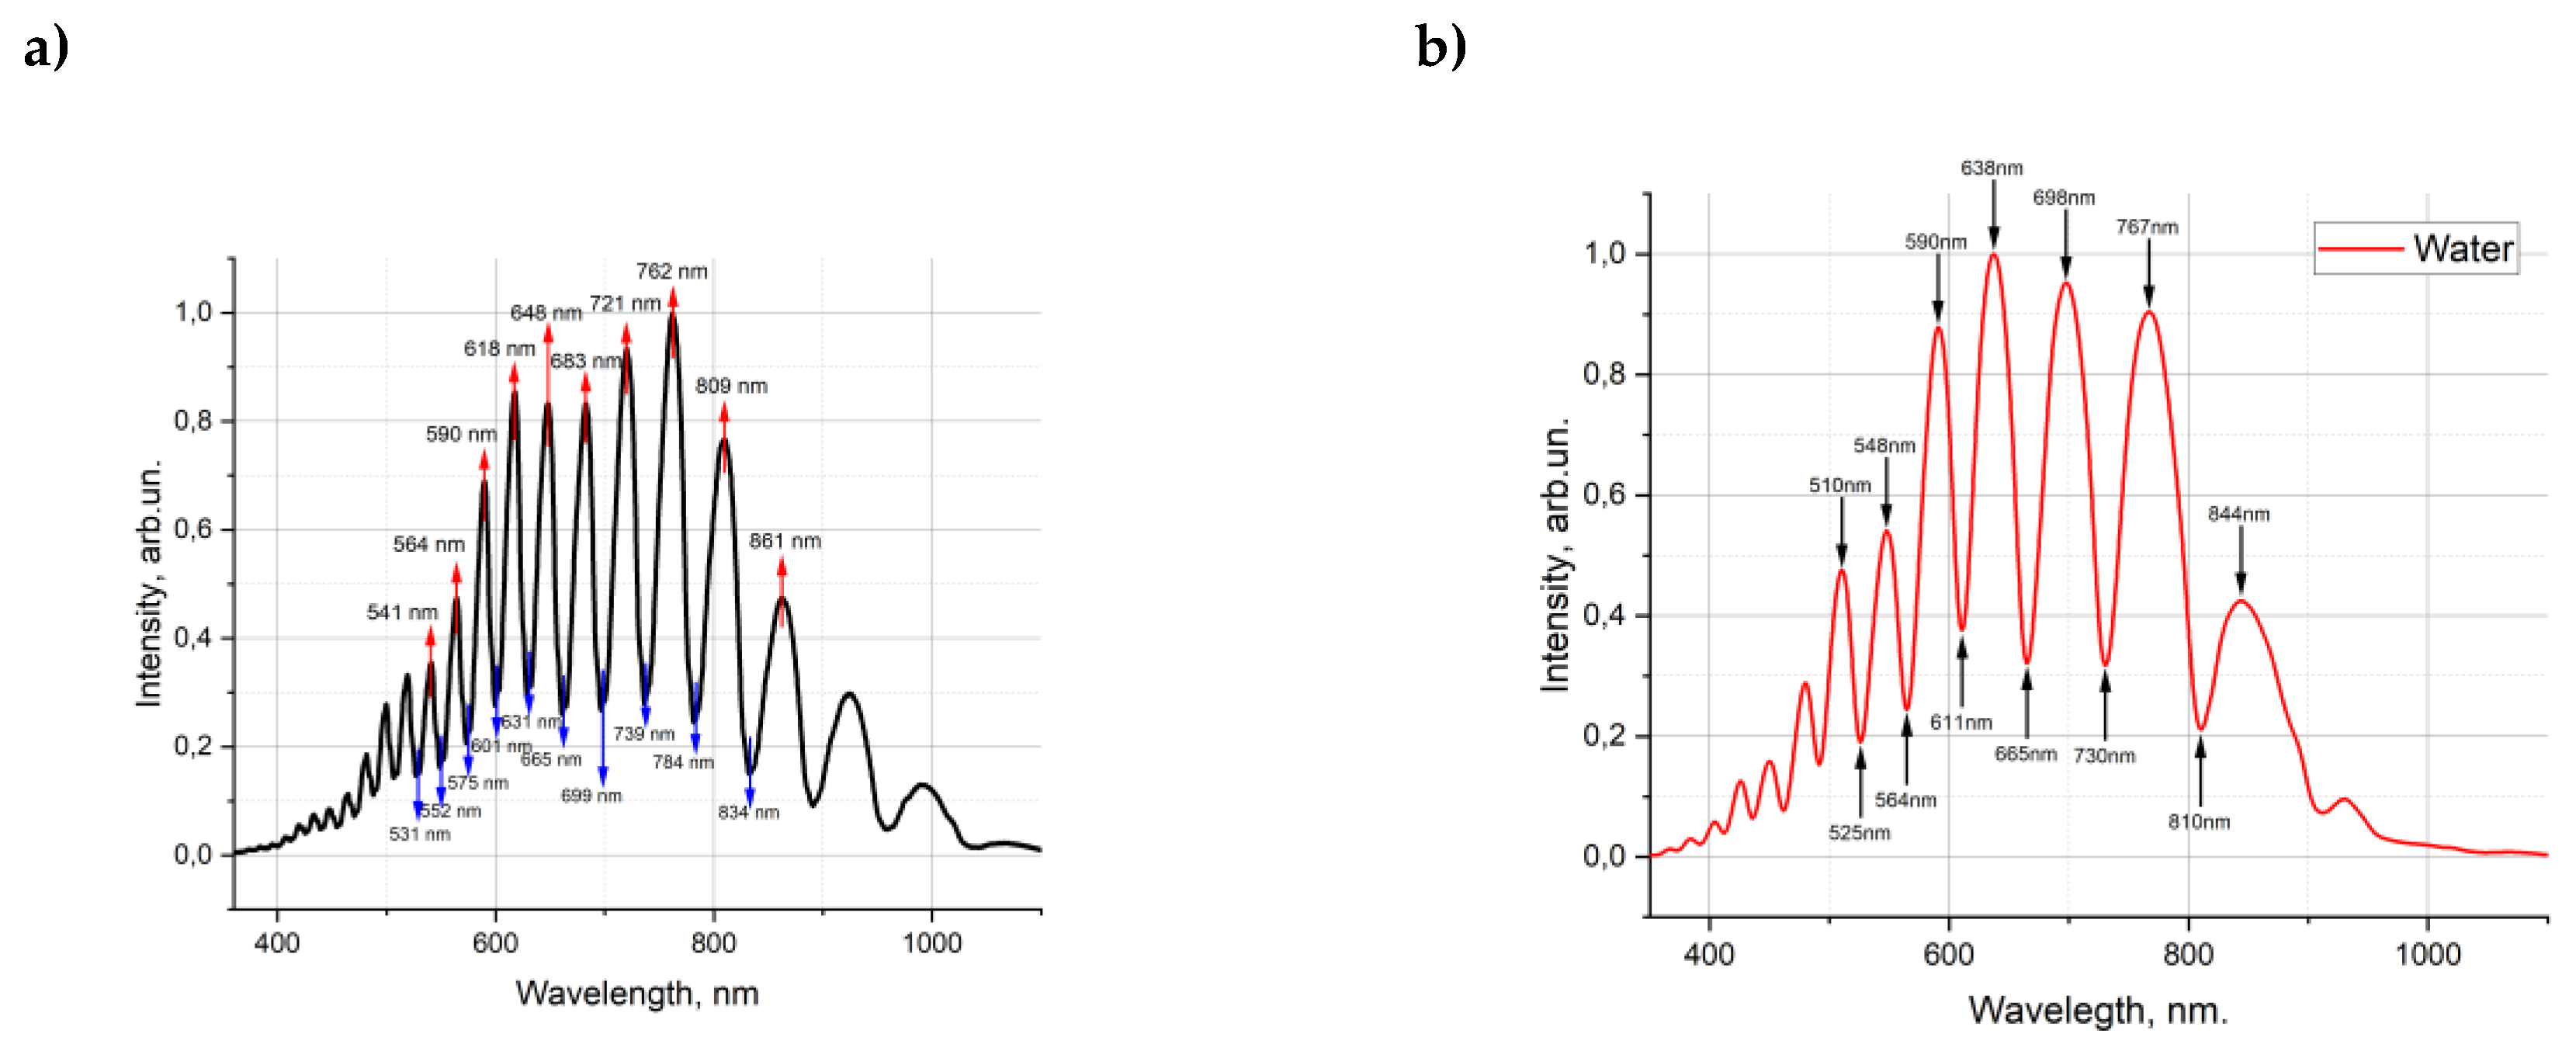
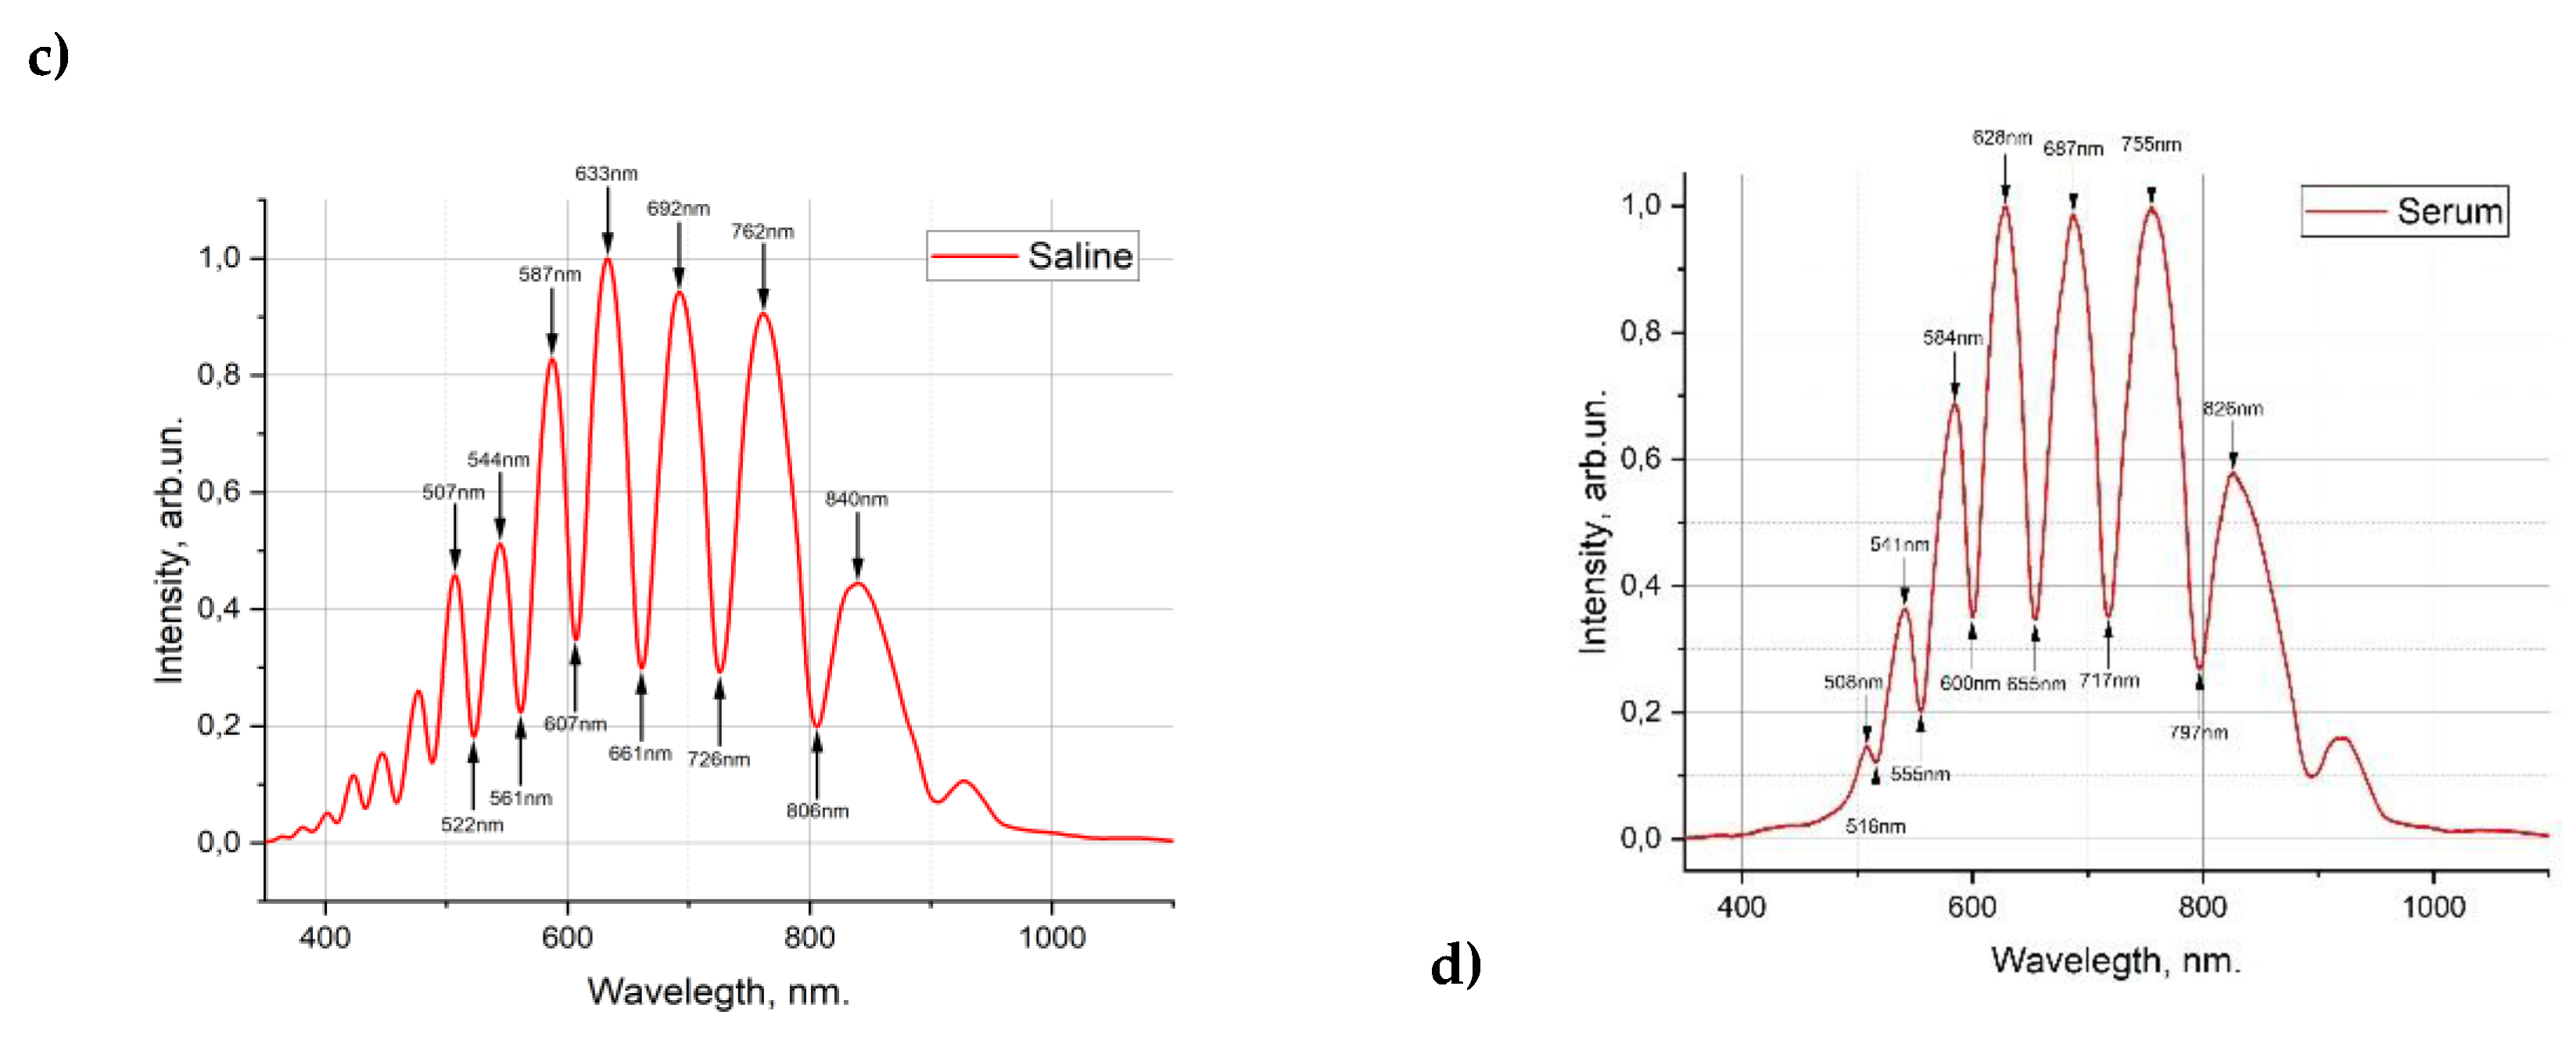
Figure 4.
Investigation of diluted blood serum in the visible range of the spectrum a) In HC- MOW; b) photometry in cuvette.
Figure 4.
Investigation of diluted blood serum in the visible range of the spectrum a) In HC- MOW; b) photometry in cuvette.
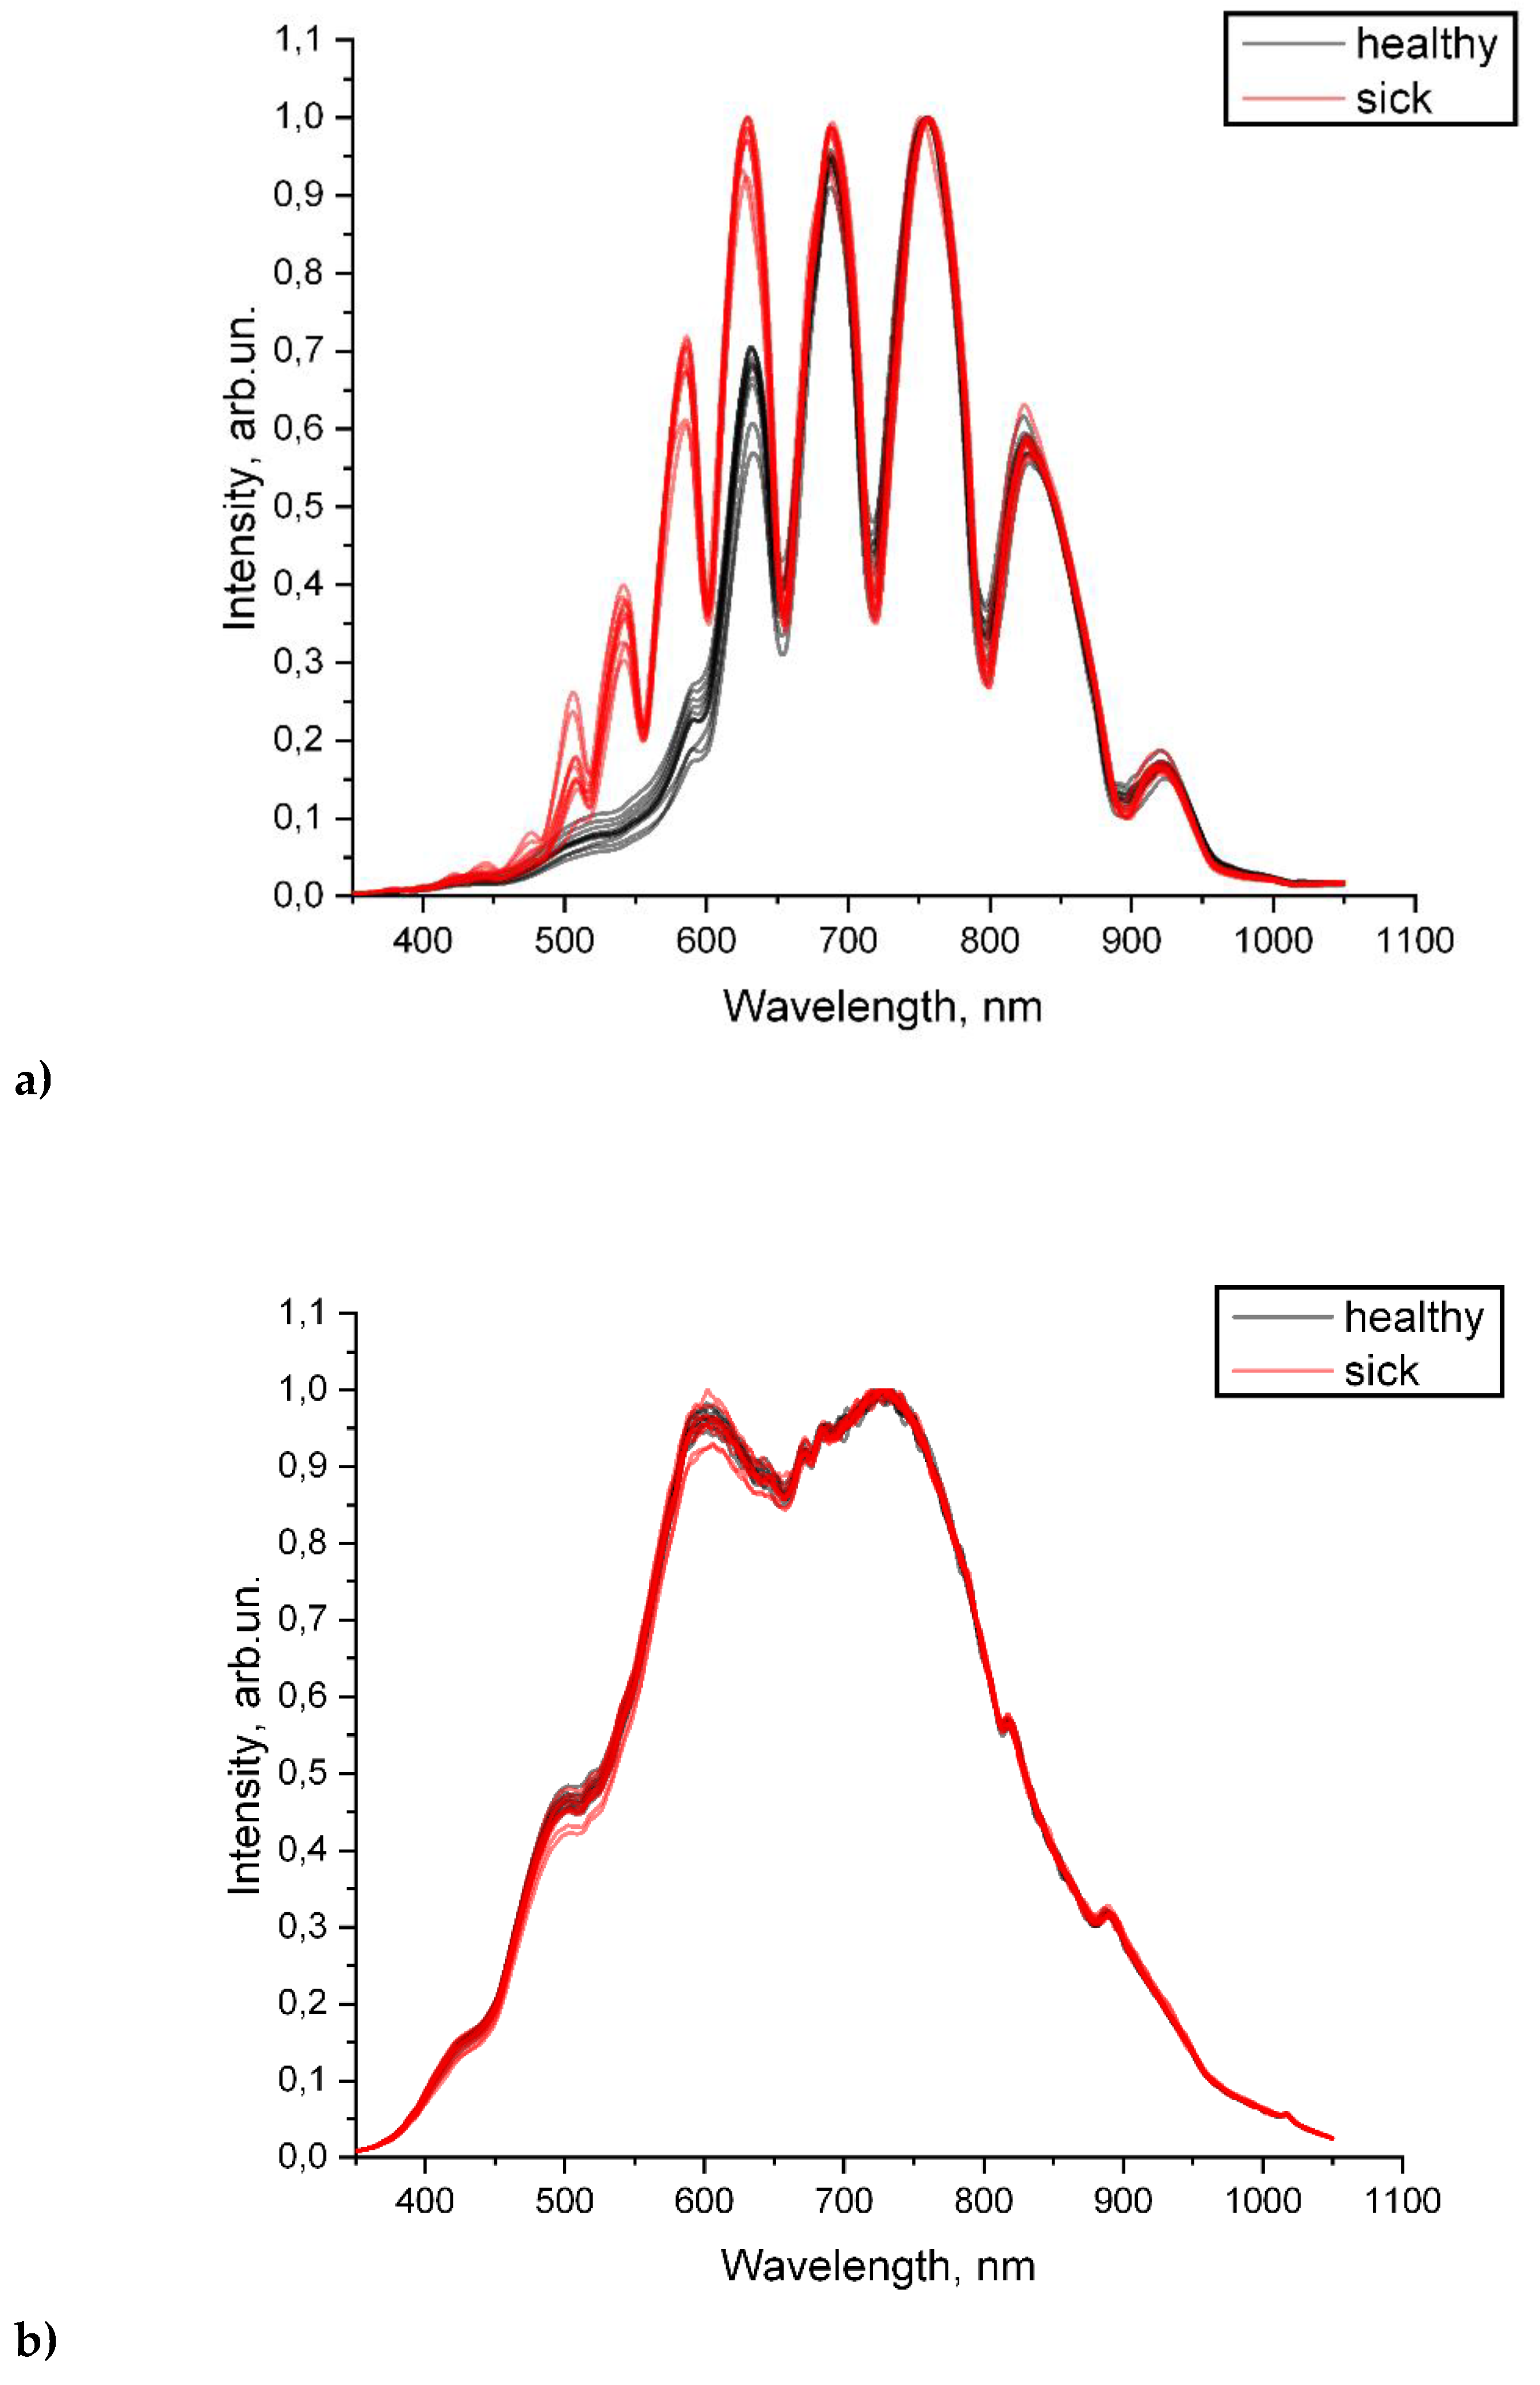
Figure 5.
Optical density of the samples, measured in cuvette.
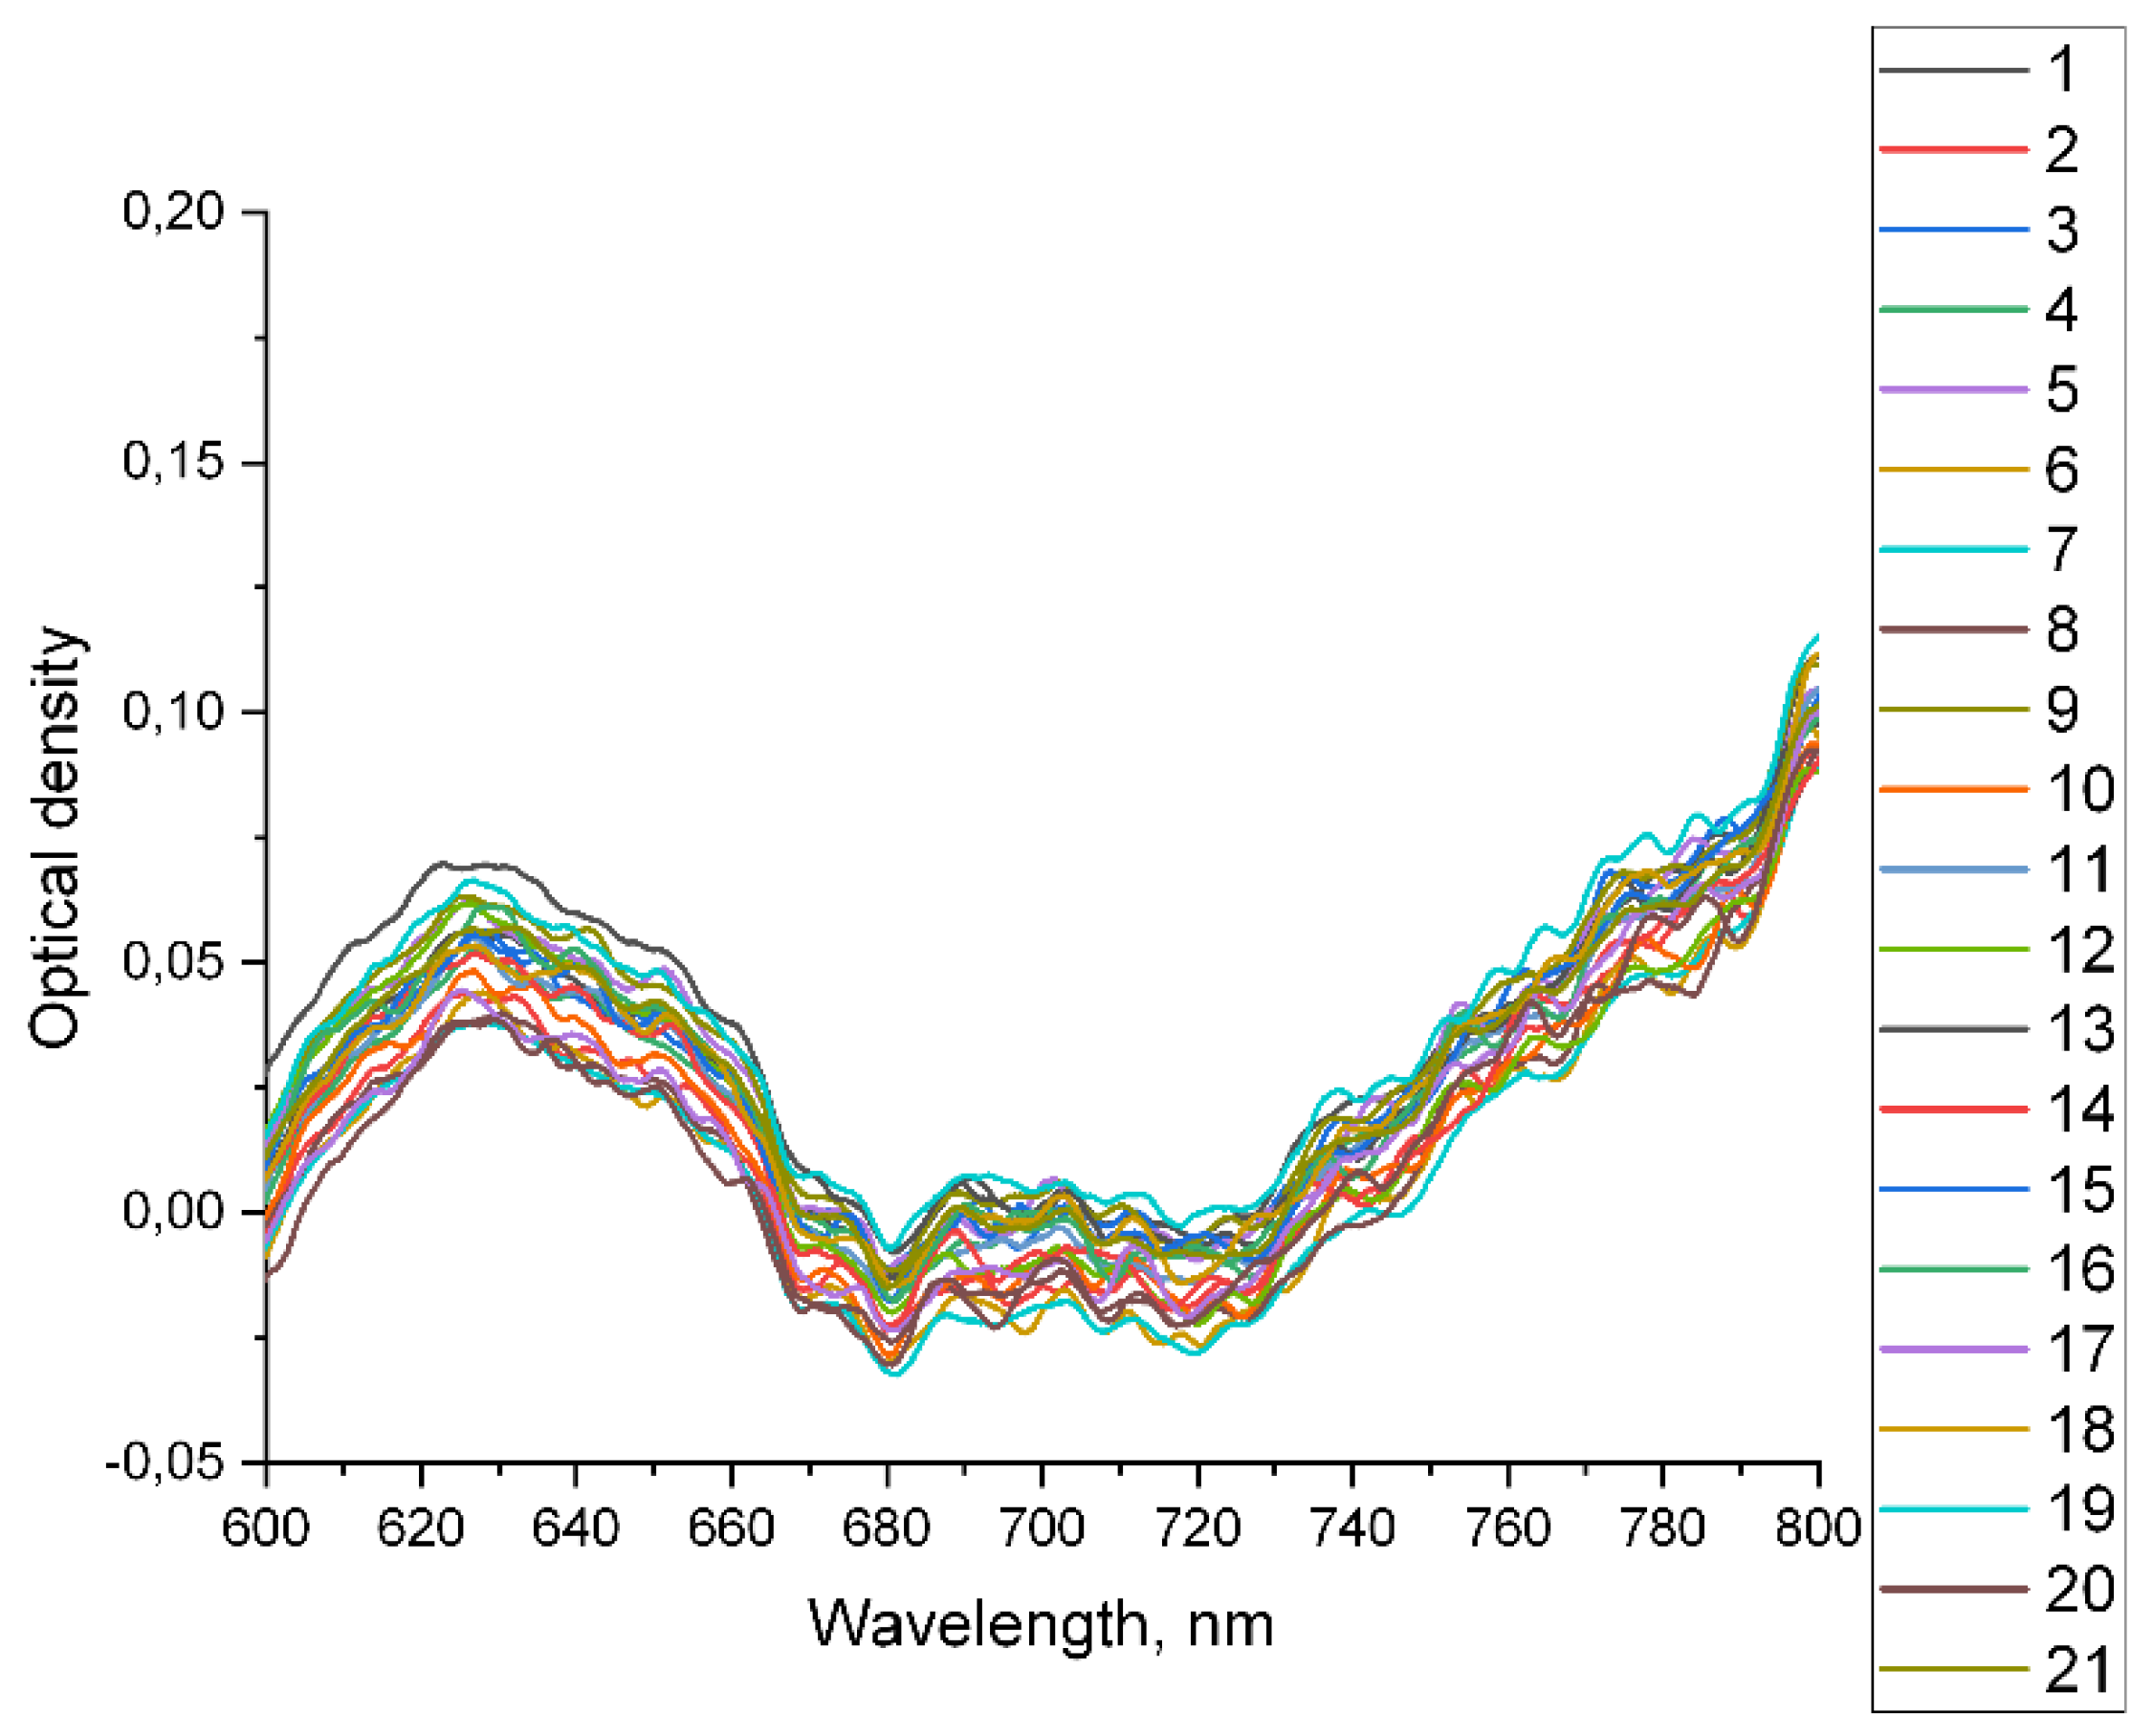
Figure 6.
The position of the transmission maximum and corresponding refractive index. ☐ - Refractive index for «healthy» volunteers. █ - Transmission maximum for «healthy» volunteers. △ - Refractive index for «sick» volunteers. ▲ - Transmission maximum for «sick» volunteers.
Figure 6.
The position of the transmission maximum and corresponding refractive index. ☐ - Refractive index for «healthy» volunteers. █ - Transmission maximum for «healthy» volunteers. △ - Refractive index for «sick» volunteers. ▲ - Transmission maximum for «sick» volunteers.
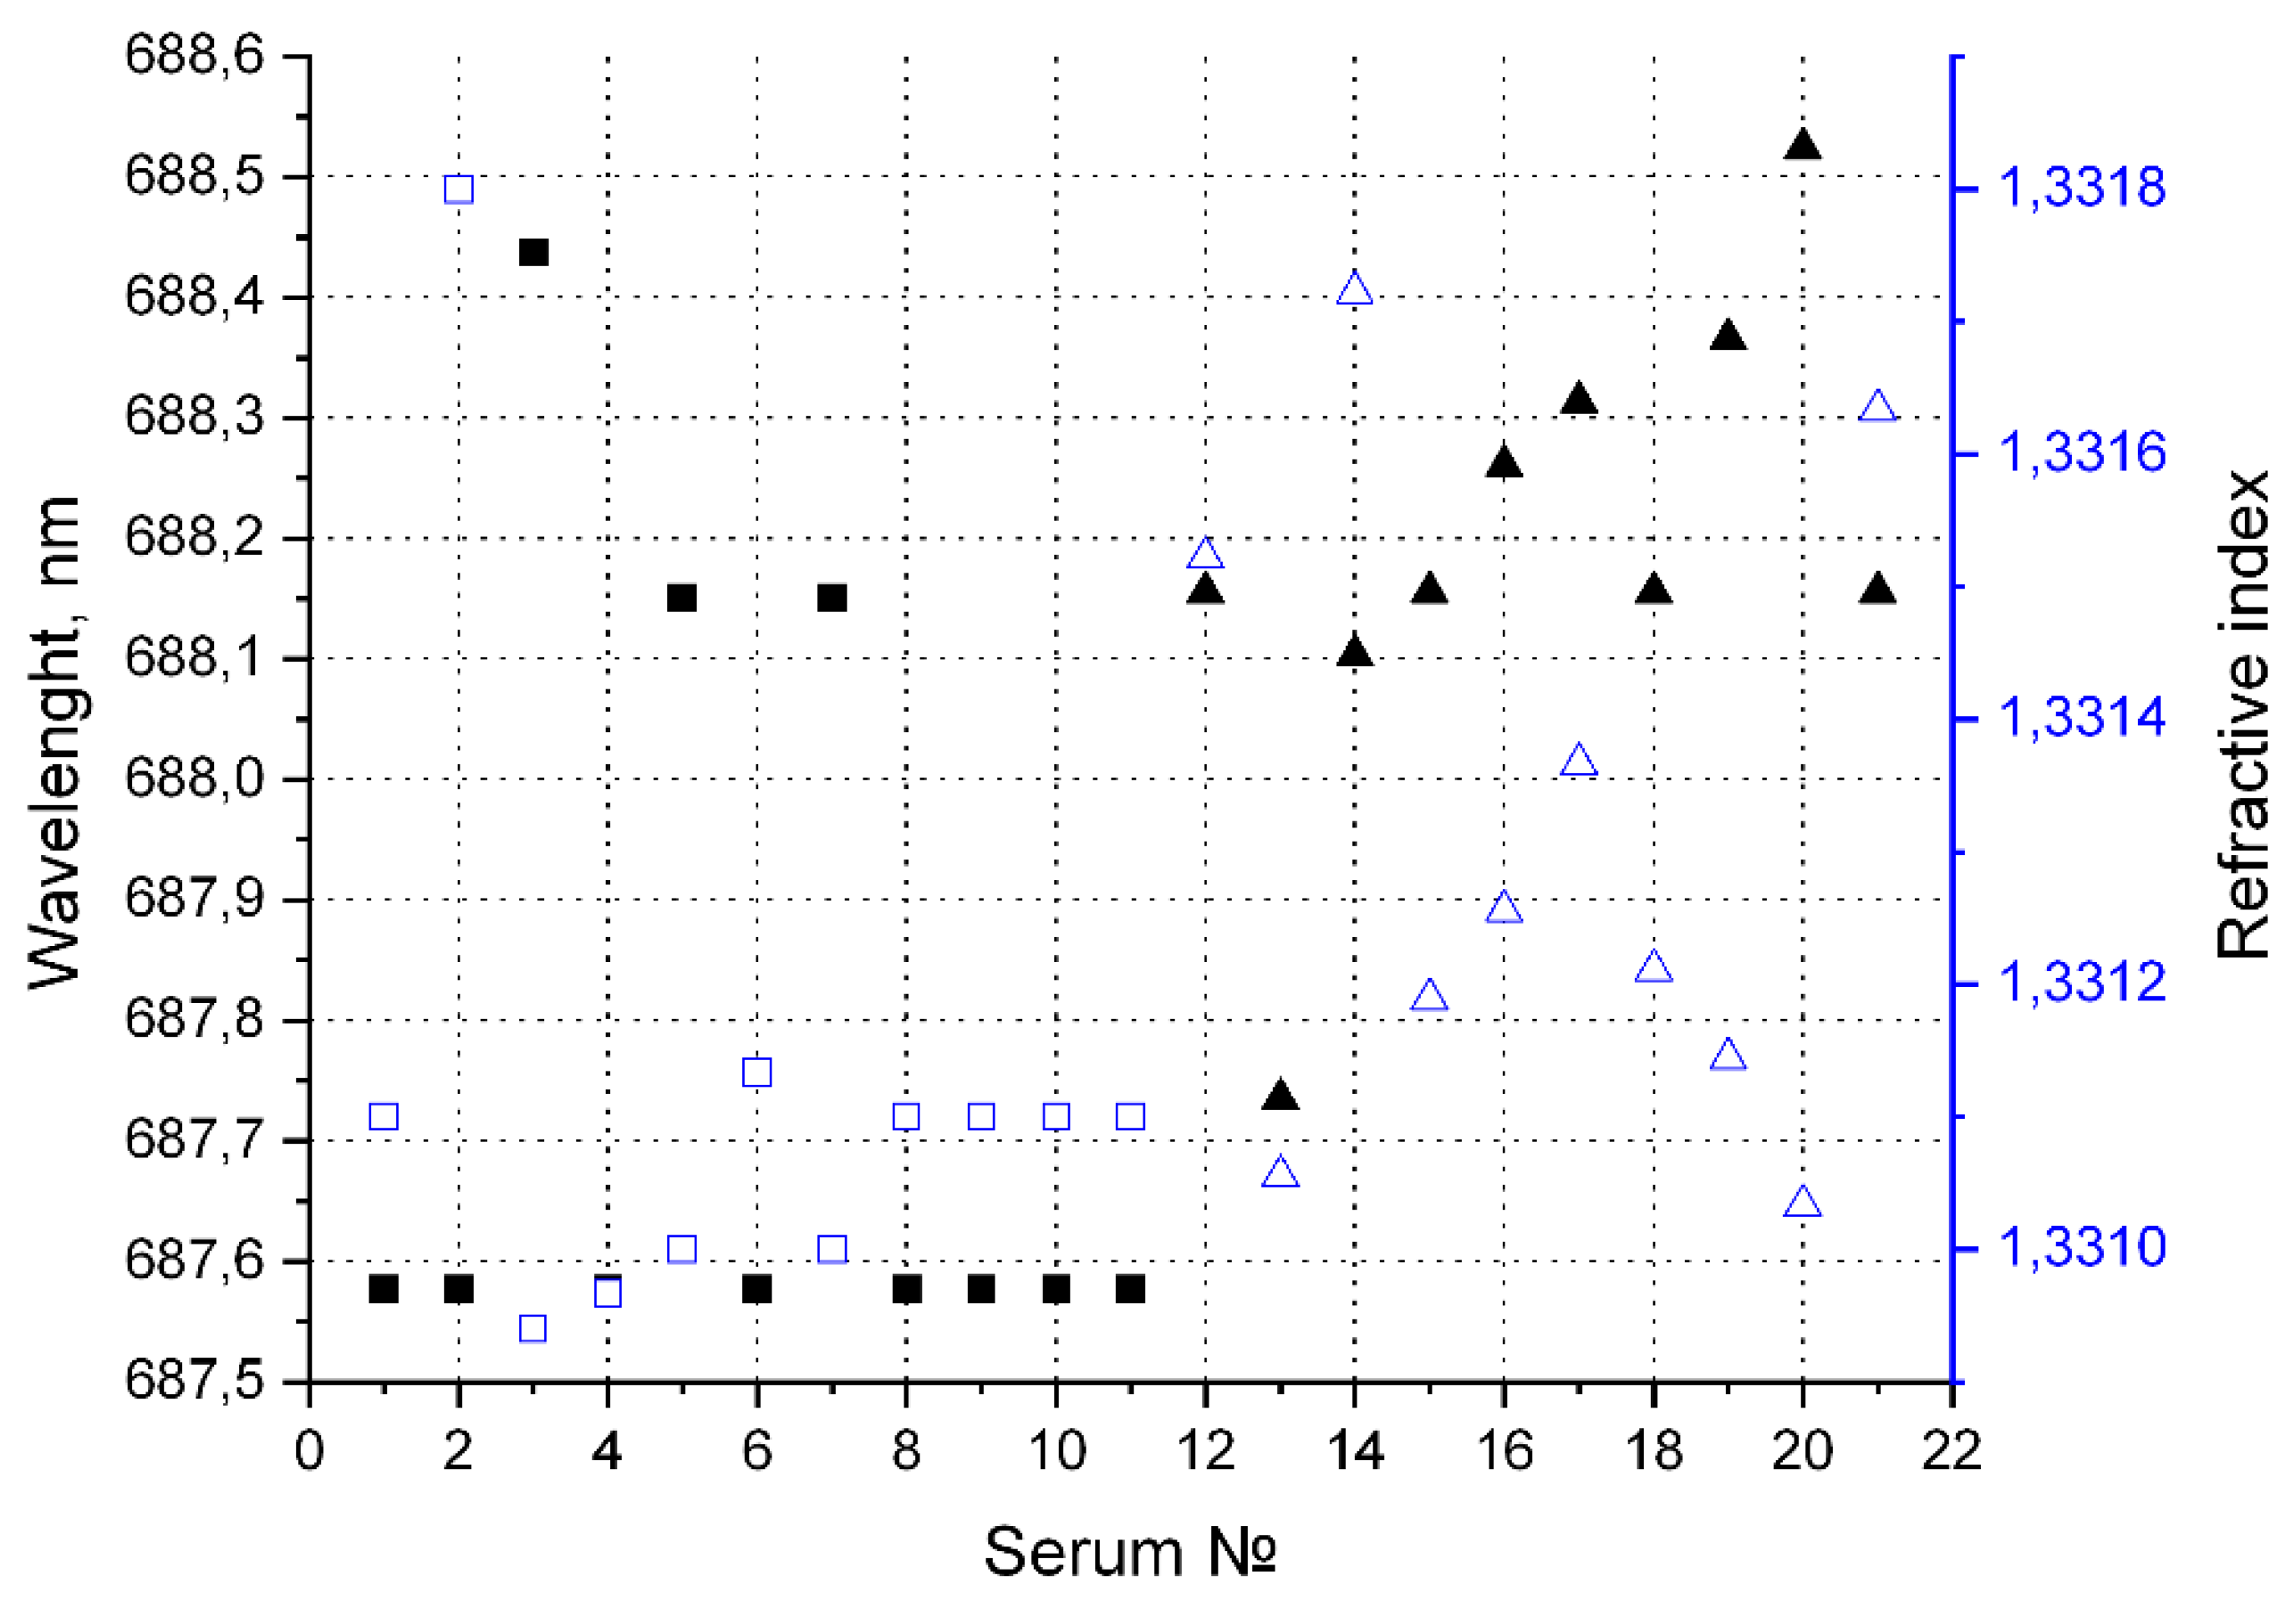
Figure 7.
Intensity of four maxima in the transmission spectra of waveguides filled with the diluted blood serum.
Figure 7.
Intensity of four maxima in the transmission spectra of waveguides filled with the diluted blood serum.
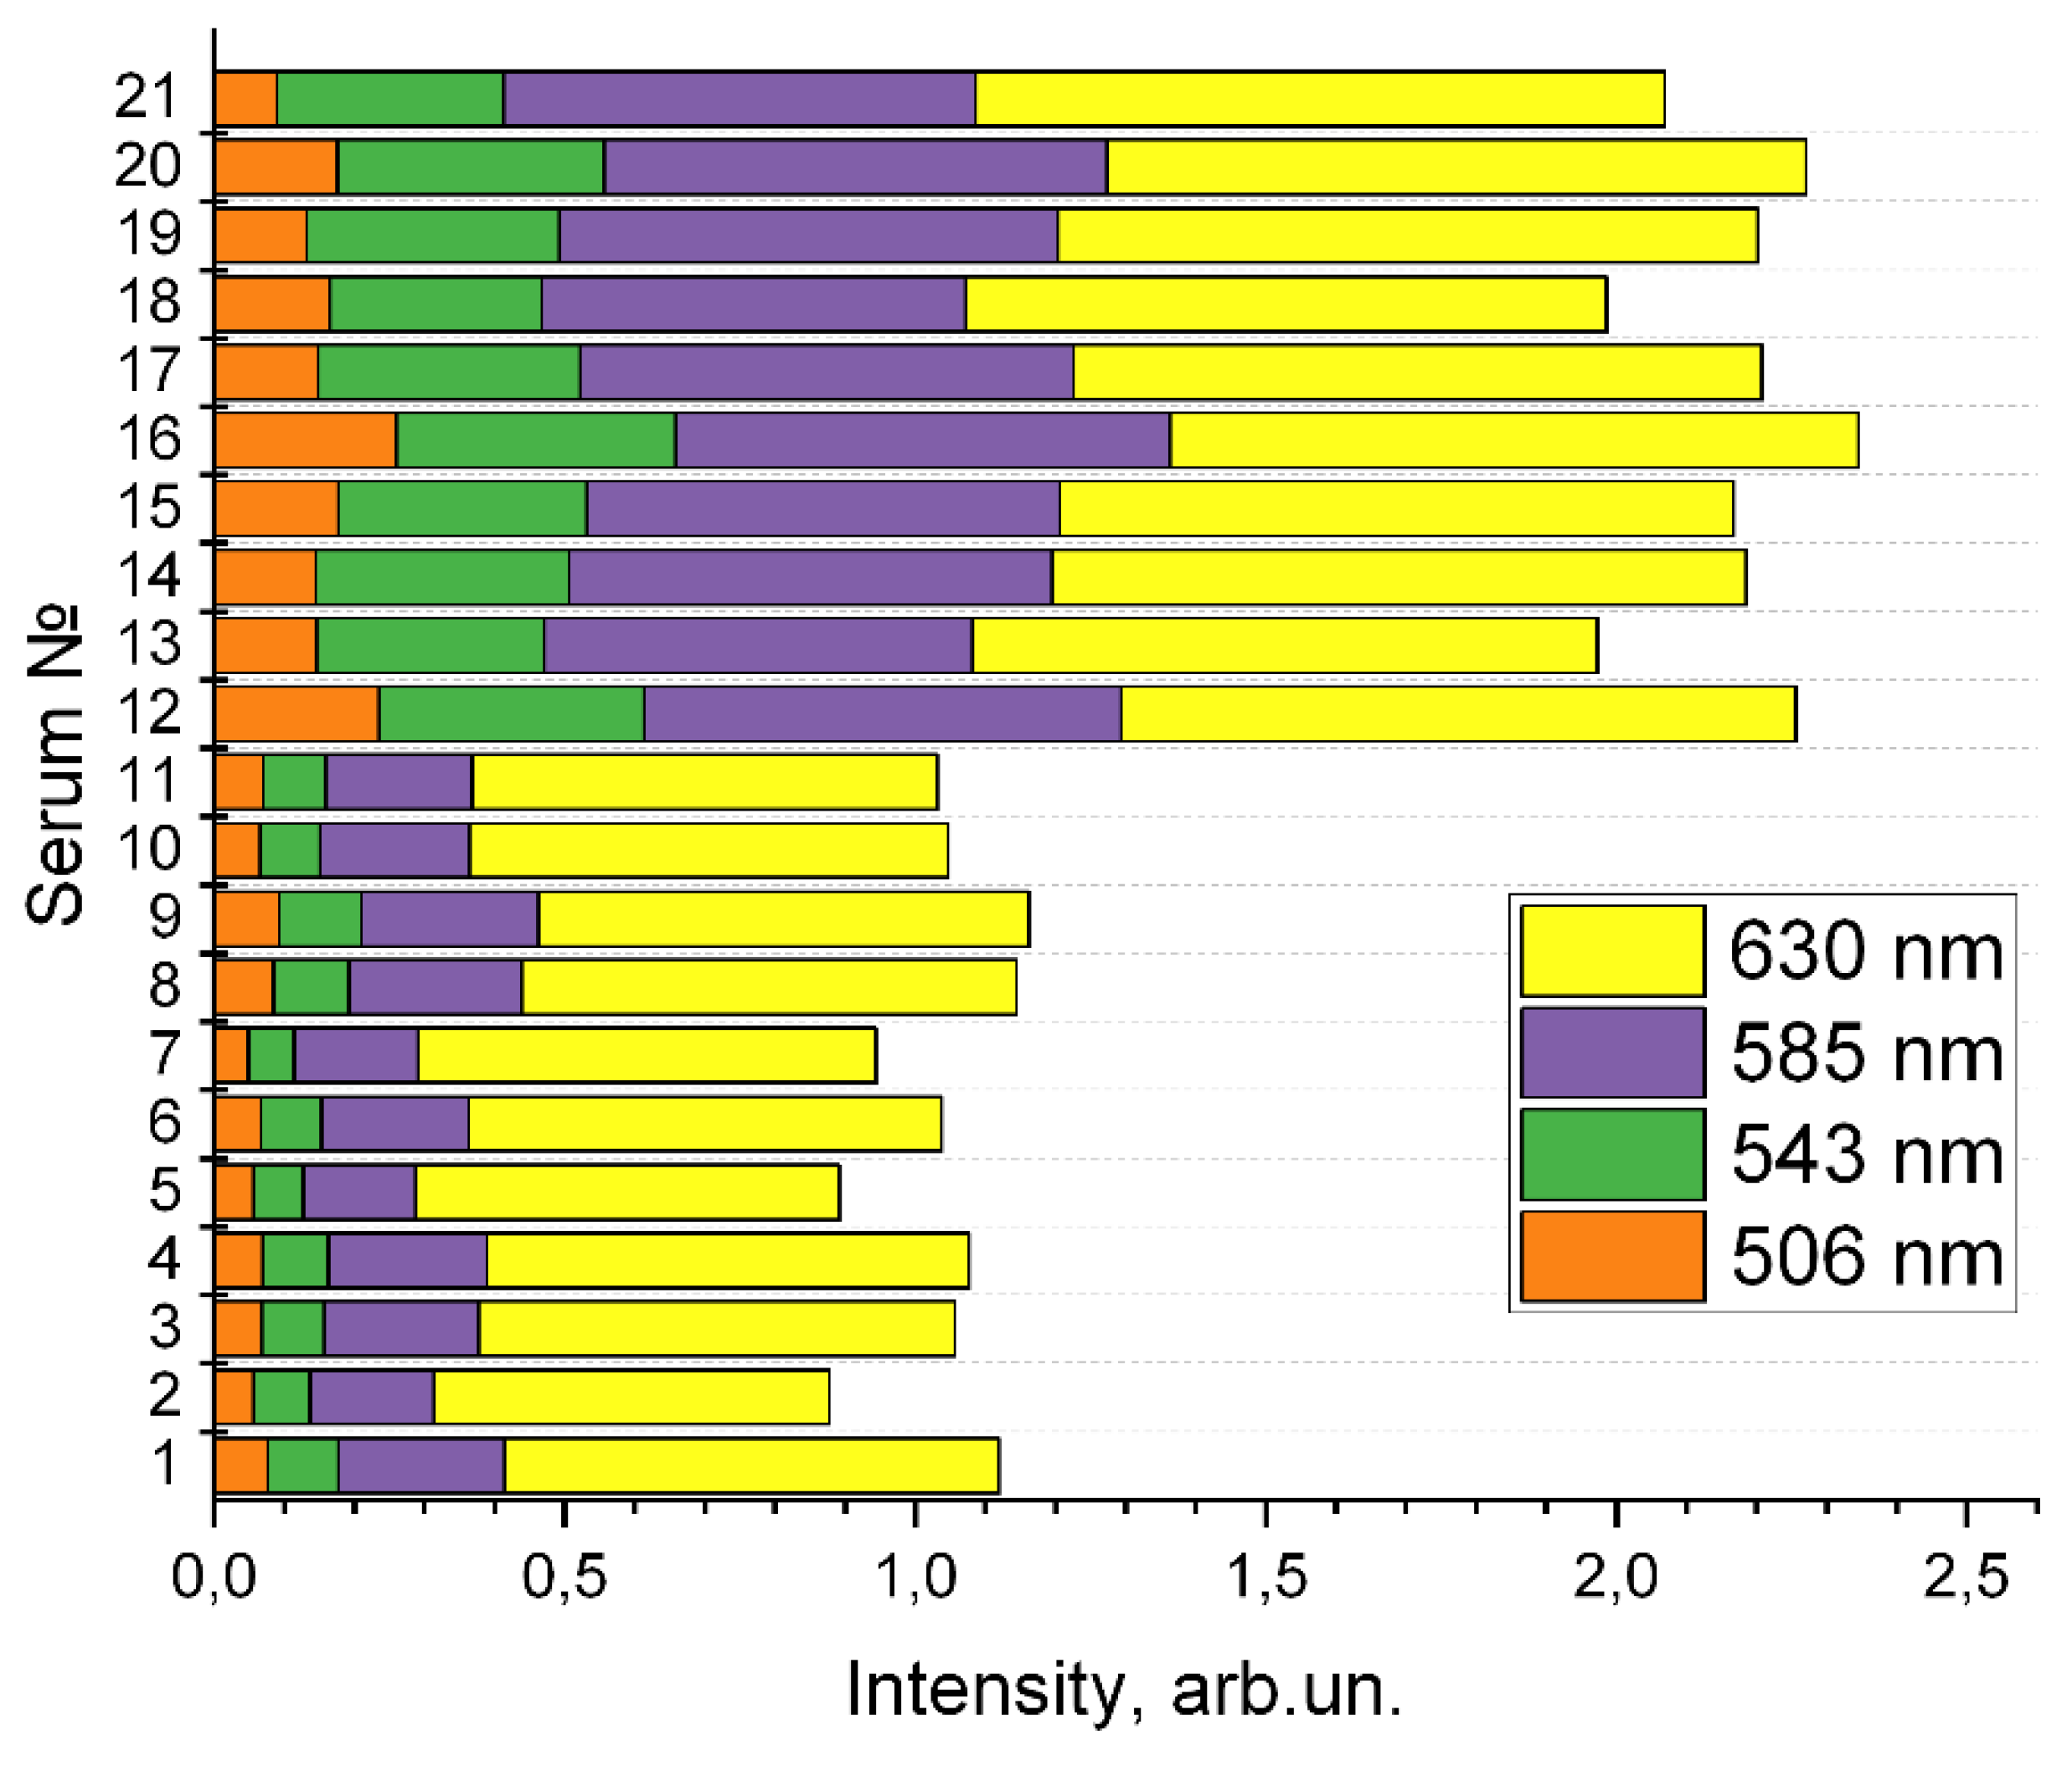
Figure 8.
Transmission spectra of blood serum after conversion.
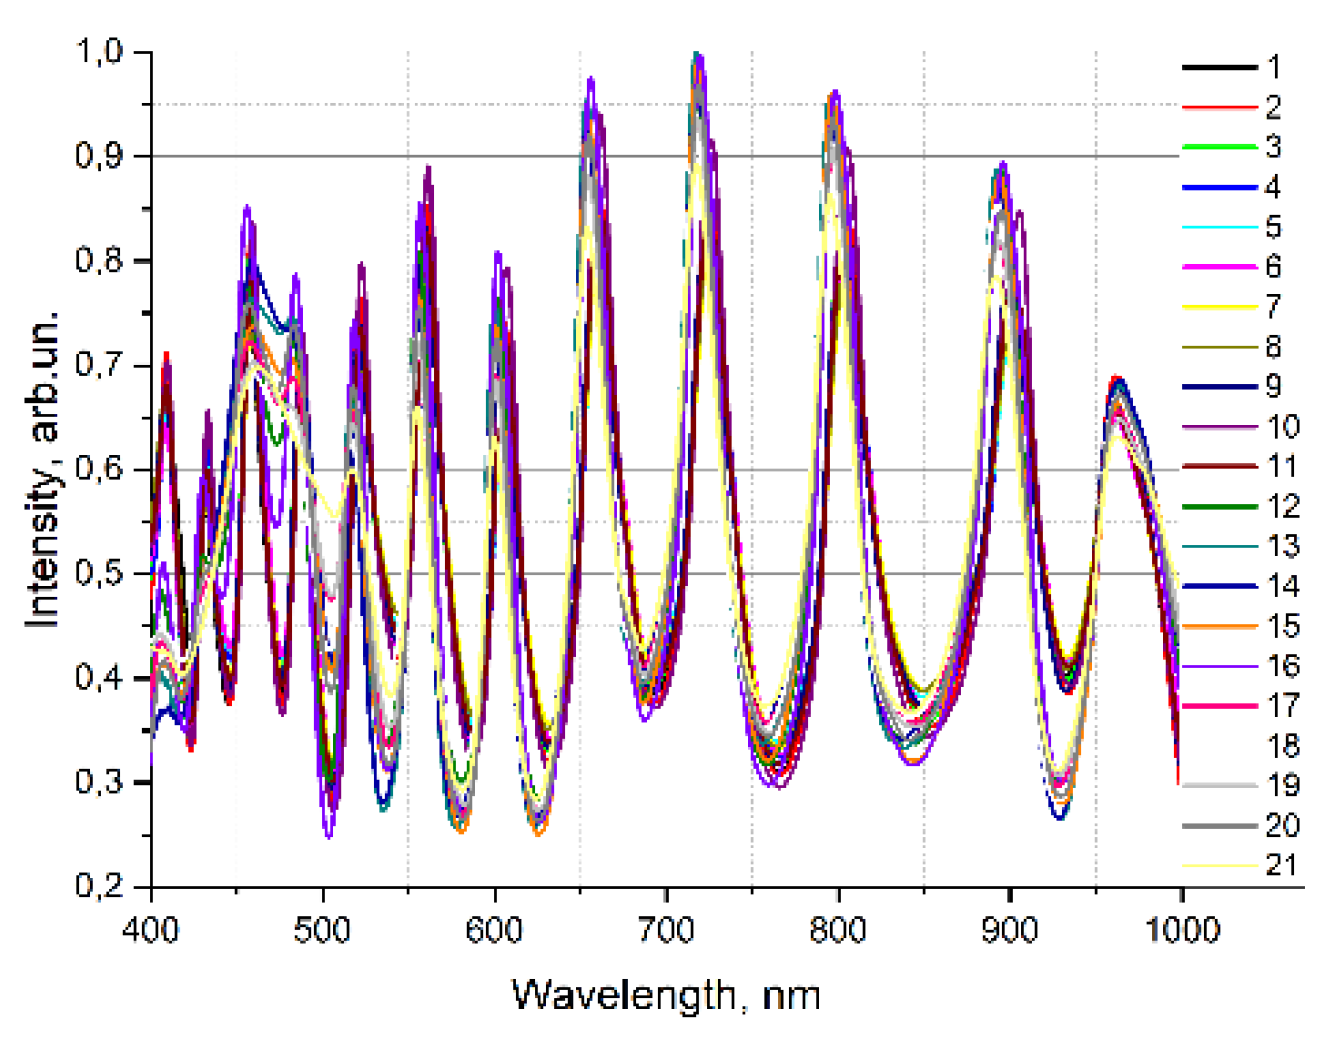
Figure 9.
The average transmission spectra of blood serum sample taken from volunteers of “healthy group” (black) and “sick group” (red).
Figure 9.
The average transmission spectra of blood serum sample taken from volunteers of “healthy group” (black) and “sick group” (red).
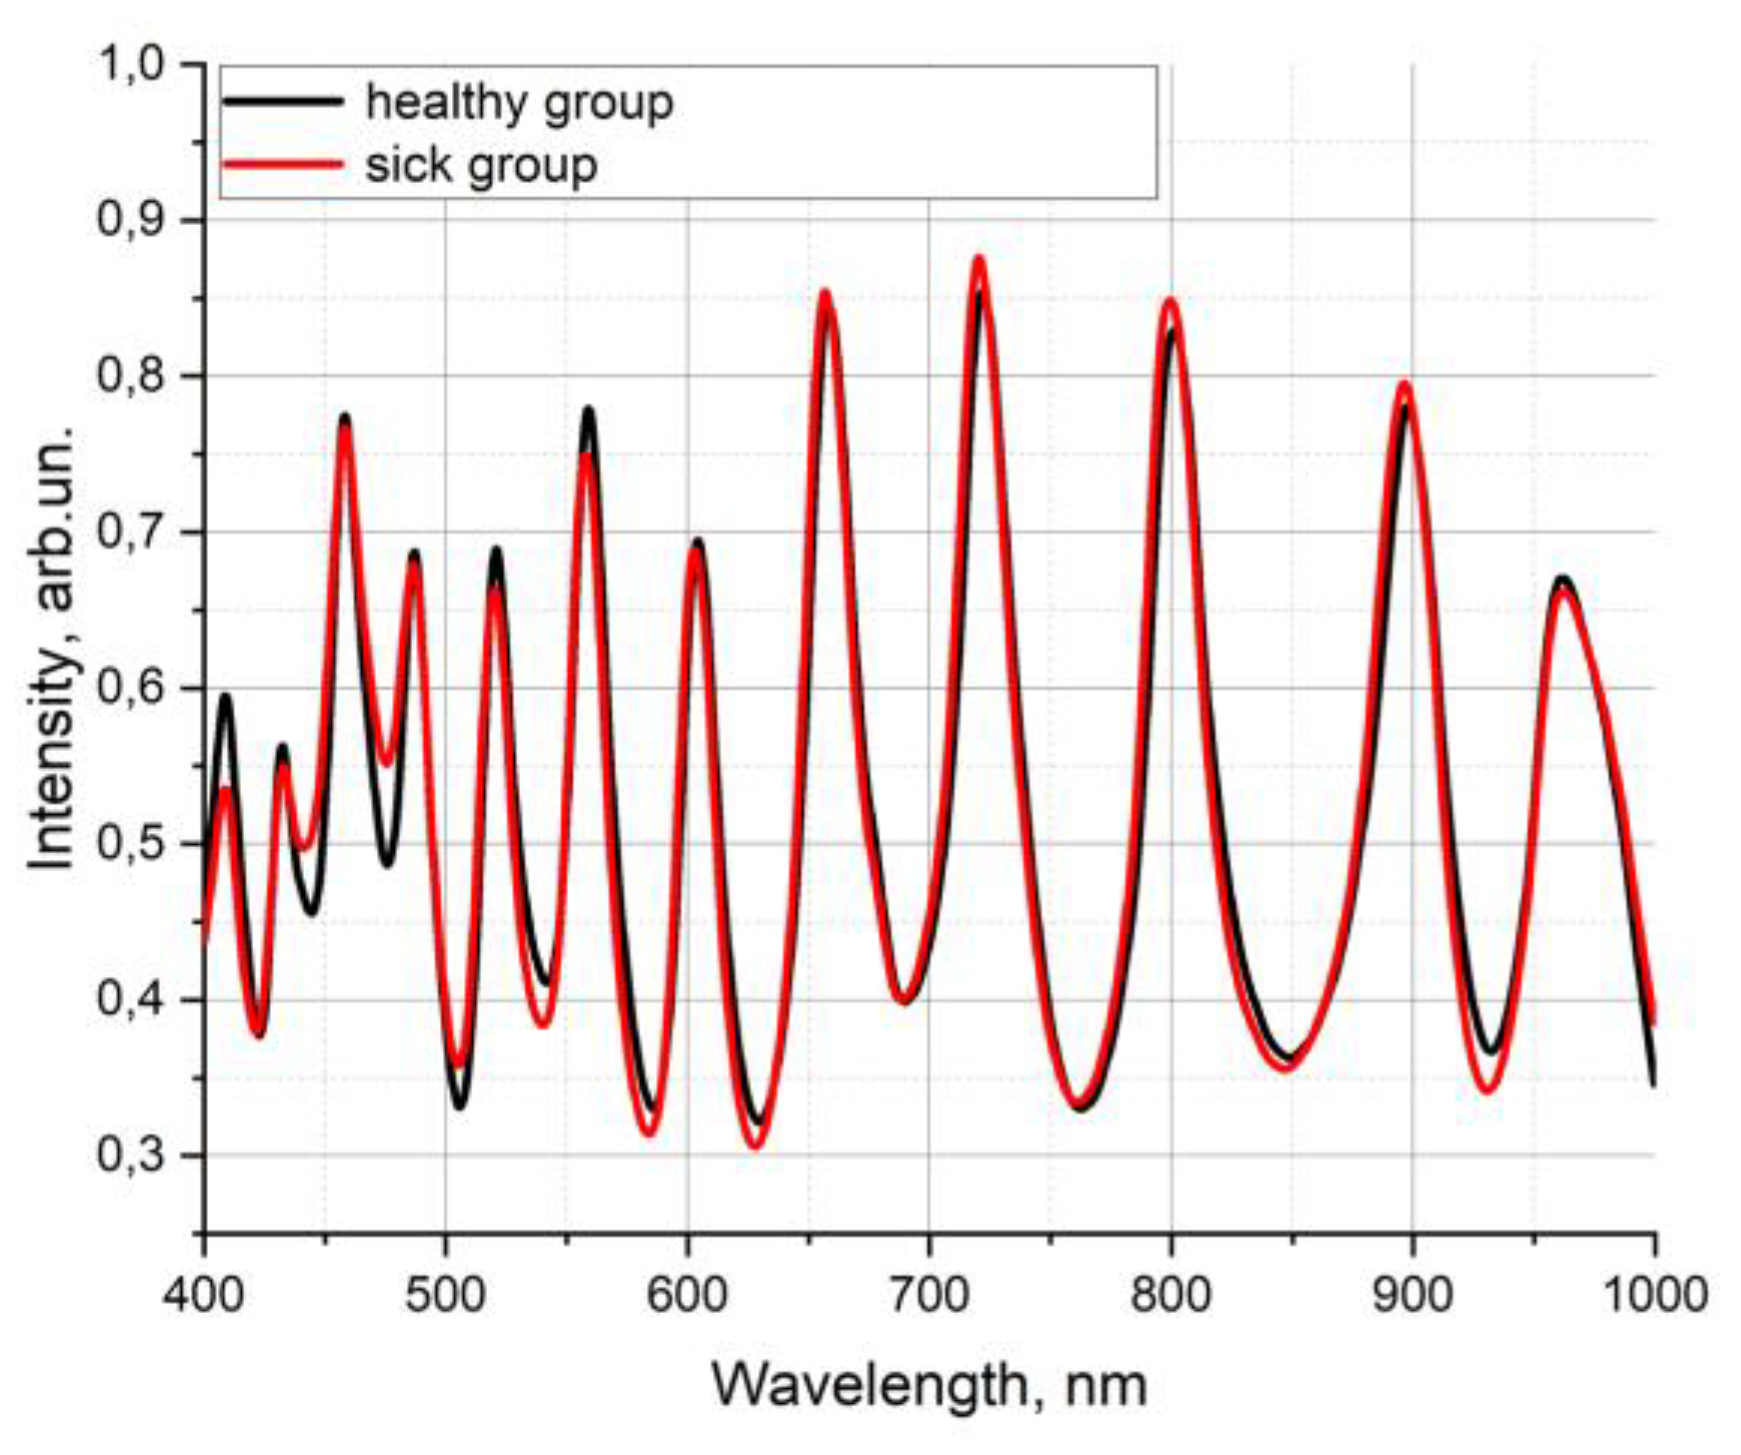
Figure 10.
Explained variance of the data matrix from the number of principal components for blood serum samples.
Figure 10.
Explained variance of the data matrix from the number of principal components for blood serum samples.
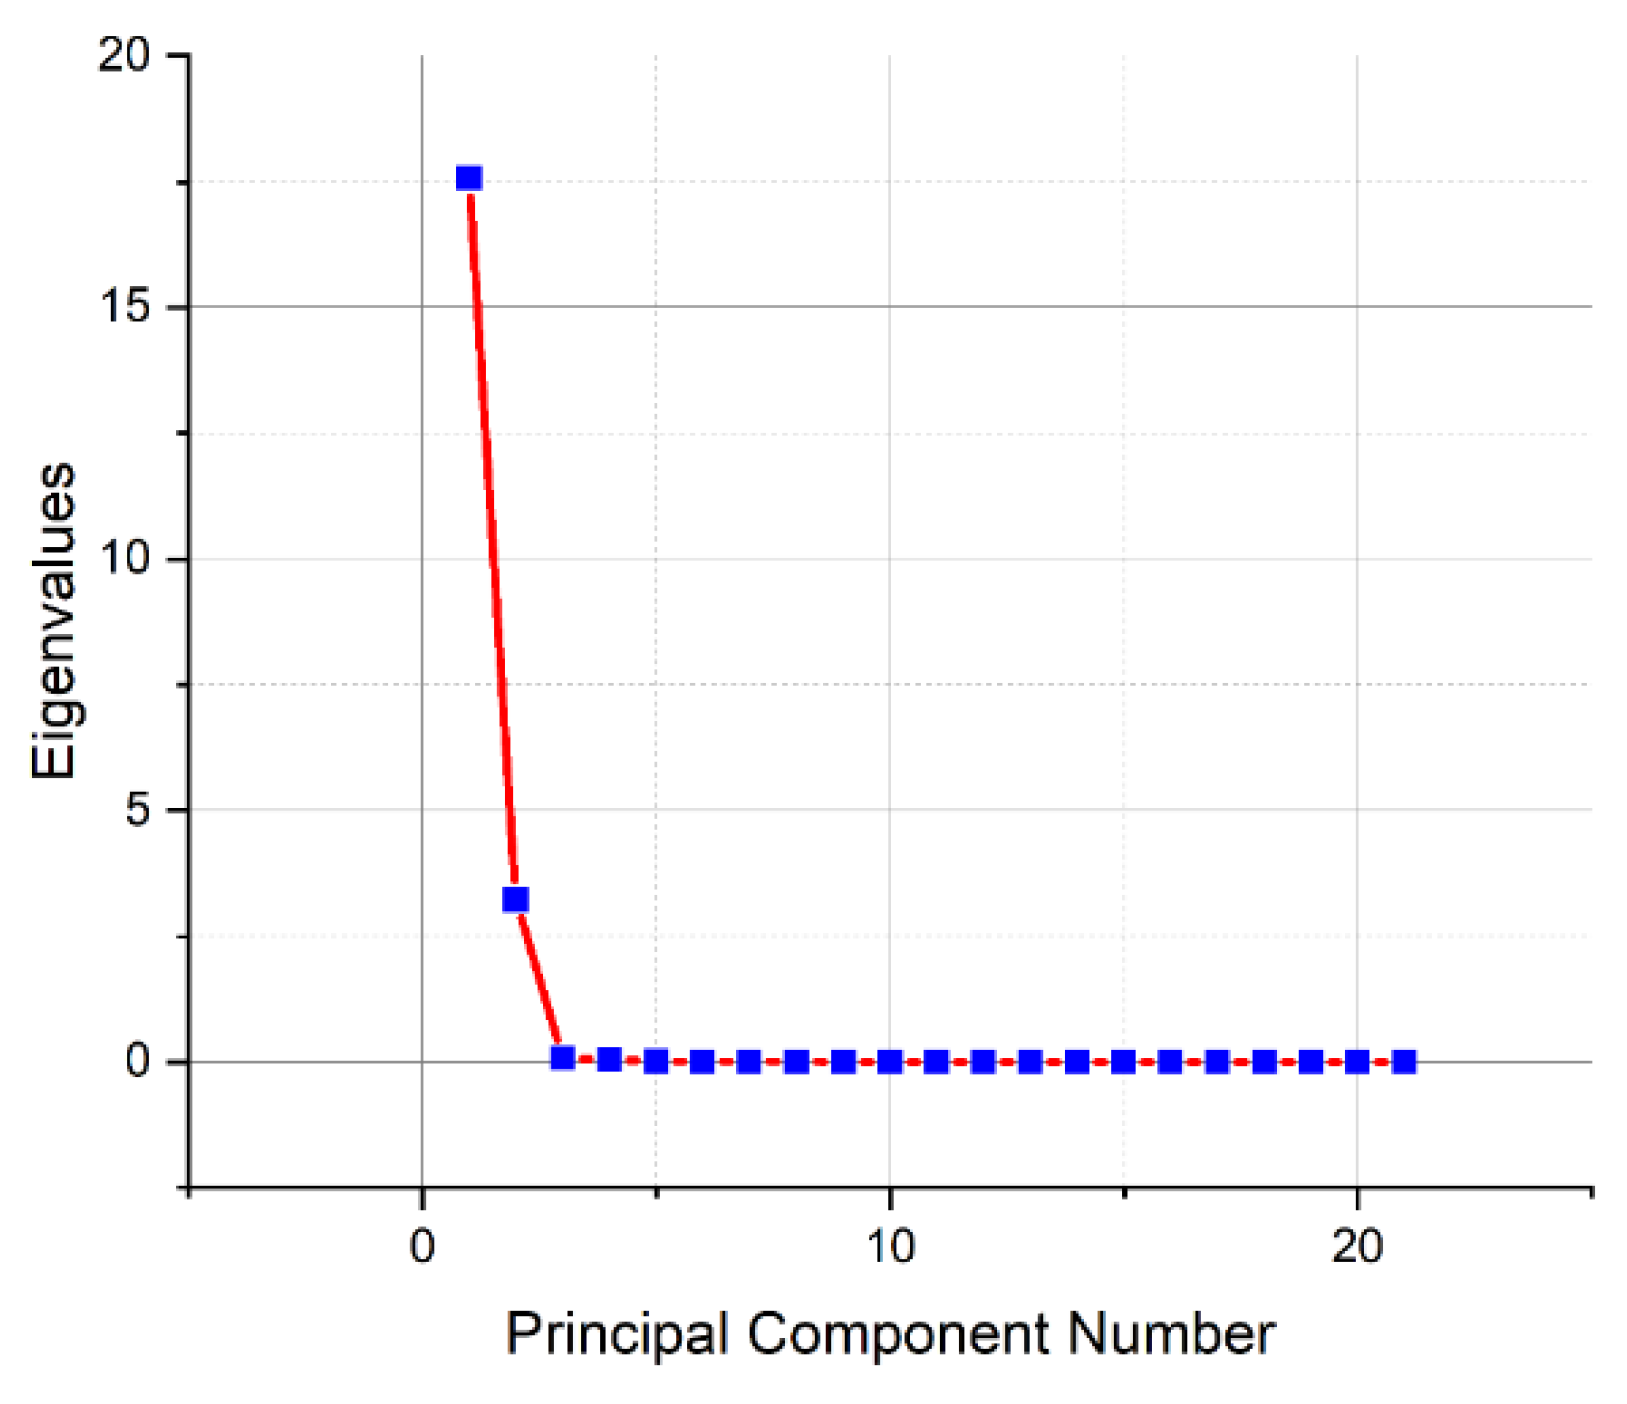
Figure 11.
Graph of counts of blood serum samples in the space of the first and second principal components (a), space of the second and third principal components (b), and space of the first and third principal components (c).
Figure 11.
Graph of counts of blood serum samples in the space of the first and second principal components (a), space of the second and third principal components (b), and space of the first and third principal components (c).
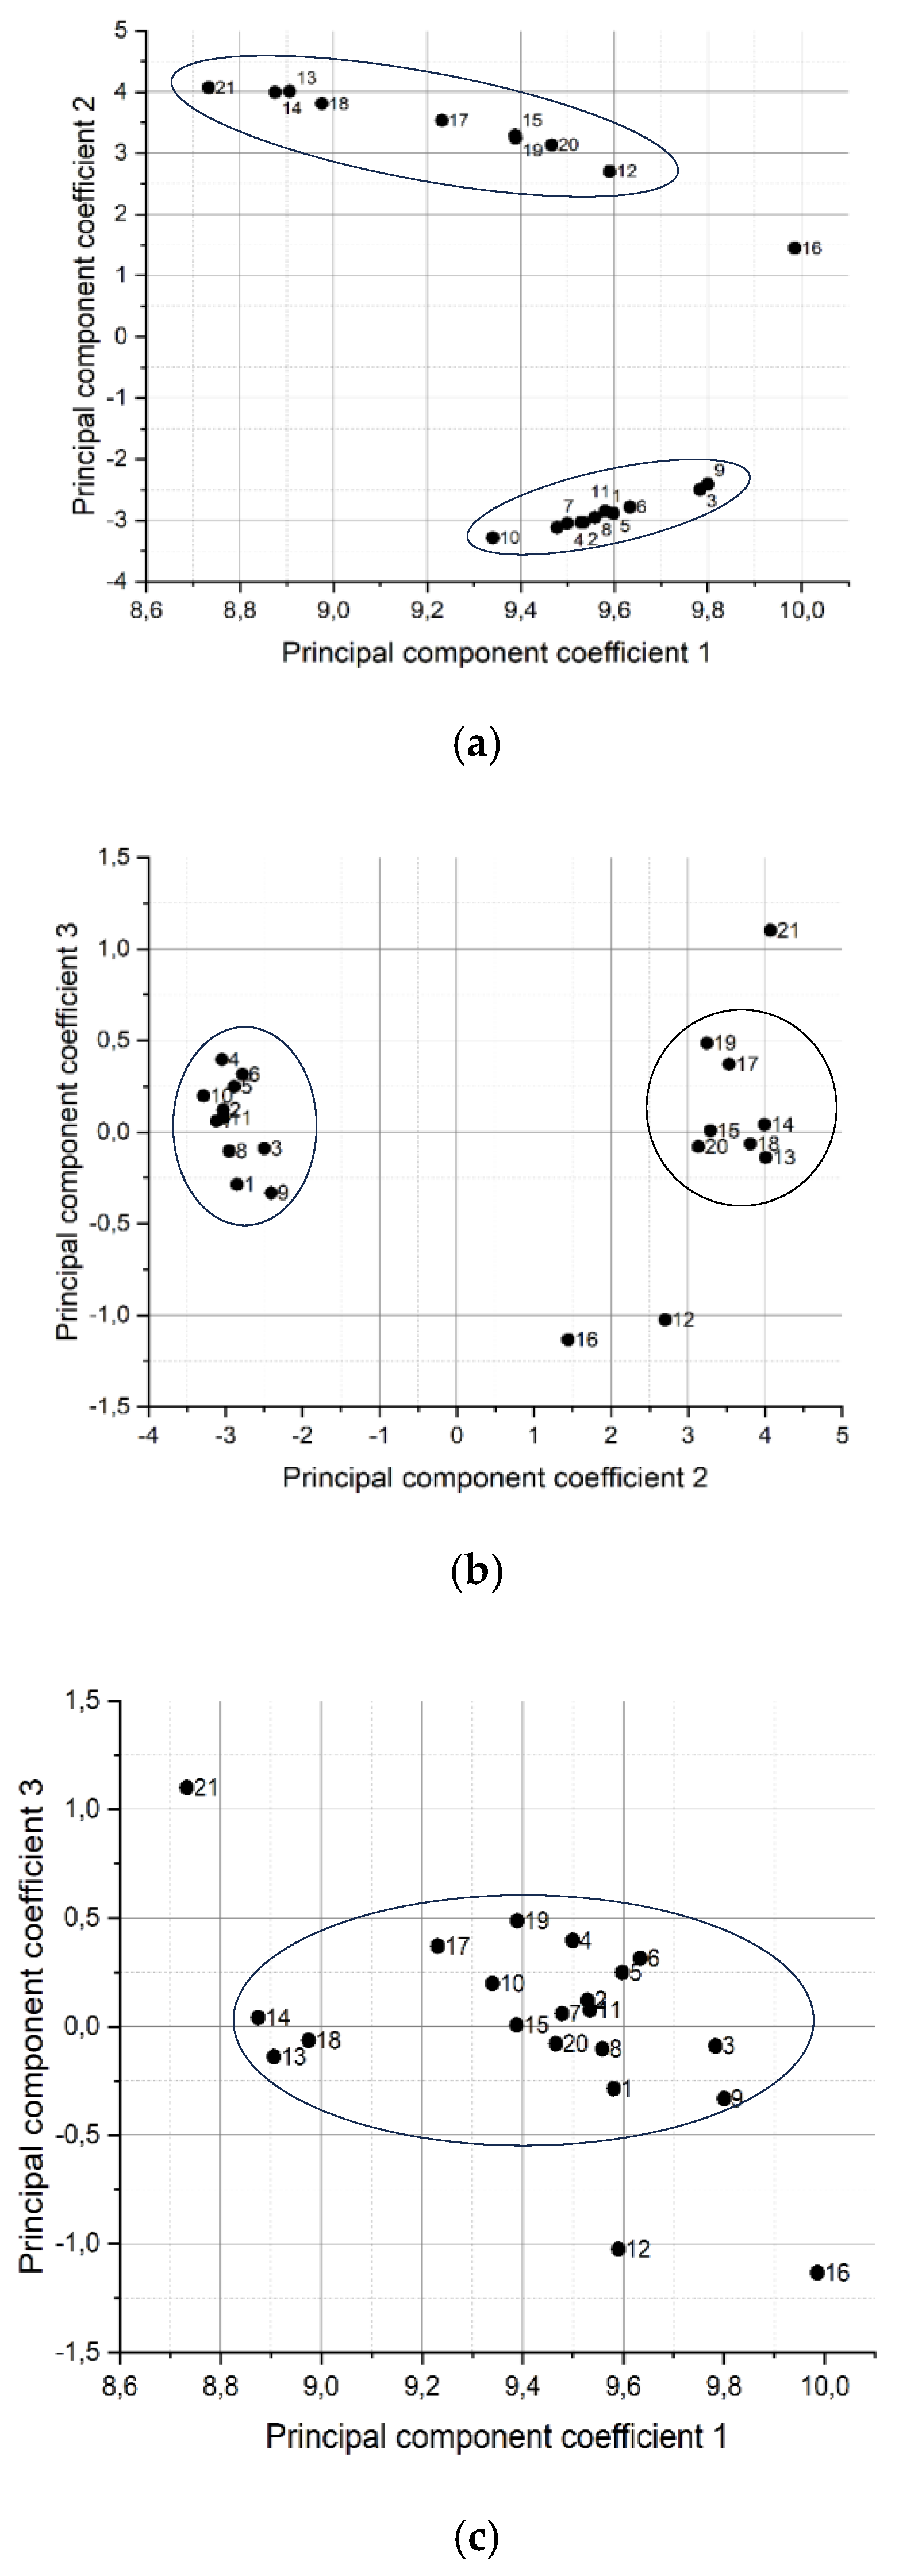

Table 1.
Comparison of calculated and experimentally obtained maxima and minima of empty HC-MOWs.
|
λmax, nm Calculated |
λmin, nm Calculated |
λmax, nm Experimental |
λmin, nm Experimental |
SD λmax |
SD λmin |
| 865 | 837 | 861 | 834 | 2,08 | 1,53 |
| 811 | 786 | 809 | 784 | 1,04 | 1,4 |
| 763 | 741 | 762 | 739 | 0,76 | 1,22 |
| 721 | 701 | 721 | 699 | 1,73 | 1,1 |
| 683 | 665 | 683 | 665 | 0,75 | 1,15 |
| 648 | 633 | 648 | 631 | 0,64 | 1,13 |
| 618 | 603 | 618 | 601 | 0,6 | 1,08 |
| 589 | 576 | 590 | 575 | 1,26 | 0,7 |
| 564 | 552 | 564 | 552 | 1,0 | 0,75 |
| 540 | 529 | 541 | 531 | 0,5 | 1,15 |
Table 2.
The set of biochemical parameters of blood serum of all volunteers without deviations from norm.
Table 2.
The set of biochemical parameters of blood serum of all volunteers without deviations from norm.
| Serum № |
High density lipoproteins, mmol /l |
Triglycerides, mmol /l |
Albumin, g /l |
Magnesium, mmol/l |
Iron, µmol/l |
| 1 | 1,01±0,09 | 1,20±0,07 | 44,01±0,84 | 0,8±0,04 | 20,9±1,15 |
| 2 | 1,35±0,1 | 0,96±0,03 | 49,22±0,76 | 0,79±0,03 | 16,1±1,01 |
| 3 | 1,78±0,12 | 1,93±0,08 | 43,36±0,89 | 0,79±0,05 | 15,2±0,9 |
| 4 | 1,54±0,08 | 1,32±0,04 | 42,02±0,9 | 0,79±0,05 | 15,8±1,19 |
| 5 | 2,03±0,07 | 2,01±0,1 | 51,30±0,63 | 0,77±0,03 | 17,4±1,16 |
| 6 | 1,85±0,03 | 1,37±0,02 | 41,26±0,59 | 0,79±0,04 | 19,1±1,50 |
| 7 | 2,05±0,09 | 1,52±0,1 | 53,03±0,69 | 0,77±0,02 | 14,7±1,02 |
| 8 | 1,12±0,10 | 1,43±0,07 | 41,02±0,74 | 0,78±0,01 | 15,2±1,30 |
| 9 | 2,07±0,08 | 0,96±0,03 | 50,56±0,89 | 0,81±0,06 | 15,6±0,56 |
| 10 | 1,07±0,04 | 1,15±0,04 | 46,23±0,6 | 0,78±0,02 | 20,7±0,63 |
| 11 | 1,59±0,05 | 1,54±0,05 | 45,36±0,55 | 0,79±0,03 | 18,6±0,89 |
| 12 | 1,11±0,03 | 1,98±0,03 | 43,95±0,45 | 0,90±0,03 | 8,91±1,16 |
| 13 | 2,03±0,12 | 0,71±0,01 | 42,96±0,98 | 0,84±0,06 | 10,1±1,03 |
| 14 | 1,28±0,09 | 1,23±0,02 | 40,46±0,66 | 0,86±0,08 | 11,7±0,64 |
| 15 | 1,09±0,02 | 2,17±0,09 | 40,71±0,076 | 1,00±0,02 | 13,6±0,75 |
| 16 | 1,18±0,03 | 1,73±0,03 | 42,69±0,58 | 0,83±0,09 | 5,74±0,56 |
| 17 | 1,12±0,02 | 0,64±0,04 | 50,36±0,35 | 0,98±0,03 | 5,71±0,43 |
| 18 | 1,52±0,05 | 1,27±0,02 | 48,21±0,45 | 0,84±0,04 | 15,21±0,95 |
| 19 | 1,53±0,02 | 0,71±0,03 | 46,62±0,63 | 0,85±0,03 | 17,19±1,23 |
| 20 | 2,01±0,15 | 0,58±0,05 | 42,43±0,79 | 0,84±0,02 | 12,21±1,34 |
| 21 | 1,11±0,03 | 0,99±0,04 | 46,35±0,58 | 0,83±0,01 | 17,22±1,57 |
| Norm values | 0,9-2,10 | 1-2,3 | 32-46 | 0,66-1,07 | 9,0-30,4 |
Table 3.
The set of biochemical parameters of blood serum of all volunteers with deviations for 11 of volunteers.
Table 3.
The set of biochemical parameters of blood serum of all volunteers with deviations for 11 of volunteers.
| Serum № |
Glucose mmol/l |
Cholesterol mmol/l |
Low density lipoproteins mmol /l |
Сreatinine µmol/l |
Alaninetransferase units/l |
Аspartate Transferase units/l |
Creatinekinase units/l |
| 1 | 2,81±0,19 | 4,74±0,18 | 0,91±0,09 | 57,30±0,96 | 18,02±0,73 | 20,31±1,24 | 33,36±1,98 |
| 2 | 3,63±0,20 | 5,00±0,20 | 1,37±0,12 | 68,20±0,88 | 10,31±0,56 | 12,54±0,91 | 53,72±2,35 |
| 3 | 2,82±0,17 | 4,16±0,15 | 1,92±0,13 | 112,32±1,23 | 35,26±1,21 | 30,43±1,25 | 63,39±2,14 |
| 4 | 3,43±0,25 | 5,88±0,19 | 1,78±0,18 | 78,82±0,92 | 32,49±1,46 | 31,54±2,13 | 67,52±3,25 |
| 5 | 3,62±0,18 | 4,57±0,17 | 2,79±0,21 | 89,02±0,12 | 29,13±1,25 | 25,82±2,26 | 106,36±3,71 |
| 6 | 3,16±0,17 | 5,63±0,16 | 2,63±0,23 | 95,52±0,45 | 15,42±1,49 | 17,29±1,12 | 152,24±2,23 |
| 7 | 2,94±0,19 | 4,94±0,15 | 2,01±0,19 | 117,43±1,26 | 23,28±1,73 | 23,53±1,93 | 37,21±0,24 |
| 8 | 2,99±0,21 | 4,71±0,18 | 1,99±0,20 | 47,57±1,58 | 37,32±4,79 | 39,62±1,52 | 63,82±1,24 |
| 9 | 3,23±0,22 | 4,82±0,19 | 1,34±0,12 | 55,73±1,52 | 23,41±1,22 | 21,74±1,41 | 76,28±1,29 |
| 10 | 2,61±0,24 | 5,58±0,20 | 1,78±0,16 | 115,02±2,31 | 39,62±1,58 | 35,28±1,23 | 54,34±1,42 |
| 11 | 2,82±0,15 | 4,14±0,16 | 3,25±0,18 | 44,89±1,25 | 30,28±1,48 | 32,17±1,52 | 78,15±2,29 |
| 12 | 10,91±0,43 | 4,12±0,15 | 2,84±0,16 | 122,2±1,21 | 18,53±1,34 | 18,38±1,13 | 100,43±2,41 |
| 13 | 4,93±0,32 | 4,00±0,34 | 1,56±0,15 | 76,72±0,88 | 46,15±2,46 | 51,29±2,41 | 95,34±1,69 |
| 14 | 3,75±0,19 | 4,78±0,28 | 2,59±0,17 | 112,13±0,96 | 23,43±1,48 | 35,45±2,19 | 84,51±1,98 |
| 15 | 6,83±0,21 | 4,61±0,25 | 2,86±0,18 | 94,92±0,87 | 39,93±1,26 | 36,97±1,49 | 300,01±2,75 |
| 16 | 12,51±0,35 | 3,82±0,23 | 1,80±0,9 | 142,21±0,65 | 18,74±1,42 | 15,68±0,81 | 125,23±2,15 |
| 17 | 5,53±0,19 | 5,65±0,23 | 3,45±0,23 | 90,24±1,56 | 19,19±1,52 | 20,62±0,96 | 77,26±1,72 |
| 18 | 6,42±0,23 | 6,04±0,31 | 3,97±0,25 | 113,41±2,31 | 45,26±2,46 | 75,35±2,65 | 254,19±2,47 |
| 19 | 4,55±0,16 | 5,53±0,22 | 3,65±0,31 | 86,32±1,13 | 17,52±1,34 | 11,92±0,49 | 89,45±2,56 |
| 20 | 5,57±0,24 | 4,94±0,28 | 2,68±0,32 | 97,49±1,54 | 21,39±1,57 | 16,42±0,95 | 136,26±3,12 |
| 21 | 5,82±0,32 | 5,99±0,24 | 3,94±0,36 | 112,25±2,21 | 20,19±1,96 | 23,35±2,15 | 160,17±2,49 |
| Norm values | 3,9-6,1 | 3,3-5,0 | <3.5 | 44-124 | 5-40 | 5-40 | 26 – 174 |
Table 4.
Separation of samples into clusters after using the PCA method.
| Cluster # | Sample # |
| 1 | 1, 2, 3, 4, 5, 6, 7, 8, 9,10, 11 |
| 2 | 13, 14, 15, 17, 18, 19, 20 |
| Dropped samples | 12, 16, 21 |
Disclaimer/Publisher’s Note: The statements, opinions and data contained in all publications are solely those of the individual author(s) and contributor(s) and not of MDPI and/or the editor(s). MDPI and/or the editor(s) disclaim responsibility for any injury to people or property resulting from any ideas, methods, instructions or products referred to in the content. |
© 2025 by the authors. Licensee MDPI, Basel, Switzerland. This article is an open access article distributed under the terms and conditions of the Creative Commons Attribution (CC BY) license (https://creativecommons.org/licenses/by/4.0/).
Copyright: This open access article is published under a Creative Commons CC BY 4.0 license, which permit the free download, distribution, and reuse, provided that the author and preprint are cited in any reuse.


