
Submitted:
05 March 2025
Posted:
05 March 2025
You are already at the latest version
Abstract
Sediment-laden water significantly exacerbates cavitation damage in hydraulic machinery compared to clear water, underscoring the importance of investigating the effects of sediment on cavitation. This study examines cavitation in sediment-laden water using a Venturi flow channel and a high-speed camera system is utilized to capture the morphology and evolution of cavitation clouds. Natural river sand samples with a median diameter of 0.05, 0.07, and 0.09 mm are selected, and sediment-laden water with a concentration of 10, 30, and 50 g/L is prepared for the study. The results indicate that increasing sediment concentration or reducing sediment size intensifies cavitation, shortens the evolution cycle of cavitation clouds, and elevates the frequency of cavitation cloud shedding. Meanwhile, numerical simulation is conducted based on a gas-liquid-solid phase mixing model. The findings indicate that a higher sediment concentration corresponds to a greater shear effect near the wall, which raises the drag on the attached sheet-like cavitation clouds and enhances the re-entrant jet which can intensify the shedding of cavitation clouds. Furthermore, sediment particles contribute to more vortex: they enhance the impact on smooth, wall-adjacent sheet-like vortex, while simultaneously consuming more energy during the vortex return process, resulting in the creation of additional small-scale vortices.
Keywords:
sediment-laden water
; cavitation
; high-speed photography
; shearing effect
; re-entrant jet
1. Introduction
Excessive river sedimentation in regions such as the Himalayas and Alps poses severe challenge to sustainable hydropower development [1]. In the foreseeable future, the problem of sediment erosion in hydraulic machineries remains a persistent task. In addition, changes in the working conditions of water turbines can lead to cavitation damage. The combined effects of erosion and cavitation can cause serious damage to hydraulic projects [2,3]. However, the synergistic wear mechanisms are barely understood, and the conclusions reached by different studies differ from each other. The synergistic bubble particle effect is manifested in the dual inhibition or promotion mechanism [4]. There are many factors affect the promotion or inhibiting synergy of abrasion and cavitation including the solid-liquid mixture [5,6] and particle properties [7,8].
Raichenko, Byakova [9] and Morch [10] suggested that inhomogeneities within the liquid can function as nucleation centers for bubbles and developed models to analyze the bubble formation process. Shen et al. [11] found the effect on single cavitation bubble dynamics could be negligible for small viscosities, but it should be considered for relatively high viscosities. Liu et al. [12] found that fine particles increased the fluid’s viscosity, and the strong liquid viscosity produced higher resistance to the growth and collapse of bubbles, lowering particle velocity and suppressing cavitation.
The properties of particle including size, concentration, shape and type are key influencing factors for the damage from cavitation and abrasion.
Lian et al. [7] reported that the critical particle diameter was approximately 0.035–0.048 mm. When the sediment had a particle size smaller than the critical value, the damage from the combined wear was slightly less severe than that from cavitation in clear water. Using a specialized vibrating device, Wu and Gou [13] discussed the combined wear under three sediment concentration cases (25, 50, and 85 kg/m3) and five particle diameter scenarios (0.531, 0.253, 0.063, 0.042, 0.026 mm). They revealed that when the particle diameter was smaller than the critical value (0.048 mm), the wear effect weakened as the concentration increased. Chen et al. [14] found the generated damage was less severe than that in clear water when the average sediment size was smaller than 0.120 mm, Zhong and Minemura [15] suggested that for sediment with a size less than 1 mm, the flow would only cause cavitation erosion. Sun et al. [16] found that when the particle size was in the range of 0.27–0.4 mm, the cavitation area and damage level were higher. In general, when the particle size is smaller than that threshold, cavitation is suppressed, otherwise it is intensified [17,18,19]. For particles smaller the threshold size, the medium sand and clay in the particle-laden flow have non-Newtonian fluid features.
In the presence of sand, the cavitation pressure threshold rises proportionately to the sediment concentration. Zhu et al. [20] indicated that the sediment concentration was linearly related to the critical cavitation value, with higher particle concentrations corresponding to more possible occurrences of cavitation. This was because many gas nuclei with different sizes existed within particle surface cracks; increasing the sediment concentration inevitably generates more gas nuclei in the flow [21,22]. However, the conclusion that an increased particle concentration monotonically promoted or inhibited combined erosion was contradicted by some other reports, which suggested a particle concentration threshold. As the concentration increased under a fixed particle diameter, combined wear initially weakened and then strengthened [23,24].
In addition, shape and type of particle will affect the cavitation [25,26,27,28,29]. However, the size and concentration of particles are crucial factors affecting cavitation, and their different combinations can inhibit or promote cavitation. Based on scholars’ previous research [7,13], natural river sand with a median diameter of 0.05, 0.07, and 0.09 mm is selected, and sediment-laden water with a concentration of 10, 30, and 50 g/L is prepared for the study of promoting cavitation in a Venturi structure flow channel in this paper.
The mechanism of the inhibit or promote cavitation have been studied. Li and Zhang et al. [30,31,32] noticed that the particle shooting effect (acceleration of particles when bubbles expanded and after bubbles and particles detached) was more pronounced as the particle-to-bubble size ratio was reduced. Poulain et al. [33] reported a quantitative relation between sand movement due to cavitation bubbles and their distance. Gonzalez-Avila et al. and Arora et al. [34,35] discovered that cavitation bubbles’ collapse would accelerate nearby sand particles, possibly aggravating abrasion and damage. Li et al. [36] claimed that bubble–particle interactions were heavily dependent on the particle-to-bubble size ratio and particle-to-liquid density ratio.
Current research on the synergistic mechanisms focuses on theoretical analyses of individual cavitation bubble or the combined effects of sediment and cavitation through material erosion assessments. Meanwhile, significant achievements have been made in the impact of cavitation on particles. However, there is a dearth of studies that directly analyze sediment-laden flow field to understand the sediment-bubbles relationship. This study explores the effect of sediment-laden flow on cavitation evolution. The viscosity of sediment-laden water varies with the sediment size and concentration, has influences on the flow field which will affect the formation, development, and collapse of cavitation. Obtain the viscosity of sediment-laden water through a viscometer and apply it to subsequent numerical calculations and analysis of flow field.
Due to its simple structure, the cavitation mechanism of the Venturi is consistent with hydraulic machinery such as pumps and turbines, making it an important experimental equipment for studying cavitation mechanisms and characteristics. This paper employs a high-speed camera system to capture the morphology of cavitations and the complete developmental process within a Venturi structure flow channel containing sediment-laden water. Furthermore, calculations for three-phase flow (vapor-liquid-solid) are performed to evaluate the cavitation flow field in sediment-laden water, aiming to elucidate the influence of sediment on cavitation.
2. Visual Cavitation Experiment
2.1. Experimental Apparatus
The experimental apparatus utilized to investigate cavitation mechanisms, with experiments conducted in a Venturi flow channel is shown in Figure 1a. The Venturi flow channel comprises four distinct sections: an inlet straight section, a contraction section, a throat, and a diffusion section. As the fluid traverses the throat of the Venturi channel, the reduction in cross-sectional area results in an increase in fluid velocity, leading to a decrease in static pressure. This pressure-drop induces a vacuum condition, creating the requisite environment for cavitation formation. The dimensions of the Venturi channel are illustrated in Figure 1b. A Fastcam AX-100 high-speed camera mounting one Nikon lens with focal length of 105 mm is used to record cavitation phenomena in Figure 1c). To enhance the quality of the cavitation cloud images, a photographic light source is utilized for additional illumination in Figure 1d. The experimental site is shown in Figure 1e. The Photron FASTCAM Viewer software is utilized to precisely control the frame rate, recording duration, and resolution of the high-speed photography system, which can achieve a 20,000 fps frame rate at maximum. During experiments, the frame rate is set to 4,000 fps to ensure that the captured images maintain sufficient detail, with an image resolution of 1024 × 1024 pixels.
2.2. Measurement of Viscosity
The viscosity of a liquid significantly influences flow behavior and cavitation characteristics. In sediment-laden water, viscosity differences arise from variations in particle concentration and size compared to clear water. These viscosity variations impact cavitation behavior, which is the primary concern of the present study. To measure the sediment-laden water’s viscosity, an NDJ-8S digital viscometer was employed, as illustrated in Figure 2a. This instrument detects and collects data on the viscous torque. Assuming laminar flow and negligible slip between the liquid and the measuring spindle’s surface, the viscosity of the liquid can be calculated using the appropriate formula.
In this context, M represents the torque exerted by the internal friction of the liquid on the rotating spindle, r denotes the inner cylinder radius, and R is the outer cylinder radius. h indicates the immersed height of the liquid surrounding the inner cylinder, and ω signifies the angular velocity of the rotating spindle. To enhance measurement accuracy, rotor number 0, which has the smallest measurement range, was selected in Figure 2b. The rotation speed for the experiment was set to 60 rpm.
The viscosity of clear water measured with this instrument is 1.13 mPa·s, and the viscosity measurements for sediment-laden water are summarized in Table 1. Notably, at a low sediment concentration (S = 10 g/L), the viscosity matches that of clear water, regardless of particle size. However, as sediment concentration increases, viscosity rises, with particle size playing a more significant role. Smaller particles contribute to a greater increase in viscosity. For example, with a particle diameter of d=0.09 mm, the viscosity rises from 1.132 mPa·s to 1.219 mPa·s, reflecting a 7.68% increase. In contrast, with a particle diameter of d=0.05 mm, viscosity escalates from 1.139 mPa·s to 1.756 mPa·s, a notable increase of 54.17%. Thus, an increase in sediment concentration with finer particles leads to a substantial rise in viscosity compared to clear water, underscoring the importance of cavitation behavior under such conditions.
2.3. Experiment Results
2.3.1. Comparison of Cavitation Intensity
Based on the experimentally measured average pressure at the throat, the cavitation numbers for various sediment-laden water samples are presented in Table 2. The findings demonstrate that the cavitation number decreases at higher sediment concentrations, indicating enhanced cavitation intensity. As the water flow decelerates from the throat to the diffusion section, the drag effect of the sediment particles slows the decrease in flow velocity and leads to a more gradual increase in pressure. Consequently, this results in lower pressure at the throat, effectively promoting cavitation. A higher concentration corresponds to a more pronounced particle drag effect.
The effect of particle dimension on the cavitation number is notably less significant than that of sediment concentration. For example, at d=0.09 mm, increasing the sediment concentration from 10 g/L to 50 g/L results in a reduction of the cavitation number from 0.27 to 0.08, a decrease of 70.37%. Conversely, in sediment-laden water with a concentration of 50 g/L, reducing the particle size from d=0.09 mm to d=0.05 mm only decreases the cavitation number from 0.08 to 0.05, reflecting a reduction of only 12.5%.
The relationship between the cavitation number and viscosity is illustrated in Figure 3, which is supported by the data in Table 1. The graph demonstrates that, in sediment-laden water, increased viscosity correlates with a smaller cavitation count and an increased cavitation intensity. When the sediment size exceeds the critical value, an increase in concentration or a decrease in sediment size will promote cavitation, and the promoting effect of concentration is more significant than that of sediment size. Therefore, the cavitation of sediment-laden water with small sediment size and high concentration (d=0.05 mm and S=50 g/L) should be taken seriously.
2.3.2. Evolution Process of Cavitation Cloud
During the cavitation experiments, high flow rates reveal a distinct phenomenon of periodic cavitation bubble shedding at the cloud tail. For instance, at a flow rate of Q=294 mL/s and a sediment concentration S=50 g/L with different sediment size, the cavitation cloud evolution over a selected cycle, denoted as T, is analyzed and depicted. The captured raw images underwent MATLAB processing including background subtraction, binarization, and denoising, as demonstrated in Figure 4.
The cavitation bubbles at the tail of the cloud undergo three distinct stages: growth, separation, and collapse. During cavitation growth, the cloud extends downstream on both the upper and lower sides. During the separation stage, noticeable breaking and detachment of bubbles occur at both sides of the tail. Finally, in the collapse stage, the separated bubbles rapidly collapse. The cloud length before detaching from the wall is defined as the cavitation cloud length (L), and its periodic variation over time is illustrated in Figure 5.
To examine the development cycle of cavitation clouds in both clear water and sediment-laden water, ten development cycles are selected for analysis. An arithmetic average is computed to determine the average period. The cavitation period for clear water is T=0.0255 s. The impacts of sediment size and concentration on cavitation cloud evolution are presented in Figure 6.
Notably, when the sediments have a very low concentration (S=10 g/L), the cavitation cloud’s evolution cycle closely resembles that of clear water and is minimally affected by particle size. However, as sediment concentration increases, shorter cycles become more pronounced with smaller particle sizes. For instance, at S=50 g/L particle diameter is d=0.09 mm, the cycle is T=0.0123 s; with d=0.05 mm, the cycle is T=0.0075 s, showing a 39% reduction. The impact of sediment concentration on the cavitation cloud’s evolution cycle is even more significant. With a particle diameter of d=0.09 mm, increasing the sediment concentration from S=10 g/L to 50 g/L reduces the cycle from T=0.0254 s to 0.0123 s, a 51.57% decrease. When the particle diameter is d=0.05 mm, the cycle decreases from T=0.0252 s to 0.0075 s, a reduction of 70.24% when the sediment concentration grows from 10 g/L to 50 g/L. It is found that decreasing sediment size or increasing sediment concentration shortens the development cycle of cavitation, and the effect of concentration is more significant than that of size.
This phenomenon can be attributed to the cavitation cloud shedding induced by the near-wall re-entrant jet. Sediment particles, characterized as non-wettable solids, exhibit greater tensile stress than water fractures. Consequently, the re-entrant jet transporting sediment particles possesses enhanced tearing and destructive capabilities compared to that in clear water, thereby accelerating the shedding of the cavitation cloud. The destructive potential of the re-entrant jet becomes increasingly pronounced at higher sediment concentrations.
2.3.3. Maximum Length of Wall-Bounded Cavitation Cloud
The average maximum cavitation cloud length Lmax before shedding was calculated over 10 cycles at a flow of 294 mL/s, yielding Lmax =19 mm in clear water. The influences of sediment size and sediment concentration on this length are illustrated in Figure 7. It is evident that both increasing sediment concentration and decreasing sediment size contribute to an expansion of the cavitation cloud, as indicated by the increased length. Notably, the magnitude of these increases is comparable, suggesting that sediment size and concentration exert similar influences on cavitation cloud length.
As shown in Table 2, L increases with the sediment-laden water’s viscosity. The sediment facilitates the formation of additional cavitation nuclei compared to a clear water medium, which subsequently leads to the generation of more cavitation bubbles and promotes cavitation effectively. Smaller sediment generates a greater number of cavitation nuclei, further enhancing the development of cavitation.
3. Numerical Calculation
3.1. Mathematical Model
The mixture model is employed to manage multiphase flow by accounting for the mixed states of multiple substances (phases), allowing each substance to possess its own independent velocity, density, and pressure within the fluid. In the model, the average velocity is defined as follows
where n represents the number of phases, is the mixture density, denotes phase t’s volume fraction, represents the phase density, and signifies the velocity of phase t.
The continuity equation is
where represents the mass source term due to cavitation generation.
The momentum equation:;
where n represents the number of phases, is the mixture viscosity, represents the drift velocity of phase t, and represents the body force.
The RNG k-ε model and Zwart-Gerber-Belamri cavitation model are used in this study.
3.2. Grid Generation
Considering the symmetry of the flow channel, a half geometric model was established in Figure 8a. The geometric model presented herein features a regular structure and employs a structured mesh. Given that cavitation occurs near the wall and reverse flow is present in that region, it is essential to refine the mesh near the wall during the meshing process to enhance simulation accuracy. The first layer of mesh nodes closest to the wall is set to y+=1, comprising a total of 27 boundary layer mesh layers. Furthermore, since cavitation typically occurs in the throat of the Venturi structure, the mesh in this area is also refined, as depicted in Figure 8b. After the independence verification the number of mesh elements was established at 7,670,400.
3.3. Parameter Settings
The time step was set to 1×10⁻³ s. The pressure–velocity coupling equations were computed using the semi-implicit method for pressure-linked equations consistent. The discretization scheme for pressure was defined as PRESTO, while the gradient was discretized via the least-squares cell-based approach. The first-order upwind scheme was employed to discretize the remaining parameters. The vapor density , vapor viscosity , saturated vapor pressure , bubble radius RB=1×10⁻⁵ m,temperature T=293.15 K, viscosity were determined based on experimental values.
3.4. Analysis of Calculation Results
3.4.1. Comparison of Cavitation Cloud Morphology and Periodicity
The experimental images of cavitation alongside the vapor volume fraction distribution from numerical simulations of sediment-laden water, with sediment sizes of d=0.05 mm and sediment concentrations S=50 g/L and S=30 g/L over one cycle are shown in Figure 9. Cavitation initiates at the throat, and as the cycle progresses, the wall-attached cavitation cloud’s length and thickness increase, thereby expanding the cavitation region. During the interval from 2/6T to 5/6T, shedding cavitation clouds form at the tail, moving with the flow before gradually collapsing. Alongside the periodic development of cavitation, the vapor-liquid re-entrant jet at the tail during cavitation collapse exhibits similar periodicity. The static pressure near the collapsing cavitation bubbles at the tail increases rapidly, resulting in the formation of a concave jet structure. A portion of the liquid at the tail, driven by the concave jet, moves in the opposite direction to the main liquid flow, generating a vapor-liquid coexisting re-entrant jet. The numerical simulations capture the periodicity of the cavitation process, which undergoes cyclical phases of contraction, expansion, and retraction. Notably, the shape of the wall-attached cavitation region in the simulations aligns with the non-shed cavitation cloud observed in the experiments, and the extent of the cavitation region closely resembles the experimental findings.
The values of Lmax in sediment-laden water before shedding, across two cycles, were compared experimentally and numerically, as shown in Figure 10. It is found that the numerically calculated cavitation cloud length closely aligns with the experimental results; however, the evolution cycle of the cavitation cloud in the simulation is slightly longer than that observed in the experiments. For a sediment concentration S=50 g/L, the experimental cycle is T=0.0075s, while the calculated cycle is T=0.0089s, indicating an 18.6% difference. Conversely, at a sediment concentration S=30 g/L, the experimental cycle is T=0.0130s, and the calculated cycle is T=0.0151s, resulting in a 16.1% difference. As the sediment concentration increases, the cavitation cloud cycle shortens while the cavitation region expands. The numerical results agree with the experiment outcomes.
3.4.2. Re-Entrant Jet and Reflow
The reverse pressure gradient of the diffusion section generates a re-entrant jet which causes the detachment of bubbles at the tail end of the cavitation cloud. The streamline diagrams of sediment-laden water cavitation at a sediment concentration of S=50 g/L are shown in Figure 11. At t=1/6 T, a re-entrant jet emerges at the wall near the cavitation cloud tail, resulting in an upward lift of the tail. At t=2/6 T, as the cavitation cloud expands and the tail continues to rise, reflow region is obvious. By t=3/6T, the cavitation cloud attains its maximum length, with the reflow region moving further away and expanding to its greatest extent. At t=4/6T, due to the collapse of the detached cavitation cloud, the reflow region is pushed back and the cavitation cloud near the wall begins to contract. By t=5/6T, the contraction of the cavitation cloud persists, and the reflow region continues to shift upstream toward the tail, further reducing in size and becomes re-entrant jet.
A comparative analysis of the streamlines of cavitation flows, maintaining the same flow rate for sediment-laden water at a sediment concentration of S=30 g/L and S=50 g/L (Figure 12) reveals that increased sediment concentration correlates with a larger reflow region at the tail of the cavitation cloud.
From the throat to the downstream diffusion section, the flow velocity decreases along the way. The density and inertia of the sediment-laden water increase when the concentration is raised. Under the same flow rate conditions, the trend of decreasing flow velocity slows down. Therefore, the velocity gradient from the edge wall to the central flow area rises accordingly.
Meanwhile starting from the throat, a small amount of sediment settles and accumulates on the side walls, while most of the sediment particles are suspended in the water and carried downstream by the water flow, forming the main flow area. There are strip-shaped areas with low sediment content between the subsidence zone and the mainstream. As the overall sediment concentration decreases, this strip-shaped area approaches clear water (Figure 13).
Based on the analyze of the velocity gradient and sediment distribution, the shearing stress near the wall enlarges and the drag on bubbles enhances with the concentration increasing, which result in an increase in the length of the sheet-like cavitation cloud. Therefore, the reverse pressure gradient at the cavitation cloud tail increases, leading to an expanded re-entrant jet in Figure 12a. The collapse of detached bubbles pushes the reflow region upstream, causing the cavitation cloud to contract. The higher the sediment content, the more obvious the driving effect, and the reflow region increases significantly in Figure 12b.
3.4.3. Vortex Distribution and Evolution
The cavitation behavior significantly affects the vortex structure. Because of the growth and shedding process of bubbles, the vortex structure changes over time, and the absolute value of vorticity near the wall is relatively large. This originates from the flow’s strong shearing effect near the wall. The smooth vortex structure grows with the development of bubbles, and there is a high vorticity value at the position where the reflow advances, which disturbs the bubbles, enhances turbulent fluctuations, and causes the vortex structure to lift-up. This indicates that the reflow impacts the surface of the bubbles, ultimately leading to the detachment of cloud bubbles.
The vorticity diagrams for cavitation in sediment-laden water with S=50 g/L, calculated using the Q-criterion are shown in Figure 14. The sheet-like vortices at the front of the cavitation cloud are relatively smooth and stable, whereas the vortices at the tail exhibit considerable periodic fluctuations due to the influence of the reflow, undergoing a cycle of shedding, downstream movement, return, and merging. From t=1/6T to t=3/6T, the reflow impacts the surfaces of the sheet-like cavitation bubbles, ultimately leading to cavitation cloud shedding. As the cloud progresses downstream, large-scale vortices are generated, complicating the vorticity characteristics. After t=4/6T, the reflow propels the vortices to return, with larger vortex structures being supplanted by smaller-scale vortices.
Figure 15 compares the cavitation vorticity of clear water and sediment-laden water with a sediment concentration of 30 g/L and 50 g/L, all under identical flow rates. It is observed that during the vortices shedding phase, higher sediment concentrations enhance the shear effect near the wall, leading to an increase in vorticity. The re-entrant jet causes the shedding of vortices, and higher sediment concentrations lead to stronger impact of the jet on the sheet-like vortices, causing more vortices to detach and the boundaries of the vortices to become more turbulent in Figure 15a. During the vortices return phase, larger-scale vortices transform into small-scale vortices exhibit greater energy consumption due to energy dissipation. In sediment laden water with a higher sediment concentration, viscous damping is more pronounced, leading to more reduction in vorticity and more small-scale vortices in Figure 15b.
4. Conclusion
This study investigates the cavitation phenomenon in sediment-laden water using a Venturi-based hydraulic cavitation device, integrating both numerical simulations and experimental methods. By comparing numerical results with experimental data, the study investigates cavitation patterns, analyzes the flow field characteristics associated with cavitation in sediment-laden water, and explores the influences of sediment size and concentration on cavitation, drawing the following conclusions:
(1) The impact of sediment concentration on viscosity is more pronounced than that of particle size. As sediment concentration increases, viscosity rises significantly, with this trend becoming more accentuated as particle size decreases.
(2) The experiment and numerical simulation found that an increase in sediment concentration or a decrease in sediment size leads to a shorter evolution cycle of the cavitation cloud and a higher frequency of cavitation cloud shedding, with sediment concentration exerting a more substantial influence. The cavitation number decreases as well, with sediment concentration having a more significant effect. Thus, increasing sediment concentration or decreasing sediment size will facilitate cavitation, and attention should be paid to sediment laden water with small sediment size and high concentration in hydraulic machinery operation.
(3) Numerical analyses of the flow field of the cavitation in sediment-laden water reveal that sediment expands the reflow region and enhance the re-entrant jet, thereby promoting cavitation cloud shedding due to more pronounced shear effect. Additionally, sediment contributes to more complex vortex structure: on one hand, they enhance the interaction with smooth, sheet-like vortex attached to the wall, leading to increased vortex shedding; on the other hand, they consume more energy during the vortex return, thus forming more small-scale vortices.
Data availability
The datasets used and/or analyzed during the current study available from the corresponding author on reasonable request.
Declaration of competing interest
We declare no personal relationships or competing financial interests that may have affected this work.
Author Contributions
Ze-Yuan Yang: Visualization, Validation, Writing—review & editing. Qin Zhao: Conceptualization, Investigation, Visualization, Writing original draft, Writing- review & editing. Gang Yu: Operation, Validation.
Funding
This work was supported by the National Natural Science Foundation of China (Grant No.52379092).
References
- Noon, A.A.; Kim, M.-H. Sediment and Cavitation Erosion in Francis Turbines—Review of Latest Experimental and Numerical Techniques. Energies 2021, 14, 1516. [Google Scholar] [CrossRef]
- Pardeep Kumar, R.P. Saini, Study of cavitation in hydro turbines—A review. Renewable and Sustainable Energy Reviews 2010, 14, 374–383. [Google Scholar] [CrossRef]
- Felix, D.; Albayrak, I.; Abgottspon, A.; Boes, R.M. Hydro-abrasive erosion of hydraulic turbines caused by sediment - a century of research and development. CONFERENCE NAME, LOCATION OF CONFERENCE, COUNTRYDATE OF CONFERENCE; p. 122001.
- Sun, J.; Ge, X.; Zhou, Y.; Liu, D.; Liu, J.; Li, G.; Zheng, Y. Research on synergistic erosion by cavitation and sediment: A review. Ultrason. Sonochemistry 2023, 95, 106399. [Google Scholar] [CrossRef] [PubMed]
- Karimi, A.; Martin, J.L. Cavitation erosion of materials. Int. Met. Rev. 1986, 31, 1–26. [Google Scholar] [CrossRef]
- Arora, M.; Ohl, C.D.; Lohse, D. Effect of nuclei concentration on cavitation cluster dynamics. J. Acoust. Soc. Am. 2007, 121, 3432–3436. [Google Scholar] [CrossRef] [PubMed]
- Lian, J.; Gou, W.; Li, H.; Zhang, H. Effect of sediment size on damage caused by cavitation erosion and abrasive wear in sediment-water mixture. Wear 2018, 398-399, 201–208. [Google Scholar] [CrossRef]
- Haosheng, C.; Jiadao, W.; Darong, C. Cavitation damages on solid surfaces in suspensions containing spherical and irregular microparticles. Wear 2008, 1–4. [Google Scholar] [CrossRef]
- Sammons, R.D.; Gaines, T.A. Glyphosate resistance: State of knowledge. Pest Manag. Sci. 2014, 70, 1367–1377. [Google Scholar] [CrossRef]
- Mo̸rch, K.A. Cavitation Nuclei and Bubble Formation—A Dynamic Liquid-Solid Interface Problem. J. Fluids Eng. 2000, 122, 494–498. [Google Scholar] [CrossRef]
- Sammons, R.D.; Gaines, T.A. Glyphosate resistance: State of knowledge. Pest Manag. Sci. 2014, 70, 1367–1377. [Google Scholar] [CrossRef]
- Liu, X.M.; He, J.; Lu, J.; Ni, X.W. Effect of liquid viscosity on a liquid jet produced by the collapse of a laser-induced bubble near a rigid boundary. Japanese Journal of Applied Physics 2009, 48. [Google Scholar] [CrossRef]
- Wu, J.H.; Gou, W.J. Critical size effect of sand particles on cavitation damage. Journal of Hydrodynamics Ser. B 2013, 25, 165–166. [Google Scholar] [CrossRef]
- Sammons, R.D.; Gaines, T.A. Glyphosate resistance: State of knowledge. Pest Manag. Sci. 2014, 70, 1367–1377. [Google Scholar] [CrossRef] [PubMed]
- Zhong, Y.; Minemura, K. Measurement of erosion due to particle impingement and numerical prediction of wear in pump casing. Wear 1996, 199, 36–44. [Google Scholar] [CrossRef]
- Chander MP, C. Kartick, J. Gangadhar, P. Vijayachari, Ethno medicine and healthcare practices among Nicobarese of Car Nicobar - an indigenous tribe of Andaman and Nicobar Islands. J. Ethnopharmacol. 2014, 158, 18–24. [Google Scholar] [CrossRef] [PubMed]
- Wang, Y.; Wu, J.; Ma, F. Cavitation–silt erosion in sand suspensions. Journal of Mechanical Science and Technology 2018, 32, 5697–5702. [Google Scholar] [CrossRef]
- Huang, S.; Ihara, A.; Watanabe, H.; Hashimoto, H. Effects of Solid Particle Properties on Cavitation Erosion in Solid-Water Mixtures. J. Fluids Eng. 1996, 118, 749–755. [Google Scholar] [CrossRef]
- Wang, J.; Chen, H.; Qin, L.; Li, Y.; Chen, D. Key roles of micro-particles in water on occurrence of cavitation-erosion of hydro-machinery. Sci. Bull. 2008, 53, 1603–1607. [Google Scholar] [CrossRef]
- Wang, L.; Zhu, R.; Chang, J. Effect of sand concentration in water on cavitation pressure in Qingtongxia and Bapanxia hydropower stations. Journal of Hydroelectric Engineering 2008, 27, 27,44–47. [Google Scholar]
- Zhang, Y.; Qian, Z.; Ji, B.; Wu, Y. A review of microscopic interactions between cavitation bubbles and particles in silt-laden flow. Renew. Sustain. Energy Rev. 2016, 56, 303–318. [Google Scholar] [CrossRef]
- Chang, J. Cavitation and cavitation erosion of pump and turbine with silt-laden water as working medium. Journal of Drainage and Irrigation Machinery Engineering 2010, 28, 93–97. [Google Scholar]
- Hu, H.X.; Zheng, Y.G. The effect of sand particle concentrations on the vibratory cavitation erosion. Wear 2017, 384–385, 95–105. [Google Scholar] [CrossRef]
- Xu, W.; Zhang, Y.; Luo, J.; Arong; Zhang, Q. ; Zhai, Y. The impact of particles on the collapse characteristics of cavitation bubbles. Ocean Eng. 2017, 131, 15–24. [Google Scholar] [CrossRef]
- Romero, R.; Teran, L.; Coronado, J.; Ladino, J.; Rodríguez, S. Synergy between cavitation and solid particle erosion in an ultrasonic tribometer. Wear 2019, 428-429, 395–403. [Google Scholar] [CrossRef]
- Arora, M.; Ohl, C.-D.; Mørch, K.A. Cavitation Inception on Microparticles: A Self-Propelled Particle Accelerator. Phys. Rev. Lett. 2004, 92, 174501. [Google Scholar] [CrossRef]
- Bahadur, S.; Badruddin, R. Erodent particle characterization and the effect of particle size and shape on erosion. Wear 1990, 138, 189–208. [Google Scholar] [CrossRef]
- Levy, A.V.; Chik, P. The effects of erodent composition and shape on the erosion of steel. Wear 1983, 89, 151–162. [Google Scholar] [CrossRef]
- Haosheng, C.; Jiadao, W.; Darong, C. Cavitation damages on solid surfaces in suspensions containing spherical and irregular microparticles. Wear 2008, 1–4. [Google Scholar] [CrossRef]
- Li, S.; Khoo, B.C.; Zhang, A.-M.; Wang, S. Bubble-sphere interaction beneath a free surface. Ocean Eng. 2018, 169, 469–483. [Google Scholar] [CrossRef]
- Li, S.; Zhang, A.M.; Han, R.; Liu, Y.Q. Experimental and numerical study on bubble-sphere interaction near a rigid wall. Phys. Fluids 2017, 29. [Google Scholar] [CrossRef]
- Li, S.; Zhang, A.-M.; Wang, S.; Han, R. Transient interaction between a particle and an attached bubble with an application to cavitation in silt-laden flow. Phys. Fluids 2018, 30, 082111. [Google Scholar] [CrossRef]
- Poulain, S.; Guenoun, G.; Gart, S.; Crowe, W.; Jung, S. Particle Motion Induced by Bubble Cavitation. Phys. Rev. Lett. 2015, 114, 214501. [Google Scholar] [CrossRef] [PubMed]
- Arora, M.; Ohl, C.-D.; Mørch, K.A. Cavitation Inception on Microparticles: A Self-Propelled Particle Accelerator. Phys. Rev. Lett. 2004, 92, 174501. [Google Scholar] [CrossRef] [PubMed]
- Borkent, B.M.; Arora, M.; Ohl, C.-D.; DE Jong, N.; Versluis, M.; Lohse, D.; Mørch, K.A.; Klaseboer, E.; Khoo, B.C. The acceleration of solid particles subjected to cavitation nucleation. J. Fluid Mech. 2008, 610, 157–182. [Google Scholar] [CrossRef]
- Li, S.; Zhang, A.-M.; Wang, S.; Han, R. Transient interaction between a particle and an attached bubble with an application to cavitation in silt-laden flow. Phys. Fluids 2018, 30, 082111. [Google Scholar] [CrossRef]
Figure 1.
Visual cavitation experimental system. (a) Schematic of the cavitation mechanism experiment apparatus (b) Schematic of Venturi structure dimensions (c) High-speed camera (d) High-speed camera (e) Experimental field diagram.
Figure 1.
Visual cavitation experimental system. (a) Schematic of the cavitation mechanism experiment apparatus (b) Schematic of Venturi structure dimensions (c) High-speed camera (d) High-speed camera (e) Experimental field diagram.
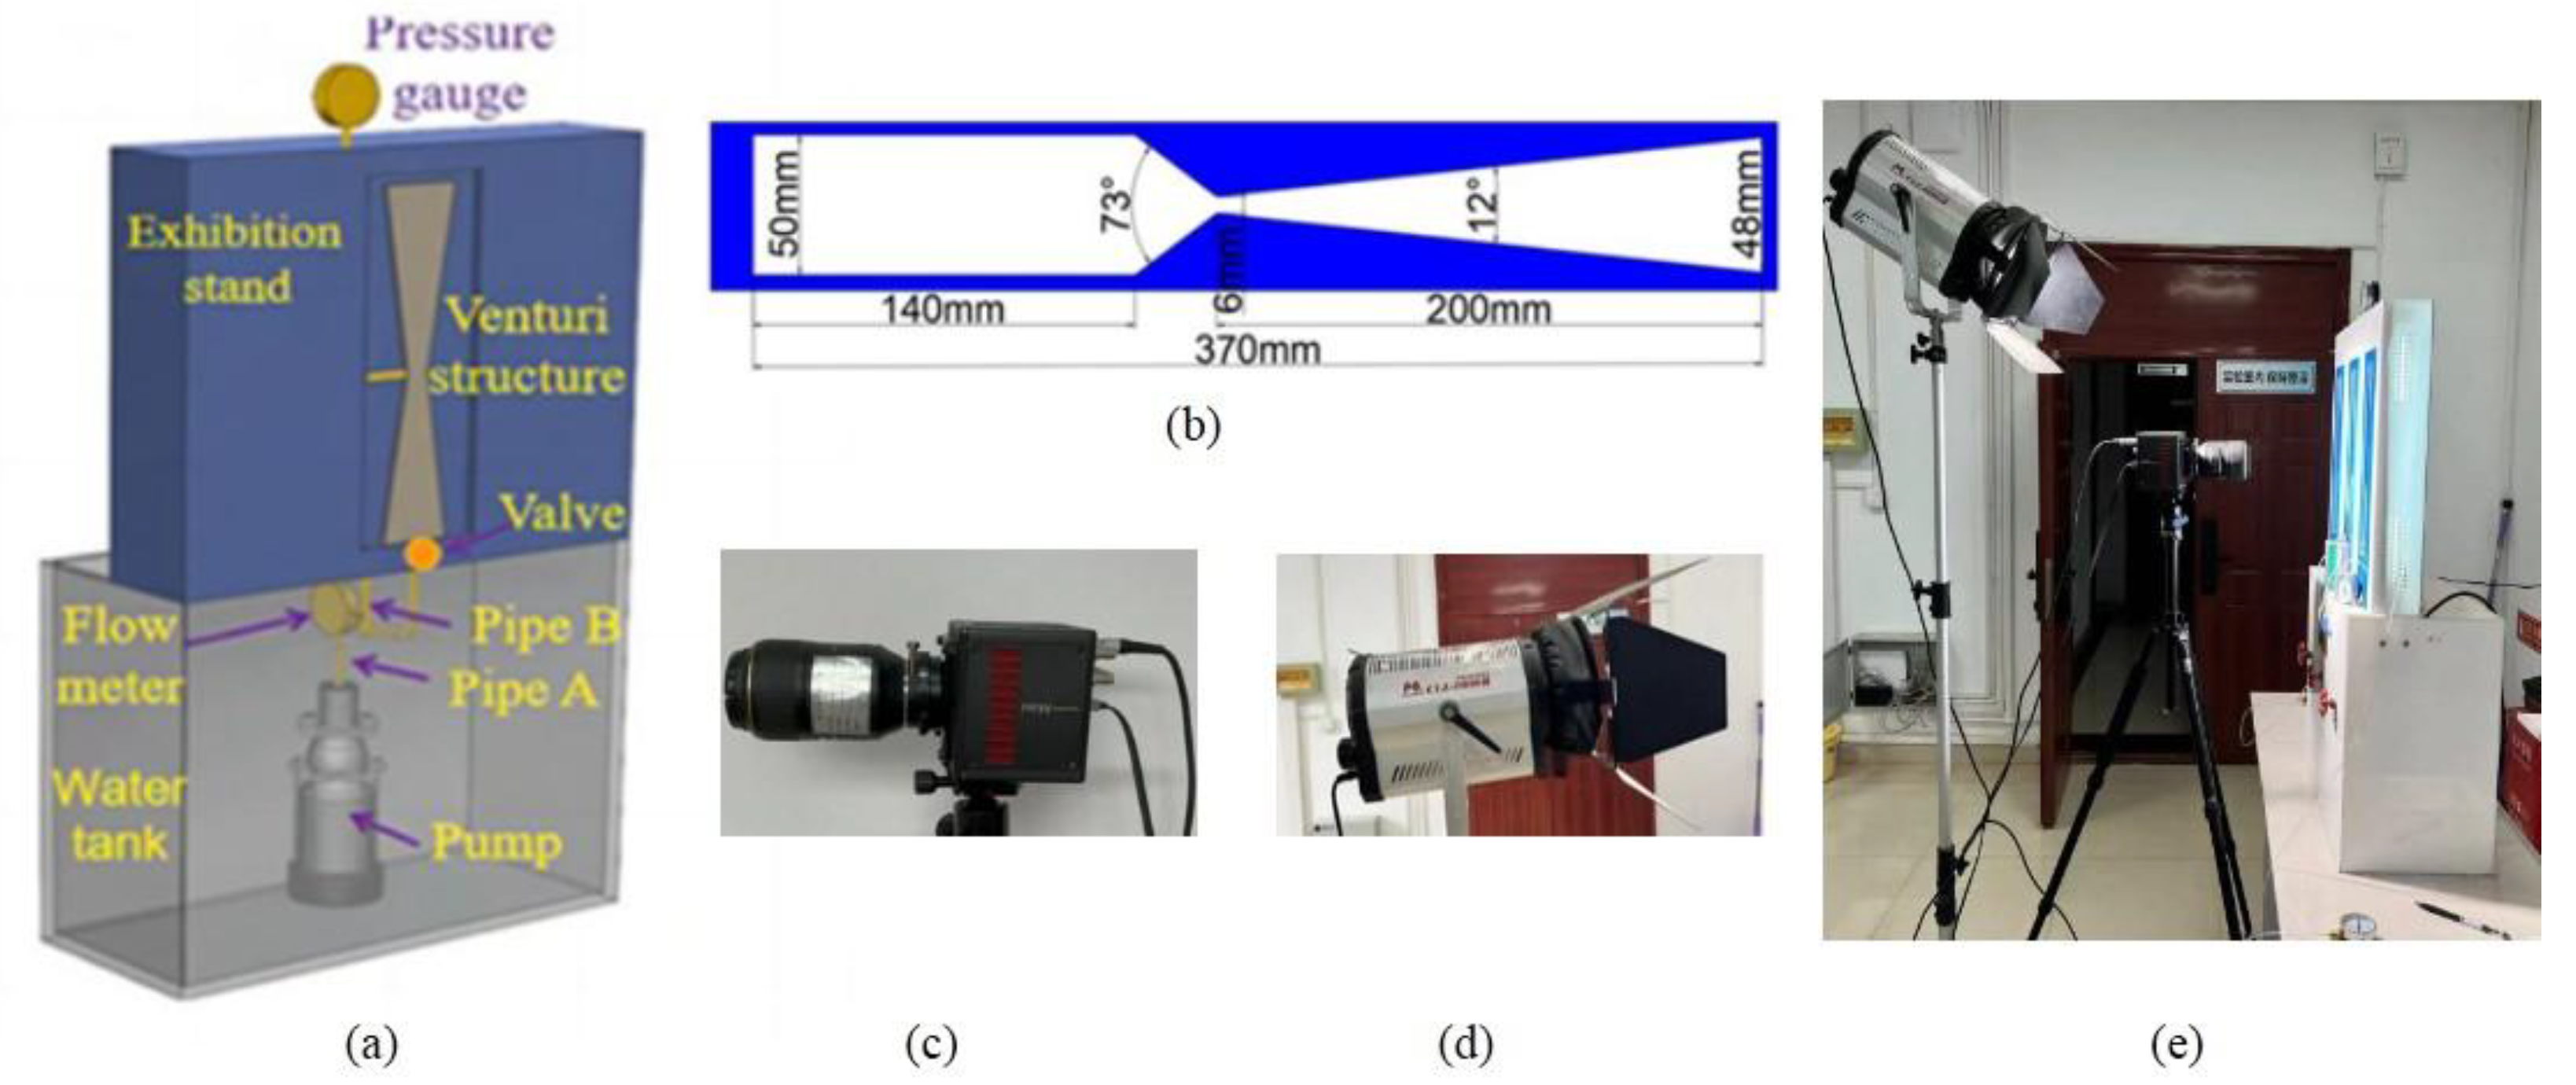
Figure 2.
Viscosity measuring instrument. (a) NDJ-8S digital display viscometer (b) Zero rotor.
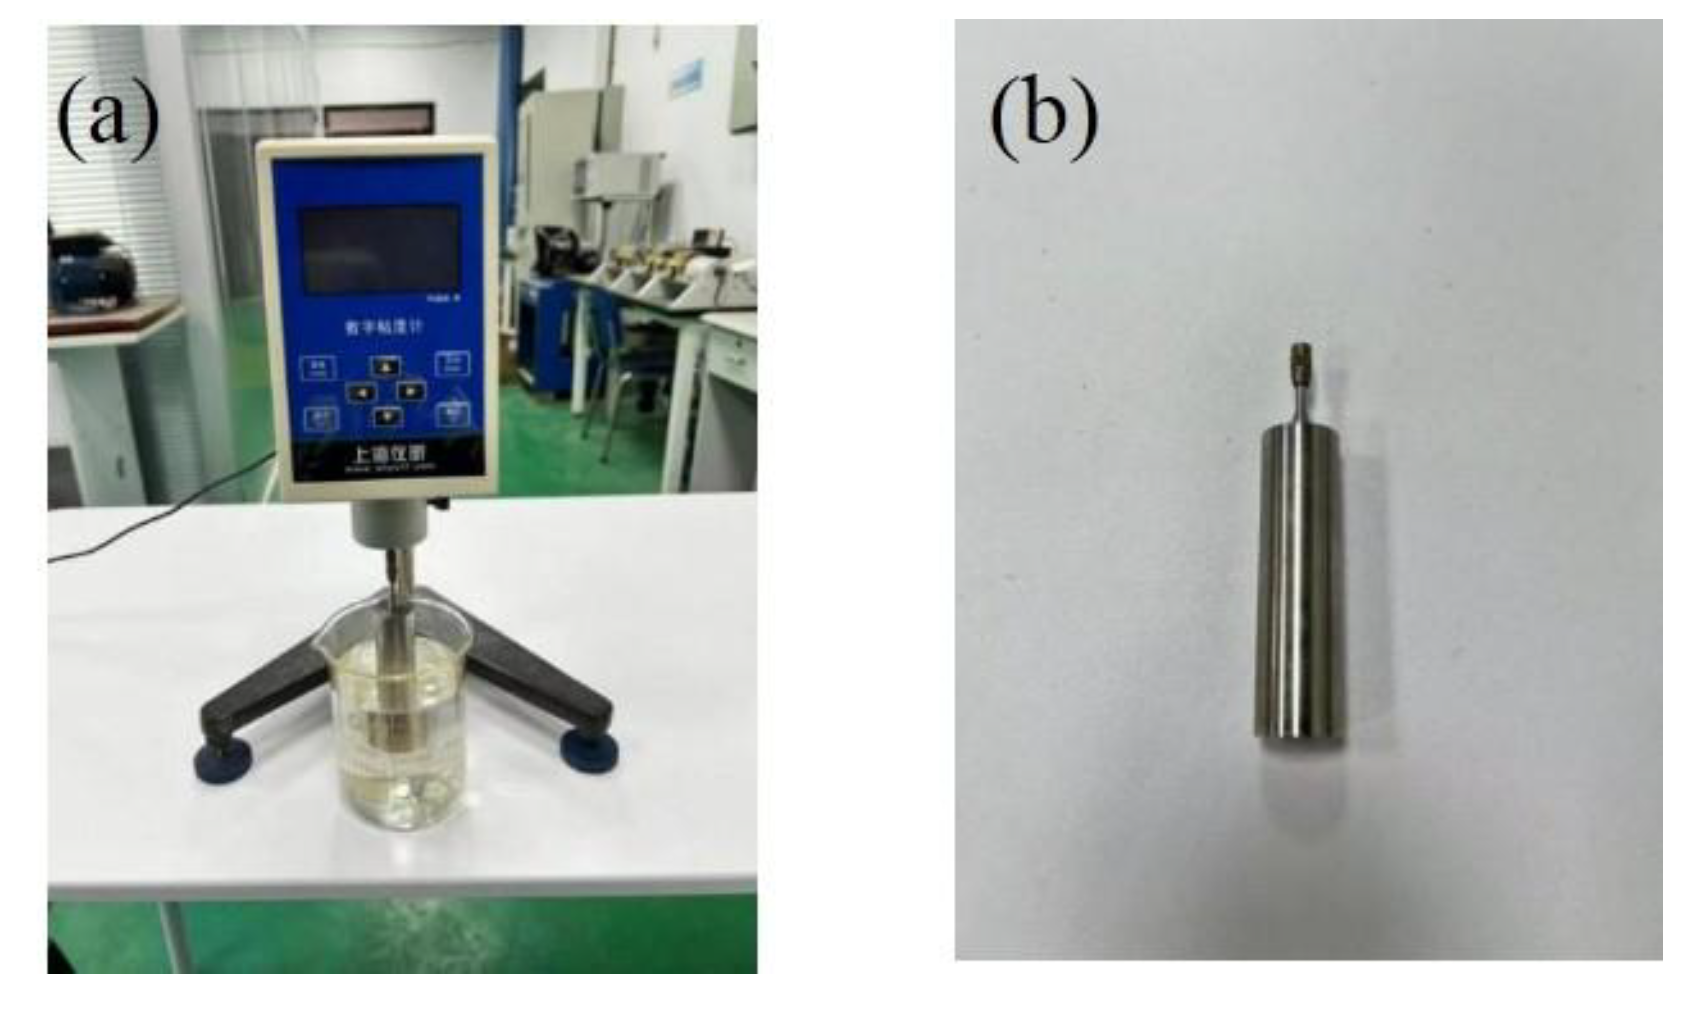
Figure 3.
Change in cavitation number with the viscosity of sand water.
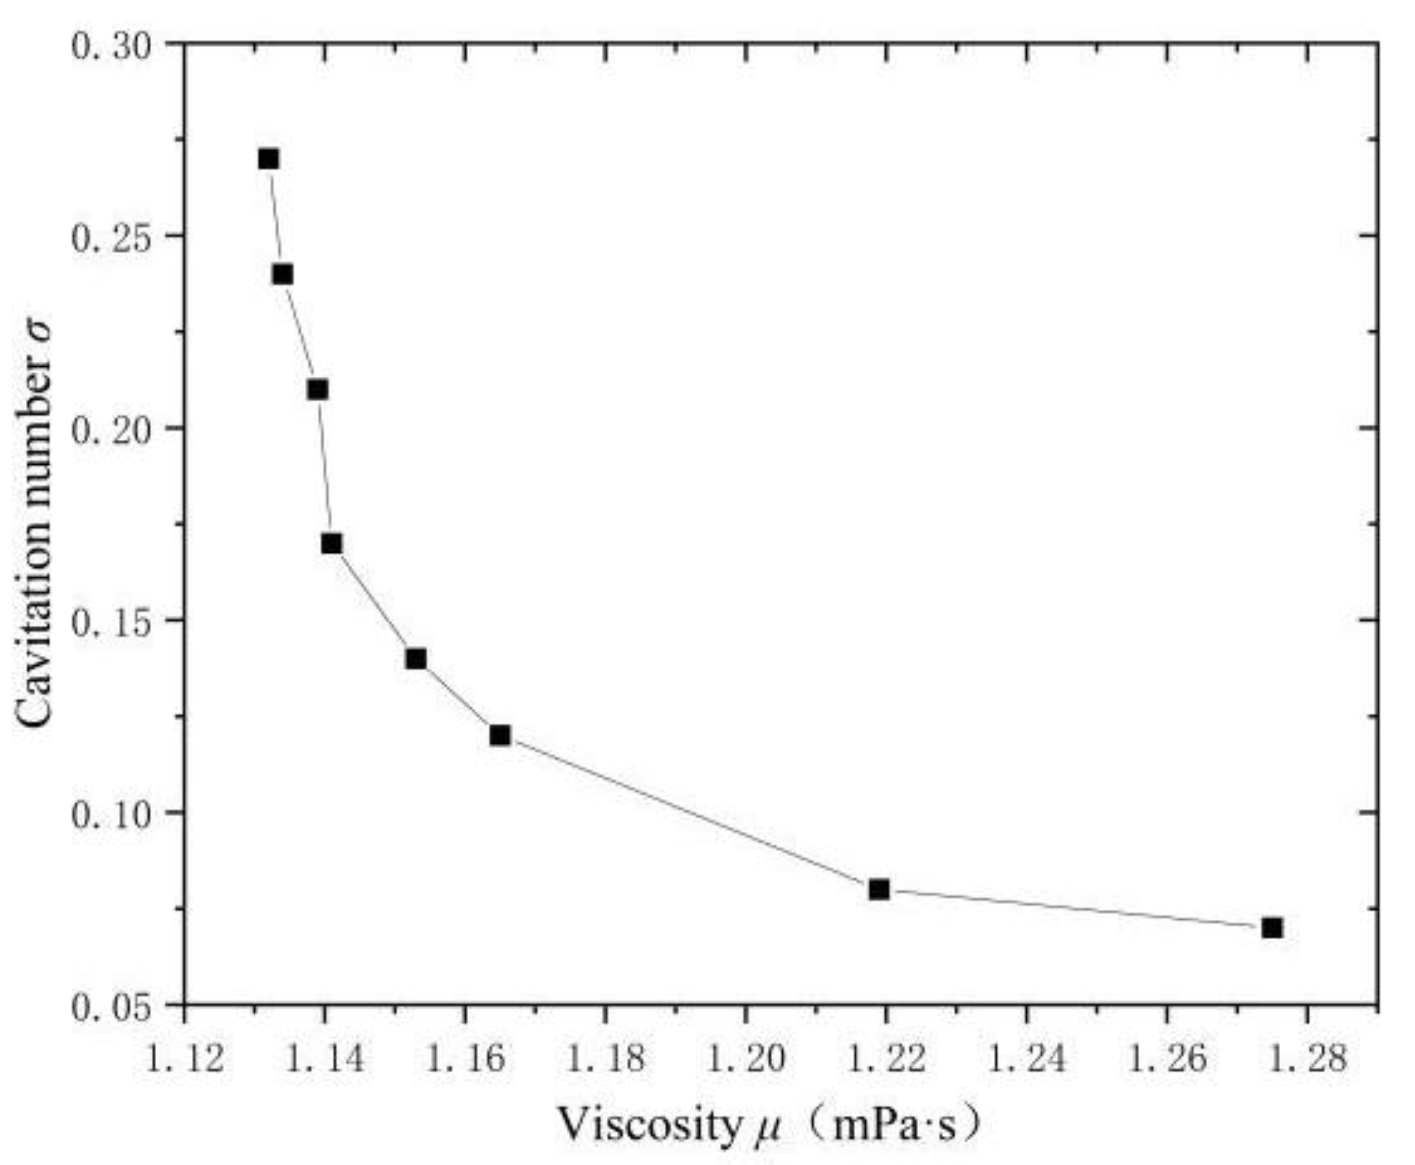
Figure 4.
Cavitation evolution after binarization of sand water. (a) d=0.05mm (b) d=0.07mm (c) d=0.09mm.
Figure 4.
Cavitation evolution after binarization of sand water. (a) d=0.05mm (b) d=0.07mm (c) d=0.09mm.
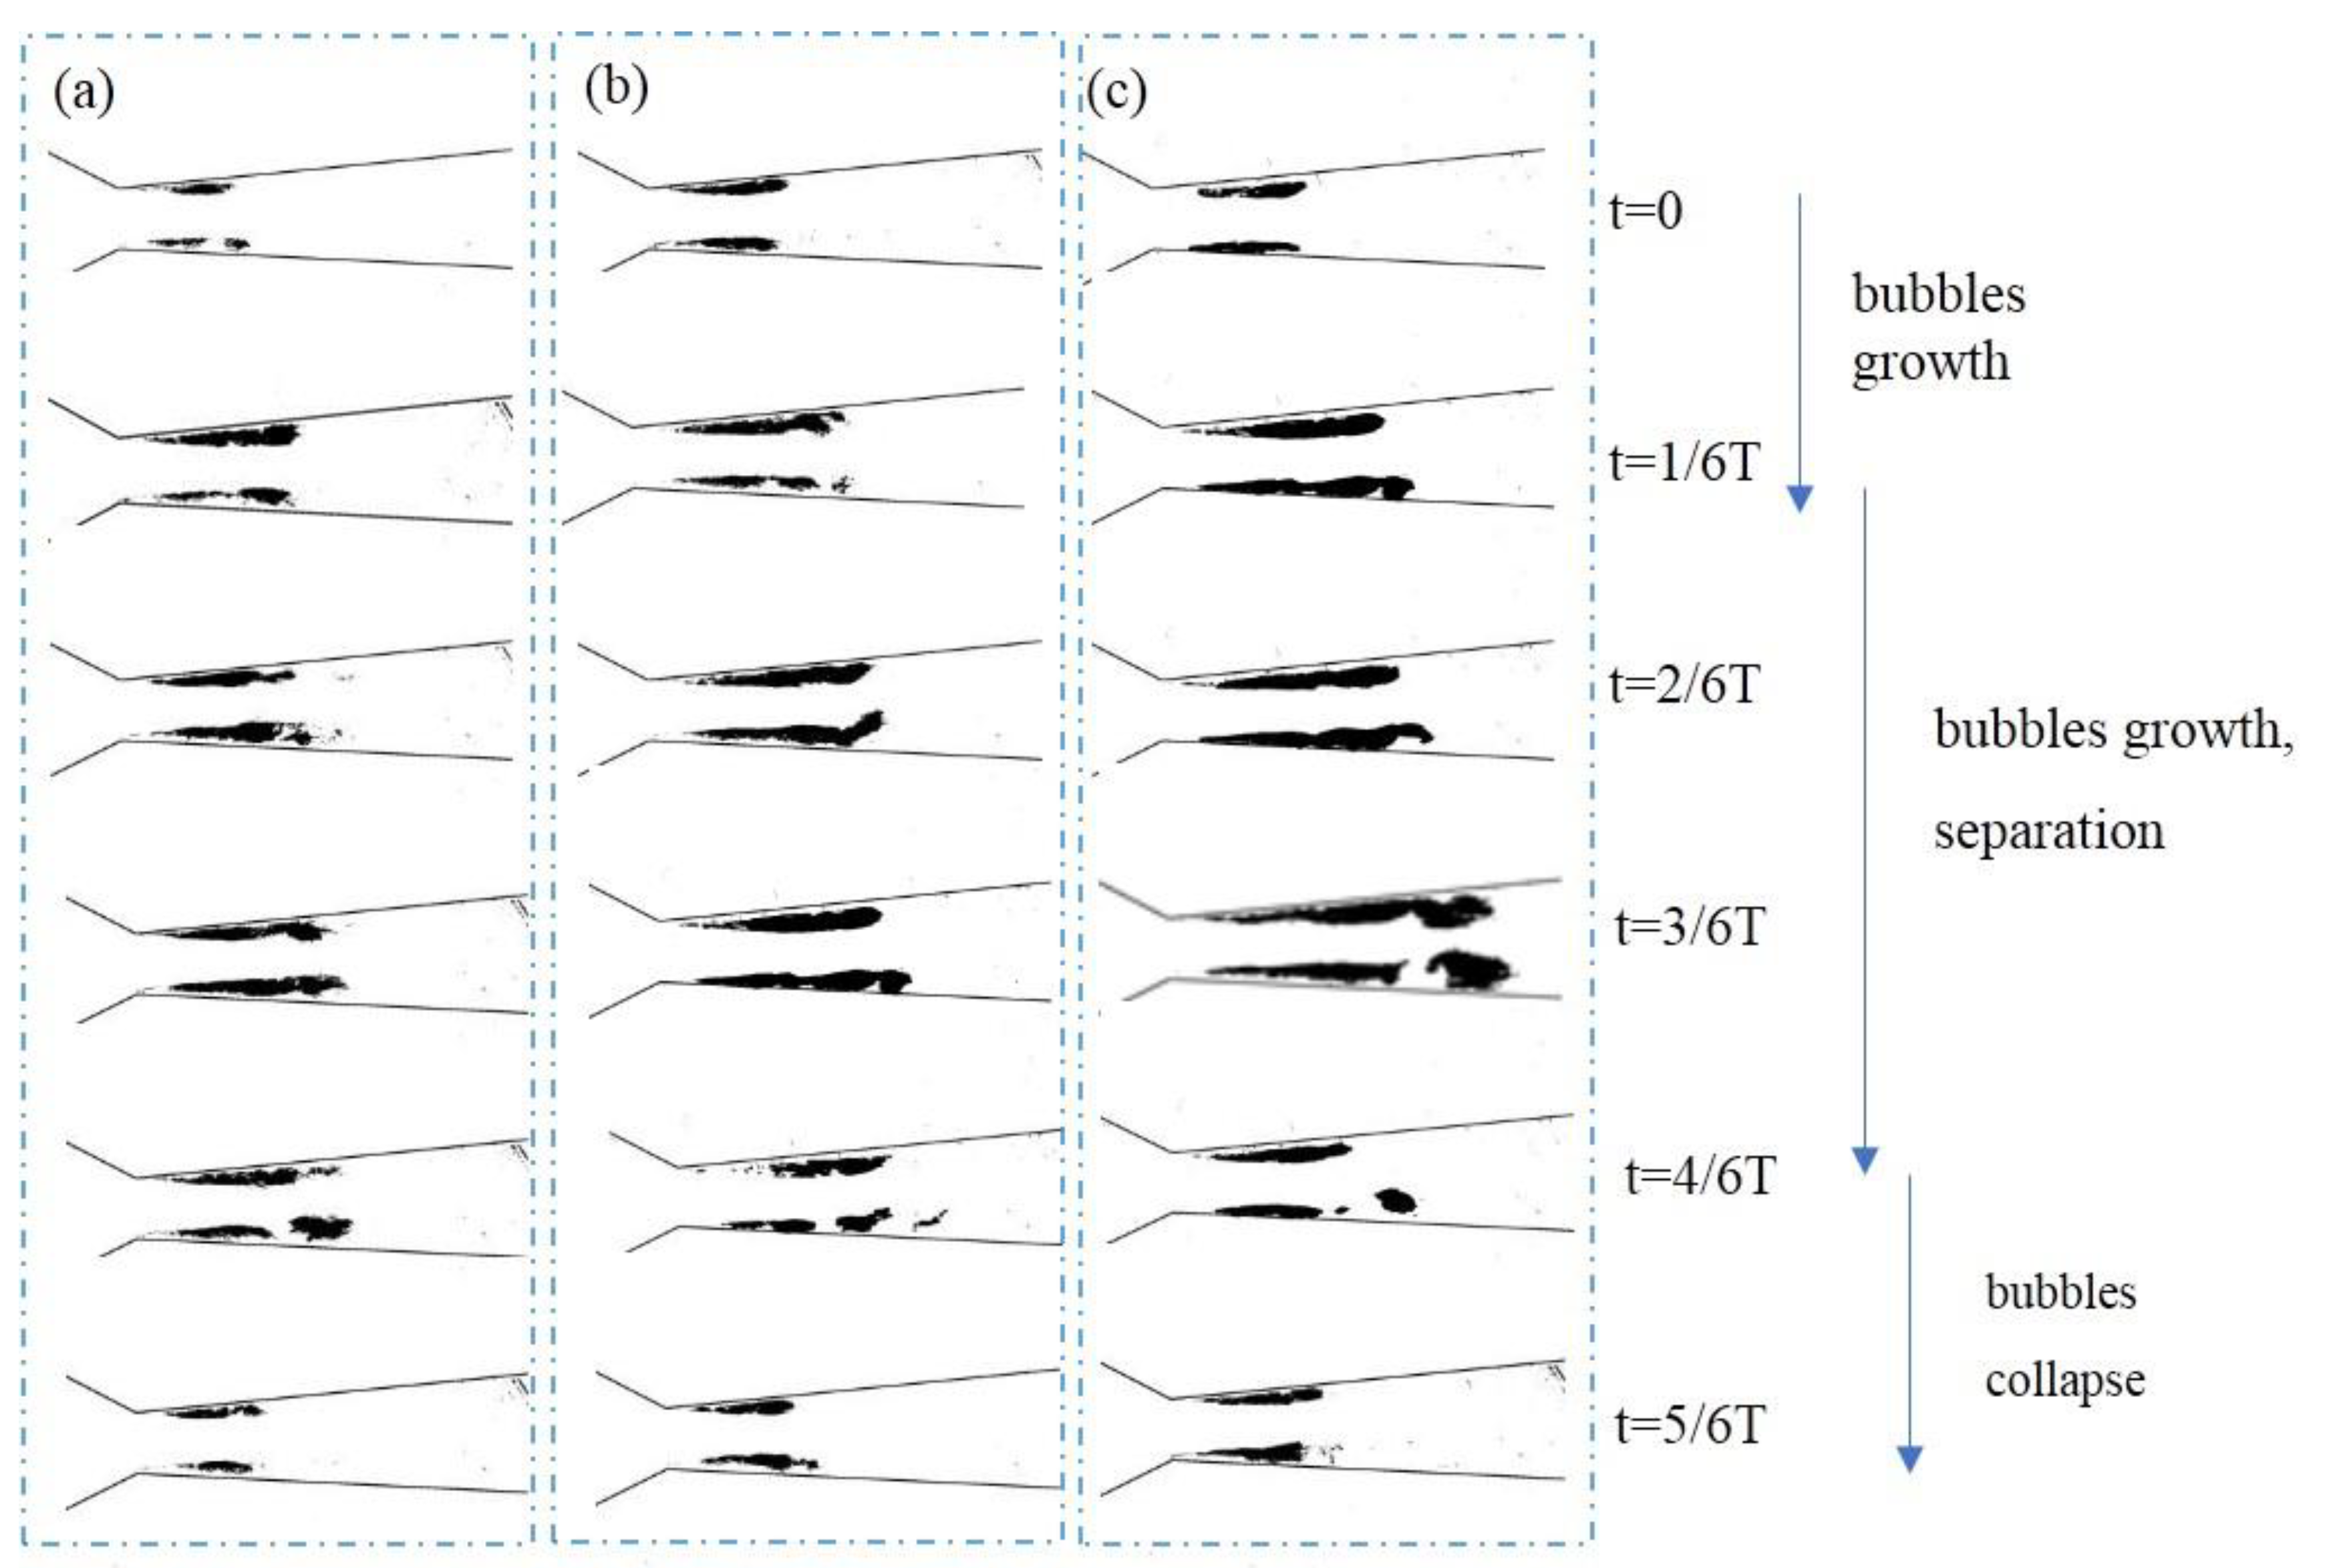
Figure 5.
Periodic variation of the cavitation cloud length (Q=294 mL/s). (a) Clear water (b) d=0.09mm (c) d=0.07mm (d) d=0.05mm.
Figure 5.
Periodic variation of the cavitation cloud length (Q=294 mL/s). (a) Clear water (b) d=0.09mm (c) d=0.07mm (d) d=0.05mm.

Figure 6.
Effects of sediment size and concentration on cavitation period.
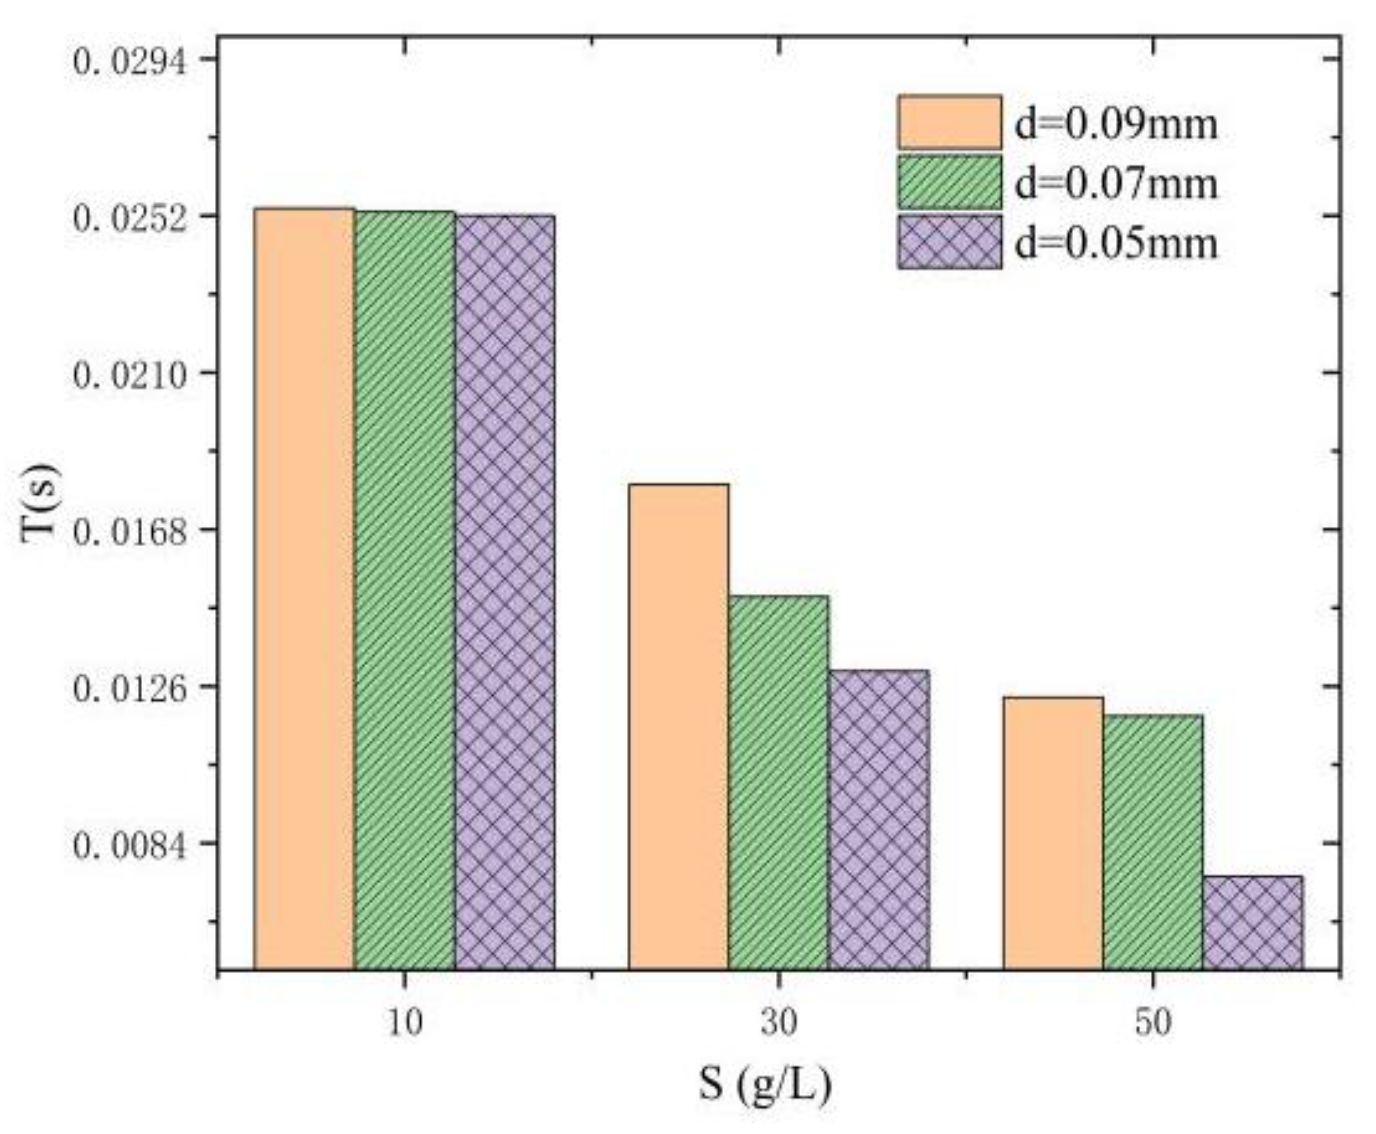
Figure 7.
Variations in the maximum cavitation cloud length with particle size and sediment content.
Figure 7.
Variations in the maximum cavitation cloud length with particle size and sediment content.
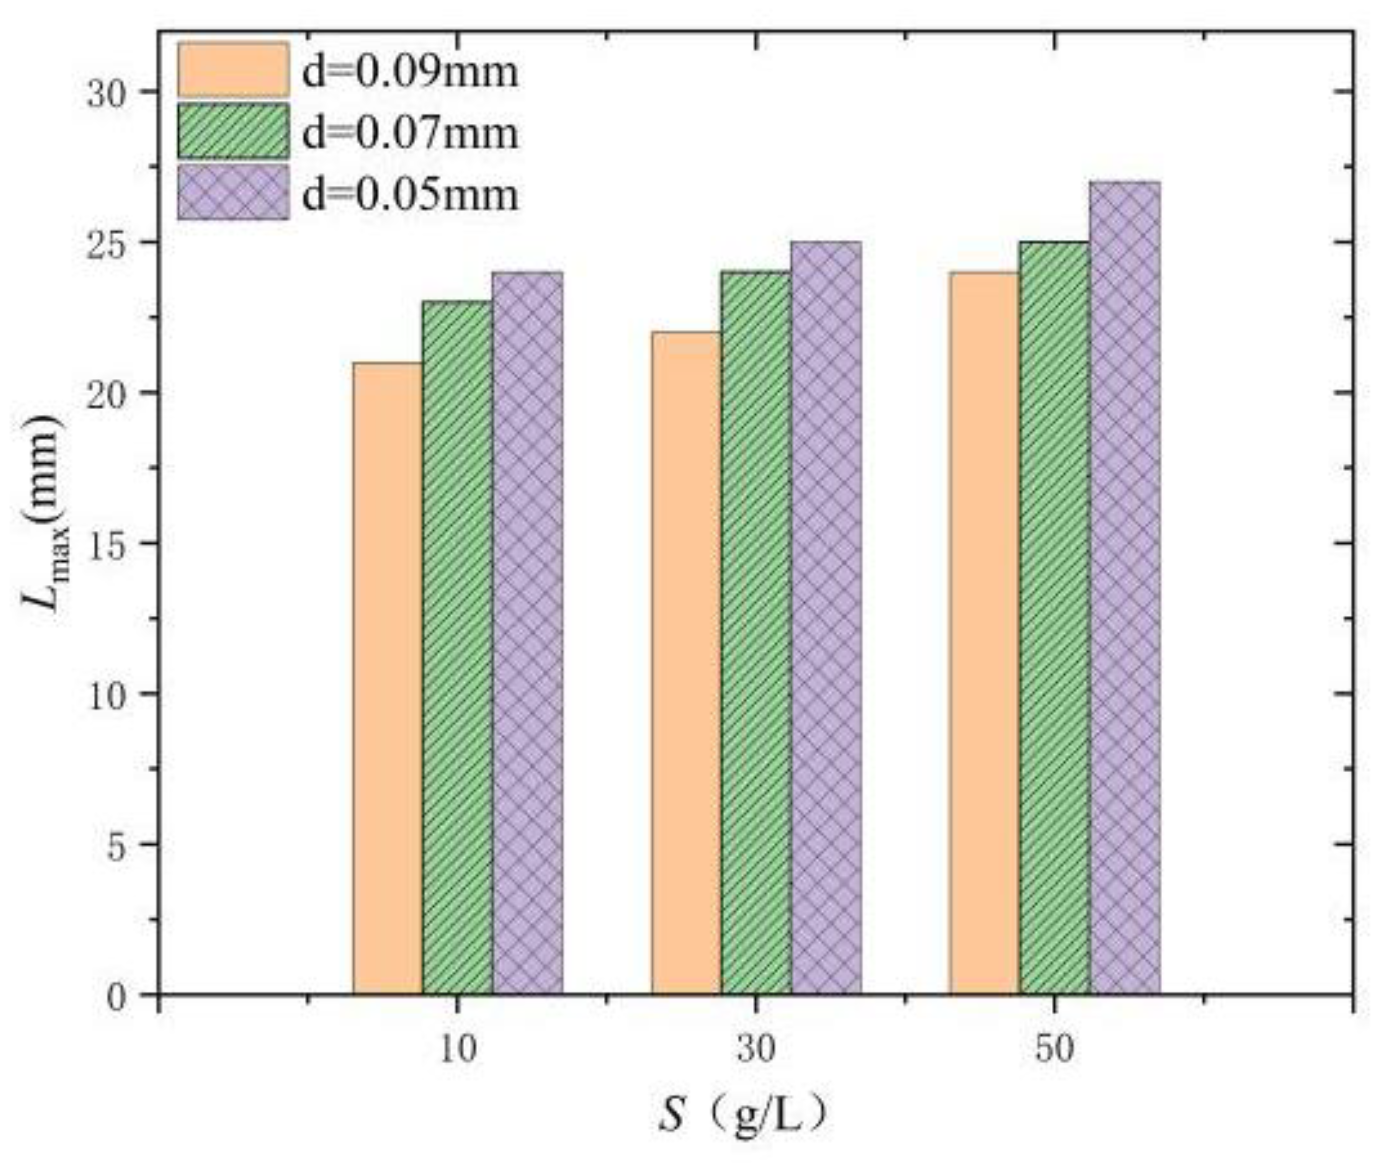
Figure 8.
Numerical geometric model. (a) Three-dimensional modeling of the channel (b) Mesh throat encryption diagram.
Figure 8.
Numerical geometric model. (a) Three-dimensional modeling of the channel (b) Mesh throat encryption diagram.
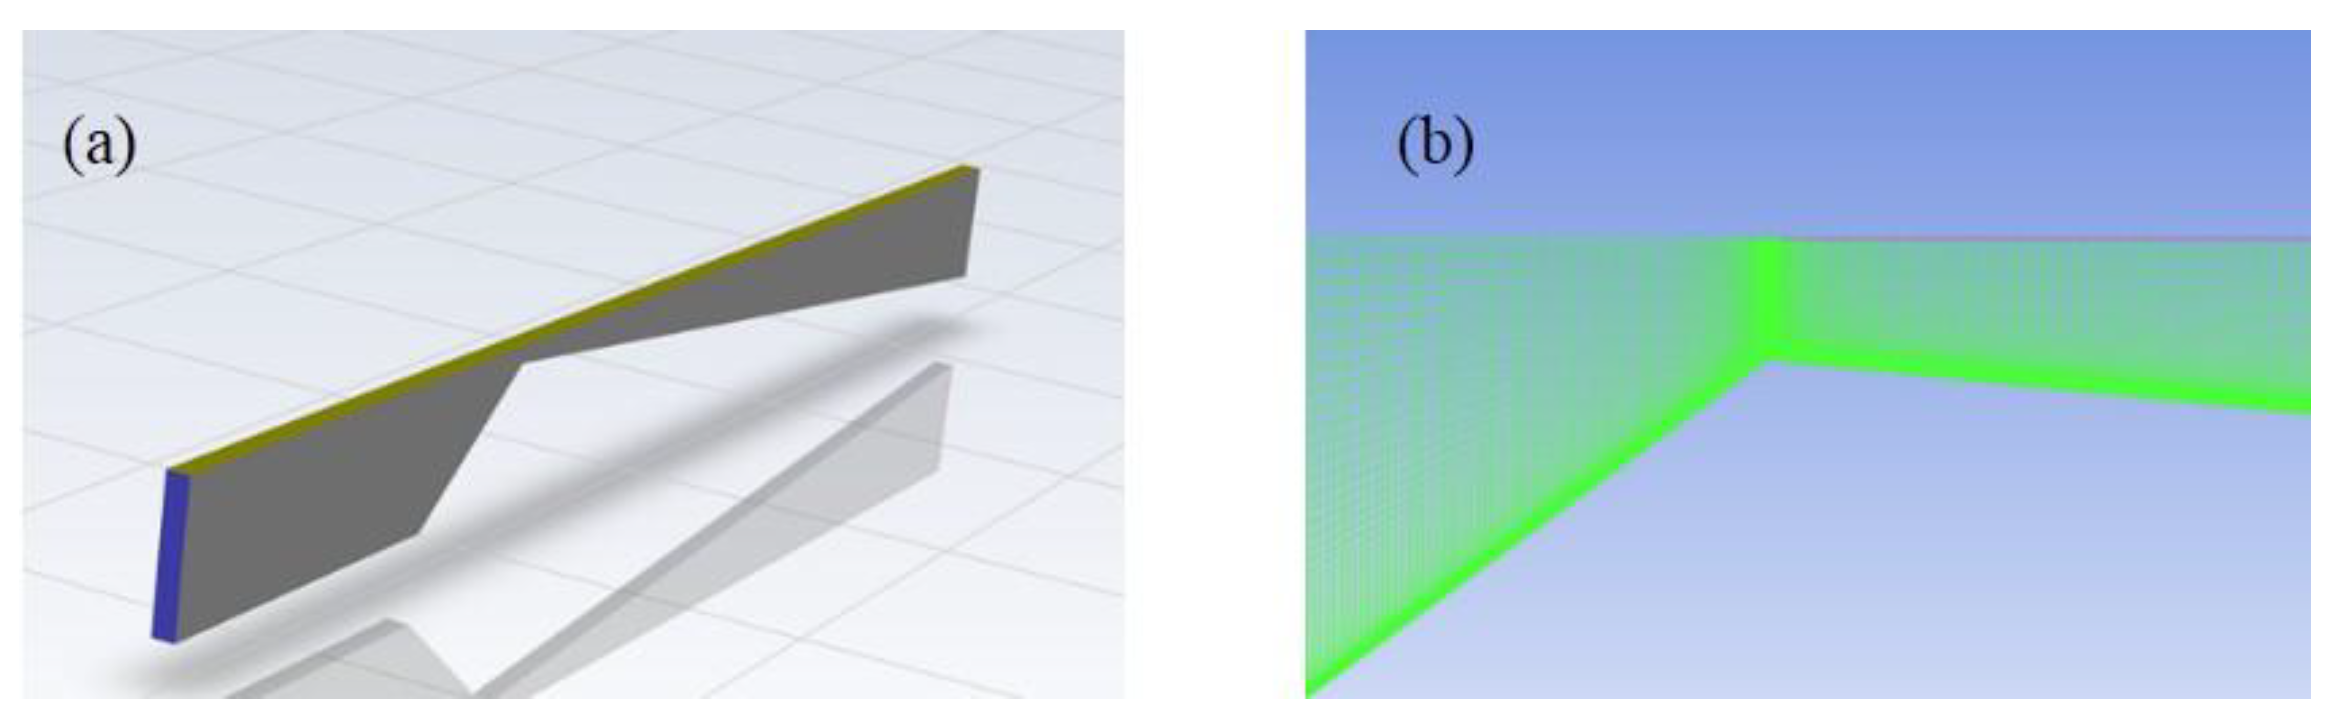
Figure 9.
Comparison of the cavitation morphology between the experimental and numerical calculation. (a) S=50g/L (b) S=30g/L.
Figure 9.
Comparison of the cavitation morphology between the experimental and numerical calculation. (a) S=50g/L (b) S=30g/L.
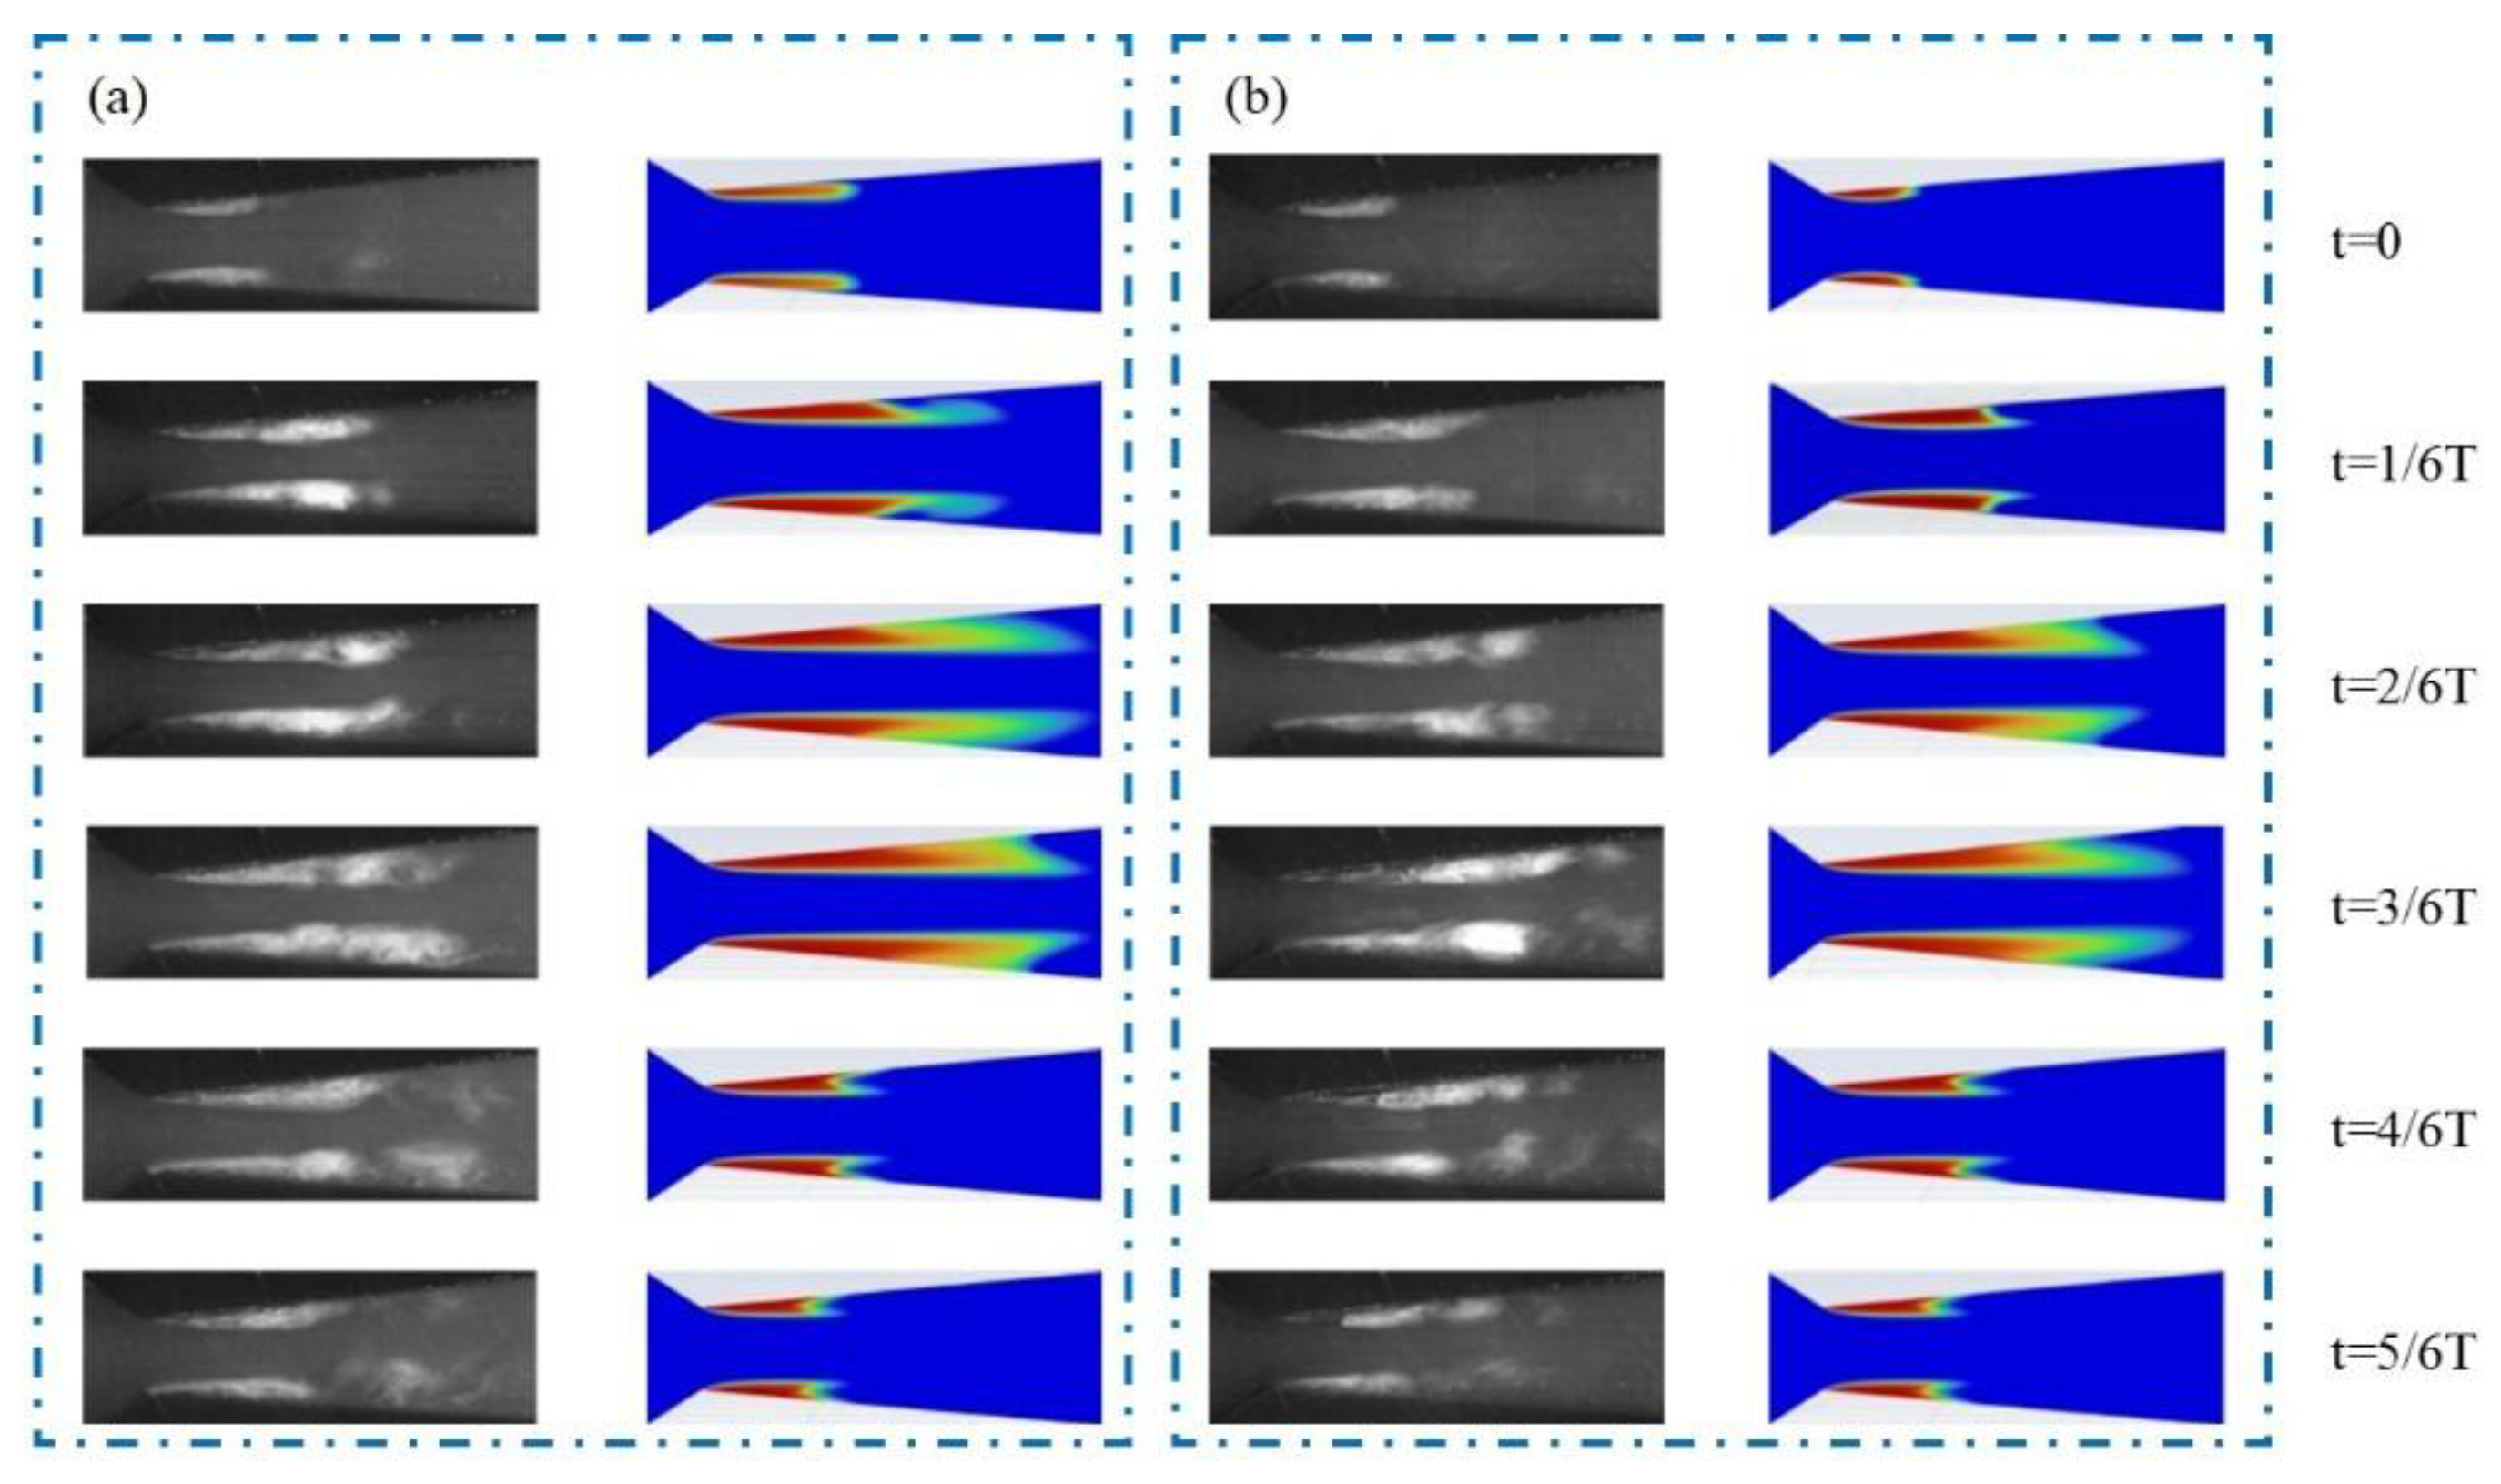
Figure 10.
Comparison of the cavitation cloud evolution period between the experiment and numerical calculation. (a) S=50g/L (b) S=30g/L.
Figure 10.
Comparison of the cavitation cloud evolution period between the experiment and numerical calculation. (a) S=50g/L (b) S=30g/L.
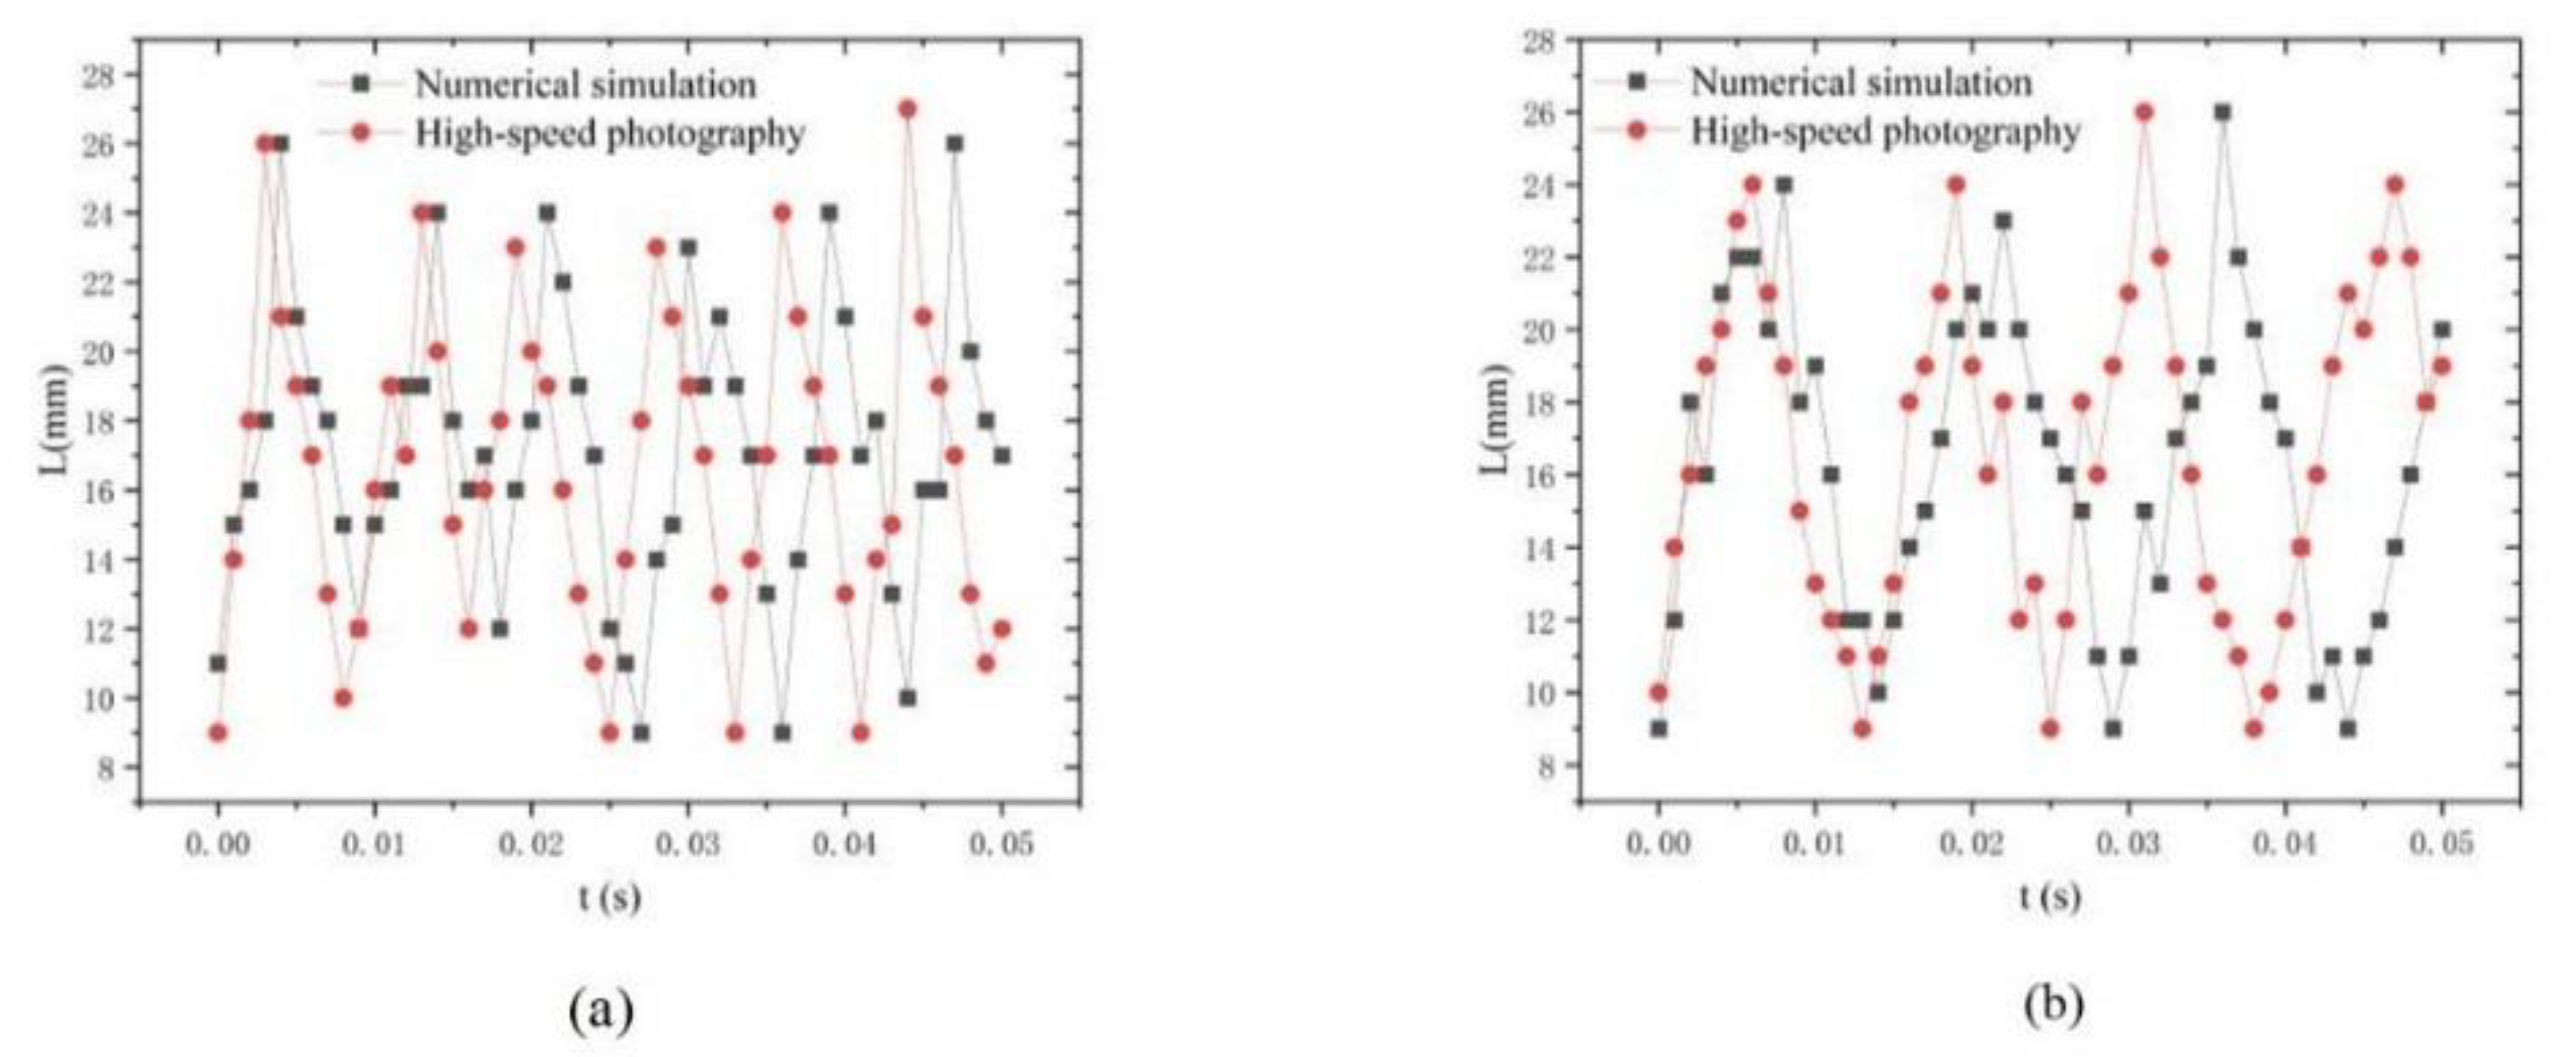
Figure 11.
Streamline of the cavitation of sand water.
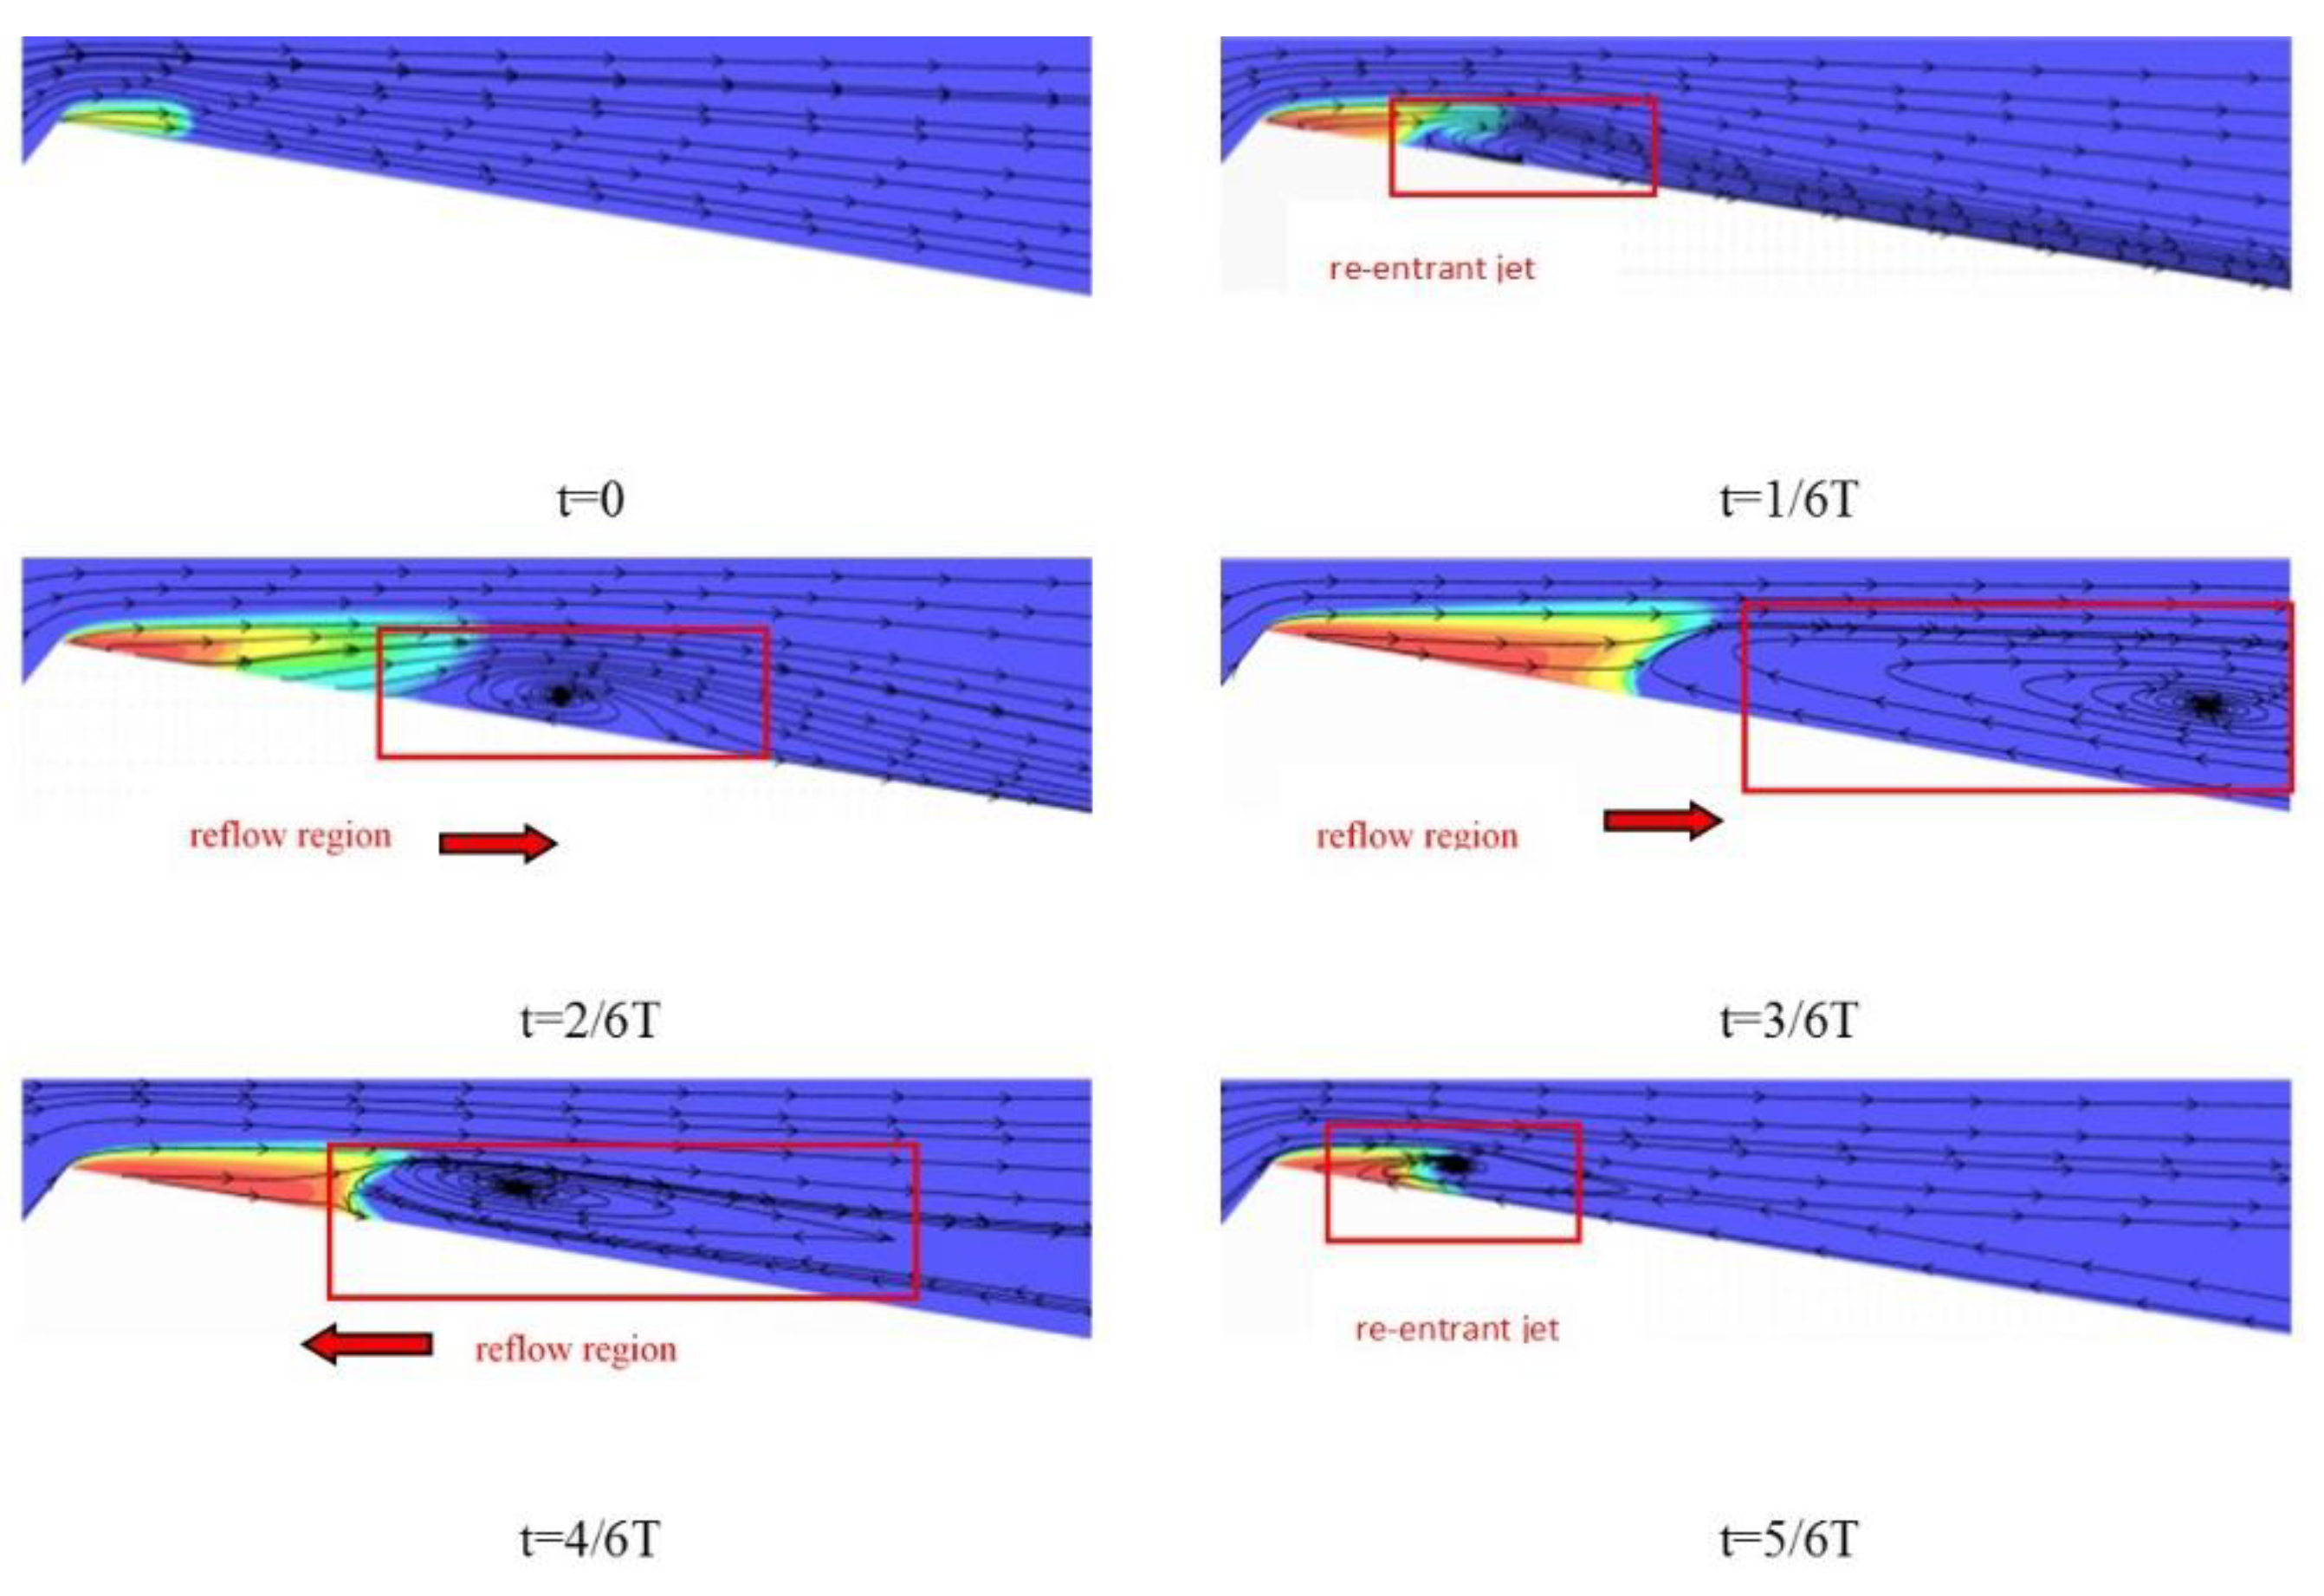
Figure 12.
Evolution of streamline with different sediment content. (a) t=1/6T (b)t=4/6T.

Figure 13.
Sediment distribution near the throat. (a) S=50g/L (b) S=30g/L.
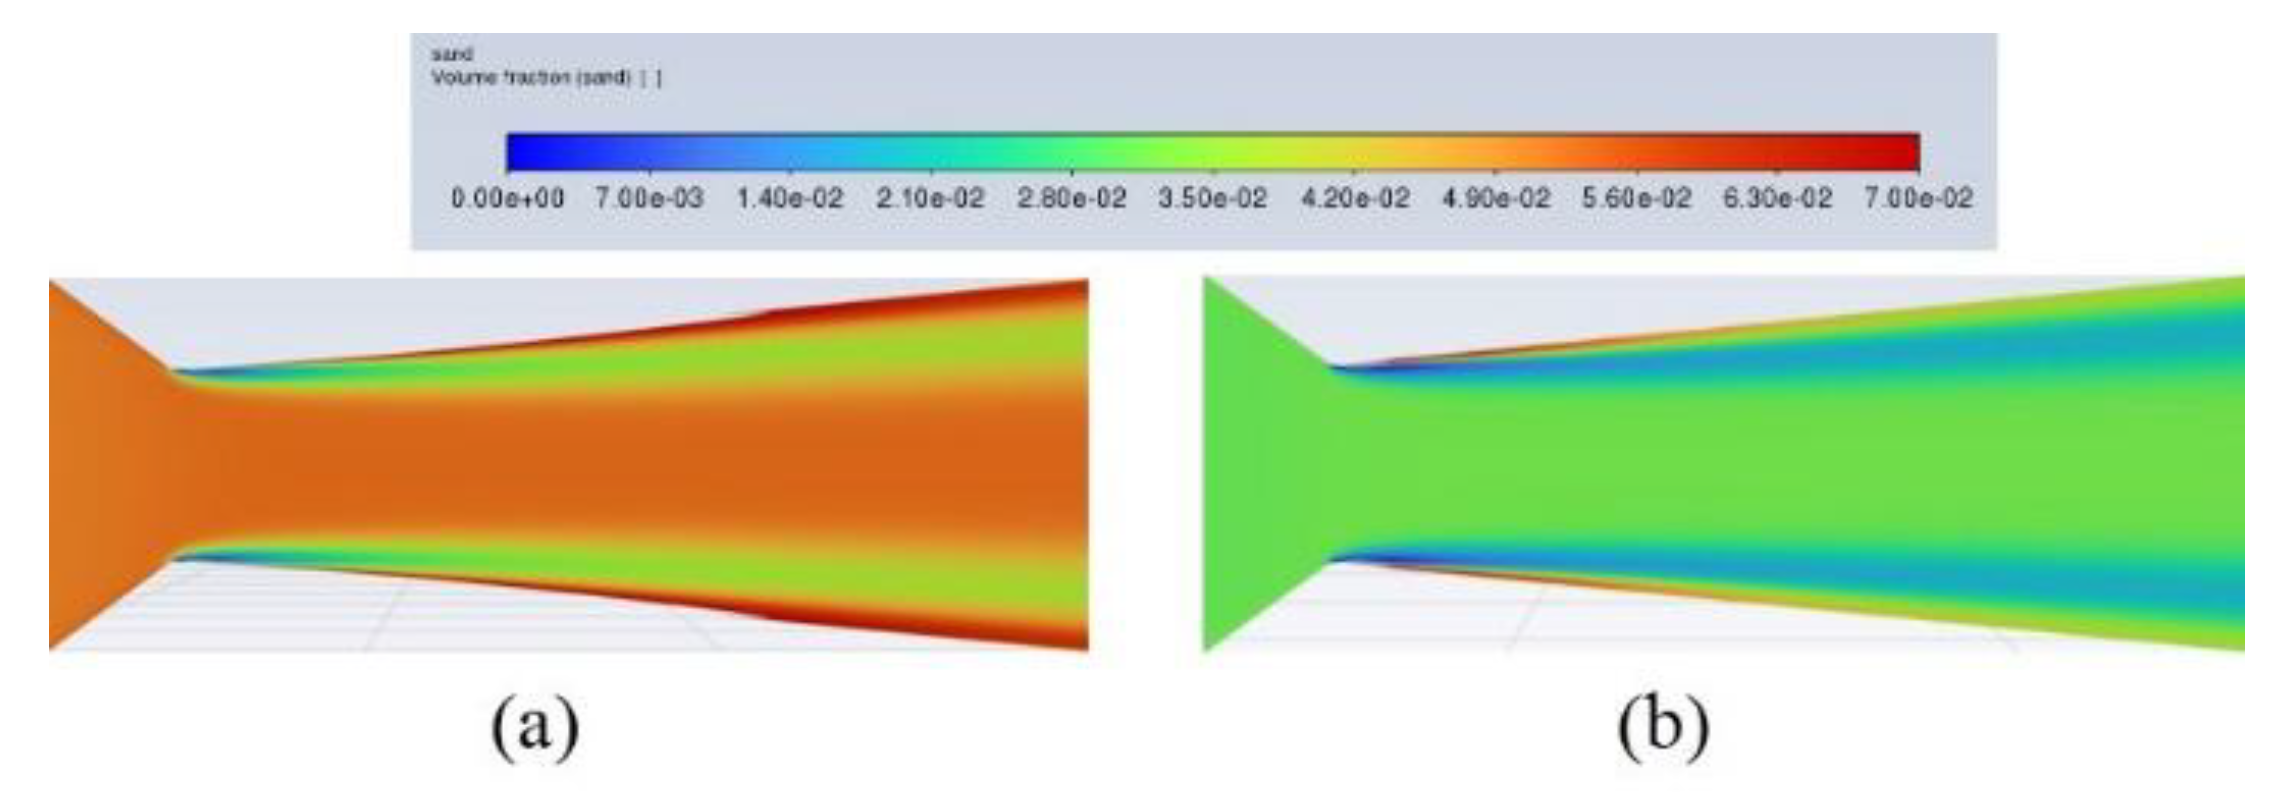
Figure 14.
Vorticity structure evolution of sandy water cavitation.
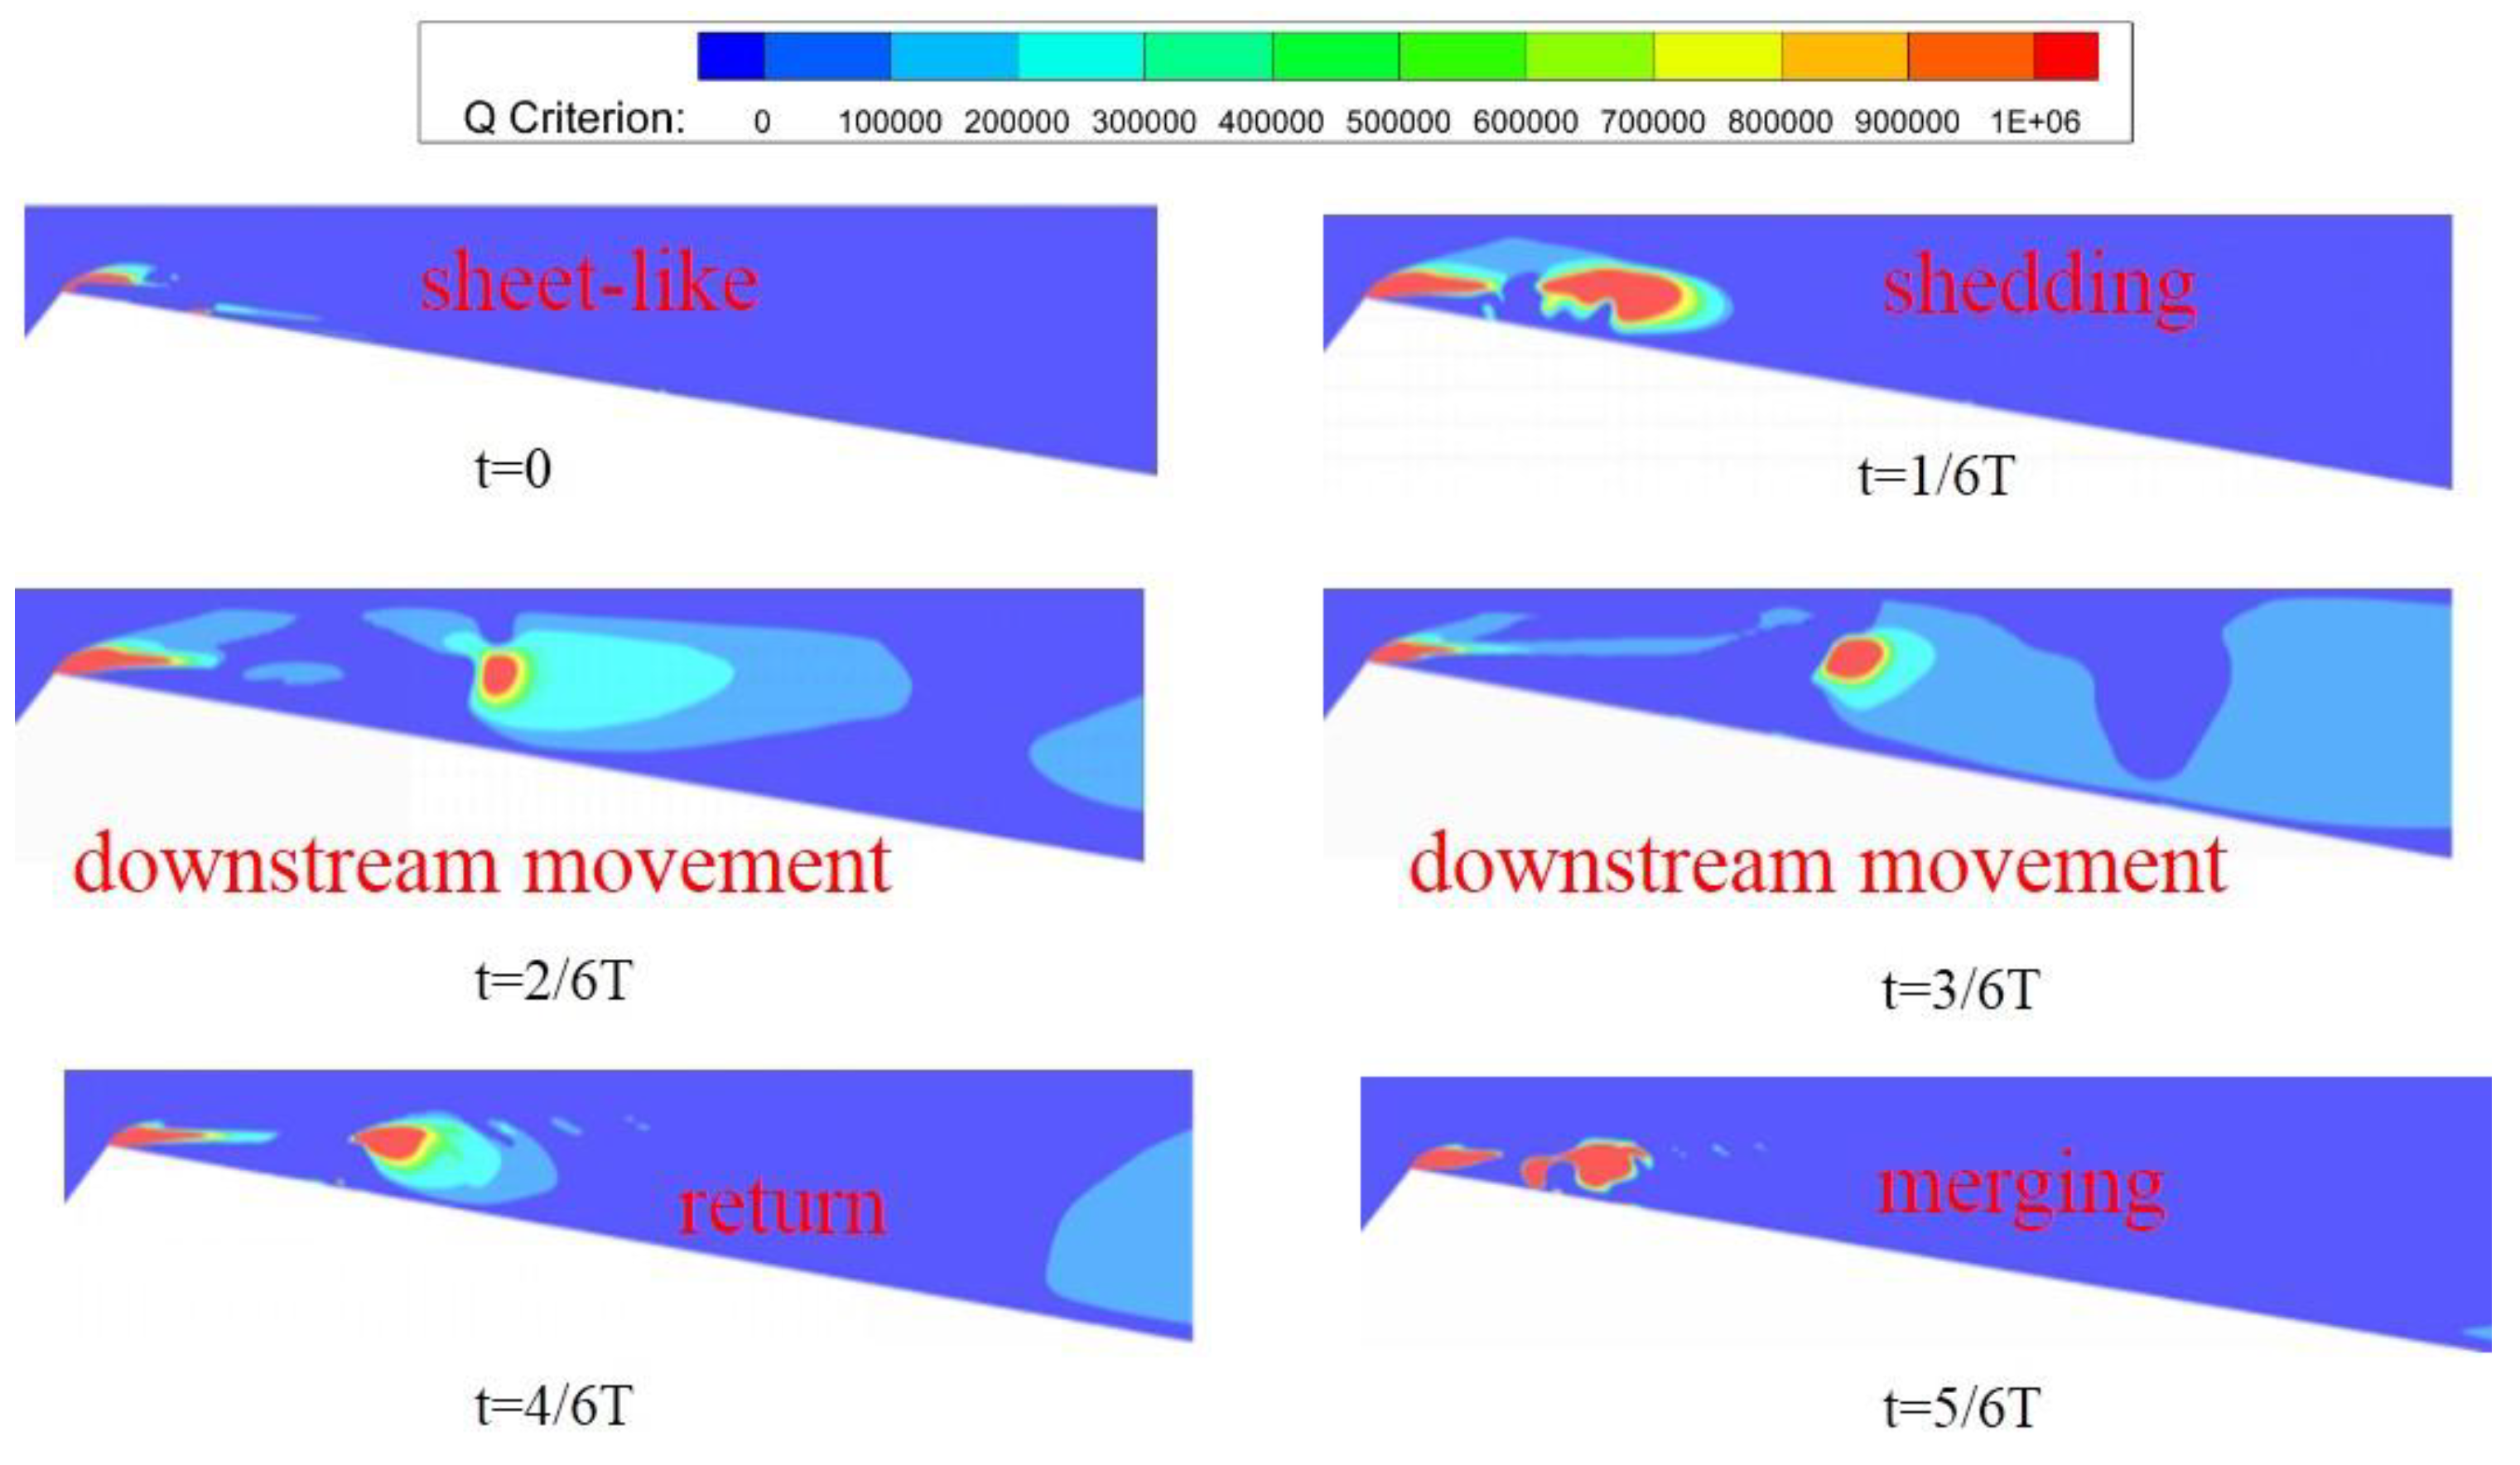
Figure 15.
Vorticity evolution with different sediment content. (a) t=4/6 T (b) t=5/6T.
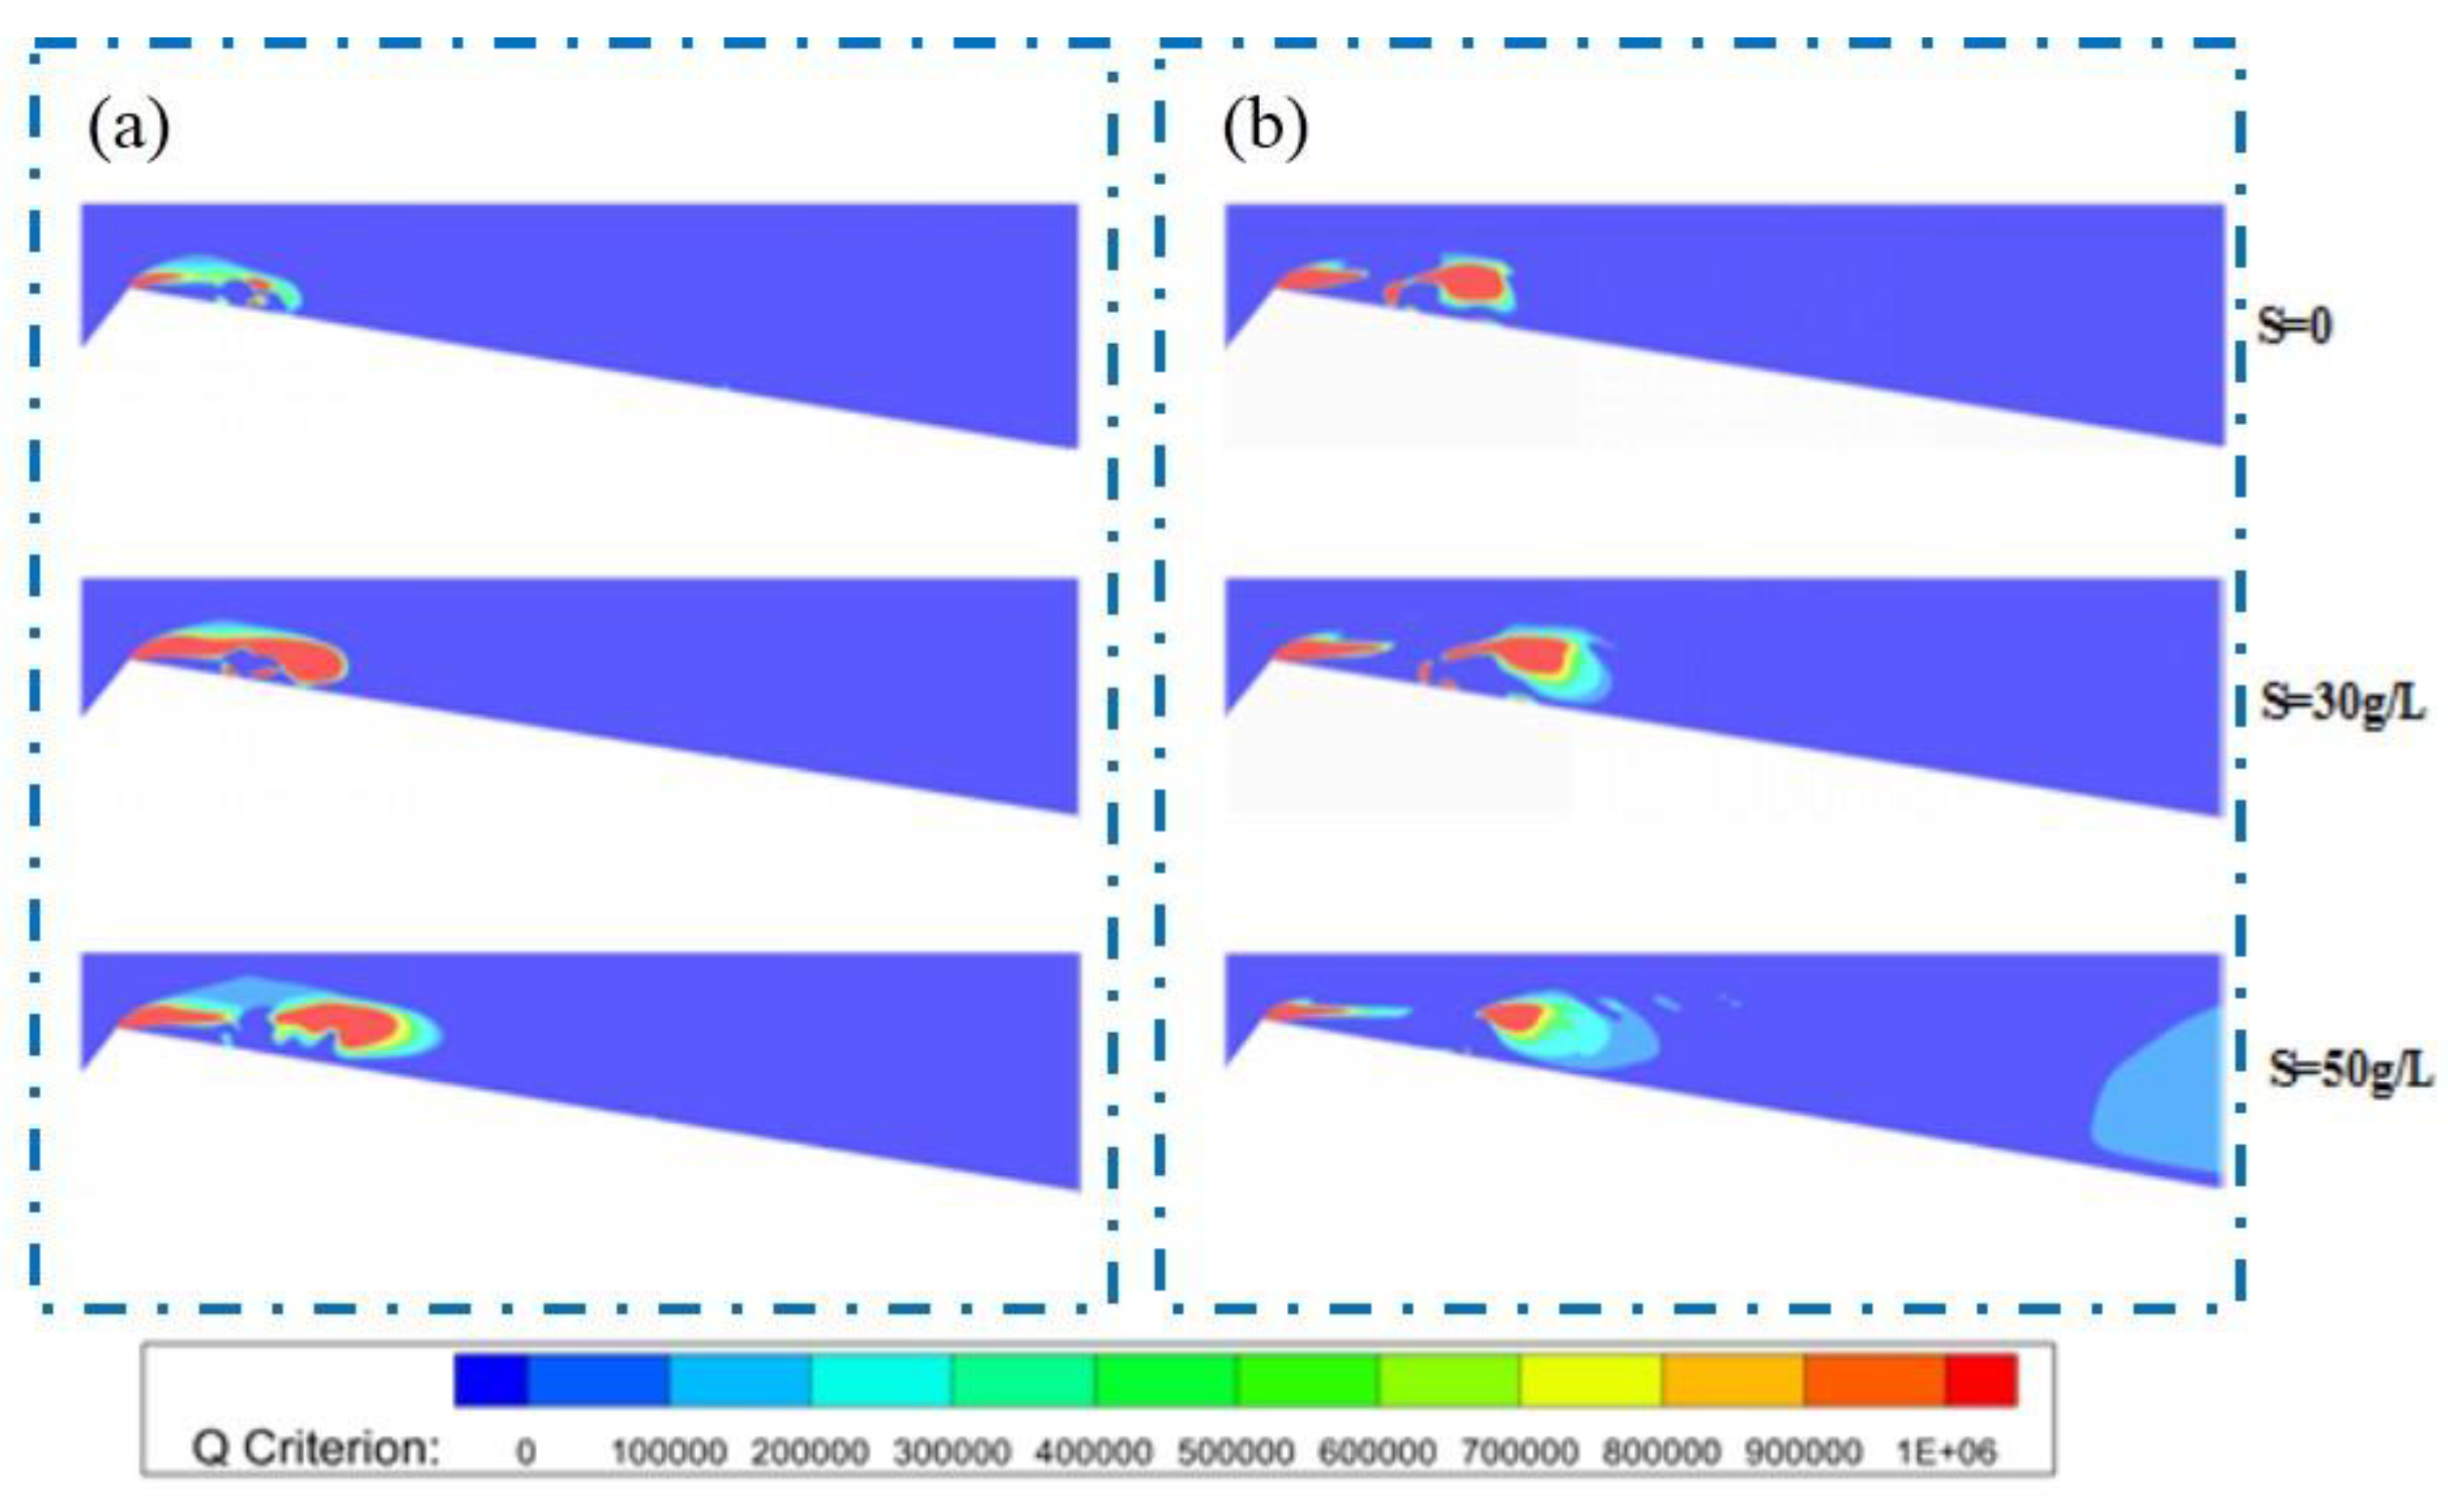

Table 1.
Viscosity of sand water μ (mPa·s).
| S (g/L) | 10 | 30 | 50 | |
| d (mm) | ||||
| 0.09 | 1.132 | 1.141 | 1.219 | |
| 0.07 | 1.134 | 1.153 | 1.275 | |
| 0.05 | 1.139 | 1.165 | 1.756 | |
Table 2.
Cavitation number of sand water.
| d (mm) | S (g/L) | Pthroat (Pa) | σ |
| 0.09 | 10 | 22325 | 0.27 |
| 30 | 14325 | 0.17 | |
| 50 | 8325 | 0.08 | |
| 0.07 | 10 | 19325 | 0.24 |
| 30 | 11825 | 0.14 | |
| 50 | 7325 | 0.07 | |
| 0.05 | 10 | 17325 | 0.21 |
| 30 | 10325 | 0.12 | |
| 50 | 6325 | 0.06 |
Disclaimer/Publisher’s Note: The statements, opinions and data contained in all publications are solely those of the individual author(s) and contributor(s) and not of MDPI and/or the editor(s). MDPI and/or the editor(s) disclaim responsibility for any injury to people or property resulting from any ideas, methods, instructions or products referred to in the content. |
© 2025 by the authors. Licensee MDPI, Basel, Switzerland. This article is an open access article distributed under the terms and conditions of the Creative Commons Attribution (CC BY) license (http://creativecommons.org/licenses/by/4.0/).
Copyright: This open access article is published under a Creative Commons CC BY 4.0 license, which permit the free download, distribution, and reuse, provided that the author and preprint are cited in any reuse.


