1. Introduction
To improve the performance of alternative energy systems, nanotechnology has an important role in the development of new materials and the study of their physical and chemical properties at the nanoscale [
1]. Metal oxides with inverse spinel structure such as NiFe
2O
4 have been studied as cathode material for hydrogen evolution, and energy storage in supercapacitors [
2,
3,
4]. Controlling the nanoparticle size will improve the performance of catalysts [
5]. These electrocatalysts are interesting for their use in microbial fuel cells because they offer good stability and low cost compared to platinum (Pt), the catalyst commonly used for the oxygen reduction reaction (ORR) [
6,
7]. The general formula for the normal spinel is AB
2O
4, where A indicates the presence of an M
2+ ion occupying a tetrahedral site, while B refers to an M
3+ ion at an octahedral site. In the case of the inverse spinel, the M
2+ ions change towards the octahedral site and half of the M3+ ions change to the tetrahedral site, the rest of the M
3+ ions fill the octahedral site with the M
2+ ions [
8]. Therefore, inverse spinels are formulated as [B
3+(A
2+B
3+)O
4]. This cationic arrangement could provide the transfer of electrons to carry out the ORR [
9,
10].
Furthermore, spinel MFe
2O
4 nanostructures (M=Co, Mn, Ni) loaded on carbon-based supports can used as a low-cost alternative to electrocatalysis with a 4e- direct path transport mechanism [
11,
12,
13]. This can be attributed to the fact that a non-stoichiometric structure can create defects causing oxygen vacancies [
14]. To improve the electrocatalytic performance of nickel ferrite, materials such as graphene and carbon nanotubes [
15,
16,
17] have been used as alternative catalysts because they can be modified with other materials and improve development for ORR [
18]. Graphene is a two-dimensional nanomaterial (2D), consisting of a single layer of carbon atoms and have large specific surface area (~2075 m
2g
-1). On another hand, graphene oxide (GO) it can be obtained in large amount by Hummers’ method [
19,
20,
21]. GO as a support can improve the activity of the catalysts because it contains reactive oxygenated functional groups that make chemical functionalization and therefore a better dispersion [
22,
23].
Herein, we report the synthesis of nickel-doped Fe3O4 decorated graphene oxide for ORR in a microbial fuel cell.
2. Materials and Methods
2.1. Synthesis of Graphene Oxide by Hummer’s Method
Graphene oxide was prepared by oxidation of graphite using a modification of the Hummers’ method reported elsewhere [
24]. Briefly, 2 g of synthetic graphite powder (<20 µm, 99.99 wt.%, Sigma Aldrich) were mixed with 1 g of sodium nitrate (NaNO
3) in a 1000 mL jacketed reactor and 46 mL of concentrated sulfuric acid (H
2SO
4, 98 %) was added to the powder mixture, introducing the flask into an ice bath to keep the reaction at 5 °C with constant stirring for 5 min. Then, 6 g of potassium permanganate (KMnO
4) were slowly added, to avoid sudden point reaction. The mixture was kept at 5 °C for 120 min under constant magnetic stirring. Then, the temperature of the mixture increased to 35 ° C, holding for 30 minutes. Afterwards, 92 mL of deionized water were added to the mixture and the temperature was increased to 98 °C and kept stirring for another 30 min. The reaction was terminated by adding 280 mL of deionized water and 20 mL of hydrogen peroxide (H
2O
2, 30 %). The greenish brown product was washed with 5 volumes of 5 % hydrochloric acid (HCl) to remove the remnants of Mn
4+ and SO
42- ions, followed by rinsing with 5 volumes of deionized water to remove the acid. The product is recovered by centrifugation at 4000 rpm. Finally, the sample was dried in an oven at 70 °C, for 24 h, obtaining a dark brown product.
2.2. Nickel-Doped Fe3O4/Graphene Oxide Synthesis
Fe3O4/graphene oxide powders were synthesized via co-precipitation method as follows: first, a mixture of iron chlorides Fe3+: Fe2+ with a 2:1 molar ratio was prepared, by dissolving FeCl3*6H2O and FeCl2*4H2O in 25 mL of deionized (DI) water. The mixture of iron chlorides was added dropwise to a suspension of 0.9 g of GO in 250 mL of DI water, at room temperature under vigorous stirring, and under a 40 sccm flow of nitrogen gas to avoid oxidation from Magnetite to Hematite. The pH was adjusted to 10 using 28% NH4OH solution. The mixture was heated at 80 ºC; once the temperature was reached, 5 mL of hydrazine hydrate was added, maintaining the temperature for 5 h. The product was allowed to cool freely and was washed 3 times with deionized water and separated by permanent magnets. The sample was dried in an oven at 70 °C for 24 h, and it is named GOMF.
Nickel-doped Fe
3O
4/graphene oxide powders were synthesized with a procedure adapted from refs. [
25,
26]: a 20 mL solution of a mixture of iron chlorides Fe
3+: Fe
2+ with a 2:1 molar ratio was first prepared, by dissolving 0.008 mol of FeCl
3*6H
2O and 0.004 mol of FeCl
2*4H
2O. The iron chloride mixture was added dropwise to the GO solution at room temperature under a 40 sccm flow of nitrogen gas and with vigorous stirring. The pH was adjusted to 10 with a 28% NH
4OH solution. On the other hand, a 0.1 M Ni
2+ solution was prepared with NiCl
2 in DI water. Different amounts of this solution were added dropwise to the GO+Fe
3+:Fe
2+ mixture at room temperature without nitrogen flow, to achieve different Ni/Fe ratios. After incorporating the chlorides into the GO solution, the temperature was raised to 80 °C. Once the temperature was reached, 5 mL of hydrazine hydrate was added, maintaining the temperature for 5 h. The product was allowed to cool freely and was washed 3 times with deionized water and separated by permanent magnets. The sample was dried in an oven at 70 ° C for 24 h. Three Ni/Fe proportions were prepared as shown in
Table 1. They are referred to as GOMNF 1:18, GOMNF 1:6, GOMNF 1:2, depending on their respective Ni/Fe ratio.
2.3. Characterization
The powders were characterized by X-ray diffraction (XRD) using a X’Pert PRO MPD (Multi-Purpose Diffractometer) equipped with a multiple strip X-ray detector, X’celerator. Measurements were performed in the Bragg- Brentano geometry in a 2θ range 6-90° and Cu-Kα radiation of 0.15406 nm at a voltage of 40 kV and a current of 40 mA. Raman spectra were measured at room temperature with a LabRAM HR 800 micro- Raman spectrometer equipped with notch filters, using the incident light from 632.8 nm He- Ne laser focused on the samples through a 50x microscope objective using neutral density filters to avoid decomposition and further oxidation. The Fourier transform infrared spectra (FTIR) were obtained in a Perkin Elmer Spectrum 100 spectrometer equipped with an attenuated total reflectance (ATR) accessory with diamond pinhole window in the wave number range of 4000 to 400 cm-1. The thermogravimetric analysis (TGA) was performed on a Setaram Thermal Gravimetric Analyzer Setsys evolution 1750 under dry air. To analyze TGA-MS, temperature increased from room temperature to 900 °C under air of 20 mLmin-1 at a rate of 5 °C min-1. To observe the morphology, scanning electron microscopy (SEM) was done in Hitachi S-4800 apparatus at 5 kV and transmission electron microscopy (TEM) was performed in a JEOL-ARM 200F microscope operating at 80 kV in a bright field mode.
2.4. Fabrication of Electrodes for ORR
For the fabrication of the electrodes for ORR, an slurry was prepared mixing 4 mL of a 10 wt.% polyvinyl alcohol (PVA) solution used as a binder and the catalyst powder of GO, GOMF, GOMNF 1:18, GOMNF 1:6 or GOMNF 1:2, impregnated by doctor blade onto a graphite felt used as working electrode, to obtain a 15 mg.cm-2 load. After impregnation, the prepared electrodes were dried at 50 °C for 12 h.
2.5. Electrochemical Measurements
The study of the electrocatalytic activity of the prepared materials towards the oxygen reduction reaction (ORR) was carried out by cyclic voltammetry (CV) using an Autolab 302N potentiostat. A 3-electrode cell configuration was used, where an Ag/AgCl minielectrode filled with saturated KCl was set as reference electrode (RE); as a counter electrode (CE) a platinum wire (Pt) and as working electrodes (WE), 1x1 cm2 graphite felt impregnated with GOMNF 1:18, GOMNF 1:6 and GOMNF 1:2 was employed. For the CV measurements, the electrolyte was 0.1 M potassium hydroxide (KOH) saturated with air. The voltammograms were obtained at room temperature from -0.1 to 0.8 V at a scan rate of 10 mVs-1.
2.6. Construction of Single Chamber Microbial Fuel Cells (MFC)
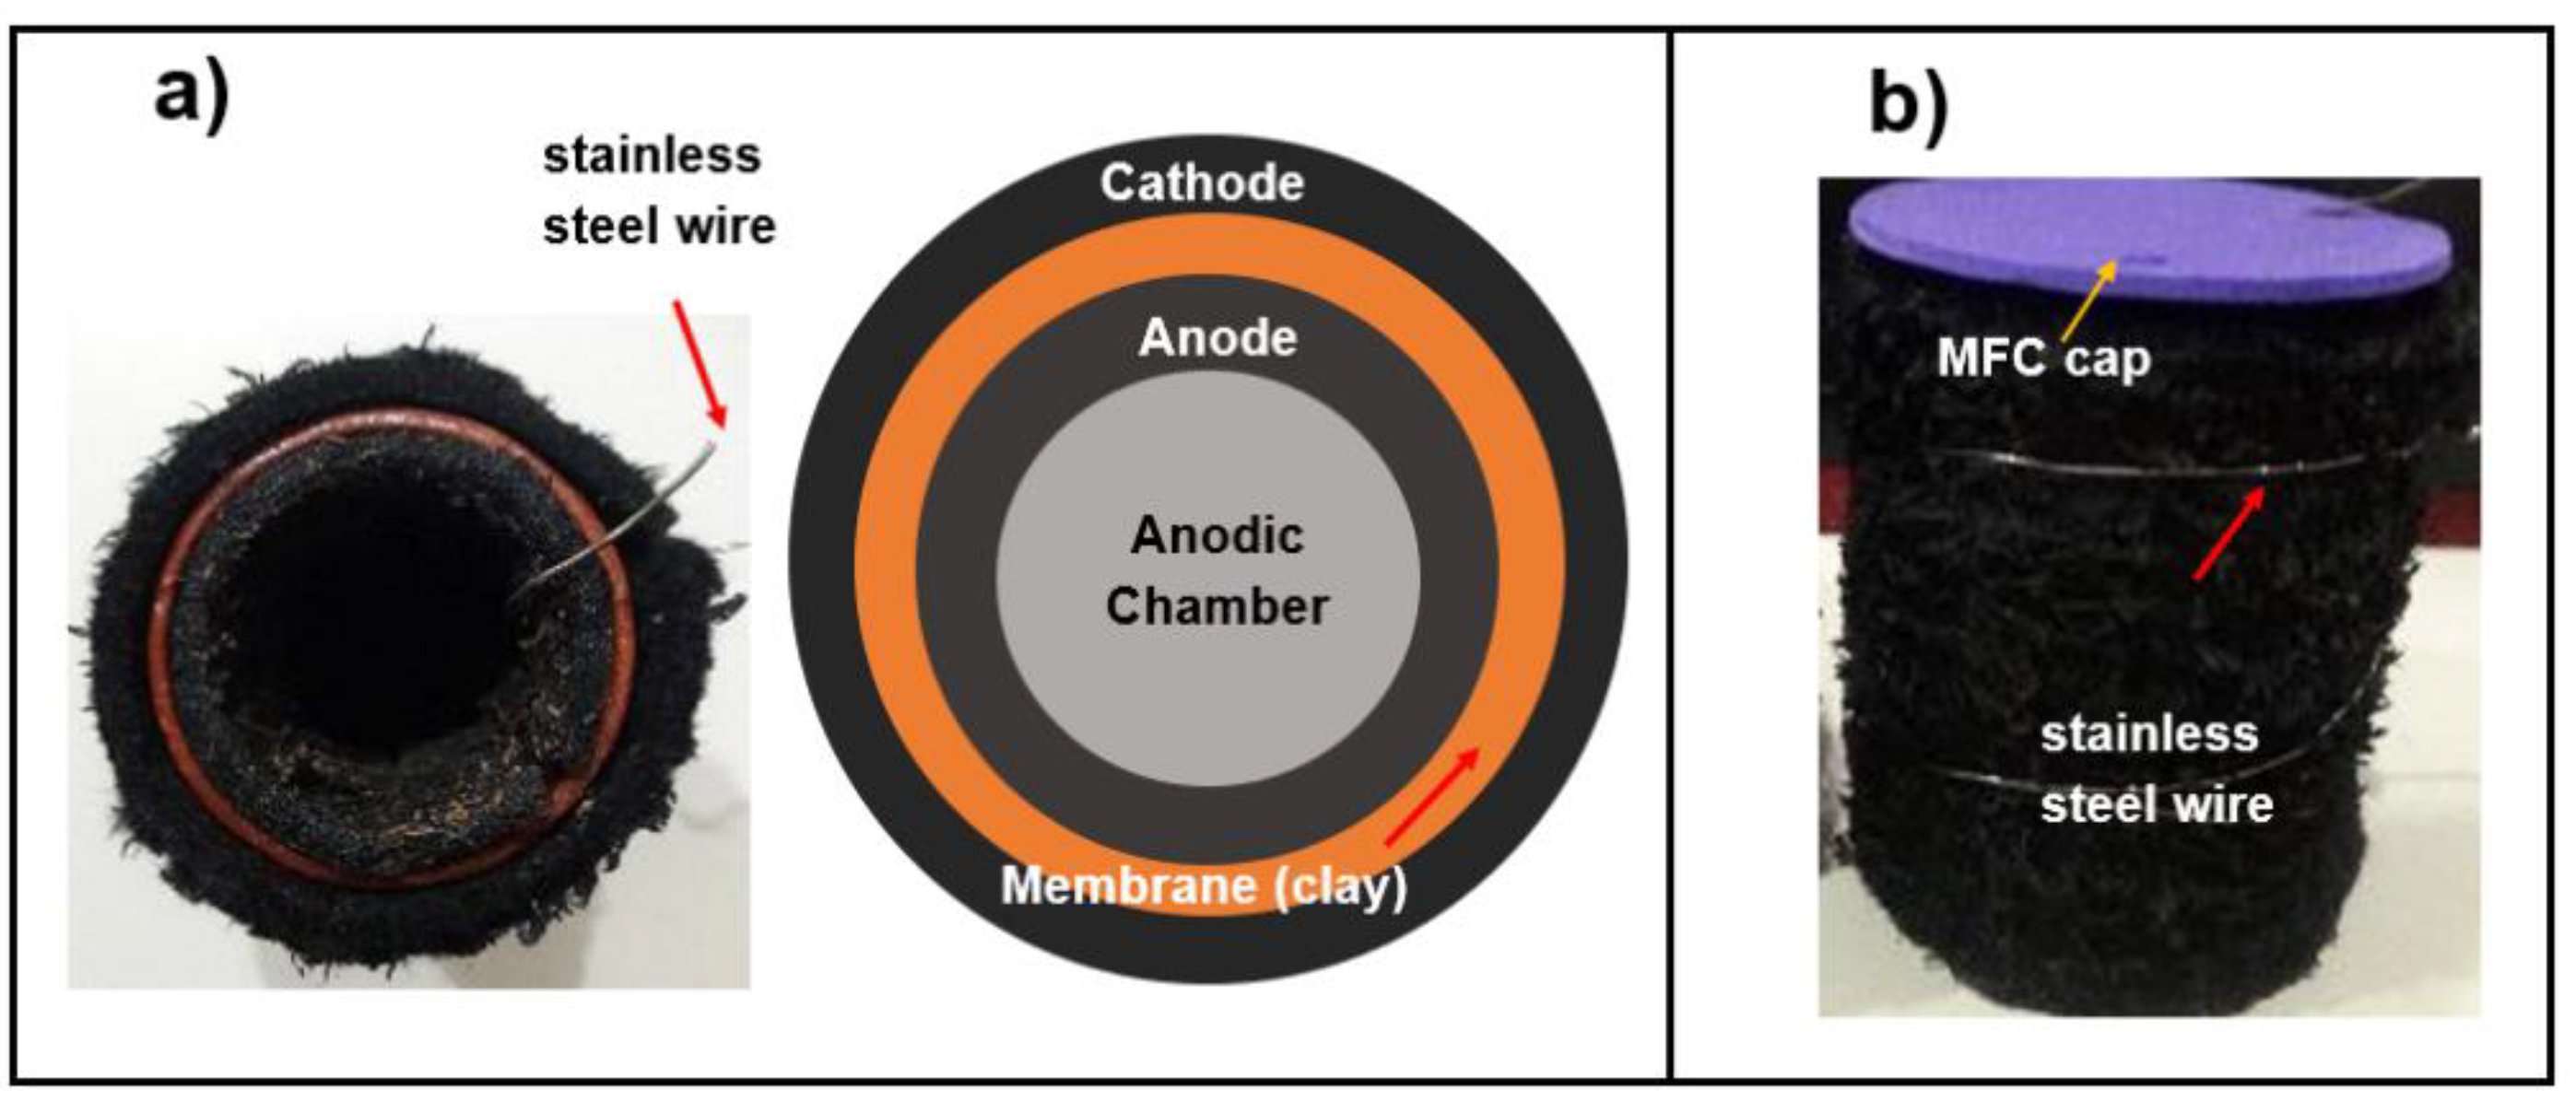
The MFCs were built with a single-chamber configuration in a cooked clay vessel with a volume of 50 mL. The cathode was fabricated from a 6x13 cm
2 graphite felt impregnated with the catalysts as described above and placed on the outer area of the MFC with 304 stainless steel wire woven into the felt, leaving a wire tip as contact. The anode was made of graphite felt with the same area placed on the inner surface of the container and woven with stainless steel wire and one end of it as an electrical contact.
Figure 1 shows the images and the configuration of the MFC’s.
2.6.1. Inoculation of the Reactor
As fuel for the anode, water prepared with commercial fertilized soil was used as a source of dispersible organic matter, adding and mixing 5 g of soil with 50 mL of water to have an estimated chemical oxygen demand (COD) of 0.1 mg.mL
-1. 0.05 g of sodium acetate, equivalent to a COD of 1 gL
-1, was added to the mixture to allow the bacteria to start the metabolic activity [
27,
28] .
2.6.2. MFC Operation
To evaluate the performance of the synthesized materials, the MFCs were put into operation with the characteristics described above to determine the maximum performance produced at open circuit voltage (OCV) [
29]. First, the inoculum was kept for a period of 12 h and remained closed without prior aeration. Activity of the MFCs was measured by placing a multimeter to measure the OCV at the terminals of each electrode, which was registered every hour for 24 h. All measurements of cell performance were made at room temperature (27 ± 1 °C)
3. Results and Discussion
3.1. XRD Analysis
The crystal structure of the prepared GO, Fe
3O
4/GO and Ni-doped Fe
3O
4/GO powders was studied by X-ray diffraction.
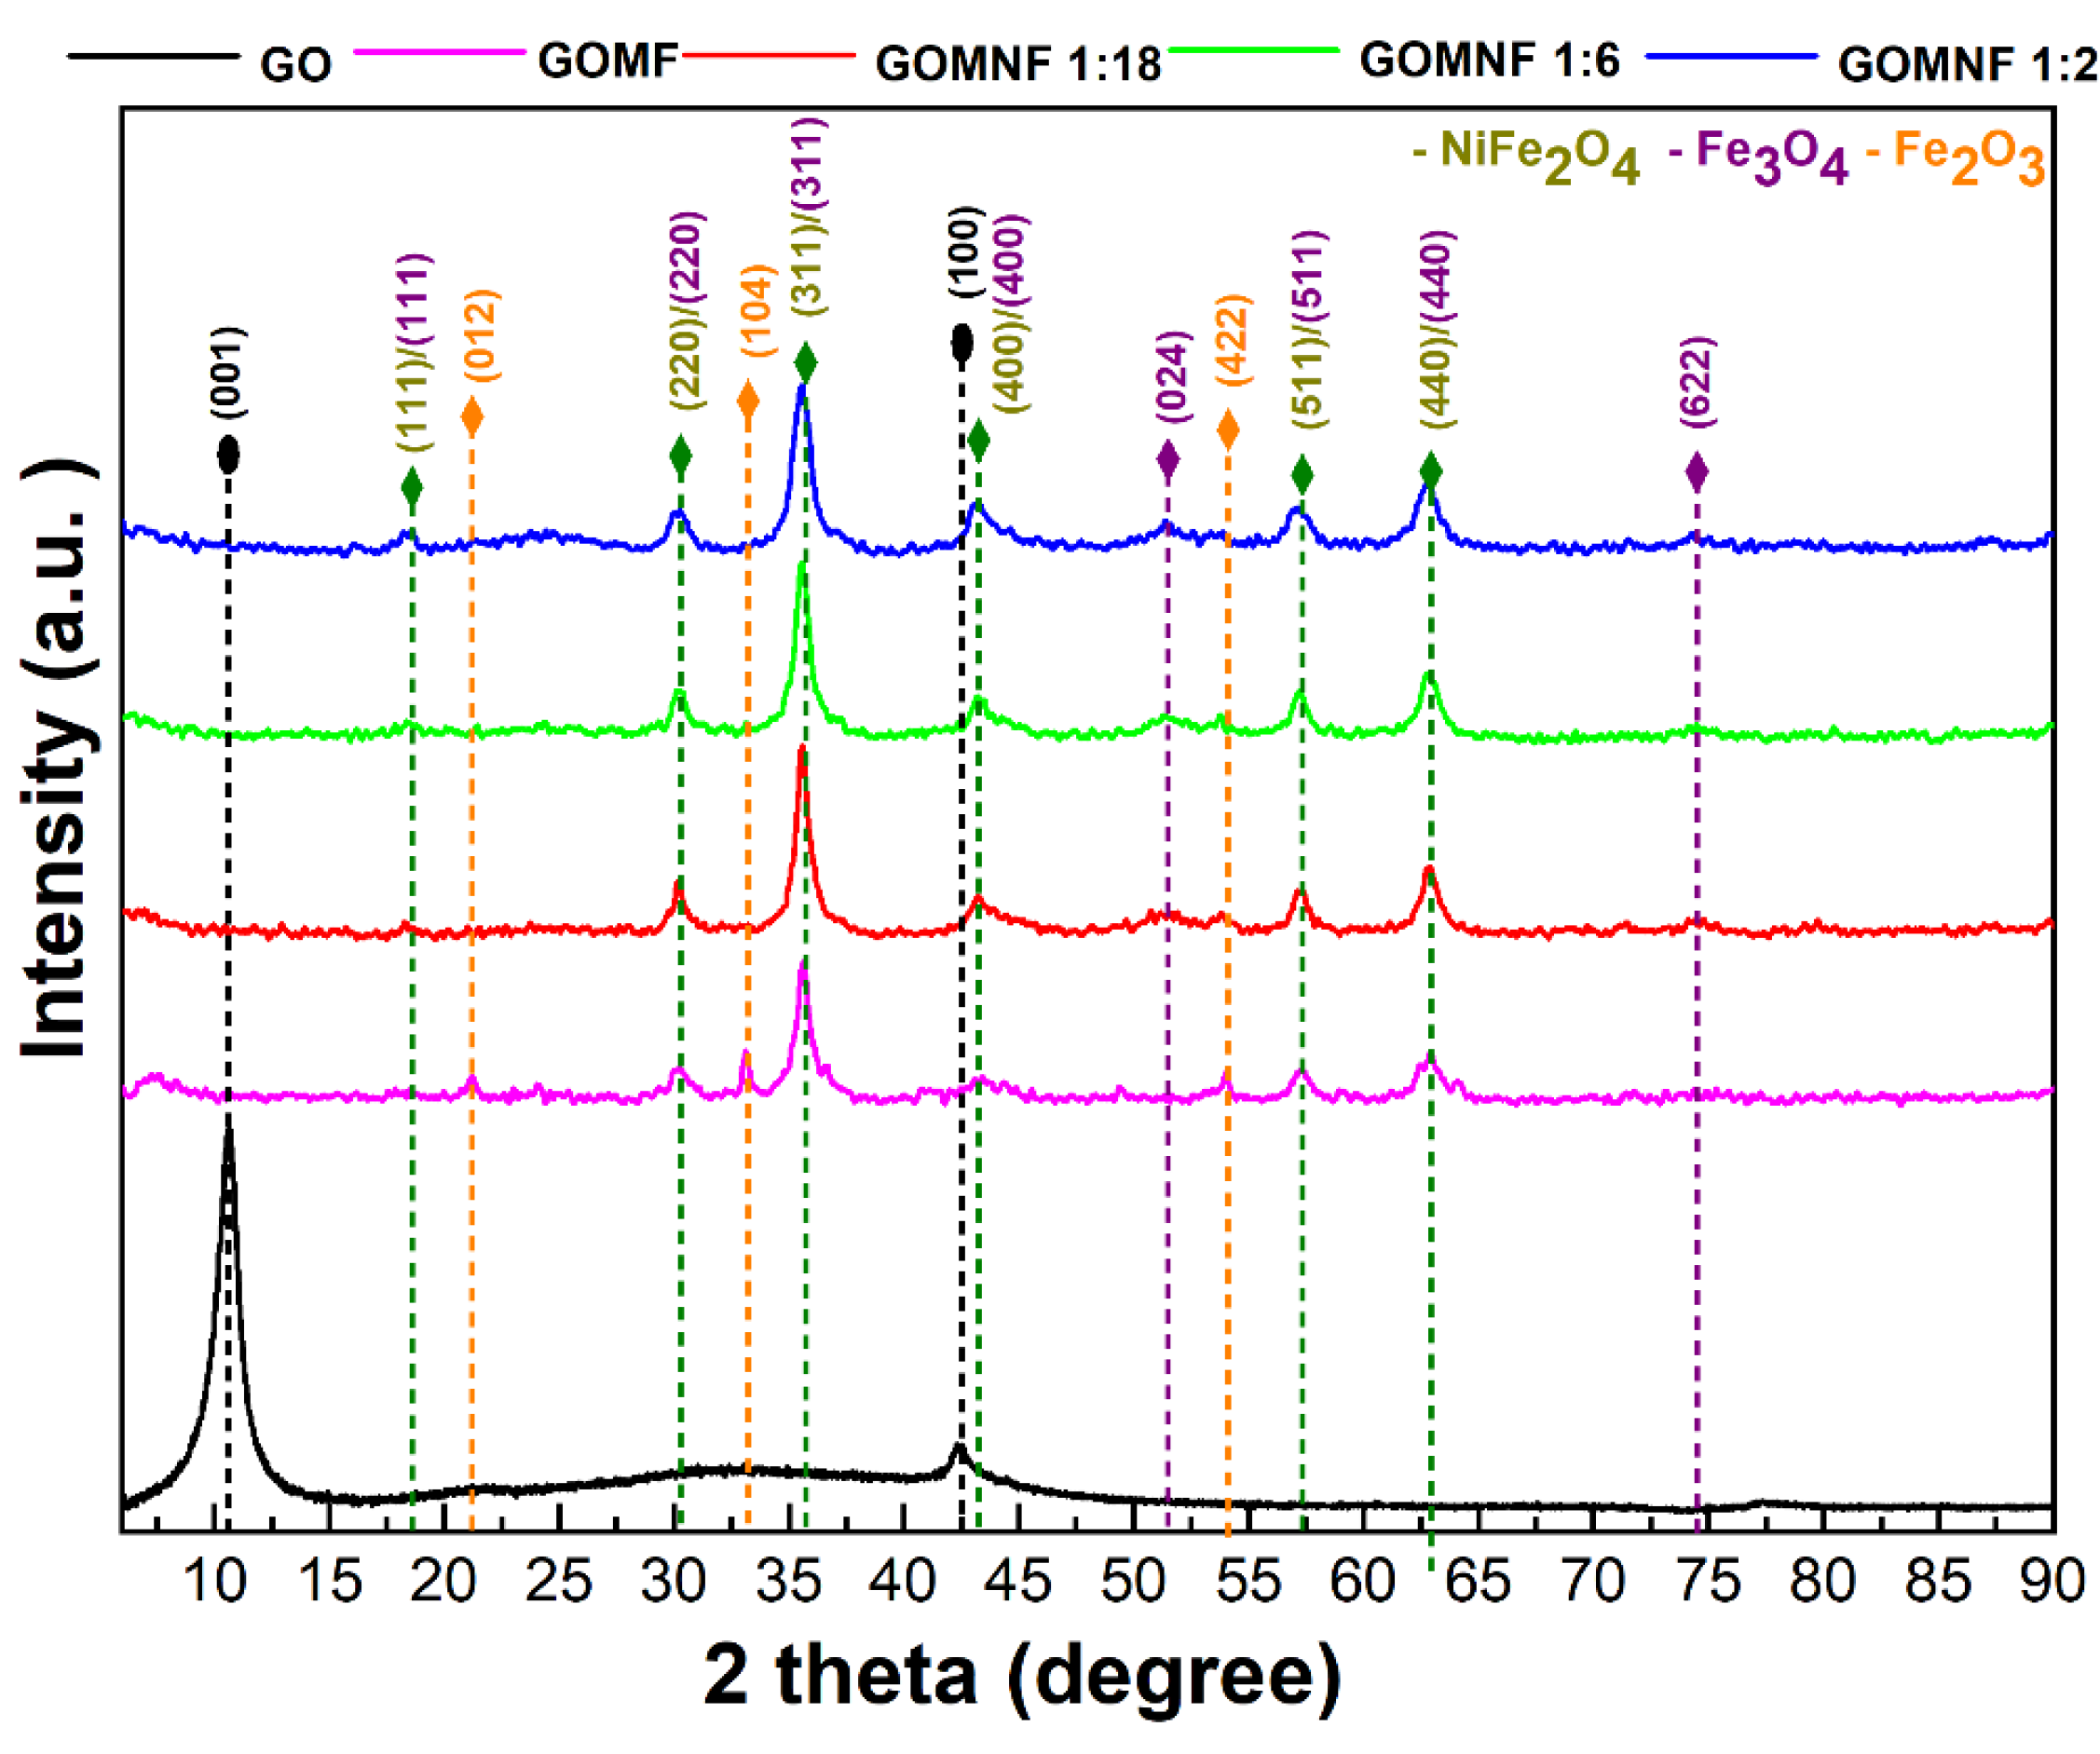
Figure 2 presents the X-ray diffractograms for each sample. Diffraction peaks attributed to GO were observed around 2 theta 10º corresponding to the plane (001) and 43º to the plane (100), which indicates the intercalation of water molecules and the formation of oxygenated functional groups between the graphite layers [
30] . The diffraction pattern of the GOMF sample shows diffraction peaks at 2θ at 30.29° (220), 35.67° (311), 43.36° (400), 53.80° (422), 62.99° (440), which can be attributed either to magnetite (Fe
3O
4) or maghemite (γ-Fe
2O
3). For the samples decorated with nickel-doped Fe
3O
4, whose labels are GOMNF 1:2, GOMNF 1:6 and GOMNF 1:18, diffraction planes were identified at 2θ at 30.29 ° (220), 35.67 ° (311), 43.36 ° (400), 53.80° (422), 62.99° (440), which also corresponds to Fe
3O
4. Diffraction peaks corresponding to the Hematite (422) plane are observed in the Ni-doped samples, however, as the nickel content (Ni/Fe) decreases in the samples 1:2> 1:6> 1:18, Hematite disappears. The sample with the highest nickel content GOMNF 1:2, presents crystalline planes of NiFe
2O
4. No crystalline planes related to nickel oxide (NiO) were found. Phases were identified with the JCPDS database as follows: NiFe
2O
4 (card 10-0325). Fe
3O
4 (card 19-0629); Hematite (card 33-0664), Goethite (card No. 17-0536).
The crystallite size for all samples were calculated, using Scherrer’s equation [
31] ,
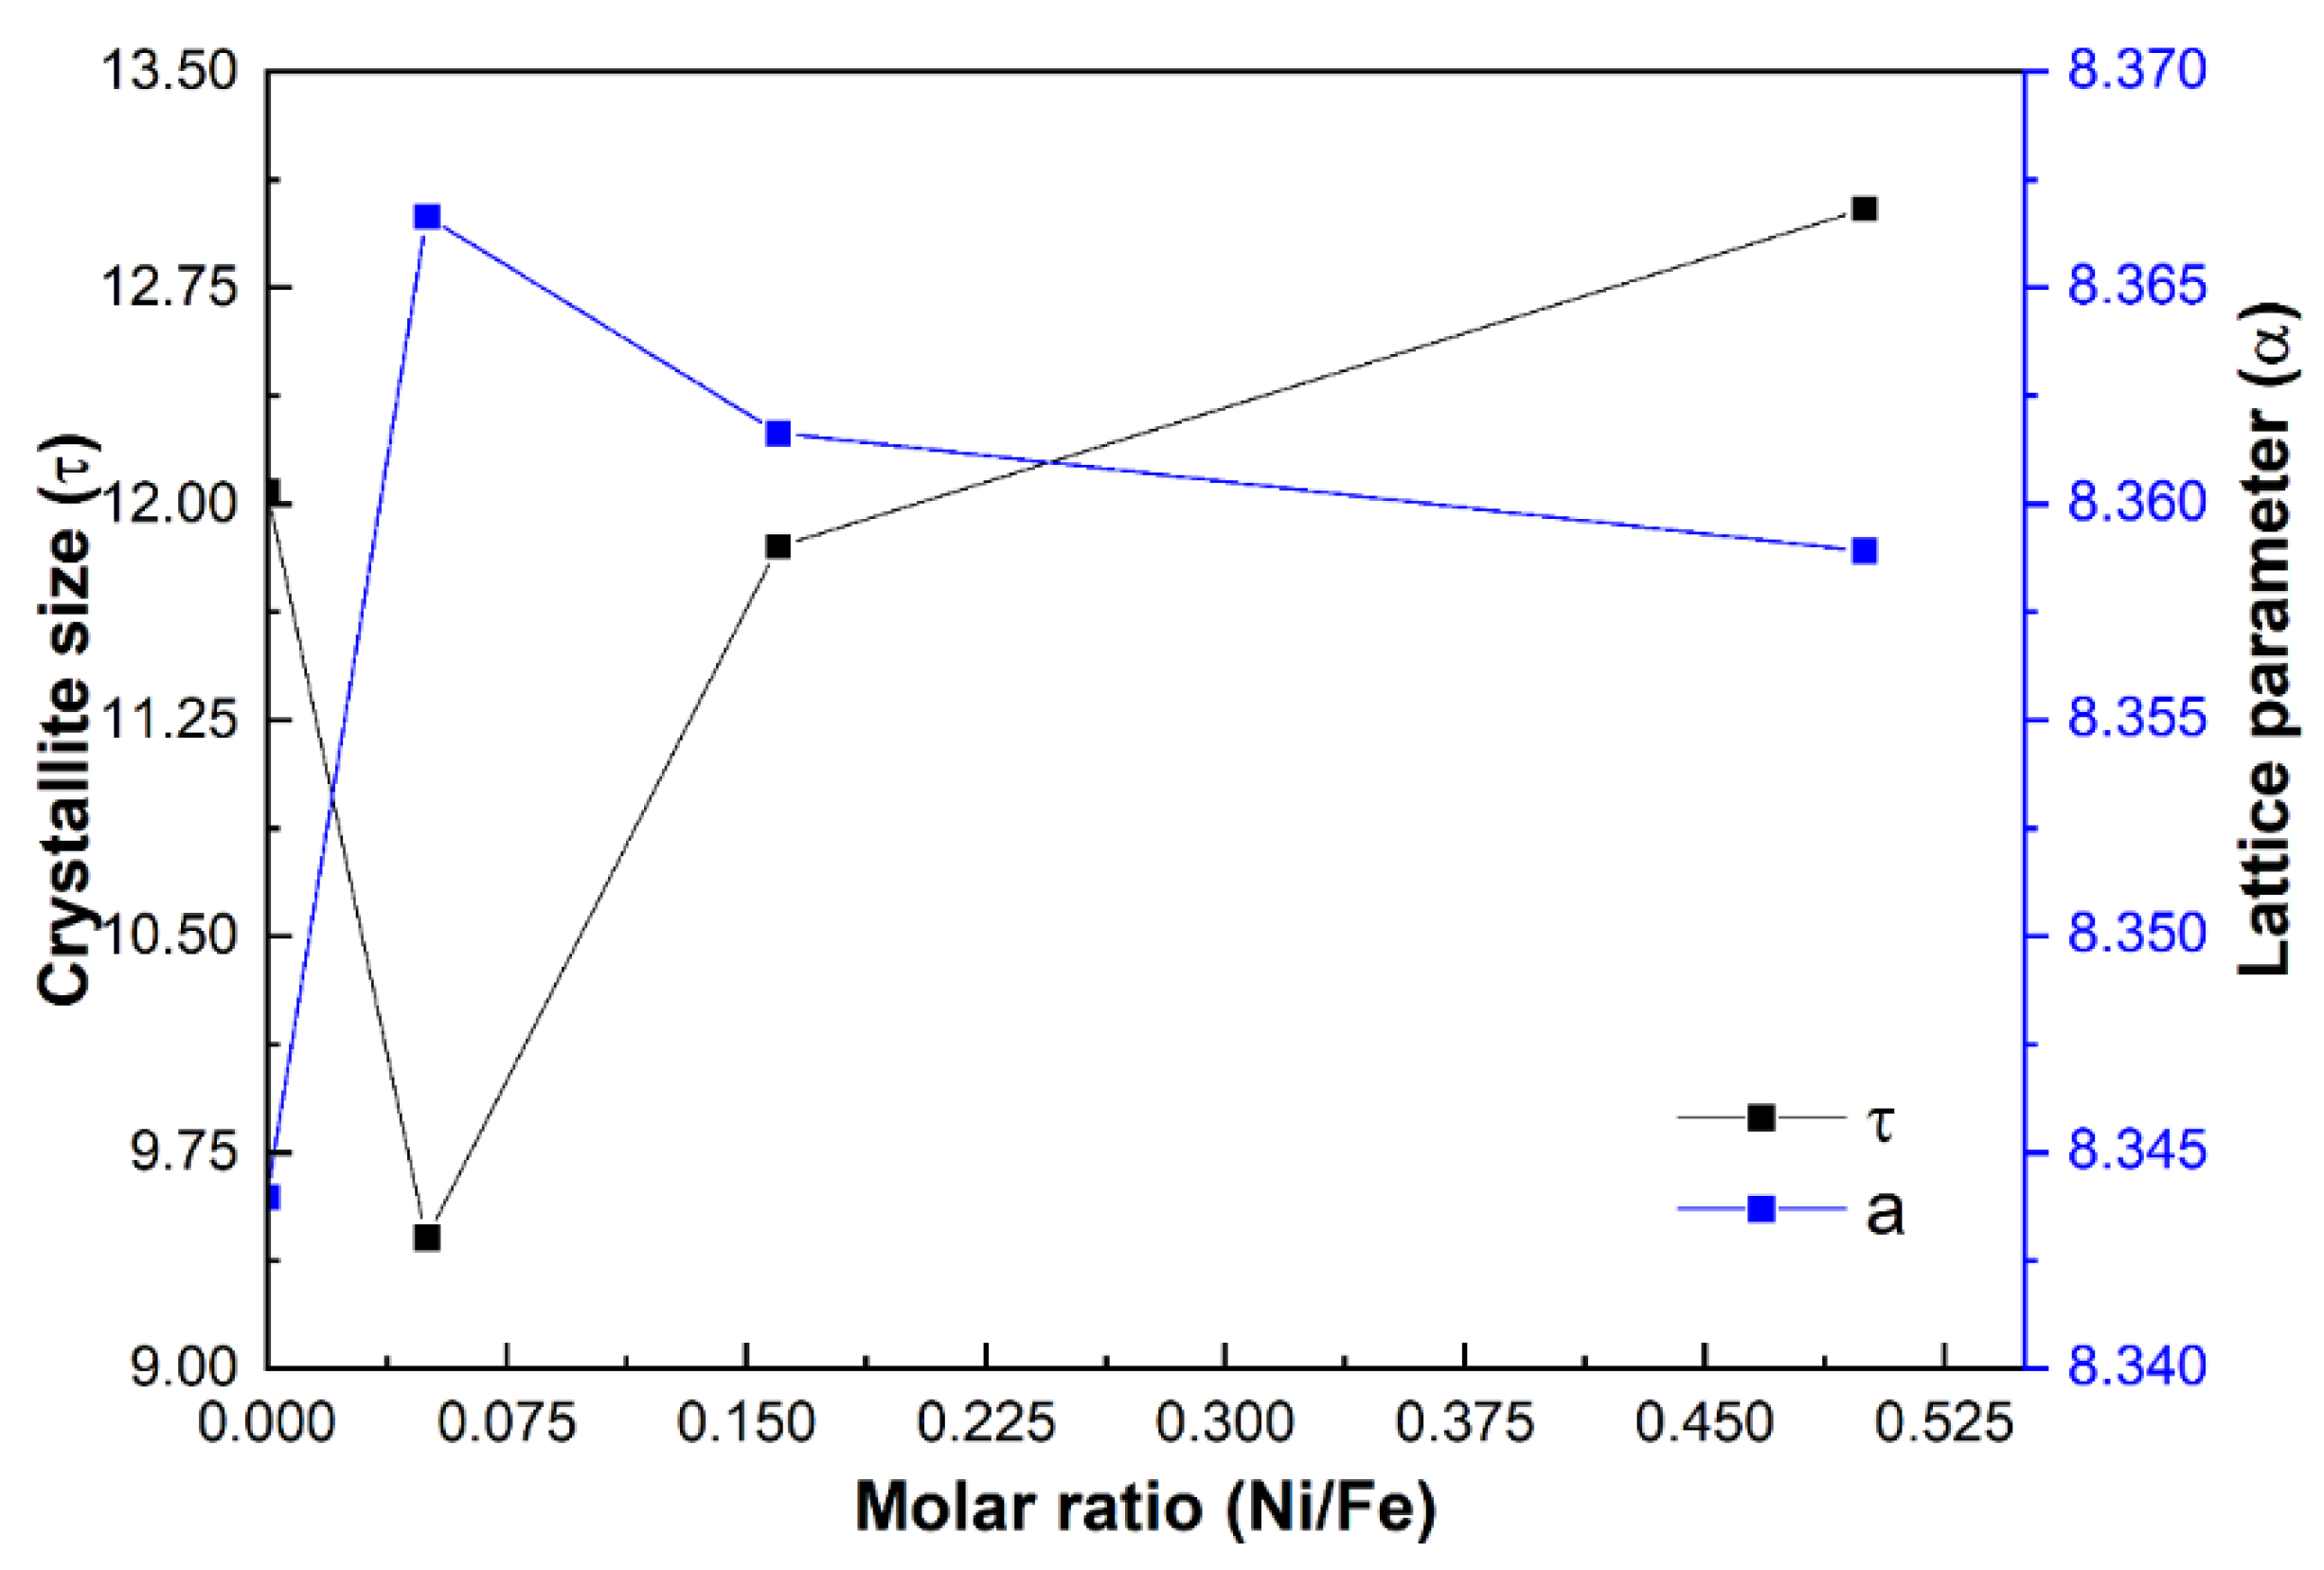
Where is the crystallite size, is the full width at half maximum (FWHM) of the peaks of all planes in the XRD pattern, is the wavelength of Cu=1.5406, and is the Bragg angle. The crystallite sizes for the GOMNF samples 1:2, 1:6, 1:18, were 13.02, 11.85, and 9.45 nm, respectively.
Figure 3 shows the crystallite size and lattice parameter of the prepared samples
vs. their respective Ni/Fe ratios. It is observed that when adding a small concentration of nickel, the lattice parameter (a) increases, this due to the size of the nickel atom that is positioned in octahedral sites where iron atoms are found, which half of them are substituted, resulting in a structure with small crystal size. However, as the nickel content increases, the lattice parameter decreases leading to a better accommodation in the lattice for the formation of NiFe
2O
4 [
32], which has a lattice parameter lower than that of magnetite. In addition, the crystallite size increases as Ni/Fe increases.
3.2. TGA/DTG Analysis
The thermal behavior of prepared samples was investigated by thermogravimetry.
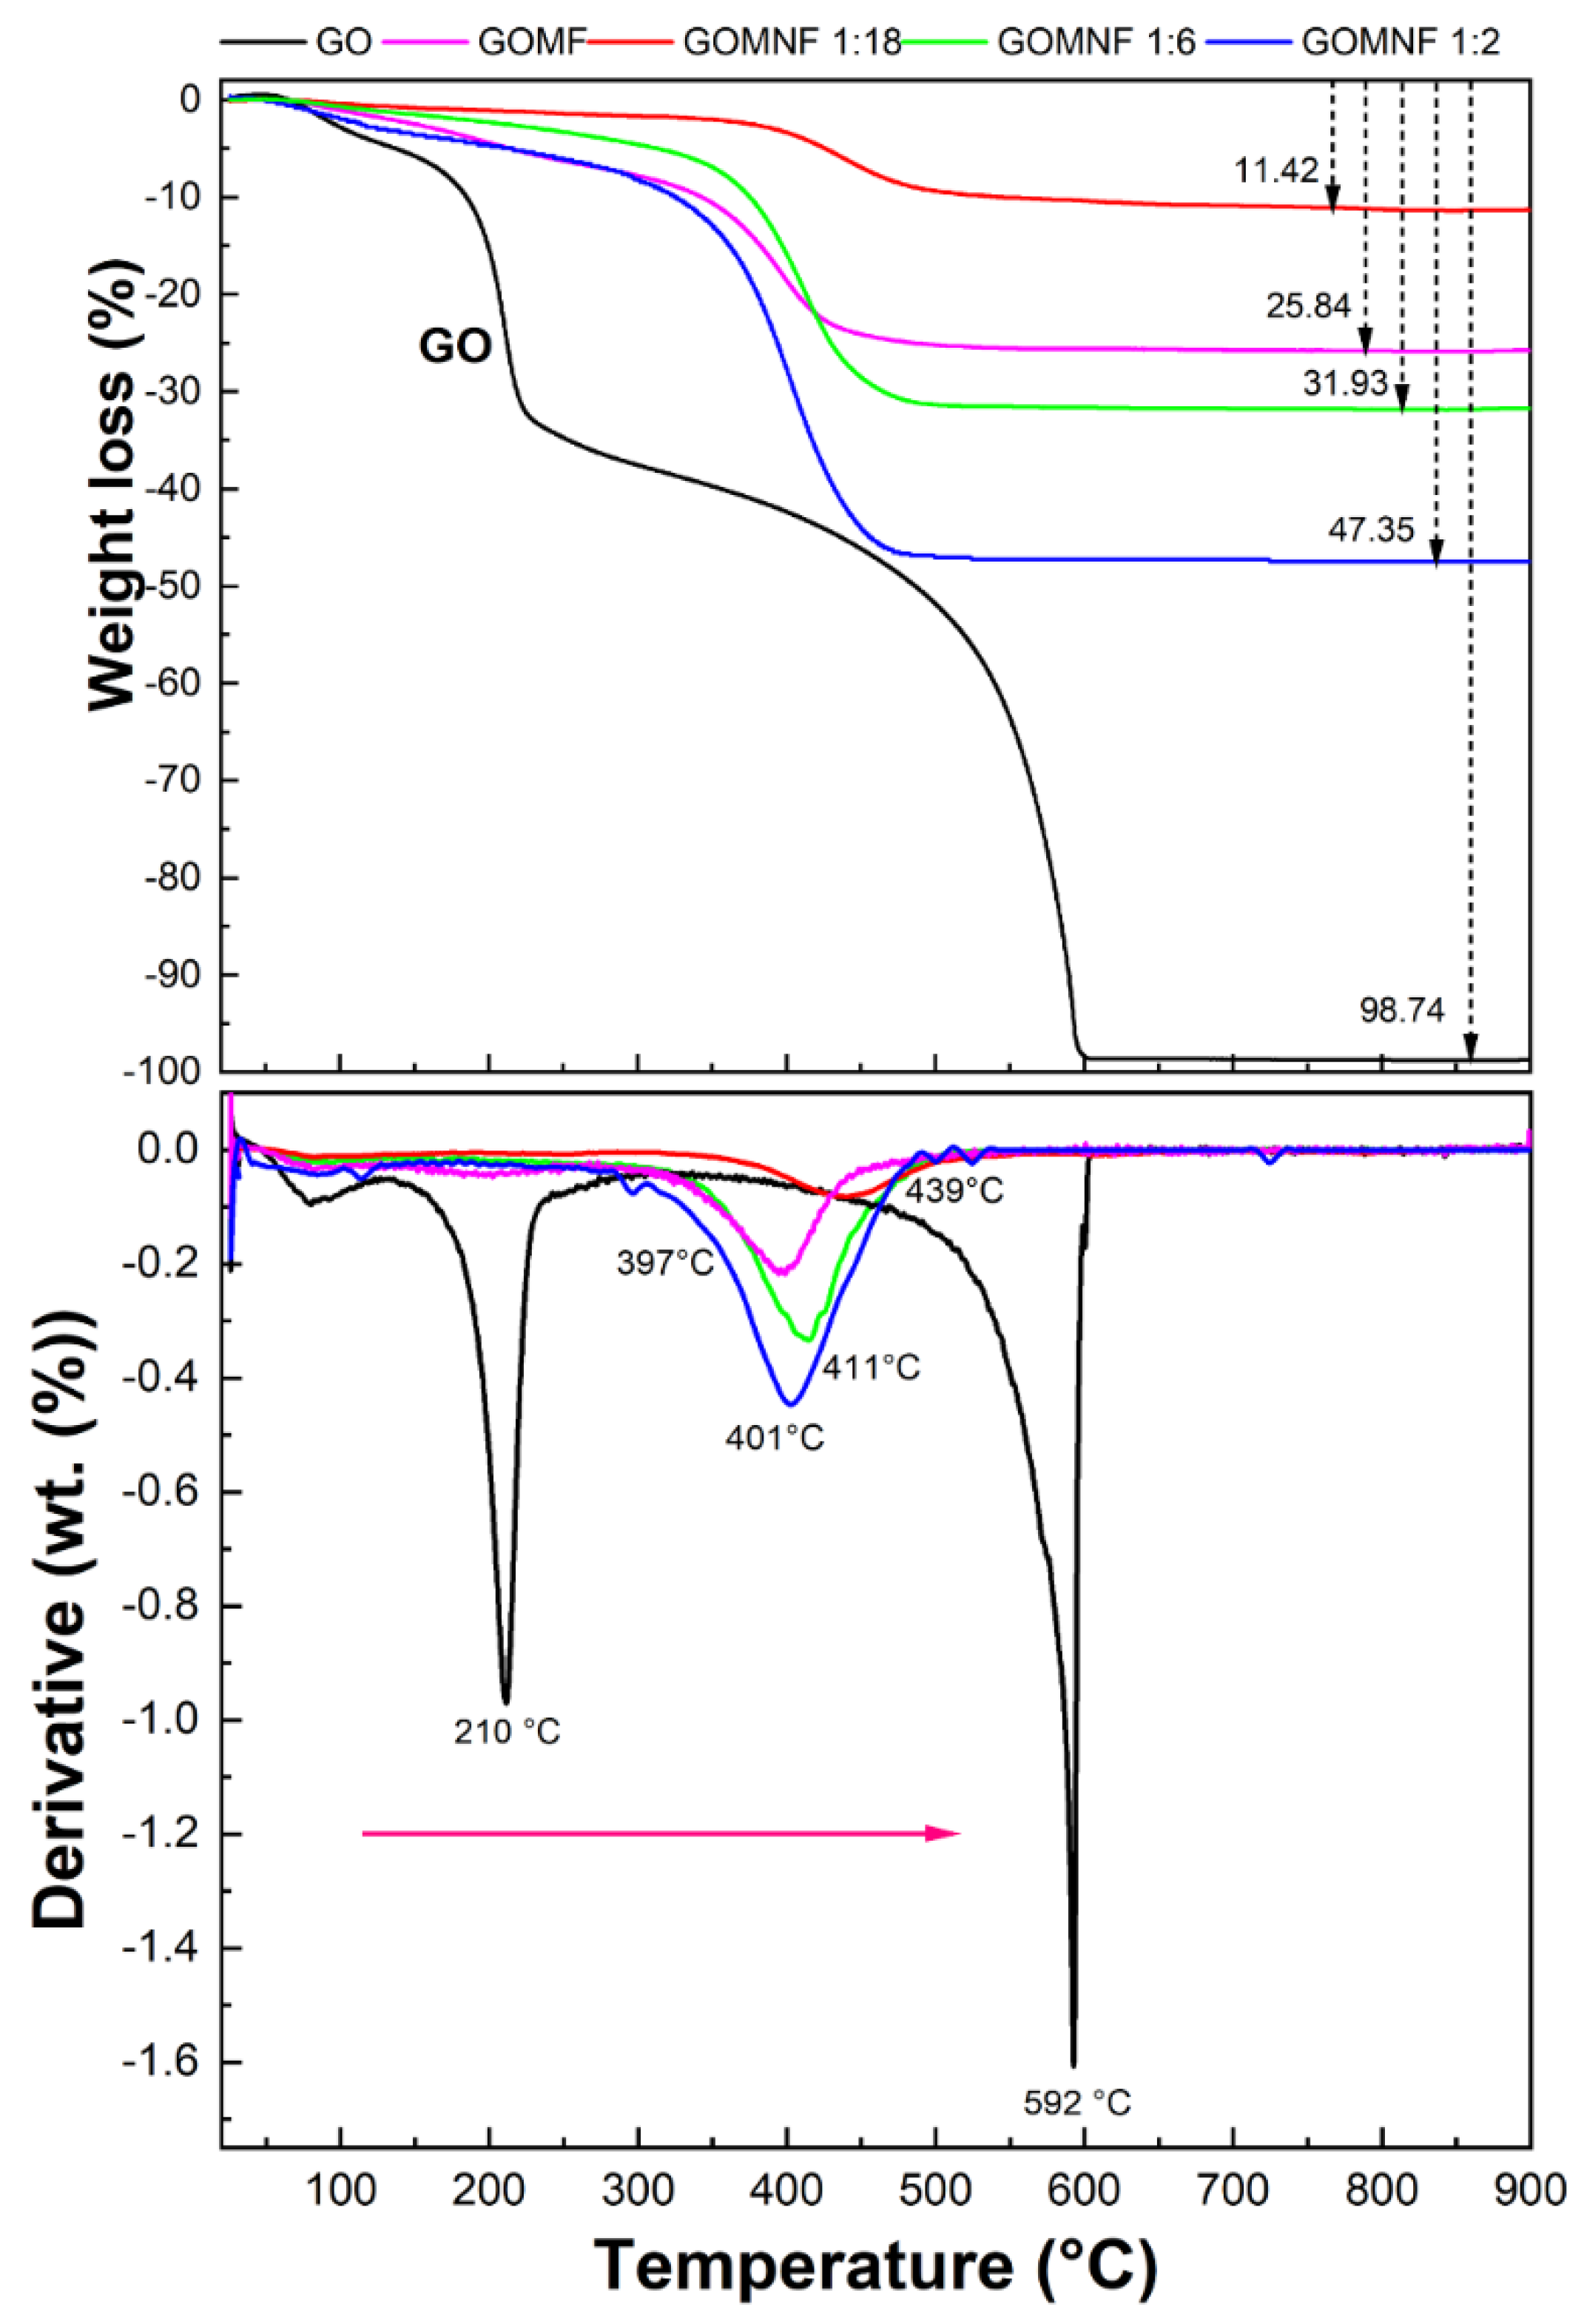
Figure 4a shows the TGA curves of undoped Fe
3O
4/GO (sample GOMF), and the Ni-doped samples with Ni/Fe, labeled as GOMNF 1:2, GOMNF 1:6 and GOMNF 1:18, respectively, as well as the GO thermogram. Thermograms show two regions of weight loss: 1) from room temperature to ~150 °C due to the loss of absorbed/interstitial water [
33] ; 2) in the range of 150-460 °C caused by decomposition of inorganic salts to metal oxides and the decomposition of GO, followed by dehydration of the OH group in the spinel structure at 400 ºC [
34] . The GOMF, GOMNF 1:2, GOMNF 1:6 and GOMNF 1:18 samples presented maximum weight losses of 25.84%, 47.35%, 31.93% and 11.42%, respectively. It is expected that after calcination GOMF sample is composed of hematite (Fe
2O
3) and GOMNF samples of a mixture hematite and nickel ferrite (NiFe
2O
4) as shown in the XRD. The final mass loss corresponds to the relative contents of Fe and Ni in the samples.
In
Figure 4b the derivative thermogravimetric (DTG) curves are presented. The first peak of GO at 210 ºC is caused by the loss of functional groups and oxygen, while the second peak at 592 ºC is attributed to carbon combustion. However, for the decorated samples, there is no peak related to the oxygen functional group loss, in correspondence to the decoration of the oxygen moieties of GO which reduces the GO sheet. For the doped samples, a peak around 405- 450 °C (Tmax) corresponds to the complete oxidation of the iron and iron/nickel to Fe
2O
3 and NiFe
2O
4 respectively. It was found that the Tmax shifted to higher temperature as GOMF (439 ºC) > GOMNF 1:18 (411 ºC) >GOMNF (401 ºC) > 1:6 GOMNF 1:2 (397 ºC) respectively. The shift in Tmax is related to the formation enthalpies of NiFe
2O
4 -1000 kJ/mol and Fe
2O
3 = -825.5 kJ/mol, altough the Tmax values are slightly higher than those reported, possibly because of the graphene matrix [
35,
36,
37].
3.4. FTIR Analysis
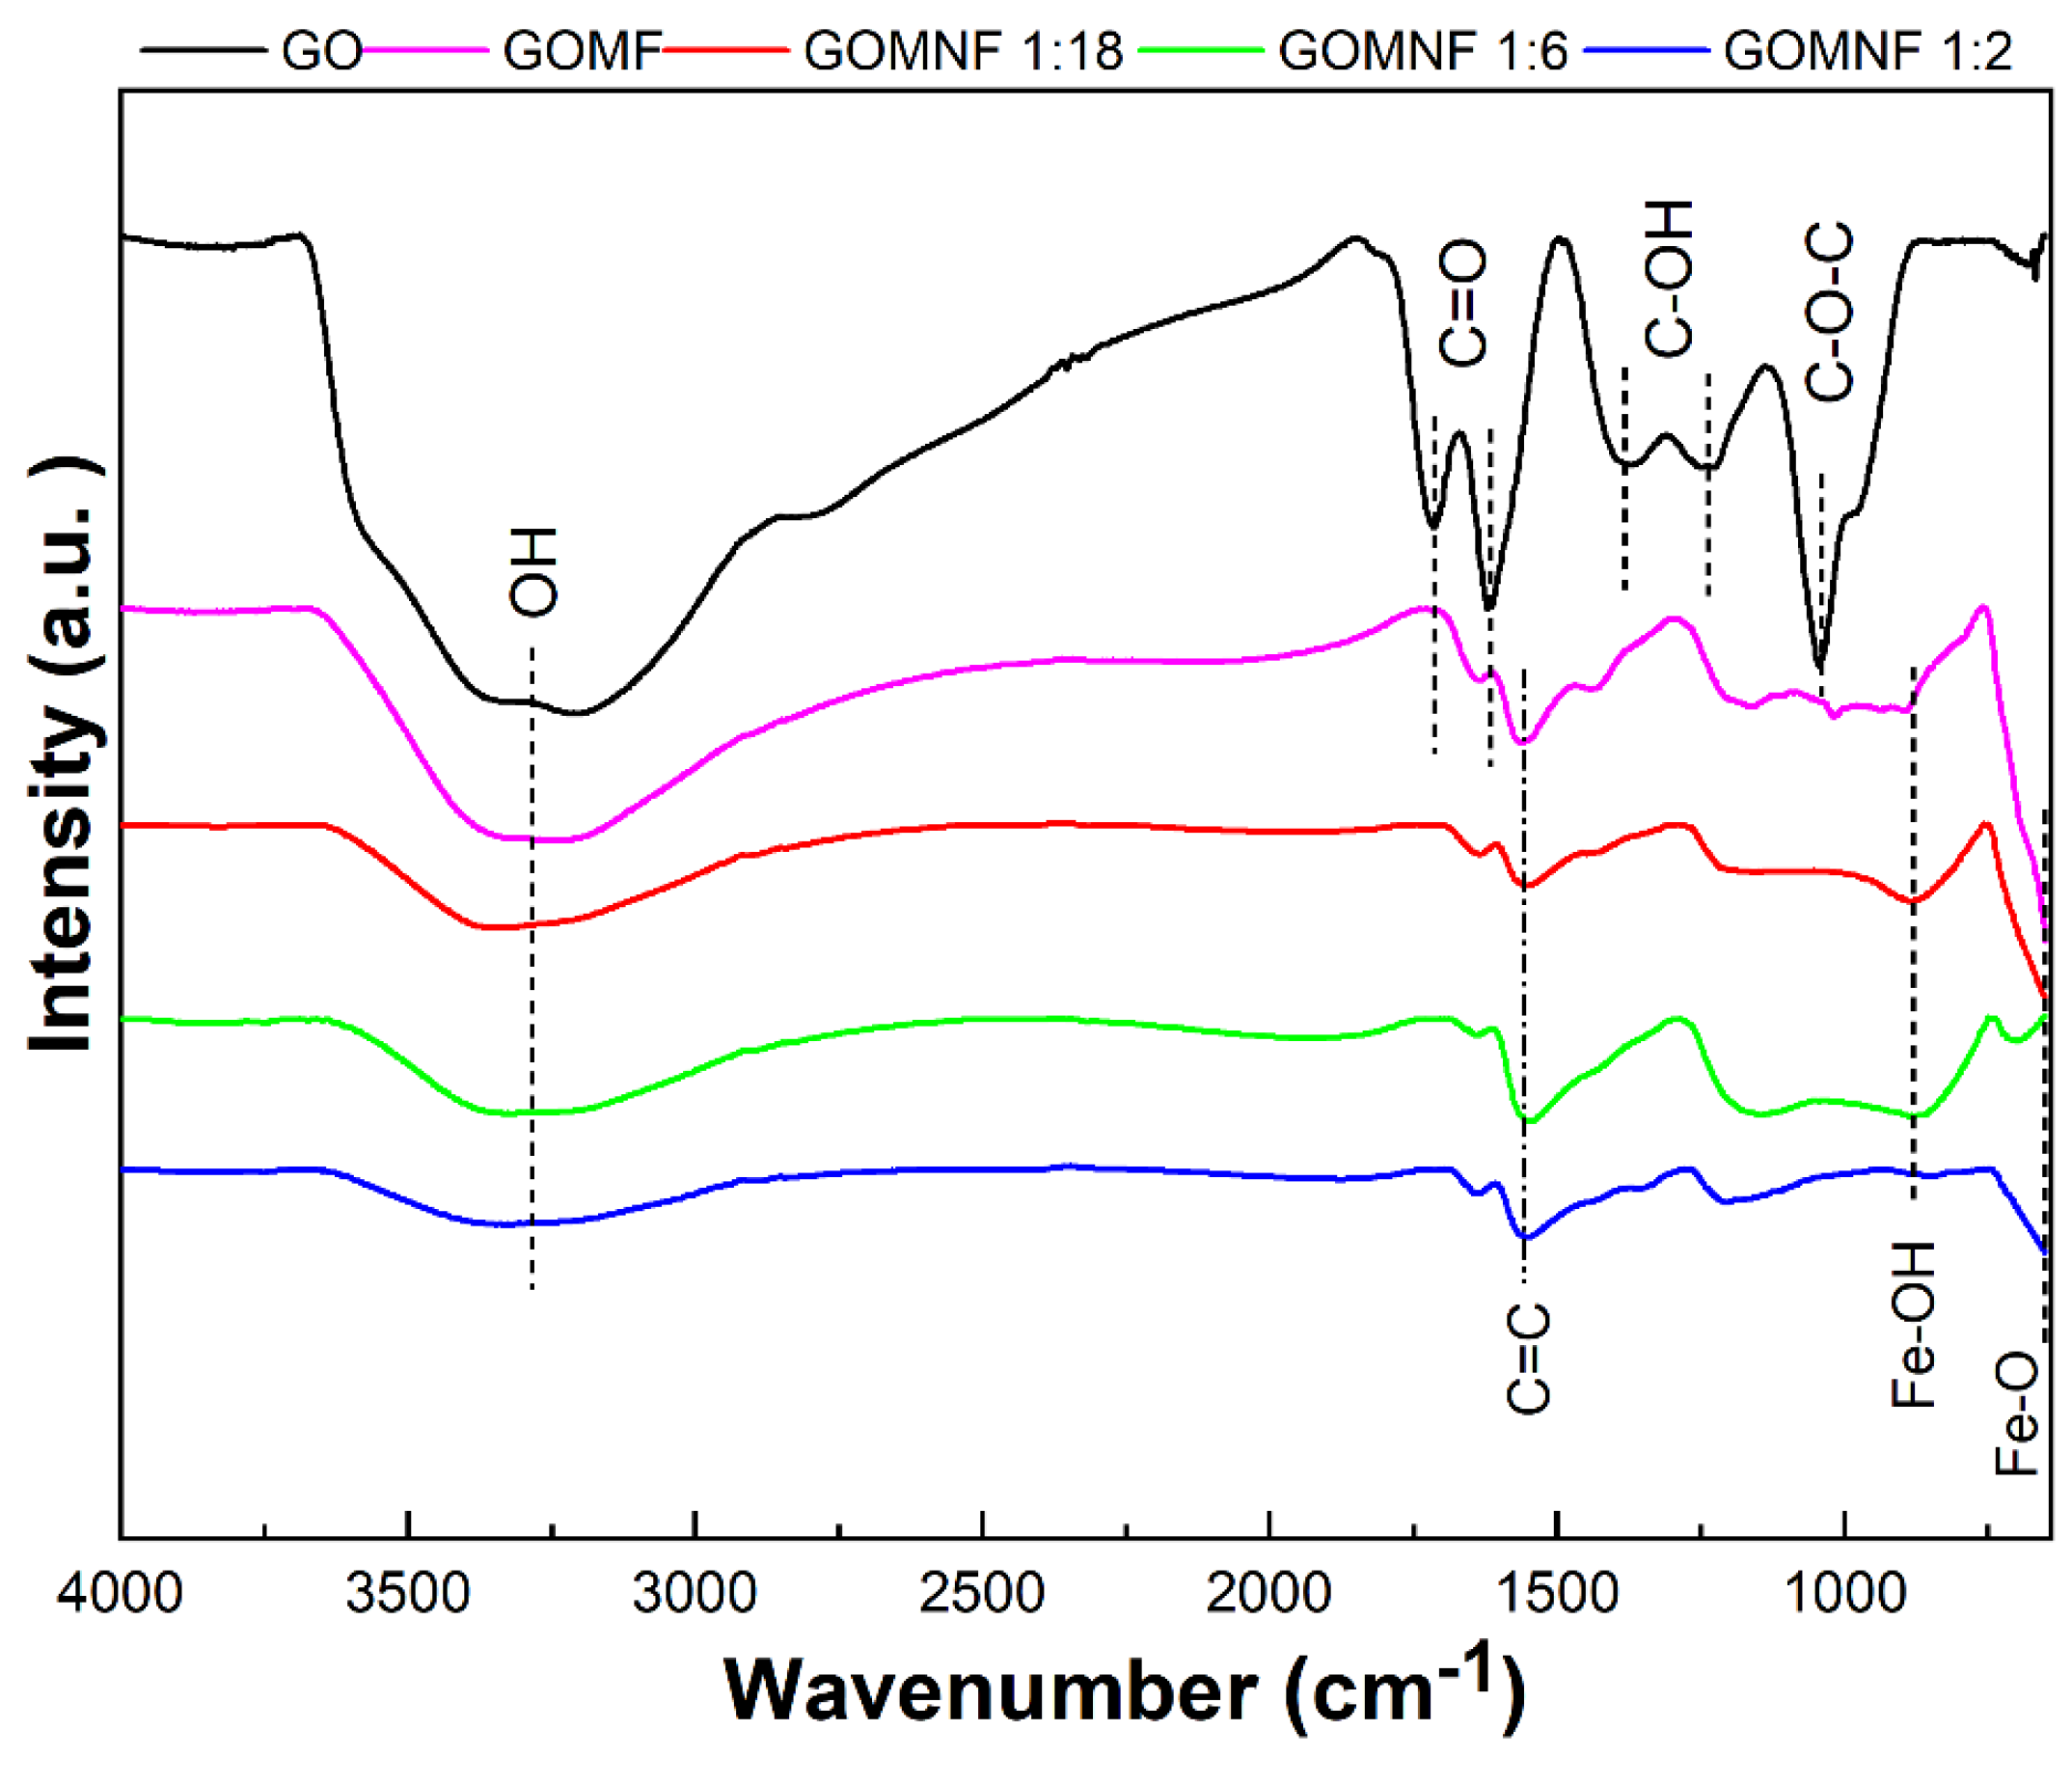
Figure 5 presents the FTIR spectra of the synthesized samples. For GO an intense and wide band around 3260 cm
-1 is attributed to the O-H bond stretch mode [
38] . The water molecules intercalated between the graphene sheets participate in the widening of the band. The band located at 1730 cm
-1 is attributed to the vibration of the C=O stretch in carboxylic acids that are located on the edges of the graphene oxide sheets; the band at 1626 cm
-1 is attributed to the C=O stretch in carbonyl groups and the band at 1560 cm
-1 to the vibration of graphitic domains of the non-oxidized carbon skeleton (C=C). The bands at 1248 cm
-1 and 1370 cm
-1 are attributed to the vibrations of the stretching of hydroxyl groups (C-OH) on the basal plane of the GO and the band at 1045 cm
-1 corresponds to the mode of stretching of the groups epoxy (C-O-C) [
39] . In the GOMNF series, the bands corresponding to carboxyl, carbonyl and epoxy groups disappear, indicating the reduction of graphene oxide. In the FTIR spectra of GOMNF 1:2, 1:6 and 1:18 the band at around 587 cm
-1 corresponds to the stretching vibrations due to Fe-O tetrahedral. It is observed that in the GOMNF 1:2 sample, with higher nickel content, the band associated with Fe-O vibration decreases. The band at 1867 cm
-1 is the result of O-H flex and stretch vibrations bound with iron ions and moisture adsorbed onto the nanoparticles [
40].
3.5. Raman Analysis
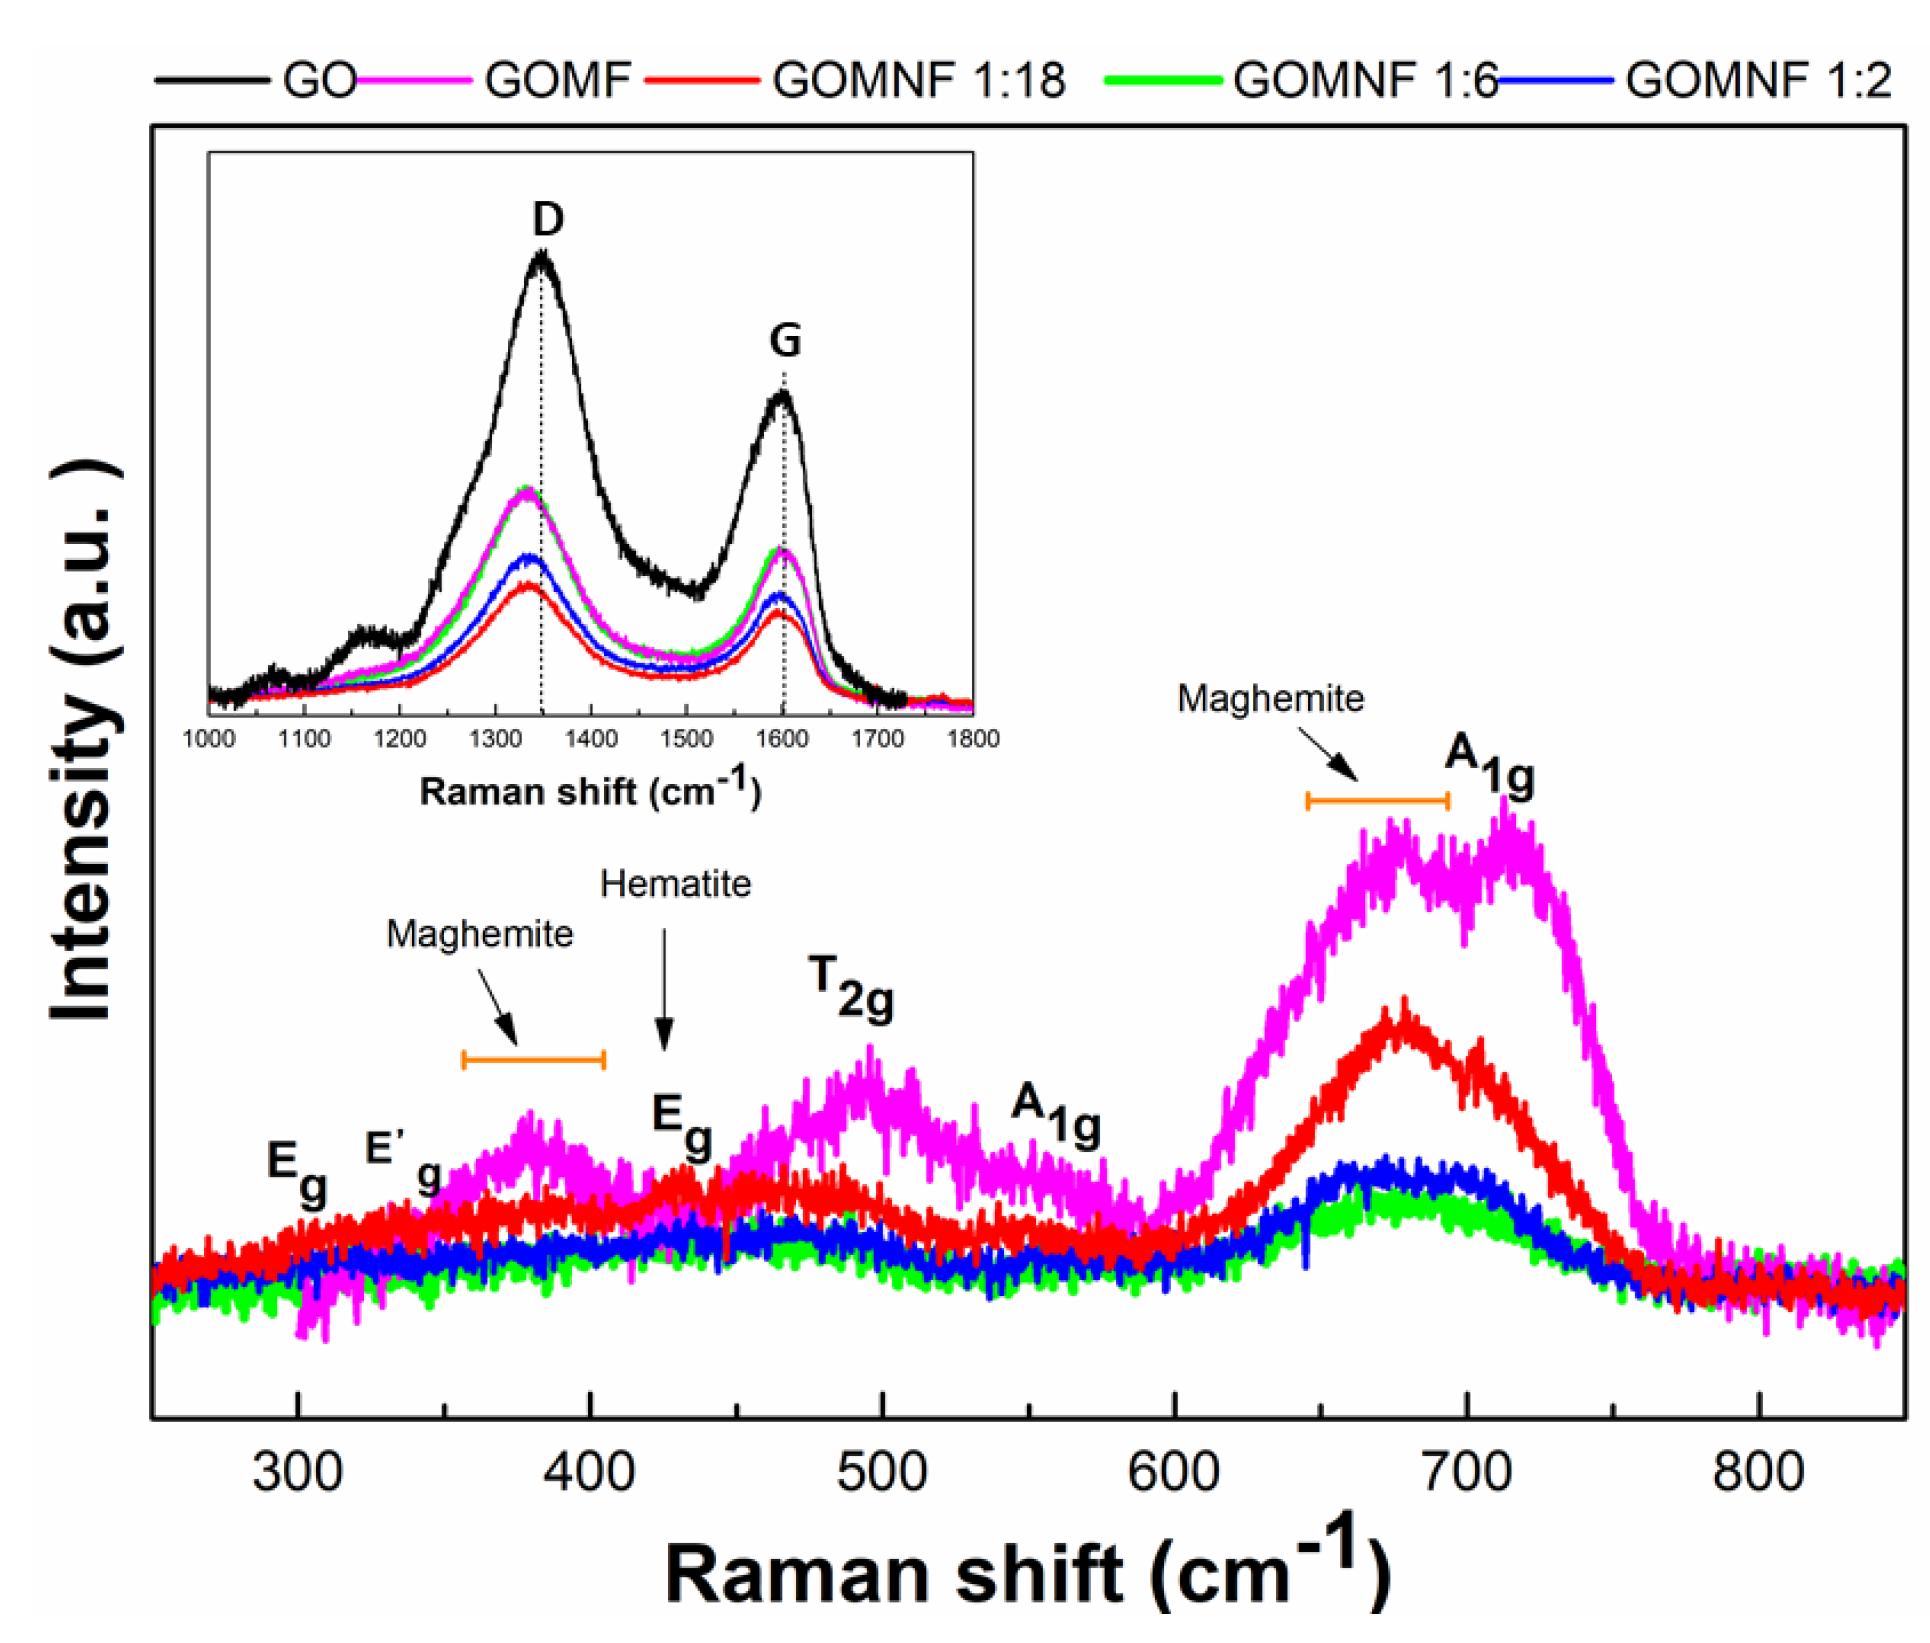
The Raman spectrum of GO is presented with the characteristic D and G bands mentioned in the literature [
41] . The band at 1598 cm
-1 called the G band, is caused by the E
2g mode of first order dispersion of the sp
2 domains, that is, due to the vibration of the carbon atoms in the plane. The band located at 1345 cm
-1, called D, corresponds to the decrease of the sp
2 domains, that is, to disordered regions containing sp
3 carbons with associated vibrations out of the plane as a result of the oxidation of the graphene sheets [
42] In the Raman spectra for the GOMNF 1:2, 1:6 and 1:18 samples, shown in
Figure 6, bands appeared between 292 cm
-1 and 704 cm
-1 and were assigned to the crystalline phase of NiFe
2O
4, in E
g 292.17 cm
-1, T
2g (2) 489.79 cm
-1, A
1g 704.33 cm
-1, according to the space group symmetry
(Fd3m) have these Raman active internal modes [
43] . In addition, broad bands between 490 and 680 cm
-1 are observed, indicating the presence of the maghemite phase of iron oxide [
44] .
3.6. Electrochemical Characterization of Air Cathodes
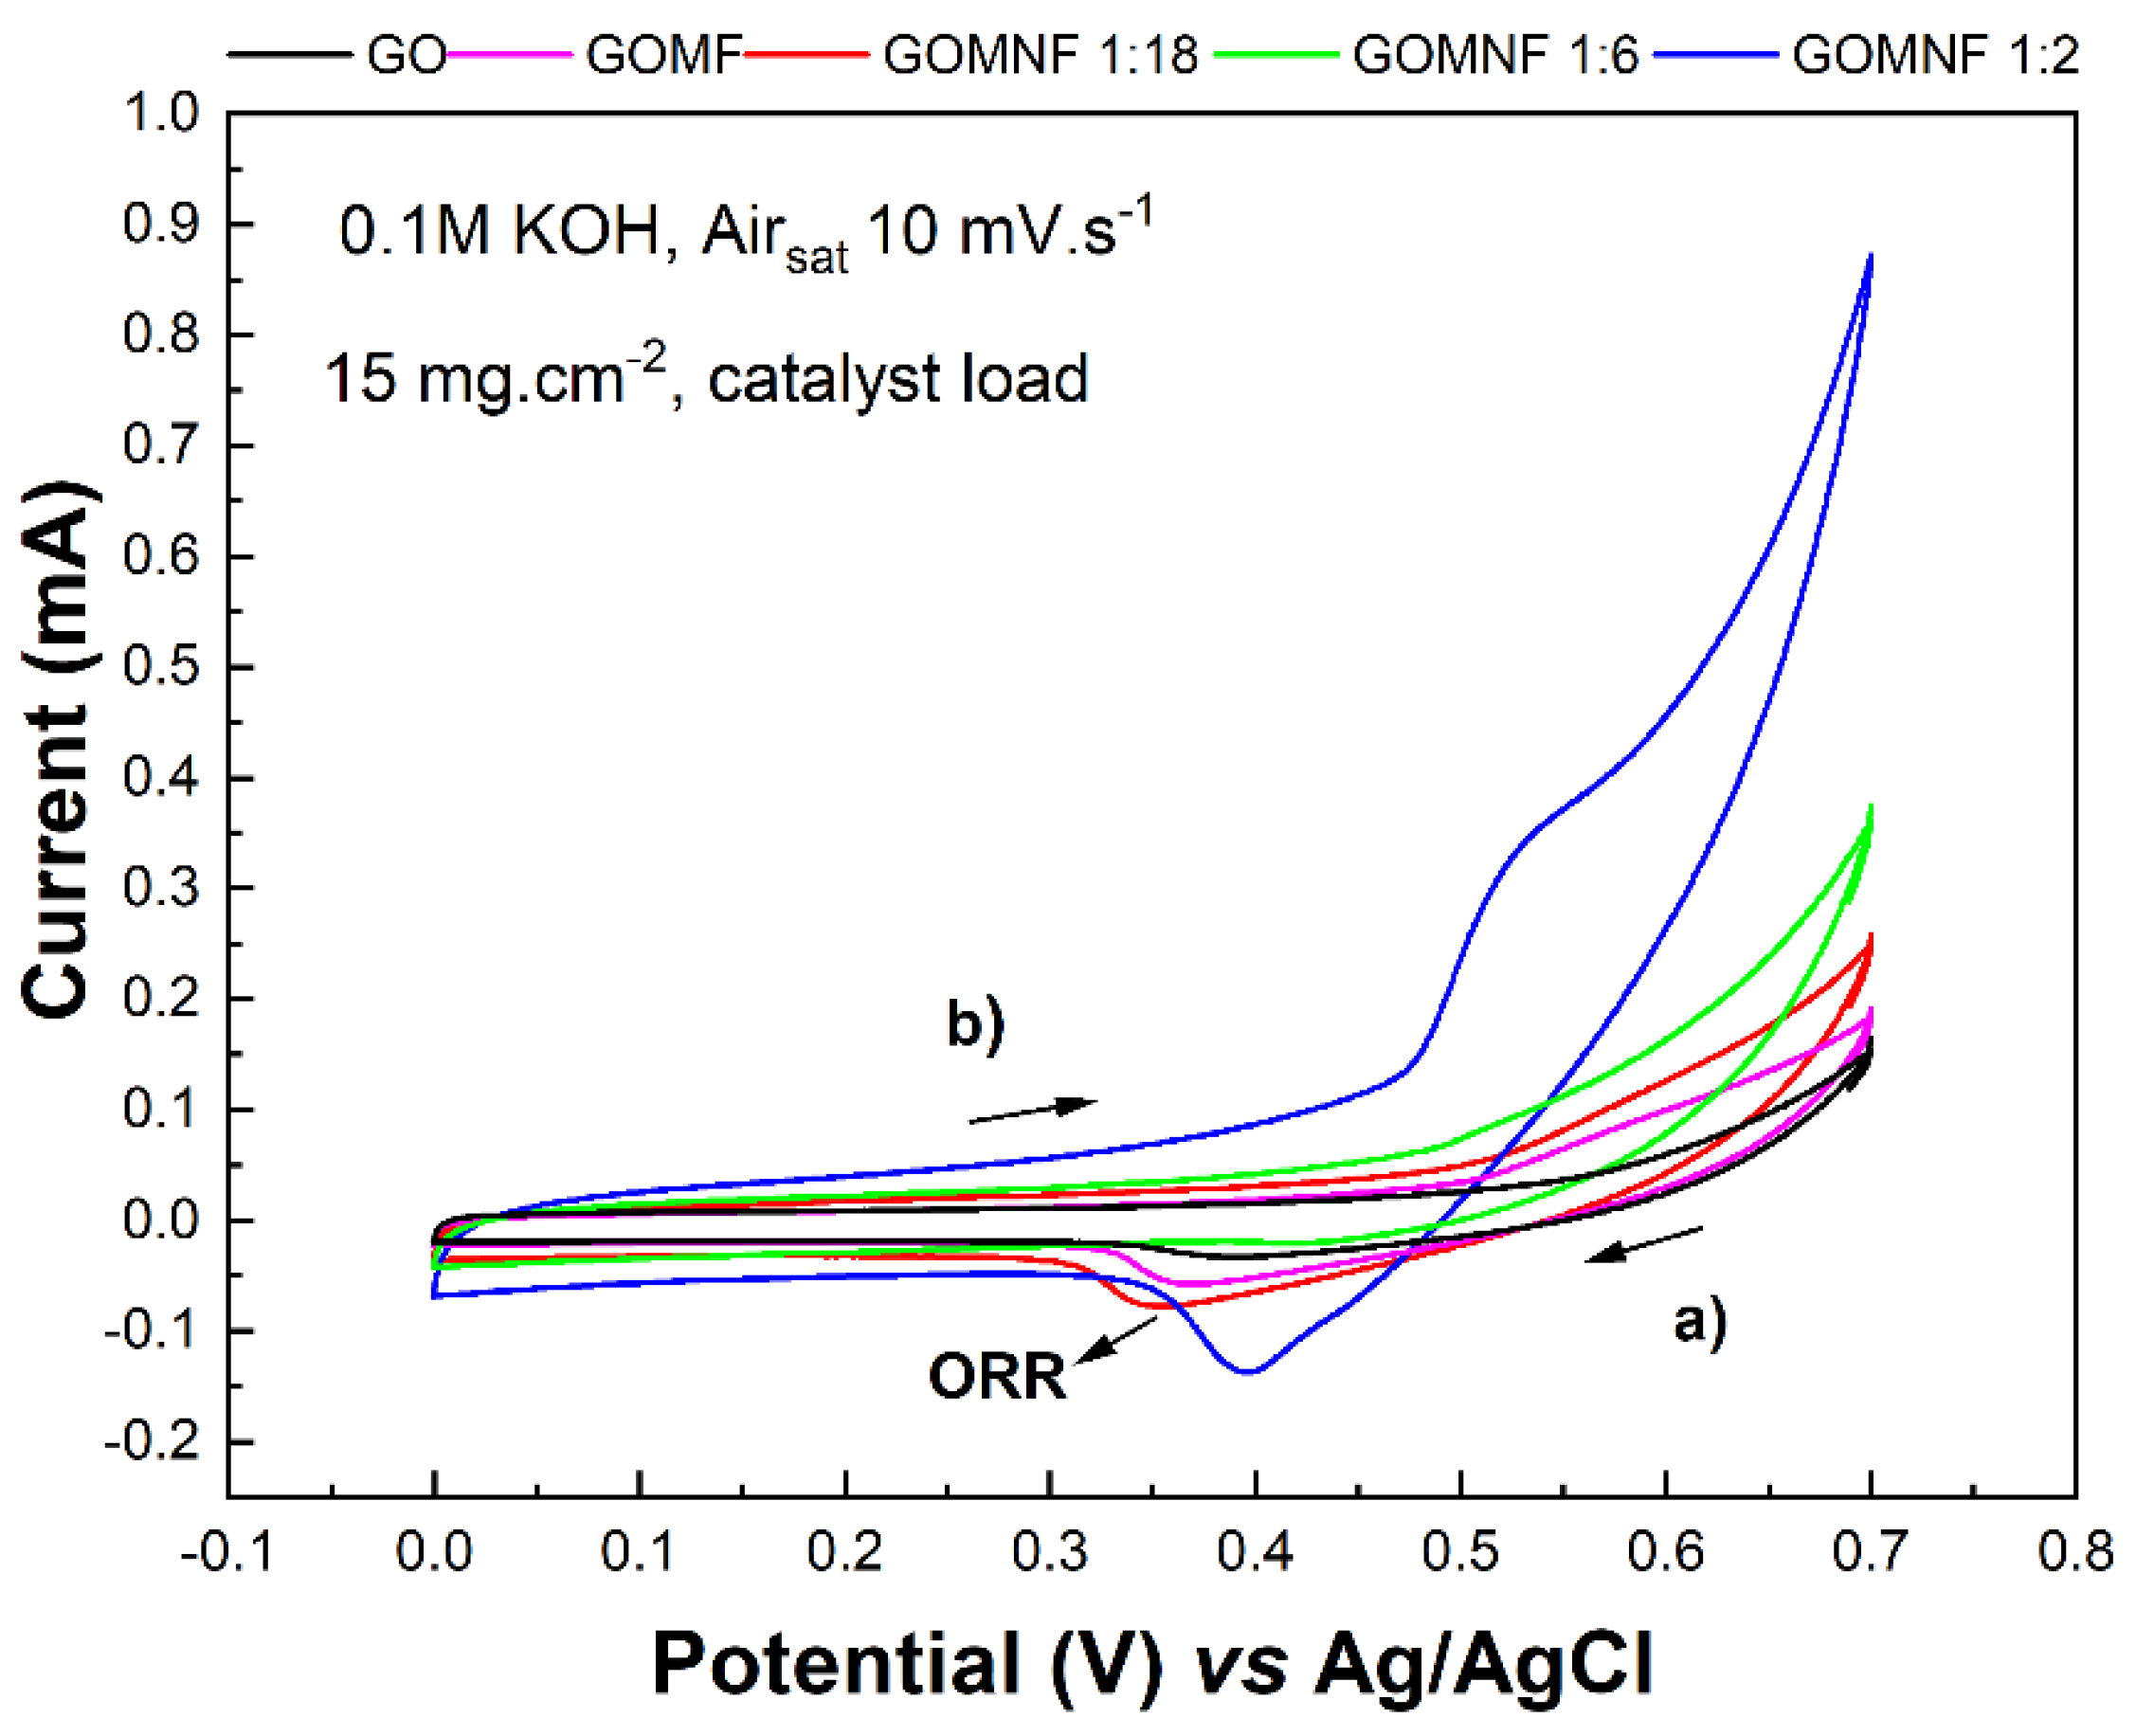
The catalytic activity of the cathodes towards ORR was studied by cyclic voltammetry.
Figure 7 shows the voltammograms of GO, Fe
3O
4/GO (GONF) and Ni-doped Fe
3O
4/GO samples (GOMNF 1:18, GOMNF 1:6, GOMNF 1:2) with a catalyst loading of 15 mg/cm
2. The samples GOMNF 1:18 and GOMNF 1:2, present catalytic activity at ORR at a potential of 0.35 V with a current response of -6.18x10
5 and a potential of 0.40 V with a current of 1.28x10
4 A, respectively. This behavior could be due to the presence of crystalline phases of nickel ferrite (NiFe
2O
4) and magnetite (Fe
3O
4), which give it an increase in electronic transfer. However, the GOMNF 1:2 sample, which shows the highest catalytic activity, shows a more intense peak corresponding to magnetite compared to the GOMNF 1:6 sample, demonstrating that a mixture of phases improves catalytic performance [
45,
46].
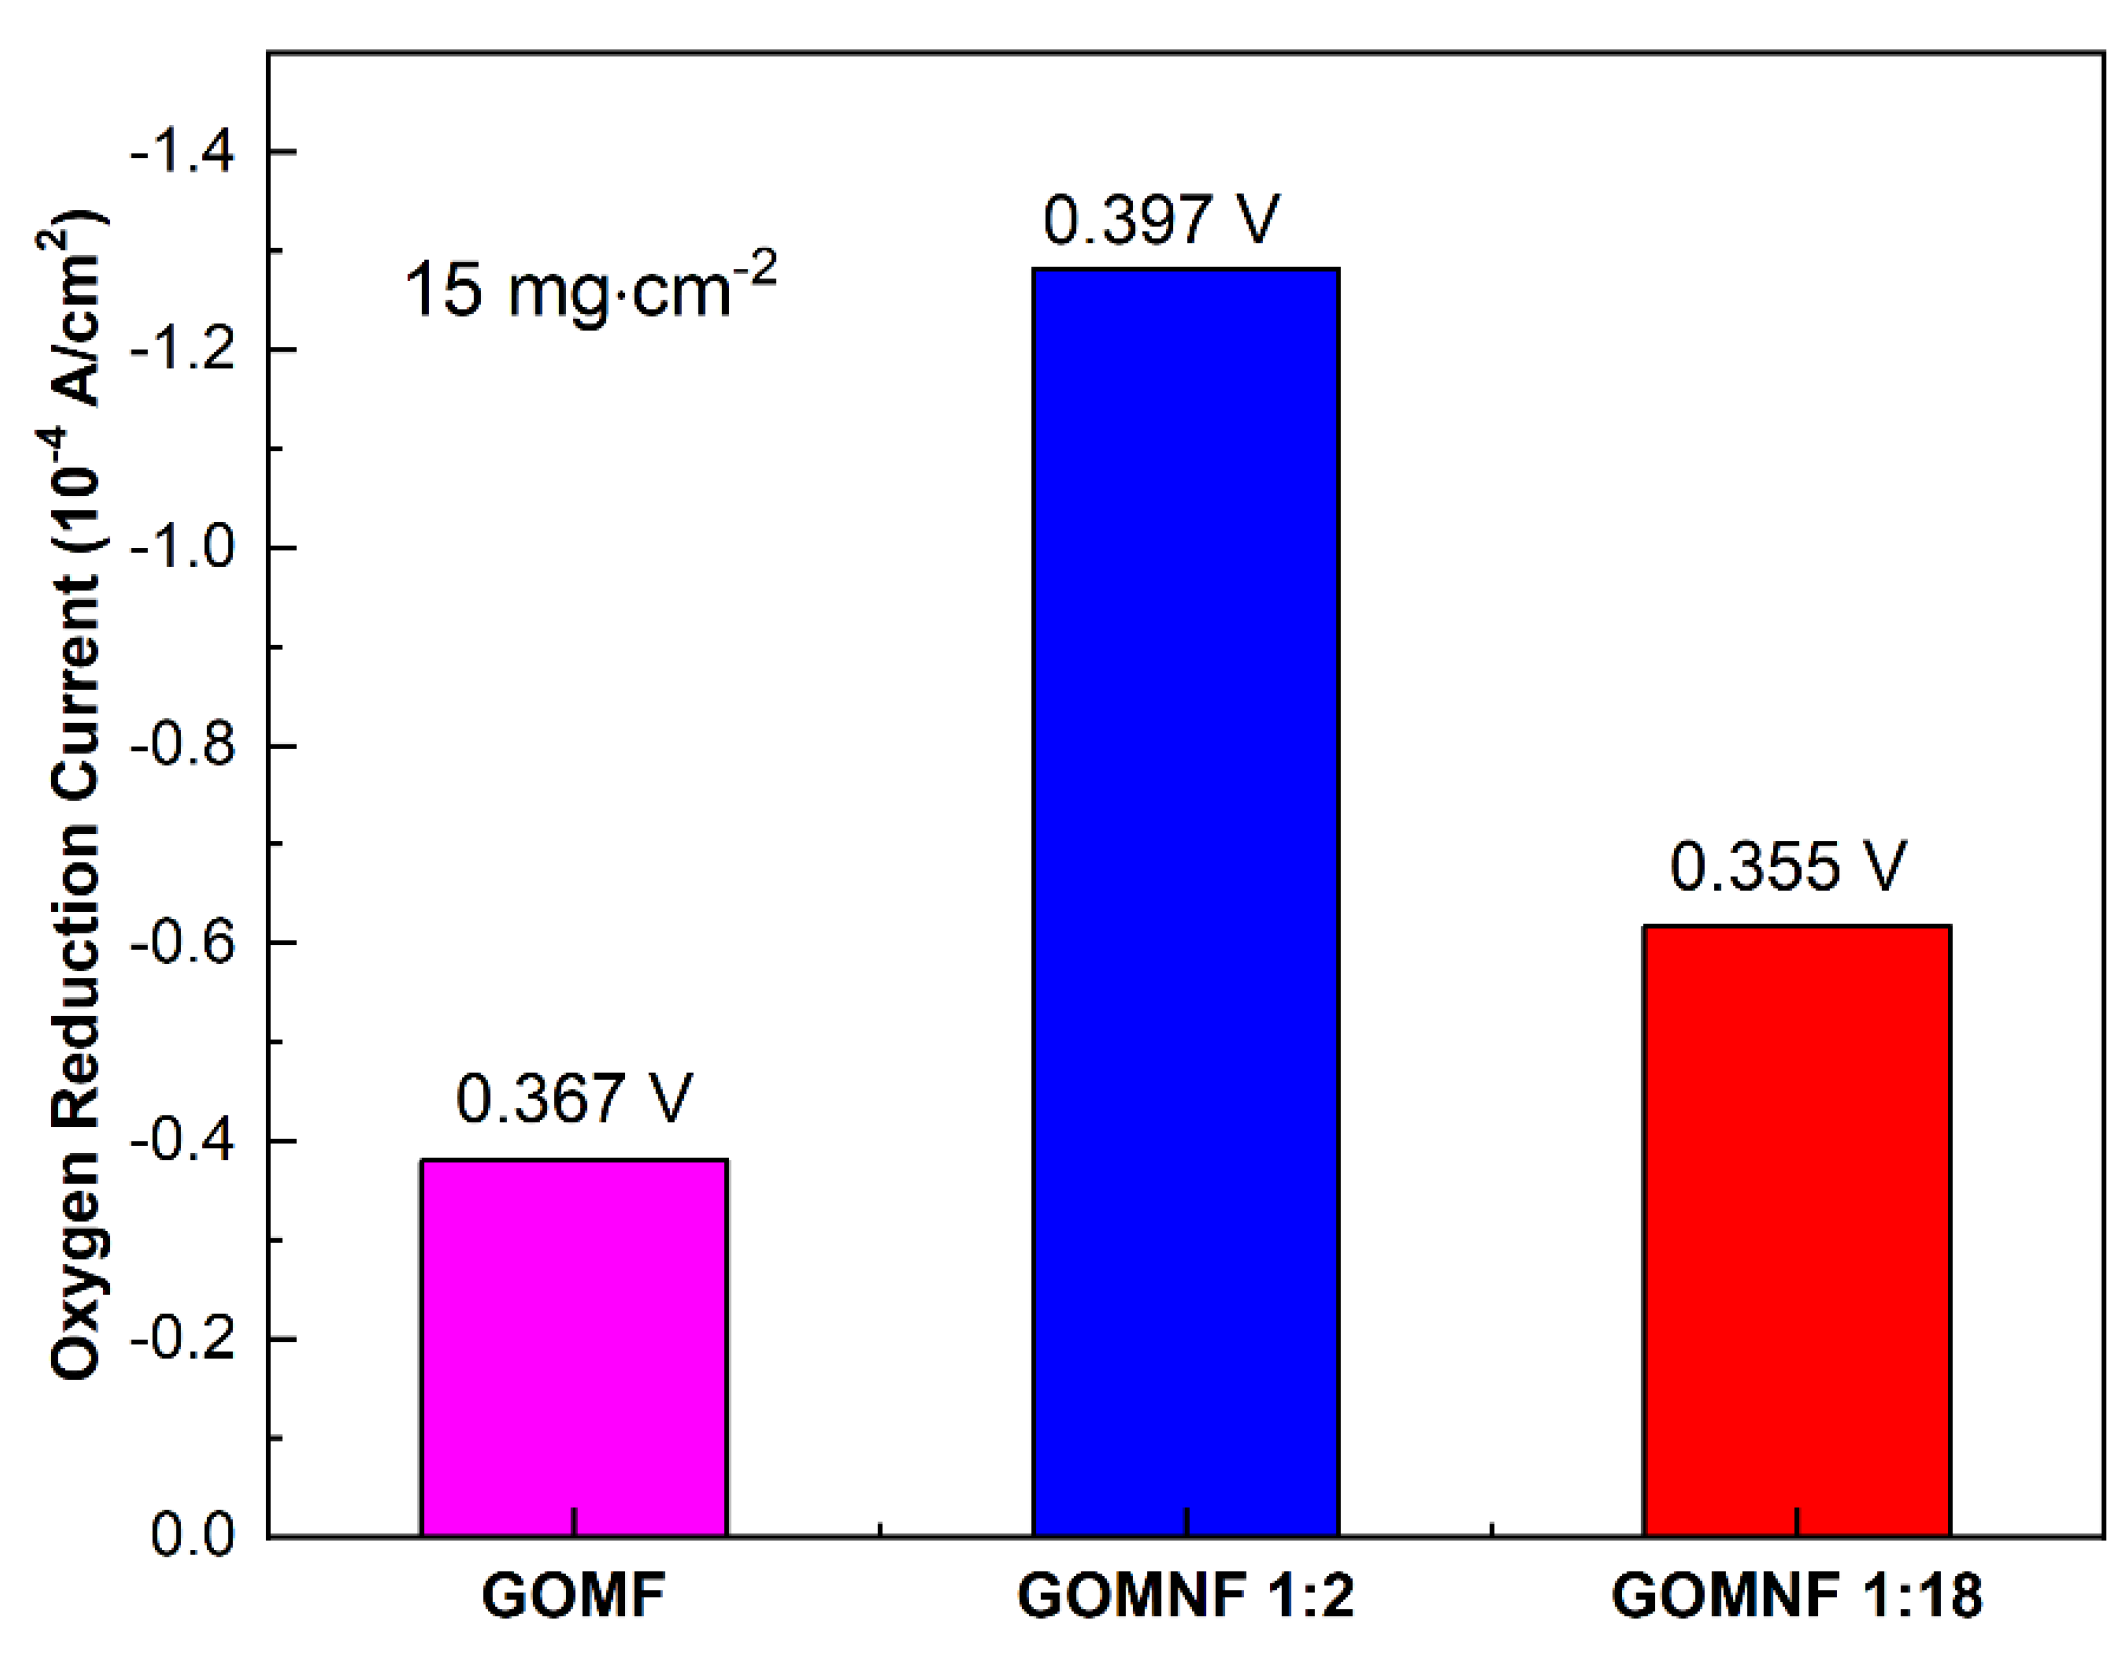
A summary of the catalytic performance, obtained by cyclic voltammetry of the decorated graphene materials, is shown in
Figure 8. Additionally, a comparison is made with a decorated GO material and Fe
3O
4. The reduction potentials are very similar, indicating that all catalysts have similar activities. On the other hand, according to the reduction current, the GOMNF 1:2 sample is the most efficient. The catalysts that showed activity were used to made air electrodes to be evaluated in a laboratory scale microbial fuel cell with a volume of 50 mL.
3.6.1. MFCs Performances with Different Electrocatalyst
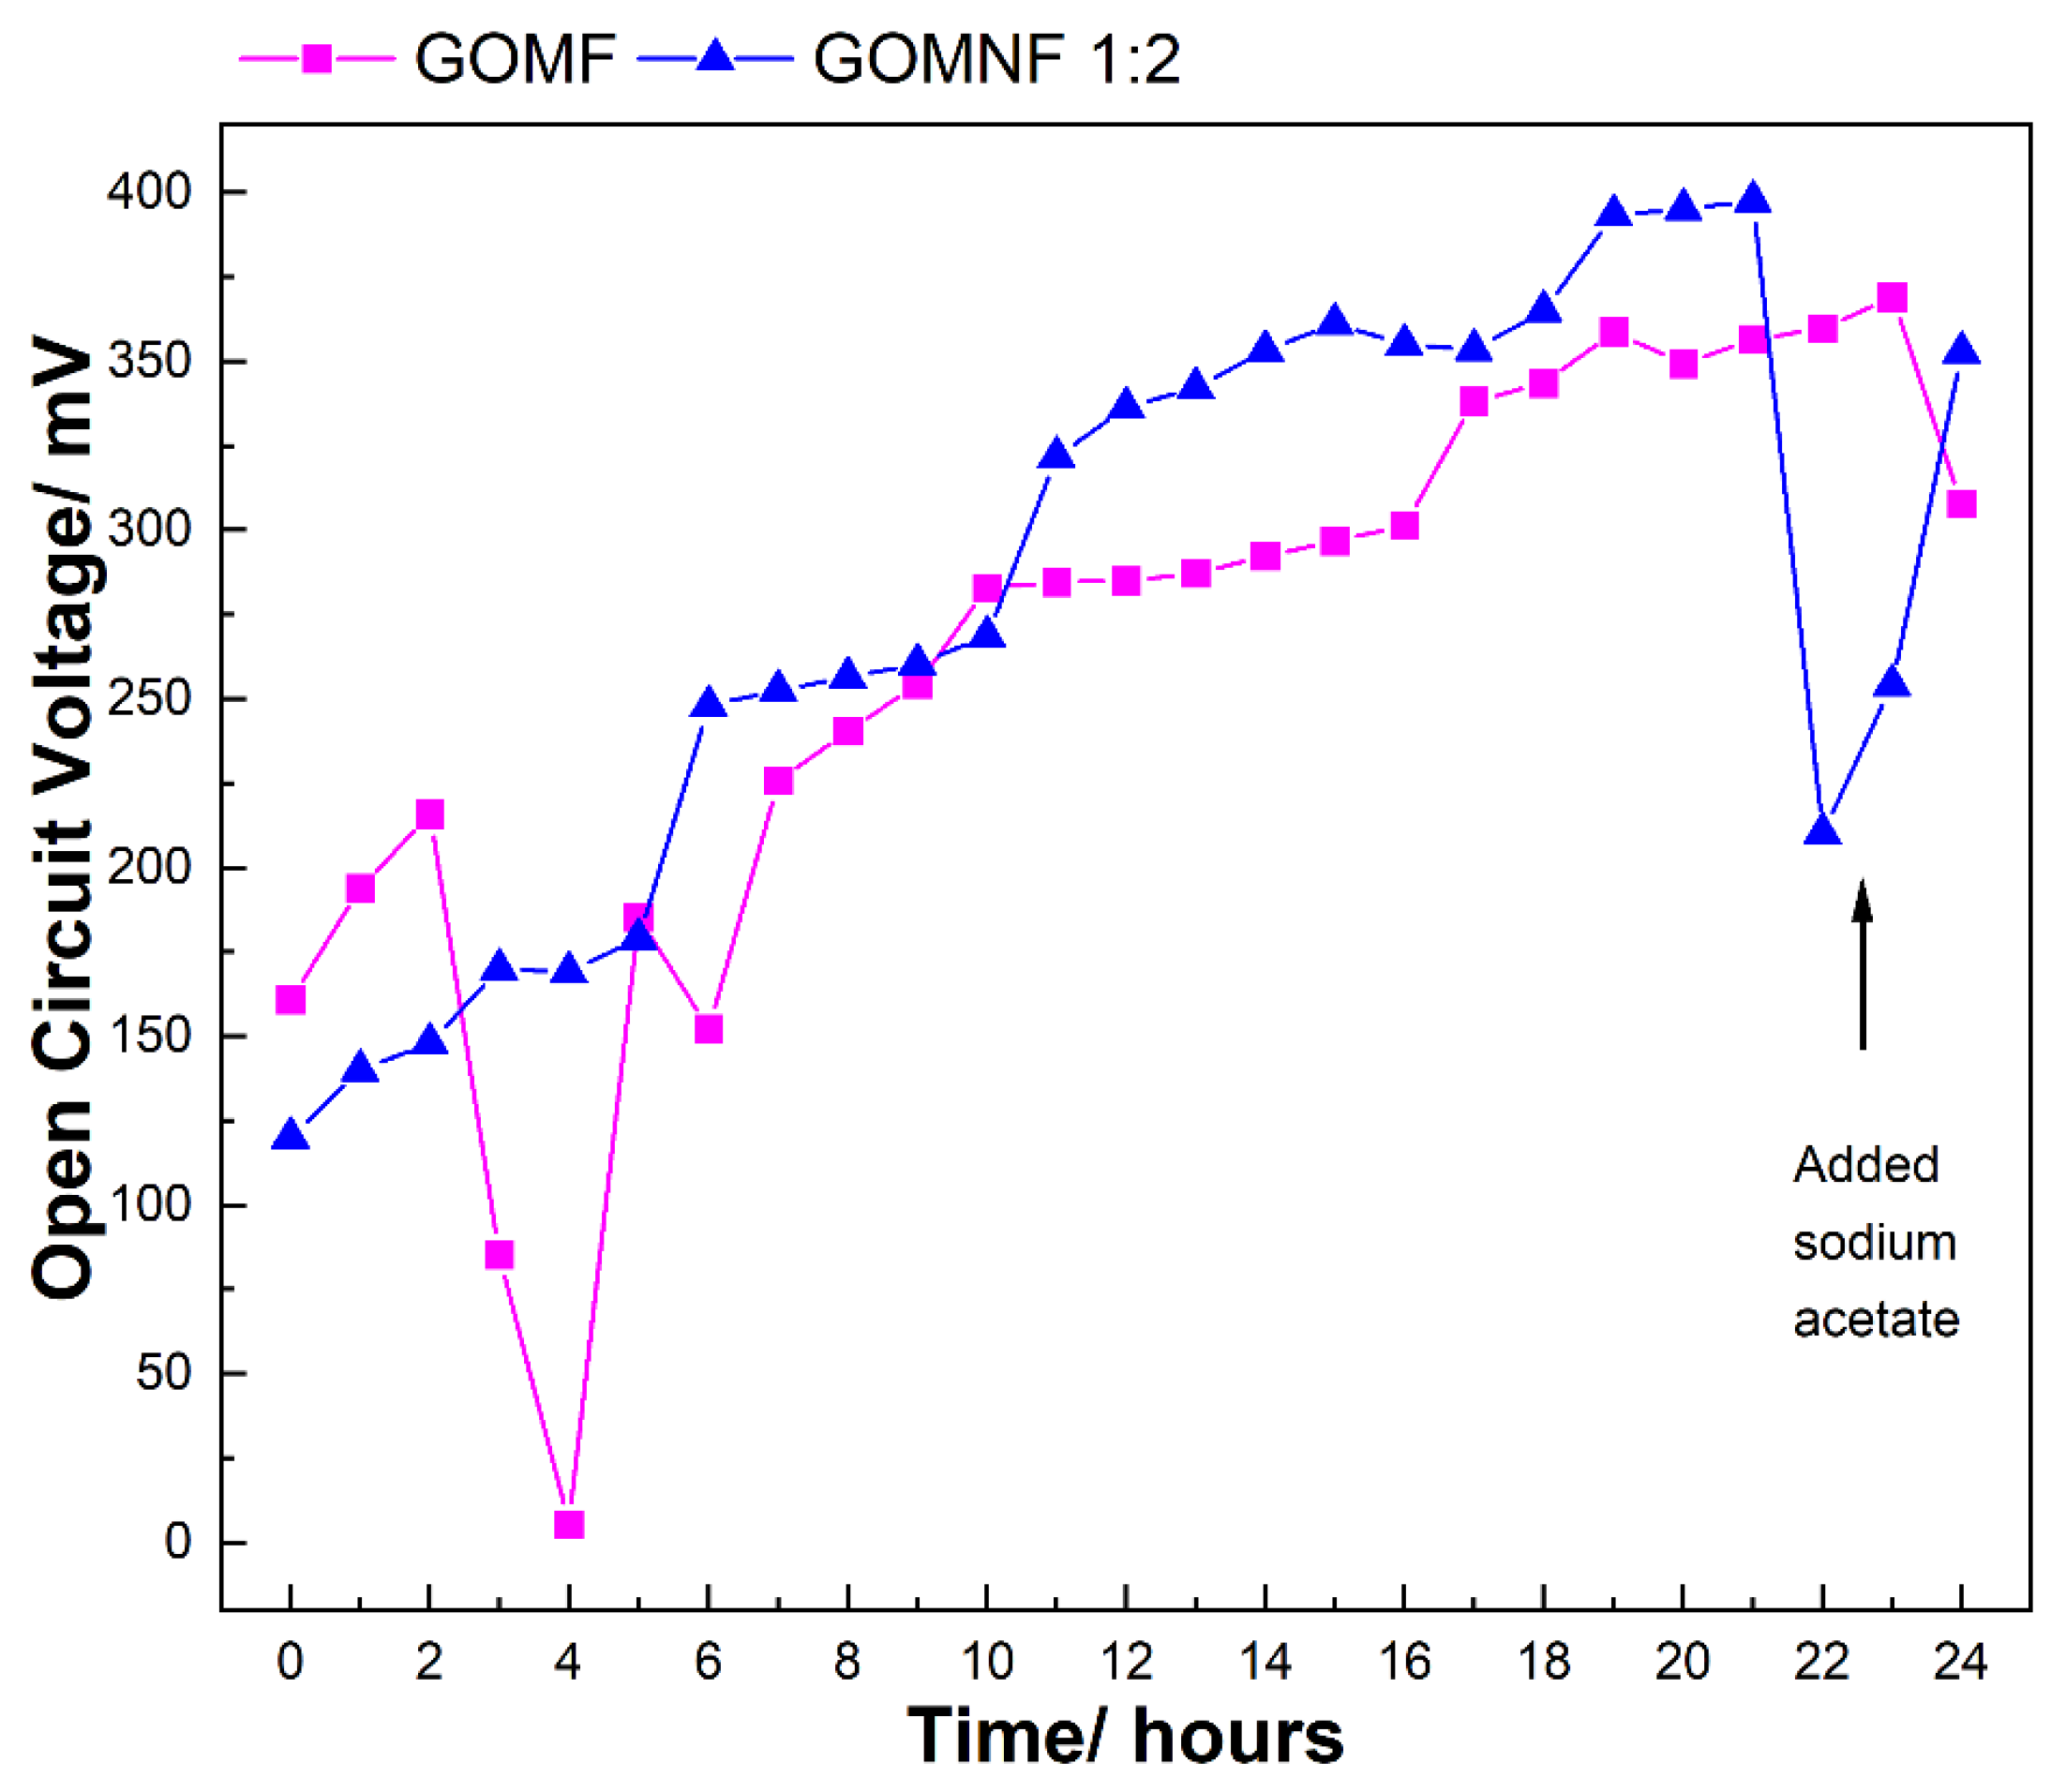
The evolution of the open circuit voltage (OCV) in the cells built with the GOMNF 1:2 and GOMF, electrocatalysts are presented in
Figure 9. In the case of the GOMNF 1:2 electrocatalyst that showed the highest OCV in cell performance and the highest oxygen reduction reaction, the voltage gradually increases until reaching a maximum potential of 397.7 mV after 21 h. From this moment on, a sharp decline in the OCV is observed; by adding sodium acetate, the voltage increases again, indicating that the drop is due to starvation of the microbiological population in the anode chamber when COD is reduced [
47,
48]. The cell with the GOMF catalyst showed a continuous increase in voltage in the 24 h of operation, until reaching 350 mV.
It is attributed that the difference in the performance of the cells with the GOMF and GOMNF catalysts was due to the crystallite sizes that were 12.04 nm and 9.45 nm, respectively. This can be influenced by the electrical conductivity of nanoparticles supported on graphene oxide [
49] .
Furthermore, the introduction of Ni causes the formation of a mixture of Fe3O4 and NiFe2O4 and other phases of iron oxide, with which some oxides can act as cocatalysts. However, the agglomeration and distribution of the catalyst on the graphite felt is related to the behavior of the material.
3.7. SEM Analysis
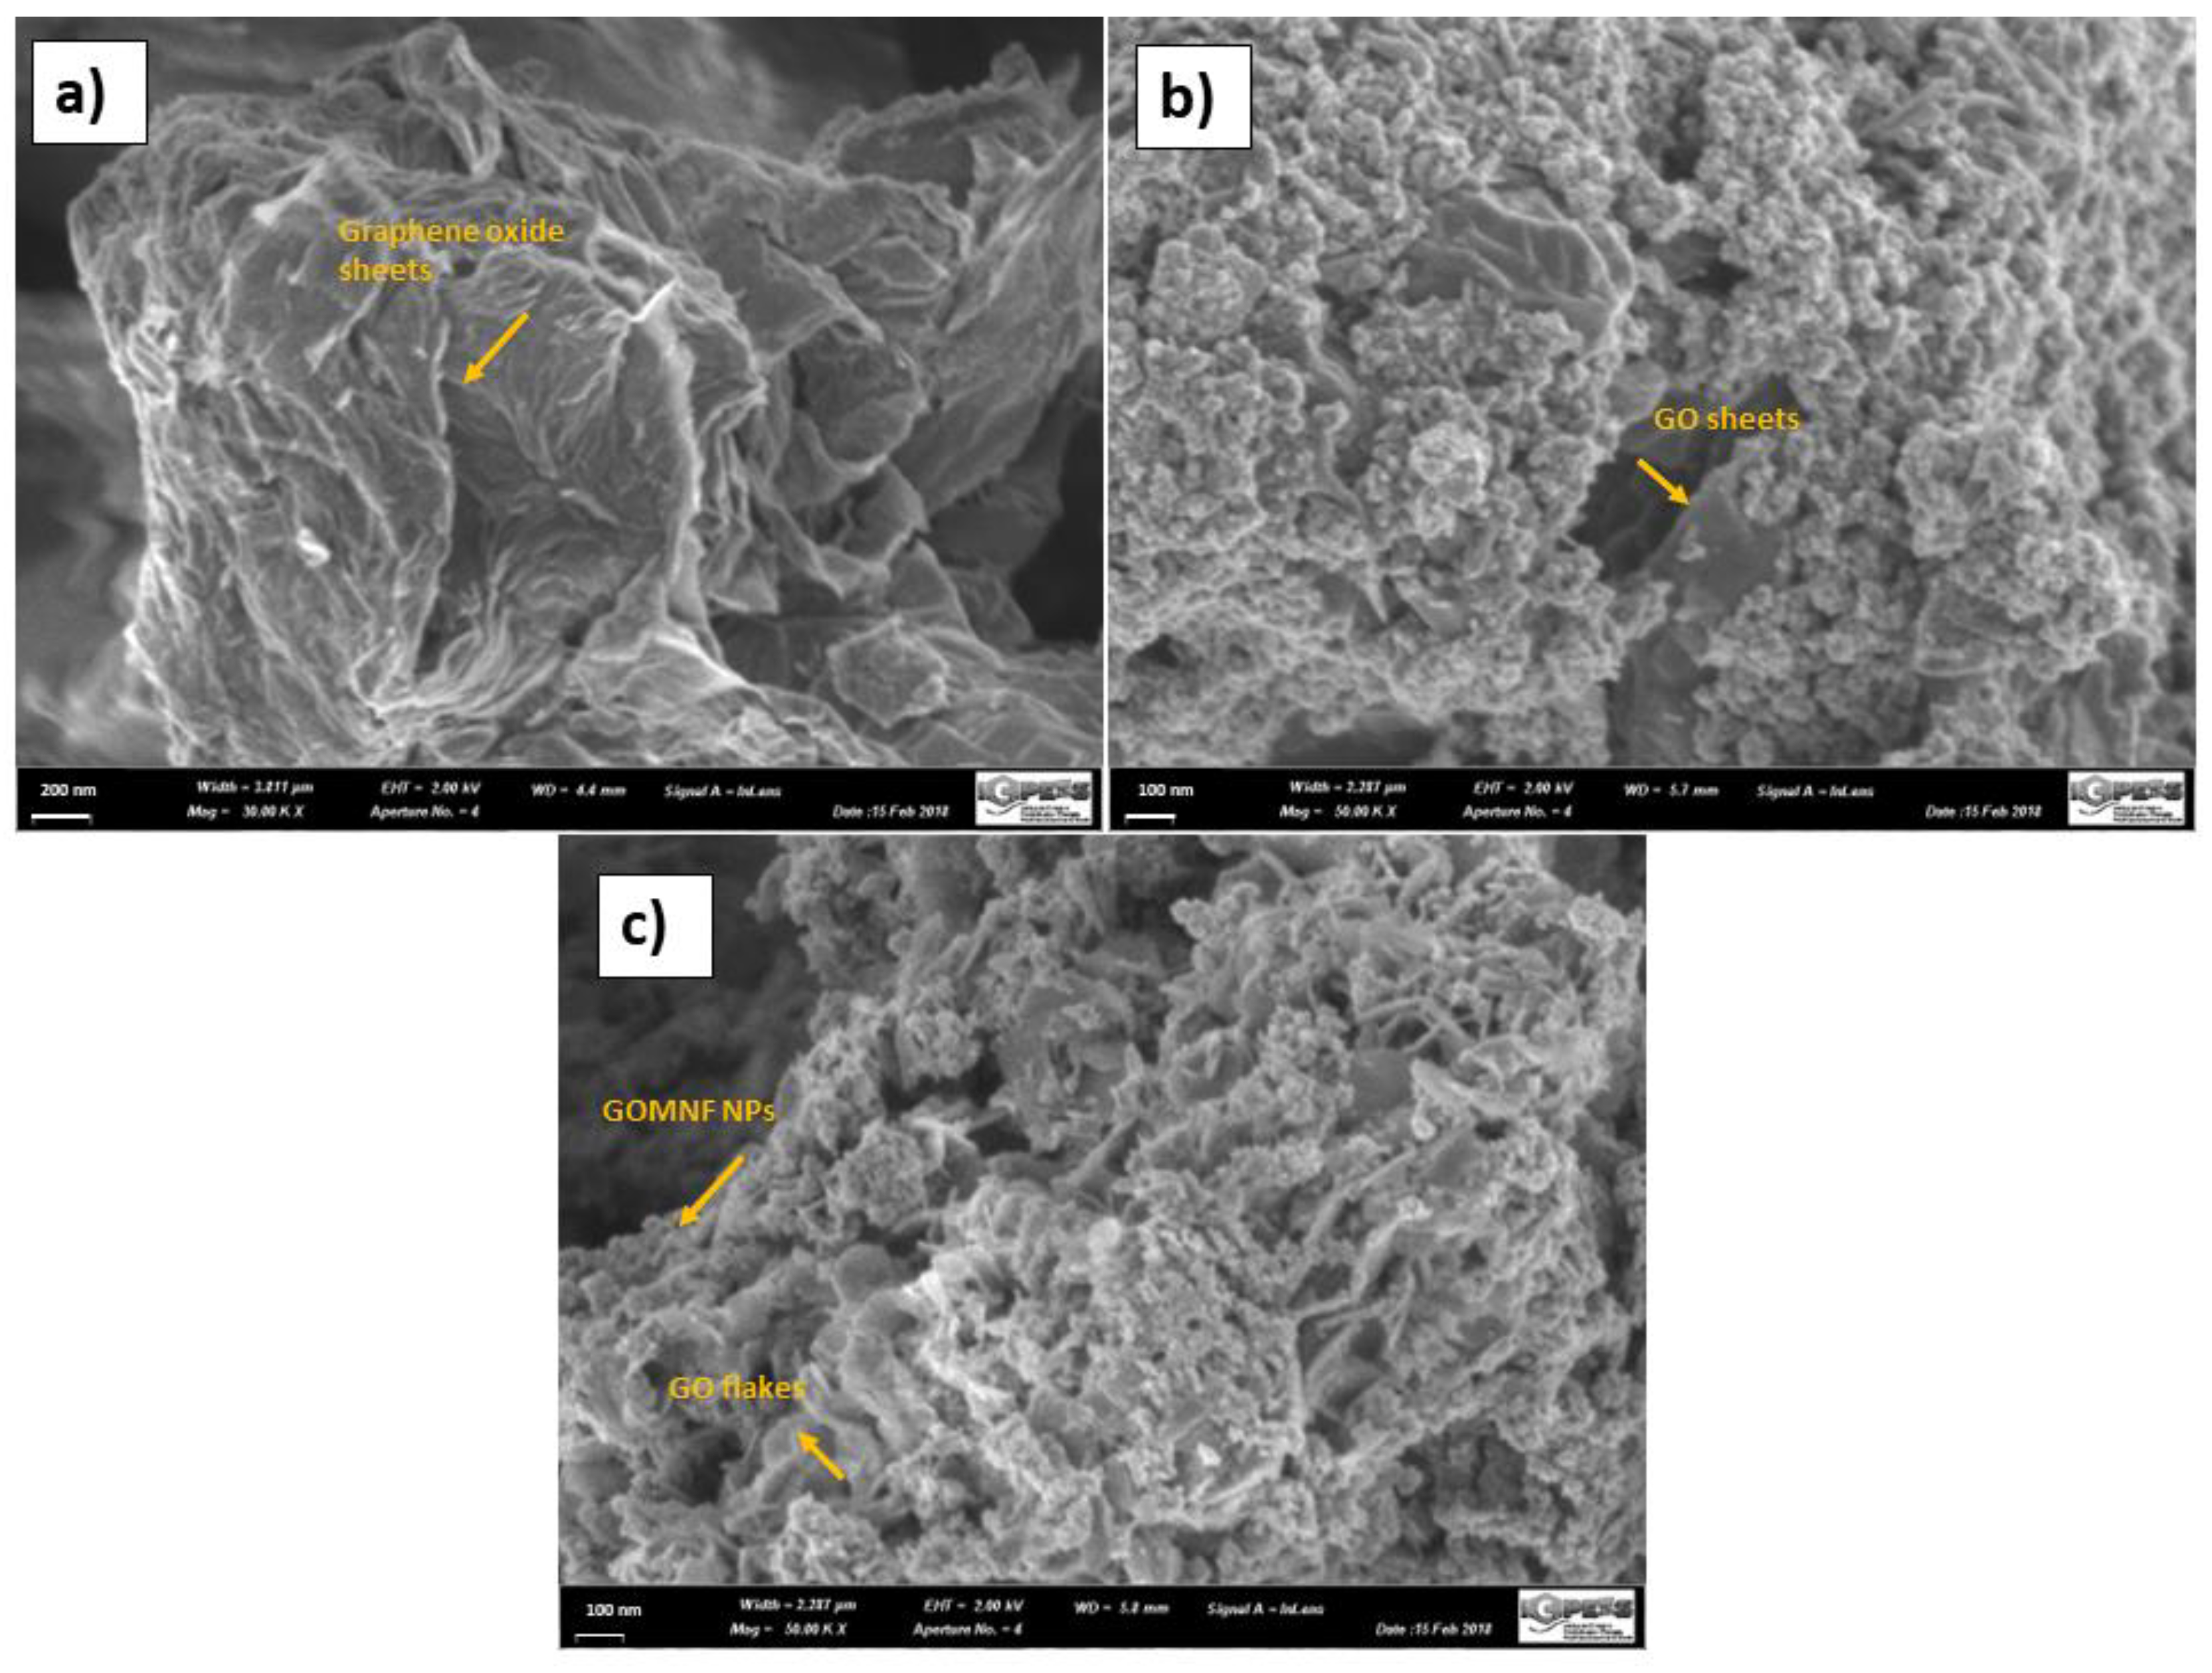
The morphology of the samples was studied by scanning electron microscopy.
Figure 10a) presents micrographs of graphene oxide. A wrinkled surface is observed in the GO layers because of the deformation by exfoliation and the re-stacking of the sheets when drying [
50] . Furthermore, it is possible to observe the edges of individual sheets of graphene which have a wavy and folded shape. In
Figure 10b) is observed the micrograph of the GOMF, where the magnetite nanoparticles cover the graphene oxide sheet.
Figure 10c shows the SEM micrograph of GOMNF 1:2, where exfoliated flakes covered with nanoparticles (NPs) are observed.
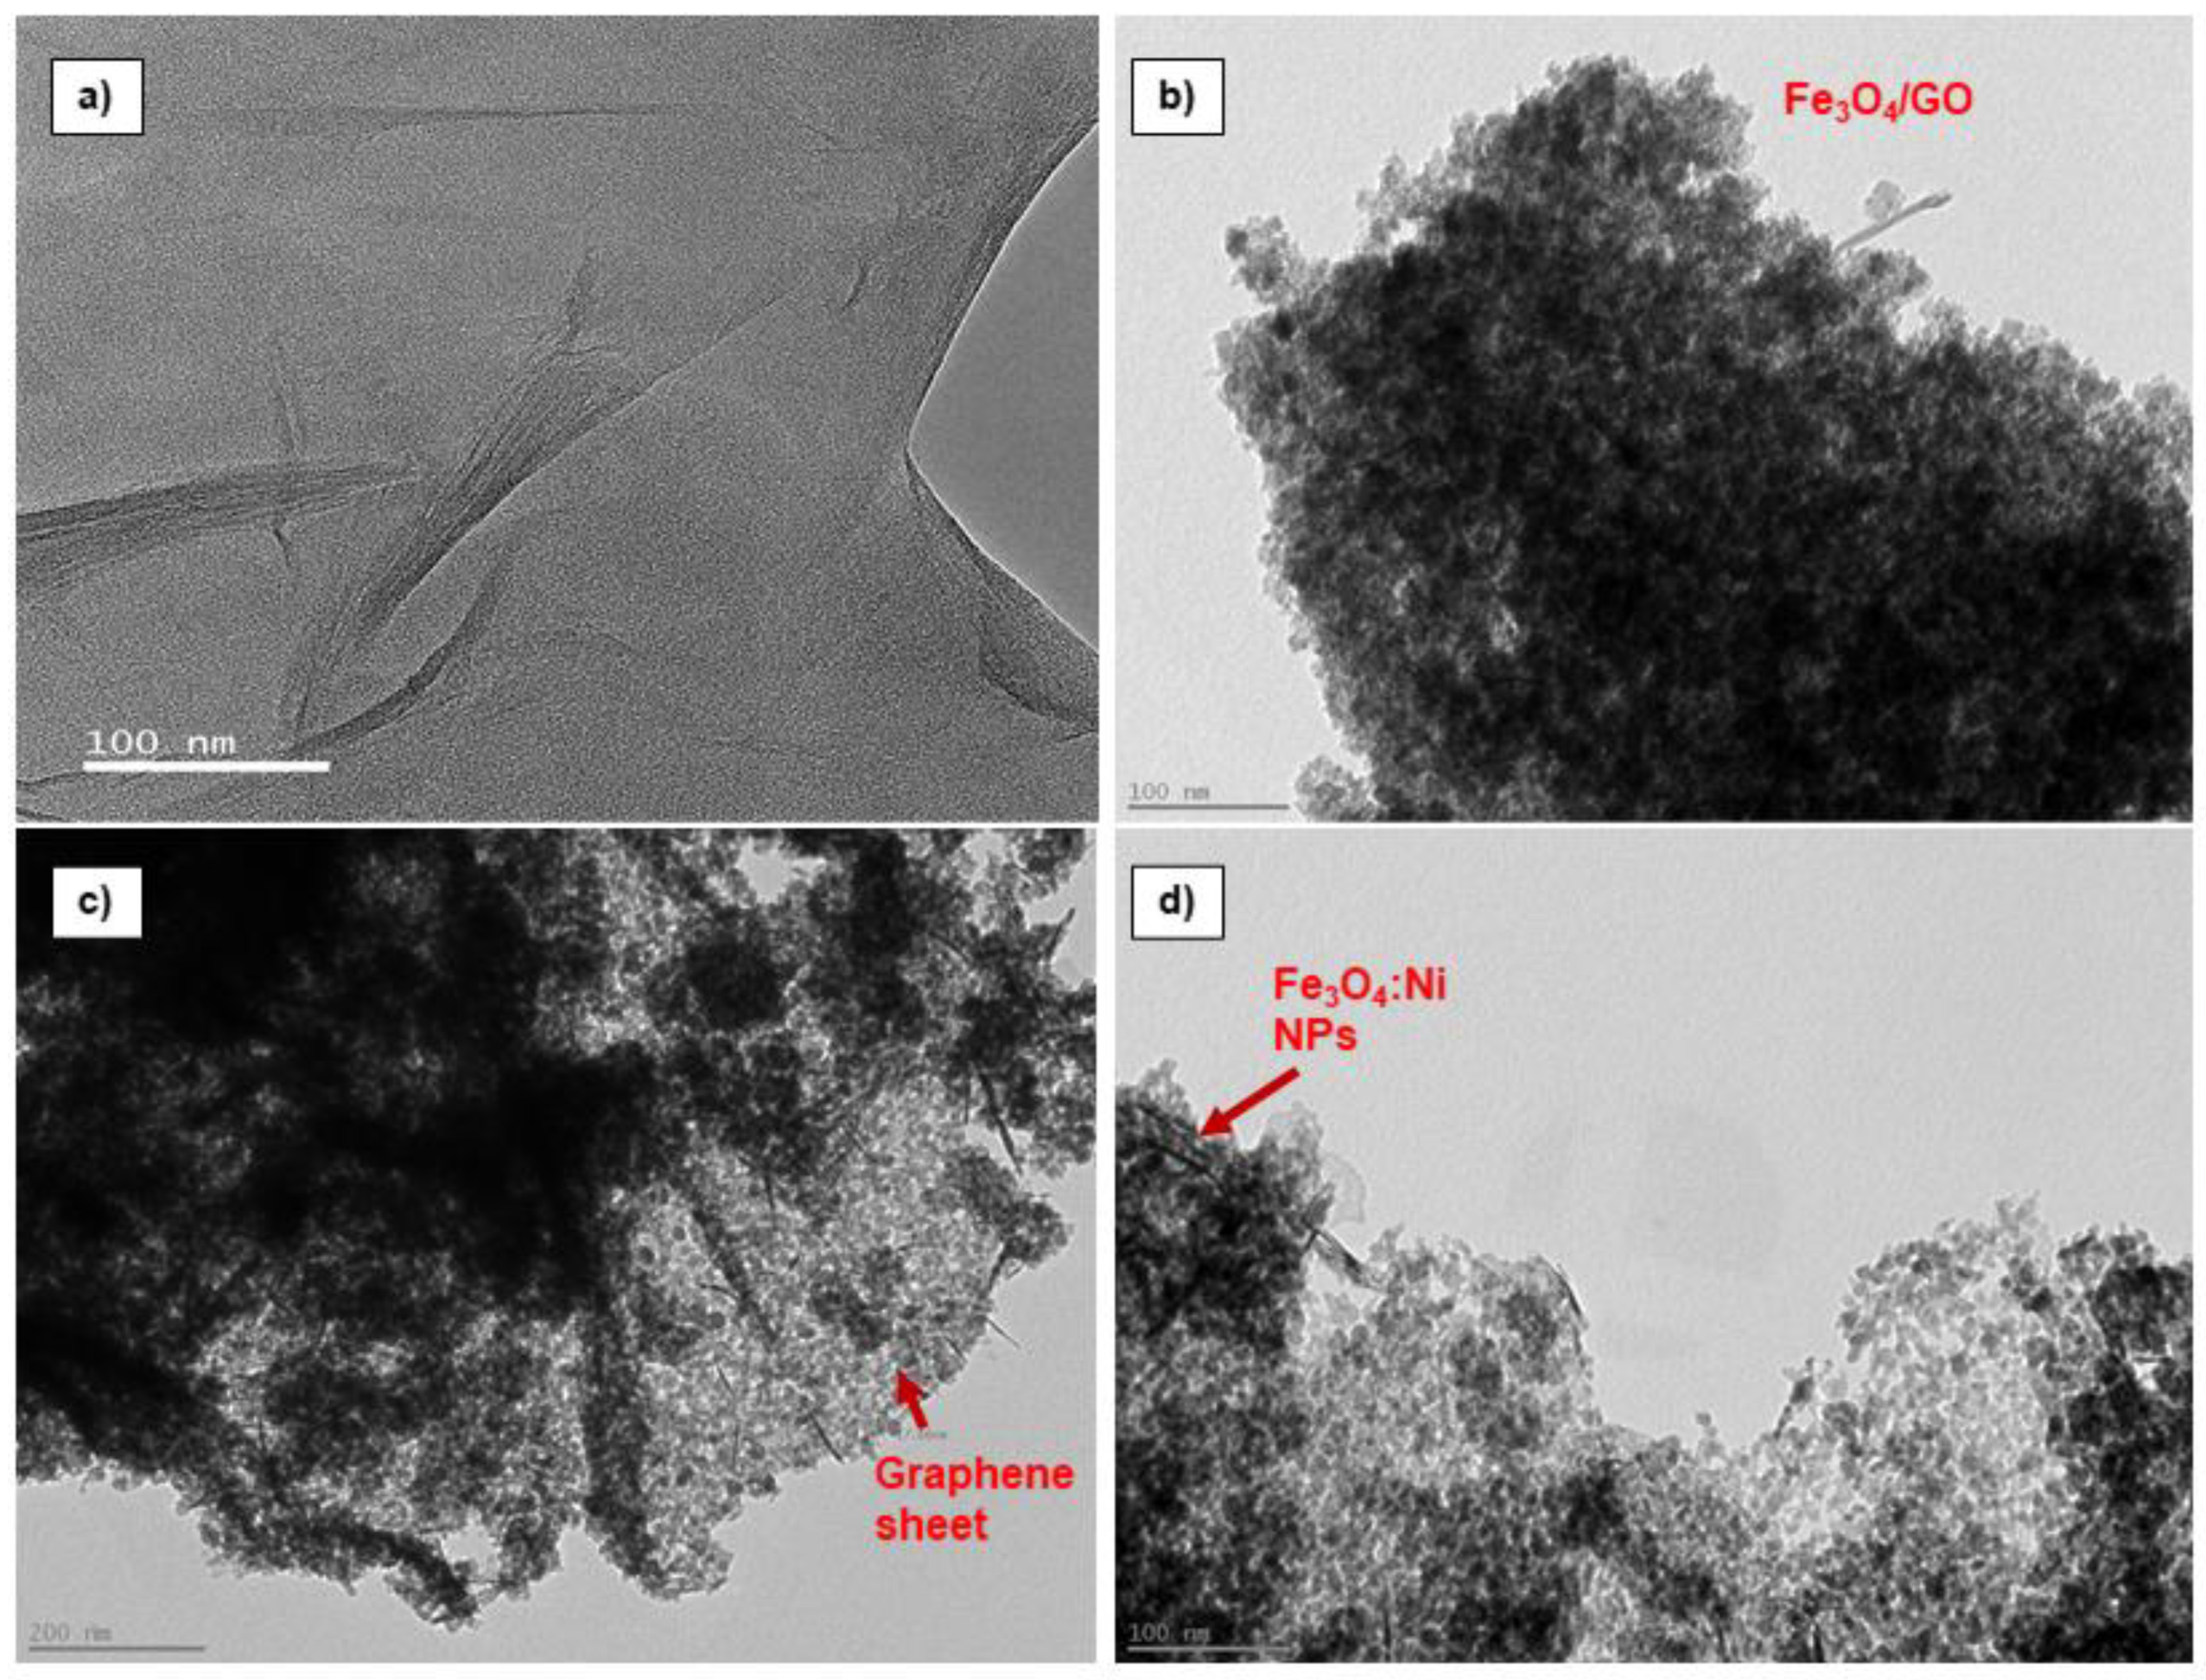
3.8. TEM Analysis
To have further insight of the morphology, in the
Figure 11 the transmission electron micrographs of graphene oxide and of the GOMNF 1:2 sample are presented.
Figure 8a) presents the microscopic characteristics of the GO, which consist of 8 to 10 stacked sheets; the folding is attributed to the functional groups incorporated to the edges of the sheet during oxidation, in which the carbon adopts the sp
3 configuration. The darker regions in the micrographs are due to the increased number of layers stacked in the area. In addition, the corrugated sheet is observed, attributed to the formation of hydrogen bonds in the oxygenated groups between the basal plane of graphene [
51,
52] .
Figure 11b belongs to the GOMF sample where agglomerated nanoparticles onto a single sheet are observed. In
Figure 11c, corresponding to the 1:2 GOMNF sample, the edge of the GO sheet looks “bitten”, possibly because the nanoparticles nucleated on the edges, reducing the carboxyl and carbonyl groups as shown in FTIR. It is noticeable that the 1:2 GONMF has a minor particle covering with respect to GOMF, which could explain the increase in weight loss with increasing Ni contents. Some tubes are seen that could be graphene sheets rolled up on themselves upon the terminal group reduction.
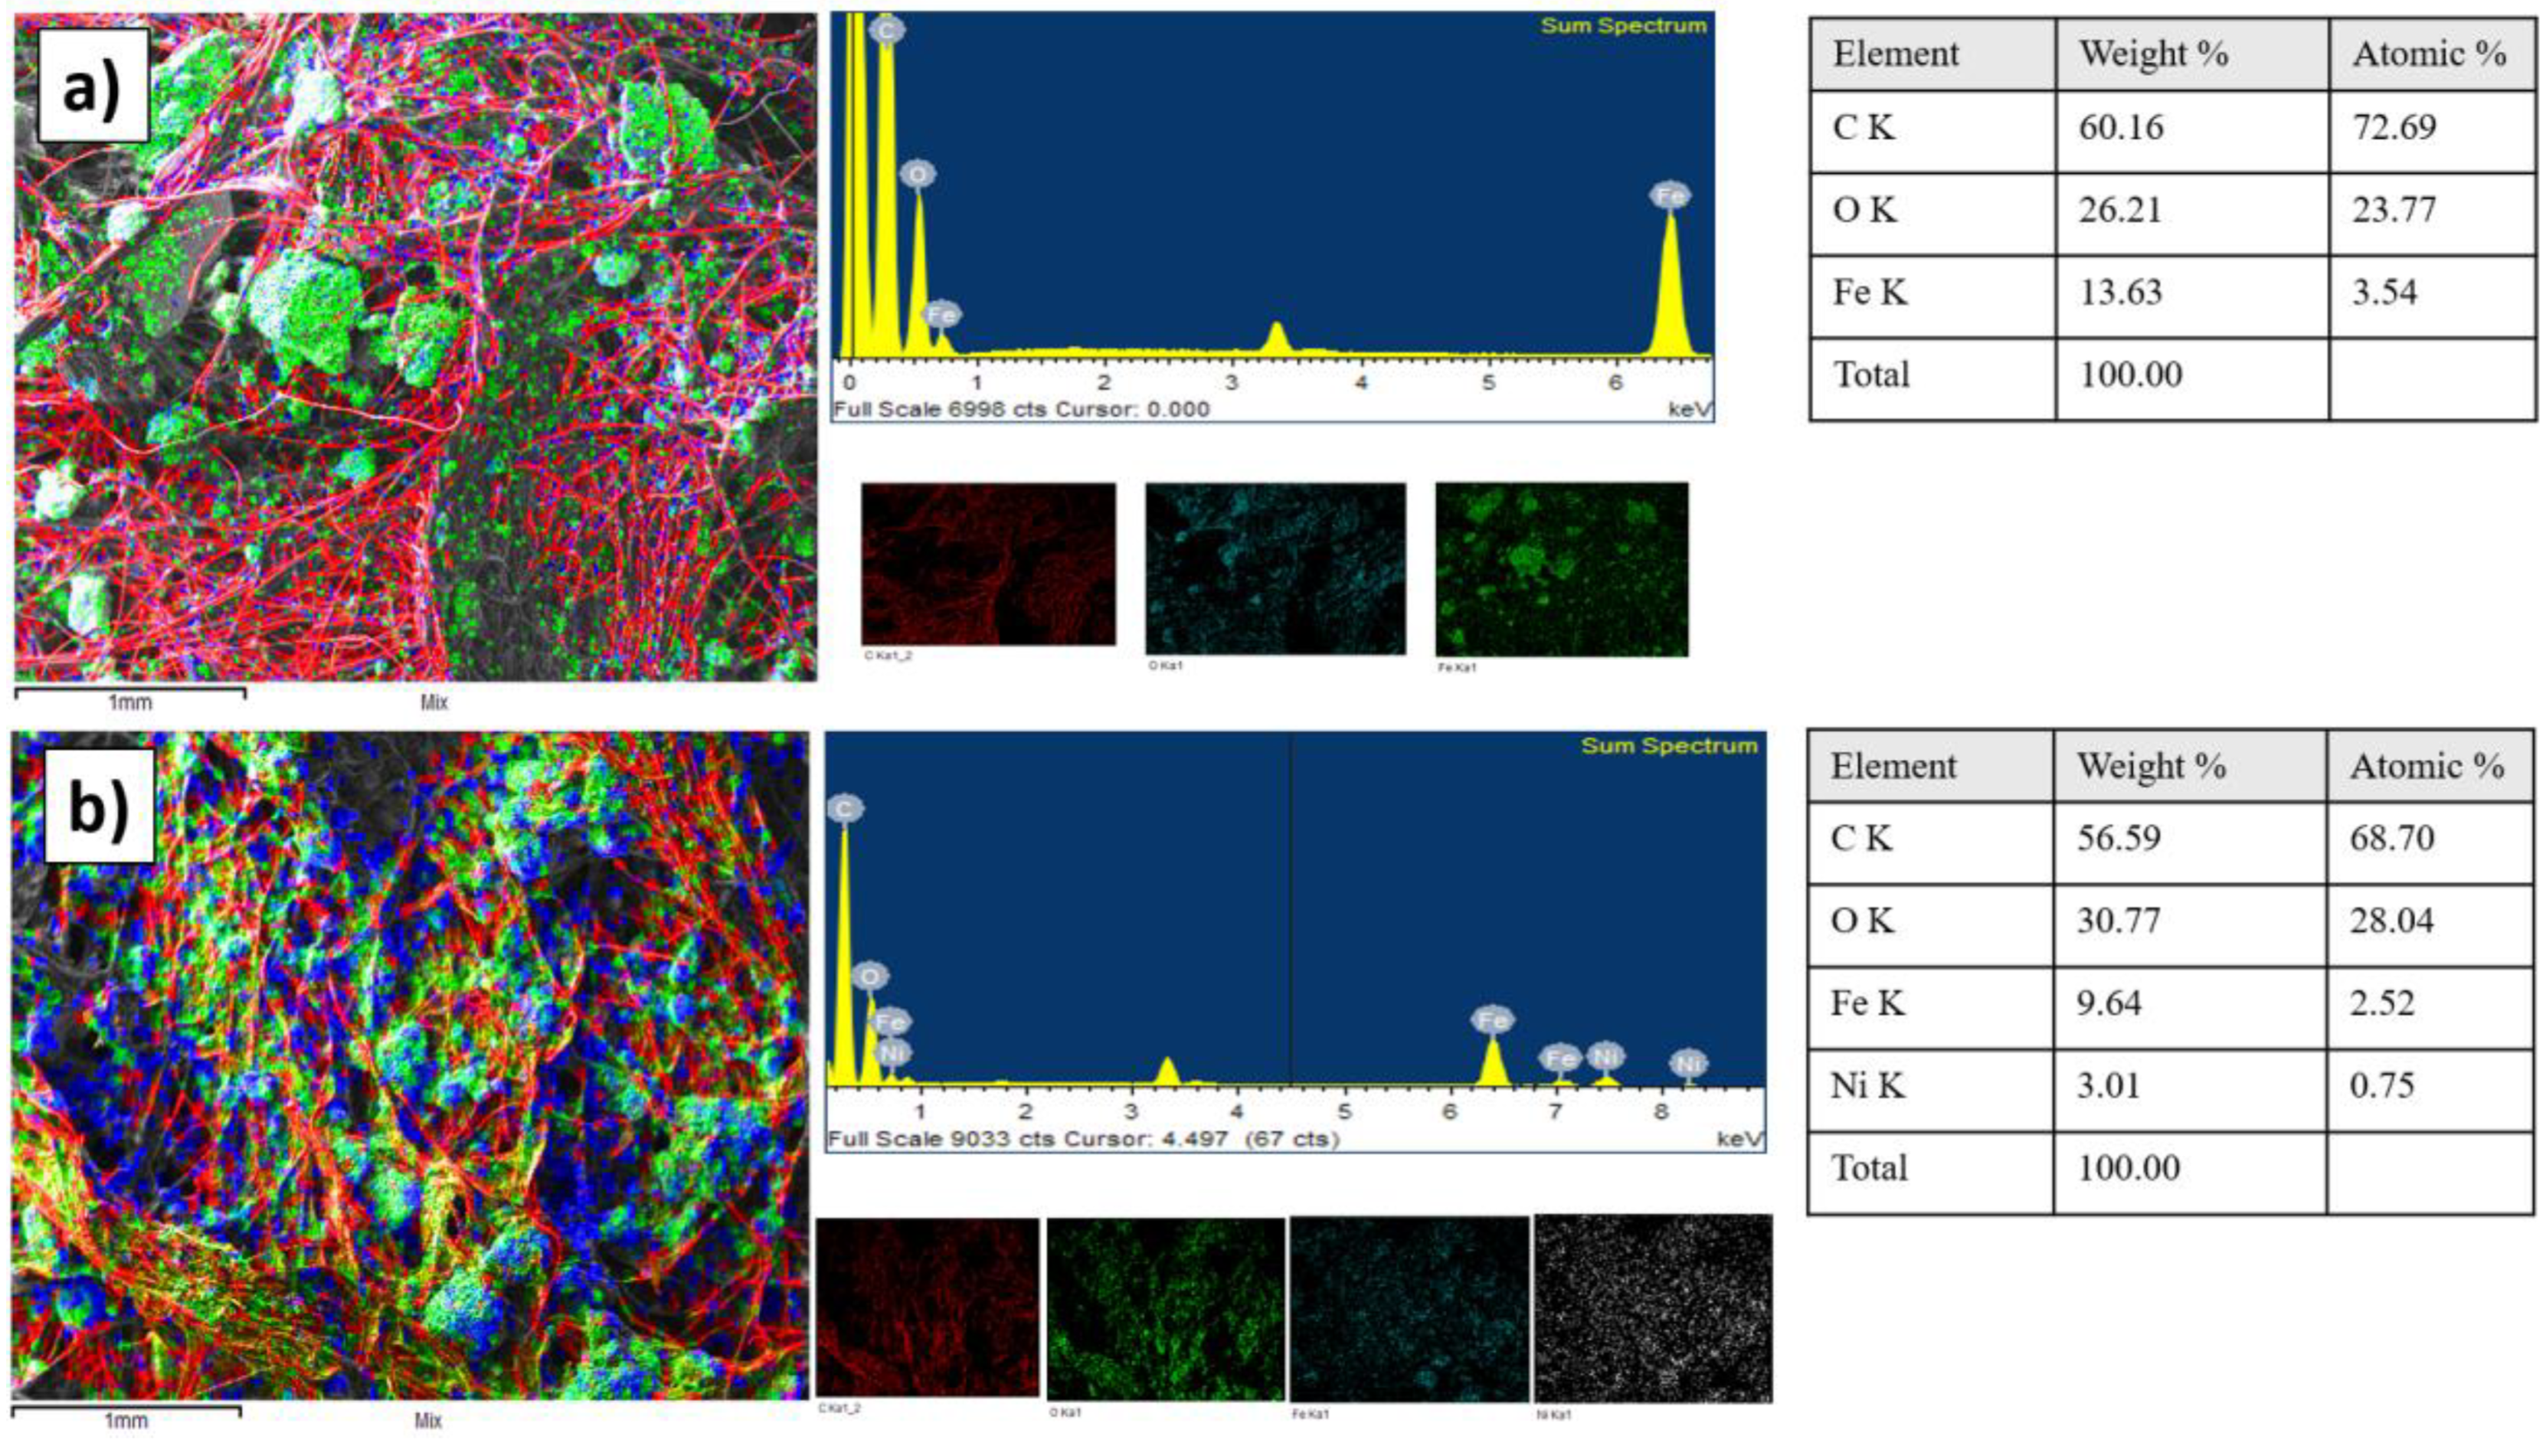
3.9. SEM/EDS Analysis
Figure 12 shows the SEM/EDS mapping of GOMF and GOMNF 1:2 samples deposited onto the graphite felt used in the MFCs.
Figure 12a) shows the SEM image and the composition of the GOMF/graphite felt sample, where large particles of Fe-rich (green color) are evenly distributed along the fibers and graphite surface, which in turn, is associated with poor electrochemical performance. The EDS data on the table at the right side, show an iron contents of ca. 3.5 at.%. For GOMNF 1:2/graphite sample (
Figure 12b), there are well distributed particles within the electrode, favoring good electrochemical performance. In the respective composition table, 2.52 at.% Fe and 0.75 at.% Ni are observed, fairly corresponding to 1 mol NiFe
2O
4 + 0.5 mol Fe
2O
3.
4. Conclusions
In this work, graphene oxide decorated with Fe3O4 and Fe3O4/Nickel-doped graphene oxide nanoparticles were obtained using the coprecipitation synthesis method. Varying the Ni/Fe ratios and the total Fe concentration, materials with different crystalline phases of iron oxide and nickel oxide were obtained, which were applied as electrocatalysts for the reduction of oxygen in small-scale microbial fuel cell cathodes. It is concluded that the 1:2 ratio of Ni:Fe is optimal to increase the ORR, as an open-circuit output potential of 397 mV is observed, which is 30 mV higher than the GOMF sample. Additionally, the materials are facile to impregnate on graphite felts, which can ensure a good distribution over the area of this material.
Author Contributions
Conceptualization, S.E.B.-S and F.C.-B.; methodology, S.E.B.-S; formal analysis, F.C.-B, B.-V and D.-B.; investigation, S.E.B-S.; resources, F.C.-B and B.-V.; data curation, J.-G, D.-B, and S.E.B.-S; writing—original draft preparation, S.E.B.-S and F.C.-B.; writing—review and editing, F.C.-B, B.-V and S.-K.K.; supervision, F.C.-B and S.-K.K.; project administration, F.C.-B.; funding acquisition, F.C.-B. All authors have read and agreed to the published version of the manuscript.
Funding
This work was financed by CONACYT 40798 Science of Frontier Grant and the SIP project 20240907.
Institutional Review Board Statement
Not applicable.
Informed Consent Statement
Not applicable.
Data Availability Statement
The data presented in this study are available on request from the corresponding author.
Acknowledgments
S.E.B.-S. acknowledges SIP-IPN as well as the Institute Jean Lamour for the financial and material support for an academic stay in France.
Conflicts of Interest
The authors declare no conflict of interest.
Abbreviations
| MFC |
Microbial Fuel Cell |
| ORR |
Oxygen Reduction Reaction |
| GO |
Graphene Oxide |
| SEM |
Scanning Electron Microscopy |
| TEM |
Transmission Electron Microscopy |
| OCV |
Open Circuit Voltage |
| TGA |
Thermogravimetric Analysis |
| DTG |
Derivative Thermogravimetric Analysis |
| EDS |
Energy Dispersive Spectroscopy |
References
- PBunyanidhi, N. Phattharasupakun, S. Duangdangchote, S. Prempluem, N. Joraleechanchai, M. Sawangphruk, Exploring the impact of metal oxide coating and metal atom doping on the electrochemical performance of Ni-rich cathode materials, J Mater Chem A Mater 2023 11 23223–23227. [CrossRef]
- YZhang, Y. Zhang, C. Li, X. Yan, S. Hu, R. Yin, Y. Wei, K. Gao, H. Gao, Research progress of NiFe2O4 electrode materials in supercapacitors: Preparation, modification, structural regulation, and future challenges, Coord Chem Rev 2024 519, 216103. [CrossRef]
- ZFeng, P. Wang, Y. Cheng, Y. Mo, X. Luo, P. Liu, R. Guo, X. Liu, Recent progress on NiFe2O4 spinels as electrocatalysts for the oxygen evolution reaction, Journal of Electroanalytical Chemistry 2023 946, 117703. [CrossRef]
- ZFeng, P. Wang, Y. Cheng, Y. Mo, X. Luo, P. Liu, R. Guo, X. Liu, Recent progress on NiFe2O4 spinels as electrocatalysts for the oxygen evolution reaction, Journal of Electroanalytical Chemistry 2023 946, 117703. [CrossRef]
- SKang, H. Kim, Y.-H. Chung, Recent developments of nano-structured materials as the catalysts for oxygen reduction reaction, Nano Converg 2018 5, 13. [CrossRef]
- SGhasemi, R. Gheshlaghi, M.A. Mahdavi, E. Abazarian, Evaluation of low-cost carbon/metal electrodes as cathodes and anodes in sediment microbial fuel cells, Fuel 2024 373, 132349. [CrossRef]
- Y-J Choi, H.O. Mohamed, S.-G. Park, R.B. Al Mayyahi, M. Al-Dhaifallah, H. Rezk, X. Ren, H. Yu, K.-J. Chae, Electrophoretically fabricated nickel/nickel oxides as cost effective nanocatalysts for the oxygen reduction reaction in air-cathode microbial fuel cell, Int J Hydrogen Energy 2020 45, 5960–5970. [CrossRef]
- Asoufi, H. HAJJAOUI, R. ELMOUBARKI, M. ABDENNOURI, S. QOURZAL, N. BARKA, Spinel ferrites nanoparticles: Synthesis methods and application in heterogeneous Fenton oxidation of organic pollutants – A review, Applied Surface Science Advances 2021 6, 100145. [CrossRef]
- YFan, R. Li, C. Zhao, A. Hu, B. Zhou, Y. Pan, J. Chen, Z. Yan, M. Liu, M. He, J. Liu, N. Chen, J. Long, Chromium-doped inverse spinel electrocatalysts with optimal orbital occupancy for facilitating reaction kinetics of lithium-oxygen batteries, J Colloid Interface Sci 2023 645, 439–447. [CrossRef]
- GJanani, Y. Chae, S. Surendran, Y. Sim, W. Park, J.K. Kim, U. Sim, Rational Design of Spinel Oxide Nanocomposites with Tailored Electrochemical Oxygen Evolution and Reduction Reactions for ZincAir Batteries, Applied Sciences 2020 10, 3165. [CrossRef]
- HM Sabaa, K.M. El-Khatib, M.Y. El-Kady, S.A. Mahmoud, Spinel structure of activated carbon supported MFe2O4 composites as an economic and efficient electrocatalyst for oxygen reduction reaction in neutral media, Journal of Solid State Electrochemistry 2022 26, 2749–2763. [CrossRef]
- M. Buaki-Sogó, L. M. Buaki-Sogó, L. Zubizarreta, M. García-Pellicer, A. Quijano-López, Sustainable Carbon as Efficient Support for Metal-Based Nanocatalyst: Applications in Energy Harvesting and Storage, Molecules 2020 25, 3123. [CrossRef]
- HWang, Q. Hu, J. Qiu, R. Guo, X. Liu, Research progress of spinel CoFe2O4 as an electrocatalyst for the oxygen evolution reaction, Catal Sci Technol 2023 13, 6102–6125. [CrossRef]
- REppstein, M. Caspary Toroker, On the Interplay Between Oxygen Vacancies and Small Polarons in Manganese Iron Spinel Oxides, ACS Materials Au 2022 2, 269–277. [CrossRef]
- WMa, F. Wu, P. Yu, L. Mao, Carbon support tuned electrocatalytic activity of a single-site metal–organic framework toward the oxygen reduction reaction, Chem Sci 2021 12, 7908–7917. [CrossRef]
- KGothandapani, R.S. Jeniffer, G. Tamil Selvi, V. Velmurugan, A.K. Assaifan, K.E. Alzahrani, H. Albrithen, M. Muthuramamoorthy, S. Pandiaraj, S. Pitchaimuthu, A.N. Alodhayb, A.N. Grace, Nickel nanoparticles supported on carbon surface as an electrocatalyst for hydrogen evolution reaction, Int J Hydrogen Energy 2024 52, 1137–1146. [CrossRef]
- EAbaft, H. Ghafouri Taleghani, M. Soleimani Lashkenari, 3D graphene oxide/nickel ferrite aerogel for high-performance supercapacitor application, J Energy Storage 2024 98, 112797. [CrossRef]
- AQavami, S. Ghasemi, Nickel-cobalt manganate supported on reduced graphene oxide/carbon nanotube for improving air cathode performance in single chamber microbial fuel cell, Materials Science and Engineering: B 2022 275, 115492. [CrossRef]
- N. Baig, Two-dimensional nanomaterials: A critical review of recent progress, properties, applications, and future directions, Compos Part A Appl Sci Manuf 2023 165, 107362. [CrossRef]
- SYadav, A. Devi, Recent advancements of metal oxides/Nitrogen-doped graphene nanocomposites for supercapacitor electrode materials, J Energy Storage 2020 30, 101486. [CrossRef]
- AA Olorunkosebi, M.A. Eleruja, A.V. Adedeji, B. Olofinjana, O. Fasakin, E. Omotoso, K.O. Oyedotun, E.O.B. Ajayi, N. Manyala, Optimization of graphene oxide through various Hummers’ methods and comparative reduction using green approach, Diam Relat Mater 2021 117, 108456. [CrossRef]
- MB Burkholder, F.B.A. Rahman, E.H. Chandler, J.R. Regalbuto, B.F. Gupton, J.M.M. Tengco, Metal supported graphene catalysis: A review on the benefits of nanoparticular supported specialty sp2 carbon catalysts on enhancing the activities of multiple chemical transformations, Carbon Trends 2022 9, 100196. [CrossRef]
- SQamar, N. Ramzan, W. Aleem, Graphene dispersion, functionalization techniques and applications: A review, Synth Met 2024 307, 117697. [CrossRef]
- JGuerrero-Contreras, F. Caballero-Briones, Graphene oxide powders with different oxidation degree, prepared by synthesis variations of the Hummers method, Mater Chem Phys 2015 153, 209–220. [CrossRef]
- YYao, S. Miao, S. Liu, L.P. Ma, H. Sun, S. Wang, Synthesis, characterization, and adsorption properties of magnetic Fe3O4@graphene nanocomposite, Chemical Engineering Journal 2012 184, 326–332. [CrossRef]
- SKazi, S. Inamdar, Y. sarnikar, D. Kamble, R. Tigote, Simple Co-precipitation synthesis and characterization of magnetic spinel NiFe2O4 nanoparticles, Mater Today Proc 2023 73, 448–454. [CrossRef]
- LLi, Q. Liao, C. Liu, T. Zhang, C. Liu, Z. Chen, R. Gao, Q. He, Enhanced biological wastewater treatment supplemented with anaerobic fermentation liquid of primary sludge, J Environ Manage 2023 347, 119086. [CrossRef]
- HLiang, J. Han, X. Yang, Z. Qiao, T. Yin, Performance improvement of microbial fuel cells through assembling anodes modified with nanoscale materials, Nanomaterials and Nanotechnology 2022 12, 184798042211329. [CrossRef]
- MShirkosh, Y. Hojjat, M.M. Mardanpour, Boosting microfluidic microbial fuel cells performance via investigating electron transfer mechanisms, metal-based electrodes, and magnetic field effect, Sci Rep 2022 12, 7417. [CrossRef]
- RIkram, B.M. Jan, W. Ahmad, An overview of industrial scalable production of graphene oxide and analytical approaches for synthesis and characterization, Journal of Materials Research and Technology 2020 9, 11587–11610. [CrossRef]
- SA Hassanzadeh-Tabrizi, Precise calculation of crystallite size of nanomaterials: A review, J Alloys Compd 2023 968, 171914. [CrossRef]
- GH La, S.H. Lee, D.J. Min, Fundamental study on preferential reduction of Ni in NiFe2O4, Miner Eng 2021 164, 106829. [CrossRef]
- FFarivar, P. Lay Yap, R.U. Karunagaran, D. Losic, Thermogravimetric Analysis (TGA) of Graphene Materials: Effect of Particle Size of Graphene, Graphene Oxide and Graphite on Thermal Parameters, C (Basel) 2021 7, 41. [CrossRef]
- SA Khanam, S. Saikia, S. Lee, Y.-B. Park, M.E.A. Zaki, K.K. Bania, Interfacial Effect-Induced Electrocatalytic Activity of Spinel Cobalt Oxide in Methanol Oxidation Reaction, ACS Omega 2023 8, 44964–44976. [CrossRef]
- DBelotcerkovtceva, R.P. Maciel, E. Berggren, R. Maddu, T. Sarkar, Y.O. Kvashnin, D. Thonig, A. Lindblad, O. Eriksson, M.V. Kamalakar, Insights and Implications of Intricate Surface Charge Transfer and sp3-Defects in Graphene/Metal Oxide Interfaces, ACS Appl Mater Interfaces 2022 14, 36209–36216. [CrossRef]
- PSivagurunathan, S.R. Gibin, Preparation and characterization of nickel ferrite nano particles by co-precipitation method with citrate as chelating agent, Journal of Materials Science: Materials in Electronics 2016 27, 2601–2607. [CrossRef]
- MO da Guarda Souza MVR dos Santos, L.M.F. Castro, C.P. da Silva, Production and in situ transformation of hematite into magnetite from the thermal decomposition of iron nitrate or goethite mixed with biomass, J Therm Anal Calorim 2020 139, 1731–1739. [CrossRef]
- AFarzan, S. Borandeh, J. Seppälä, Conductive polyurethane/PEGylated graphene oxide composite for 3D-printed nerve guidance conduits, Eur Polym J 2022 167, 111068. [CrossRef]
- VBrusko, A. Khannanov, A. Rakhmatullin, A.M. Dimiev, Unraveling the infrared spectrum of graphene oxide, Carbon N Y 2024 229, 119507. [CrossRef]
- DA Flores-Cano, N.-R. Checca-Huaman, I.-L. Castro-Merino, C.N. Pinotti, E.C. Passamani, F.J. Litterst, J.A. Ramos-Guivar, Progress toward Room-Temperature Synthesis and Functionalization of Iron-Oxide Nanoparticles, Int J Mol Sci 2022 23, 8279. [CrossRef]
- AAlshahrani, M.S. Bin-Shuwaish, R.S. Al-Hamdan, T. Almohareb, A.M. Maawadh, M. Al Deeb, A.M. Alhenaki, T. Abduljabbar, F. Vohra, Graphene oxide nano-filler based experimental dentine adhesive. A SEM / EDX, Micro-Raman and microtensile bond strength analysis, J Appl Biomater Funct Mater 2020 18, 228080002096693. [CrossRef]
- KA Khalil, N.A.M. Barakat, M. Motlak, F.S. Al-Mubaddel, A novel graphene oxide-based ceramic composite as an efficient electrode for capacitive deionization, Sci Rep 2020 10, 9676. [CrossRef]
- SKumar, F. Ahmed, N.M. Shaalan, N. Arshi, S. Dalela, K.H. Chae, Investigations of Structural, Magnetic, and Electrochemical Properties of NiFe2O4 Nanoparticles as Electrode Materials for Supercapacitor Applications, Materials 2023 16, 4328. [CrossRef]
- SMore, S. Raut, S. Premkumar, S. Bhopale, S. Bhoraskar, M. More, V. Mathe, Structural and morphological tuning of iron oxide polymorphs by ECR plasma-assisted thermal oxidation, RSC Adv 2020 10, 32088–32101. [CrossRef]
- YYan, H. Cheng, Z. Qu, R. Yu, F. Liu, Q. Ma, S. Zhao, H. Hu, Y. Cheng, C. Yang, Z. Li, X. Wang, S. Hao, Y. Chen, M. Liu, Recent progress on the synthesis and oxygen reduction applications of Fe-based single-atom and double-atom catalysts, J Mater Chem A Mater 2021 9, 19489–19507. [CrossRef]
- WWan, Y. Zhao, S. Wei, C.A. Triana, J. Li, A. Arcifa, C.S. Allen, R. Cao, G.R. Patzke, Mechanistic insight into the active centers of single/dual-atom Ni/Fe-based oxygen electrocatalysts, Nat Commun 2021 12, 5589. [CrossRef]
- MBlatter, L. Delabays, C. Furrer, G. Huguenin, C.P. Cachelin, F. Fischer, Stretched 1000-L microbial fuel cell, J Power Sources 2021 483, 229130. [CrossRef]
- SQiu, L. Wang, Y. Zhang, Y. Yu, Microbial Fuel Cell-Based Biosensor for Simultaneous Test of Sodium Acetate and Glucose in a Mixed Solution, Int J Environ Res Public Health 2022 19, 12297. [CrossRef]
- MA Kazakova, D.M. Morales, C. Andronescu, K. Elumeeva, A.G. Selyutin, A. V. Ishchenko, G. V. Golubtsov, S. Dieckhöfer, W. Schuhmann, J. Masa, Fe/Co/Ni mixed oxide nanoparticles supported on oxidized multi-walled carbon nanotubes as electrocatalysts for the oxygen reduction and the oxygen evolution reactions in alkaline media, Catal Today 2020 357, 259–268. [CrossRef]
- SDeng, V. Berry, Wrinkled, rippled and crumpled graphene: an overview of formation mechanism, electronic properties, and applications, Materials Today 2016 19, 197–212. [CrossRef]
- TC Kueh, S.H. Chew, A.K. Soh, Y.M. Hung, Investigation of the influence of the location of oxygenated functional groups in graphene nanostructures on water permeation via molecular dynamics simulations, Appl Surf Sci 2023 609, 155414. [CrossRef]
- WYu, L. Sisi, Y. Haiyan, L. Jie, Progress in the functional modification of graphene/graphene oxide: a review, RSC Adv 2020 10, 15328–15345. [CrossRef]
|
Disclaimer/Publisher’s Note: The statements, opinions and data contained in all publications are solely those of the individual author(s) and contributor(s) and not of MDPI and/or the editor(s). MDPI and/or the editor(s) disclaim responsibility for any injury to people or property resulting from any ideas, methods, instructions or products referred to in the content. |
© 2025 by the authors. Licensee MDPI, Basel, Switzerland. This article is an open access article distributed under the terms and conditions of the Creative Commons Attribution (CC BY) license (http://creativecommons.org/licenses/by/4.0/).