Submitted:
04 March 2025
Posted:
04 March 2025
You are already at the latest version
Abstract
Detailed characterization of evapotranspiration (ET) patterns is crucial for optimizing irrigation scheduling and enhancing water use efficiency in the North China Plain. A two-season study conducted at the National Experimental Station for Precise Agriculture in Beijing compared summer maize varieties with contrasting canopy sizes (JK: large canopy; CF: small canopy) using 12 weighing lysimeters. The results revealed: (1)seasonal ET patterns: daily average ET rates showed consistent variation between cultivars, with JK exhibiting higher water consumption, the highest daily ET of JK and CF reach 5.91 mm/day and 5.52 mm/day at V13-R1 stage in the first growth season and reach 5.21 mm/day and 5.22 mm/day at R1-R3 stage in the second growth season, respectively. (2)Diurnal dynamics: hourly ET fluctuations displayed similar temporal patterns across growth stages, regardless of canopy size. The most pronounced inter-varietal ET differences occurred during the R1-R3 reproductive stages when both cultivars maintained peak canopy development (Leaf area index(LAI) > 4.5). Notably, ET differences between JK and CF followed characteristic diurnal "increase-decrease" pattern, peaking in mid-morning (09:00-11:00) and early afternoon (13:00-15:00), with minimal divergence at solar noon. (3)Transpiration differentiation: pooled data analysis identified two critical periods driving cumulative ET differences: 12:00-17:00 during R1-R3 (anthesis) and 08:00-16:00 during R3-R5 (grain filling). JK maintained significantly higher transpiration rates (Tr), particularly during morning hours (09:00-12:00), with mean Tr exceeding CF by 5.3% (pre-anthesis) and 16.0% (post-anthesis).The observed Tr differentials suggest that canopy architecture modulates stomatal regulation patterns, with large-canopy genotypes demonstrating greater morning photosynthetic activity but similar midday water conservation strategies. Our findings reveal the relationship between the leaf area index and evapotranspiration of summer maize across multiple timescales, including periodic, daily, and hourly variations. This study provides valuable data to support precise and quantitative irrigation strategies for maize production in the region.
Keywords:
daily evapotranspiration
; hourly evapotranspiration
; transpiration
; canopy
; summer maize
1. Introduction
Maize production in North China Plain (NCP) is critical for national food security because it occupied 32.92% of corn yield in China (Shan et al., 2011). However, further development of maize production in NCP needed to consider a further deterioration of regional water resources carrying capacity (Mei et al., 2012), which resulted from: (1)an increase of evaporative demand, (2)a reduction in the water availability resulted from the decreased precipitation during summer and (3)the increased runoff loss from short-duration extreme precipitation events (Liu et al., 2005, Ding et al., 2010, Sun et al., 2010, Ren et al., 2015, Huang et al., 2015).
Determination of ET can provide data support for making decisions regarding global water budget and local irrigation management (Fraiture and Wichelns, 2010; Ding et al., 2012). Total ET is essential for terrestrial hydrological cycle research because irrigation accounts for approximately 70% of the world's total freshwater withdrawals (Wada et al., 2016). Similar ET determinations of summer maize in NCP were reported by Liu et al. (2002)and by Kang et al. (2003), which was 423 mm and 424 mm respectively. Further determination of daily ET at various spatial scales by measuring equipment upgrade helps agricultural producers making more precise irrigation scheme and then can better match moisture to the daily water demand of crops (Cammalleri et al., 2012, Ma et al., 2018). Better understanding about ET process is of great concern for the improvement of agricultural water utilization and is critical for the sustainability of agricultural production (Tognetti et al., 2009; Ranatunga et al., 2012). Now, with the development of precise irrigation technology, the knowledge of crop ET at a smaller time scale is an urgent task for regional maize production in NCP., however, deep knowledge of ET, for example, consecutive determination of daily and hourly ET of maize is still limited in this region.
Many studies focused on the effects of climate change and its variability on ET (Harmsen et al., 2009; Liang et al., 2010; Baguis et al., 2010, Zhang et al., 2011) and tried to find out more precise and concise methods or alternative choices to estimate ET (Galleguillos, et al., 2017,Valipour, 2017). Similarly, ET can also be influenced by cultivation management (Allen et al., 1998). Among many agronomic measures, soil management practices can affect ET by increasing the soil water holding capacity and precipitation infiltration, improving the capacity of root to extract water from the soil profile, decreasing the leach losses (Hatfield et al., 2001), these practices were associated with some types of manipulation of the soil by tillage and residue management and mulching. ET estimation showed no significant difference between reduced tillage and conventional tillage (Tan et al., 2002), zero tillage and reservoir tillage resulted in higher water potential than conventional tillage (Salem et al., 2015), but the better method to store water in the soil profile is the straw or plastic mulch, which was widely used in northwest China.
Another agronomic measure widely applied in northwest China is plastic mulch, which had greater influence on water consumption than tillage (Tao et al., 2015). Mulch can prevent vast majority of soil evaporation, meanwhile the optimized rhizosphere water environment lead to a greater transpiration through crop canopy better developed, however, the stored heat accelerated crop growth and caused a shorter growth period which decreased the transpiration. Making a comprehensive survey, mulch has had changed the ratio of evaporation and transpiration (Li et al., 2012), as well as the distribution of evapotranspiration before and after anthesis (Zhang et al., 2014), and showed positive or no obvious effect on ET (Xu et al., 2015).
Fertilizer application is also strong related with ET, no matter compost or chemical fertilizer, can significantly increase cumulative water use and daily transpiration (Adamtey et al., 2010), but other researches provided evidence that the effect was not obvious from the viewpoint of water balance and mean recharge rate (Stumpp et al., 2013). Nitrogen fertilizer has a strong relationship with canopy establishment and functions (Lv et al., 2008, Kitonyo et al., 2018), evaporation declined while transpiration increased by N addition (Li et al., 2015) and as a result, affect ET (Rudnick and Irmak, 2014). A significant water by N interaction for ETa and soil profile water extraction pattern was observed for maize and wheat by Lenka et al. (2009).
Actual ET mainly depends on irrigation amount in maize production, it increased with irrigation up to a point where irrigation became excessive (Payero et al., 2008), and decreased significantly when encountered soil water deficit (Zhang et al., 2004). Actual ET was impacted by irrigation amount rather than irrigation frequency (Irmak et al., 2016), Payero et al. (2009)further indicated that irrigation timing can also have a considerable effect on actual ET and on what proportion of actual ET without water stress can be met with a given water allocation.
Canopy size is an important factor affecting ET besides the meteorological factors, the cultivation measures reported before, for it was not only a scene where transpiration (T)occurred, but also it blocked the evaporation from soil, so the characteristics of canopy was an important converter for those factors affecting ET. Xu et al. (2018) investigated the effect of canopy size on ET and crop coefficient of summer maize, however, ET at microscopic time scale needs to be investigated for better water management and water productivity in semi arid regions. Our objective of this study is to compare the characteristics of daily ET, hourly ET and transient transpiration rate of summer maize with diverse canopy size. Detailed analysis of evapotranspiration will give support to maize production through a precise irrigation plan in NCP where the water deficit is a rising limitation.
Water shortage in this region limits the further development of maize production in this region, therefore threatens national food security and environmental sustainability. The objectives of this study include: (1)determination of maize ET at daily and hour scale, (2) comparison of maize ET at daily and hour scale between two maize canopy size, evaluation the difference of ET under different canopy size.
2. Materials and methods
2.1. Experimental site
The experiment was conducted at the National Experiment Station for Precise Agriculture, a comprehensive station of Beijing Academy of Agricultural and Forestry Sciences (40.17’ degrees North, 116.39’ degrees East, 50m altitude), located in northwest of Beijing, China. Atmospheric environmental parameters including air temperature, relative humidity and solar radiation were similar between two growth seasons, higher precipitation, longer sun duration and faster wind speed in the first growth season than in the second season is probably related to the more occurrence of extreme weather events in 2023, for example, the extreme precipitation event during 30th July to 1st August in 2023.

Table 1.
Environmental parameter averaged for the growing season.
| Environmental parameter | 2022 | 2023 |
| Air temperature ℃ | 23.9 | 23.8 |
| Relative humidity % | 70.6 | 69.6 |
| Solar radiation W/m2 | 181.3 | 187.5 |
| Precipitation mm/day | 3.1 | 4.1 |
| Sun duration hour | 5.0 | 6.4 |
| Wind speed m/s | 0.6 | 0.9 |
2.2. Growth process
Maize (Zea mays L.) was cultivated from 15th June to 7th October in 2022, and from 15th June to 1st October in 2023. Two maize varieties were applied: Jingke 968 (JK) and CF 1002 (CF). Plant density was controlled to 6 plants m-2 with a row spacing in 50 cm for all treatments. 6 lysimeters were applied for each treatment as duplicates. 40 mm water was irrigated through a rubber tube in order to avoid the adverse effects of previous winter wheat, the amount of mineral fertilizer included urea and phosphoric anhydride and potassium sulfate applied in each lysimeter was 180g, 180g and 180g, respectively, all the phosphoric anhydride and potassium sulfate as well as half urea was applied with seeding simultaneously, the remaining portion was served as supplementary fertilizer when the maize grown to 13 leaves. Also, to maintain a similar environment, the crop in same plant type and density was grown in the lands surrounding the lysimeters. The identical cultivation practices such as tillage depth, application time and dosage of fertilizer, sowing and harvest date and weed management was applied to both inside and outside lysimeter.
Phenological process of summer maize was recorded according to Corn growth and development (Chad Lee, University of Kentucky, 2005-2011). Diurnal time lasts 12 hours, defined as as 6 to 17 p.m, nocturnal time begin from 18 p.m and lasts until 5 p.m the next day.
2.3. Experimental procedures
The employed lysimeter is a suspended weighed type, it has a steel box with the size of 1m×0.75m×2.3m, isometric original soil was transported from near field in order to retain field soil property. Considering the possible micro environmental perturbation and the water exchange between lysimeter interior and surrounding field, the soil surface inside the lysimeter was kept flush with the surrounding field surface yet the border is slightly higher than the ground level. Evapotranspiration of maize for each season was measured by lysimeters in an interval of 5 minutes with a high precision of 0.05-0.1mm. The calibration of lysimeters was conducted after the crop was harvested so the precision can be ensured. Leaf length and width was measured using a ruler at each growth stage including V3, V9, V13, R1, R3, R5 and maturity stage. Leaf area was calculated by multiplying this length and width with a coefficient of 0.70 for maize. Each time one fixed plants for maize were selected to conduct the measuring in each lysimeter. Leaf area index was then calculated by this value and the density. Instantaneous transpiration rate of ear leaf was measured by a portable gas exchange system (Li-Cor 6400, Li-Cor Inc. U.S.) at 9 hours including 8:00, 9:00, 10:00, 11:00, 12:00, 13:00, 14:00, 15:00, 16:00, on 15th July and on 23rd August in the first growing season.
Atmospheric environmental parameters: air temperature, air humidity, air pressure, wind speed at 2m above ground, solar radiation, sunshine duration, precipitation were recorded in a standard weather station located at the experimental site next to the lysimeter. The field is flat and the data from the weather station therefore represent that of the lysimeter site.
Data was filtered based on the degree of dispersion before it was tested in ANOVA, 3 and 4 lysimeters with smaller variability were selected out of each 6 lysimeters to represent different maize varieties as duplicates in each growth season, respectively. Comparisons between groups were tested by One-Way ANOVA analysis and LSD test using SPSS 22.0 software package.
3. Results
3.1. The development process of LAI during total growth stage
Figure 1.
Leaf area index (LAI) of two summer maize varieties during two growth seasons.
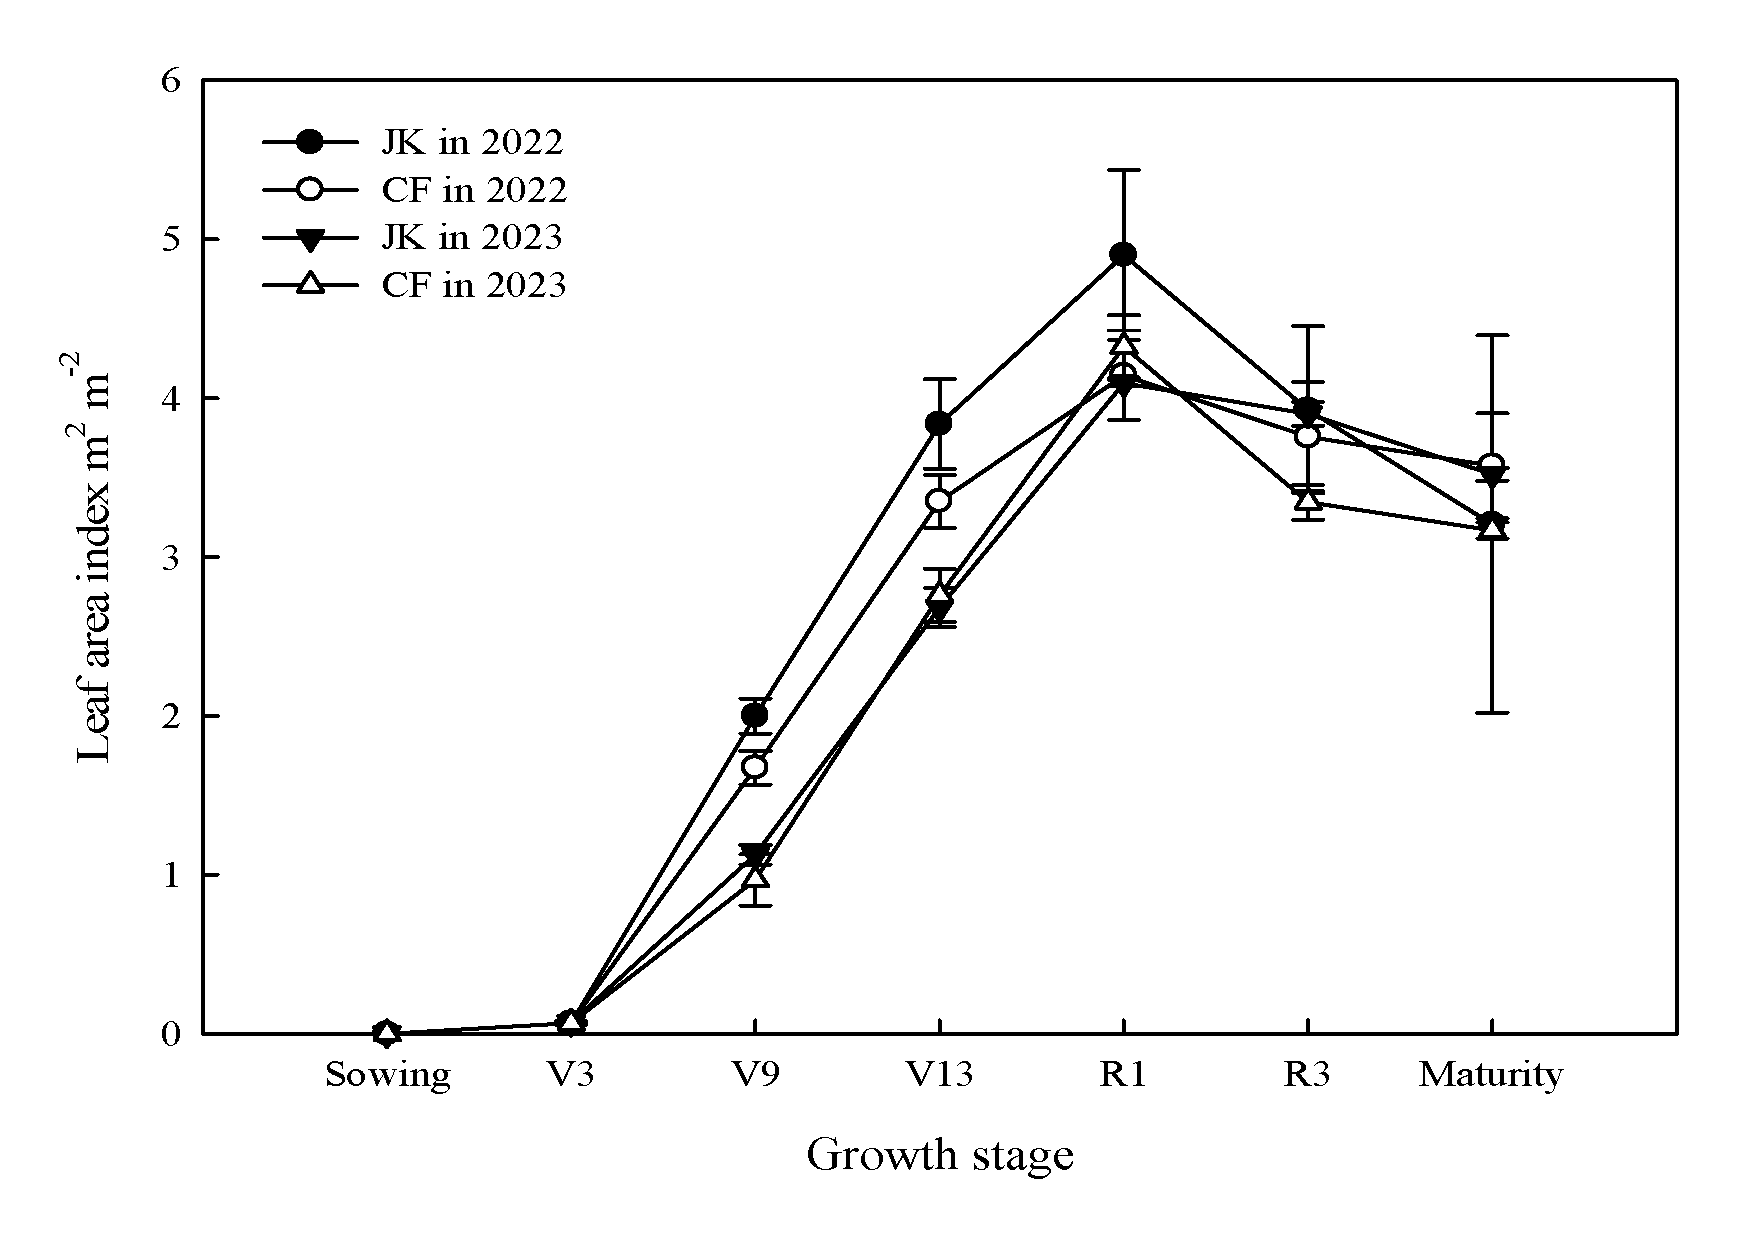
According to Fig 1., leaf area index (LAI) of JK and CF increased from emergence, reach its peak at R1 stage, and then began to decrease till the maturity stage in both two growth seasons. Analysis of pooled date showed that LAI of JK was significantly higher than that of CF by 18.1%, 5.0% and 10.4% at V9, V13 and R3 stage, respectively.
The diversion of LAI between JK and CF in each season resulted from: (1)the different increase rate of LAI during the vegetative period, for instance, LAI of JK was higher (p<0.05) than that of CF by 19.5% (p<0.05) and 16.5% (p<0.05) at V9 stage in two growth seasons, and was higher than that of CF at V13 stage by 14.5% (p<0.05) in the first growth season. (2)Both peak LAI of JK and CF occurred at R1 stage, however, LAI of JK was higher than that of CF by 18.3% (p<0.05) in the first growth season and was lower than that of CF by 5.3% (p<0.05) in the second growth season. (3) The different decrease rate of LAI during the reproductive period, for instance, LAI of JK was lower (p<0.05) than that of CF at R3 stage by 16.6% (p<0.05) and at Maturity stage by 11.2% (p<0.05) in the second growth season.
Inter-annual variation of LAI during the vegetative period was similar for JK and CF, LAI at V9 stage was 77.4% (p<0.05) and 73.1% (p<0.05) higher in the first season than in the second season for JK and CF, and LAI at V13 stage in the first season was 43.1% (p<0.05) and 21.5% (p<0.05) higher than in the second season for JK and CF, respectively. However, inter-annual variation of LAI at reproductive period was diverse for JK and CF, LAI at R1 in the first season increased by 19.7% (p<0.05) when compared with that in the second season and showed no significant difference at R3 stage and Maturity for JK, LAI at R3 stage and Maturity stage was 12.3% (p<0.05) and 12.8% (p<0.05) higher in the first season than in the second season for CF and showed no significant difference at R1 stage for CF, respectively.
3.2. Daily evapotranspiration at different growth stages in two seasons
Figure 2.
Averaged daily ET of summer maize in two growth seasons.
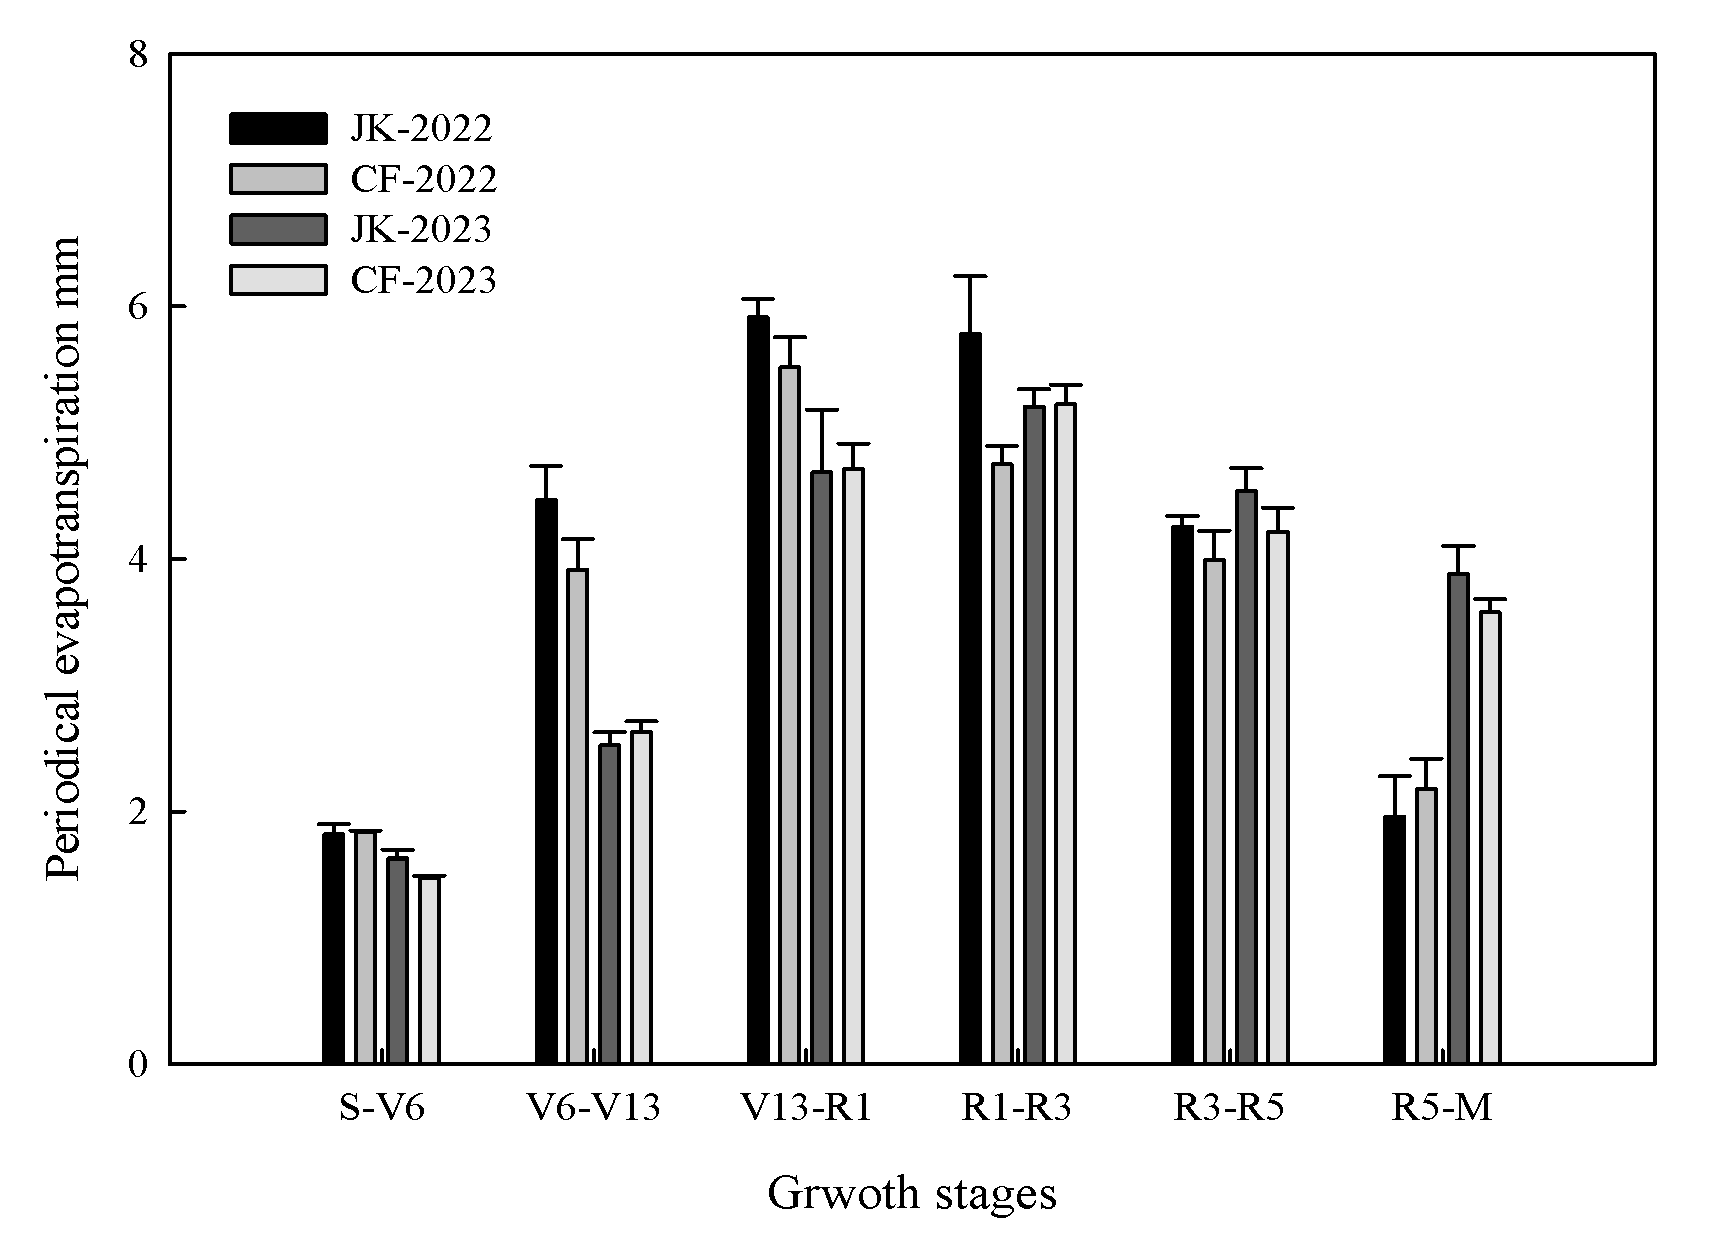
Daily ET averaged for different growth periods and for total growth season was showed in Fig 2.
Temporal distribution of average daily ET was different for JK and CF in the first season, JK: V13-R1>R1-R3>V6-V13>R3-R5>R5-M>S-V6, CF: V13-R1>R1-R3>R3-R5≈V6-V13>R5-M>S-V6, and was same in the second season: R1-R3>V13-R1>R3-R5>R5-M>V6-V13>S-V6, respectively. The highest daily ET of JK and CF reach 5.91 mm/day and 5.52 mm/day at V13-R1 stage in the first growth season and reach 5.21 mm/day and 5.22 mm/day at R1-R3 stage in the second growth season, respectively. It demonstrated that the peak water consumption occurred around R1 stage when canopy size reach its peak according to Fig 1.
Further on, daily ET at different growth periods was higher for JK when compared with that of CF in the first season, especially at the R1-R3 period, which was 1.03 mm/day (p<0.05), and the descend range of averaged daily ET from V13-R1 to R1-R3 for JK was also significantly lower than that of CF in the first growth season. Daily ET of JK was 0.15 mm/day higher than that of CF at the S-V6 period (p<0.05) and was close to that of CF at other growth periods in the second growth season, the increment of averaged daily ET from Sowing-V6 to V6-V13 was 0.90 mm/day for JK, which was significantly lower than 1.16 mm/day for CF in the second growth season. It can be inferred that the difference of daily ET occurred around R1 stage may had larger influence on the difference of daily ET averaged for the total growth stage when compared with the corresponding difference occurred at other growth period.
In comparison to daily ET at corresponding stages in the second growth season, daily ET for each maize variety significantly increased at three growth stages: S-V6, V6-V13, V13-R1, decreased at last two growth stages: R3-R5 stage (p>0.05) and significantly decreased at R5-Maturity stage during the first growth season. It is worth noting for the adverse annual variation of daily ET at R1-R3 stage that daily ET of JK increased (p>0.05) when that of CF significantly decreased at R1-R3 stage in the first growth season when compared with corresponding daily ET in the second season respectively.
3.3. Hourly evapotranspiration averaged for total growth stage
Figure 3.
Hourly ET averaged for total growth season of summer maize in different seasons.
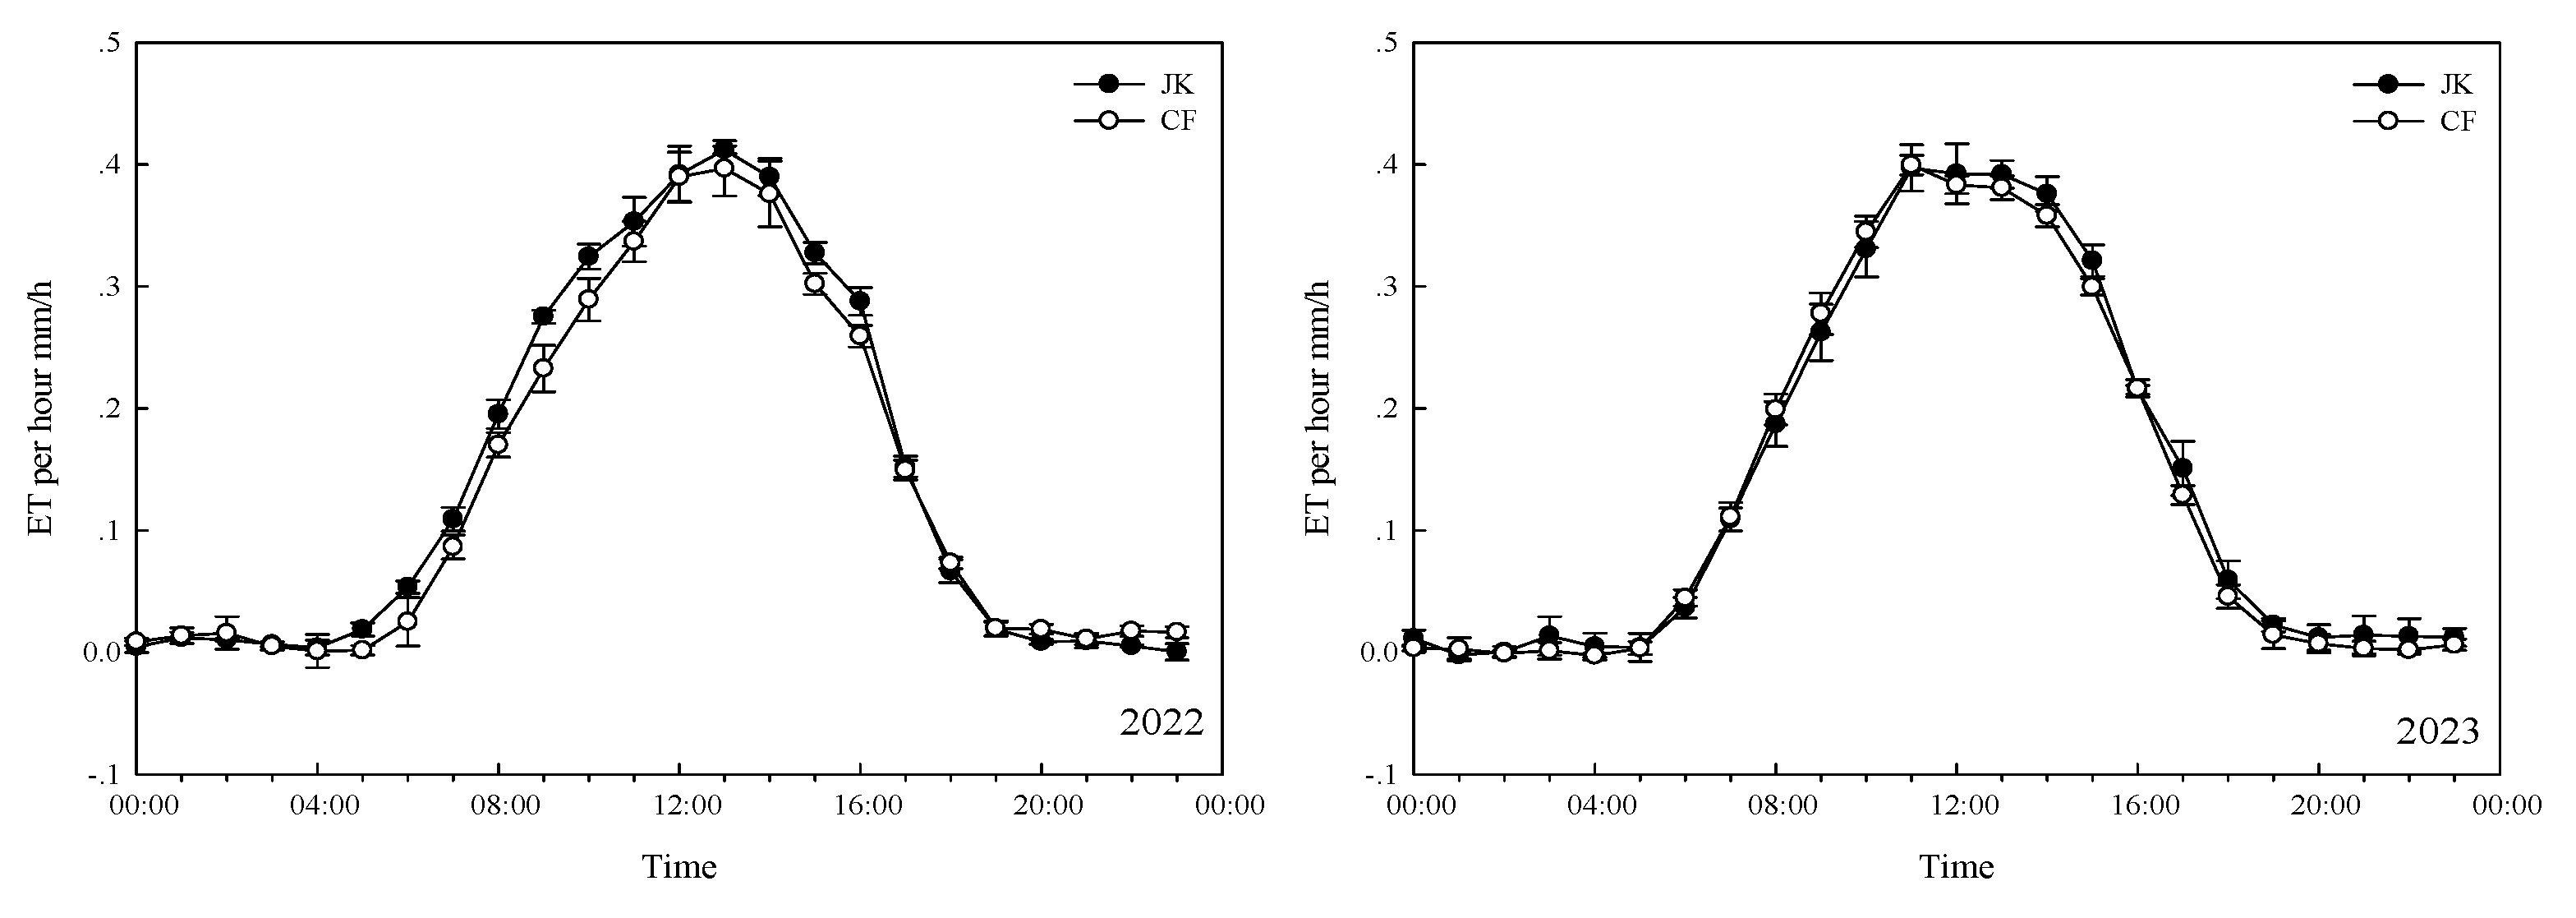
Hourly ET averaged for total growth stage was showed in Fig 3. Variation of hourly ET was similar for JK and CF in each season. In the first season, hourly ET of JK was significantly higher than that of CF at 5:00, 7:00, 8:00, 9:00, 10:00, 15:00, 16:00, and was significantly lower than that of CF at 20:00, 22:00, 23:00 in the first season, respectively. In the second season, ET difference was not significant between JK and CF at each individual hour. Hourly ET difference reach its first extreme value that was -0.0153 mm/hour and 0.0426 mm/hour at 9:00 and reach its second extreme value that was 0.0214 mm/hour and 0.0252 mm/hour at 15:00. It is noteworthy that the difference of individual hourly ET was not significant at noon from 11:00 to 14:00, although this time frame was considered as the peak of daily ET.
According to our observation, more than 50% of diurnal ET occurred at afternoon (12:00-17:00) in both two seasons. However, the accumulated difference of hourly ET between JK and CF was significant at afternoon (12:00-17:00) in the second season and was significant at morning (6:00-11:00) in the first season, respectively. Further investigation revealed that majority of daily ET accumulated at the daytime in both two seasons, however, hourly ET difference accumulated during daytime were 0.31 mm (p<0.05) between JK and CF in the first season, and were 0.05 mm (p>0.05) between JK and CF in the second season, respectively. On the other hand, the accumulation of hourly ET occurred during nocturnal time were 0.08 mm and -0.04 mm between JK and CF in the corresponding seasons respectively.
Figure 4.
Hourly ET averaged for total growth season of summer maize in the first growth season.
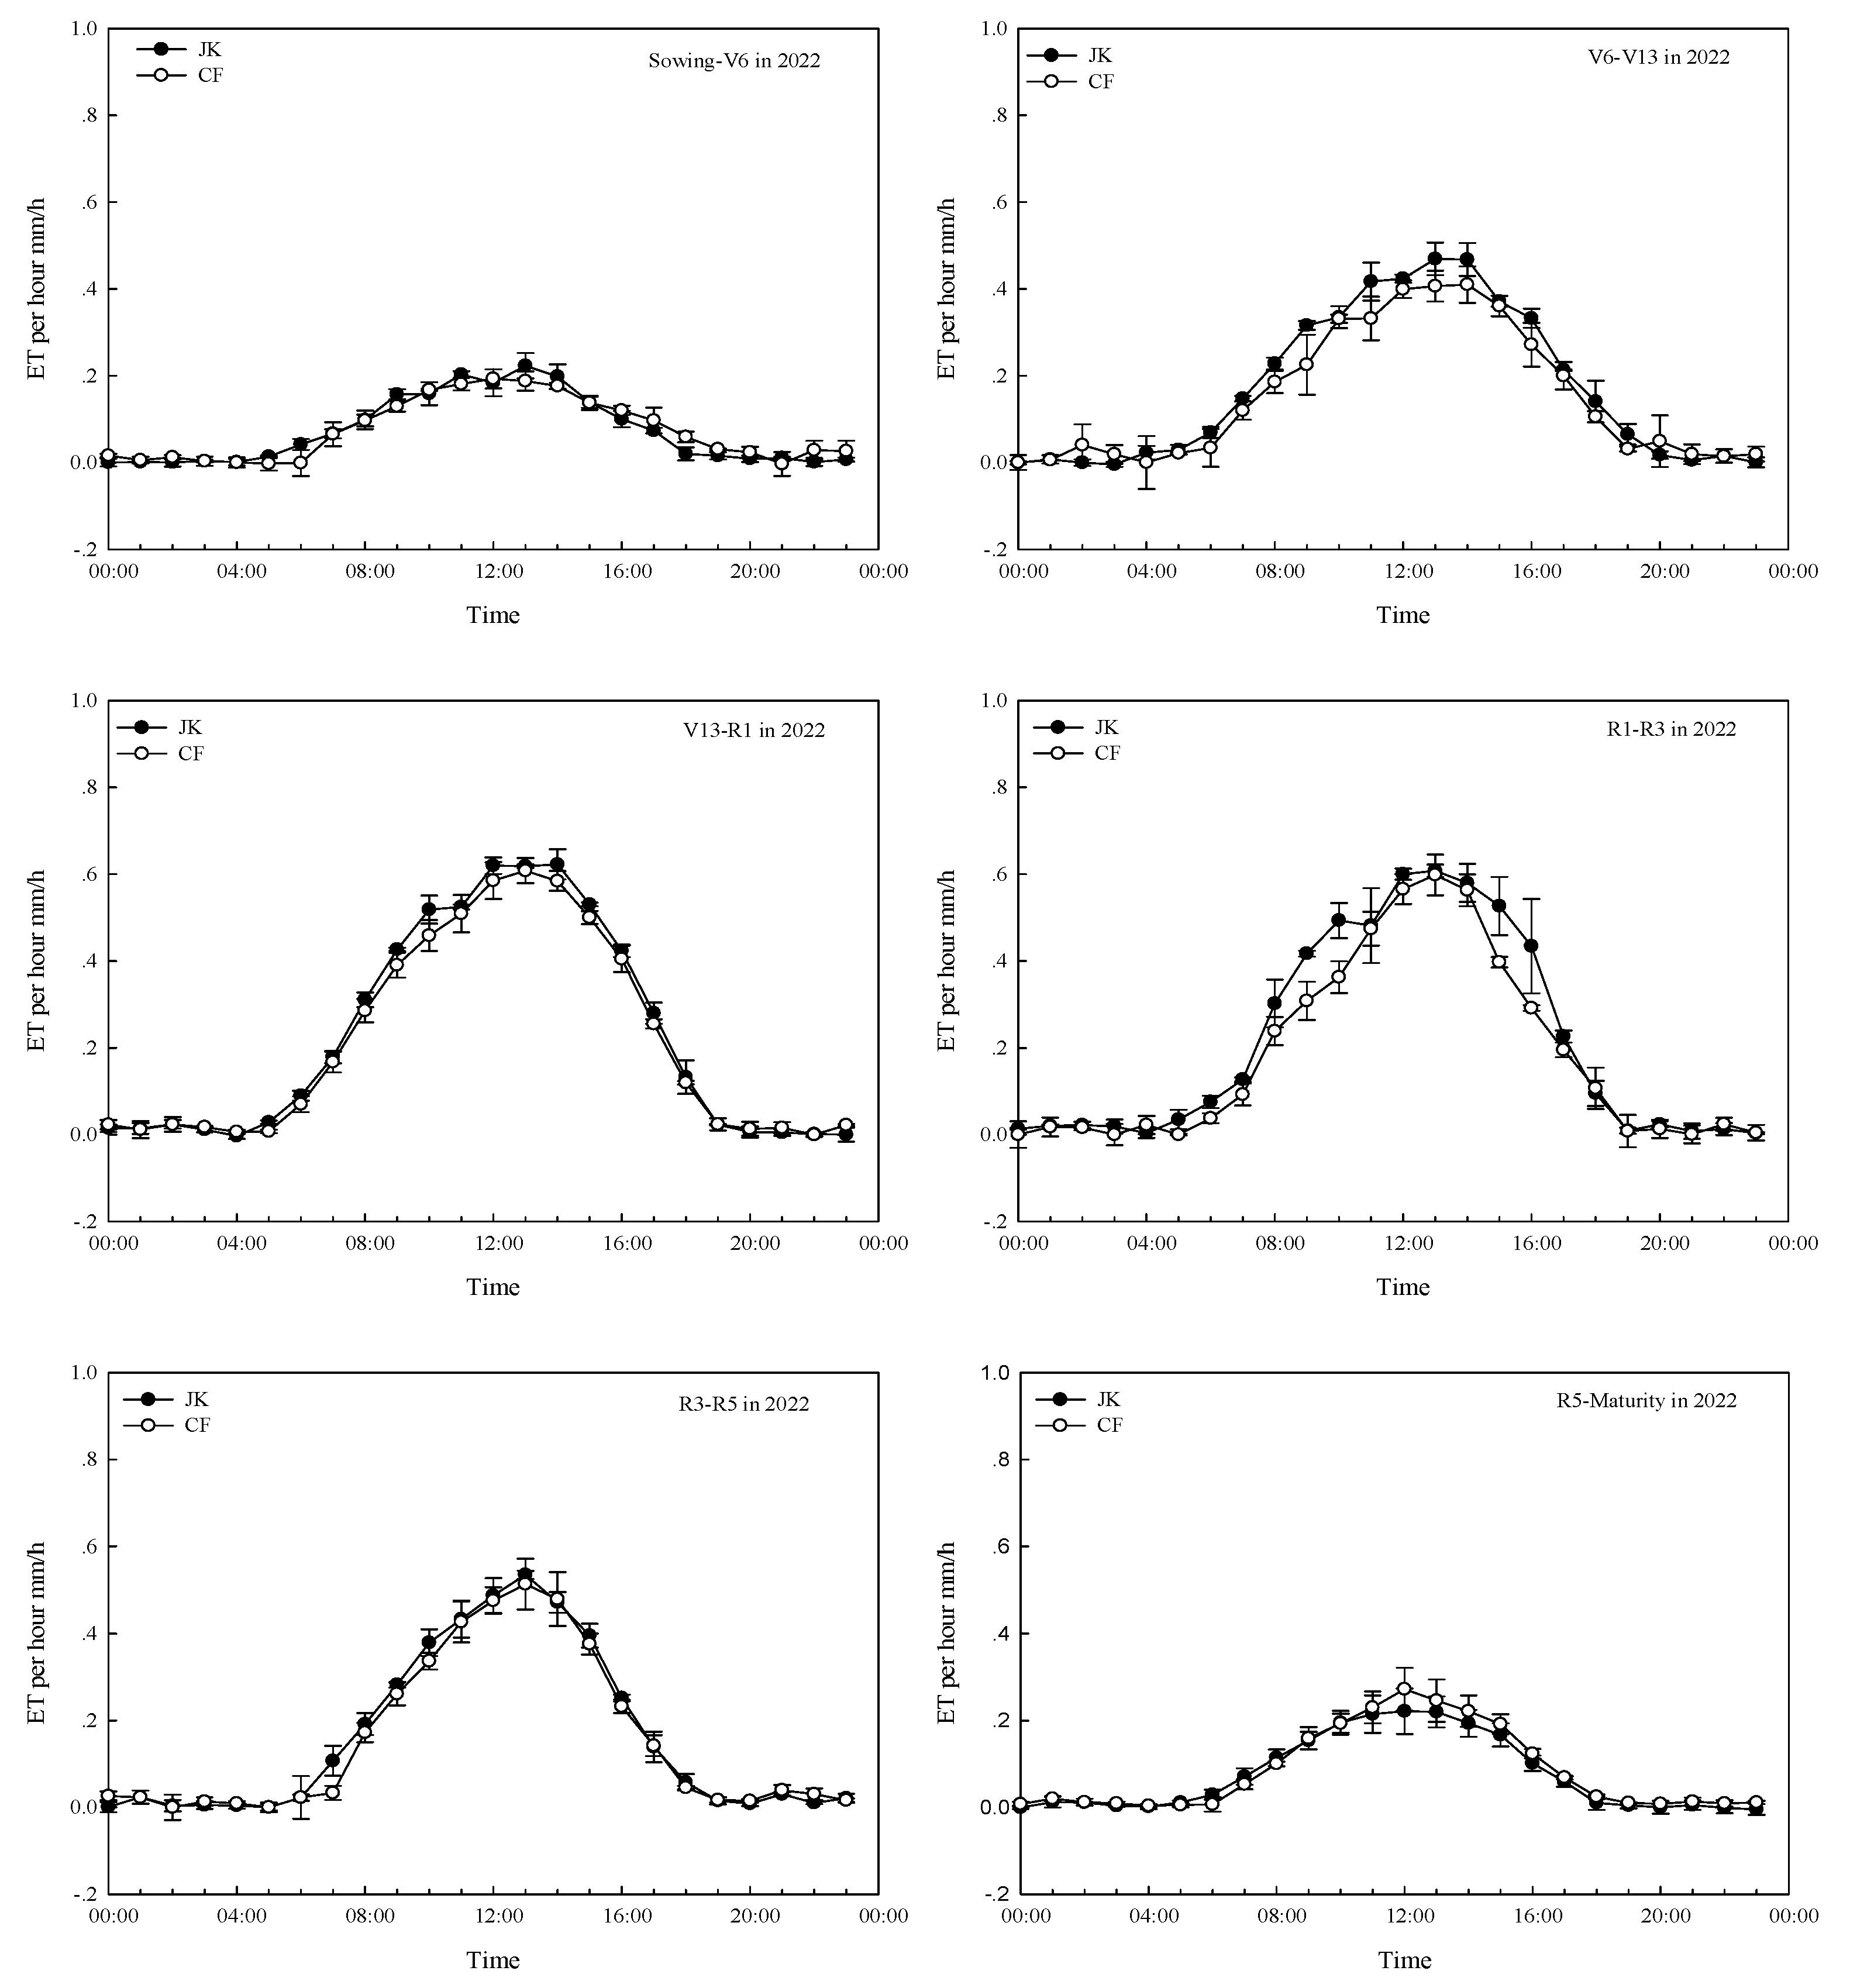
Figure 5.
Hourly ET averaged for total growth season of summer maize in the second growth season.

Fluctuations of hourly evapotranspiration (HET) of summer maize at different growth stages in the first growth season and the second growth season were showed in Fig 4. and Fig 5., respectively. The peak of hourly ET occurred at 11:00 and 13:00 more than other hours. The peak of hourly ET of both two maize varieties increased with the development of canopy, from 0.26 mm/hour and 0.27 mm/hour at S-V6 stage to 0.62 mm/hour and 0.61 mm/hour at V13-R1 stage for JK and CF in the first growth season, from 0.16 mm/hour and 0.15 mm/hour at S-V6 stage to 0.61 mm/hour and 0.61 mm/hour at R1-R3 stage for JK and CF in the second growth season, respectively. The peak of hourly ET of both two maize varieties decreased with leaf senescence development, from 0.62 mm/hour and 0.60 mm/hour at R1-R3 stage to 0.22 mm/hour and 0.27 mm/hour at R5-M stage for JK and CF in the first growth season, from 0.59 mm/hour and 0.48 mm/hour at R3-R5 stage to 0.45 mm/hour and 0.43 mm/hour at R5-M stage for JK and CF in the second growth season, respectively. Peak value of hourly ET was higher in the first growth season than in the second growth season at most growth stages except the final R5-Maturity stage, which maybe caused by 6 day harvest earlier in the second growth season.
The biggest difference of these peaks among all growth stages, exhibiting one hour time-lag between two maize varieties, which was 0.0593 mm/hour at V6-V13 stage in the first growth season and was 0.0783 mm/hour at R3-R5 stage in the second growth season, respectively. However, the biggest difference of the peak of hourly ET was lower than the biggest difference of hourly ET, which was 0.1425 mm/hour in the first growth season (at 16:00, R1-R3 stage)and was 0.0999 mm/hour in the second growth season (at 13:00, R3-R5 stage), respectively. The difference of hourly ET between maize varieties decreased with the increase of hourly ET may implied a limitation or a ceiling for hourly ET of summer maize.
Averaged for two years, there were 7 hours at R1-R3 stage including 3:00, 5:00, 7:00, 9:00, 10:00, 15:00, 16:00 and 3 hours at R3-R5 including 12:00, 13:00, 19:00 when hourly ET of JK was significantly higher than that of CF, those differences of HET lead to significant accumulated differences of HET for 12:00-17:00, and finally made the significant accumulated difference of HET for 24 hours at two stages.
The annual difference of hourly ET was significant for JK and CF during the afternoon: 13:00, 16:00 at Sowing-V6 stage, 12:00-17:00 at V6-V13 stage, 13:00-16:00 at V13-R1 stage, 16:00 at R3-R5 stage, 12:00-16:00 at R5-Maturity, respectively.
3.4. Transpiration rate at plant level
Figure 6.
Leaf transpiration rate during pre-anthesis period.
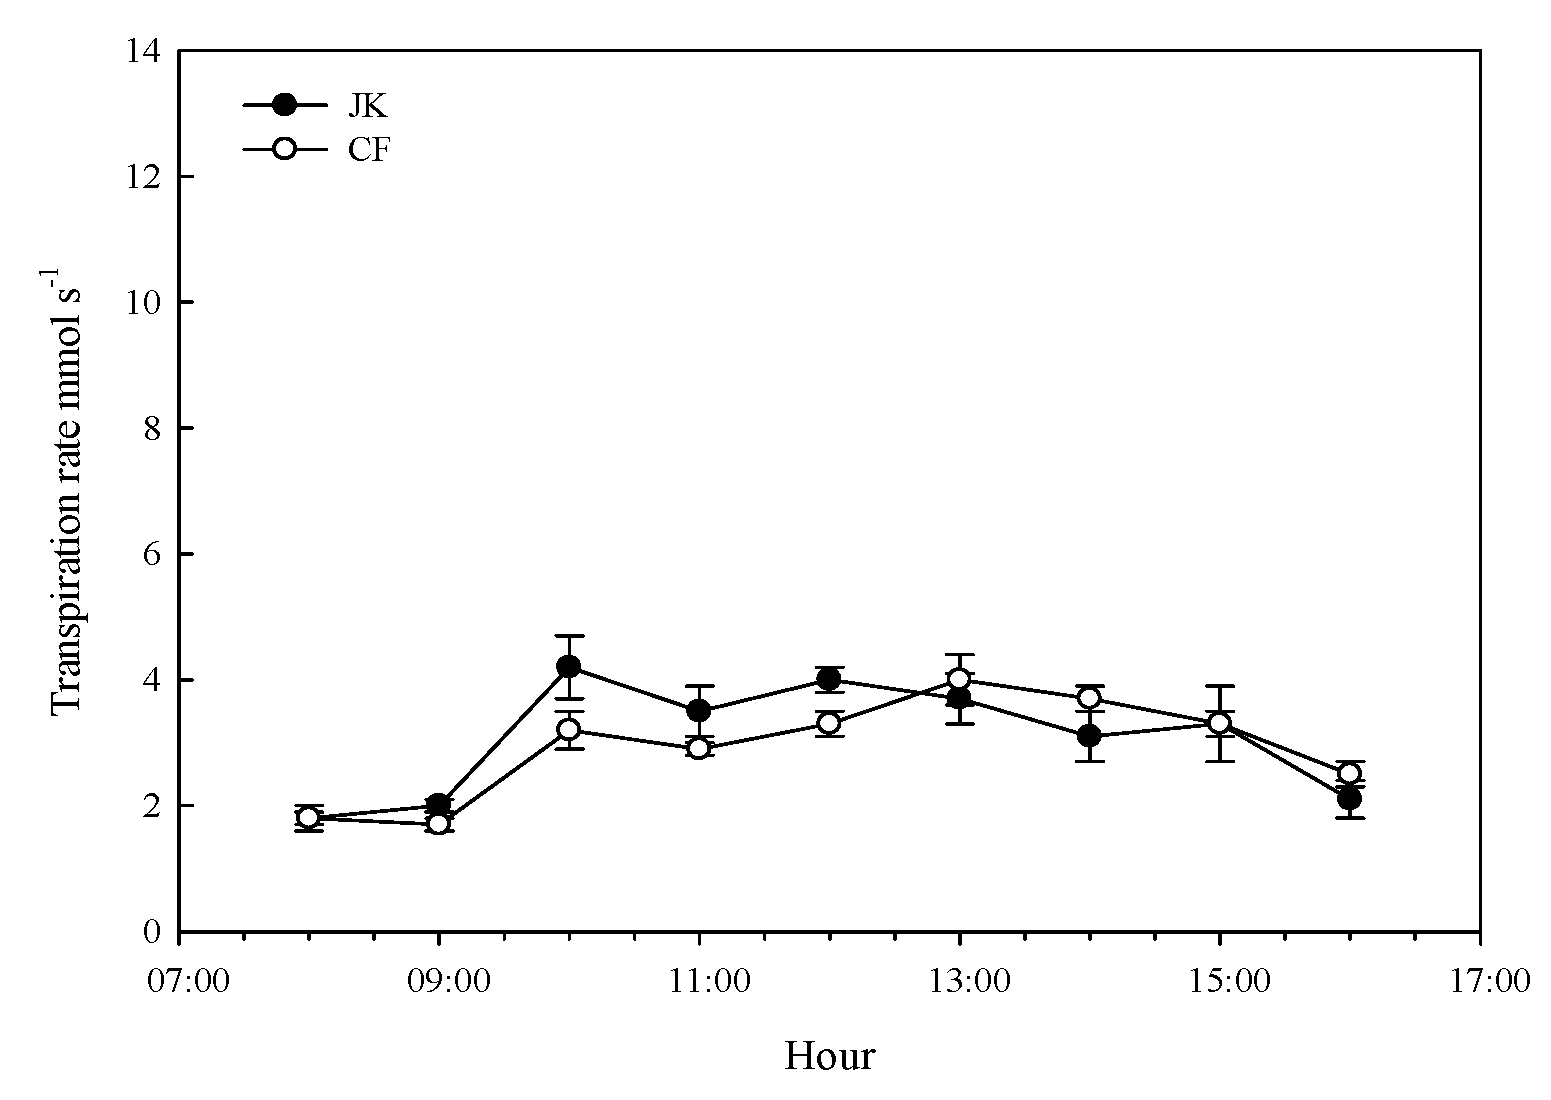
Figure 7.
Leaf transpiration rate during post-anthesis period.
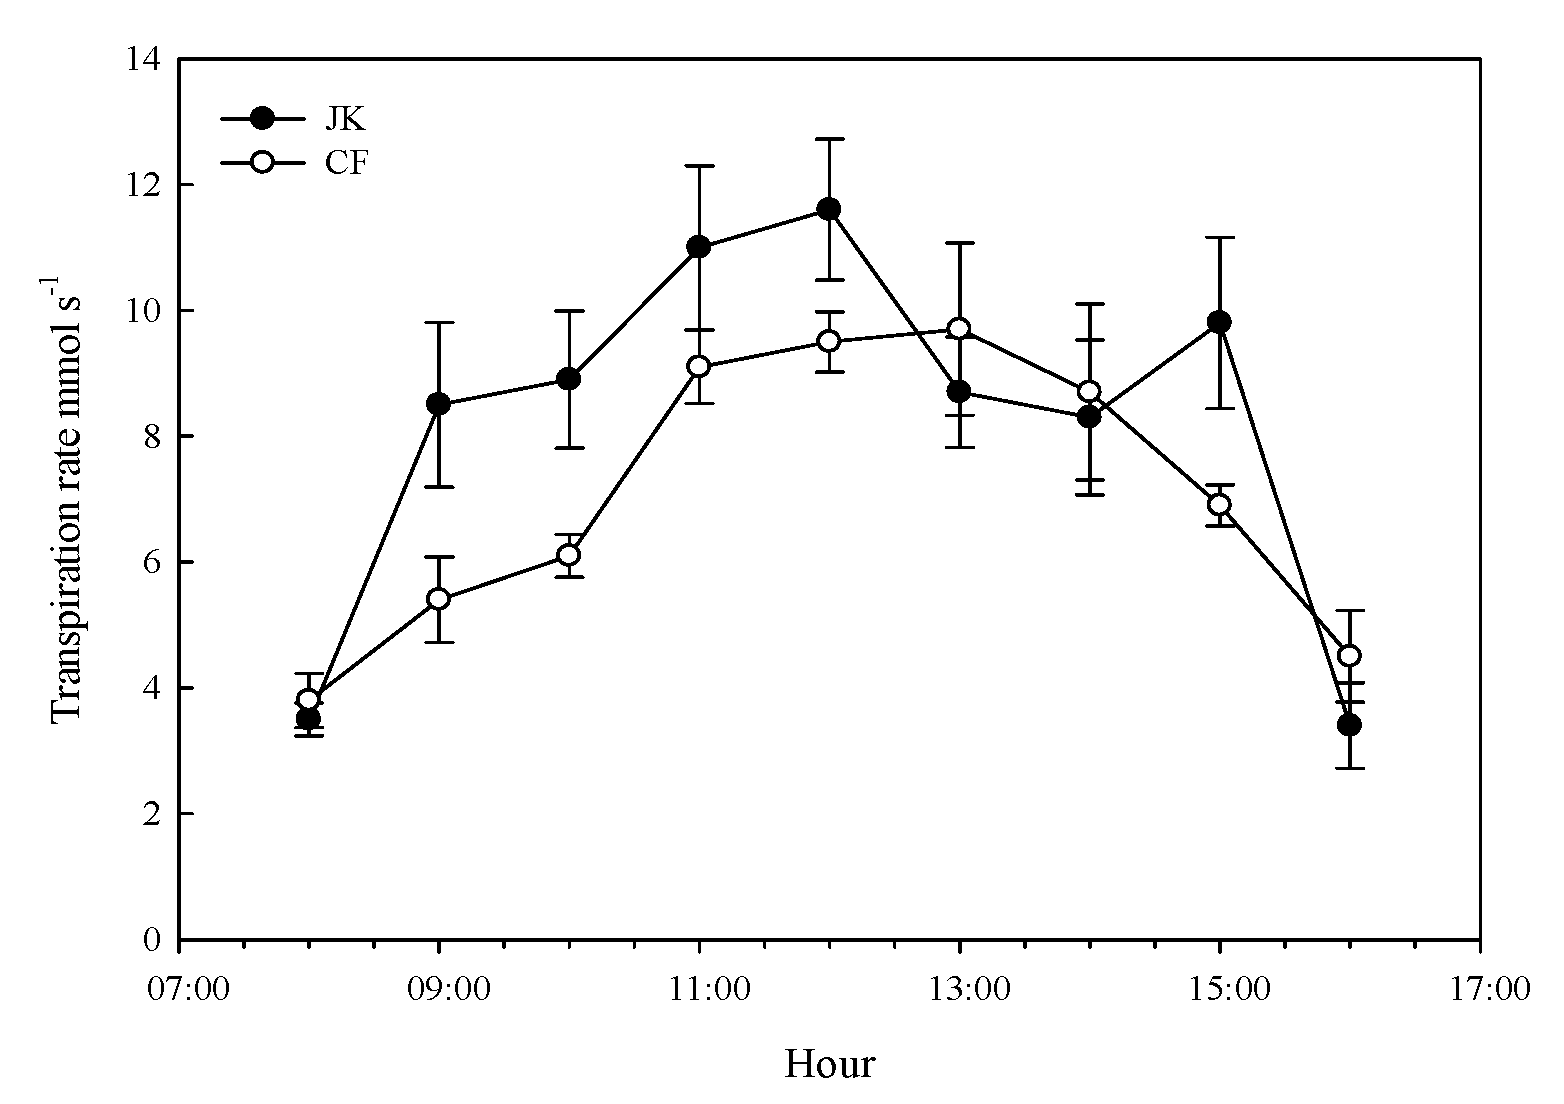
Transpiration rate (Tr) of summer JK and CF at pre-anthesis period and post-anthesis period was showed in Fig 6 and Fig 7. Tr of JK was higher than that of CF at 9:00, 10:00, 11:00, 12:00, 15:00, and was lower than that of CF at 8:00, 13:00, 14:00 and 16:00, either at pre-anthesis or at post-anthesis, respectively. Actually, the significant difference of Tr between two maize varieties from 9:00 to 12:00 was 16.8%, 31.8%, 23.0%, 20.7% during pre-anthesis and 57.0%, 46.5%, 21.5%, 22.2% during post anthesis, respectively. Among other hours, Tr of JK was significantly lower than that of CF at 14:00 by 16.1% at pre-anthesis and was significantly higher than that of CF at 15:00 by 41.7% at post-anthesis, respectively.
In compared with pre-anthesis, Tr increased significantly at every hour at post-anthesis for JK and CF respectively. Averaged Tr at diurnal time (8:00 -16:00) was 5.3% and 16.0% higher for JK than CF at pre-anthesis and post-anthesis respectively. Further, averaged Tr at forenoon (8:00 - 12:00) of JK was significantly higher than that of CF by 20.0% and 28.7% , in contrast of -9.0% and 1.5% at afternoon (13:00 -16:00), respectively. In consequence, the difference of Tr between two maize varieties depends on the difference formed at forenoon.
4. Discussion
Daily evapotranspiration (ET) serves as a critical indicator for irrigation scheduling, exhibiting distinct spatial characteristics. In this study, daily ET variations fell within the range reported for summer maize in the North China Plain (Liu et al., 2002; Liu et al., 2010). Daily ET was higher for JK with larger canopy size across most growth stages. During the second season, daily ET of JK was slightly higher than that of CF because canopy size was similar before R1 stage, and the significantly higher daily ET for JK in compared of CF relied on the significantly larger canopy size or LAI for JK during V9-R1 period in the first season (Fig 1.). The positive correlation between daily ET and LAI highlights the influence of individual canopy size on maize evapotranspiration.
There are few reports about the effect of individual canopy size on maize evapotranspiration, but the positive effect of canopy size under various planting densities on maize ET can be used as reference. Higher plant density resulted in more evapotranspiration during the whole growth season (Jiang et al., 2014), except for its initial growth stage when barely canopy difference occurred (Chen et al., 2019), significant ET increment under medium and high plant density treatments occurred during V10-R1 stage while canopy size was significantly enhanced simultaneously (Wang et al., 2017). In this study, 48.2% of daily ET difference averaged for two growth seasons depended on the significant difference of daily ET at R1-R3 stage. This stage is considered as a period with high water consumption and high water sensitivity for maize (Wang et al., 2021), and is also regarded as a period with the maximum LAI difference for canopy maintains its high capability of transpiration and photosynthesis after fully establishment (Li et al., 2018). According to our results, the absence of significant LAI difference at R1 stage when annual variation of daily ET was significant for JK and insignificant for CF, is the primary reason of the temporal diversity of the occurrence of the significant ET difference, regardless of the significant difference of LAI at other stages such as V9, V13, R3 stage, when maize maintained a large canopy size under adequate meteorological conditions for evapotranspiration (enough radiation and sun duration) in NCP.
The LAI difference at the critical stage also influenced the proportion of diurnal difference in daily difference of ET. Diurnal ET was the main component of daily ET (Irmak, 2011). In this study, diurnal ET accounted for 93.7%-97.3% of daily ET averaged for total growth season (Fig 3.), hence, it is reasonable that diurnal difference composes 87.2% of the difference of daily ET. However, the proportion was 24.7% and 117.1% for two seasons respectively. According to our investigation, the primary reason is the significant difference of diurnal ET between two maize varieties at R1-R3 stage in the first season. We can further deduced that reduced diurnal difference of hourly ET may lead to the increased nocturnal difference because less water consumed at daytime means more available moisture conserved in the soil at nighttime, and vice versa.
Transpiration is the majority of maize evapotranspiration, accounting for 65.0%, 78.3%, 81.8%, and 50.0% in four growth stages of jointing, booting, tasseling, and filling-mature, respectively (Zhang et al., 2014). Transpiration increased with plant density ranging from 52,500/60,000 plants ha-1 to 97, 500/90, 000 plants ha-1 (Ren et al., 2016, Chen et al., 2019). Similarly, the individual canopy size also has a positive effect on hourly transpiration rate at whole plant level (represented as Tr×LA) when averaged for diurnal time (8:00-16:00) at pre-anthesis and at post-anthesis respectively. Transpiration was driven by radiative energy and evaporative demand (vapor pressure deficit, VPD) in daytime (Kukal et al., 2022), therefore, the response of transpiration to solar radiation was enhanced by larger canopy, and the dependance of transpiration on leaf area as the plant growth progressed was widely reported (Villalobos and Fereres, 1990; Herbst et al., 1996; Steduto and Hsiao, 1998; Basso and Ritchie, 2015). It is worth pointing out that seasonal transpiration is positively and closely correlated with maximum LAI across plant densities and seasons (Hernández et al., 2021). Here we also found that hourly Tr×LA and Tr×LA of both two maize varieties averaged for the forenoon (8:00-12:00), afternoon (13:00-16:00) and diurnal time (8:00-16:00) significantly increased at post-anthesis when the canopy fully established.
Although variations of transpiration rate were similar for maize varieties with different canopy size (Fig 6. and Fig 7.), there were several diversities that worth noting: (1)faster startup transpiration rate for JK at the beginning of morning and higher final transpiration rate for CF at 16:00. (2) 1 hours time lag of the maximum hourly ET, which occurred at 12:00 for JK and at 13:00 for CF, respectively. (3) the downtrend Tr rose briefly at 15:00 and then continued to decline for JK instead of CF during the afternoon. Transpiration rate, determined either at leaf level or at individual plant level by multiplying leaf area, was identified as the transient transpiration rate, which was determined by the hydraulic conductivity of the plant-soil interface or vapor pressure deficit under water stress conditions (Hayat et al., 2019). Hence, during the early morning, for instance at 9:00 or 10:00, the transient transpiration rate would remain high when the evapotranspiration demand is lower than at noon (Wu et al., 2011). According to our analysis, strong transpiration under large canopy leads to rapid depletion of soil moisture, lower soil water content then in turn limits the subsequent transpiration (Novák et al., 2005). Therefore, it is well understood that the positive effect of canopy size on transpiration relies more on the significant difference of Tr averaged for forenoon (8:00-12:00) than for afternoon (13:00-16:00), especially on the significant difference of hourly transpiration at four consecutive hours involving 9:00, 10:00, 11:00, 12:00. We speculate that available water in rhizosphere soil is enough for supporting transpiration in the forenoon and it may cost about two hours to recover from the decreased water potential, either from the nearby soil with higher water potential through horizontal transfer or from deeper soil profile through vertical movement such as capillarity phenomena (Wu et al., 2015, Ramos et al., 2017, Wang et al., 2020). In our opinion, the temporal variation of plant transpiration and its coupling relationship with soil water dynamics in both horizontal and vertical directions requires further analysis.
However, we found sporadic temporal consistency between the difference of daily ET and the difference of Tr×LA at the date of measurement, just at 10:00, 11:00, 12:00 at pre-anthesis. ET and Tr was measured at field level and at leaf level in this study, representation of ET scaling up from leaf level to plant level and field level is important for better understanding of efficient water utilization of summer maize, because it related transpiration with photosynthesis through stomatal movement (Jones H G., 1998; Katul G., 2010). In this study, Tr×LA is a method widely applied for ET representation scaling up from leaf level to plant level from statistics, ignoring the diversities of canopy structure and capacity (leaf angle, orientation, stomata density, etc.), as well as water transfer in stem. Further, soil evaporation and the consequent spatial and temporal distribution of soil water content should be taken into account when ET representation needs to scale up to field level.
5. Conclusion
Analysis of pooled date revealed the advantage of maize variety with large canopy size that LAI of JK was significantly higher than CF by 18.1%, 5.0% and 10.4% at V9, V13 and R3 stage, respectively. Larger canopy size at R1 stage may lead to the significant difference of daily ET between JK and CF, because the significant difference of daily ET between JK and CF was 1.03 mm/day at R1-R3 stage, higher daily ET of JK in compared with that of CF also occurred at V6-V13 stage, V13-R1 stage, R3-R5 stage in the first growth season (p>0.05). Diurnal ET difference accounted for 24.7% and 117.1% of daily ET difference,in spite of the proportion of diurnal ET in daily ET was 95.0% and 95.2% for JK and 97.3% and 93.7% for CF in each growth season respectively.
Hourly ET of L was higher than that of CF among diurnal 12 hours in the first season, especially at 7:00, 8:00, 9:00, 10:00, 15:00, 16:00 (p<0.05). Accumulated hourly ET difference during the afternoon (12:00-17:00) was 0.080 mm and 0.088 mm in each growth season, when the variation of sum of hourly ET difference during the forenoon (6:00-11:00) was -0.054 mm and 0.170 mm respectively. Hourly ET of JK was higher than that of CF among diurnal 12 hours in the first growth season, especially at 7:00, 8:00, 9:00, 10:00, 15:00, 16:00 (p<0.05). Hourly ET difference showed an “increase-decrease” process both in the forenoon and in the afternoon. It was noteworthy that the difference of hourly ET decreased to near 0 mm/hour at noon when the peak hourly ET occurred.
The significant difference of Transpiration rate between two maize varieties from 9:00 to 12:00 was 16.8%, 31.8%, 23.0%, 20.7% at pre-anthesis and 57.0%, 46.5%, 21.5%, 22.2% at post anthesis, respectively. Among other hours, Tr of JK was significantly lower than that of CF at 14:00 by 16.1% at pre-anthesis and was significantly higher than that of CF at 15:00 by 41.7% at post-anthesis, respectively. Averaged Tr at diurnal time (8:00-16:00) was 5.3% and 16.0% higher for JK than CF at pre-anthesis and post-anthesis respectively.Further, averaged Tr at forenoon (8:00- 12:00) of JK was significantly higher than that of CF by 20.0% and 28.7%, in contrast of -9.0% and 1.5% at afternoon (13:00-16:00), respectively.
Acknowledgments
This research was funded by the National Natural Science Foundation of China (32101831) and the Innovative Research and Experiment Project for Young Researchers of Tianjin Academy of Agricultural Sciences (2022013). Authors are grateful to all the staff of the National Experiment Station for Precise Agriculture. The authors declare that they have no conflict of interest.
References
- Adamtey, N., Cofie, O., Ofosu-Budu, K.G., Ofosu-Anim, J., Laryea, K.B., Forster, D. Effect of N-enriched co-compost on transpiration efficiency and water-use efficiency of maize (Zea mays L.) under controlled irrigation. Agric. Water Manag. 2010, 97 (7), 995-1005.
- Allen, RG, Pereira, LS, Raes, D, Smith, M. Crop Evapotranspiration: Guidelines for Computing Crop Water Requirements. FAO Irrigation and Drainage. Paper 56. FAO, 1998, 56.
- Baguis, P., Roulin, E., Willems, P., Ntegeka, V. Climate change scenarios for precipitationand potential evapotranspiration over central Belgium. Theor. Appl. Climatol. 2010, 99, 273–286.
- Basso, B., Ritchie, J.T. Assessing the impact of management strategies on water use efficiency using soil–plant–atmosphere models. Vadose Zone J. 2015, 11 (4).
- Cammalleri, C., Anderson, M. C., Gao, F., Hain, C. R., Kustas, W. P. A data fusion approach for mapping daily evapotranspiration at field scale. Water Resour. Res. 2013, 49 (8), 4672-4686.
- Chen, Z.J., Sun, S.J., Zhu, Z.C., Jiang, H., Zhang, X.D. Assessing the effects of plant density and plastic film mulch on maize evaporation and transpiration using dual crop coefficient approach. Agric. Water Manag. 2019, 225, 105765.
- De Fraiture, C., Wichelns, D. Satisfying future water demands for agriculture. Agric. Water Manag. 2010, 97 (4), 502-511.
- Ding, R., Kang, S., Li, F., Zhang, Y., Tong, L., Sun, Q.Evaluating eddy covariance method by large-scale weighing lysimeter in a maize field of northwest China. Agric. Water Manag. 2010. 98 (1), 87-95.
- Ding, R.S., Kang, S.Z., Zhang, Y.Q., Hao, X.M., Tong, L., Du, T.S. Partitioning evapotranspiration into soil evaporation and transpiration using a modified dual crop coefficient model in irrigated maize field with ground-mulching. Agric. Water Manag. 2012, 127: 85–96.
- Galleguillos, M., Jacob, F., Prévot, L., Faúndez, C., Bsaibes, A. Estimation of actual evapotranspiration over a rainfed vineyard using a 1-D water transfer model: A case study within a Mediterranean watershed. Agric. Water Manag. 2017, 184, 67-76.
- Harmsen, E.W., Miller, N.L., Schlegel, N.J., Gonzalez, J.E. Seasonal climate change impacts on evapotranspiration, precipitation deficit and crop yield in Puerto Rico. Agric. Water Manag. 2009, 96: 1085–1095.
- Hatfield, J.L., Sauer, T.J., Prueger, J.H. Managing soils to achieve greater water use efficiency. Agron. J. 2001, 93 (2),271-280.
- Hayat, F., Ahmed, M.A., Zarebanadkouki, M., Javaux, M., Carminati, A. Transpiration reduction in maize (Zea mays L.) in response to soil drying. Front. Plant Sci. 2019, 10, 1695.
- Herbst, M., Kappen, L., Thamm, F., Vanselow, R. Simultaneous measurements of transpiration, soil evaporation and total vaporation in a maize field in Germany. J. Exp. Bot. 1996, 47 (12), 1957-1962.
- Hernández, M.D., Alfonso, C., Echarte, M. M., Cerrudo, A., Echarte, L. Maize transpiration efficiency increases with n supply or higher plant densities. Agric. Water Manag. 2021, 250 (1), 106816.
- Huang, J., Sun, S., Xue, Y., Zhang, J. Changing characteristics of precipitation during 1960–2012 in Inner Mongolia, northern China. Meteorol. Atmos. Phys. 2015, 127, 257-271.
- Irmak, S. Dynamics of nocturnal, daytime, and sum-of-hourly evapotranspiration and other surface energy fluxes over nonstressed maize canopy. J. Agric. Sci. 2011, 137 (8), 475-490.
- Irmak, S., Djaman, K., Rudnick, D.R. Effect of full and limited irrigation amount and frequency on subsurface drip-irrigated maize evapotranspiration, yield, water use efficiency and yield response factors. Irrig. Sci. 2016, 34 (4), 271-286.
- Jiang, X.L., Kang, S.Z., Tong, L., Li, F.S., Ding, R.S., Qiu, R. Crop coefficient and evapotranspiration of grain maize modified by planting density in an arid region of northwest China. Agric. Water Manag. 2014, 142, 135-143.
- Jones, H.G. Stomatal control of photosynthesis and transpiration. J. Exp. Bot. (Special_Issue). 1998, 387-398.
- Kang, S., Gu, B., Du, T., Zhang, J. Crop coefficient and ratio of transpiration to evapotranspiration of winter wheat and maize in a semi-humid region. Agric. Water Manag. 2003, 59 (3), 239-254.
- Katul, G., Manzoni, S., Palmroth, S. A stomatal optimization theory to describe the effects of atmospheric CO2 on leaf photosynthesis and transpiration. Ann. Bot. 2010, 105 (3), 431-442.
- Kitonyo, O.M., Sadras, V.O., Yi, Z., Denton, M.D. Nitrogen supply and sink demand modulate the patterns of leaf senescence in maize. Field Crops Res. 2018, 225: 92-103.
- Kukal, M.S., Irmak, S., Clothier, B.E., Dierickx, W., Oster, J., Wichelns, D. Nocturnal transpiration in field crops: implications for temporal aggregation and diurnal weighing of vapor pressure deficit. Agric. Water Manag. 2022, 266.
- Lenka, S., Singh, A.K., Lenka, N.K. Water and nitrogen interaction on soil profile water extraction and ET in maize–wheat cropping system. Agric. Water Manag. 2009, 96 (2): 195-207.
- Li, J., Xie, R. Z., Wang, K. R., Hou, P., Li, S.K. Response of canopy structure, light interception and grain yield to plant density in maize. J. Agric. Sci. 2018, 156 (6), 1-10.
- Li, S. X., Wang, Z.H., Li, S.Q., Gao, Y.J. Effect of nitrogen fertilization under plastic mulched and non-plastic mulched conditions on water use by maize plants in dryland areas of China. Agric. Water Manag. 2015, 162: 15-32.
- Li, S.X., Wang, Z.H, Li, S.Q, Gao, Y.J, Tian XH. Effect of plastic sheet mulch, wheat straw mulch, and maize growth on water loss by evaporation in dryland areas of China. Agric. Water Manag. 2012, 116, 39-49.
- Liang, L., Li, L., Liu, Q. Temporal variation of reference evapotranspiration during 1961–2005 in the Taoer River basin of Northeast China. Agric. For. Meteorol. 2010, 150: 298-306.
- Liu, C.M., Zhang, X.Y., Zhang, Y.Q. Determination of daily evaporation and evapotranspiration of winter wheat and maize by large-scale weighting lysimeter and macro-lysimeter. Agric. For. Meteorol. 2002, 111 (2), 109-120.
- Liu, Y. B., De Smedt, F. Flood modeling for complex terrain using GIS and remote sensed information. Water Resour Manage. 2005, 19, 605-624.
- Liu, Y.J., Luo, Y.A. A consolidated evaluation of the FAO-56 dual crop coefficient approach using the lysimeter data in the North China Plain. Agric. Water Manag. 2010, 97 (1): 31-40.
- Lv, L.H., Zhao., M, Zhao, J R., Tao, H.B., Wang, P. Canopy structure andphotosynthesis of summer maize under different nitrogen fertilizerapplication rates. Scientia Agric. Sin. 2008, 41 (9), 2624-2632. (in Chinese with English abstract).
- Ma, Y., Liu, S., Song, L., Xu, Z., Liu, Y., Xu, T., Zhu, Z. Estimation of daily evapotranspiration and irrigation water efficiency at a Landsat-like scale for an arid irrigation area using multi-source remote sensing data. Remote Sens. Environ. 2018, 216, 715-734.
- Mei, X.R, Kang, S.Z, Yu, Q, Huang, Y.F, Zhong, X.L, Gong, D.Z, Huo, Z.L, Liu, E.K. Pathways to synchronously improving crop productivity and field water use efficiency in the North China Plain. Scientia Agric. Sin. 2012, 46 (6): 1149-1157. (in Chinese with English abstract).
- Novák, V., Hurtalová, T., Matejka, F. Predicting the effects of soil water content and soil water potential on transpiration of maize. Agric. Water Manag. 2005, 76 (3), 211-223.
- Payero, J.O, Tarkalson, D.D, Irmak, S., Davison, D., Petersen, J.L. Effect of irrigation amounts applied with subsurface drip irrigation on corn evapotranspiration, yield, water use efficiency, and dry matter production in a semiarid climate. Agric. Water Manag. 2008, 95 (8), 895-908.
- Payero, J.O, Tarkalson, D.D, Irmak, S., Davison, D., Petersen, J.L. Effect of timing of a deficit-irrigation allocation on corn evapotranspiration, yield, water use efficiency and dry mass. Agric. Water Manag. 2009, 96 (10), 1387-1397.
- Ramos, T.B., Simionesei, L., Jauch, E., Almeida, C., Neves, R. Modelling soil water and maize growth dynamics influenced by shallow groundwater conditions in the sorraia valley region, Portugal. Agric. Water Manag. 2017, 185, 27-42.
- Ranatunga, K. Soil-tree-atmosphere water relations. Atmospheric Model Applications. Cranberra: Bureau of Metorology. 2012, pp.157-194.
- Ren, P., Rossi, S., Gricar, J., Liang, E., Cufar, K. Is precipitation a trigger for the onset of xylogenesis in Juniperus przewalskii on the north-eastern Tibetan Plateau? Ann. Bot, 2015, 115 (4), 629-639.
- Ren, X.M., Sun, D.B., Wang, Q.S. Modeling the effects of plant density on maize productivity and water balance in the Loess Plateau of China. Agric. Water Manag. 2016, 171, 40–48.
- Rudnick, D.R, Irmak, S. Impact of nitrogen fertilizer on maize evapotranspiration crop coefficients under fully irrigated, limited irrigation, and rainfed settings. J. Irrig. Drain. Eng. 2014, 140 (12), 04014039.
- Salem, H.M, Valero, C, Muñoz, M.Á, Rodríguez, M.G, Silva, L.L. Short-term effects of four tillage practices on soil physical properties, soil water potential, and maize yield. Geoderma. 2015, 237, 60-70.
- Shan, L., Wu, P.T., Kang, S.Z., Feng, H., Zhang, S.Q. Study on agricultural water-saving countermeasures and feasibility of implementing semi-dryland farmingin the Huang-Huai-Hai Region. Chin. Eng. Sci, 2011, 13 (4): 37-41. (in Chinese with English abstract).
- Steduto, P., Hsiao, T.C. Maize canopies under two soil water regimes II. Seasonal trends of evapotranspiration, carbon dioxide assimilation and canopy conductance, and as related to leaf area index. Agric. For. Meteorol. 1998, 89, 185–200.
- Stumpp, C., Stichler, W., Kandolf, M., Imneka, J. Effects of land cover and fertilization method on water flow and solute transport in five lysimeters: A long-term study using stable water isotopes. Vadose Zone J. 2013, 11 (1), vzj2011-0075.
- Sun, H., Shen, Y., Yu, Q., Flerchinger, G. N., Zhang, Y., Liu, C., Zhang, X. Effect of precipitation change on water balance and WUE of the winter wheat–summer maize rotation in the North China Plain. Agric. Water Manag. 2010, 97 (8), 1139-1145.
- Tan, C.S, Drury, C.F, Gaynor, J.D, Welacky, T.W, Reynolds, W.D. Effect of tillage and water table control on evapotranspiration, surface runoff, tile drainage and soil water content under maize on a clay loam soil. Agric. Water Manag. 2002, 54 (3), 173-188.
- Tao, Z., Li, C., Li, J., Ding, Z.S., Xu, J., Sun, X.F., Zhou, P.L., Zhao, M. Tillage and straw mulching impacts on grain yield and water use efficiency of spring maize in Northern Huang–Huai–Hai Valley. Crop J. 2015, 3 (5), 445-450.
- Tognetti, R., Giovannelli, A., Lavini, A., Morelli, G., Fragnito, F., d’Andria, R. Assessing environmental controls over conductances through the soil–plant–atmosphere continuum in an experimental olive tree plantation of southern Italy. 2009, Agric. For. Meteorol. 149 (8), 1229–1243.
- Valipour M. Analysis of potential evapotranspiration using limited weather data. Appl. Water Sci. 2017, 7 (1), 187-197.
- Villalobos, F.J., Fereres, E. Evaporation measurements beneath corn, cotton and sunflower canopies. Agron. J. 1990, 82 (6), 1153-1159.
- Wada, Y., Flörke, M., Hanasaki, N., Eisner, S., Fischer, G., Tramberend, S., Satoh, Y., Van Vliet, M.T.H., Yillia, P., Ringler, C.J.G.M.D., Burek, P. Modeling global water use for the 21st century: The Water Futures and Solutions (WFaS) initiative and its approaches. Geosci. Model Dev. 2016, 9 (1), 175-222.
- Wang, F., Xiao, J.F., Ming, B., Xie, R.Z., Wang, K.R., Hou, P., Liu, G.Z., Zhang,G.Q., Chen, J.L., Liu,W.M., Yang, Y.S., Qin A.Z., Li, S.K. Grain yields and evapotranspiration dynamics of drip-irrigated maize under high plant density across arid to semi-humid climates. Agric. Water Manag. 2021, 247, 106726.
- Wang, Q.M., Fan, Z.L., Zhao, Y.H., Yin, W., Chai, Q. Effect of Planting Density on Water Consumption Characteristics of Maize in Oasis Irrigation Area. Acta Agron. Sin. 2017, 43 (9), 1347-1356.
- Wang, X.W., Guan, H.D., Huo, Z.L., Guo, P., Du, j.l., Wang, W.S. Maize transpiration and water productivity of two irrigated fields with varying groundwater depths in an arid area. Agric. For. Meteorol. 2020, 281, 107849.
- Wu, Y., Liu, T., Paredes, P., Duan, L., Pereira, L.S. Water use by a groundwater dependent maize in a semi-arid region of inner mongolia: evapotranspiration partitioning and capillary rise. Agric. Water Manag. 2015, 152, 222-232.
- Wu, Y.Z., Huang, M.B., Warrington, D.N. Growth and transpiration of maize and winter wheat in response to water deficits in pots and plots. Environ. Exp. Bot. 2011, 71 (1), 65-71.
- Xu, G.P., Xue, X.Z., Wang, P., Yang, Z.S., Yuan, W.Y., Liu, X.F., Lou, C.J. A lysimeter study for the effects of different canopy sizes on evapotranspiration and crop coefficient of summer maize. Agric. Water Manag. 2018, 208, 1-6.
- Xu, X., Sun C., Qu, Z.Y., Huang, Q.Z, Ramos, T.B., Huang, G.H. Groundwater recharge and capillary rise in irrigated areas of the upper Yellow River basin assessed by an agro-hydrological mode. Irrig. Drain. 2015, 64 (5), 587-599.
- Zhang, S., Sadras, V., Chen, X., Zhang, F.S. Water use efficiency of dryland maize in the Loess Plateau of China in response to crop management. Field Crops Res. 2014, 163, 55-63.
- Zhang, X.Y., Chen, S.Y., Sun, H.Y., Shao, L.W., Wang, Y.Z. Changes in evapotranspiration over irrigated winter wheat and maize in North China Plain over three decades. Agric. Water Manag. 2011, 98 (6), 1097-1104.
- Zhang, Y., Kendy, E., Qiang, Y., Shao, L.W., Wang, Y.Z. Effect of soil water deficit on evapotranspiration, crop yield, and water use efficiency in the North China Plain. Agric. Water Manag. 2004, 64 (2), 107-122.
Disclaimer/Publisher’s Note: The statements, opinions and data contained in all publications are solely those of the individual author(s) and contributor(s) and not of MDPI and/or the editor(s). MDPI and/or the editor(s) disclaim responsibility for any injury to people or property resulting from any ideas, methods, instructions or products referred to in the content. |
© 2025 by the authors. Licensee MDPI, Basel, Switzerland. This article is an open access article distributed under the terms and conditions of the Creative Commons Attribution (CC BY) license (http://creativecommons.org/licenses/by/4.0/).
Copyright: This open access article is published under a Creative Commons CC BY 4.0 license, which permit the free download, distribution, and reuse, provided that the author and preprint are cited in any reuse.


