

Submitted:
03 March 2025
Posted:
04 March 2025
You are already at the latest version
Abstract
Low plant stands at early crop establishment contribute to yield reduction in legumes. Gap-filling has been suggested as a mechanism to mitigate these losses. There is, however, limited understanding of yield-compensation mechanism in the cowpea. This study was aimed to investigate the mechanism of yield-compensation in some accessions of cowpea in two savannah agro-ecologies in Northern Nigeria. The experiment was laid out split plot fitted into a randomized complete block design with three replicates in each site. The main plot consisted of four plant densities (33,333; 66,666; 99,999; 133,333 plants ha-1) while the subplots consisted of six cowpea accessions (IT89KD-288, IT93K-452-1, IT99K-537-1-1, IT98K-205-8, IT08K-150-27 and DANILA). Results showed that plant density and environment affected grain yield. Total grain yield increased with increasing plant density and was higher at Minjibir than at Shika. The highest total grain yield of 1793.3 kg ha-1 was observed in the accession DANILA at 99,999 plants ha-1, while the lowest (1,100 kg ha-1) was observed in the accession IT98K-205-8 at 33,333 plants ha-1. Leaf area index, stand count at harvest and intercepted photosynthetically active radiation were positively correlated with total grain yield at both locations, suggesting that these traits could be considered for cowpea improvement. Cowpea growers and breeders could consider the erect (IT93K-452-1 and IT98K-205-8) and semi-erect accessions (IT99K-573-1-1 and IT08K-150-27) for cultivation at 133,133 plants ha-1. Prostrate accessions (IT89KD-288 and DANILA) could be planted at 99,999 plants ha-1 at Minjibir. The accessions IT93K-452-1-1, IT98-205-8, IT99K-573-1-1 and IT08K-150-27 could be considered for cultivation at Shika irrespective of plant density.
Keywords:
Growth
; yield compensation
; cowpea
; missing stand
; plant density
1. Introduction
Cowpea [Vigna unguiculata (L.) Walp] is a staple legume which is important for the livelihood of millions of people in Sub-Saharan Africa (SSA). It is an underutilised crop with a high potential for food and nutritional security in SSA. It is produced for grain, immature green pods and fresh leaves due to its nutritional composition [1].
Cowpea production in Sub-Saharan Africa is very critical to smallholder farmers because of its potential to combat food insecurity, malnutrition and poverty. Rich in protein, it is regarded as a poor man’s meat for most households in Africa. The yield of cowpea was reported to have increased to about 900 kg ha-1 between 2014 and 2018 [2]. Between 2017 and 2018, an increase of 575 kg ha-1 was reported by FAOSTAT.
Despite the increase in cowpea productivity in Nigeria, a yield-gap still exists due to constraints such as insect pests, parasitic weeds, drought and poor soil fertility [3]. Other challenges faced by growers include missing plant stands, which are mostly caused by seed-picking birds and hoe-weeding. Hicks et al. [4] suggested gap-filling as a potential approach to mitigate yield losses caused by missing plant stands, although not all seedlings may survive transplanting procedures to make up for reduction in plant stands. Mechanisms of yield compensation are aimed at bridging the gap in cowpea production. The use of an appropriate mechanism of yield-compensation could provide insights into the management of phenotypic and yield-improvement in the cowpea [5]. Plant density is another important factor that affects the growth and yield of crops including the cowpea. It is used to compensate yield losses caused by biotic and abiotic stresses. Kamara et al. [6] reported plant density as an important factor used to enhance light interception and crop growth, especially in densely populated crop stands [5,7]. Plant density can also be manipulated to improve crop growth and optimise yield [7,8]. Studies have demonstrated the importance of appropriate plant population suitable for optimum yield in improved crop varieties. Seran and Brintha [9] and Nur Arina et al. [10] noted that excessive plant populations could result in low yield due to overcrowding and competition for limited resources and suggested a reduction in the number of seedlings in order to optimise yield. In the soyabean, studies have been carried out to determine if yield compensation occasioned by low plant population could be achieved through increasing plant density and yield components [5] or the use of improved varieties [11]. Studies have been carried out in major crops such as sorghum [5] and black gram [12] to determine the effect of plant density on growth and yield. Not much has been reported in the cowpea. This study was aimed at investigating the yield-compensation mechanism in some accessions of cowpea grown at different plant densities in two agro-ecologies of Minjibir and Shika in Northern Nigeria.
2. Materials and Methods
2.1. Experimental Site
The experiment was conducted at two locations, namely the International Institute of Tropical Agriculture (IITA) experimental research farm, Minjibir, Kano (12o42’N, 8o39’E; 509 m above sea level), which is located in the Sudan Savannah, and the International Institute of Tropical Agriculture (IITA) experimental station at Shika, Zaria (11o11’N, 7o38’E; 686 m above sea level) in the northern Guinea Savannah. Composite soil samples were collected before sowing from six different spots at the trial locations using the auger at a depth of 0-20 cm and analysed for physicochemical properties in the IITA Analytical Services Laboratory in Ibadan, Nigeria. The result of the soil analysis is shown in Table 1.
2.2. Meteorological Report
Meteorological data were collected from the weather stations situated at the IITA experimental stations at Minjibir and Shika as shown in Table 2.
2.3. Experimental Design
The layout of the experiment at each location was in the split plot arrangement fitted into a randomized complete block design with three replicates. The main plots consisted of four plant densities (33,333 plants ha-1; 66,666 plants ha-1; 99,999 plants ha-1 and 133,333 plants ha-1) while the sub-plots consisted of six cowpea accessions, namely IT89KD-288, IT93K-452-1, IT99K-573-1-1, IT98K-205-8, IT08K-150-27 and DANILA. The accessions were sourced from the germplasm collection of the IITA, Kano Station, Kano, Nigeria. The agronomic characteristics of the accessions are as shown in Table 3.
2.4. Cultural Practice
Seeds were cleaned to avoid mechanical mixtures; after which they were treated with 250 g of Apron star to protect them from soil-borne pathogens. The field was disc-harrowed and then ridged. Each sub-plot measuring 3 m x 3 m consisted of four rows with inter-row and intra-row spacing of 75 cm and 20 cm, respectively. Three seeds per hill were sown on August 17 and August 21 at Minjibir and Shika, respectively. Thinning was done at two weeks after sowing (2 WAS) to achieve the desired number of plants in each plot according to the experimental design.
A starter dose of NPK 15:15:15 fertilizer was applied blanket at the rate of 14.25 kg ha-1. Insects were controlled with the application of Cypermethrin [Cyano - (3-phenoxy phenol) methyl) 3 - (2,2-dicholoroethy 1) -2, 2-dimethylcyclopropane -1- carbonxylate] at the rate of 120 ml ha-1. Ampligo [Chlorantraniliprole (10%) + Lambda-cyhalothrin (5%) Zc, manufactured by Syngenta Crop protection AG, Switzerland] was applied at the rate of 100 ml ha-1 to control Maruca damage. Ampligo was used after the emergence of flowers to avoid delay in flowering.
2.5. Field Observation and Data Collection
Field observation and data collection commenced at two weeks after sowing (2 WAS), using the two middle rows in each plot. The ratio of the number of seedlings established to the total number of seeds sown in each plot and multiplied by 100 was recorded as the establishment rate. Leaf area index (LAI) was measured at 30, 45 and 60 DAS using the AccuPAR Model LP-80 PAR/LAI Ceptometer (Decagon Devices, Pullman WA, USA). The sensor was placed diagonally across the two middle rows on the surface below the canopy so that the two ends of the sensor were in line with the cowpea rows. The means of five measurements were used for the statistical analysis. Measurements were done under sunlight conditions from 12 noon to 4 pm local time [13].
The intercepted photosynthetically active radiation (IPAR) was measured at 30, 45 and 60 DAS using the same instrument that was used to measure the leaf area index. The value of photosynthetically active radiation intercepted by the cowpea canopy was computed as IPAR as follows:
where,
IPAR = [1.0 – (PARb/PARa)]
- IPAR = Intercepted PAR
- PARa = PAR measured above cowpea canopy (µmol m-2s-1)
- PARb = PAR measured below cowpea canopy (µmol m-2s-1)
The number of days to first flower was recorded as the number of days from sowing to when the first flower had appeared in each plot. The number of days from sowing to when at least 50% of the plants had flowered in each plot was recorded as the number of days to 50% flowering. The number of days to first pod maturity was recorded as the number of days from sowing to when the first pod in each plot had completely turned yellow [14]. The number of days from sowing to when at least 95% of the total number of pods on plants in the middle row in each plot had completely turned yellow was recorded as the number of days to 95% pod maturity.
The total number of plants in the two middle rows at harvest was recorded as the stand count at harvest. The pods were dried for two days after harvest, threshed and the grains were weighed. The weight of the grain in each plot was extrapolated to the equivalent in kilogram per hectare [15]:
Grain yield (Kg ha-1) = Grain yield (kg) x 10,000 m2
Plot size (m) x Net row (m)
The effect of environment and cowpea development type on grain yield was determined by plotting the total grain yield against the different developmental types of the cowpea at the different plant densities.
2.6. Data Analysis
Data collected from both locations were subjected to two-way analysis of variance (ANOVA) test separately and then combined using the R-programming software (version 4.1.0). The plant densities and cowpea accessions were considered as factors in determining the mean squares and the F-test. Means were separated using the Duncan’s new Multiple-Range test (DMRT). Correlation coefficient was computed using the relationship between total grain yield and the growth parameters.
3. Results
3.1. Establishment Rate
Table 4 shows the main effects of plant density and accession on establishment rate and stands count at harvest at Minjibir and Shika. The highest establishment rate of 90% was observed at the plant density of 33,333 plants ha-1 while the lowest (81%) was observed at 133,333 plants ha-1 at Minjibir. The establishment rate did not differ significantly amongst the accessions. The same trend was observed at the Shika location. The establishment rate was generally higher at Minjibir than at Shika. Results of the combined analysis showed that the establishment rate was significantly (p < 0.001) higher (89.5%) at 33,333 plants ha-1 than at 133,333 plants ha-1 (79.3%).
3.2. Stand Count at Harvest
The highest stand count at harvest at Minjibir (62) was observed at 133,333 plants ha-1 while the lowest (21) was observed at 33,333 plants ha-1 (p < 0.001). The accessions did not differ significantly in stand count at harvest (Table 4). The same trend was observed at the Shika location. The accessions, however, differed significantly (p < 0.05) in the stand count at harvest. The results of the combined analysis showed that stand count at harvest was significantly (p < 0.001) higher at 133,333 plants ha-1 (50) than at 33,333 plants ha-1 (19). The interaction of accession and environment on stand count at harvest was significant (Appendix Table A1). The highest stand count of 49.3 was observed in the accession IT98K-205-8 at Minjibir while the lowest (22.3) was observed in the accession DANILA at Shika.
3.3. Leaf Index Area (LAI)
Table 5 shows the leaf area index (LAI) at different stages of growth of cowpea. At 30 DAS, the lowest LAI value at Minjibir (1.60) was observed at the plant density of 33,333 plants ha-1 while the highest value (2.56) was observed at 133,333 plants ha-1. At the Shika location, the LAI did not differ significantly with plant density. At the Minjibir location, LAI was highest in the accession DANILA and lowest in the accession IT99K-573-1-1 with values of 3.01 and 1.45, respectively. At Shika, LAI was highest in the accession IT93K-452-1 and lowest in the accessions IT99K-537-1-1, IT98K-205-8 and DANILA. Results of the combined analysis showed that LAI was highest (1.30) at 133,333 plants ha-1 and lowest (0.82) at 33,333 plants ha-1. The LAI was highest in the accession IT99K-573-1-1 (0.75) when the data were combined before the analysis. The LAI was generally higher at Minjibir than at the Shika location (Table 5).
At 45 DAS, the LAI at Minjibir varied from 3.68 at 33,333 plants ha-1 to 4.64 at 133,333 plants ha-1. At Shika, the LAI values at 45 DAS did not differ significantly with the accession. The results of the combined analysis showed that the LAI was highest at 133,333 plants ha-1 (2.63) and lowest at 33,333 plants ha-1 (1.94). The highest LAI value in the combined analysis was observed in the accession DANILA while the lowest was observed in the accession IT99K-573-1-1 with values of 2.17 and 1.75, respectively (Table 5). Again, the LAI values were generally higher at Minjibir than at Shika.
At 60 DAS, the LAI values at Minjibir did not differ significantly with the plant density. At Shika, the LAI was highest at 133,333 plants ha-1 (0.18) and lowest at 33,333 plants ha-1 (0.12). The LAI value at Minjibir was highest in the accession IT89KD-288 (4.62) and lowest in the accession IT99K-573-1-1 (3.67). At 60 DAS, the LAI value at Shika ranged from 0.09 in the accession DANILA to 0.19 in the accession IT08K-150-27. The LAI value was highest in the accession IT89KD-288 (2.39) and lowest in the accession IT99K-573-1-1 (1.91) in the combined analysis (Table 5).
Appendix Table A2 shows that the interaction of accession and environment on LAI at 30 DAS was significant. The LAI value was highest in the accession DANILA (3.01) at Minjibir and lowest in the accessions IT99K-573-1-1, IT98K-205-8 and DANILA with a value of 0.04 at Shika. The interaction of accession and environment on LAI was significant at 45 DAS (Appendix Table A3). The LAI was highest in the accession DANILA (4.94) at Minjibir and lowest in the accessions IT99K-537-1-1, IT08K-150-27 and IT93K-452-1 (0.94) at Shika.
3.4. Intercepted Photosynthetically Active Radiation (IPAR)
At Minjibir the intercepted photosynthetically active radiation (IPAR) was significantly higher (p < 0.001) at 99,999 plants ha-1 than at 66,666 plants ha-1 (Table 6). At Shika the IPAR values did not differ significantly with the plant density or accession at 30 DAS. The IPAR value was significantly higher at 99,999 and 133,333 than at 33,333 plants ha-1 when the data were combined. It was significantly higher in the accession IT89KD-288 (0.68 µmol m-2S1) and lowest in the accession IT99K-573-1-1 (0.42 µmol m-2S1) at 30 DAS.
At 45 DAS the IPAR value at Minjibir was significantly higher (p < 0.05) at 133,333 plants ha-1 than at 33,333 plants ha-1. It was significantly higher in the accession IT93K-452-1 (0.87 µmol m-2s-1) than in the accession IT99K-573-1-1 (0.73 µmol m-2s-1). At Shika, the IPAR values did not differ significantly irrespective of plant density or accession. Results of the combined analysis showed that the IPAR value was higher at 133,333 plants ha-1 than at 33,333 plants ha-1. The IPAR value was highest in the accession DANILA (0.73 µmol m2s-1) and lowest in the accession IT99K-573-1-1 (0.64 µmol m2s-1) (Table 6).
At 60 DAS, the IPAR values at Minjibir did not differ significantly irrespective of plant density or cowpea accession (Table 6). At Shika the IPAR value was highest at 66,666 plants ha-1 and lowest at 133,333 plants ha-1. Irrespective of plant density or accession, the IPAR values did not differ significantly when the data were combined before the analysis at 60 DAS.
The IPAR values were generally higher at Minjibir than at Shika across plant densities and cowpea accessions. Generally, the IPAR values increased with the crop age up to 45 DAS and thereafter decreased at 60 DAS across the plant densities (Table 6). Across the accessions, the IPAR values were generally higher at the early than at the latter stages of growth. When data were combined, the IPAR values increased with the crop age up to 45 DAS and thereafter decreased (Table 6).
3.5. Number of Days to First Flower
Table 7 shows the number of days to first flower and number of days to 50% flowering at Minjibir and Shika locations. The number of days to first flower at Minjibir did not differ significantly with plant density. It was highest in the accession IT89KD-288 (57 days) and lowest in the accession IT98K-205-8 (44 days). Similarly, the number of days to first flower at Shika did not differ significantly with plant density. The accessions differed significantly in the number of days to first flower. Generally, the number of days to first flower was higher at Shika than at Minjibir location. When the data were combined, the number of days to first flower was similar across the plant densities but differed significantly with the accessions (Table 7).
3.6. Number of Days to 50% Flowering
At Minjibir the number of days to 50% flowering was highest (70 DAS) at the plant density of 133,333 plants ha-1 and lowest (64 DAS) at 33,333 plants ha-1. The number of days to 50% flowering was significantly higher in the accession IT89KD-258 (74 DAS) than in the accession IT98K-205-8 (61 DAS). At Shika, the number of days to 50% flowering did not differ significantly with the plant density. The number of days to 50% flowering was highest in the accession DANILA (58 DAS) and lowest in the accession IT93K-452-1 (50 DAS). Across the plant densities and accessions, the number of days to 50% flowering was generally higher at Minjibir than at Shika. Results of the combined analysis showed that the number of days to 50% flowering differed significantly with the accessions (Table 7).
The interaction of cowpea accession and plant density on the number of days to 50% flowering was significant (Appendix Table A4). The highest number of days to 50% flowering (73.7 days) was observed in the accession IT89KD-288 at Minjibir while the lowest (50.1 days) was observed in the accession IT93K-452-1-1 at Shika.
3.7. Number of Days to First Pod Maturity
At both Minjibir and Shika locations the number of days to first pod maturity did not differ significantly with the plant density, as well as in the combined analysis. The number of days to first pod maturity at Minjibir was highest in the accession DANILA (93 DAS) and lowest in the accession IT98K-205-8 (89 DAS). At Shika, the number of days to first pod maturity varied from 71.6 DAS in the accession IT98K-205-8 to 78.3 DAS in the accession DANILA (Table 8). In the combined analysis, the number of days to first pod maturity did not differ significantly across the accessions and plant densities. The number of days to first pod maturity was generally higher at Minjibir than at Shika location.
3.8. Number of Days to 95% Pod Maturity
The number of days to 95% pod maturity at Minjibir was statistically similar at all the plant densities, but was significantly higher in the accession IT08K-150-27 than in IT93K-452-1 with values of 105.8 DAS and 101.3 DAS, respectively (Table 8). The same trend was observed at the Shika location. The number of days to 95% pod maturity was highest in the accession DANILA (94.6 DAS) and lowest in the accession IT93K-452-1 (87.4 DAS). The number of days to 95% pod maturity was similar at all plant densities, but was highest in the accession DANILA (100.1 DAS) and lowest in the accession IT93K-452-1 (94.3 DAS) when the data were combined before the analysis.
A significant interaction of accession and environment on the number of days to 95% pod maturity was observed (Appendix Table A5). The number of days to 95% pod maturity was highest (105.7 DAS) in the accession DANILA at Minjibir and lowest (87.4 DAS) in the accession IT93K-425-1 at Shika.
3.9. Total Grain Yield
At the Minjibir location, the total grain yield increased with increasing plant density, ranging from 1,297.1 kg ha-1 at 66,666 plants ha-1 to 1,494.8 kg ha-1 at 133,333 plants ha-1. Total grain yield was highest in the accession DANILA (1,597.4 kg ha-1) and lowest in the accession IT89KD-288 (1,270 kg ha-1) (Table 9). Similarly, total grain yield at the Shika location increased with increasing plant density from 315.8 kg ha-1 at 33,333 plants ha-1 to 499.6 kg ha-1 at 133,333 plants ha-1. Total grain yield at Shika was highest in the accession IT08K-150-25 and lowest in the accession DANILA, with grain yield values of 512.9 kg ha-1 and 174.4 kg ha-1, respectively. Total grain yield was generally higher at Minjibir than at the Shika location. The result of combined analysis also showed that total grain yield increased as the plant density increased, but was statistically similar in all the accessions (Table 9).
The interaction of plant density and accession on total grain yield was significant (Appendix Table A6). The total grain yield was highest in the accession DANILA (1,793.3 kg ha-1) at 99,999 plants ha-1 and lowest in the accession IT98K-205-8 (1,100 kg ha-1) at 33,333 plants ha-1. The interaction of the accession and environment on total grain yield was also significant (Appendix Table A7). Total grain yield was highest (1,597.4 kg ha-1) in the accession DANILA at Minjibir and lowest (174.44 kg ha-1) in the same accession at Shika.
3.10. Response of Grain Yield to Cowpea Architecture
The environment had a significant effect on the response of grain yield to the cowpea architecture. Figure 1a shows the effect of cowpea architecture on grain yield at different plant densities. At the Minjibir location, there was no significant difference (p > 0.05) in the performance of indeterminate cowpea accessions (IT89KD-288 and DANILA) at 33,333 plants ha-1 (1,382.2 kg ha-1); 66,666 plants ha-1 (1,454.5 kg ha-1); 99,999 plants ha-1 (1,526.4 kg ha-1) and 133,333 plants ha-1 (1,371.7 kg ha-1). The determinate cowpea accessions (IT08k-150-27, IT98K-205-8, IT99K-573-1-1 and IT93K-452-1) performed best at 133,333 plants ha-1 with a mean grain yield value of 1,556.4 kg ha-1. At Shika, the determinate accessions performed better at 33,333 plants ha-1; 66,666 plants ha-1; 99,999 plants ha-1 and 133,333 plants ha-1 than the indeterminate ones.
The growth habit of the cowpea accessions also affected the total grain yield at different plant densities at both locations (Figure 1b). At the Minjibir location, the highest grain yield of 1,433.7 kg ha-1 was observed in the prostrate accessions DANILA and IT89KD-288 while the lowest (1,382.6 kg ha-1) was observed in the erect accessions IT93K-452-1 and IT98K-205-8, even though the difference (p > 0.05) was not significant. The semi-erect accessions (IT08K-150-27 and IT99K-573-1-1) and the erect accessions IT93K-452-1 and IT98K-205-8) performed best with mean yield values of 1,615.3 kg ha-1 and 1,497.5 kg ha-1, respectively, at 133,333 plants ha-1. Prostrate accessions produced the highest grain yield of 1,526 kg ha-1 at 99,999 plants ha-1. At Shika, the erect cowpea accessions IT93K-452-1 and IT98K-205-8 and the semi-erect ones IT08K-150-27 and IT99K-573-1-1 differed significantly (p < 0.05) from the prostrate ones (DANILA and IT89KD-288). The semi-erect accessions had the highest grain yield of 565.6 kg ha-1 at 133,333 plants ha-1, which was significantly different (p < 0.05) from the erect and the prostrate accessions with average yield values of 458.6 kg ha-1 and 305.8 kg ha-1, respectively. At the Shika location, the semi-erect accessions IT08K-150-27 and IT99K-573-1-1 had a significantly higher grain yield than the erect accessions IT93K-452-1 and IT98K-205-8 as well as the prostrate types (DANILA and IT89KD-288).
Table 10 shows the correlation coefficients of some growth characters with total grain yield of cowpea grown at Minjibir and Shika locations in 2020. At both location, the establishment rate, stand count at harvest, leaf area index and intercepted photosynthetically active radiation were positively and significantly correlated with total grain yield. The number of days to first flower and 50% flowering were negatively correlated with total grain yield at both locations; however, the relationships were significant at the Shika location only. The number of days to first and 95% pod maturity was negatively, albeit non-significantly, correlated with grain yield at both locations. However, when the data were combined, the correlation coefficients were positive and significant.
4. Discussion
Results of this study showed that establishment rate and stand count at harvest were influenced by plant density and cowpea accession. The difference in establishment rate and stand count at harvest could be attributed to differences in soil fertility and rainfall pattern at the two locations. The meteorological data showed that rainfall was higher at Shika than at Minjibir. Results of the soil analysis showed that the soil at both locations was slightly acidic (Table 1). Kamara et al. [13] also reported low rainfall and poor soil fertility at Minjibir when compared to Shika. Organic carbon and Nitrogen were higher at Shika than at Minjibir.
The leaf area index (LAI) increased with increasing plant density at both locations and in the combined analysis at all sampling dates. The LAI was highest in the accession DANILA and lowest in the accession IT99K-573-1-1 at all sampling dates. The LAI was generally higher at Minjibir than at Shika. Teixeira et al. [16] and Du et al. [17] observed that increased plant density resulted in rapid canopy establishment, increased leaf area index and a higher intercepted photosynthetically active radiation. Xiaolei and Zhifeng [18] and Kamara et al. [12] observed that increased LAI resulted in increased photosynthetic activities. In this study, increasing LAI up to 45 DAS resulted in increased IPAR values at both locations (Table 6). A similar finding has been reported in Sorghum bicolor by Addai and Alimiyawo [19], who noted that high LAI resulted in high photosynthetic activities. This study showed that the leaf area index was positively and significantly correlated with total grain yield at both locations and in the combined analysis (Table 10). The significant interaction of accession and environment on the LAI at 30 and 45 DAS indicates that the accessions responded differently to plant density at the latter stages of growth of the cowpea. The cowpea accessions used in this study differed in the type of development (determinate and indeterminate) and growth habit (erect, semi-erect and prostrate). Ahmed and Abdelrhim [20] observed that LAI decreased with increasing plant density. Archana et al. [21] reported that LAI increased at the early stages of growth but decreased at the latter stages, especially in the subtropical environments. Rossini et al. [22] and Zhang et al. [23] suggested that the decrease in the LAI values could be attributed to senescence and shedding of leaves, and that the level of decrease differed with plant density. A similar finding was reported in black gram by Biswas et al. [12]. The decline in the LAI might be due to re-channelling of stored nutrients from the leaves to the pods during the grain-filling period.
In this study, prostrate accessions (DANILA and IT89KD-288) had higher LAI (2.39) than the erect (IT93K-452-1 and IT98K-205-8) or semi-erect types (IT08K-150-27 and IT99K-573-1-1) at both locations. Buff, a prostrate cowpea accession, was reported to have produced the highest LAI, which was attributed to differences in growth habit and genotype [20].
Like the LAI, the intercepted photosynthetically active radiation (IPAR) differed with plant density and cowpea accession. The IPAR values were higher at the early than at the latter stages of growth. The formation of canopy structures during vegetative growth allows for maximum trapping of light and this agrees with the findings of Drewry et al. [24]. IPAR was generally higher at Minjibir than at Shika. The differences in IPAR at the two locations could be attributed to the differences in the growth habit and canopy architecture. For example, the prostrate accessions (DANILA and IT89KD-288) had higher values of IPAR than the erect (IT93K-452-1 and IT98K-205-8) or semi-erect accessions (IT08K-150-27 and IT99K-573-1-1) at both locations (Table 6). Ahmed and Abdelrhim [20] attributed these differences to growth habit and the genotype. The IPAR was positively and significantly correlated with total grain yield in the cowpea. In other words, the grain yield in the cowpea is influenced by the intercepted photosynthetically active radiation.
The number of days to 50% flowering varied with the accessions at Minjibir but was similar at Shika. It was generally higher in the accession IT89KD-288 than in the other accessions. Differences in the number of days to flowering at the different locations show that cowpea is photoperiod-sensitive and this aligns with the report of Yuan et al [25] whose finding noted that time of flowering could be adjusted to improve reproductive success each time daylength changes with season. Bisikwa et al. [26] reported no significant difference in the number of days to flowering in response to plant density. A similar finding has been reported in the cowpea by Ahmed and Abdelrhim [20] for the number of days to 50% flowering. Solar radiation and relative humidity were higher at Shika than at Minjibir (Table 2). Differences in meteorological data at the two locations could have contributed to the differences in the time of flowering. Iseki et al. [27] and Garcia et al. [28] noted that excessive moisture stress could cause delayed flowering in the cowpea and soyabean.
The interaction of accession and plant density on the number of days to 50% flowering was significant implying that the accessions responded differently to the plant density at the different locations. In this study, the accession IT93K-452-1 flowered earlier than the accession IT89KD-288 at both locations. Ishiyaku et al. [29] identified the accessions DANILA and IT89KD-288 as late-maturing. The number of days to 50% flowering was negatively correlated with total grain yield at both locations but showed a positive and significant correlation in the combined analysis.
The number of days to first pod and 95% pod maturity did not differ significantly with plant density at both locations. They were generally higher at Minjibir than at Shika. They were also higher in the accession DANILA than in IT93K-452-1. These differences suggest that both the number of days to first pod maturity and the number of days to 95% pod maturity are influenced by genotype and environment. Solar radiation was higher at Minjibir in the early stages of growth than at the latter stages when it was higher at Shika than at Minjibir. Both the minimum and maximum relative humidity was higher at Shika than at Minjibir. On the other hand, both minimum and maximum temperatures were higher at Minjibir than at Shika (Table 2). There was significant interaction of accession and environment on 95% pod maturity, suggesting that the accessions responded differently to the plant densities at the two locations. Ali and Dov [30] and Bisikwa et al. [26] attributed the delay in physiological maturity to the pattern of rainfall and temperature. The results of correlation analysis showed that the number of days to first and 95% pod maturity were negatively correlated with total grain yield at both locations but were positively and significantly correlated with total grain yield in the combined analysis. The results suggest that early-maturing cowpea accessions have the potential to produce higher grain-yield than the late-maturing ones.
The total grain yield increased with the increasing plant density at both Minjibir and Shika locations as well as in the combined analysis. It differed with accession at both locations. The grain yield was generally higher at Minjibir than at Shika. Similar findings have been reported by Biswas et al. [12] in the black gram, Kamara et al. [6] in soyabean and Bakal et al. [31] in the peanut. Kamara et al. [13] reported that the photosynthetic rate increased with increasing plant density and the intercepted photsynthetically active radiation (IPAR). The same trend was observed in this study. Kamara et al. [13] noted that increasing plant density resulted in increasing biological efficiency and the total grain yield.
The interactions of accession and environment as well as accession and plant density on total grain yield indicate that the cowpea accessions responded differently to plant density at the two locations. Chen et al. [32] and Iseki et al. [27] also noted that cowpea accessions responded differently to plant densities at different locations. The yield differentials observed at Minjibir and Shika could partly be attributed to the incidence of leaf scab disease at Shika, which affected the photosynthetic leaf area.
Results of this study indicate that the leaf area index and the IPAR influenced the pod and total grain yield. These findings are in agreement with those of Jin et al. [33] and Bruns [34] in the soyabean as well as Kamara et al. [13] and Ramesh et al. [35] in the cowpea.
In this study, the environment has been shown to influence the architecture and growth habit of the accessions, which in turn affected the total grain yield. This plasticity is partly due to the genetic constitution of the cowpea accession which affects allocation of resources to allow the plant to compensate for losses that would have occurred due to adverse environmental conditions and this agrees with the findings of Atakora et al. [36]. At Minjibir, for example, there was no significant difference in total grain yield amongst indeterminate accessions IT89KD-288 and DANILA. Kamara et al. [13] reported that high population density could result in better yield irrespective of the stability of the genotypes. This does not agree with the present study as determinate accessions IT98K-205-8 and IT93K-452-1 produced the highest grain yield at 33,333 plants ha-1. At Shika, the determinate accessions out-yielded the indeterminate accessions irrespective of the plant density. Determinate cultivars of cowpea may be more positive because the synchronous habit has proved consistent in soybean, wheat and rice [37].
The growth habit of the cowpea accessions also affected the grain yield at the different locations. At Minjibir, the highest grain yield was observed in the prostrate accessions IT89KD-288 and DANILA, while the lowest yield was observed in the erect accessions IT93K-452-1 and IT98K-205-8. The semi-erect accessions IT99K-573-1-1 and IT08K-150-27 produced the highest grain yield at 133,333 plants ha-1. The prostrate accessions IT89KD-288 and DANILA produced high grain yield at 99,999 plants ha-1. At Shika, the erect (IT93K-452-1 and IT98K-205-8) and semi-erect (IT99K-573-1-1 and IT08K-150-27) accessions differed significantly from the prostrate accessions IT89KD-288 and DANILA. The semi-erect accessions produced the highest grain yield at 133, 333 plants ha-1. At Shika, the semi-erect accessions IT99K-573-1-1 and IT08K-150-27 produced higher grain yield than the erect (IT93K-452-1 and IT98-205-8) and prostrate (IT89KD-288 and DANILA) accessions.
5. Conclusions
This study was aimed at identifying the mechanism of yield compensation in some accessions of cowpea at different environments. The results showed that plant density and environment affected total grain yield. The cowpea architecture and growth habit also affect total grain yield. The results demonstrated that for optimum grain yield in the cowpea, different accessions could be cultivated at different locations and at different plant densities. At Minjibir, the erect accessions IT93K-452-1 and IT98K-205-8 and semi-erect accessions IT99K-573-1-1 and IT08K-150-27 could be cultivated at 133,333 plants ha-1. The prostrate accessions IT89KD-288 and DANILA could be cultivated at 99,999 plants ha-1. At Shika, the erect and semi-erect accessions performed better than the prostrate types irrespective of the plant density. Therefore, the accessions IT93K-452-1-1, IT98-205-8, IT99K-573-1-1 and IT08K-150-27 could be considered for cultivation at Shika.
Author Contributions
Conceptualization, O.A.T.N. and O.S.; methodology, P.O.O. and O.I.S.; software, P.O.O. and O.G.U.; validation, O.A.T.N., and O.S..; formal analysis, P.O.O., O.G.U. and O.I.S.; investigation, O.A.T.N.; resources, O.S..; data curation, P.O.O., G.O.O and O.I.S..; writing—original draft preparation, O.I.S.; writing—review and editing, O.A.T.N. and P.O.O; visualization, O.I.S.; supervision, O.A.T.N. and O.S.; project administration, O.I.S. and G.O.O.; funding acquisition, O.A.T.N. All authors have read and agreed to the published version of the manuscript.
Funding
This research was funded by the Tertiary Education Trust Fund (TETFund), Nigeria, TETFUND/UJ/IBR/2017-2024/015.
Institutional Review Board Statement
Not applicable.
Data Availability Statement
Data are contained within the article.
Acknowledgments
The authors acknowledge the in-kind support given by the International Institute of Tropical Agriculture (IITA), Kano Station.
Conflicts of Interest
The authors declare no conflicts of interest.
Abbreviations
The following abbreviations are used in this manuscript:
| IPAR | Intercepted Photosynthetically Active Radiation |
| LAI | Leaf Area Index |
| DET | Determinate, |
| INT | Indeterminate |
| ER | Erect accession (pods above canopy) |
| SER | Semi-erect accession (pods at the same level with canopy) |
| PRS | Prostrate (pods below canopy) |
Appendix A
Appendix A.1

Table A1.
Interaction effects of accession and environment on stand count at harvest.
| Accession | Minjibir | Shika |
|---|---|---|
| IT89KD-288 | 41.58ab | 25.67e |
| IT93K-452-1 | 43.83a | 28.50d |
| IT99K-573-1-1 | 39.67b | 28.58d |
| IT98K-205-8 | 43.92a | 31.67c |
| IT08K-150-27 | 40.33b | 30.58cd |
| DANILA | 41.83ab | 22.25f |
| LSD (0.05) | 2.65 |
Means followed by the same letter (s) within the same column are not significantly different at 5% level of probability.
Table A2.
Interaction effects of accession and environment on leaf area index at 30 days after sowing.
Table A2.
Interaction effects of accession and environment on leaf area index at 30 days after sowing.
| Accession | Minjibir | Shika |
|---|---|---|
| IT89KD-288 | 2.44b | 0.05e |
| IT93K-452-1 | 2.14bc | 0.06e |
| IT99K-573-1-1 | 1.45d | 0.04e |
| IT98K-205-8 | 1.75cd | 0.04e |
| IT08K-150-27 | 1.74cd | 0.05e |
| DANILA | 4.94a | 0.04e |
| LSD (0.05) | 0.45 |
Means followed by the same letter (s) within the same column are not significantly different at 5% level of probability.
Table A3.
Interaction effects of accession and environment on leaf area index at 45 days after sowing.
Table A3.
Interaction effects of accession and environment on leaf area index at 45 days after sowing.
| Accession | Minjibir | Shika |
|---|---|---|
| IT89KD-288 | 4.64b | 0.47e |
| IT93K-452-1 | 4.71ab | 0.45e |
| IT99K-573-1-1 | 3.05d | 0.45e |
| IT98K-205-8 | 3.93c | 0.49e |
| IT08K-150-27 | 3.98c | 0.45e |
| DANILA | 4.94a | 0.49e |
| LSD (0.05) | 0.27 |
Means followed by the same letter (s) within the same column are not significantly different at 5% level of probability.
Table A4.
Interaction effects of accession and environment on days to 50% flower.
| Accession | Minjibir | Shika |
|---|---|---|
| IT89KD-288 | 73.67a | 56.08def |
| IT93K-452-1 | 62.00e | 50.08g |
| IT99K-573-1-1 | 70.75ab | 50.58fg |
| IT98K-205-8 | 61.33f | 52.00fg |
| IT08K-150-27 | 69.17ab | 52.67efg |
| DANILA | 66.17bc | 58.00de |
| LSD (0.05) | 5.93 |
Means followed by the same letter (s) within the same column are not significantly different at 5% level of probability.
Table A5.
Interaction effects of accession and environment on days to 95% pod maturity.
| Accession | Minjibir | Shika |
|---|---|---|
| IT89KD-288 | 105.67a | 93.00cd |
| IT93K-452-1 | 101.25b | 87.42e |
| IT99K-573-1-1 | 105.00a | 89.17e |
| IT98K-205-8 | 102.08b | 87.50e |
| IT08K-150-27 | 105.83a | 92.25d |
| DANILA | 105.67a | 94.58e |
| LSD (0.05) | 1.98 |
Means followed by the same letter (s) within the same column are not significantly different at 5% level of probability.
Table A6.
Interaction effects of plant density and accession on total grain yield (kg ha-1) of cowpea.
Table A6.
Interaction effects of plant density and accession on total grain yield (kg ha-1) of cowpea.
| Accession | Density (plants ha-1) | |||
|---|---|---|---|---|
| 33,333 | 66,666 | 99,999 | 133,333 | |
| IT89KD-288 | 1323.9cdefg | 1245.0defg | 1259.4defg | 1251.7defg |
| IT93K-452-1 | 1301.7cdefg | 1186.7efg | 1587.2abcd | 1280.0cdefg |
| IT99K-573-1-1 | 1434.4abcdefg | 1115.0fg | 1372.8bcdefg | 1600.6abcd |
| IT98K-205-8 | 1100.0g | 1513.3abcde | 1377.2bcdefg | 1715.0ab |
| IT08K-150-27 | 1340.0bcdefg | 1058.9g | 1575.6abcd | 1630.0abcd |
| DANILA | 1440.6abcdefg | 1663.9abc | 1793.3a | 1491.7abcdef |
| LSD (0.05) | 388.28 | |||
Means followed by the same letter (s) within the same column are not significantly different at 5% level of probability.
Table A7.
Interaction effects of accession and environment on total grain yield (kg ha-1) of cowpea.
Table A7.
Interaction effects of accession and environment on total grain yield (kg ha-1) of cowpea.
| Accession | Minjibir | Shika |
|---|---|---|
| IT89KD-288 | 1270.00c | 424.17de |
| IT93K-452-1 | 1338.89bc | 375.42e |
| IT99K-573-1-1 | 1380.69bc | 438.47de |
| IT98K-205-8 | 1426.38b | 393.75e |
| IT08K-150-27 | 1401.11b | 512.92d |
| DANILA | 1597.36a | 174.44f |
| LSD (0.05) | 117.88 |
Means followed by the same letter (s) within the same column are not significantly different at 5% level of probability.
References
- Gerrano, A.S.; van Rensburg, J.W.S.; Adebola, P.O. Preliminary evaluation of seed and germination traits in cowpea [Vigna uguiculata (L.) Walp.] genotypes. S. Afr. J. Plant Soil 2017a, 34(5), 399-402. [CrossRef]
- FAOSTAT Statistical database. Available online: https://www.fao.org/faostat/en/#data/QCL.
- Horn, L.N.; Shimelis, H. Production constraints and breeding approach to cowpea improvement for drought-prone agro-ecologies in Sub-Saharan Africa. Ann. of Agric Sci. 2020, 65(1), 1–9. [Google Scholar] [CrossRef]
- Hicks, D.R.; Lueschen, W.E.; Ford, J.H. Effects of Stand Density and Thinning on Soybean. J Prod Agric 1990, 3(4), 587–590. [Google Scholar] [CrossRef]
- Ball, R.A.; Purcell, L.C.; Vories, E.D. Short-Season Soybean Yield Compensation in Response to Population and Water Regime. Crop Sci 2000, 40, 1070–1078. [Google Scholar] [CrossRef]
- Kamara, A.Y.; Sylvester, U.E.; Tofa, A.I.; Steve, B. Agronomic response of soybean to plant density in the Guinea savannahs of Nigeria. Agron J 2014, 106, 1051–1059. [Google Scholar] [CrossRef]
- Karukonda, G.; Pakalpati, S.R.; Ganesh, P.; Chinmayee, P. Effect of plant density on yield parameters of cowpea (Vigna unguiculata L.) Int J of Chem Stud. 2020, 8(4), 344-347. [CrossRef]
- Liu, X.B.; Jin, J.; Wang, G.H.; Herbert, S.J. Soybean yield physiology and development of high-yielding practices in Northeast China. Field Crops Res. 2008, 105(3), 157–171. [Google Scholar] [CrossRef]
- Seran, T.H.; Brintha, I. Review on Maize-Based Intercropping. Agron J 2010, 9, 135–145. [Google Scholar] [CrossRef]
- Nur Arina, M.M.Y.; Surdiana, S.; Mohd, F.R. , Zulkefly, S. Radiation Dynamics on Crop Productivity in Different Cropping Systems. Int J of Agron 2021, 4570616, 8 pp. [CrossRef]
- Pepper, G.E.; Walker, J.T. Yield Compensation for Stand Deficiencies by Determinate and Indeterminate Growth-Habit Soybean. Agron J 1988, 80(1), 1–4. [Google Scholar] [CrossRef]
- Biswas, D.K.; Hauge, M.M.; Hamid, A.; Ahmed, J.U.; Rahman, M.A. Influence of Plant Population Density on Growth and Yield of two Black gram Varieties. J Agron 2002, 1(2-3), 83-85. [CrossRef]
- Kamara, A.Y.; Tofa, A.I. , Kyei-Boahen, S. ; Solomon, R.;, Ajeigbe, H.A.; Kamai, N. Effect of plant density on the performance of cowpea in Nigerian Savannahs. Exp Agric 2016, 54(01), 120–132. [Google Scholar] [CrossRef]
- Owusu, E.Y.; Akromah, R.; Denwar, N.N.; Adjebeng-Danquah, J.; Kusi, F.; Haruna, M. Inheritance of Early-Maturity in Some Cowpea [Vigna unguiculata (L.) Walp.] Genotypes under Rain fed Conditions in Northern Ghana. Adv Agric, 2018; 1–10. [Google Scholar] [CrossRef]
- Toungos, M.D.; Njodi, M.; Babayola, M.; Kashim, H. Multi-locational trial on SAMMAZ Maize (Zea mays (L)) Variety on Yield Performance in the Northern Guinea Savannah Zone, Nigeria. Int J Sci Res Eng Dev 2019, 2(2), 754–788. [Google Scholar]
- Teixeira, E.I.; George, M.; Herreman, T.; Brown, H.; Fletcher, A.; Chakwizira, E.; de Ruiter, J.; Maley, S.; Noble, A. The impact of water and nitrogen limitation on maize biomass and resource-use efficiencies for radiation, water and nitrogen. Field Crops Res 2014, 168, 109–118. [Google Scholar] [CrossRef]
- Du, X.; Wang, Z.; Lei, W.; Kong, L. Increased planting density combined with reduced nitrogen rate to achieve high yield in maize. Sci Rep 2021, 11, 358. [Google Scholar] [CrossRef] [PubMed]
- Xiaolei, S.; Zhifeng, W. The optimal leaf area index for cucumber photosynthesis and production in plastic green house. Acta Hort 2004, 633, 161–165. [Google Scholar] [CrossRef]
- Addai, I.K.; Alimiyawo, M. Graphical determination of leaf area index and its relationship with growth and yield parameters of Sorghum (Sorghum bicolor L. Moench) as affected by fertilizer application. J Agron. [CrossRef]
- Ahmed, M.E.N.; Abdelrhim, A.J. Effects of plant density and cultivar on growth and yield of cowpea [Vigna unguiculata (L.) Walp]. Aust J Basic App Sci, 2010; 4, 8, 3148–3153. [Google Scholar]
- Archana, R.; Sujit, S.R.; Girish, J. Physiological Parameters: Leaf Area Index, Crop Growth Rate, Relative Growth Rate and Net Assimilation Rate of Different Varieties of Rice Grown under Different Planting Geometrics and Depths in System of Rice Keeping. Int J Plant Sci 2017, 5(2), 19–25. [Google Scholar] [CrossRef]
- Rossini, M.A.; Maddonni, G.A.; Otegui, M.E. Inter-plant competition for resources in maize crops grown under contrasting nitrogen supply and density: Variability in plant and ear growth. Field Crops Res 2011, 121, 373–380. [Google Scholar] [CrossRef]
- Zhang, Y.; Xu, Z.; Li, J.; Wang, R. Optimum Planting Density Improves Resource Use Efficiency and Yield Stability of Rain fed Maize in Semiarid Climate. Front Plant Sci 2021, 12, 1–10. [Google Scholar] [CrossRef]
- Drewry, D.T.; Kumar, P.; Long, S.P. Simultaneous improvement in productivity, water use, and albedo through crop structural modification. Glob Chang Biol 2014, 20(6), 1955–1967. [Google Scholar] [CrossRef]
- Yuan, J.; Ott, T.; Hiltbrunne, A. Phytochromes and flowering: legumes do it another way. Trends Plant Sci, 2023; 28, 4, 379–381. [Google Scholar] [CrossRef]
- Bisikwa J, Kawooya R, Ssebuliba JM, Ddungu SP, Biruma M., Okello DK. Effect of plant density on the performance of local and elite cowpea [Vigna unguiculata (L.) Walp] varieties in Eastern Uganda. Afr J App Agric Sci Techno, 2014; 1, 1, 28–41.
- Iseki, K.; Ikazaki, K.; Batieno, B.J. Heterogeneity effects of plant density and fertilizer application on cowpea grain yield in soil types with different physicochemical characteristics. Field Crops Res 2022, 292, 3–10. [Google Scholar] [CrossRef]
- Garcia, N.; da-Silva, C.J.; Cocco, K.L.T.; Pomagualli, D.; de Oliveira, F.K.; da Silva, J.V.L.; de Oliveira, A.C.B.; Amarante, L.D. Waterlogging tolerance of five soybean genotypes through different physiological and biochemical mechanisms. Environ Exp Bot, 2020; 172, 1–33. [Google Scholar] [CrossRef]
- Ishiyaku, M. F.; Singh, B. B. ; Craufurd; P. Q. Inheritance of time to flowering in cowpea [Vigna unguiculata (L.) Walp.]. Euphytica, 2005; 142, 291–300. [Google Scholar]
- Ali, I.; Dov, P. Yields and forage nutritive quality of high-yielding dual-purpose cowpea [Vigna unguiculata (L). Walp.] Varieties in the Sahelian low-input cropping system. Afr J Agric, 2017; 12, 40, 2969-2975. [Google Scholar] [CrossRef]
- Bakal, H; Kenetli, A; Arioglu, H. The effect of plant density on pod yield and some agronomic characteristics of different growth-type peanut varieties (Arachis hypogaea L.) grown as a main crop. Field Crops Res, 2020; 25, 1, 92-99. [CrossRef]
- Chen, K.; Camberato, J.J.; Vyn, T.J. Maize grain yield and kernel component relationships to morpho-physiological traits in commercial hybrids separated by four decades. Crop Sci 2017, 57(3), 1641–1657. [Google Scholar] [CrossRef]
- Jin, J.; Liu, X.; Wang, G.; Mi, L.; Shen, Z.; Chen, X.; Herbert, S.J. Agronomic and physiological contributions to the yield improvement of soybean cultivars released from 1950 to 2006 in Northeast China. Field Crops Res 2010, 115(1), 116–123. [Google Scholar] [CrossRef]
- Bruns, H. Comparisons of single-row and twin-row soybean production in the mid-south. Agron J 2011, 103, 1308–1313. [Google Scholar] [CrossRef]
- Ramesh, K.G.; Pramila, B.; Udit, K. Studies on correlation and path analysis in cowpea [Vigna unguiculata (L.) Walp.]. Int J of Chem Stud, 2019; 7, 6 , 1264-1268. [Google Scholar]
- Atakora, K.; Essilfie, M.; Agyarko, K.; Dapaah, H.; Santo, K. Evaluation of Yield and Yield Components of Some Cowpea (Vigna unguiculata (L.) Walp) Genotypes in Forest and Transitional Zones of Ghana. Agric Sci, 2023; 14, 878-897. [Google Scholar] [CrossRef]
- Chaturvedi, G.S.; Aggarwal, P.K.; Sinha, S.K. Growth and yield of determinate and indeterminate cowpeas in dryland agriculture. J Agric Sci 1980, 94(01), 137. [Google Scholar] [CrossRef]
Figure 1.
(a) Effect of cowpea development type on grain yield at different plant densities. (b) Effect of growth habit on grain yield at different plant densities in cowpea. T1-33,333 plant ha-1; T2-66 666 plant ha-1; T3- 99 999 plant ha-1, T4-133 333 plant ha-1.
Figure 1.
(a) Effect of cowpea development type on grain yield at different plant densities. (b) Effect of growth habit on grain yield at different plant densities in cowpea. T1-33,333 plant ha-1; T2-66 666 plant ha-1; T3- 99 999 plant ha-1, T4-133 333 plant ha-1.
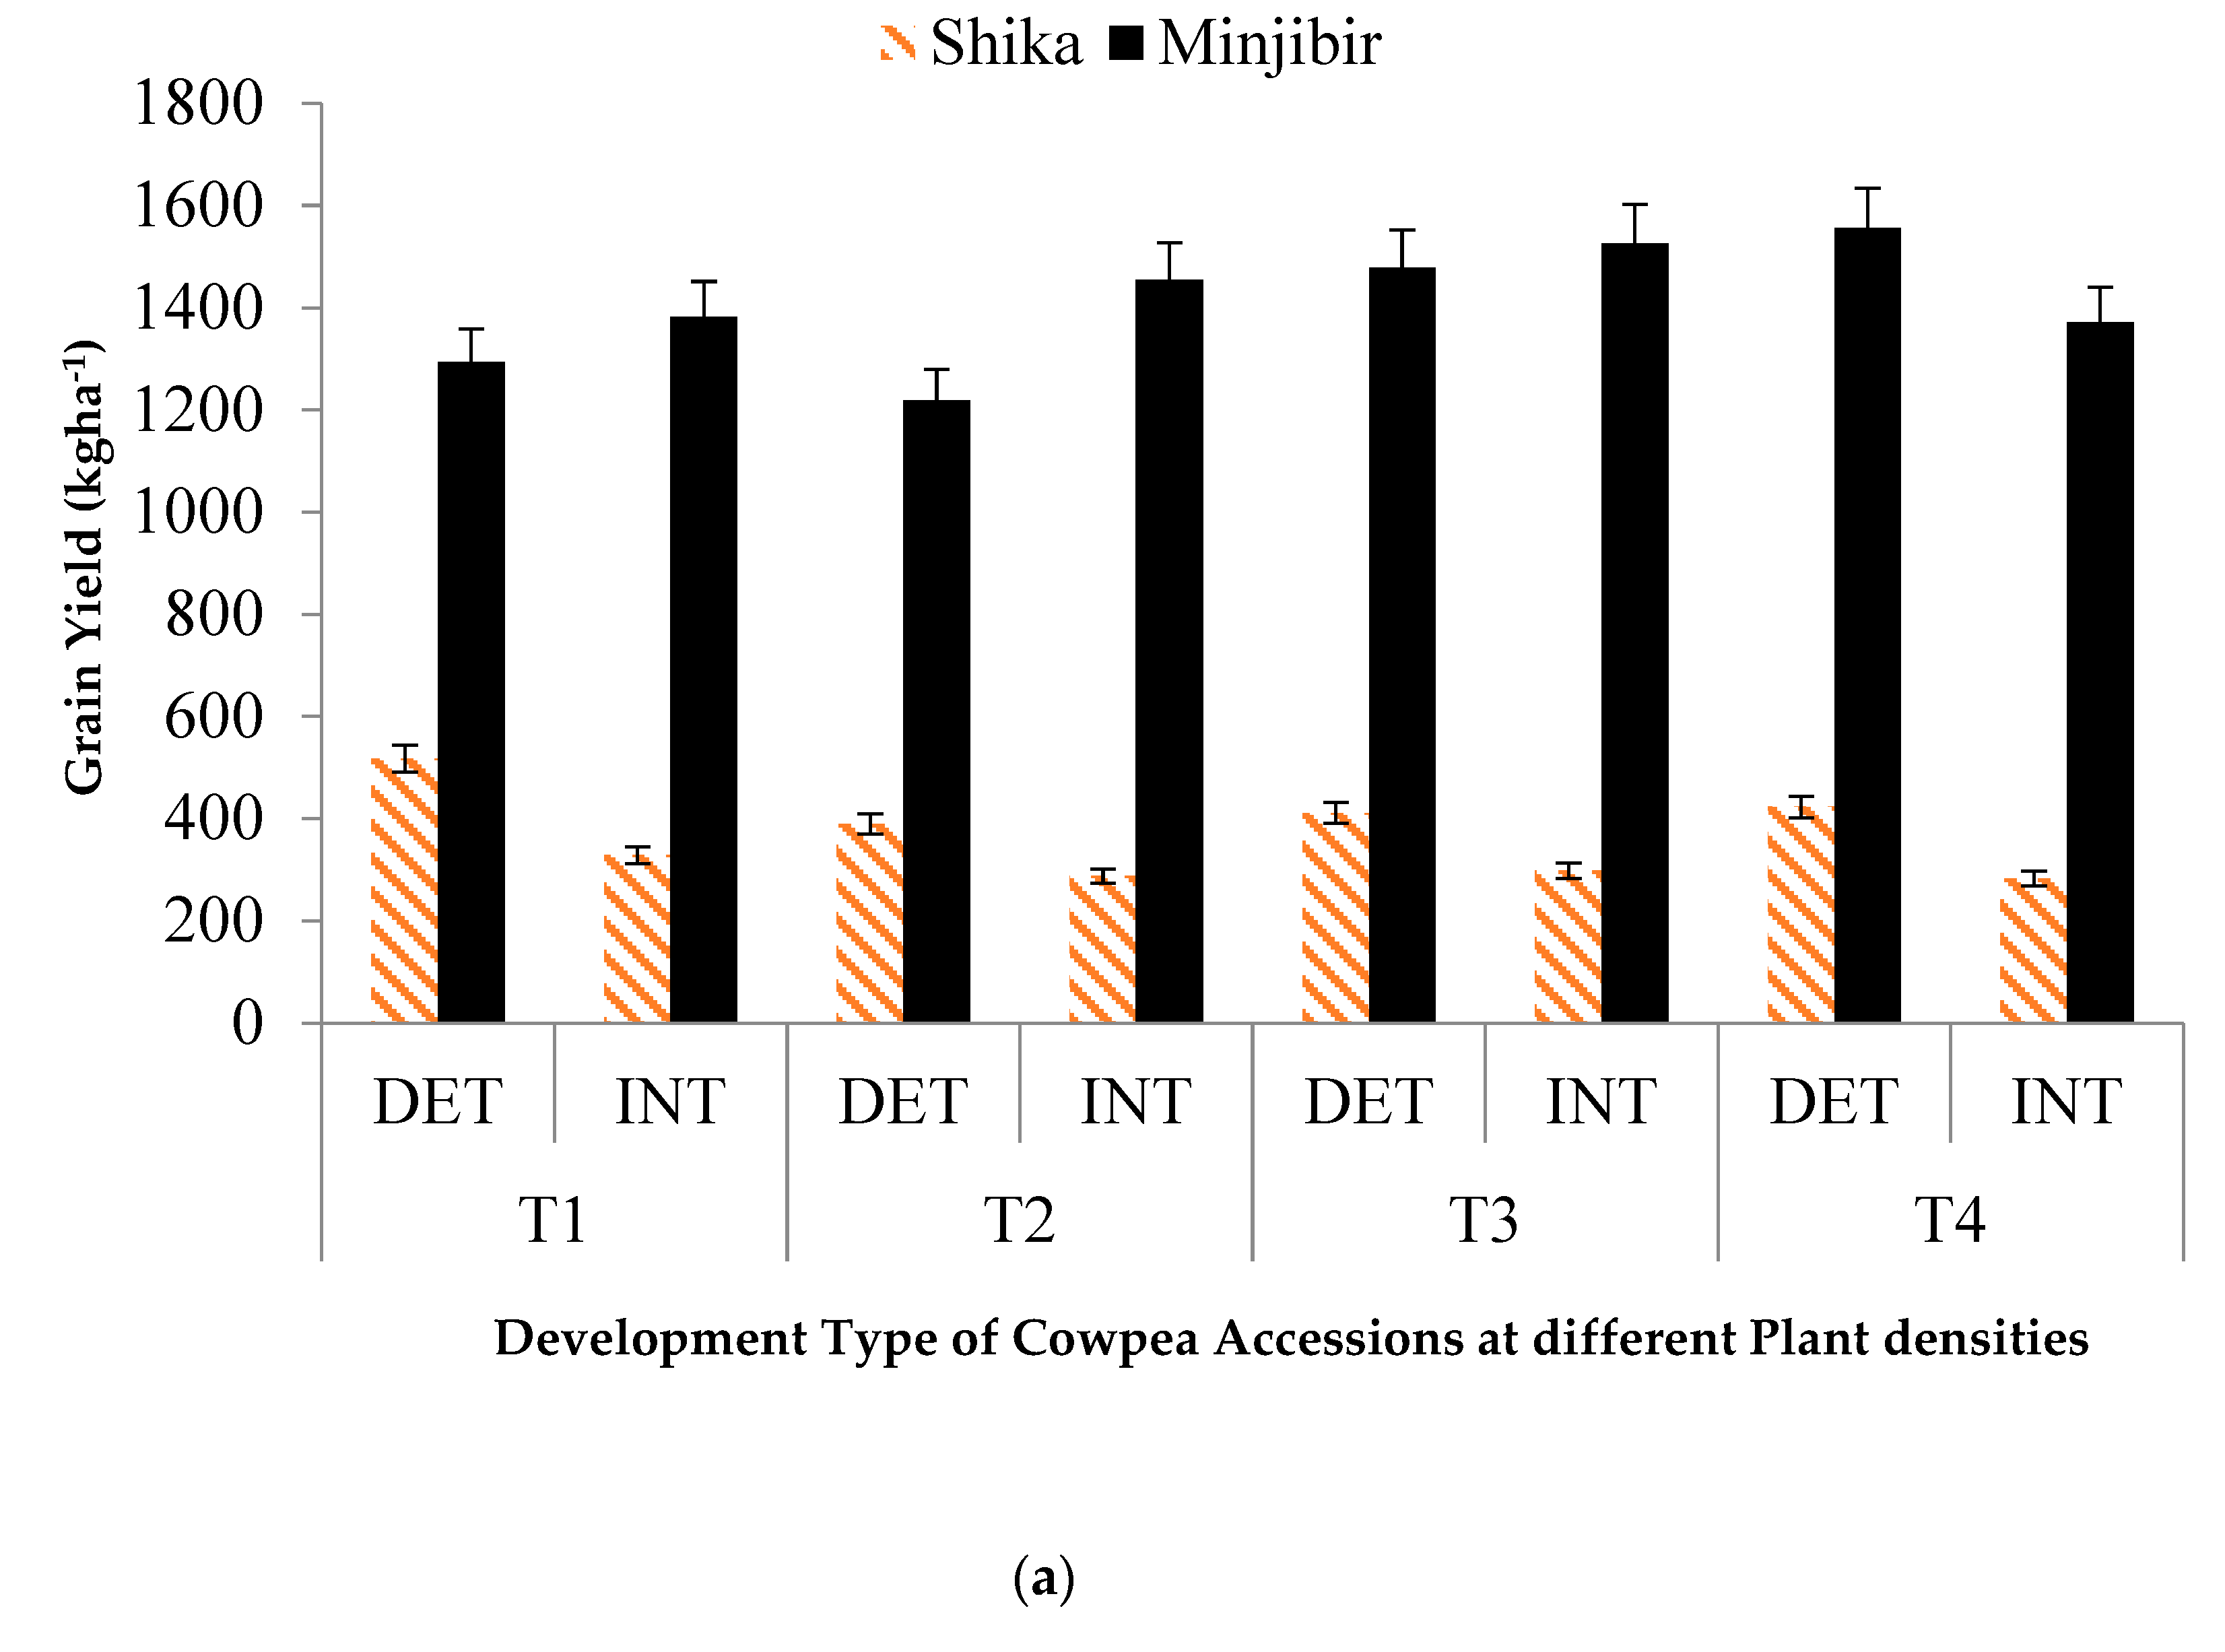
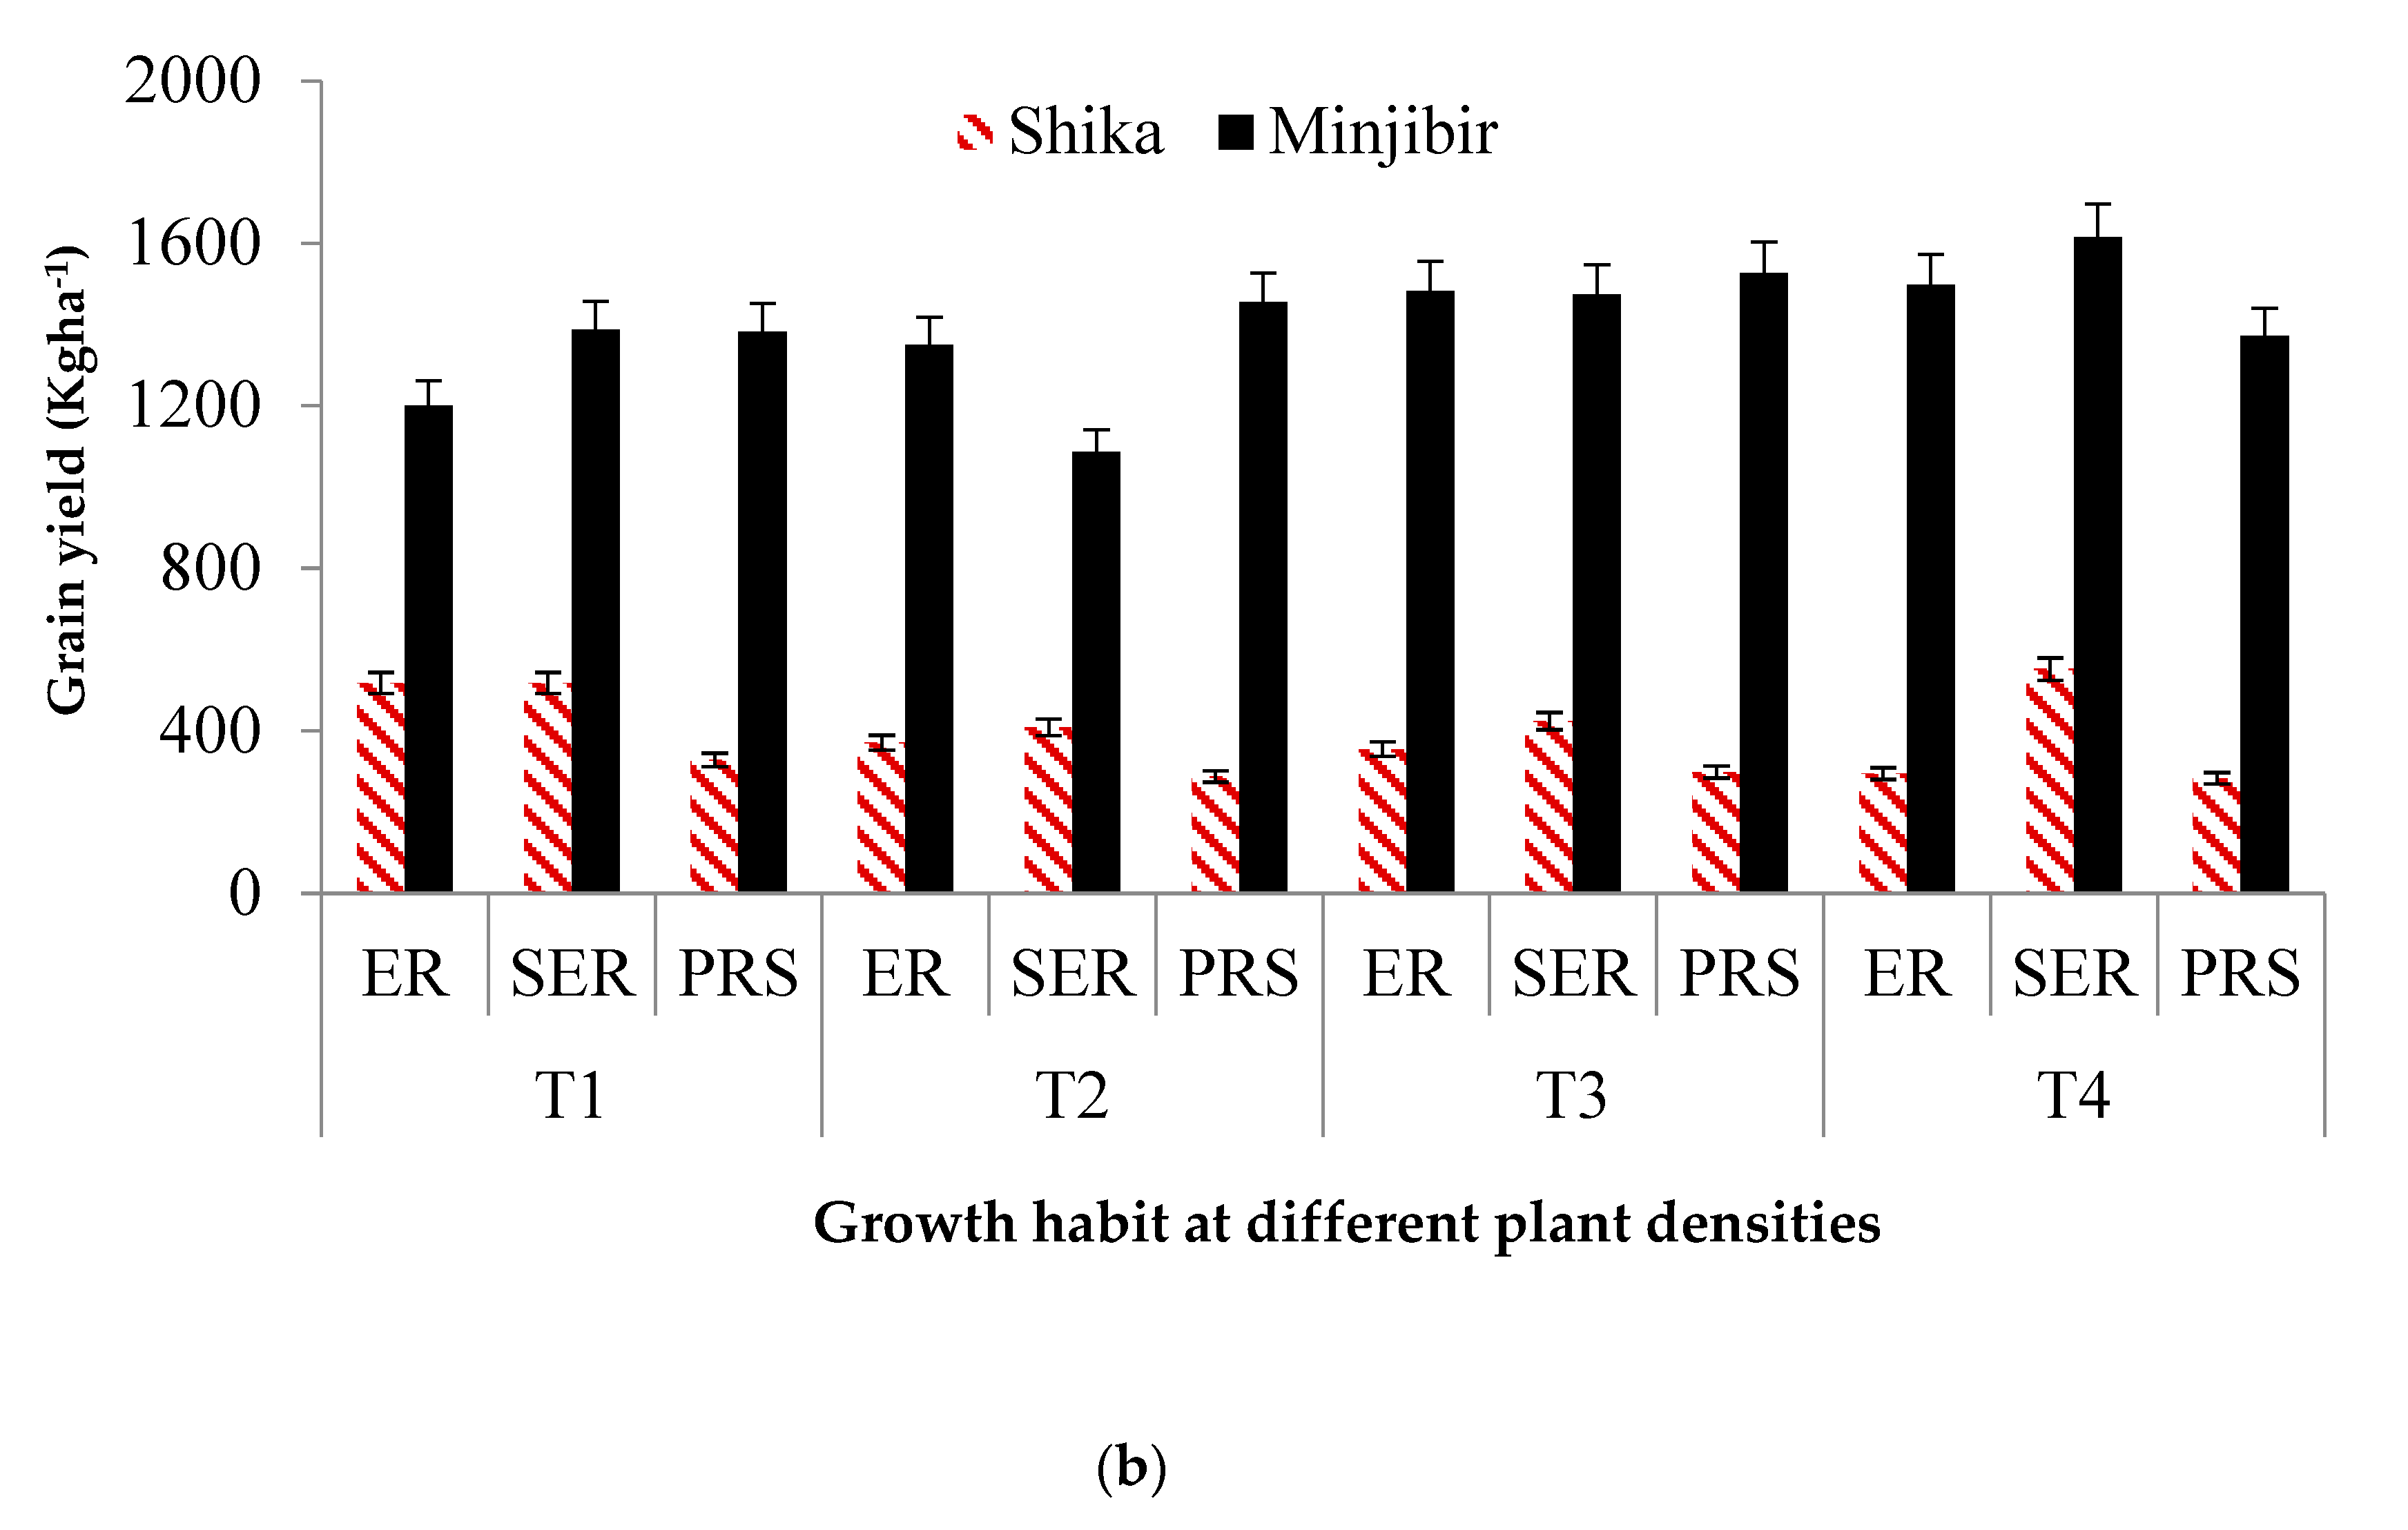
Table 1.
Physicochemical properties of the topsoil sampled from the experimental sites.
| Soil Property | Minjibir | Shika |
|---|---|---|
| Sand (%) | 70.00 | 32.00 |
| Clay (%) | 21.00 | 23.00 |
| Silt (%) | 9.00 | 45.00 |
| pH (H2O 1:1) | 5.50 | 6.30 |
| Organic Carbon (%) | 0.30 | 0.60 |
| Total N (%) | 0.02 | 0.05 |
| Mehlic P (ppm) | 9.00 | 12.80 |
| Ca (cmol kg-1) | 1.00 | 2.16 |
| Mg (cmol kg-1) | 0.25 | 0.83 |
| K (cmol kg-1) | 0.30 | 0.42 |
| Na (cmol kg-1) | 0.70 | 0.06 |
Source: IITA Analytical Services Laboratory (ASL), Ibadan, Nigeria.
Table 2.
Meteorological data collected in 2020 from Minjibir and Shika experimental stations.
| Weather Reports | Month | Location | |
|---|---|---|---|
| Minjibir | Shika | ||
| Solar Radiation (MJ/m²/day) | August | 15.76 | 15.22 |
| September | 17.24 | 19.02 | |
| October | 18.41 | 22.10 | |
| November | 18.12 | 20.12 | |
| December | 18.37 | 19.31 | |
| Minimum Relative Humidity (%) | August | 54.38 | 70.70 |
| September | 48.02 | 70.99 | |
| October | 26.28 | 44.19 | |
| November | 12.38 | 23.93 | |
| December | 9.03 | 18.37 | |
| Relative Humidity (%) | August | 94.96 | 98.66 |
| September | 95.53 | 98.62 | |
| October | 87.42 | 92.03 | |
| November | 72.48 | 64.60 | |
| December | 66.97 | 51.12 | |
| Minimum Temperature (⁰C) | August | 22.00 | 19.79 |
| September | 22.41 | 19.76 | |
| October | 20.74 | 18.91 | |
| November | 16.47 | 16.52 | |
| December | 11.47 | 15.78 | |
| Maximum Temperature (⁰C) | August | 29.74 | 26.50 |
| September | 31.91 | 29.61 | |
| October | 34.66 | 32.02 | |
| November | 31.49 | 31.49 | |
| December | 32.70 | 32.56 | |
| Rainfall (mm) | August | 8.57 | 5.56 |
| September | 5.64 | 26.45 | |
| October | 0.52 | 2.85 | |
| November | 0.00 | 0.03 | |
| December | 0.00 | 0.00 | |
Source: International Institute of Tropical Agriculture, Minjibir and Shika sub-stations.
Table 3.
Agronomic characteristics of cowpea accessions used in the experiment.
| Accession | Growth Pattern | Growth habit | Other Characteristics |
|---|---|---|---|
| IT93K-452-1 | Determinate | Erect | Extra-early maturing; good seed quality and field tolerance to major insect pests |
| IT99K-573-1-1 | Semi-determinate | Semi-erect | Medium-maturing; multiple disease-resistant especially Fusarium wilt, drought- tolerant, Striga and Alectra-resistant, yield (2.6 t ha1) |
| IT89KD-288 | Indeterminate | Prostrate | Nematode and Aphid resistant, yield (2t ha1) and good seed quality |
| IT98K-205-8 | Determinate | Semi-erect | Extra-early maturing |
| IT08K-150-27 | Semi-determinate | Erect | Medium-maturing and resistant to bacterial blight |
| DANILA | Indeterminate | Prostrate | Late-maturing with good fodder quality |
Source: Seed bank, International Institute of Tropical Agriculture, Kano station.
Table 4.
Main effects of plant density and accession on establishment count and stand count at harvest at Minjibir and Shika.
Table 4.
Main effects of plant density and accession on establishment count and stand count at harvest at Minjibir and Shika.
| Treatments | Establishment rate (%) | Stand count at harvest | ||||
|---|---|---|---|---|---|---|
| Minjibir | Shika | Pooled | Minjibir | Shika | Pooled | |
| Density (plants ha-1) | ||||||
| 33,333 | 90.00a | 89.03a | 89.51a | 20.83d | 16.61d | 18.72d |
| 66,666 | 89.41a | 85.86ab | 87.68a | 34.78c | 24.06c | 29.42c |
| 99,999 | 82.20b | 80.83b | 81.33b | 50.00b | 31.72b | 40.86b |
| 133,333 | 81.14b | 73.17c | 79.25b | 61.83a | 39.11a | 50.47a |
| Accession | ||||||
| IT89KD-288 | 87.01a | 84.15a | 85.58a | 41.58ab | 25.67ab | 33.63bc |
| IT93K-452-1 | 86.79a | 83.20a | 84.99a | 43.83a | 28.50a | 36.17ab |
| IT99K-573-1-1 | 86.75a | 80.14a | 83.44a | 39.67b | 28.58a | 34.13bc |
| IT98K-205-8 | 86.35a | 80.96a | 83.65a | 43.92a | 31.67a | 37.79a |
| IT08K-150-27 | 85.43a | 79.94a | 82.69a | 40.33b | 30.58a | 35.46ab |
| DANILA | 87.66a | 84.96a | 86.31a | 41.83ab | 22.25b | 32.04c |
| Level of Significance | ||||||
| DEN | *** | ** | *** | *** | *** | *** |
| ACS | ns | ns | ns | ns | * | * |
| EVR | ** | *** | ||||
| Interactions | ||||||
| DEN x ACS | ns | ns | ns | ns | ns | ns |
| DEN x EVR | ns | ns | ||||
| ACS x EVR | ns | *** | ||||
| ACS x DEN x EVR | ns | ns | ||||
| CV (%) | 5.9 | 15.5 | 11.78 | 38.7 | 41.0 | 44.8 |
1 Means followed by the same letter (s) within the same column are not significantly different at 5% level of probability. ∗∗∗p<0.001, ∗∗p<0.01, ∗p<0.05; ns=Not significant; DEN=Density; ACS=Accession; EVR=Environment; CV=Coefficient of Variability.
Table 5.
Main effects of plant density and accessions on leaf area index at Minjibir and Shika.
| Treatment | LAI 30DAS | LAI 45DAS | LAI 60DAS | ||||||
|---|---|---|---|---|---|---|---|---|---|
| Minjibir | Shika | Pooled | Minjibir | Shika | Pooled | Minjibir | Shika | Pooled | |
| Density (plants ha-1) | |||||||||
| 33,333 | 1.60b | 0.05a | 0.82b | 3.68b | 0.44a | 1.94c | 4.34a | 0.12b | 2.12a |
| 66,666 | 1.80b | 0.05a | 0.91b | 3.93b | 0.44a | 2.22b | 3.88a | 0.13b | 2.03a |
| 99,999 | 2.43a | 0.04a | 1.24a | 4.59a | 0.48a | 2.56a | 4.23a | 0.16ab | 2.26a |
| 133,333 | 2.56a | 0.05a | 1.30a | 4.64a | 0.50a | 2.63a | 4.28a | 0.18a | 2.25a |
| Accession | |||||||||
| IT89KD-288 | 2.44ab | 0.05b | 1.25b | 4.64ab | 0.47a | 2.55a | 4.62a | 0.15a | 2.39a |
| IT93K-452-1 | 2.14ab | 0.06a | 1.10bc | 4.71a | 0.45a | 2.58a | 4.32ab | 0.18a | 2.25ab |
| IT99K-573-1-1 | 1.45c | 0.04c | 0.75d | 3.05c | 0.45a | 1.75c | 3.67b | 0.15a | 1.91b |
| IT98K-205-8 | 1.75bc | 0.04c | 0.89cd | 3.93b | 0.49a | 2.21b | 4.37ab | 0.14ab | 2.25ab |
| IT08K-150-27 | 1.74bc | 0.05b | 0.90cd | 3.98b | 0.45a | 2.22b | 3.72b | 0.19a | 1.95b |
| DANILA | 3.01a | 0.04c | 1.52a | 4.94a | 0.49a | 2.71a | 4.39ab | 0.09b | 2.24ab |
| Level of Significance | |||||||||
| DEN | *** | ns | *** | *** | ns | *** | ns | * | ns |
| ACS | *** | *** | *** | *** | ns | *** | ns | * | ns |
| EVR | *** | *** | *** | ||||||
| Interactions | |||||||||
| DEN x ACS | ns | ns | ns | ns | ns | ns | ns | ns | ns |
| DEN x EVR | ns | ns | ns | ||||||
| ACS x EVR | *** | *** | ns | ||||||
| ACS x DEN x EVR | ns | ns | ns | ||||||
| CV (%) | 43.1 | 41.0 | 112.7 | 25.4 | 23.3 | 86.6 | 24.3 | 48.3 | 99.1 |
1 Means followed by the same letter (s) within the same column are not significantly different at 5% level of probability. ∗∗∗p<0.001, ∗∗p<0.01, ∗p<0.05; ns=Not significant; DEN=Density; ACS=Accession; EVR=Environment; CV=Coefficient of Variability.
Table 6.
Main effects of plant density and accession on intercepted photosynthetically active radiation (μ molm2s-1) at Minjibir and Shika.
Table 6.
Main effects of plant density and accession on intercepted photosynthetically active radiation (μ molm2s-1) at Minjibir and Shika.
| Treatment | IPAR 30DAS | IPAR 45DAS | IPAR 60DAS | ||||||
|---|---|---|---|---|---|---|---|---|---|
| Minjibir | Shika | Pooled | Minjibir | Shika | Pooled | Minjibir | Shika | Pooled | |
| Density (plants ha-1) | |||||||||
| 33,333 | 0.47b | 0.25a | 0.35b | 0.78b | 0.54a | 0.65b | 0.80a | 0.10ab | 0.44a |
| 66,666 | 0.43b | 0.28a | 0.37b | 0.79b | 0.54a | 0.67b | 0.76a | 0.11a | 0.44a |
| 99,999 | 0.63a | 0.27a | 0.45a | 0.85a | 0.60a | 0.72a | 0.79a | 0.09ab | 0.45a |
| 133,333 | 0.60a | 0.25a | 0.42a | 0.86a | 0.63a | 0.75a | 0.81a | 0.08b | 0.45a |
| Accession | |||||||||
| IT89KD-288 | 0.68a | 0.27a | 0.47a | 0.85a | 0.59a | 0.72a | 0.78a | 0.09b | 0.44a |
| IT93K-452-1 | 0.54b | 0.24a | 0.39b | 0.87a | 0.57a | 0.72a | 0.79a | 0.08b | 0.43a |
| IT99K-573-1-1 | 0.42c | 0.27a | 0.35b | 0.73c | 0.55a | 0.64b | 0.77a | 0.09b | 0.43a |
| IT98K-205-8 | 0.45c | 0.27a | 0.36b | 0.79b | 0.59a | 0.69ab | 0.81a | 0.09b | 0.45a |
| IT08K-150-27 | 0.46c | 0.25a | 0.36b | 0.82ab | 0.56a | 0.69ab | 0.81a | 0.08b | 0.44a |
| DANILA | 0.64ab | 0.28a | 0.46a | 0.86a | 0.61a | 0.73a | 0.79a | 0.13a | 0.46a |
| Level of Significance | |||||||||
| DEN | *** | ns | ** | *** | ns | *** | ns | ns | ns |
| ACS | *** | ns | *** | *** | ns | * | ns | * | ns |
| EVR | *** | *** | *** | ||||||
| Interactions | |||||||||
| DEN x ACS | ns | ns | ns | ns | ns | ns | ns | ns | ns |
| DEN x EVR | ns | ns | ns | ||||||
| ACS x EVR | ns | ns | ns | ||||||
| ACS x DEN x EVR | ns | ns | ns | ||||||
| CV (%) | 35.3 | 21.6 | 48.6 | 10.1 | 25.3 | 24.2 | 9.9 | 41.7 | 80.1 |
1 Means followed by the same letter (s) within the same column are not significantly different at 5% level of probability. ∗∗∗p<0.001, ∗∗p<0.01, ∗p<0.05; ns=Not significant; DEN=Density; ACS=Accession; EVR=Environment; CV=Coefficient of Variability.
Table 7.
Main effects of plant density and cowpea accession on days to first pod maturity and 95% pod maturity at Minjibir and Shika.
Table 7.
Main effects of plant density and cowpea accession on days to first pod maturity and 95% pod maturity at Minjibir and Shika.
| Treatments | Days to first flower | Days to 50% flower | ||||
|---|---|---|---|---|---|---|
| Minjibir | Shika | Pooled | Minjibir | Shika | Pooled | |
| Density (plants ha-1) | ||||||
| 33,333 | 90.78a | 71.17a | 81.97a | 104.22a | 90.94a | 97.28a |
| 66,666 | 91.94a | 74.72a | 83.33a | 104.00a | 91.00a | 97.72a |
| 99,999 | 91.72a | 74.28a | 83.14a | 105.71a | 90.28a | 97.58a |
| 133,333 | 90.94a | 74.89a | 82.92a | 103.61a | 90.39a | 97.22a |
| Accession | ||||||
| IT89KD-288 | 92.25a | 73.83bc | 83.04a | 105.67a | 93.00ab | 99.33a |
| IT93K-452-1 | 91.00ab | 72.33bc | 81.67a | 101.25b | 87.42c | 94.33c |
| IT99K-573-1-1 | 91.75ab | 73.58bc | 82.67b | 105.00a | 89.17c | 97.08b |
| IT98K-205-8 | 88.67b | 71.58c | 80.13a | 102.08b | 87.50c | 94.79c |
| IT08K-150-27 | 91.42ab | 76.00ab | 83.71a | 105.83a | 92.25b | 99.04a |
| DANILA | 93.00a | 78.25a | 85.63a | 105.67a | 94.58a | 100.13a |
| Level of Significance | ||||||
| DEN | ns | ns | ns | ns | ns | ns |
| ACS | ns | ** | *** | *** | *** | *** |
| EVR | *** | *** | ||||
| Interactions | ||||||
| DEN x ACS | ns | ns | ns | ns | ns | ns |
| DEN x EVR | ns | ns | ||||
| ACS x EVR | ns | ** | ||||
| ACS x DEN x EVR | ns | ns | ||||
| CV (%) | 3.7 | 6.5 | 11.5 | 2.4 | 3.7 | 7.6 |
1 Means followed by the same letter (s) within the same column are not significantly different at 5% level of probability. ∗∗∗p<0.001, ∗∗p<0.01, ∗p<0.05; ns=Not significant; DEN=Density; ACS=Accession; EVR=Environment; CV=Coefficient of Variability.
Table 8.
Main effects of plant density and cowpea accession on days to first pod maturity and 95% pod maturity at Minjibir and Shika.
Table 8.
Main effects of plant density and cowpea accession on days to first pod maturity and 95% pod maturity at Minjibir and Shika.
| Treatments | Days to first pod maturity | Days to 95% pod maturity | ||||
|---|---|---|---|---|---|---|
| Minjibir | Shika | Pooled | Minjibir | Shika | Pooled | |
| Density (plants ha-1) | ||||||
| 33,333 | 90.78a | 71.17a | 81.97a | 104.22a | 90.94a | 97.28a |
| 66,666 | 91.94a | 74.72a | 83.33a | 104.00a | 91.00a | 97.72a |
| 99,999 | 91.72a | 74.28a | 83.14a | 105.71a | 90.28a | 97.58a |
| 133,333 | 90.94a | 74.89a | 82.92a | 103.61a | 90.39a | 97.22a |
| Accession | ||||||
| IT89KD-288 | 92.25a | 73.83bc | 83.04a | 105.67a | 93.00ab | 99.33a |
| IT93K-452-1 | 91.00ab | 72.33bc | 81.67a | 101.25b | 87.42c | 94.33c |
| IT99K-573-1-1 | 91.75ab | 73.58bc | 82.67b | 105.00a | 89.17c | 97.08b |
| IT98K-205-8 | 88.67b | 71.58c | 80.13a | 102.08b | 87.50c | 94.79c |
| IT08K-150-27 | 91.42ab | 76.00ab | 83.71a | 105.83a | 92.25b | 99.04a |
| DANILA | 93.00a | 78.25a | 85.63a | 105.67a | 94.58a | 100.13a |
| Level of Significance | ||||||
| DEN | ns | ns | ns | ns | ns | ns |
| ACS | ns | ** | *** | *** | *** | *** |
| EVR | *** | *** | ||||
| Interactions | ||||||
| DEN x ACS | ns | ns | ns | ns | ns | ns |
| DEN x EVR | ns | ns | ||||
| ACS x EVR | ns | ** | ||||
| ACS x DEN x EVR | ns | ns | ||||
| CV (%) | 3.7 | 6.5 | 11.5 | 2.4 | 3.7 | 7.6 |
1 Means followed by the same letter (s) within the same column are not significantly different at 5% level of probability. ∗∗∗p<0.001, ∗∗p<0.01, ∗p<0.05; ns=Not significant; DEN=Density; ACS=Accession; EVR=Environment; CV=Coefficient of Variability.
Table 9.
Main effects of plant density and accession on total grain yield at Minjibir and Shika.
| Treatments | Grain yield (kg ha-1) | ||
|---|---|---|---|
| Minjibir | Shika | Pooled | |
| Density (plants ha-1) | |||
| 33,333 | 1323.43b | 315.83b | 819.63b |
| 66,666 | 1297.13b | 342.13b | 819.63b |
| 99,999 | 1494.26a | 438.52a | 966.39a |
| 133,333 | 1494.82a | 449.63a | 972.22a |
| Accession | |||
| IT89KD-288 | 1270.00b | 424.17b | 847.08a |
| IT93K-452-1 | 1338.89b | 375.42b | 857.15a |
| IT99K-573-1-1 | 1380.69b | 438.47ab | 909.58a |
| IT98K-205-8 | 1426.39ab | 393.75b | 910.07a |
| IT08K-150-27 | 1401.11b | 512.92a | 957.01a |
| DANILA | 1597.36a | 174.44c | 885.90a |
| Level of Significance | |||
| DEN | * | *** | *** |
| ACS | * | *** | ns |
| EVR | *** | ||
| Interactions | |||
| DEN x ACS | * | ns | ns |
| DEN x EVR | ns | ||
| ACS x EVR | *** | ||
| ACS x DEN x EVR | ns | ||
| CV (%) | 20.7 | 42.5 | 62.7 |
1 Means followed by the same letter (s) within the same column are not significantly different at 5% level of probability. ∗∗∗p<0.001, ∗∗p<0.01, ∗p<0.05; ns=Not significant; DEN=Density; ACS=Accession; EVR=Environment; CV=Coefficient of Variability.
Table 10.
Correlation coefficients of some growth characters with total grain yield of cowpea grown.at Minjibir and Shika, Nigeria.
Table 10.
Correlation coefficients of some growth characters with total grain yield of cowpea grown.at Minjibir and Shika, Nigeria.
| Character | Minjibir | Shika | Pooled |
|---|---|---|---|
| Establishment rate | 0.242* | 0.330* | 0.037ns |
| Stand count at harvest | 0.270* | 0.600* | 0.550** |
| Leaf area index | 0.427** | 0.254* | 0.840** |
| IPAR | 0.288* | 0.295* | 0.085** |
| Days to first flower | -0.150ns | -0.238* | -0.244** |
| Days to 50% flowering | -0.116ns | -0.431** | 0.588** |
| Days to first pod maturity | -0.007ns | -0.041ns | 0.814** |
| Days to 95% pod maturity | -0.116ns | -0.225ns | 0.832** |
* **p ≤ 0.001; *p ≤ 0.05; ns = not significant.
Disclaimer/Publisher’s Note: The statements, opinions and data contained in all publications are solely those of the individual author(s) and contributor(s) and not of MDPI and/or the editor(s). MDPI and/or the editor(s) disclaim responsibility for any injury to people or property resulting from any ideas, methods, instructions or products referred to in the content. |
© 2025 by the authors. Licensee MDPI, Basel, Switzerland. This article is an open access article distributed under the terms and conditions of the Creative Commons Attribution (CC BY) license (http://creativecommons.org/licenses/by/4.0/).
Copyright: This open access article is published under a Creative Commons CC BY 4.0 license, which permit the free download, distribution, and reuse, provided that the author and preprint are cited in any reuse.