Submitted:
04 March 2025
Posted:
05 March 2025
You are already at the latest version
Abstract
The present study was designed to establish the distribution pattern and immunohistochemical characteristics of phoenixin-immunoreactive (PNX-IR) urinary bladder-projecting neurons (UBPNs) of dorsal root ganglia (DRGs) in the female pigs. The investigated sensory cells were visualized with a retrograde tracing method using Fast Blue (FB), while their chemical profile(s) were disclosed with double-labelling immunohistochemistry using antibodies against PNX, calcitonin gene-related peptide (CGRP), calretinin (CRT), galanin (GAL), neuronal nitric oxide synthase (nNOS), pituitary adenylate cyclase-activating polypeptide (PACAP), somatostatin (SOM) and substance P (SP). Nearly half of UBPNs contained PNX (45%), and the majority of such encoded nerve cells were small in size (66%). The most numerous subpopulation of FB/PNX-positive neurons were those containing SP (71%). CGRP, GAL or PACAP were observed in a smaller number of PNX-containing UBPNs (50%, 30% or 25%, respectively), while PNX-positive sensory cells simultaneously immunostained with nNOS, CRT or SOM constituted a small fraction of all retrogradely-traced DRG neurons (15%, 6.5% or 1.6%, respectively). Furthermore, the numerical analysis of neurons expressing individual antigens, performed on 10-μm-thick consecutive sections, allows to state that studied sensory cells can be classified as neurons “coded” either by the simultaneous presence of SP/CGRP/PACAP/GAL, SP/CGRP/PACAP/NOS, SP/CGRP/PACAP/NOS/CRT and/or SP/CGRP/GAL/PACAP, or, as a separate population, those capable of SOM synthesis (SP/CGRP/SOM/PACAP/GAL-positive cells).The present study reveals the extensive expression of PNX in the DRG neurons projecting to the urinary bladder, indicating an important regulatory role of this neuropeptide in the control of physiological function(s) of this organ.
Keywords:
phoenixin
; urinary bladder
; sensory innervation
; dorsal root ganglia neurons
; neuropeptides
; immunohistochemistry
; pig
1. Introduction
Phoenixin (PNX), a bioactive peptide described nearly a decade ago [1], is highly conserved across mammalian and non-mammalian species, with phoenixin-14 and -20 being the most prominent bioactive forms giving rise to its physiological importance. PNX-14 is identical among multiple species including human, rat, mouse, dog and domestic pig, whereas PNX-20 differs in one amino acid between the coding region of human, canine or porcine sequences [1].
Initially, this substance was assigned an important function in the regulation of reproductive processes due to its high expression in the rodent hypothalamus and pituitary gland, where, acting by one of the orphan receptors, G protein-coupled receptor 173 (GPR173), PNX was able to induce an increase of gonadotropin releasing hormone (GnRH) receptor mRNA expression and potentiates GnRH receptor upregulation, followed by a subsequent release of luteinizing hormone (LH) or follicle stimulating hormone (FSH) from cultures of female pituitary cells [1,2]. Further studies have shown that the presence of this peptide is not only limited to the hypothalamo-pituitary complex, but PNX contributes to the central control of several other biological processes, including food intake, energy homeostasis, water balance, modulation of inflammation, memory or anxiety (for corresponding reviews see [3,4]).
It should be emphasized that PNX is present not only in brain structures, but the occurrence of this neuropeptide has also been confirmed in some nervous structures belonging to the peripheral nervous system (PNS). Currently available data, unfortunately concerning almost exclusively the rat PNS, have revealed the presence of PNX-immunoreactive (IR) cells and fibers in, among others, the spinal trigeminal tract and nucleus of the solitary tract, trigeminal and nodose ganglion cells, superficial layers of the dorsal horn (DH), and, last but not least, in afferent neurons of the dorsal root ganglia (DRGs) [5]. This latter observation was recently confirmed and extended by the results of our recent publication analyzing the intraganglionic arrangement and chemical coding of PNX-IR cells in DRGs of domestic pig [6]. Indirect confirmation of the sensory and/or autonomic projections of PNX-positive cells were the observations of Yosten and colleagues who demonstrated the presence of this peptide in a number of internal organs, such as esophagus, stomach, pancreas, spleen and lung [1].
The sensory component of the innervation of internal organs and its proper functioning is an indispensable part of many processes regulating the activity of the human and animal organism. For instance, DRG sensory neurons of the lumbo-sacral levels of the spinal cord are a crucial part of the afferent part of the micturition reflex arch. Spinal afferent neurons working together with sympathetic and parasympathetic efferent nerves, play an important role in reflex control of urine storage and micturition. As reported by Bossowska et al., the porcine bladder receives dual afferent innervation originating from sensory neurons located in the lumbar (L3-L6) and sacro-coccygeal (S3-S4 and Cq1) DRGs [7]. Since many urinary bladder disorders have a neurogenic background, it is important to unravel the physiological mechanisms regulating functions of this organ what, in turn, will allow us to better understand the pathological mechanisms causing dysfunctions of the urinary bladder.
As mentioned above, recent studies regarding PNX have shown that this peptide has widely been distributed in various peripheral tissues. However, until now there is no data regarding the presence of PNX in the urinary bladder or in neurons supplying this organ. Therefore, the present study has been designed to investigate i) the pattern of PNX-IR sensory neurons occurrence in DRGs associated with the urinary bladder; ii) pattern(s) of intraganglionic distribution of PNX-positive cells in the examined sensory ganglia, and, iii) pattern(s) of colocalization of PNX with other markers of sensory neurons (calretinin- CRT; calcitonin gene-related peptide-CGRP; galanin-GAL; neuronal nitric oxide synthase- nNOS; pituitary adenylate cyclase-activating polypeptide-PACAP; substance P-SP and somatostatin-SOM) in the bladder sensory neurons of the L as well as the S-Cq neuromeres of the porcine spinal cord. The domestic pig has been chosen for this study, as this species is increasingly employed as an animal model, because of the anatomical and physiological similarities to humans, in regard to both the structure and function of various tissues and organs [8,9,10].
2. Materials and Methods
2.1. Laboratory Animals
Investigations were conducted using six immature (8–12 weeks old, 15–20 kg body weight - b.w.) female pigs of the Large White Polish breed. All the animals originated from a commercial fattening farm and were kept under standard laboratory conditions. They were fed standard fodder (Grower Plus, Wipasz, Wadąg, Poland) and had free access to water. The animals were housed and treated in accordance with the rules of the Local Ethics Committee for Animal Experimentation in Olsztyn (affiliated to the National Ethics Commission for Animal Experimentation, Polish Ministry of Science and Higher Education; decision No. 40/2020 from 22 July 2020r). All efforts were made to minimize the number of animals used and their suffering. As the present study was designated to provide basic data concerning the chemical phenotypes of the subpopulation of PNX-containing DRG neurons involved in the afferent innervation of the urinary bladder wall under physiological conditions, the authors decided to focus on sexually immature female pigs in order to exclude any possible influences of reproductive hormones on studied tissues as identified in previous studies [11,12].
2.2. Anesthesia and Surgical Procedures
Before performing any surgical procedure, all the animals were pretreated with atropine (Polfa, Poland, 0.05 mg/kg b.w., subcutaneous (s.c.) injection) and azaperone (Stresnil, Janssen Pharmaceutica, Belgium; 0.5 mg/kg b.w., intramuscular (i.m.) injection). Next, buprenorphine (Bupaq, Richter Pharma AG, Austria, 20 μg/kg b.w.) was given in a single i.m. injection to abolish the visceral pain sensation. Thirty minutes later, to induce anesthesia, the main anesthetic drugs: sodium pentobarbital (Tiopental, Sandoz, Poland; 0.5 g per animal, administered according to the effect) and ketamine (Bioketan, Vetoquinol, Poland, 10 mg/kg b.w.) were given intravenously in a slow, fractionated infusion. The depth of anesthesia was monitored by testing the corneal reflex.
A mid-line laparotomy was performed in all the animals (n=6), and the urinary bladder was gently exposed to administer a total volume of 40 µL of 5% aqueous solution of the fluorescent retrograde tracer Fast Blue (FB; Dr K. Illing KG & Co GmbH, Gross Umstadt, Germany) into the right side of the urinary bladder body wall in multiple injections (1 μL of the dye solution per 1 injection with a Hamilton microsyringe equipped with a 26S gauge needle) under the serosa along the whole extension of the urinary bladder dome, keeping a similar distance between the places of injections. To avoid the leakage of the dye, the needle was left in each place of FB injection for about one minute. The wall of the injected organ was then rinsed with physiological saline and gently wiped with gauze. Three weeks later, which is a minimum time period needed for the retrograde tracer to be transported to the DRGs and label the urinary bladder-projecting neurons (UB-PNs) [7], the animals were deeply anaesthetized (following the same procedure as was described above) and, after the cessation of breathing, transcardially perfused with freshly prepared 4% paraformaldehyde in 0.1 M phosphate buffer (pH 7.4). Following the perfusion, all the animals were dissected and the bilateral DRGs were collected from all animals studied (as described previously in detail by Bossowska et al. [7]). Tissue samples were then postfixed by immersion in the same fixative (10 min at room temperature), washed several times in 0.1 M phosphate buffer (pH 7.4; 4 °C; twice a day for three days), and finally transferred to and stored in 18% buffered sucrose at 4 °C (two weeks) until sectioning.
2.3. Sectioning of the Tissue Samples and Estimation of the Total Number of UB-PNs
Samples of the ipsi- as well as the contralateral DRGs studied were pairwise located on a pre-cooled block made of a drop of the ‘optimal cutting temperature’ compound medium (OCT) in a manner allowing easy determination of the position of individual subdomains of DRG sections under the microscope. Frozen ganglia were cut with an HM525 Zeiss freezing microtome on transverse 10-µm-thick serial sections (four sections on each slide), mounted on chrome alum-gelatine-coated slides, air dried, and examined under the fluorescent Olympus BX61 microscope equipped with a filter set allowing the visualization of FB-positive (FB+) neurons. To determine the relative number of UB-PNs, FB-positive nerve cells were counted in every fourth section (to avoid double-counting of the same neuron; most neurons were approximately 40 μm in diameter) prepared from both the ipsi- and contralateral ganglia of all animals. Only neurons with a clearly visible nucleus were considered. The results were pooled for every experimental animal and statistically analyzed, and the mean number of FB-positive cells was calculated. The total number of FB+ nerve cells counted in all the ipsilateral and contralateral DRG from a particular animal as well as the relative frequencies of perikarya in the ganglia belonging to the individual neuronal size classes were presented as mean ± standard deviation (SD). The diameter of the FB+ perikarya was measured by means of an image analysis software (version 3.02, Soft Imaging System, Münster, Germany), and data were used to divide urinary bladder-projecting neurons into the three size-classes: small (average diameter up to 40µm), medium-sized (diameter 41–70 µm), and large afferent cells (diameter > 70 µm), while the statistical analysis was performed with Graph-Pad Prism 8 software (GraphPad Software, La Jolla, CA, USA).
2.4. Immunohistochemical Procedure
Double-immunofluorescence was performed on cryostat sections of both the ipsi- and contralateral DRGs where the UB-PNs were found, according to a previously described method [7]. Immunohistochemical characteristics of FB+ neurons were investigated using primary antibodies raised in different species. After immersion of the tissues in a blocking solution containing 0.1% bovine serum albumin, 1% Triton X 100, 0.01% sodium azide (NaN3), 0.05% thimerosal and 10% normal goat serum in 0.01 M phosphate-buffered saline (PBS) for 1h at room temperature to reduce non-specific background staining, sections were repeatedly rinsed in PBS, and then incubated overnight at room temperature with PNX antiserum applied in a mixture with antisera against: CGRP, CRT, GAL, nNOS, PACAP and SOM (the presence of all the above-mentioned active substances, or their marker enzymes (nNOS) was previously revealed in the porcine UB-PNs [7,13,14,15]. Primary antisera were visualized by fluorescein isothiocyanate (FITC)-conjugated rat- or mouse-immunoglobulin G (IgG) specific secondary antisera or biotin-conjugated anti-rabbit specific antiserum. The latter complexes were then visualized by application of CY3-conjugated streptavidin. The application of primary antisera raised in different species allowed to assess the coexistence of investigated biological active substances. Details concerning all the primary and secondary antibodies used in the present study are listed in Table 1.
Retrogradely labelled and double-immunostained DRG perikarya were evaluated under an Olympus BX61 microscope (Olympus, Hamburg, Germany) equipped with epifluorescence filter for FB and an appropriate filter set for CY3 or FITC. Relationships between immunohistochemical staining and FB distribution were examined directly by interchanging filters. The images were taken with an Olympus XM10 digital camera (Tokyo, Japan). The microscope was equipped with cellSens Dimension 1.7 Image Processing software (Olympus Soft Imaging Solutions, Münster, Germany).
2.5. Estimation of the Chemical Coding of the DRG UB-PNs
All sections containing FB+ neurons were used for double-immunohistochemical labelling. To determine the percentages of particular neuronal subpopulations, FB+ neuronal profiles were investigated with a combination of two primary antisera on each section (four sections per slide) and counted in both (ipsi- and contralateral) DRGs in each animal studied. Relationships between immunohistochemical staining and FB distribution were examined directly by interchanging filters. To avoid double counting of the same neurons, the retrogradely labeled neuronal cells were counted in every fourth section (only neurons with clearly visible nucleus were included). The colocalization pattern(s) of PNX with other biologically active substances in FB+ neurons were examined on consecutive sections. The percentages of FB+ neurons immunopositive to the individual biologically active substances or their marker enzyme were pooled in all the animals and presented as mean ± SD, with “n” referring to the number of animals. Morphometric data relative to each neuronal class were compared within each animal and among the animals and were analyzed by the student’s two-tailed t test for unpaired data using GraphPad PRISM 8.0 software (GraphPad Software, La Jolla, CA, USA). The differences were considered to be significant at p < 0.05.
2.6. Control of Specificity of the Tracer Staining and Immunohistochemical Procedures
The FB injection sites and the tissues adjacent to the urinary bladder were carefully examined macroscopically prior to the collection of DRGs for examination. The injection sites were easily identified by the yellow-labeled deposition left by the tracer within the bladder wall. Moreover, the injection sites were also observed in the UV lamp rays in the dark room. The tissues adjacent to the bladder were not found to be contaminated with the tracer. To verify that the tracer had not migrated into the urethra, we analyzed, in cryostat sections and by means of the H&E staining technique (IHC WORLD LLC, Woodstock, NY, USA), possible signs of leakage of the tracer to the junction between the urinary bladder trigone and cranial portion of the urethra. No contamination of the urethra with a tracer was found in all the animals studied. All above-mentioned procedures excluded any leakage of the tracer and validated the specificity of the tracing protocol.
To test the specificity of primary antibodies and staining reaction, preincubation tests were performed with the sections from DRG ganglia of the control pigs. Preabsorption for the neuropeptide antisera (20 μg of appropriate antigen per 1 ml of the corresponding antibody at working dilution; all antigens purchased from Peninsula, SWANT, Sigma, Phoenix - Table 2), as well as an omission and replacement of the respective primary antiserum with the corresponding nonimmune serum completely abolished immunofluorescence and eliminated specific labeling.
3. Results
3.1. Distribution Pattern and Morphometrical Characteristics of FB+ Neurons in the Porcine DRGs
Three weeks after the administration of FB into the wall of the right side of the urinary bladder, FB-containing sensory neurons were found bilaterally in DRGs of all animals studied. The total number of FB+ nerve cells counted in all DRGs per animal ranged from 468 to 593 retrogradely labelled perikarya (527 ± 62.7; mean ± SD). It should be stressed, that a distinct “lateralization” in the localization of UB-PNs was observed in terms of their distribution ipsi- and contralaterally to the sites of FB injections into the bladder wall, with a distinct predominance of FB+ nerve cells in the ipsilateral ganglia. The number of FB+ neurons per animal ranged from 428 to 534 retrograde labelled perikarya (479 ± 53.1) in the DRGs of the right side of the body, and from 40 to 59 FB-positive neurons (48 ± 9.8) in the left ones. Approximately 91% of all FB-positive spinal sensory neurons (90.9 ± 0.7%) were located in the ipsilateral ganglia, while only 9% (9.1 ± 0.7%) of retrograde labelled bladder sensory nerve cells was observed in contralateral DRGs.
Retrogradely labelled cells were found to form two distinct “centers”, located bilaterally in DRGs of the L3-L6 as well as S3-S4 and Cq1 neuromeres of the spinal cord. Urinary bladder-projecting afferent cells were, however, virtually absent from the bilateral S1 and S2 DRGs. The vast majority of traced neurons (87.8 ± 1.2% and 86.3 ± 1.9%; in DRGs on the right and left side of the body, respectively) were located in S3-S4 and in the Cq1 ganglia, while the remainder of FB+ nerve cells (12.2 ± 1.2% and 13.7 ± 1.9%) were found in the L3-L6 ganglia. Details concerning the relative percentages of retrogradely labelled sensory neurons located in the individual ipsilateral and contralateral DRGs are presented in Table 3 and Figure 1.
In terms of the diameter of the UB-PNs and their intraganglionic distribution pattern, they were, in fact, almost identical to those obtained in our previous study (for detailed description, see [15].
3.2. Distribution Pattern and Morphometrical Characteristics of FB+ and PNX-containing Sensory Neurons in the porcine DRGs.
3.2.1. Distribution Pattern of FB+/PNX+ Neurons
In general, PNX+ UB-PNs were observed bilaterally in all the studied DRGs. The total number of FB+/PNX+ sensory neurons per animal ranged from 214 to 262 (245.3 ± 27.5), representing 45.3 ± 4.6% of all UB-PNs counted in the investigated DRG. The vast majority of FB+ and PNX-containing sensory neurons were present in the ipsilateral DRGs (82.8 ± 3.3%) while in the contralateral ones, such encoded UB-PNs were observed in much smaller number (17.2 ± 3.3%). Furthermore, in both the ipsilateral and contralateral DRGs, PNX+ sensory nerve cells were present in the L (80.9 ± 2.0% and 19.1 ± 2.0%) as well as in the S/Cq (82.9 ± 3.1% and 17.1 ± 3.1%) population of retrogradely labelled nerve cells and there were no significant differences in the number of UB-PNs immunolabelled for PNX between the ipsi- and contralateral DRG studied in these two bladder-projecting “centers”. Nevertheless, it should be noted that the lumbar DRGs contained a significantly greater number of FB+/PNX+ sensory neurons (59.5 ± 4.1%) compared to the DRGs forming the S-Cq-projecting “center” (41.2 ± 5.8%).
3.2.2. Morphometrical Characteristics of FB+/PNX+ DRG Neurons
Regarding the diameter of PNX+ UB-PNs, only two classes of these nerve cells have been determined in all the DRGs examined. In both the ipsilateral and contralateral sensory ganglia, a larger subpopulation of small-sized cells (average diameter up to 40 µm; 65.8 ± 2.0% and 67.1 ± 9.9%, respectively) and the less numerous subset of medium-sized perikarya (diameter 41–70 µm; 34.2 ± 2.0% and 32.9 ± 9.9%, respectively) have been observed, while the immunoreactivity to PNX was absent in large UB-PNs (diameter >70 µm) of all the DRGs studied. Although in both the L and S-Cq DRGs the majority of retrogradely labelled and simultaneously PNX+ neurons belonged to the subset of small-diameter cells (62.2 ± 8.9% and 71.5 ± 9.3%, respectively), when compared to the number of medium-sized perikarya (37.8 ± 8.9% and 28.5 ± 9.3%, respectively), it should be stressed that in the S-Cq ganglia, small-sized neurons constituted a slightly larger population of PNX-containing cells than the fraction of medium-diameter neurons.
3.2.3. Intraganglionic Distribution Patterns of FB+/PNX+ Neurons
To establish the intraganglionic distribution pattern(s) of PNX+ UB-PNs in all the DRGs tested, the "mask" shown in Figure 2 was applied to each ganglionic section analyzed.
PNX-containing sensory nerve cells were present in all five ganglia domains analyzed in this study. In the ipsilateral as well as the contralateral DRGs examined, the majority of PNX-containing UB-PNs were unevenly distributed, as isolated cells scattered throughout the individual ganglionic subdomains. Only a few retrogradely labelled PNX+ nerve cells in the ipsilateral ganglia were found to form small, loose clusters up to three neurons.
In the right (ipsilateral) DRGs, a distinct accumulation of the retrogradely labelled PNX-positive cells was found in the caudal (Cd; 36.7 ± 3.6%) and in the middle (Md) as well as the cranial (Cr) ganglionic regions (22.3 ± 1.6% and 20.2 ± 4.2%, respectively), while such coded cells were less numerous in the peripheral (P) and central (Cn) domains (12.2 ± 2.1% and 8.6 ± 0.8%, respectively). The distribution pattern of FB+ PNX-containing nerve cells in the DRG contralateral to the site of tracer injections was different to that seen in the ipsilateral ones: the majority of FB+/PNX+ nerve cell bodies were present in the Cd and P subdomains (26.5 ± 1.5% and 24.8 ± 1.6%, respectively), with the rest of retrogradely labelled PNX+ perikarya dispersed quite evenly in the Md, Cn and Cr regions of the ganglion (18.1 ± 4.3%, 17.4 ± 1.4% and 13.2 ± 1.2%, respectively). Details concerning the intraganglionic distribution pattern of retrogradely labelled PNX-positive cells in the individual domains of the ipsi – and contralateral DRGs studied are shown in Table 4.
3.3. Immunohistochemical Characteristic of PNX-Containing UB-PNs in DRG Studied
Two main subpopulations of FB+/PNX+ DRG neurons have been revealed using the technique of double immunohistochemical staining. The vast majority (72.3 ± 2.7%) of all retrogradely labeled, PNX-positive cells also showed co-occurrence of other substances investigated, although the numbers of cells in individual subpopulations differed from each other. The remaining FB+ neurons (27.7 ± 2.7%) were immunopositive only to PNX.
3.3.1. Cells co-localizing PNX and SP
The largest subpopulation of PNX+ DRG bladder sensory nerve cells were neurons containing simultaneously SP (Figure 3 A1-A4). Such coded cells accounted for 71.1 ± 5.8% of the total population of PNX-IR UB-PNs found in all examined DRGs, while just over a quarter of them (28.9 ± 5.8%) did not concurrently express SP. Statistically significant differences in the numbers of FB+/PNX+/SP+ neurons were neither observed between the ipsi- and contralateral DRGs studied (67.5 ± 5.2% and 76.6 ± 2.6%, respectively), nor between the DRGs forming L and S-Cq bladder-projecting “centers” (52.2 ± 1.1% and 70.1 ± 3.5%, respectively).
Regarding their diameter, the most numerous subset of simultaneously PNX- and SP-positive UB-PNs was that of small-sized cells (Figure 3 A1-A4; 73.3 ± 4.7%), while such coded medium-sized neurons were found to be distinctly less numerous (26.7 ± 4.7%). Although the differences in the numbers of both small PNX/SP-IR bladder-projecting sensory neurons (70.1 ± 5.2% and 65.3 ± 2.9%) and those of the medium size (29.9 ± 5.2% and 34.7 ± 2.9%) were statistically insignificant between the L and the S-Cq DRGs, in the ipsilateral ganglia the statistically significant higher number of the small-sized (85.1 ± 3.9%) and the distinctly lower number of medium-sized (14.9 ± 3.9%) PNX/SP-IR traced neurons were observed when compared with the contralateral ones (70.1 ± 5.2% and 29.9 ± 5.2%, respectively).
In both the contra- and the ipsilateral DRGs, the majority of FB+/PNX+/SP+ neurons were unevenly distributed, usually as isolated cells scattered throughout the individual ganglionic subdomains. Only a few PNX+/SP+ UB-PNs were found to form small, loose clusters of up to three neurons. In the contralateral DRGs, a distinct accumulation of the retrogradely labelled PNX+/SP+ cells was found in the P and the Cd ganglion domains (32.8 ± 2.3% and 31.9 ± 1.9%, respectively), while such coded UB-PNs were less numerously present in the Md, the Cr and the Cn part of the ganglia (14.1 ± 3.0%, 13.3 ± 4.6% and 7.9 ± 1.6%, respectively). In the ipsilateral ganglia, the majority of PNX+ UB-PNs containing SP were located in the Cd and the Cr domains of DRG (36.3 ± 6.9% and 26.7 ± 6.0%, respectively), while a smaller number of retrogradely labelled PNX+/SP+ nerve cells was found in the P, the Md and the Cn parts (15.1 ± 4.9%, 14.2 ± 1.8% and 7.7 ± 2.9%, respectively) of all DRG studied. It should be stressed that in comparison to the contralateral DRGs, the distinctly higher number of such coded UB-PNs was observed in the Cr domain, while in the P part of the ganglion the number of retrogradely labelled PNX+/SP+ nerve cells were present in a significantly smaller number. Distribution pat-tern of PNX+ and SP-containing bladder-projecting sensory neurons in the different domains of DRG studied has been showed in Table 5.
3.3.2. Cells co-localizing PNX and CGRP
The second most numerous subpopulation of FB+/PNX+ sensory neurons in the investigated DRGs was that containing CGRP (50.1 ± 5.4%; Figure 3 B1-B4) and being present in all the selected contra- and the ipsilateral DRGs (51.8 ± 4.1% and 50.2 ± 6.3%) of the L and the S-Cq projecting “centers” (48.2 ± 4.9% and 51.4 ± 6.1%). No statistically significant differences were observed in the number of PNX+/CGRP+ UB-PNs between the ipsi- and contralateral ganglia as well as between L and S-Cq DRGs studied.
FB+ and PNX/CGRP-containing DRG neurons belonged to two classes of afferent perikarya. The most numerous subpopulation of this type of nerve cells found in all DRGs studied was that of small-sized (65.8 ± 3.9%), while the medium-sized sensory neurons were found to be distinctly less numerous (Figure 3 B1-B4; 34.2 ± 3.9%). It should be noted that significantly more small-sized neurons and correspondingly fewer medium-sized nerve cells were observed in the ipsilateral ganglia (74.5 ± 5.2% and 25.5 ± 5.2%) compared to the contralateral DRGs (59.7 ± 3.4% and 40.3 ± 3.4%).
In both the contra- and the ipsilateral DRGs, the majority of FB+/PNX+ neurons simultaneously containing CGRP were unevenly distributed, visible usually as isolated cells, scattered throughout the individual ganglionic subdomains. In the contralateral DRGs, a distinct accumulation of the retrogradely labelled PNX+/CGRP+ cells was found in the Cd and the P ganglion domains (30.6 ± 2.1% and 29.1 ± 1.5%), while such coded UB-PNs were less numerously present in the Md, the Cr and the Cn part of the ganglia (16.1 ± 8.7%, 15.4 ± 3.5% and 8.8 ± 1.1%, respectively). In the ipsilateral ganglia, the majority of PNX+ UB-PNs containing CGRP were located in the Cd, the Md and the Cr domains of DRG (33.8 ± 3.5%, 24.3 ± 3.6% and 22.9 ± 4.8%, respectively), while a smaller number of retrogradely labelled PNX+/CGRP+ nerve cells was found in the Cn and the P parts (11.7 ± 0.8% and 7.3 ± 1.6%) of all DRGs studied. It should be stressed that in comparison to the contralateral DRGs, the distinctly higher number of such coded UB-PNs was observed in the Cn domain of the ipsilateral DRGs. Distribution pattern of PNX+ and CGRP-containing bladder-projecting sensory neurons in the different domains of studied DRGs has been shown in Table 6.
3.3.3. Cells Co-Localizing PNX and GAL
The third most abundant subpopulation of PNX+ cells consisted of neurons co-expressing GAL (29.7 ± 2.1%; Figure 3 C1-C4), and being present in both the ipsi- and contralateral DRGs studied (37.2 ± 5.3% and 52.9 ± 8.65). Although the differences in the numbers of PNX/GAL-IR bladder-projecting sensory neurons were statistically insignificant between the ipsi- and the contralateral sensory ganglia, it should be stressed that in the S-Cq DRGs a statistically significant higher number of such coded nerve cells (44.4 ± 3.2%) have been observed when compared with the lumbar ones (21.7 ± 5.3%).
Regarding their diameter, all PNX/GAL-positive UB-PNs belonged exclusively to the subpopulation of small-sized cells (Figure 3 C1-C4 - small arrows).
In both the contra- and ipsilateral DRGs, the distribution of retrogradely labelled PNX+/GAL+ neurons was virtually restricted to only two domains of DRGs studied: the Cd and the Cr regions (55.8 ± 5.8% vs. 62.1 ± 2.2% and 44.2 ± 5.8% vs. 37.9 ± 2.2%, respectively). This pattern of intraganglionic distribution was basically repeated in the L as well as the S-Cq UB-PNs (Cd - 52.9 ± 3.6% vs. 59.4 ± 1.3% and Cr – 47.1 ± 3.6% vs. 40.6 ± 1.3%, respectively). No statistically significant differences in the number of PNX+/GAL+ UB-PNs were observed in the above-mentioned domains between the ipsi- and contralateral ganglia as well as between L and S-Cq DRGs studied. The distribution pattern of FB+/PNX+/GAL+ sensory neurons in particular domains of studied ganglia has been summarized in Table 7.
3.3.4. Cells co-localizing PNX and PACAP
PACAP was found in 25.0 ± 1.6% (Figure 3 D1-D4) of all PNX-containing UB-PNs and it has been present in all the selected ipsi- as well as the contralateral DRGs (43.4 ± 3.9% and 38.8 ± 2.6%, respectively). Although the differences in the numbers of PNX/PACAP-IR bladder-projecting sensory neurons were statistically insignificant between the ipsi- and the contralateral sensory ganglia, it should be stressed that in the S-Cq DRGs the statistically significant higher number of such coded nerve cells (40.9 ± 4.4%) have been observed when compared with the L ones (7.5 ± 0.8%).
PNX-positive UB-PNs containing PACAP belonged mainly to the subpopulation of small-sized cells (Figure 3 D1-D4-short arrows; 71.3 ± 2.6%), while the number of medium-sized neurons (28.7 ± 2.6%) was distinctly smaller. Although the differences in the numbers of both small PNX/PACAP-IR bladder-projecting sensory neurons (63.6 ± 4.6% and 61.6 ± 2.3%) and those of the medium size (36.4 ± 4.6% and 38.4 ± 2.3%) were statistically insignificant between the L and the S-Cq DRGs, in the ipsilateral ganglia the noticeably higher number of the small-sized (73.5 ± 3.6%) and the distinctly lower number of medium-sized (26.5 ± 3.6%) PNX- and PACAP-IR FB+ neurons were observed when compared with the contralateral ones (44.6 ± 4.9% and 55.4 ± 5.2%).
In terms of the intraganglionic distribution pattern, the majority of FB+/PNX+ neurons simultaneously containing PACAP were dispersed inside the ganglia, and in both the contra- and the ipsilateral DRGs, the largest number of such encoded nerve cells was observed in the Cd region (42.9 ± 2.3% vs. 36.5 ± 9.0%) of the ganglion. For the remaining DRG domains, in the contralateral DRGs, PNX/PACAP-positive UB-PNs were less numerously present in the Md, the P, the Cr and the Cn part of the ganglia (24.6 ± 3.3%, 15.5 ± 1.3%, 11.4 ± 3.3% and 5.6 ± 4.8%, respectively). In the ipsilateral ganglia, a smaller number of retrogradely labelled PNX+/PACAP+ nerve cells was found in the Cr, the Md, the P and the Cn parts (23.7 ± 6.0%, 16.6 ± 3.2%, 13.7 ± 2.8% and 9.5 ± 1.9%, respectively) of all
DRGs studied. It should be stressed that in comparison to the contralateral DRGs, the distinctly smaller number of such coded UB-PNs was observed in the P and the Md domain of the ipsilateral DRGs. Distribution pattern of PNX+ and PACAP-containing bladder-projecting sensory neurons in the different domains of investigated DRGs has been summarized in Table 8.
3.3.5. Cells co-localizing PNX and nNOS
PNX+/nNOS-containing cells constituted one of the smaller subpopulation of all PNX-IR and retrograde traced neurons in DRGs (14.9 ± 2.1%; Figure 3 E1-E4 ), and were observed in all the ipsi- and the contralateral DRGs studied constituting 15.9 ± 5.9% and 6.8 ± 2.5% of all PNX-positive UB-PNs, respectively. Additionally, the L DRGs contained significantly higher number of PNX/nNOS-positive retrogradely traced cells (16.4 ± 2.4%) than S-Cq ganglia (7.7 ± 3.0%).
In general, nNOS was observed in two size classes of PNX+ afferent perikarya, being present in 58.4 ± 7.7% of small- and 41.6 ± 7.7% of medium-sized nerve cells, respectively. Although the differences in the numbers of both small PNX/nNOS-IR bladder-projecting sensory neurons (Figure 3 E1-E4-short arrows) and those of the medium size were statistically insignificant between the L (64.6 ± 5.0% and 52.7 ± 6.3%) and the S-Cq (35.4 ± 5.0% and 47.3 ± 6.3%) DRGs, in the ipsilateral ganglia the statistically significant higher number of the small-sized (63.5 ± 4.2%) and the distinctly lower number of medium-sized (36.5 ± 4.2%) PNX and nNOS-IR FB+ neurons were observed when compared with the contralateral ones (53.5 ± 3.9% and 46.5 ± 3.9%, respectively).
In the ipsilateral ganglia, PNX+/nNOS+ UB-PNs were dispersed inside the ganglia, mainly in its Cd (32.6 ± 2.7%) and in the Md (30.3 ± 2.7%) regions. The remainder of nNOS-containing, PNX+ nerve cells were present in the Cr, Cn and P domains of DRGs studied (15.9 ± 1.4%, 11.1 ± 3.7% and 10.1 ± 5.7%, respectively). In the contralateral DRGs, the distribution of retrogradely labelled PNX+/nNOS+ neurons were virtually restricted to only two domains of DRGs studied: the Cd and the Md regions (79.9 ± 7.6% and 20.1 ± 7.9%, respectively). It should be stressed that in comparison to the contralateral DRG, a distinctly higher number of such coded UB-PNs was observed in the Cn and P domains (11.1 ± 3.7% vs. 0.0% and 10.1 ± 5.7% vs. 0.0%) while in the Cd part of the ganglion the number of retrogradely labelled PNX+/nNOS+ nerve cells were present in the significantly smaller number (32.6 ± 2.7% vs. 79.9 ± 7.6%) in the ipsilateral ganglia. Distribution pattern of PNX+ and nNOS-containing bladder-projecting sensory neurons in the different domains of DRGs has been showed in Table 9.
3.3.6. Cells co-localizing PNX and CRT
The presence of PNX and CRT was demonstrated in a small population (6.5 ± 0.3%; Figure 3 F1-F4) of all sensory DRG neurons supplying the urinary bladder. Statistically significant differences in the numbers of FB+/PNX+/CRT+ neurons were neither observed between the ipsi- and contralateral DRGs studied (6.5 ± 0.7% and 9.4 ± 3.4%) and nor between the L and S-Cq bladder-projecting “centers” (6.4 ± 1.6% and 7.9 ± 3.4%).
Regarding the diameter, the most numerous subpopulation of PNX-positive UB-PNs containing CRT was that of small-sized cells (Figure 3 F1-F4; 75.6 ± 1.6%), while the medium-sized neurons were found to be distinctly less numerous (24.4 ± 1.6%). It should be stressed that the differences in the numbers of both small PNX/CRT-IR bladder-projecting sensory neurons (71.1 ± 8.2% vs. 77.5 ± 1.1%) and those of the medium size (28.9 ± 8.2% vs. 22.5 ± 1.1%) were statistically insignificant between the L and the S-Cq DRGs as well as between the ipsi- and contralateral ganglia studied (80.5 ± 7.8% vs. 66.7 ± 5.4% and 19.5 ± 7.8% vs. 33.3 ± 5.4%, respectively).
In terms of the intraganglionic distribution pattern, the majority of FB+/PNX+/CRT+ cells were unevenly dispersed inside the ganglia; the largest number of such encoded nerve cells was observed in the Cd region (96.3 ± 3.7% vs. 54.7 ± 10.8%) in both the ipsi- as well as contralateral ganglia. For the remaining DRG domains, in the contralateral DRGs, the rest of PNX/CRT-positive UB-PNs were only present in the Md part of the ganglion (3.7 ± 3.7%). In the ipsilateral ganglia, a smaller number of retrogradely labelled PNX+/CRT+ nerve cells was found in the Md, P and Cn parts (29.6 ± 4.5%, 10.5 ± 9.1% and 5.2 ± 4.5%, respectively) of all DRGs studied. It should be stressed that in comparison to the contralateral DRGs, in the ipsilateral ganglia a distinctly higher number of such coded UB-PNs was observed in the Md domain, while the retrogradely labelled PNX+/CRT+ nerve cells were present in a significantly smaller number in the Cd domain. Distribution pattern of PNX+ and CRT-containing bladder-projecting sensory neurons in the different domains of DRGs has been presented in Table 10.
3.3.7. Cells Co-Localizing PNX and SOM
SOM-containing sensory neurons constituted the smallest subpopulation (1.6 ± 1.1%; Figure 3 G1-G4) of all PNX+ UB-PNs, being observed in all the ipsi- and contralateral -DRGs (1.5 ± 1.2% and 1.7 ± 1.6%, respectively) of the L and the S-Cq “centers” (1.0 ± 0.7% and 1.5 ± 1.8%, respectively). No statistically significant differences in the number of PNX+/SOM+ UB-PNs between the ipsi- and contralateral ganglia as well as between the L and S-Cq DRGs studied were observed.
PNX-positive, SOM-containing UB-PNs belonged mainly to the subpopulation of small-sized cells (Figure 3 G1-G4-short arrows; 83.1 ± 2.6%), while the number of such coded medium-sized neurons was distinctly smaller (16.9 ± 2.6%). Although the differences in the numbers of both small PNX/SOM-IR bladder-projecting sensory neurons (74.8 ± 4.8% vs. 93.7 ± 5.6%) and those of the medium size (25.2 ± 4.8% vs. 6.3 ± 5.6%) were statistically insignificant between the ipsi- and the contralateral DRGs, in the S-Cq ganglia the noticeably higher number of the small-sized (96.3 ± 3.6% vs. 69.4 ± 2.7%) and the distinctly lower number of medium-sized (3.7 ± 3.6% vs. 30.6 ± 2.7%) PNX and SOM-IR FB+ neurons were observed when compared with the L ones.
In terms of the intraganglionic distribution pattern, in both the contralateral and the ipsilateral DRGs, the majority of FB+/PNX+/SOM+ neurons were observed in the Cd region (95.9 ± 5.5% and 55.7 ± 8.0%, respectively) of the ganglia. For the remaining DRG domains, the rest of PNX/SOM-positive UB-PNs were present in the P segment of the contralateral DRGs (4.1 ± 5.5%), while in the ipsilateral ganglia, a smaller number of retrogradely labelled PNX+/SOM+ nerve cells was found in the Cr and the P regions (32.8 ± 4.0% and 11.5 ± 5.1%, respectively) of studied DRGs. It should be stressed that in comparison to the contralateral DRGs, a distinctly higher number of such coded UB-PNs was observed in the Cr domain (32.8 ± 4.0% vs. 0.0%) of the ipsilateral ganglia, while in the Cd part of the ganglion, the number of retrogradely labelled PNX+/SOM+ nerve cells were present in a significantly smaller number (55.7 ± 8.0% vs. 95.9 ± 5.5%). Distribution pattern of PNX+ and SOM-containing
bladder-projecting sensory neurons within different domains of DRGs has been summarized in Table 11.
3.4. Pattern of Co-Occurrence of Biologically Active Substances in the PNX-Containing UB-PNs of DRGs Studied
An attempt, made to colocalize more than two studied substances in the same neuron profile on consecutive sections, labelled with the double immunofluorescence technique, allowed us to draw the following conclusions:
- (i)
- Almost half of the PNX+/SP+ UB-PNs co-contain PACAP, CGRP or GAL (50.6 ± 4.5%, 46.5 ± 0.9% and 45.9 ± 1.9%, respectively). A much smaller number of such coded FB-positive neurons contained CRT, nNOS or SOM (9.2 ± 1.9%, 3.8 ± 1.4% and 1.2 ± 1.1%, respectively).
- (ii)
- SP, PACAP and GAL were also very frequently observed (69.8 ± 1.6%, 49.7 ± 2.2% and 47.2 ± 0.9%, respectively) in PNX+/CGRP+ sensory neurons supplying the urinary bladder, while PNX+/CGRP+ neurons containing simultaneously nNOS, CRT and/or SOM (9.8 ± 1.9%, 8.4 ± 3.6% and 1.4 ± 1.4%, respectively) were observed much less frequently.
- (iii)
- The most numerous subset of PNX+/GAL+ UB-PNs was that containing simultaneously SP, CGRP and/or PACAP (68.2 ± 7.4%, 60.1 ± 7.2% and 49.4 ± 2.7%, respectively). In contrast, FB-positive neurons containing both PNX and GAL rarely colocalized nNOS, CRT or SOM (8.4 ± 2.8%, 8.1 ± 0.6% and 1.9 ± 0.8%, respectively).
- (iv)
- A similar pattern of colocalization was observed for PNX and PACAP-positive UB-PNs, where the vast majority of such encoded nerve cells contained SP, CGRP and/or GAL (82.1 ± 4.5%, 61.1 ± 2.0% and 49.2 ± 5.1%, respectively), while such coded neurons, showing immunoreactivity for nNOS, CRT and/or SOM, were observed in much smaller numbers (15.5 ± 5.9%, 8.8 ± 0.3% and 1.9 ± 0.8%, respectively).
- (v)
- The most numerous subpopulations of FB+/PNX+/NOS+ sensory neurons were those that simultaneously contained PACAP, CGRP and/or SP (79.2 ± 12.0%, 64.4 ± 2.0% and 57.9 ± 2.7% respectively). GAL and CRT were observed in a much smaller subset (40.9 ± 2.7% and 25.1 ± 8.9) of these neurons, while SOM was absent from this subpopulation of UB-PNs.
- (vi)
- PNX-IR, CRT-positive neurons mainly co-contained SP and CGRP (79.1 ± 1.5%, 54.3 ± 6.9%, respectively), while PACAP, GAL and/or nNOS (39.5 ± 7.3%, 37.8 ± 3.6% and 23.2 ± 3.3%) were observed in a much smaller population of FB+/PNX+/CRT+ perikarya. As in the above-mentioned case, SOM was absent from this subpopulation of UB-PNs.
- (vii)
- All PNX/SOM-positive UB-PNs simultaneously contained SP and CGRP, while more than half of these neurons colocalized with GAL and PACAP (70.3 ± 4.1% and 68.9 ± 5.5%). This population of sensory neurons was devoid of immunoreactivities towards nNOS as well as CRT.
Mathematical analysis of the relative frequencies of co-occurrence of antigens studied in cross-sections of the same sensory cell, analyzed on consecutive sections of the ganglion, indicates the existence of two basic populations of afferent cells supplying the urinary bladder. The basic determinant of both populations is the presence (minority, less than 2% of all perikarya) or absence of SOM expression (the overwhelming majority of labeled neurons studied). While the population characterized by the presence of SOM is very homogeneous in terms of chemical coding (in fact, the vast majority of these cells simultaneously express SP, CGRP, SOM, PACAP and GAL (approximately 70% of neurons in this population), the second main population of UB-PNs consists, as results from the aforementioned mathematical analysis, of at least a number of fractions of differently chemically encoded DRG neurons.
Although, due to the fact that the vast majority of cells of the latter subpopulation are small-diameter cells, usually identifiable on a maximum of three consecutive sections, the present study could not provide indisputable evidence for the presence of the cell populations mentioned below, however, the analysis of the number of cells expressing individual antigens allows to state that these sensory cells can be classified as neurons
“coded” by the simultaneous presence of SP/CGRP/PACAP/GAL, SP/CGRP/PACAP/NOS, SP/CGRP/PACAP/NOS/CRT and/or SP/CGRP/GAL/PACAP.
Details concerning the relative percentages of individual subpopulations of retrogradely labeled PNX+ neurons are shown in Table 12.
4. Discussion
Authors should discuss the results and how they can be interpreted from the perspective of previous studies and of the working hypotheses. The findings and their implications should be discussed in the broadest context possible. Future research directions may also be highlighted.
The analysis of literature clearly shows that PNX may be involved in sensory transmission. PNX was detected in the epidermis and dermis, and moreover, this peptide was found also in skin-projecting DRG neurons [16]. It has also been demonstrated that PNX had a similar distribution in the dorsal horn and DRGs as gastrin-releasing peptide, which causes itching [16].
Lyu et al. revealed that PNX is expressed in DRG neurons in rodents [5], however the results of the present study for the first time have shown that PNX is present in the porcine DRG sensory neurons supplying the urinary bladder. This neuropeptide has been detected in the small- and medium-sized DRG neurons, but it was absent from the large-diameter cells. It is well known that small- and medium-sized DRG neurons are involved in pain transmission [17,18]. Considering that Lyu et al. showed PNX can reduce visceral pain, but not thermally evoked pain [5], this phenomenon may also suggest putative influence of PNX on nociceptive transmission from the urinary bladder.
The main co-transmitter of PNX is SP, a tachykinin distributed throughout the central and peripheral nervous system. The literature clearly shows that SP is involved in classical and neurogenic inflammatory response at the peripheral level [19,20]. In the lower urinary tract, SP induces bladder contraction and facilitates normal micturition [21]. Moreover, SP is recognized as a peptide involved in nociceptive transmission [22]. Co-expression of PNX with SP may suggest that PNX, being present in a significant fraction of SP-IR cells, influences micturition and nociception, by modulation of SP-driven stimulation. However, this speculation needs confirmation in further studies.
CGRP is a peptide associated with several pathological conditions, among others the modulation of the releasing of inflammatory cytokines, in sepsis or in airways through hyperemia [23]. It was also shown that CGRP level is increased during migraine attack [24]. Considering the above data, as well as the relatively frequent co-occurrence with SP in retrogradely labeled DRG cells, it may be speculated that CGRP is also involved in nociceptive transmission. Although in the lower urinary tract CGRP has no excitatory effect on the micturition reflex pathway per se, it is able to facilitate the SP-evoked chemonociceptive reflex [25]. CGRP inhibits the activity of an endopeptidase that degrades SP [26], thus may “improve” and extend the time of SP action. A large number of FB+ PNX-IR cells containing SP and/or CGRP indicates putative connection of PNX with bladder contraction and nociceptive transmission. Moreover, it is widely known that the release of CGRP and SP were significantly increased following inflammation [27]. It strongly suggests that PNX may involve sensory transmission.
The next most abundant population of PNX+ cells, as shown by double immunofluorescence studies, were neurons containing either PACAP or GAL simultaneously. The presence of PACAP in sensory neurons serving various afferent pathways has been found in virtually every area of the human body [28], and this molecule seems to play a significant role in many different physio- and pathophysiological processes. For example, it was investigated and observed that the intravenous infusion of PACAP in healthy human volunteers caused a slight headache or, rather, a feeling of increasing pressure in the head [29], which may suggest that, similarly to CGRP, this transmitter may also be a factor involved in the etiopathogenesis of migraine attacks. This is further supported by the observations that in rats, administration of pituitary adenylate cyclase-activating polypeptide type I receptor (PAC1) antagonists both blocks the development of migraine and significantly reduces nociceptive transmission itself. [30]. Moreover, PACAP has been shown to act as both a significant anti-inflammatory and neuroprotective factor in brain tissue [31], acting via stimulation and recovery of brain-derived neurotrophic factor (BDNF) expression under pathophysiological conditions [32,33]. At lower urinary tract, PACAP increased bladder smooth muscle tone and potentiated electric field stimulation (EFS)-induced contractions [34]. On the other hand, Hernández et al. have reported that PACAP induced relaxations of the pig urinary bladder neck [35]. Considering the above-mentioned data, it can be assumed that PACAP plays a number of roles in the lower urinary tract, starting from being involved in the regulation of the detrusor muscle tone, the control of blood flow through the vascular bed of the organ, to acting as a sensory transmitter and, probably, a neuroprotective factor.
It is well-known that GAL is involved in the regulation of many processes within the lower urinary tract. As can be concluded from the available literature, this peptide seems to influence the contractility of detrusor muscle in rat bladder per se, and moreover, on the other hand, it may also act indirectly, modulating the activity of autonomic ganglia neurons involved in the control of detrusor motility [36]. It seems that the action of GAL in the lower urinary tract is not limited only to the effect on smooth muscles, but through its ability to modulate the activity of neuromuscular junctions [37], it may also (co-)regulate the activity of the external urethral sphincter. Furthermore, Honda and colleagues showed that intrathecal administration of this peptide delays the onset of micturition in rats, what may be indicative for an inhibitory role of GAL in the control of micturition reflex at the spinal level [38]. It is also interesting that GAL may interact with other known afferent cell transmitters: for example, Zvarova et al. reported that GAL may inhibit the actions exerted by PACAP and/or nitric oxide (NO) on bladder-projecting afferent cells [39]. Furthermore, GAL, when administrated intrathecally in higher doses, blocked the facilitatory effects of SP and CGRP on the excitability of the nociceptive flexor reflex in rats [40,41] what implicated that GAL may possess analgesic as well as anti-inflammatory properties [42]. Considering that PNX was colocalized with GAL in a fair number of neurons, it seems likely that PNX may participate in the regulatory effects described above by modulating GAL function in a currently unknown manner. However, the existence or absence of such interactions remains to be clarified in detail. It should be emphasized that PNX co-occurs in the DRG cells supplying the bladder with transmitters that are believed to induce opposing physiological effects (e.g., SP and CGRP facilitate micturition and nociceptive transmission, while GAL inhibits these phenomena), and further studies are necessary to explain the interactions between PNX and other active substances co-occurring with it in sensory neurons.
In contrast to the substances described above, PNX co-existed with nNOS, CRT and/or SOM only in a marginal number of retrogradely labeled cells.
The role of NO in regulating lower urinary tract function, particularly the pool of molecules released from afferent nerve endings supplying the wall of the bladder and/or urethra, has not yet been sufficiently explained. On the one hand, it has been shown that the major sites of NO release in the rat bladder are afferent nerves and that NO plays an important role in the facilitation of the micturition reflex evoked by noxious chemical irritation of the bladder [43], participating simultaneously in the initiation of inflammatory responses and triggering painful sensations [43,44]. On the other hand, an inhibitory function of NO in the micturition pathway has also been suggested. It was reported that NO may be a regulator of sodium currents in C-type DRG neurons, leading, by suppression of both fast and slow sodium trafficking, to DRG hypoexcitability [25]. As previously described in the rat, similarly to PNX, nNOS is expressed mainly by small-diameter sensory neurons [45], and moreover, this enzyme co-expresses very frequently with SP and/or CGRP in the L DRGs [46]; however, in the present study, only a small percentage of retrogradely labeled PNX+ cells co-expressed nNOS, even though a significant proportion of these neurons co-expressed SP and/or CGRP. This may suggest that the modulatory effect of PNX on nitrergic pathways regulating bladder functions is rather limited, whereas, considering the frequency of co-existence of PNX with SP and CGRP, it seems to be much more important in the latter case.
At present, the physiological significance of SOM in bladder afferent neurons remains completely unclear. The only hypothesis that can be derived without any doubt from the presented results, analyzing both the number of cells containing it and the patterns of colocalization of this transmitter with other biologically active substances studied in this experiment, is that it most likely constitutes a distinct component of the bladder afferent pathways, the significance of which must be clarified in separate studies. At present, it can only be assumed, based on the available research results, that SOM may be involved in specific modulation of nociceptive transmission [47], depressing the firing of dorsal horn neurons activated by noxious stimulation [48], which is confirmed by the observations that SOM may produce an antinociceptive effect [49], especially in the case of inflammatory reactions of both neurogenic and non-neurogenic origin [50].
The last protein, previously observed by us in DRG cells associated with the bladder innervation, and whose co-occurrence with PNX we decided to investigate in this study, was CRT. Although the existence of CRT was described already in 1987 [51], to date there is no precise data allowing to strongly suggest its physiological function in DRG cells involved in the regulatory loops of the micturition process. While it is known that CRT is a protein efficiently modulating both transmembrane Ca2+ currents and calcium homeostasis in neurons of many parts of brain (e.g., hippocampus, thalamus, neocortex, amygdala) as well as spinal cord regions (especially in the superficial laminae of dorsal horn) [52,53], the exact role of this protein in DRG cells remains to be elucidated. Although the ability to modify the presynaptic signaling and Ca2+ transients by CRT acts as a buffer against excitotoxicity, the expression of this protein seems to be modulated by hypoxic stress, as observed after ischemic episodes [54], since its overexpression was observed in neurons belonging to the injured brain areas [55]. Another interesting information is that mechanical and chemical stimuli received and transmitted by DRG neurons induce the expression of CRT in the sensory neurons of dorsal horns of the spinal cord, as can be judged by the increase in the number of CRT+ cells visible in the spinal cord sections within the superficial Rexted laminae, a phenomenon that was explained by the increased activity of nociceptive transmission under the influence of the above-mentioned stimuli [56]. However, further dedicated studies are required to reliably establish the role of this calcium-binding protein and its (possible) interactions with PNX and other studied compounds in the regulation of bladder function.
In the course of this study, we also tried to answer the question whether PNX+ DRG afferent cells, involved in the innervation of the urinary bladder, can colocalize more than two tested substances simultaneously. However, although the analysis of the co-occurrence patterns of the tested substances, performed on consecutive sections, provided a lot of new data (see Table 12), expanding our knowledge of the chemical coding of bladder sensory neurons, it also raised almost as many new questions, the answers to which require in-depth studies, both qualitative and functional. Although the existence of two clearly separable subpopulations of bladder sensory neurons, distinguished by the expression (or lack thereof) of SOM, seems indisputable, the physiological significance of this subtype of sensory perikaryons, as well as the function(s) that may be assigned to them, remain unknown at present. When the chemical coding patterns of the second, much larger subpopulation of PNX+ DRG cells conducting sensory information from the bladder wall are analyzed, it is clear that their suite of neurotransmitters represents variant patterns of coexistence of GAL, PACAP, nNOS, and/or CRT with the "core pair" of sensory transmitters, SP and/or CGRP. While the importance of the co-occurrence and simultaneous or sequential release of two neurotransmitters from sensory neurons into the target tissue has been investigated in a number of studies, there are no similar studies on both the physiological importance and the interrelationships of the simultaneous release of more types of neurotransmitter molecules from the same nerve ending into the target tissue. An additional difficulty in interpreting the functional significance of the observed compositions of active substances that may be released into target tissues is both the almost complete ignorance of the latter (in relation to the individual neuronal subtypes identified during these studies) and the lack of data on the receptor "landscape" of potential effector tissues. Unfortunately, it should be stated that as of yet, without further, in-depth functional studies, the multitude of observed patterns of co-occurrence of the studied transmitters makes it impossible to clearly assign individual sensory modalities to individual sub-types of differently coded DRG neurons.
5. Conclusions
The following conclusions can be drawn from the results of the study presented:
i) PNX occurs in a relatively large population of DRG neurons innervating the porcine urinary bladder, which indicates its participation in regulating and/or modulating the activity of afferent neural pathways co-creating the regulatory loops of micturition and/or reception and transmission of various sensory modalities from the organ wall;
ii) The surprisingly numerous patterns of co-occurrence of PNX and many substances considered to be sensory transmitters strongly suggest that this peptide may be involved in a wide range of mechanisms regulating the physiological behavior of the organ;
iii) The multitude of observed patterns of co-occurrence of PNX and other tested transmitters/biologically active substances necessitates further, in-depth studies focusing on the detailed determination of target tissues, expression patterns of types and subtypes of receptors, and the undisputed indication of the functions performed by individual subsets of differently coded DRG cells.
Author Contributions
conceptualization, A.B. and M.K.M.; methodology, A.B.; validation, A.B.; surgical procedures, A.B., P.H, N.K., K.W.; formal analysis, P.J. and A.B.; investigation, P.J, K.W. and U.M.; resources, P.J. and A.B.; writing—original draft preparation, P.J. and A.B.; writing—review and editing, A.B. and M.K.M.; visualization, U.M. and P.J.; supervision, A.B.; project administration, P.J. and A.B.; funding acquisition, A.B. All authors have read and agreed to the published version of the manuscript.
Funding
Agnieszka Bossowska was the recipient of the Statutory Fund of the School of Medicine, Collegium Medicum (61.610.008-110), University of Warmia and Mazury in Olsztyn.
Institutional Review Board Statement
The study was conducted in accordance with the Declaration of Helsinki and approved by the Ethics Committee for Animal Experimentation in Olsztyn, Poland (affiliated with the National Ethics Committee for Animal Experimentation, Polish Ministry of Science and Higher Education; decision No. 40/2020 from 22 July 2020).
Informed Consent Statement
Not applicable.
Data Availability Statement
The data that support the findings of this study are available from the corresponding author upon reasonable request.
Conflicts of Interest
The authors declare no conflict of interest. The funders had no role in the design of the study; in the collection, analyses, or interpretation of data; in the writing of the manuscript; or in the decision to publish the results.
Abbreviations
BDNF - brain-derived neurotrophic factor
Cd - caudal domain
CGRP - calcitonin gene-related peptide
Cn - central domain
Cq – coccygeal
Cr - cranial domain
CRT – calretinin
CY3 - conjugated streptavidin
DH - dorsal horn
DRGs - dorsal root ganglia
EFS - electric field stimulation
FB - fluorescent retrograde tracer Fast Blue
FITC - fluorescein isothiocyanate
FSH - follicle stimulating hormone
GAL – galanin
GnRH - gonadotropin releasing hormone
GPR173 - G protein-coupled receptor 173
IgG - immunoglobulin G
IR – immunoreactive
L – lumbar
LH - luteinizing hormone
Md - middle ganglion area
nNOS - neuronal nitric oxide synthase
NO - nitric oxide
OCT - the ‘optimal cutting temperature’ compound medium
P - peripheral domain
PACAP - pituitary adenylate cyclase-activating polypeptide
PBS - phosphate-buffered saline
PNS - peripheral nervous system
PNX – Phoenixin
S – sacral
SD - standard deviation
SOM – somatostatin
SP – substance P
UB-PNs - urinary bladder-projecting neurons
References
- Yosten, G.L.C.; Lyu, R.M.; Hsueh, A.J.W.; Avsian-Kretchmer, O.; Chang, J.K.; Tullock, C.W.; Dun, S.L.; Dun, N.; Samson, W.K. A Novel Reproductive Peptide, Phoenixin. J Neuroendocrinol 2013, 25, 206. [Google Scholar] [CrossRef] [PubMed]
- Treen, A.K.; Luo, V.; Belsham, D.D. Phoenixin Activates Immortalized GnRH and Kisspeptin Neurons Through the Novel Receptor GPR173. Mol Endocrinol 2016, 30, 872–888. [Google Scholar] [CrossRef] [PubMed]
- McIlwraith, E.K.; Zhang, N.; Belsham, D.D. The Regulation of Phoenixin: A Fascinating Multidimensional Peptide. J Endocr Soc 2022, 6, bvab192. [Google Scholar] [CrossRef] [PubMed]
- Liang, H.; Zhao, Q.; Lv, S.; Ji, X. Regulation and Physiological Functions of Phoenixin. Front Mol Biosci 2022, 9, 956500. [Google Scholar] [CrossRef]
- Lyu, R.M.; Huang, X.F.; Zhang, Y.; Dun, S.L.; Luo, J.J.; Chang, J.K.; Dun, N.J. Phoenixin: A Novel Peptide in Rodent Sensory Ganglia. Neuroscience 2013, 250, 622. [Google Scholar] [CrossRef]
- Mazur, U.; Lepiarczyk, E.; Janikiewicz, P.; Łopieńska-Biernat, E.; Majewski, M.K.; Bossowska, A. Distribution and Chemistry of Phoenixin-14, a Newly Discovered Sensory Transmission Molecule in Porcine Afferent Neurons. Int J Mol Sci 2023, 23, 16647. [Google Scholar] [CrossRef]
- Bossowska, A.; Crayton, R.; Radziszewski, P.; Kmieć, Z.; Majewski, M. Distribution and neurochemical characterization of sensory dorsal root ganglia neurons supplying porcine urinary bladder. J. Physiol. Pharmacol. 2009, 60, 77–81. [Google Scholar]
- Dalmose, A.L.; Hvistendahl, J.J.; Olsen, L.H.; Eskild-Jensen, A.; Djurhuus, J.C.; Swindle, M.M. Surgically Induced Urologic Models in Swine. J Invest Surg 2000, 13, 133–145. [Google Scholar] [CrossRef]
- Kuzmuk, K.N.; Schook, L.B. Pigs as a Model for Biomedical Sciences. The Genetics of the Pig: Second Edition 2011, 426–444. [Google Scholar] [CrossRef]
- Swindle, M.M.; Makin, A.; Herron, A.J.; Clubb, F.J.; Frazier, K.S. Swine as Models in Biomedical Research and Toxicology Testing. Vet Pathol 2012, 49, 344–356. [Google Scholar] [CrossRef]
- Purves-Tyson, T.D.; Keast, J.R. Rapid actions of estradiol on cyclic amp response-element binding protein phosphorylation in dorsal root ganglion neurons. Neuroscience 2004, 129, 629–637. [Google Scholar] [CrossRef] [PubMed]
- Koszykowska, M.; Całka, J.; Gańko, M.; Jana, B. Long-term estradiol-17β administration reduces population of neurons in the sympathetic chain ganglia supplying the ovary in adult gilts. Exp. Mol. Pathol 2011, 91, 353–361, Epub 2011 Apr 27. [Google Scholar] [CrossRef] [PubMed]
- Bossowska, A.; Majewski, M. The influence of resiniferatoxin on the chemical coding of neurons in dorsal root ganglia supplying the urinary bladder in the female pig. Polish J Vet Scienc 2012, 15, 135–142. [Google Scholar] [CrossRef]
- Bossowska, A.; Lepiarczyk, E.; Mazur, U.; Janikiewicz, P.; Markiewicz, W. Botulinum toxin type A induces changes in the chemical coding of substance P-immunoreactive dorsal root ganglia sensory neurons supplying the porcine urinary bladder. Toxins (Basel) 2015, 7, 4797–4816. [Google Scholar] [CrossRef] [PubMed]
- Janikiewicz, P.; Wasilewska, B.; Mazur, U.; Franke-Radowiecka, A.; Majewski, M.; Bossowska, A. The Influence of an Adrenergic Antagonist Guanethidine (GUA) on the Distribution Pattern and Chemical Coding of Dorsal Root Ganglia (DRG) Neurons Supplying the Porcine Urinary Bladder. Int J Mol Sci 2021, 24, 13399. [Google Scholar] [CrossRef]
- Cowan, A.; Lyu, R.M.; Chen, Y.H.; Dun, S.L.; Chang, J.K.; Dun, N.J. Phoenixin: A candidate pruritogen in the mouse. Neuroscience 2015, 310, 541–8. [Google Scholar] [CrossRef]
- Honda, C.N. Differential distribution of calbindin-D28k and parvalbumin in somatic and visceral sensory neurons. Neuroscience 1995, 68, 883–892. [Google Scholar] [CrossRef]
- Jongsma Wallin, H.; Danielsen, N.; Johnston, J.M.; Gratto, K.A.; Karchewski, L.A.; Verge, V.M.K. Exogenous NT-3 and NGF differentially modulate PACAP expression in adult sensory neurons, suggesting distinct roles in injury and inflammation. Eur. J. Neurosci. 2001, 14, 267–282. [Google Scholar] [CrossRef]
- Ullah, M.W.; Bano, F.; Rashid, F.; Mehboob, R.; Kurdi, M.; Bamaga, A.; Aldardeir, N.; Nasief, H.; Moshref, L.H.; Alsinani, T.; Rayes, A.O.; Jabbad, R.H. Substance P/ Neurokinin-1 Receptor, Trigeminal Ganglion, Latency, and Coronavirus Infection-Is There Any Link? Front. Med. 2021, 8, 727593. [Google Scholar] [CrossRef]
- Severini, C.; Improta, G.; Falconieri-Erspamer, G.; Salvadori, S.; Erspamer, V. The tachykinin peptide family. Pharmacol. Rev. 2002, 54, 285–322. [Google Scholar] [CrossRef]
- Mersdorf, A.; Schmidt, R.A.; Kaula, N.; Tanagho, E.A. Intrathecal administration of substance P in the rat: The effect on bladder and urethral sphincteric activity. Urology 1992, 40, 87–96. [Google Scholar] [CrossRef] [PubMed]
- Nicoll, R.A.; Schenker, C.; Leeman, S.E. Substance P as a transmitter candidate. Ann Rev Neurosci. 1980, 3, 227–268. [Google Scholar] [CrossRef]
- Holzmann, B. Modulation of immune responses by the neuropeptide CGRP. Amino Acids 2011, 45, 1–7. [Google Scholar] [CrossRef] [PubMed]
- Cernuda-Morollón, E.; Larrosa, D.; Ramón, C.; Vega, J.; Martínez-Camblor, P.; Pascual, J. Interictal increase of CGRP levels in peripheral blood as a biomarker for chronic migraine. Neurology 2013, 81, 1191–1196. [Google Scholar] [CrossRef] [PubMed]
- Renganathan, M.; Cummins, T.R.; Hormuzdiar, W.N.; Black, J.A.; Waxman, S.G. Nitric oxide is an autocrine regulator of Na(+) currents in axotomized C-type DRG neurons. J. Neurophysiol. 2000, 83, 2431–2442. [Google Scholar] [CrossRef]
- Le Greves, P.; Nyberg, F.; Terenius, L.; Hokfelt, T. Calcitonin gene-related peptide is a potent inhibitor of substance P degradation. Eur. J. Pharmacol. 1985, 115, 309–311. [Google Scholar] [CrossRef]
- Garry, M.G.; Hargreaves, K.M. Enhanced release of immunoreactive CGRP and substance P from spinal dorsal horn slices occurs during carrageenan inflammation. Brain Res. 1992, 582, 139–142. [Google Scholar] [CrossRef]
- Vaudry, D.; Falluel-Morel, A.; Bourgault, S.; Basille, M.; Burel, D.; Wurtz, O.; Fournier, A.; Chow, B.K.C.; Hashimoto, H.; Galas, L.; et al. Pituitary Adenylate Cyclase-Activating Polypeptide and Its Receptors: 20 Years after the Discovery. Pharm. Rev. 2009, 61, 283–357. [Google Scholar] [CrossRef]
- Christensen, C.E.; Ashina, M.; Amin, A.M. Calcitonin Gene-Related Peptide (CGRP) and Pituitary Adenylate Cyclase-Activating Polypeptide (PACAP) in Migraine Pathogenesis. Pharmaceuticals 2022, 15, 1189. [Google Scholar] [CrossRef]
- Hoffmann, J. , Miller, S., Martins-Oliveira, M., Akerman, S., Supronsinchai, W., Sun, H., Shi, L., Wang, J., Zhu, D., Lehto, S., et al. PAC1 receptor blockade reduces central nociceptive activity: new approach for primary headache? Pain 2020, 161, 1670–1681. [Google Scholar] [CrossRef]
- Figueiredo, C.A.; Düsedau, H.P.; Steffen, J.; Ehrentraut, S.; Dunay, M.P.; Toth, G.; Reglödi, D.; Heimesaat, M.M.; Dunay, I.R. The neuropeptide PACAP alleviates T. gondii infection-induced neuroinflammation and neuronal impairment. J Neuroinflammation 2022, 19, 274. [Google Scholar] [CrossRef] [PubMed]
- Frechilla, D.; Garcia-Osta, A.; Palacios, S.; Cenarruzabeitia, E.; Del Rio, J. BDNF mediates the neuroprotective effect of PACAP-38 on rat cortical neurons. NeuroReport. 2001, 12, 919–923. [Google Scholar] [CrossRef]
- Brown, D.; Tamas, A.; Reglodi, D.; Tizabi, Y. PACAP protects against inflammatory-mediated toxicity in dopaminergic SH-SY5Y cells: implication for Parkinson's disease. Neurotox Res. 2014, 26, 230–239. [Google Scholar] [CrossRef]
- Braas, K.M.; May, V.; Zvara, P.; Nausch, B.; Kliment, J.; Dunleavy, J.D.; Nelson, M.T.; Vizzard, M.A. Role for pituitary adenylate cyclase activating polypeptide in cystitis-induced plasticity of micturition reflexes. Am. J. Physiol. Regul. Integr. Comp. Physiol. 2006, 290, R951–R962. [Google Scholar] [CrossRef]
- Hernández, M.; Barahona, M.V.; Recio, P.; Benedito, S.; Martinez, A.C.; Rivera, L.; García-Sacristán, A.; Prieto, D.; Orensanz, L.M. Neuronal and smooth muscle receptors involved in the PACAP- and VIP-induced relaxations of the pig urinary bladder neck. Br. J. Pharmacol. 2006, 149, 100–109. [Google Scholar] [CrossRef] [PubMed]
- Yau, W.M.; Dorsett, J.A.; Youther, M.L. Evidence for galanin as an inhibitory neuropeptide on myenteric cholinergic neurons in the guinea pig small intestine. Neurosci. Lett. 1986, 72, 305–308. [Google Scholar] [CrossRef]
- Maggi, C.A.; Santicioli, P.; Patacchini, R.; Turini, D.; Barbanti, G.; Beneforti, P.; Giuliani, S.; Meli, A. Galanin: A potent modulator of excitatory neurotransmission in the human urinary bladder. Eur. J. Pharmacol. 1987, 143, 135–137. [Google Scholar] [CrossRef] [PubMed]
- Honda, M.; Yoshimura, N.; Inoue, S.; Hikita, K.; Muraoka, K.; Saito, M.; Chancellor, M.B.; Takenaka, A. Inhibitory role of the spinal galanin system in the control of micturition. Urology 2013, 82, 1188.e9–1188.e14. [Google Scholar] [CrossRef]
- Zvarova, K.; Murray, E.; Vizzard, M.A. Changes in galanin immunoreactivity in rat lumbosacral spinal cord and dorsal root ganglia after spinal cord injury. J. Comp. Neurol. 2004, 475, 590–603. [Google Scholar] [CrossRef]
- Wiesenfeld-Hallin, Z.; Bartfai, T.; Hökfelt, T. Galanin in sensory neurons in the spinal cord. Front Neuroendocrinol. 1992, 13, 319–343. [Google Scholar]
- Xu, X.J.; Wiesenfeld-Hallin, Z.; Villar, M.J.; Hökfelt, T. Intrathecal galanin antagonizes the facilitatory effect of substance P on the nociceptive flexor reflex in the rat. Acta Physiol. Scand. 1989, 137, 463–464. [Google Scholar] [CrossRef]
- Jimenez-Andrade, J.M.; Zhou, S.; Du, J.; Yamani, A.; Grady, J.J.; Castaneda-Hernandez, G.; Carlton, S.M. Pronociceptive role of peripheral galanin in inflammatory pain. Pain 2004, 110, 10–21. [Google Scholar] [CrossRef]
- Birder, L.A.; Kanai, A.J.; de Groat, W.C.; Kiss, S.; Nealen, M.L.; Burke, N.E.; Dineley, K.E.; Watkins, S.; Reynolds, I.J.; Caterina, M.J. Vanilloid receptor expression suggests a sensory role for urinary bladder epithelial cells. Proc. Natl. Acad. Sci. USA 2001, 98, 13396–13401. [Google Scholar] [CrossRef] [PubMed]
- Aley, K.O.; Mc Carter, G.; Levine, J.D. Nitric oxide signaling in pain and nociceptor sensitization in the rat. J. Neurosci. 1998, 18, 7008–7014. [Google Scholar] [CrossRef] [PubMed]
- Cury, Y.; Picolo, G.; Gutierrez, V. P.; Ferreira, S.H. Pain and analgesia: the dual effect of nitric oxide in the nociceptive system. Nitric Oxide. 2011, 25, 243–254. [Google Scholar]
- Russo, D. , Clavenzani, P., Mazzoni, M., Chiocchetti, R., Guardo, G. Di.; Lalatta-Costerbosa, G. Immunohistochemical characterization of TH13-L2 spinal ganglia neurons in sheep (Ovis aries). Micros. Res. Tech. 2010, 73, 128–139. [Google Scholar] [CrossRef]
- Morton, C.R.; Hutchison, W.D.; Hendry, I.A. Release of immunoreactive somatostatin in the spinal dorsal horn of the cat. Neuropeptides 1988, 12, 189–197. [Google Scholar] [CrossRef]
- Sandkühler, J.; Fu, Q.G.; Helmchen, C. Spinal somatostatin superfusion in vivo affects activity of cat nociceptive dorsal horn neurons: Comparison with spinal morphine. Neuroscience 1990, 34, 565–576. [Google Scholar] [CrossRef]
- Helyes, Z.; Than, M.; Oroszi, G.; Pinter, E.; Nemeth, J.; Keri, G.; Szolcsanyi, J. Anti-nociceptive effect induced by somatostatin released from sensory nerve terminals and by synthetic somatostatin analogues in the rat. Neurosci. Lett. 2000, 278, 185–188. [Google Scholar] [CrossRef]
- Than, M.; Nemeth, J.; Szilvassy, Z.; Pinter, E.; Helyes, Z.; Szolcsanyi, J. Systemic anti-inflammatory effect of somatostatin released from capsaicin-sensitive vagal and sciatic sensory fibers of the rat and guinea-pig. Eur. J. Pharmacol. 2000, 399, 251–258. [Google Scholar] [CrossRef]
- Rogers, J.H. Calretinin: a gene for a novel calcium-binding protein expressed principally in neurons. J Cell Biol. 1987, 105, 1343–1353. [Google Scholar] [CrossRef] [PubMed]
- Hua, R.; Wang, X.; Chen, X.; Wang, X.; Huang, P.; Li, P.; et al. Calretinin neurons in the midline thalamus modulate starvation-induced arousal. Curr Biol. 2018, 28, 3948–3959.e4. [Google Scholar] [CrossRef] [PubMed]
- Tóth, K.; Eross, L.; Vajda, J.; Halász, P.; Freund, T.F.; Maglóczky, Z. Loss and reorganization of calretinin-containing interneurons in the epileptic human hippocampus. Brain 2010, 133, 2763–2777. [Google Scholar] [CrossRef] [PubMed]
- Freund, T.F.; Maglóczky, Z. Early degeneration of calretinin-containing neurons in the rat hippocampus after ischemia. Neuroscience 1993, 56, 581–596. [Google Scholar] [CrossRef] [PubMed]
- Brandt, M.D.; Jessberger, S.; Steiner, B.; Kronenberg, G.; Reuter, K.; Bick-Sander, A.; et al. Transient calretinin expression defines early postmitotic step of neuronal differentiation in adult hippocampal neurogenesis of mice. Mol Cell Neurosci. 2003, 24, 603–613. [Google Scholar] [CrossRef]
- Smith, K.M.; Boyle, K.A.; Madden, J.F.; Dickinson, S.A.; Jobling, P.; Callister, R.J.; Hughes, D.I.; Graham, B.A. Functional heterogeneity of calretinin-expressing neurons in the mouse superficial dorsal horn: implications for spinal pain processing. J Physiol. 2015, 19, 4319–39. [Google Scholar] [CrossRef]
Figure 1.
Bar diagram showing the distribution pattern of FB+ bladder projecting cells in the porcine DRGs ipsi- (light blue bars) and contralateral (dark blue bars) to the sites of tracer injections into the organ wall. The data obtained were pooled in all the animals and presented as mean ± SD, referring to the number of animals (N=6).
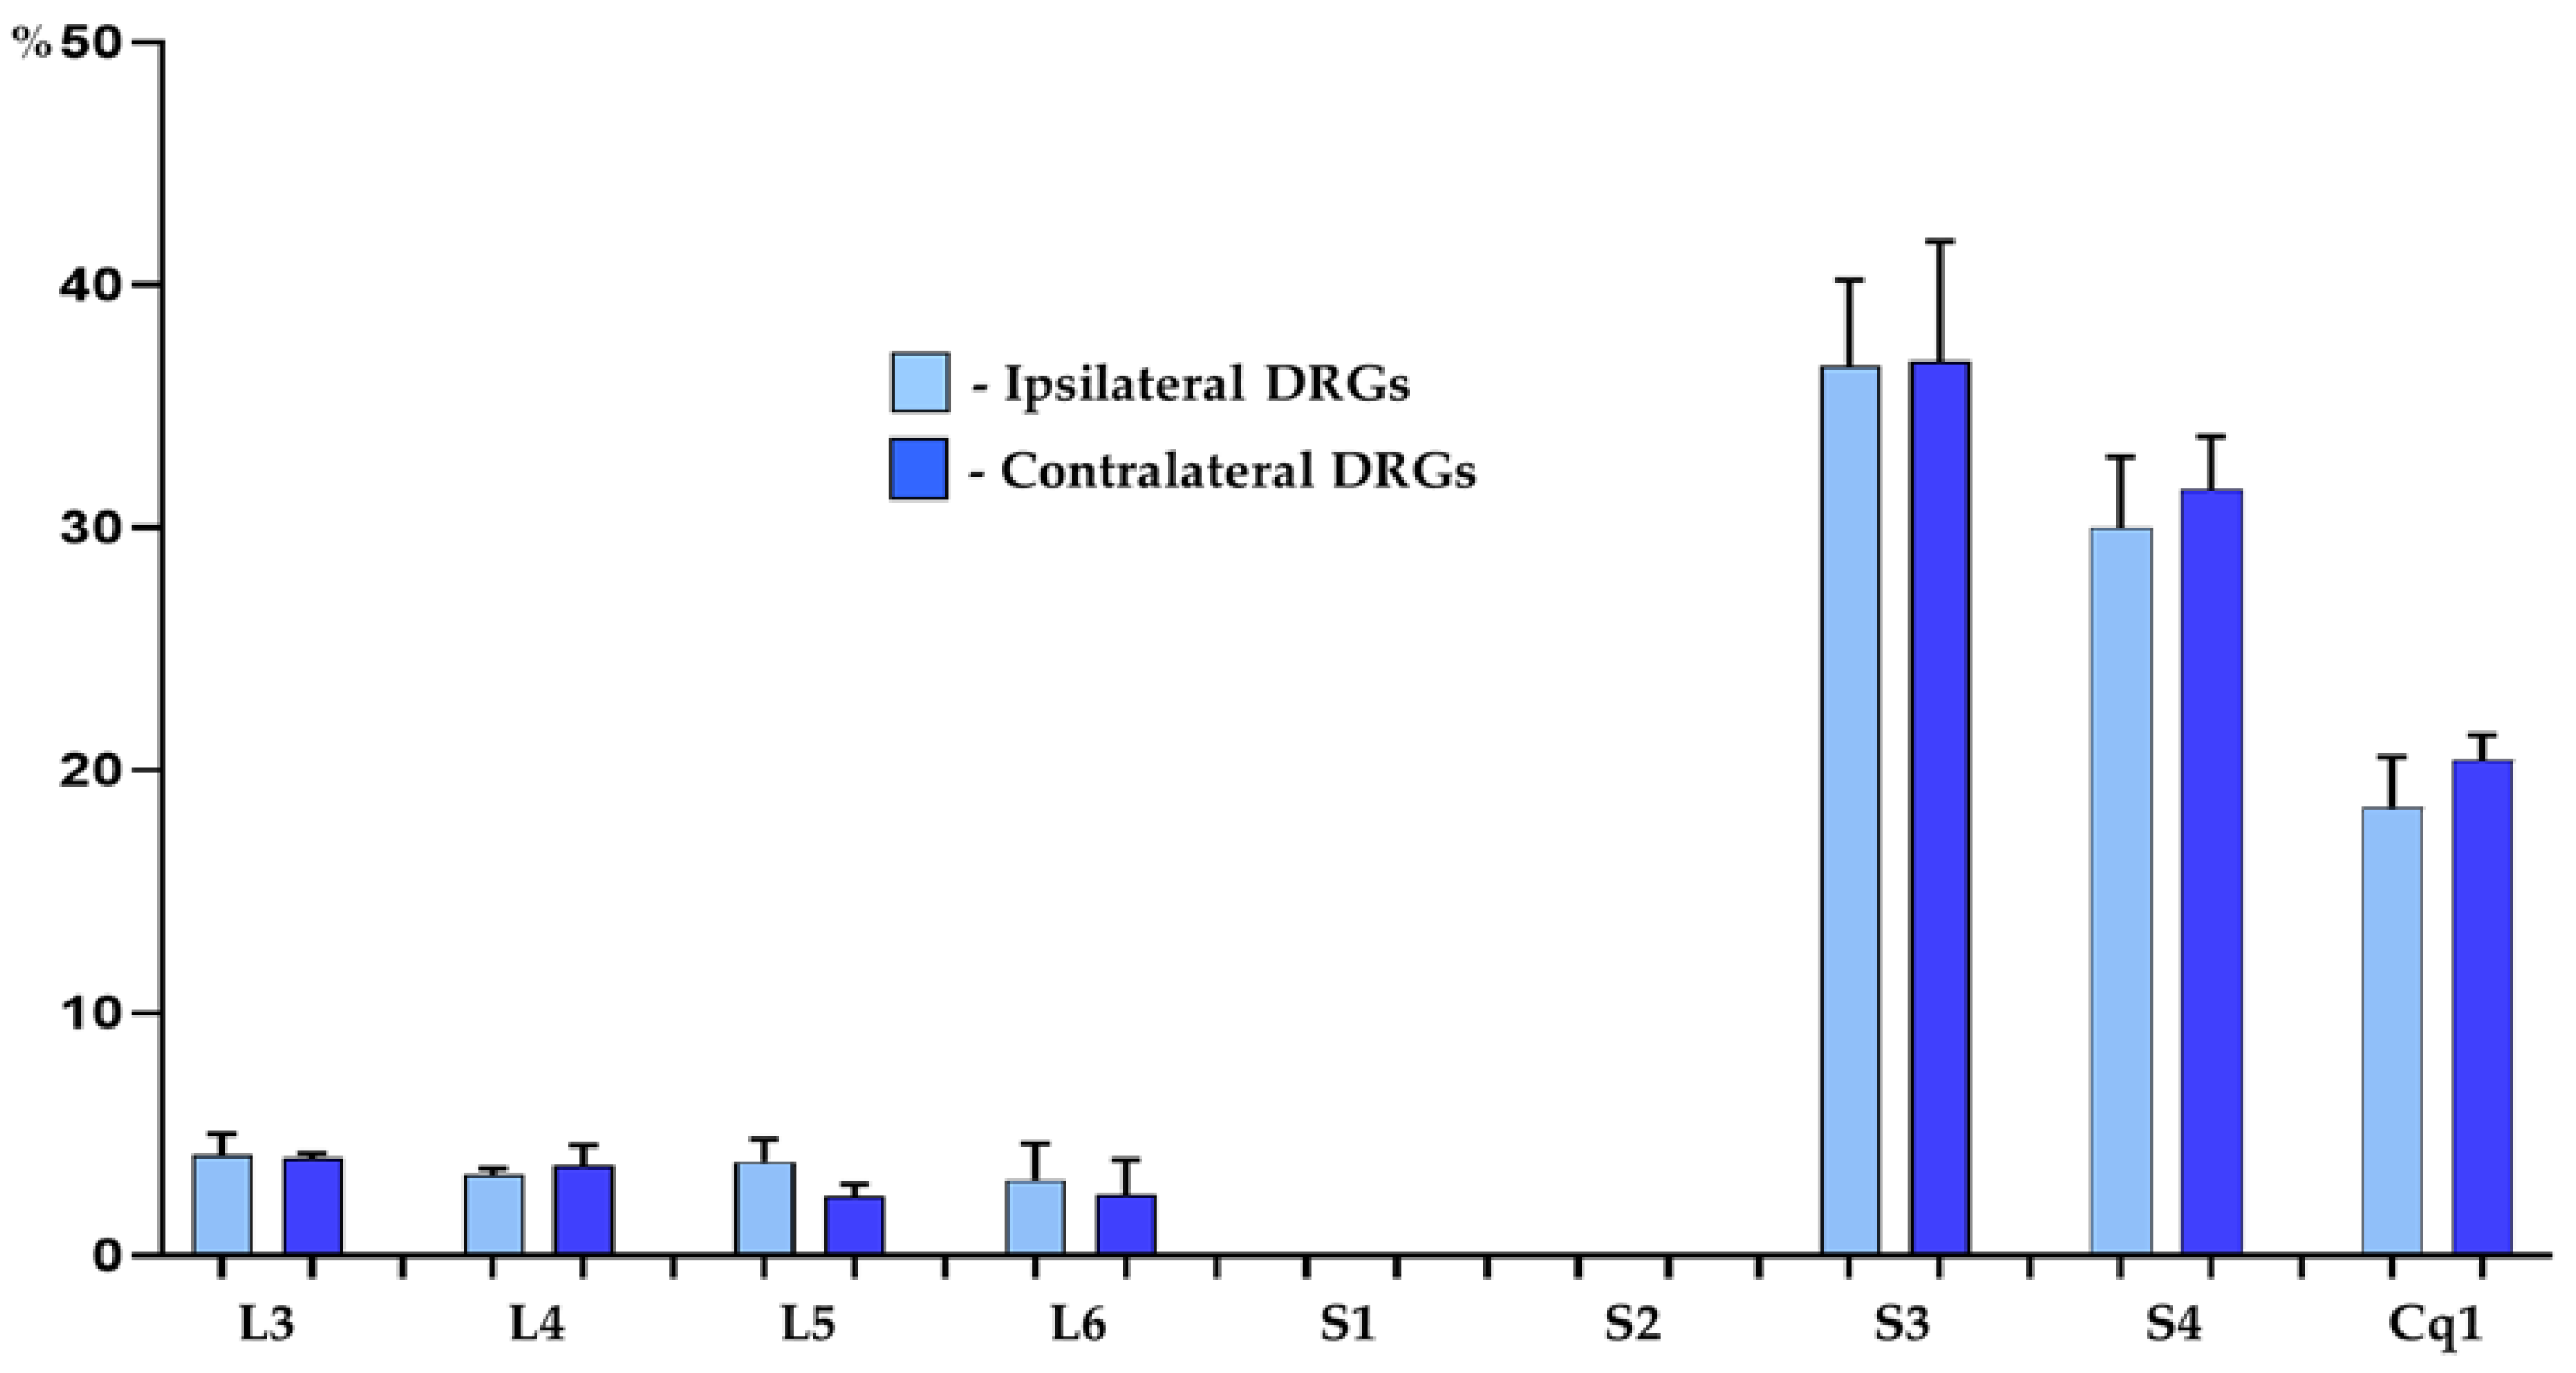
Figure 2.
A schematic diagram of DRG section showing its arbitrary division into topographical domains, in which the occurrence and relative frequency of PNX-containing sensory neurons was studied: P – peripheral domain, Cr – cranial domain, Cd - caudal domain, Cn – central domain of the DRG, Md - middle ganglion area; section from the a) proximal b) middle and c) distal part of the ganglion.
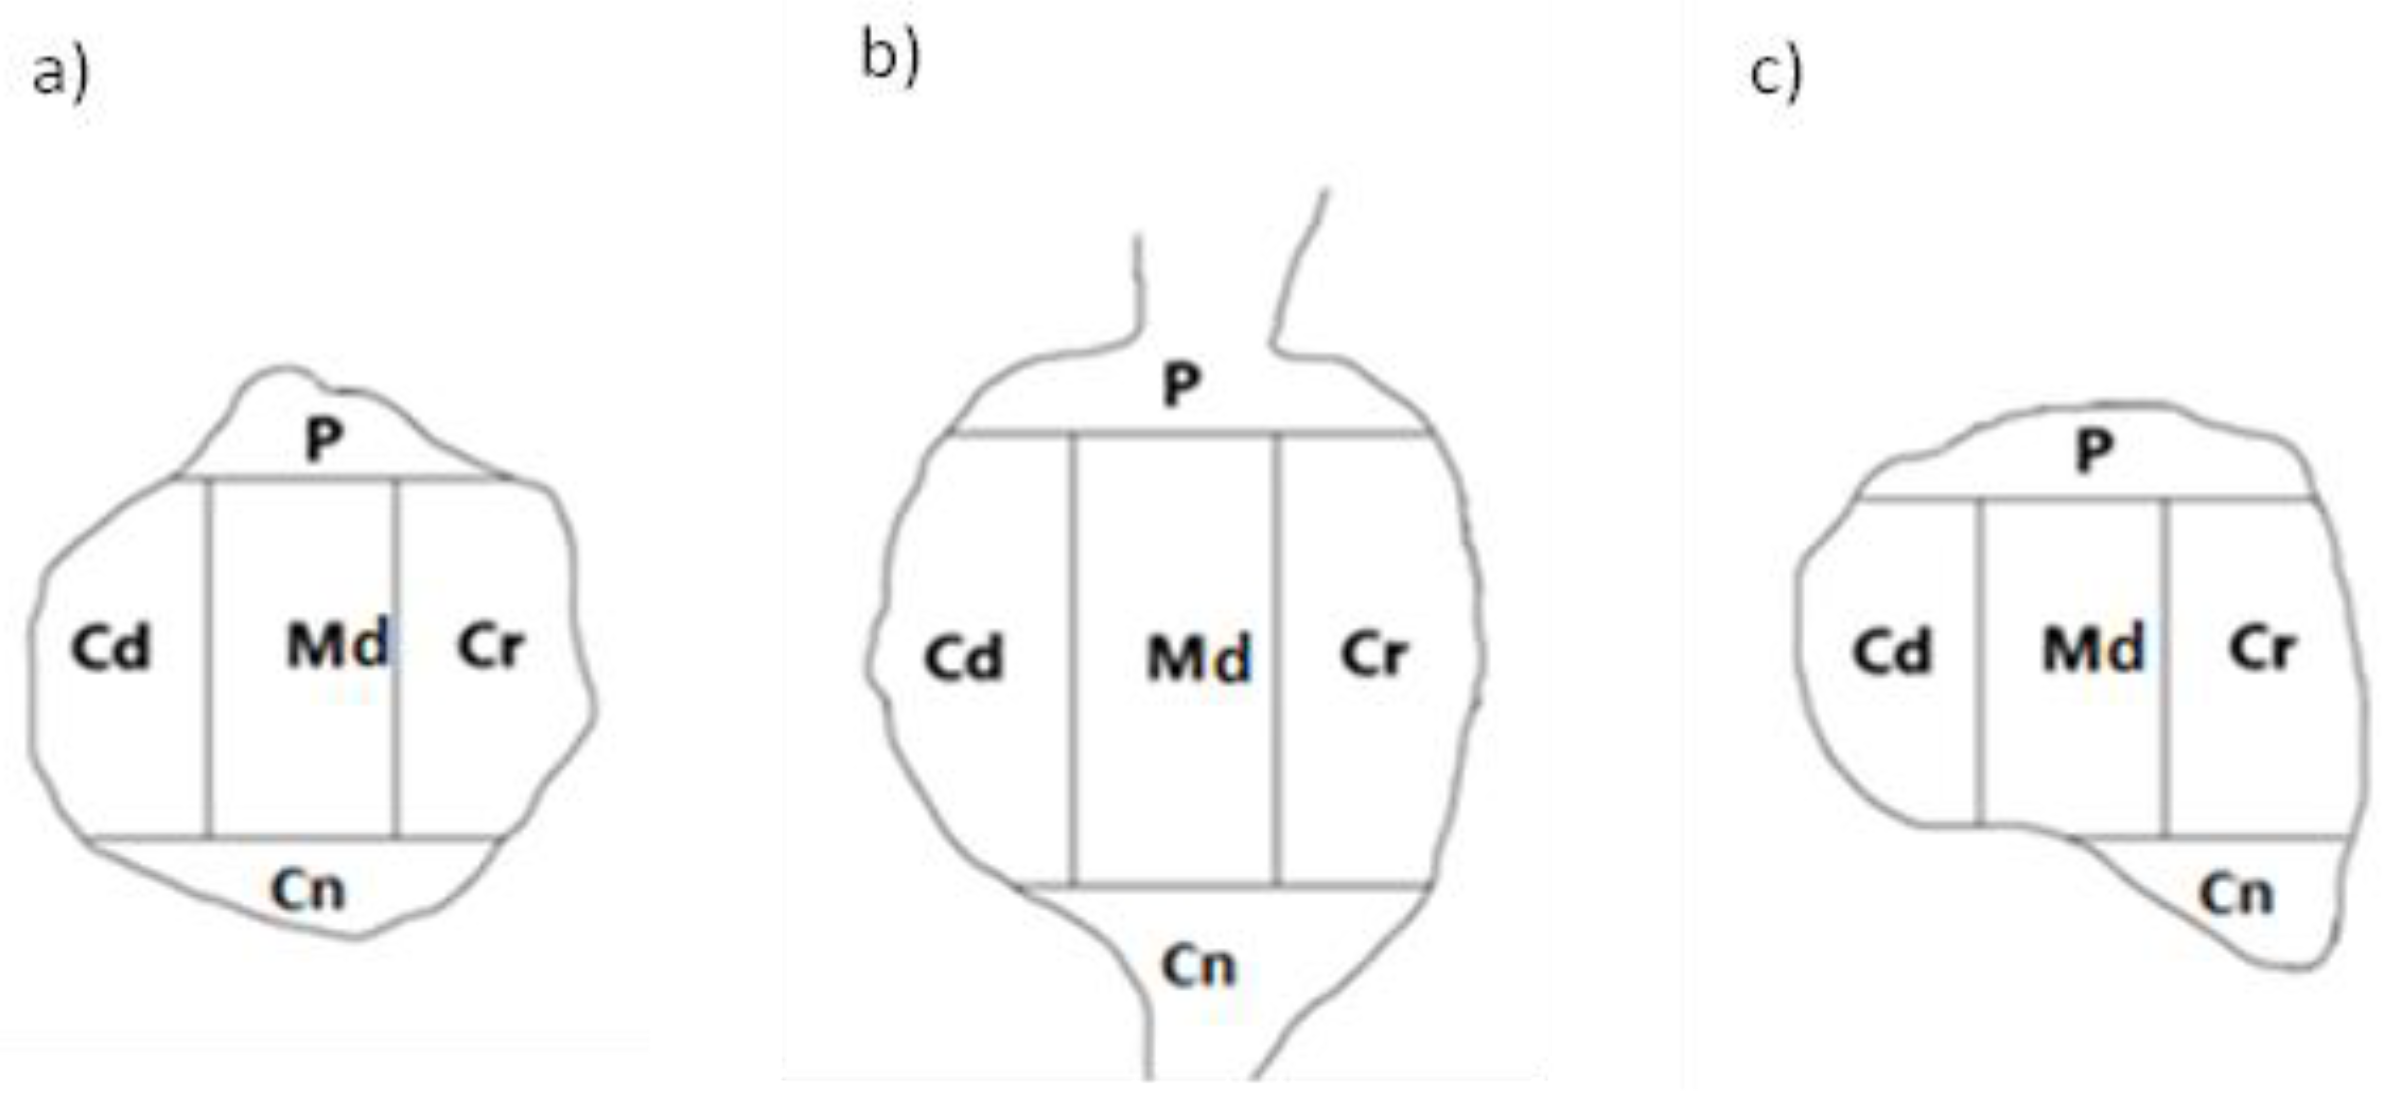
Figure 3.
Representative images of dorsal root ganglia (DRG)-UB-PNs. The images were taken separately from blue (A1, B1, C1, D1, E1, F1, G1), green (A2, B2, C2, D2, E2, F2, G2) and red (A3, B3, C3, D3, E3, F3, G3) fluorescent channels. Pictures A4, B4, C4, D4, E4, F4 and G4 represent images where blue, green and red channels were digitally superimposed. Short arrows represent small-sized FB-positive DRG-UB-PNs (A1, C1, D1, E1, F1, G1) which were simultaneously PNX- (A3, C3, D3, E3, F3, G3) and substance P- (SP; A2), galanin- (GAL; C2), pituitary adenylate cyclase-activating polypeptide- (PACAP; D2), neuronal nitric oxide synthase- (nNOS; E2), calretinin- (CRT; F2) or somatostatin-positive (SOM; G2). Long arrow represents middle-sized FB-positive DRG-UB-PN (B1) containing PNX (B3) and CGRP (B2). Double arrows represent small-sized FB-positive DRG-UB-PNs (F1, G1) which contained CRT (F2) or SOM (G2) and were simultaneously PNX-negative (F3, G3). Bar in all the images - 100 μm.
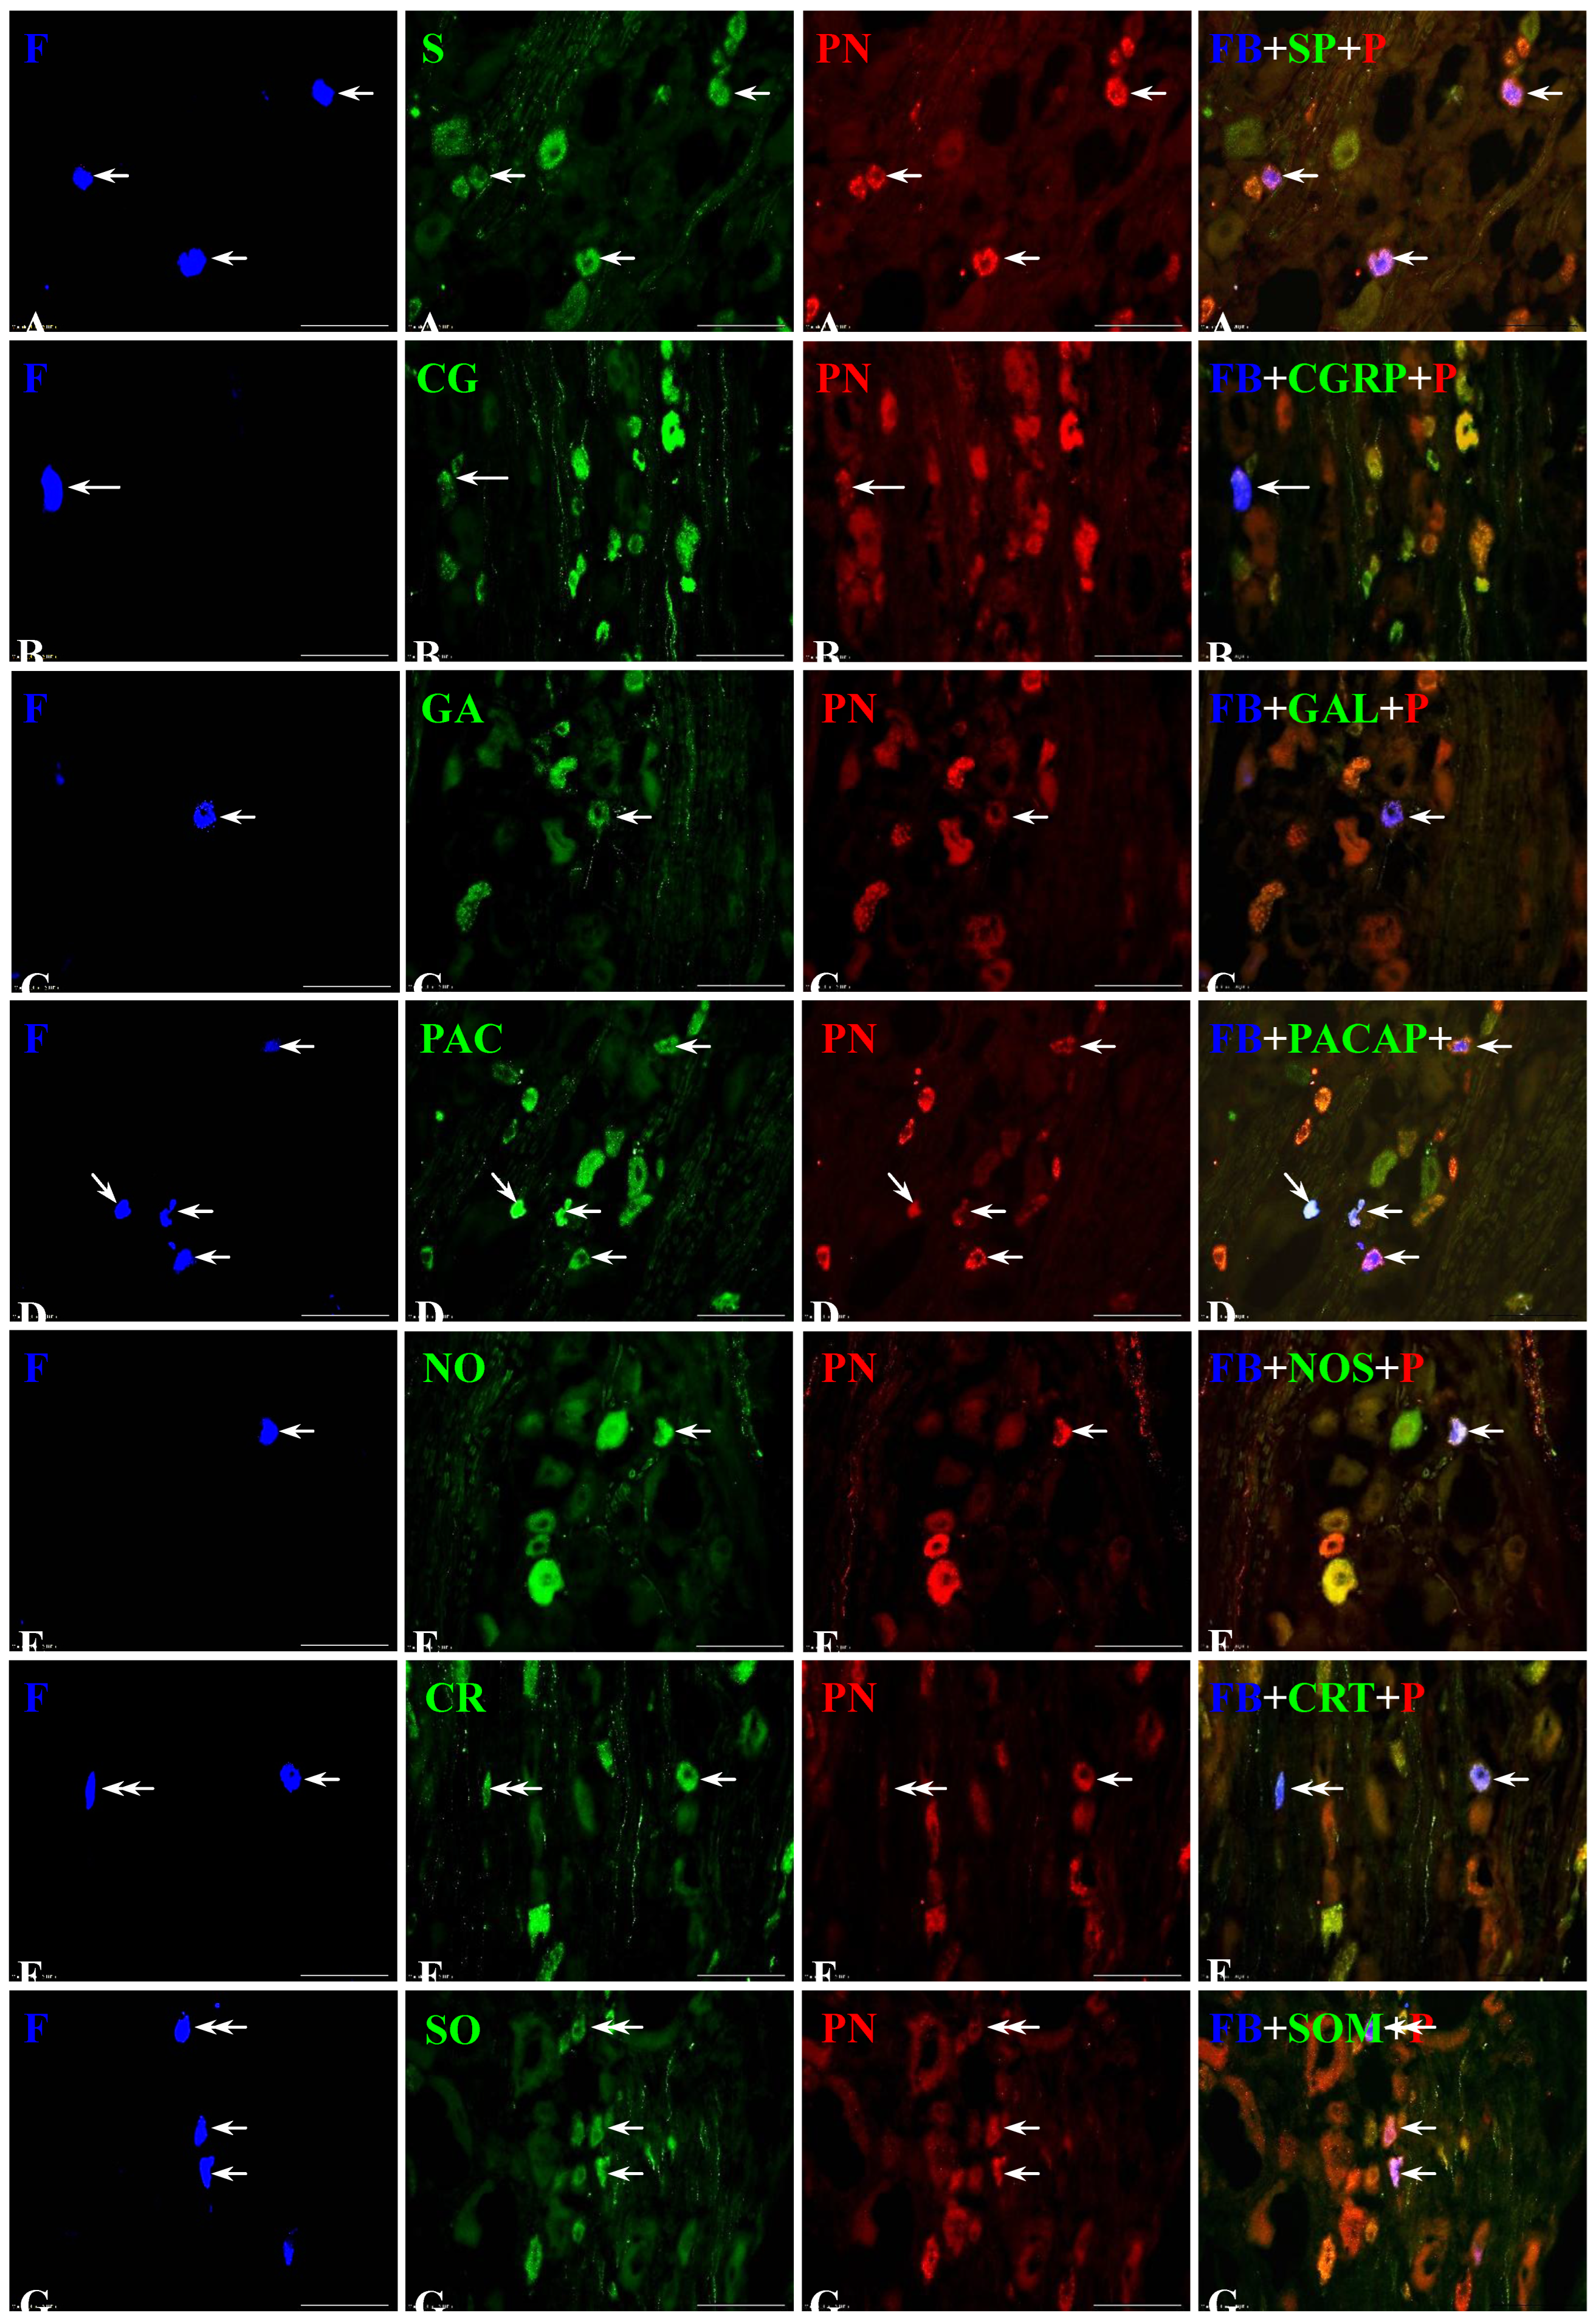

Table 1.
List of primary antisera and secondary reagents used in the study: CGRP - calcitonin gene-related peptide, CRT - calretinin, GAL - galanin, nNOS - neuronal nitric oxide synthase, PACAP - pituitary adenylate synthase-activating polypeptide, PNX - phoenixin, SOM - somatostatin, SP - substance P, FITC - fluorescein isothiocyanate, CY3 - streptavidin-conjugated.
| Antigen | Code | Dilution | Host | Supplier |
| Primary antibodies | ||||
| CGRP | PC205L | 1:9000 | Rabbit | Merck Millipore; Temecula; CA; USA |
| CRT | 6B3 | 1:2000 | Mouse | SWANT, Switzerland |
| GAL | AB5909 | 1:4000 | Rabbit | Merck Millipore; Temecula; CA; USA |
| nNOS | N2280 | 1:200 | Mouse | Sigma-Aldrich, St. Louis, MO, USA |
| PACAP | T-4465 | 1:15000 | Rabbit | Peninsula; San Carlos; CA; USA; |
| PNX | H-079-01 | 1:7000 | Rabbit | Phoenix Pharmaceuticals Inc, Burlingame, CA, USA, |
| SOM | MAB 354 | 1:50 | Rat | Merck Millipore, Temecula, CA, USA |
| SP | 8450-0004 | 1:200 | Rat | Bio-Rad, Kidlington, UK |
| Secondary reagents | ||||
| Biotinylated anti-rabbit immunoglobulins | E 0432 | 1:1000 | Goat | Dako; Hamburg; Germany |
| CY3-conjugated streptavidin | 711-165-152 | 1:12000 | - | Jackson I.R.; West Grove; PA; USA |
| FITC-conjugated anti-rat IgG | 712-095-150 | 1:400 | Donkey | Jackson I.R.; West Grove; PA; USA |
| FITC-conjugated anti-mouse IgG | 715-096-151 | 1:600 | Donkey | Jackson I.R.; West Grove; PA; USA |
Table 2.
List of antigens used in pre-absorption test.
| Antigen | Code | Dilution | Supplier |
| CGRP | T-4030 | 1:800 | Peninsula Laboratories, San Carlos, CA, USA |
| CRT | Lot No.: 22 | 1:2000 | SWANT, Switzerland |
| GAL | T-4862 | 1:1500 | Peninsula Laboratories, San Carlos, CA, USA |
| nNOS | N3033 | 1:200 | Sigma, St. Louis, MO, USA |
| PACAP | A9808 | 1:1000 | Sigma, St. Louis, MO, USA |
| PNX | 079-01 | 1:7000 | Phoenix Pharmaceuticals Inc; Burlingame; Kalifornia; USA |
| SOM | S9129 | 1:50 | Sigma-Aldrich, St. Louis, MO, USA |
| SP | S6883 | 1:200 | Sigma-Aldrich, St. Louis, MO, USA |
Table 3.
Percentages of Fast Blue-positive (FB+) neurons located in the individual lumbar (L), sacral (S) and coccygeal (Cq) dorsal root ganglia (DRGs). The obtained data were pooled in all the animals and presented as mean ± standard deviation (SD), referring to the number of animals (N=6).
Table 3.
Percentages of Fast Blue-positive (FB+) neurons located in the individual lumbar (L), sacral (S) and coccygeal (Cq) dorsal root ganglia (DRGs). The obtained data were pooled in all the animals and presented as mean ± standard deviation (SD), referring to the number of animals (N=6).
| FB+ neurons | L3 % |
L4 % |
L5 % |
L6 % |
S3 % |
S4 % |
Cq1 % |
|---|---|---|---|---|---|---|---|
| Ipsilateral DRGs | 3.5 ± 0.4 | 2.4 ± 0.4 | 3.4 ± 0.5 | 2.9 ± 0.8 | 33.3 ± 2.0 | 30.7 ± 1.6 | 23.8 ± 1.2 |
| Contralateral DRGs | 3.8 ± 0.1 | 3.0 ± 0.1 | 3.7 ± 0.2 | 3.2 ± 0.8 | 33.5 ± 2.8 | 31.3 ± 1.2 | 21.5 ± 0.6 |
Table 4.
Percentages of intraganglionic distribution pattern of FB+/PNX+ neuronal populations located in the ipsilateral and the contralateral DRG studied. Data obtained from all studied animals were pooled and presented as mean ± SD, referring to the number of animals (N=6).
Table 4.
Percentages of intraganglionic distribution pattern of FB+/PNX+ neuronal populations located in the ipsilateral and the contralateral DRG studied. Data obtained from all studied animals were pooled and presented as mean ± SD, referring to the number of animals (N=6).
| DRG subdomain | P | Cr | Cd | Cn | Md |
| Ipsilateral DRGs | 12.2 ± 2.1% | 20.2 ± 4.2% | 36.7 ± 3.6% | 8.6 ± 0.8% | 22.3 ± 1.6% |
| Contralateral DRGs | 24.8 ± 1.6% | 13.2 ± 1.2% | 26.5 ± 1.5% | 17.4 ± 1.4% | 18.1 ± 4.3% |
Table 5.
Percentages of intraganglionic distribution pattern of FB+/PNX+ neuronal populations containing SP and located in the ipsilateral and the contralateral DRGs studied. Data obtained from all studied animals were pooled and presented as mean ± SD, referring to the number of animals (N=6).
Table 5.
Percentages of intraganglionic distribution pattern of FB+/PNX+ neuronal populations containing SP and located in the ipsilateral and the contralateral DRGs studied. Data obtained from all studied animals were pooled and presented as mean ± SD, referring to the number of animals (N=6).
| DRG subdomain | P | Cr | Cd | Cn | Md |
| Ipsilateral DRGs | 15.1 ± 4.9% | 26.7 ± 6.0% | 36.3 ± 6.9% | 7.7 ± 2.9% | 14.2 ± 1.8% |
| Contralateral DRGs | 32.8 ± 2.3% | 13.3 ± 4.6% | 31.9 ± 1.9% | 7.9 ± 1.6% | 14.1 ± 3.0% |
Table 6.
Percentages of intraganglionic distribution pattern of FB+/PNX+ neuronal populations containing CGRP and located in the ipsi- and contralateral DRGs studied. Data obtained from all studied animals were pooled and presented as mean ± SD, referring to the number of animals (N=6).
Table 6.
Percentages of intraganglionic distribution pattern of FB+/PNX+ neuronal populations containing CGRP and located in the ipsi- and contralateral DRGs studied. Data obtained from all studied animals were pooled and presented as mean ± SD, referring to the number of animals (N=6).
| DRG subdomain | P | Cr | Cd | Cn | Md |
| Ipsilateral DRGs | 0% | 37.9 ± 2.2% | 62.1 ± 2.2% | 0% | 0% |
| Contralateral DRGs | 0% | 44.2 ± 5.8% | 55.8 ± 5.8% | 0% | 0% |
Table 7.
Percentages of intraganglionic distribution pattern of FB+/PNX+ neuronal populations containing GAL and located in the ipsi- and contralateral studied. Data obtained from all studied animals were pooled and presented as mean ± SD, referring to the number of animals (N=6).
Table 7.
Percentages of intraganglionic distribution pattern of FB+/PNX+ neuronal populations containing GAL and located in the ipsi- and contralateral studied. Data obtained from all studied animals were pooled and presented as mean ± SD, referring to the number of animals (N=6).
| DRG subdomain | P | Cr | Cd | Cn | Md |
| Ipsilateral DRGs | 13.7 ± 2.8% | 23.7 ± 6.0% | 36.5 ± 9.0% | 9.5 ± 1.9% | 16.6 ± 3.2% |
| Contralateral DRGs | 15.5 ± 1.3% | 11.4 ± 3.3% | 42.9 ± 2.3% | 5.6 ± 4.8% | 24.6 ± 3.3% |
Table 8.
Percentages of intraganglionic distribution pattern of FB+/PNX+ neuronal populations containing PACAP and located in the ipsi- and contralateral DRGs studied. Data obtained from all studied animals were pooled and presented as mean ± SD, referring to the number of animals (N=6).
Table 8.
Percentages of intraganglionic distribution pattern of FB+/PNX+ neuronal populations containing PACAP and located in the ipsi- and contralateral DRGs studied. Data obtained from all studied animals were pooled and presented as mean ± SD, referring to the number of animals (N=6).
| DRG subdomain | P | Cr | Cd | Cn | Md |
| Ipsilateral DRGs | 10.1 ± 5.7% | 15.9 ± 1.4% | 32.6 ± 2.7% | 11.1 ± 3.7% | 30.3 ± 2.7% |
| Contralateral DRGs | 0% | 0% | 79.9 ± 7.6% | 0% | 20.1 ± 7.9% |
Table 9.
Percentages of intraganglionic distribution pattern of FB+/PNX+ neuronal populations containing nNOS and located in the ipsilateral and contralateral DRGs studied. Data obtained from all studied animals were pooled and presented as mean ± SD, referring to the number of animals (N=6).
Table 9.
Percentages of intraganglionic distribution pattern of FB+/PNX+ neuronal populations containing nNOS and located in the ipsilateral and contralateral DRGs studied. Data obtained from all studied animals were pooled and presented as mean ± SD, referring to the number of animals (N=6).
| DRG subdomain | P | Cr | Cd | Cn | Md |
| Ipsilateral DRGs | 7.3 ± 1.6% | 22.9 ± 4.8% | 33.8 ± 3.5% | 11.7 ± 0.8% | 24.3 ± 3.6% |
| Contralateral DRGs | 29.1 ± 1.5% | 15.4 ± 3.5% | 30.6 ± 2.1% | 8.8 ± 1.1% | 16.1 ± 8.7% |
| DRG subdomain | P | Cr | Cd | Cn | Md |
| Ipsilateral DRGs | 7.3 ± 1.6% | 22.9 ± 4.8% | 33.8 ± 3.5% | 11.7 ± 0.8% | 24.3 ± 3.6% |
| Contralateral DRGs | 29.1 ± 1.5% | 15.4 ± 3.5% | 30.6 ± 2.1% | 8.8 ± 1.1% | 16.1 ± 8.7% |
Table 10.
Percentages of intraganglionic distribution pattern of FB+/PNX+ neuronal populations containing CRT and located in the ipsi- and contralateral DRGs studied. Data obtained from all studied animals were pooled and presented as mean ± SD, referring to the number of animals (N=6).
Table 10.
Percentages of intraganglionic distribution pattern of FB+/PNX+ neuronal populations containing CRT and located in the ipsi- and contralateral DRGs studied. Data obtained from all studied animals were pooled and presented as mean ± SD, referring to the number of animals (N=6).
| DRG subdomain | P | Cr | Cd | Cn | Md |
| Ipsilateral DRGs | 10.5 ± 9.1% | 0% | 54.7 ± 10.8% | 5.2 ± 4.5% | 29.6 ± 4.5% |
| Contralateral DRGs | 0% | 0% | 96.3 ± 3.7% | 0% | 3.7 ± 3.7% |
Table 11.
Percentages of intraganglionic distribution pattern of FB+/PNX+ neuronal populations containing SOM and located in the ipsilateral and the contralateral DRGs studied. Data obtained from all studied animals were pooled and presented as mean ± SD, referring to the number of animals (N=6).
Table 11.
Percentages of intraganglionic distribution pattern of FB+/PNX+ neuronal populations containing SOM and located in the ipsilateral and the contralateral DRGs studied. Data obtained from all studied animals were pooled and presented as mean ± SD, referring to the number of animals (N=6).
| DRG subdomain | P | Cr | Cd | Cn | Md |
| Ipsilateral DRGs | 11.5 ± 5.1% | 32.8 ± 4.0% | 55.7 ± 8.0% | 0% | 0% |
| Contralateral DRGs | 4.1 ± 5.5% | 0% | 95.9 ± 5.5% | 0% | 0% |
Table 12.
The relative numbers of individual, differently neurochemically coded, subpopulations of PNX+ sensory neurons supplying the urinary bladder, as determined by analysis of consecutive serial sections of the studied ganglia.
Table 12.
The relative numbers of individual, differently neurochemically coded, subpopulations of PNX+ sensory neurons supplying the urinary bladder, as determined by analysis of consecutive serial sections of the studied ganglia.
| Collocation Patterns of PNX with Different Neurotransmitters in the Bladder DRG Neurons | % |
| PNX+/SP+ | 14.6 ± 0.9 |
| PNX+/GAL+ | 3.7 ± 0.8 |
| PNX+/CGRP+ | 4.2 ± 0.8 |
| PNX+/SP+/PACAP+ | 3.5 ± 1.1 |
| PNX+/SP+/GAL+ | 6.1 ± 1.2 |
| PNX+/SP+/CGRP+ | 4.3 ± 0.8 |
| PNX+/SP+/CRT+ | 0.7 ± 0.5 |
| PNX+/SP+/NOS+ | 0.8 ± 0.9 |
| PNX+/GAL+/CGRP+ | 7.2 ± 0.8 |
| PNX+/NOS+/PACAP+ | 1.9 ± 1.1 |
| PNX+/GAL+/PACAP+ | 3.5 ± 1.9 |
| PNX+/CRT+/CGRP+ | 3.7 ± 1.3 |
| PNX+/PACAP+/CGRP+ | 2.2 ± 1.4 |
| PNX+/SP+/CGRP+/PACAP+ | 6.7 ± 2.1 |
| PNX+/SP+/GAL+/PACAP+ | 3.2 ± 1.5 |
| PNX+/SP+/GAL+/CGRP+ | 4.4 ± 0.6 |
| PNX+/SP+/GAL+/CRT+ | 8.1 ± 1.8 |
| PNX+/SP+/CGRP+/CRT+ | 0.7 ± 0.2 |
| PNX+/SP+/NOS+/PACAP+ | 2.2 ± 0.8 |
| PNX+/SP+/SOM+/CGRP+ | 0.7 ± 0.7 |
| PNX+/NOS+/PACAP+/CGRP+ | 3.0 ± 1.3 |
| PNX+/SP+/PACAP+/CRT+/CGRP+ | 2.2 ± 0.9 |
| PNX+/SP+/GAL+/PACAP+/CGRP+ | 8.5 ± 2.8 |
| PNX+/SP+/NOS+/PACAP+/CGRP+ | 1.2 ± 0.7 |
| PNX+/SP+/GAL+/NOS+/CGRP+ | 0.6 ± 0.3 |
| PNX+/SP+/SOM+/GAL+/PACAP+/CGRP+ | 2.1 ± 0.8 |
Disclaimer/Publisher’s Note: The statements, opinions and data contained in all publications are solely those of the individual author(s) and contributor(s) and not of MDPI and/or the editor(s). MDPI and/or the editor(s) disclaim responsibility for any injury to people or property resulting from any ideas, methods, instructions or products referred to in the content. |
© 2025 by the authors. Licensee MDPI, Basel, Switzerland. This article is an open access article distributed under the terms and conditions of the Creative Commons Attribution (CC BY) license (http://creativecommons.org/licenses/by/4.0/).
Copyright: This open access article is published under a Creative Commons CC BY 4.0 license, which permit the free download, distribution, and reuse, provided that the author and preprint are cited in any reuse.


