1. Introduction
Low-density DNA microarrays have emerged as essential tools in molecular diagnostics, prized for their cost-effectiveness, high sensitivity, and ease of use[
1,
2,
3,
4,
5]. Unlike high-density arrays that simultaneously analyze thousands of sequences, low-density microarrays focus on a limited set of markers, making them particularly well-suited for small laboratories and clinical environments. Their affordability and minimal infrastructure requirements have promoted their widespread adoption in fields such as infectious disease detection, pharmacogenetics, and oncology[
6,
7,
8]. For example, these microarrays have been effectively applied to diagnose tick-borne pathogens in livestock[
7], to genotype antibiotic resistance in Neisseria gonorrhoeae[
3], and to perform pharmacogenetic tests aimed at optimizing drug prescriptions[
1]. In oncology, they have been instrumental in mutational profiling for colorectal cancer[
9] and in enabling noninvasive prenatal screening for conditions like β-thalassemia[
8]. Additionally, low-density microarrays are critical for quality control during production, ensuring that probes are reliably immobilized to facilitate accurate diagnostics[
10].
Accurate spot localization is paramount in DNA microarray analysis, particularly for low-density arrays where variations in spot center positions may result from factors such as printing pin misalignment, robotic positioning errors, and slide misalignment—issues that encompass both systemic and random components[
10]. Often, not every target spot produces a detectable fluorescence signal, which limits the effectiveness of traditional intensity projection-based methods. To address this challenge, control probes are strategically positioned at predefined locations to both assess experimental performance and aid in spot localization[
1,
2,
6,
9]. By combining spot template matching with point pattern matching, robust spot detection can be achieved even under low-signal conditions. In this approach, template matching involves comparing image segments with predefined templates, while point pattern matching verifies that the detected spots conform to the expected grid layout[
11,
12,
13].
A significant challenge in this methodology arises from common image artifacts, including bright specks, elevated background fluorescence, dust, and scratches[
10]. Although the inherent circular shape of spots suggests the use of circular templates for matching[
14,
15,
16], the considerable variability in spot fluorescence necessitates a normalization process—typically implemented through cross-correlation—which in turn requires computing the template’s signal root mean square (RMS) power. This computation can be particularly intensive.
Modern CPUs, featuring multicore architectures, advanced cache hierarchies, and vector processing units, enable significant performance improvements through cache-efficient parallelization and vectorized programming[
17,
18,
19]. These technologies accelerate convolution operations, such as those needed for cross-correlation and RMS power calculations. Given that the primary goal is to localize spots rather than to quantitatively assess probe responses, a box (square) template is proposed as an alternative to circular templates. Box templates allow for separable filtering and facilitate the use of moving average techniques in each direction, thereby substantially reducing computational overhead. When the use of a square template does not compromise detection performance, it can dramatically reduce the time required for spot localization—a critical benefit for high-throughput applications.
In this paper, we present a rapid spot locating method that leverages vectorized programming and square template matching to overcome the computational challenges associated with normalized correlation. This method is designed to enhance both the efficiency and robustness of spot detection in low-density DNA microarrays, providing critical benefits in resource-constrained and high-throughput diagnostic applications. The proposed approach was further validated using images from HPV genotyping of patient samples on a commercial DNA microarray, demonstrating its applicability in clinical settings.
2. Materials and Methods
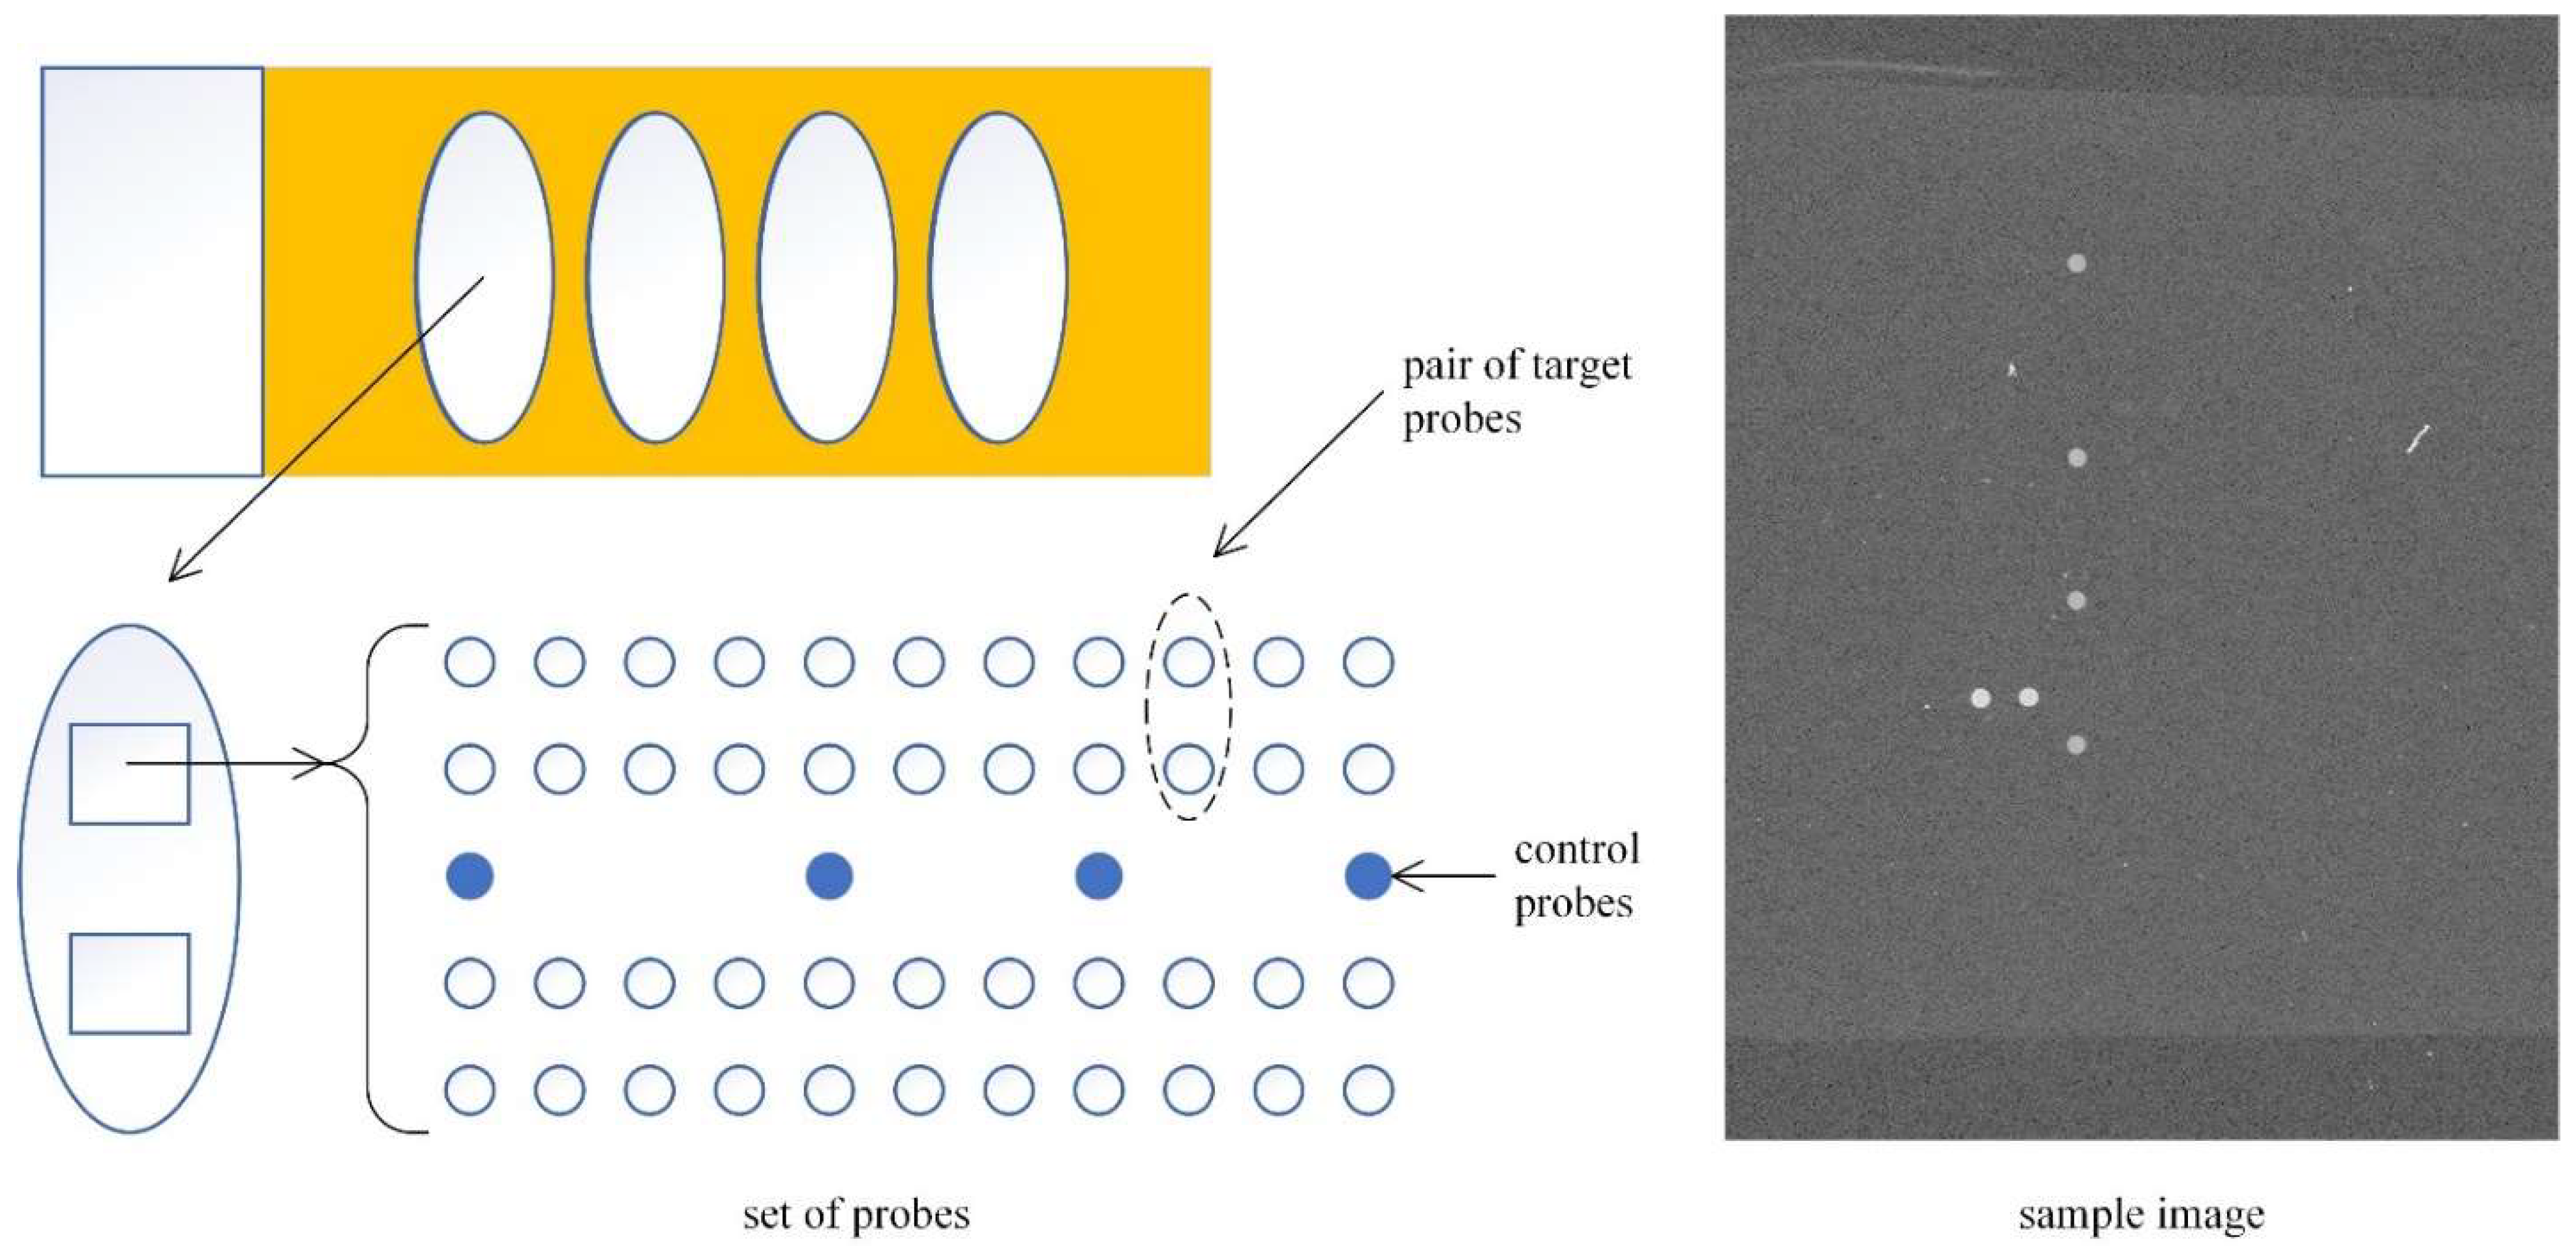
2.1. Experimental Images
The proposed method was tested using patient images obtained from the HPVDNAChip™ (Biomedlab Co., Korea),a microarray designed to detect human papillomavirus (HPV) infection, one of the primary causes of cervical cancer. The layout of the microarray is depicted in
Figure 1. Each slide comprises of four chambers, with each chamber allocated for a single patient sample. To enhance diagnostic reliability, each chamber contains two identical sets of probe spots, composed of four control probes and twenty-two pairs of HPV type-specific oligonucleotide target probes. Each HPV type probe appears twice as a pair, and since two sets exist within each chamber, there are four probes for each HPV type in total. The four human β-globin control probes in each set are used to determine the reference position of a probe set and verify the hybridization process.
Target DNA is extracted from clinical samples, amplified via polymerase chain reaction (PCR), and hybridized onto the chip. During PCR amplification, Cy5 dye is randomly incorporated, allowing hybridization sites to be visualized when scanned with a microarray scanner.
Probes were printed using a microarray spotter equipped with a 100 μm nozzle and subsequently scanned at a 10 μm resolution, yielding a spot radius of approximately 10 pixels. The probe spacing is 300 μm, which translates to a 30-pixel gap between adjacent spots. Consequently, the relative distances of the control spots from the topmost spot are 120, 210, and 300 pixels, respectively.
The scanner captures eight predefined regions on the microarray, each containing a set of spots, and stores the data as 16-bit grayscale images. Each microarray can accommodate up to eight images, with two images assigned per patient. A representative example of the sample image is shown in
Figure 1. A total of 1,546 images from 773 patient samples were obtained as a dataset in this study.
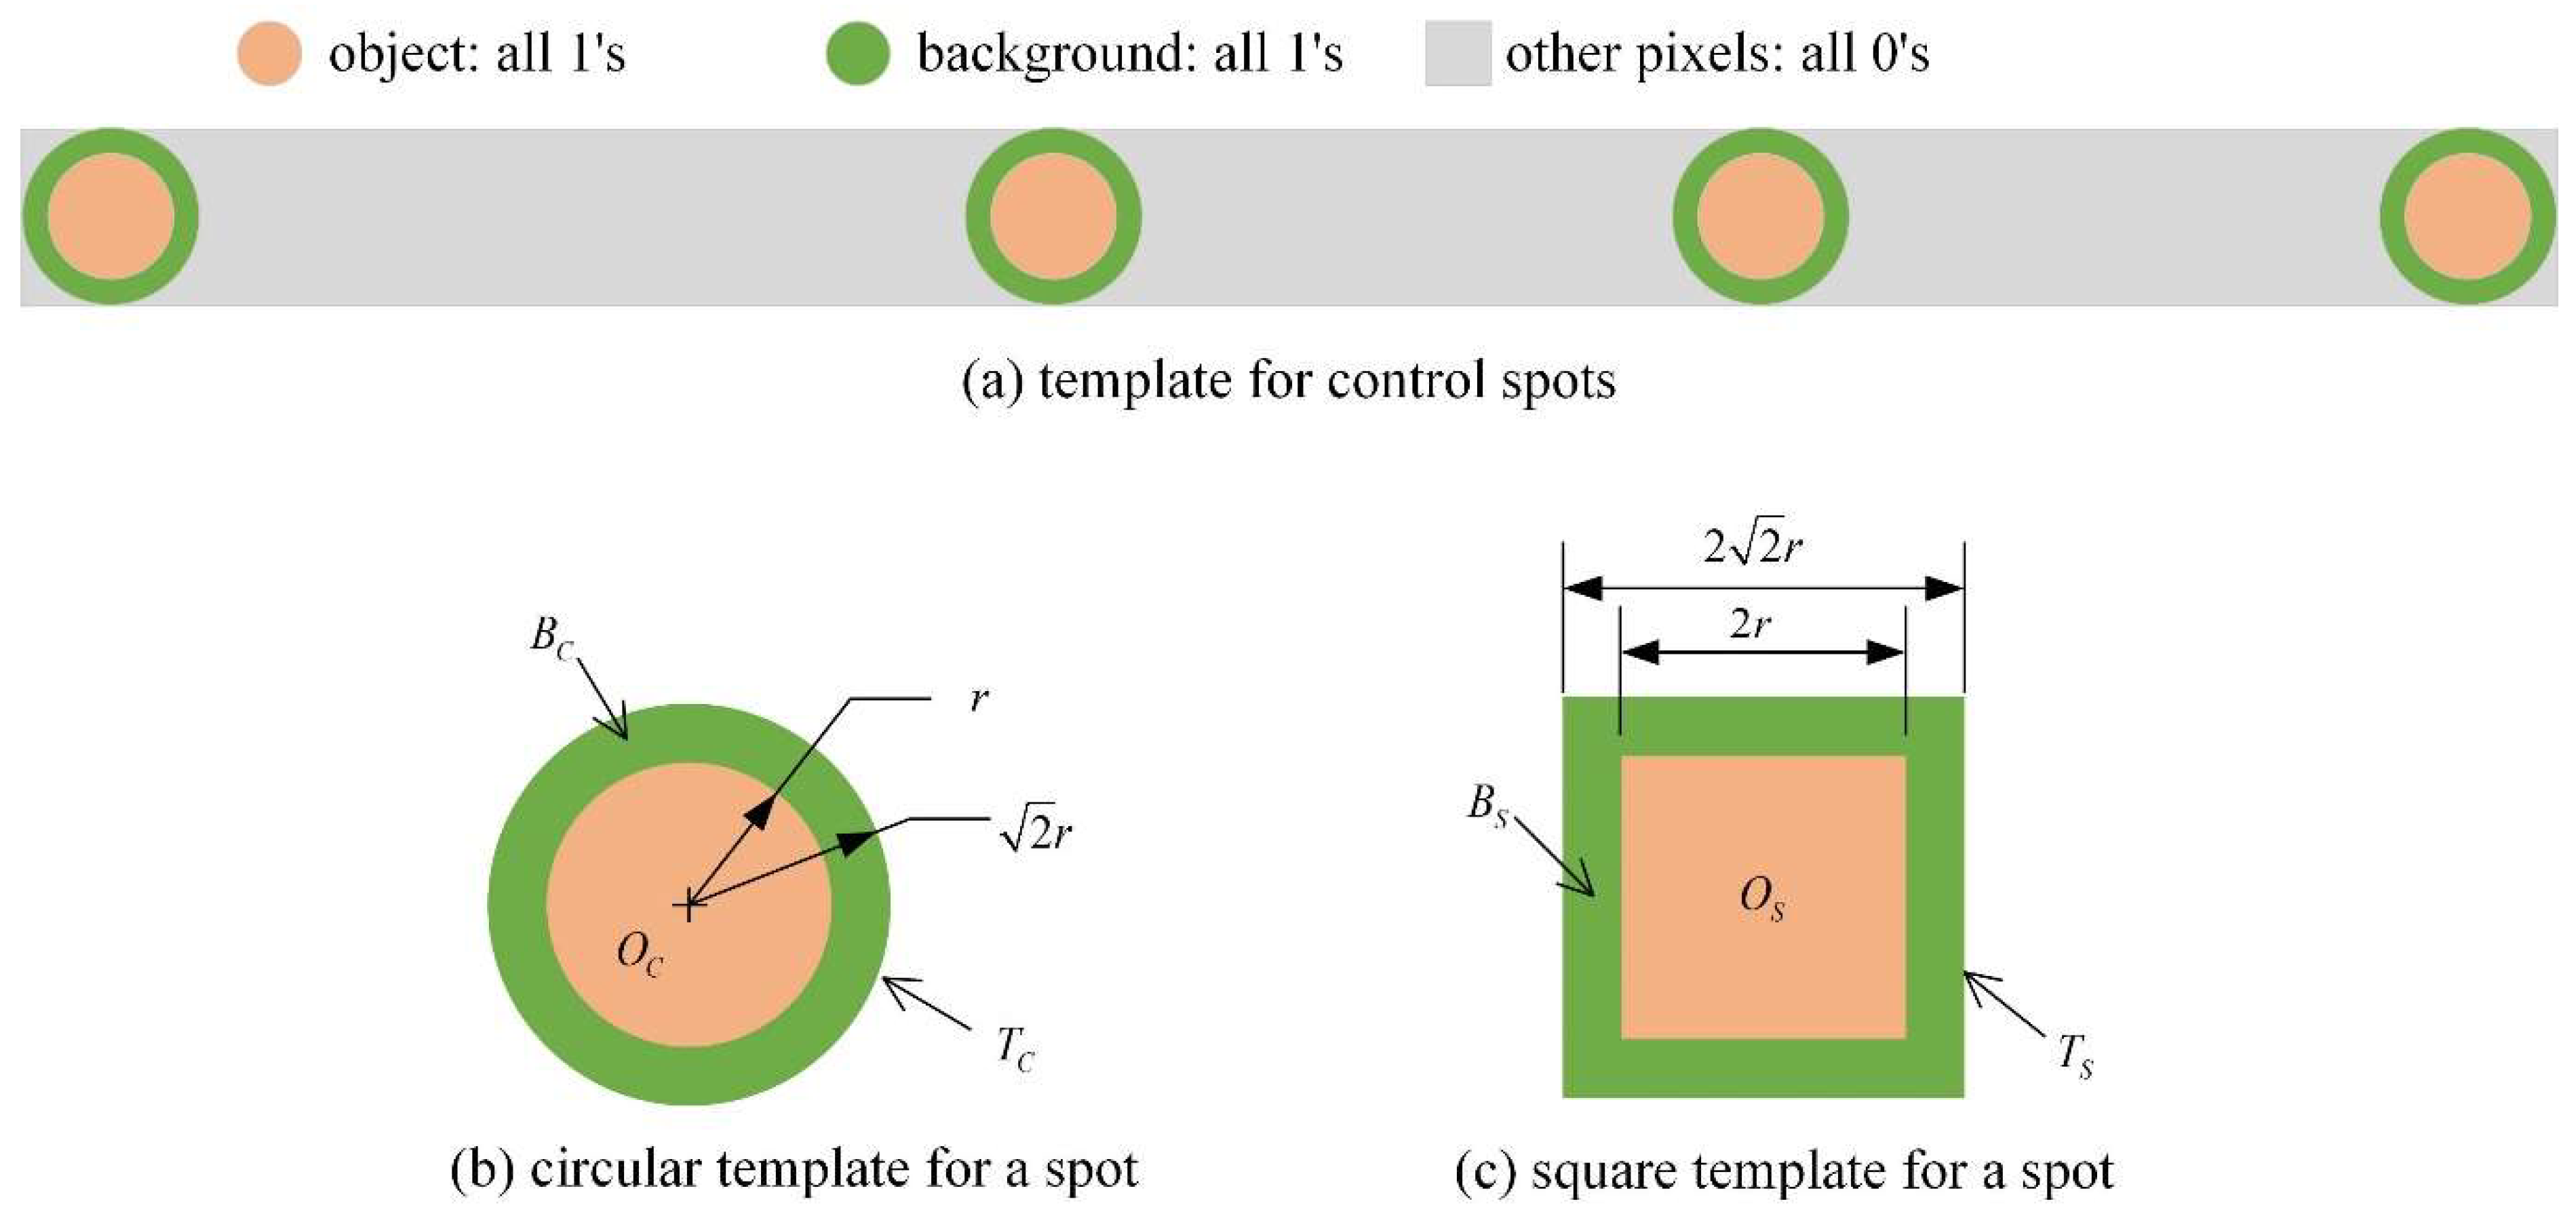
2.2. Template Matching
The control spot pattern template (
Figure 2(a)) can be utilized for accurate location of the set of spots within an image. The template provides the highest matching response at the position of the control spots. Within the template, a stable response can be acquired without explicit background elimination by selecting a background region (Bc/Bs) that has the same pixel count as the object area (Oc/Os) and assigning a kernel value of -1.
Since the computational complexity of convolution operations is proportional to the square of the template size, and normalized correlation is required to account for significant variations in spot intensity, directly computing normalized correlation for the entire control spot template (
Figure 2(a)) leads to high computational complexity.
A more computationally efficient alternative involves computing circular spot template matching responses (
Figure 2(b)) and subsequently deriving the point pattern matching, i.e., constellation matching response (CMR) using the following equation:
where
’s represents the spot matching responses at the corresponding positions. And
,
, and
, which are the relative distances of the 2nd, 3rd, and 4th control spots from 1st control spot, are 120, 210, and 300 pixels, respectively.
On the other hand, if a square template (as shown in
Figure 2(c)) performs well, computational cost can be significantly reduced further. Unlike circular templates, square templates can be separable in horizontal and vertical directions, allowing for efficient 1D convolution operations[
20]. Additionally, moving average filtering can be applied to further optimize the calculations.
2.3. Spot Template Matching Response Calculation
The spot template response is calculated using the normalized correlation method:
where
,
,
,
,
, and
are the normalized correlation, input image, template, RMS signal power over the template area, convolution operator and a constant implying the template RMS power.
The denominator of the normalized correlation is computed as the cross-correlation between the input image and the template. Since convolution operations are well-optimized in most programming languages, we implemented the method using Python NumPy and OpenCV. These libraries leverage Single Instruction Multiple Data (SIMD), pipelining, and vectorized programming techniques, ensuring efficient computation.
Similar to the cross-correlation computation, the local RMS power can also be efficiently calculated using convolution:
where
P is a kernel with a value of 1 throughout the template domain.
The convolutions of the circular and square templates are performed using OpenCV’s ‘filter2D’ and ‘boxFilter’ functions, respectively. Both functions are designed with efficient vectorization techniques, and ‘boxFilter’ in particular fully incorporates separable 1D filtering and moving average calculations as described earlier [
20].
Figure 3 illustrates the steps involved in computing the CMR.
Figure 3(b) shows the spot template matching response derived from
Figure 3(a), while
Figure 3(c) presents the CMR obtained from the normalized correlation image (
Figure 3(b)). The CMR search area is limited to the upper 200×200 pixels, assuming a 1 mm deviation of the spot set (equivalent to 100 pixels).
2.4. Verification of Control Spot Localization Performance
Since the spot diameter is 10 pixels, a circular template with a radius of 5 pixels was used to determine the first control spot by maximizing the CMR response. This location was overlaid as a circle on the input images for visual inspection. The input images were gamma-corrected (γ = 2) and pseudo-colored using the ’jet’ colormap to facilitate easier interpretation.
The difference between the first and second peak values in the CMR response was used to assess the reliability of peak detection. A relative gain metric was defined to determine the optimal template radius:
where
and
represent the first and second peak values, respectively, and
is the relative gain of each CMR image.
The algorithm identifies the second peak in the normalized correlation image after detecting the first. Once the first peak is found, the template-sized region surrounding it is set to zero, effectively removing it. The highest value in the resulting image is then identified as the second peak.
The template radius, which defines the half-size of the spot template used in matching, was optimized to enhance detection reliability. A range of candidate radii was evaluated using experimental images. For each radius, the relative gain between the first and second peaks (which measure how much higher the first peak is compared to the second) was calculated for all test images. The minimum relative gain (worst-case scenario) across those images was recorded for each radius. The optimal radius was chosen as the one that maximized this minimum relative gain across all test images. After determining this radius, the spot localization accuracy was reassessed by visually inspecting all images to confirm that the spots were correctly identified.
An excessively small or large radius may cause a significant deviation in the detected spot location from the true spot center. In the dataset used in this study, spots are spaced 30 pixels apart (~300 µm) with a spot diameter of approximately 10 pixels. This allows for a localization error of up to ±10 pixels without compromising probe detection accuracy.
Figure 4 illustrates the impact of a 10-pixel misalignment on control spot localization.
Figure 4(a) shows when control spots are perfectly aligned with their true positions, and the probe judgment grid (designated detection region) precisely overlaps with its corresponding spot. The probes are still correctly identified when control spots are misaligned by 10 pixels in both x and y directions, as the spots remain inside their respective boundaries as shown in
Figure 4(b). This ensures that a 10-pixel offset does not result in misclassification with a neighboring region each spot remains within its designated grid region. The effect of misalignment is demonstrated in
Figure 4(c) where the grid is overlaid on the normalized correlation image. When the normalized correlation value is used as a probe classification criterion, the peak value within each probe’s designated region is used for probe classification. In this case, a 10-pixel misalignment remains within an acceptable margin, ensuring classification robustness.
For non-control spots, the classification of each probe is determined based on its intensity. A spot is classified as positive if it appears bright and negative if it appears dark. Alternatively, normalized correlation values can also be used for classification, where a high correlation value indicates a positive probe and a low correlation value suggests a negative probe. Based on these findings, a localization error of up to 10 pixels was deemed acceptable for practical applications.
In the square template experiments, the results were compared with those from the optimal circular template. The relative gain was analyzed for cases where the maximum deviation remained within 10 pixels.
3. Results
3.1. Computation Time Analysis
Table 1 presents the average computation times for various vectorized operations required for CMR calculation using experimental images on both a PC (Windows 11) and a Raspberry Pi 4 (Debian 12). The experimental images had a resolution of 520 × 700 pixels, with each pixel stored as a 32-bit floating-point value.
The first data row reports the execution time for computing the square using a for-loop, serving as a baseline reference to emphasize the necessity of vectorized operations, particularly in embedded systems such as the Raspberry Pi.
The second to fourth rows summarize the computation times for point-wise and element-wise image operations, including square computation, square root computation, and image addition. While these operations exhibited similar performance on the PC, the Raspberry Pi required approximately three times longer for square root computation.
The fifth and sixth rows shows the computational bottleneck caused by convolution operations. Circular template convolution took more than 75 times longer, whereas using a square template significantly reduced the computation time to approximately eight times that of the baseline.
The time required to generate the CMR image from the input image and to identify the highest-intensity location is recorded in the “square locating” and “circle locating” rows. The final row presents the time ratio between these two methods.
While the PC was approximately ten times faster than the Raspberry Pi, the performance benefits of vectorized computation and the use of a square template for computational efficiency remained consistent across both platforms.
The implementation of vectorized operations was crucial for both platforms, as non-vectorized calculations proved to be impractically slow on the Raspberry Pi. The use of a square template resulted in a fourfold improvement in processing speed, and this trend was consistently observed on both systems.
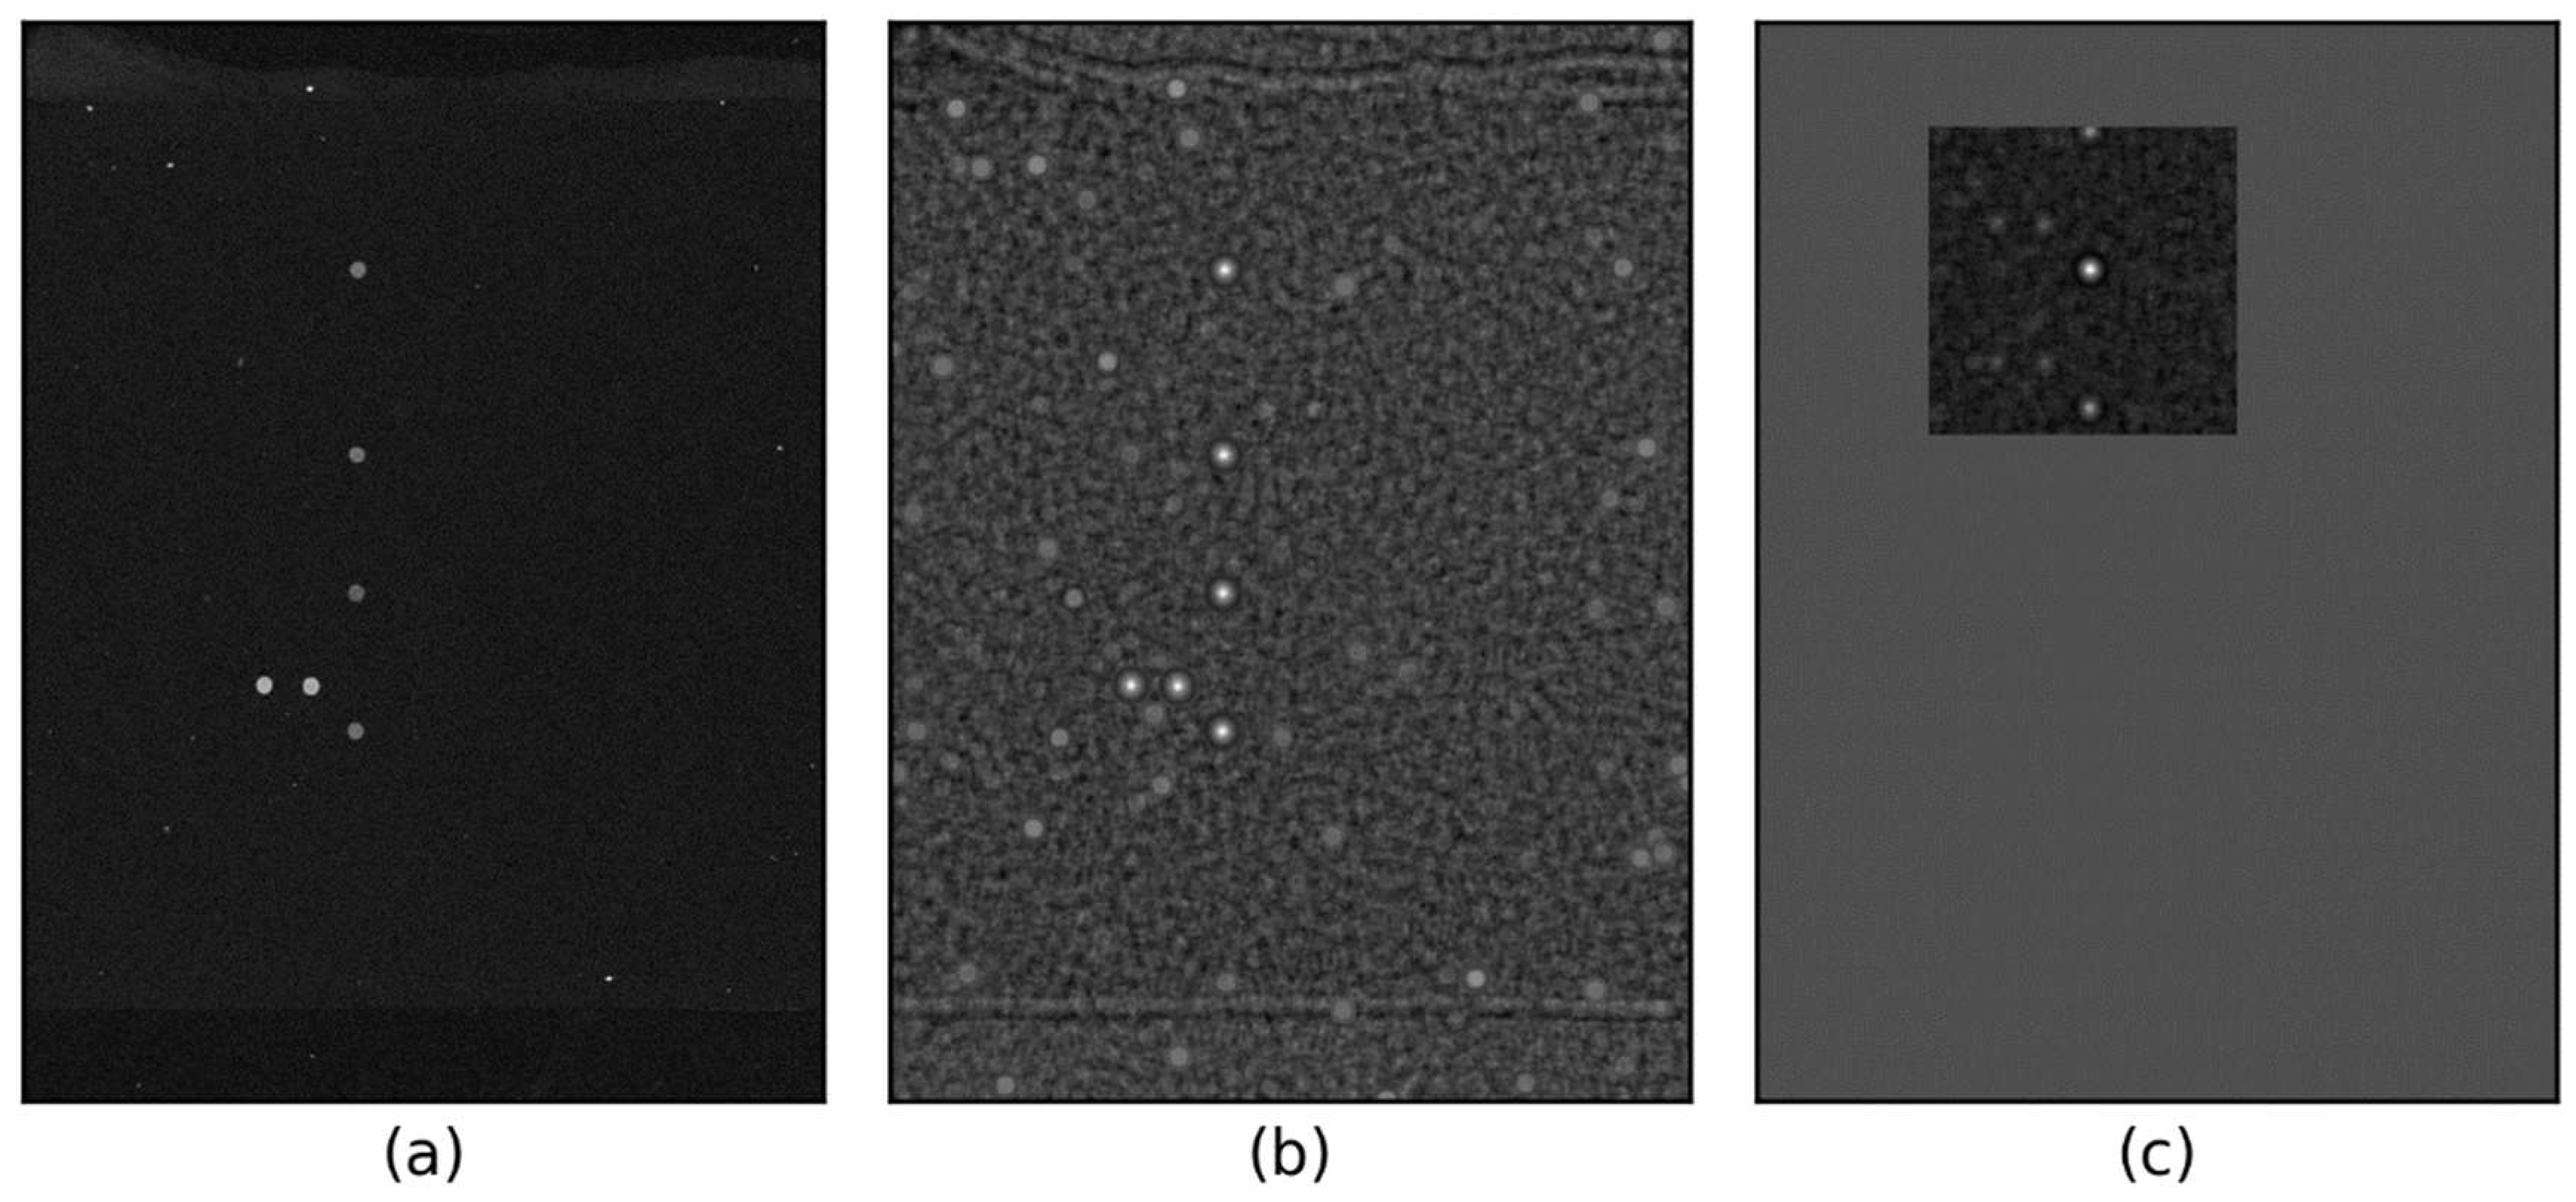
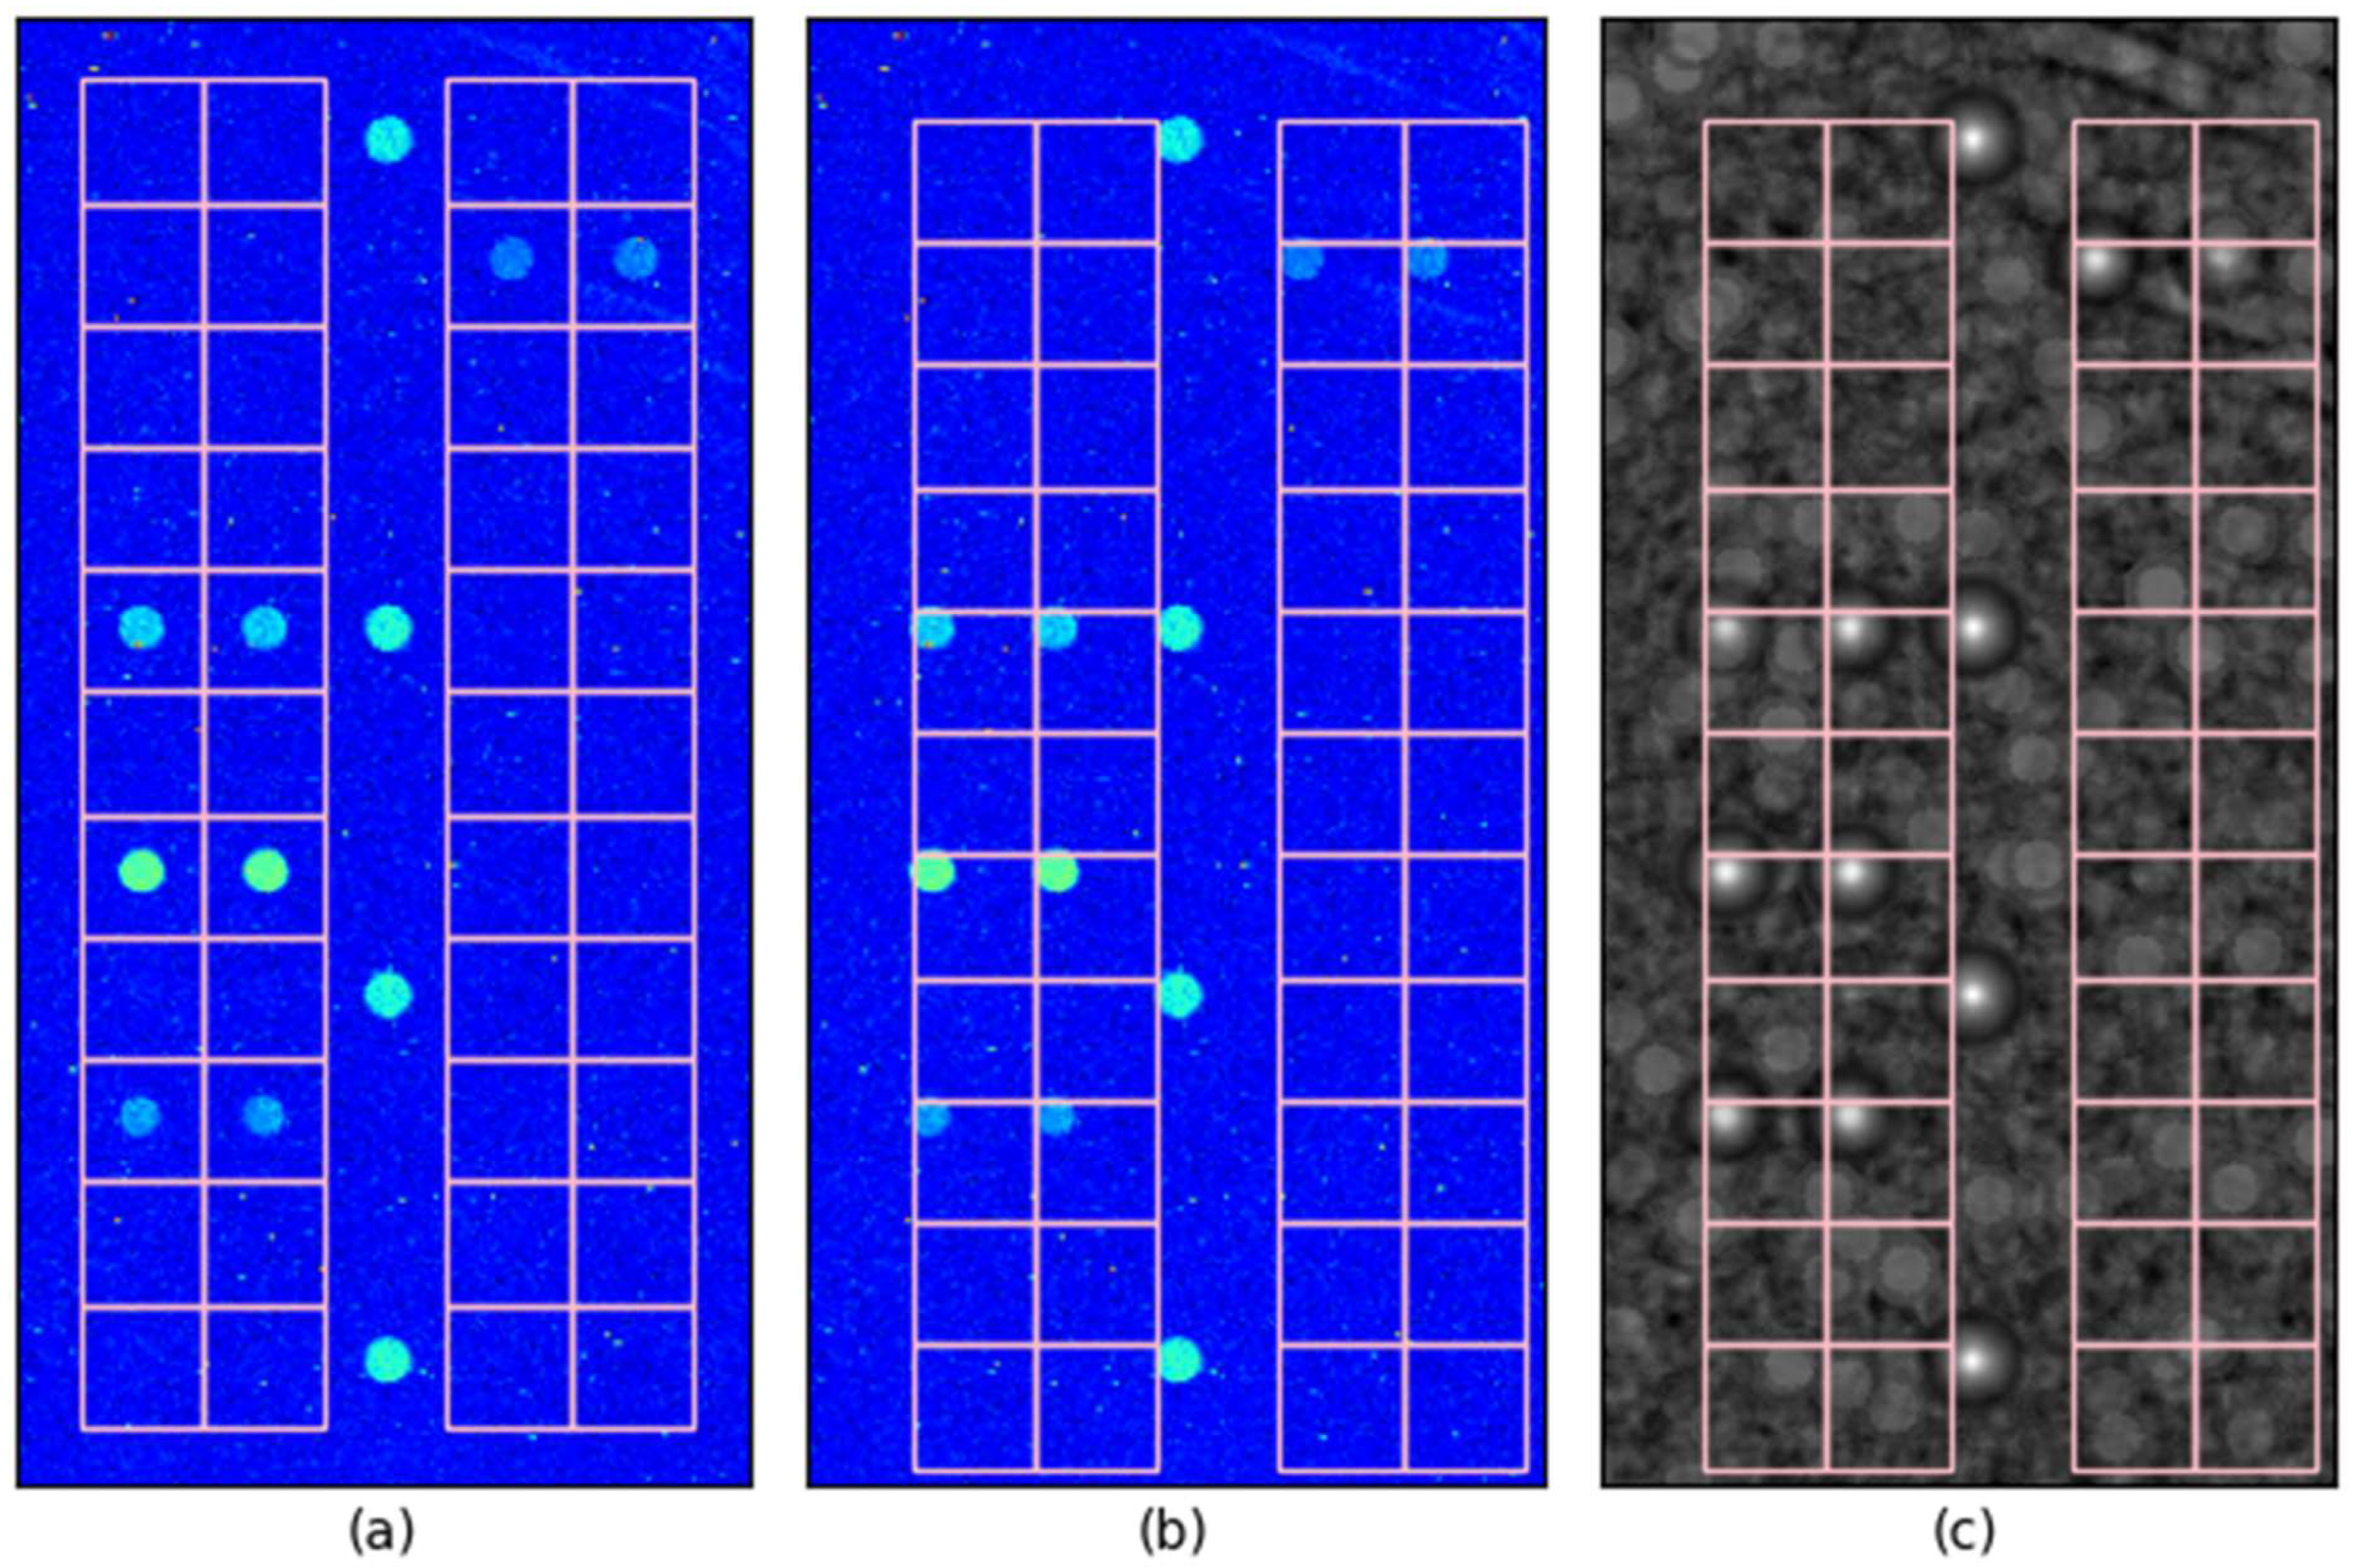
3.2. Visual Inspection of Spot Locating
To verify that the detected spot positions were not at the boundaries of the search area, we visually inspected the first detected spot in all experimental images using a circular template.
Figure 5 presents a scatter plot of the detected 1
st spot positions in all experimental images. The pink circle represents the predefined initial position of the 1
st spot, where the control spots are searched over ±1 mm area. The vertical deviation was measured as 122 pixels (1.22 mm), and the horizontal deviation was 85 pixels (0.85 mm), both within the search range.
Although the initial position was not centered in the distribution, it could be recalibrated during the device calibration process. However, if the proposed fast locating method reliably detects the correct position, recalibration may be unnecessary by the allocating the broader search area. Currently ±1mm search area was sufficient for the given data set.
To further verify the spot detection accuracy, we overlaid a red circle with a radius of 6 pixels at each detected control probe location in all images. For better visualization, images were clipped around the control probe with a margin equal to the search area, gamma-enhanced (γ=2), and pseudo-colored using the ‘jet’ colormap.
Figure 6 illustrates representative cases, including an image with well-defined control spots and three images where detection could be challenging. The proposed method successfully detected the control spots even in cases where the control spots were faint, one of the control spots had a defect, and the background was highly contaminated due to inadequate washing, which is shown in
Figure 6 (b), (c), and (d), respectively.
3.3. Optimal Template Size Selection
To determine the optimal template size for spot normalization correlation, we examined the minimum relative gain and the maximum absolute deviation. As shown in
Table 2 and
Table 3, the safest choice was a circular template with a radius of 6 pixels, as it exhibited the highest minimum relative gain. For circular templates, radii of 6–9 pixels yielded relative gains exceeding 5%, while for square templates, the optimal range was 5–7 pixels.
Figure 7 presents the relative gain histogram when using a radius of 6 pixels. As illustrated in
Figure 7, circular templates demonstrated a superior relative gain.
Figure 8 compares the images corresponding to the two lowest and two highest relative gains obtained using circular and square templates. One of the images exhibited the lowest relative gain with the circular template, while the same image showed the second-lowest relative gain with the square template, resulting in a total of only three unique images being presented.
In all three cases, gamma correction with γ = 5 was required to make the control probes visually distinguishable. Despite the control probes being faint, the relative gain remained above 24% when using the square template. These results indicate that the square template is sufficiently stable for processing images of the quality examined in this study.
4. Discussion
In this study, we introduced a rapid and robust spot locating method for low-density DNA microarrays by employing normalized correlation-based template matching combined with constellation matching. By opting for normalized correlation over traditional cross-correlation, we effectively compensated for significant variations in fluorescence intensity, thereby enhancing the accuracy of spot detection. The implementation of an optimal template size determination further ensured the stability of detection across varying data characteristics.
To address the high computational demands associated with normalized correlation, vectorized programming techniques and the use of square templates were integrated into the processing workflow. The application of square templates facilitated separable filtering and the use of moving average algorithms, resulting in an approximately fourfold reduction in processing time. . This improvement in efficiency provides critical benefits in resource-constrained and high-throughput diagnostic applications. Furthermore, the compatibility and consistent performance of the proposed method in embedded systems further extends the applicability of proposed method in point-of-care diagnostic devices.
Moreover, our analysis revealed discrepancies between the expression patterns of target spots and control spots within the dataset. This finding underscores the need for reconsidering control probe placement strategies in future DNA microarray designs—such as arranging control probes in a grid formation or positioning them along the array periphery—to better facilitate negative pattern matching through constellation matching. Additionally, the responses derived from constellation matching showed great potential for evaluating both lot quality and individual microarray performance, thereby enhancing overall quality control measures.
5. Conclusions
This study demonstrates that the integration of normalized correlation and constellation matching yields a high-speed spot detection method that significantly improves the analytical efficiency of low-density DNA microarrays. The incorporation of vectorized programming and square templates enables substantial reductions in processing time without compromising detection accuracy, making the approach highly suitable for embedded systems and on-site diagnostic applications. Future research should focus on optimizing control probe designs and incorporating additional quality control strategies to further expand the practical applicability of the proposed method.
Author Contributions
Conceptualization, S.H.K. and J.D.K.; methodology, MG.K. and J.K.; software, J.D.K.; validation, MG.K. and J.K.; formal analysis, J.D.K.; investigation, MG.K.; writing—original draft preparation, MG.K.; writing—review and editing, S.H.K. and J.D.K.; visualization, MG.K.; supervision, S.H.K. and J.D.K.; project administration, J.D.K.; funding acquisition, S.H.K. All authors have read and agreed to the published version of the manuscript.
Funding:
Institutional Review Board Statement
A study involving humans or animals is absent.
Informed Consent Statement
A study involving humans is absent.
Data Availability Statement
Not applicable.
Conflicts of Interest
The authors declare no conflict of interest.
References
- Ikonnikova A, Morozova A, Antonova O, Ochneva A, Fedoseeva E, Abramova O, Emelyanova M, Filippova M, Morozova I, Zorkina Y, Syunyakov T, Andryushchenko A, Andreuyk D, Kostyuk G, Gryadunov D. Evaluation of the Polygenic Risk Score for Alzheimer’s Disease in Russian Patients with Dementia Using a Low-Density Hydrogel Oligonucleotide Microarray. International Journal of Molecular Sciences. 2023 Jan;24(19):14765.
- Das A, Santhosh S, Giridhar M, Behr J, Michel T, Schaudy E, Ibáñez-Redín G, Lietard J, Somoza MM. Dipodal Silanes Greatly Stabilize Glass Surface Functionalization for DNA Microarray Synthesis and High-Throughput Biological Assays. Anal Chem. 2023 Oct 17;95(41):15384–93.
- Shaskolskiy B, Kandinov I, Kravtsov D, Vinokurova A, Gorshkova S, Filippova M, Kubanov A, Solomka V, Deryabin D, Dementieva E, Gryadunov D. Hydrogel Droplet Microarray for Genotyping Antimicrobial Resistance Determinants in Neisseria gonorrhoeae Isolates. Polymers. 2021 Jan;13(22):3889.
- Waldmüller S, Freund P, Mauch S, Toder R, Vosberg HP. Low-density DNA microarrays are versatile tools to screen for known mutations in hypertrophic cardiomyopathy. Human Mutation. 2002;19(5):560–9.
- de Longueville F, Surry D, Meneses-Lorente G, Bertholet V, Talbot V, Evrard S, Chandelier N, Pike A, Worboys P, Rasson JP, Le Bourdellès B, Remacle J. Gene expression profiling of drug metabolism and toxicology markers using a low-density DNA microarray. Biochemical Pharmacology. 2002 Jul 1;64(1):137–49.
- Ma X, Li Y, Liang Y, Liu Y, Yu L, Li C, Liu Q, Chen L. Development of a DNA microarray assay for rapid detection of fifteen bacterial pathogens in pneumonia. BMC Microbiol. 2020 Dec;20(1):177.
- Abanda B, Paguem A, Achukwi MD, Renz A, Eisenbarth A. Development of a Low-Density DNA Microarray for Detecting Tick-Borne Bacterial and Piroplasmid Pathogens in African Cattle. Trop Med Infect Dis. 2019 Apr 12;4(2):64.
- Galbiati S, Damin F, Di Carlo G, Ferrari M, Cremonesi L, Chiari M. Development of new substrates for high-sensitive genotyping of minority mutated alleles. ELECTROPHORESIS. 2008;29(23):4714–22.
- Damin F, Galbiati S, Soriani N, Burgio V, Ronzoni M, Ferrari M, Chiari M. Analysis of KRAS, NRAS and BRAF mutational profile by combination of in-tube hybridization and universal tag-microarray in tumor tissue and plasma of colorectal cancer patients. PLOS ONE. 2018 18;13(12):e0207876.
- Davies SW, Seale DA. DNA Microarray Stochastic Model. IEEE Trans.on Nanobioscience. 2005 Sep;4(3):248–54.
- Ryu M, Kim JD, Min BG, Kim J, Kim YY. Probe classification of on-off type DNA microarray images with a nonlinear matching measure. J Biomed Opt. 2006;11(1):014027.
- Ryu M, Dae Kim J, Goo Min B, Pang MG, Kim J. Nonlinear matching measure for the analysis of on-off type DNA microarray images. J Biomed Opt. 2004;9(3):432.
- Sako H, Fujio M, Furukawa N. The constellation matching and its application. In: Proceedings 2001 International Conference on Image Processing (Cat No01CH37205) [Internet]. 2001 [cited 2025 Feb 11]. p. 790–3 vol.1. Available from: https://ieeexplore.ieee.org/abstract/document/959164.
- Neal FB, Russ JC. Measuring Shape. CRC Press; 2012. 443 p.
- Russ, JC. The Image Processing Handbook. 5th ed. Boca Raton: CRC Press; 2006. 832 p.
- Qin L, Rueda L, Ali A, Ngom A. Spot Detection and Image Segmentation in DNA??Microarray Data: Applied Bioinformatics. 2005;4(1):1–11.
- Jones, NL. Fast annual daylighting simulation and high dynamic range image processing using NumPy. Science and Technology for the Built Environment. 2024 Apr 20;30(4):327–40.
- Watkinson N, Tai P, Nicolau A, Veidenbaum A. NumbaSummarizer: A Python Library for Simplified Vectorization Reports. In: 2020 IEEE International Parallel and Distributed Processing Symposium Workshops (IPDPSW) [Internet]. New Orleans, LA, USA: IEEE; 2020 [cited 2025 Feb 18]. p. 1–7. Available from: https://ieeexplore.ieee.org/document/9150361/.
- Maeda Y, Fukushima N, Matsuo H. Taxonomy of Vectorization Patterns of Programming for FIR Image Filters Using Kernel Subsampling and New One. Applied Sciences. 2018 Jul 26;8(8):1235.
- Szeliski R. Computer Vision: Algorithms and Applications, 2nd Edition.
|
Disclaimer/Publisher’s Note: The statements, opinions and data contained in all publications are solely those of the individual author(s) and contributor(s) and not of MDPI and/or the editor(s). MDPI and/or the editor(s) disclaim responsibility for any injury to people or property resulting from any ideas, methods, instructions or products referred to in the content. |
© 2025 by the authors. Licensee MDPI, Basel, Switzerland. This article is an open access article distributed under the terms and conditions of the Creative Commons Attribution (CC BY) license (http://creativecommons.org/licenses/by/4.0/).