
Submitted:
03 March 2025
Posted:
04 March 2025
You are already at the latest version
Abstract
Rainfall datasets from Uganda National Meteorological Authority (UNMA) for 1981-2017 and two reanaly-sis datasets (Climate Hazards Group Infrared Precipitation with Stations data (CHIRPS) and Tropical Applica-tions of Meteorology using Satellite data (TAMSAT) were used to compute drought and flood tendencies over from 1981 to 2017. Cumulative departure index (CDI), and rainfall anomaly index (RAI), were computed to show drought and flood tendencies in the region. Meanwhile; Dry Days (DD) and Wet Days (WD) were computed based on the definition as a day of the season with rainfall amount less than 1.0 mm and greater than 1.0 mm respec-tively. The CDI graphics indicated below-average rainfall during 1981-1987 and relatively wetter conditions dur-ing 1989-1995 for all stations in the region. Generally, a seasonal rainfall declined over the first 27 years but an in-creasing trend in both MAM (March-April-May) and SOND (September-October-November-December) is observed in most stations during 2006-2017. The highly variable seasonal rainfall in the region is expected to impact the livelihoods of the communities. This study recommends use of tailor-made weather and climate information for planning economic development programs such as agriculture will play a critical role in improving the livelihood of the communities in the region.
Keywords:
rainfall variability
; rainfall anomaly index (RAI)
; cumulative departure index (CDI)
; Lake Kyoga Basin
; Uganda
1. Introduction
African countries are expected to be the most affected by climate change and variability yet are the least prepared to deal with the effects [1,2,3,4,5,6]. Climate change is also emerging as one of the main challenges humankind will have to face for many years to come. It could become a major threat to world food security, as it has a strong impact on food production, access, and distribution[7]. Across East Africa(EA), rainfall is predicted to increase by 5-20% during the December to February rainy season and by 5-10% between the June and August rainy seasons [8]. In Uganda, it is stated that current average temperatures are expected to increase by between 0.7oC and 1.5oC by the 2020s [9], however, this will be interrupted by the naturally variable climate by high spatial and temporal variability of rainfall largely explained by natural phenomena such as the El Niño and Southern Oscillation (ENSO)[10,11]
Climate variability and recent change have exposed most parts of the east African region to poverty and hunger [12,13], starvation, and death as recently in northeastern Uganda. This is exacerbated by the impact of unreliable weather patterns usually resulting in worse food insecurity in the region [14]. Precipitation variability is expected to intensify the magnitude and frequency of flood and drought events that negatively affect agricultural sectors in most countries of EA[4,15], yet the increasing human population continues to exert pressure on food security, worsening the already fragile situation[16]
Climate variability impacts have the potential to undermine and even, undo the progress made in improving the socio-economic well-being of countries, especially those that rely on natural weather systems for agriculture like Uganda [17]. Furthermore, given an estimate of 80% of farmers produce food primarily to meet their family needs, rural poverty in Uganda could be worsening with climate change and due to their low income, lower technological and capital stocks, households are predicted to have limited options to adapt to climate change[6,18,19]
There have been general studies that quantify the effect of climate change and variability in Uganda[19,20,21,22], but these cannot be used for adaptation at the local level. Further, the recent trends in temperature and rainfall to date weather and climate information needs to be frequently generated to aid in making both strategic and tactical decisions. There is a need for proper planning of agricultural activities around the Lake Kyoga Basin based on reliable weather and climate information to adapt to climate variability with its associated implications on food security, poverty, and health-related challenges.
The remaining sections of this study are structured as follows: Section 2 describes the study area, meanwhile; section 3 is reserved for data and methods, while section 4 presents the main results, section 5 is for discussions. The conclusions and recommendations are highlighted in section 6.
2. Study Area
The study area lies along geographical latitude, and longitude of 0°13'N, 3°41N, and longitude 32°02'E, 34°52'E. The Lake Kyoga Basin is among the largest Basins in Uganda (Figure 1).
Generally, the Lake Kyoga basin is a low laying area with an elevation ranging between 450 meters to 867 meters as per the Shuttle Radar Topography Mission digital model (SRTM) released in 2004. The climate of the basin is modified by the large swampy surrounding area. The basin has a rainy season from March to November, with a marked minimum in June, and marked peaks in April to May and August to October while December and January are the driest months.
3. Materials and Methods
3.1. Materials
3.1.1. Observed Station Climate Data
The in-situ daily and monthly rainfall climate data were obtained from the Uganda National Meteorological Authority for Namulonge, Tororo, Soroti Jinja, Lira, Serere, Kiige, Buginyanya, Kotido, and Namalu stations. The duration for all datasets was taken in the range of 1981 to 2017 collected from manual instruments; The stations are presented in Fig.1 and Table 1. The quality control measures for the observed rainfall dataset included; checks control to identify the negative precipitations values, typing errors to identify gaps in the dataset, and false zeros [23]. All the rainfall data were processed through an extensive series of quality control procedures to ensure erroneous values such as errors in manual keying; negative daily precipitation amounts have been removed and/or identified. Some stations such as Namulonge, Tororo, Soroti, Jinja, and Lira had daily rainfall datasets which is required for the determination of critical phenomena like onset and cessation of rainfall. The remaining station had only monthly rainfall totals, these include; Jinja, Nakasongola, Serere, Kiige, Buginyanya, Kotido, and Namalu, thus unable to determine the onset and cessations in these rainfall stations and zones. Nearly all the stations didn’t have complete temperature datasets (except for Soroti and Jinja, both located at the airfield).
3.1.2. Climate Hazards Group Infrared Precipitation with Stations Data (CHIRPS)
The gridded precipitation of the spatial resolution of 0.05°x 0.05° for 1981 to 2017 was sourced from Climate Hazards Group Infrared Precipitation with Stations data (CHIRPS). CHIRPS is a product developed by merging three types of high resolution data including; global climatology, satellite estimates, and in situ observations employing a combination of interpolation techniques, which improved rainfall products [24] Funk et al., [24] provides an elaborated detail of CHIPRPS data. Over EA, the lack of well-distributed and managed rain gauge is a challenge to spatial analysis of climate data [25], which can only be overcome by the use of satellite or reanalysis datasets. Data can be accessed through webpage; https://data.chc.ucsb.edu/products/CHIRPS-2.0/global_daily/netcdf/p25/
3.1.3. TAMSAT Precipitation Data
TAMSAT (Tropical Applications of Meteorology using Satellite data) precipitation data is a widely used dataset for monitoring and studying rainfall patterns in Africa. The data has spatial resolution: 0.0375° × 0.0375° (approximately 4 km × 4 km) and temporal resolution: daily, 10-daily, and monthly [26]. TAMSAT precipitation data is available from 1983 to present, and can be accessed through the links; https://data.tamsat.org.uk/data-download/rainfall/; and https://research.reading.ac.uk/tamsat/regridded-files/
TAMSAT precipitation data is derived from a combination of satellite and ground-based observations such as Geostationary satellite images from the European Organisation for the Exploitation of Meteorological Satellites (EUMETSAT); Rain gauge data from ground-based rainfall measurements from national meteorological agencies and research institutions and, finally; Tropical Rainfall Measuring Mission (TRMM) satellite data (until 2015). The TAMSAT algorithm uses a combination of techniques to estimate rainfall from satellite data, including; Cold Cloud Duration (CCD), and Rainfall Estimation Algorithm (REA) [26].
3.2. Methods
3.2.1. Number WET/DRY Days over MAM and SOND Rainfall Seasons
For the two well-known seasonal rainfall over Uganda and EA (MAM and SOND), Wet and Dry days are generated by the common definition that a rainy day must experience at least 1.0 mm of rainfall, while a dry day is basically days with less than 1.0 mm of rainfall [27,28]. Once recorded over concessive period, the two variables are referred to as wet and dry spell respectively. Analyzing the number of wet and dry days is crucial for understanding rainfall variability, managing water resources, planning agricultural activities, studying climate change impacts, and maintaining ecosystem health.
3.2.2. Cumulative Departure Index (CDI) for 1981-2017
The MAM and SOND Seasonal rainfall variability was further assessed by the cumulative departure index (CDI). The CDI involves the estimation of the arithmetic mean of seasonal rainfall for the period of record. The means of seasonal rainfall were then normalized by equation (1) below;
Where represent the actual seasonal of a given year. is the mean rainfall of the total length of the period, and the standard deviation of the total length of the period. Results of the values were cumulatively added to each other for the period of record and plotted to achieve long-term trends for seasonal as used [27,28].
3.2.3. Rainfall Anomaly Index (RAI) for 1981-2017
Further, the rainfall anomaly index (RAI) was analyzed to show the variability of annual rainfall (Frequency and intensity of dry and wet years) and presented through graphical plots for visual interpretation. RAI is suggested to be very effective in detecting the persistence of drought periods [27]. Rainfall variability indices were used to establish drought periods and to show some haphazard values for drought indication [27]. These simple indices which use only rainfall as the only input perform comparatively well compared with more complicated indices in depicting periods and density of droughts [27,29]. RAI was used to describe annual rainfall variability and was first introduced and used by van Rooy, (1965) but is currently been used by many authors [32].
The RAI is calculated from equation (2) for positive anomalies and equation (3) for negative anomalies.
Where RAI represents the annual rainfall anomaly index, Rf the actual rainfall for a given year, MRf the mean of the total length of the record, MH10 the mean of the ten highest values of rainfall on record, and ML10 the lowest values of rainfall on record.
4. Results
Figure 2 presents the mean monthly annual rainfall for nine (9) stations in lake Kyoga Basin during the period 1981- 2017. Results revealed unimodal rainfall in all the stations within lake Kyoga Basin but show a slight decline over June. This result is in agreement with previous studies on the region [33]. Rainfall in the lake Kyoga basin is usually contributed to by several factors including the north-south movement of ITCZ, and the Congo air mass, and modified by topographic features [32,33,34].
The results showed high values of seasonal rainfall recorded during the months of March-April-May (MAM) and September-October-November-December (SOND), coinciding with two main modal rainfall regimes (MAM) and (SOND) reported by other studies over the regions [35,36]. In this study, these two main rainy periods MAM and SOND are therefore considered as the major seasons and for subsequent use in the seasonal analysis. The main rainfall season from March to May (MAM) is usually referred to as the “long rains’ and the September to December is the “short rains” in EA [34,35,36].
4.5.2. Temporal Variation of Annual and Seasonal Rainfall in Lake Kyoga Basin
Figure 3 shows the temporal variation of the annual rainfall over the lake Kyoga basin during 1981-2017. Results indicate a decline in the annual rainfall during the first periods of the study 1981-1985 for most stations including Kiige, Namulonge, Buginyanya, Serere, Lira, and Namalu, this coincides with the reported droughts episodes of 1983-1985 over EA which cause severe impacts on socioeconomic activities in the regions [41,36,40]
The mean annual rainfall in the lake Kyoga Basin gradually increased from 1985 to 2005 except for the two adjacent stations; Soroti (e) and Serere (g) which indicated a declining trend over the same period. Conversely; after 2005, most rainfall stations in the lake Kyoga basin revealed a drop in annual precipitation. The declining rainfall in Uganda was reported in a recent analysis [38].
Contrarily, parts of Lake Kyoga basin have experienced a lot of rainfall over the years, which has caused mudslides on several occasions such as in 2015 and recently in 2018, and 2019, to the extent of causing the catastrophic loss of human lives and destruction of properties and infrastructure [22].
Lake Kyoga Basin receives an average of 30-70 wet days during MAM rainfall seasons over most parts of region with a few areas receiving less than 20 wet days during MAM (Figure 4 (a, b)). The average number of dry days from two gridded satellite datasets CHIRPS 2.0, and TAMSAT v3.1 are provided in Figure 4 above in (c) and (d). The highest number of dry Days (80) occurred in northeastern part of lake Kyoga Basin, while lowest number of dry days were experienced in the southern part of the Basin bordering the Lake Victoria which usually receives the highest rainfall amount in Uganda. As observed from above figure the number of dry days during MAM rainfall seasons outstripped their corresponding wet days during the same rainfall seasons.
Figure 4.
Comparison of wet/dry days during MAM season using two gridded satellite datasets CHIRPS-2.0, and TAMSAT v3.1 for the historical period 1983–2017.
Figure 4.
Comparison of wet/dry days during MAM season using two gridded satellite datasets CHIRPS-2.0, and TAMSAT v3.1 for the historical period 1983–2017.
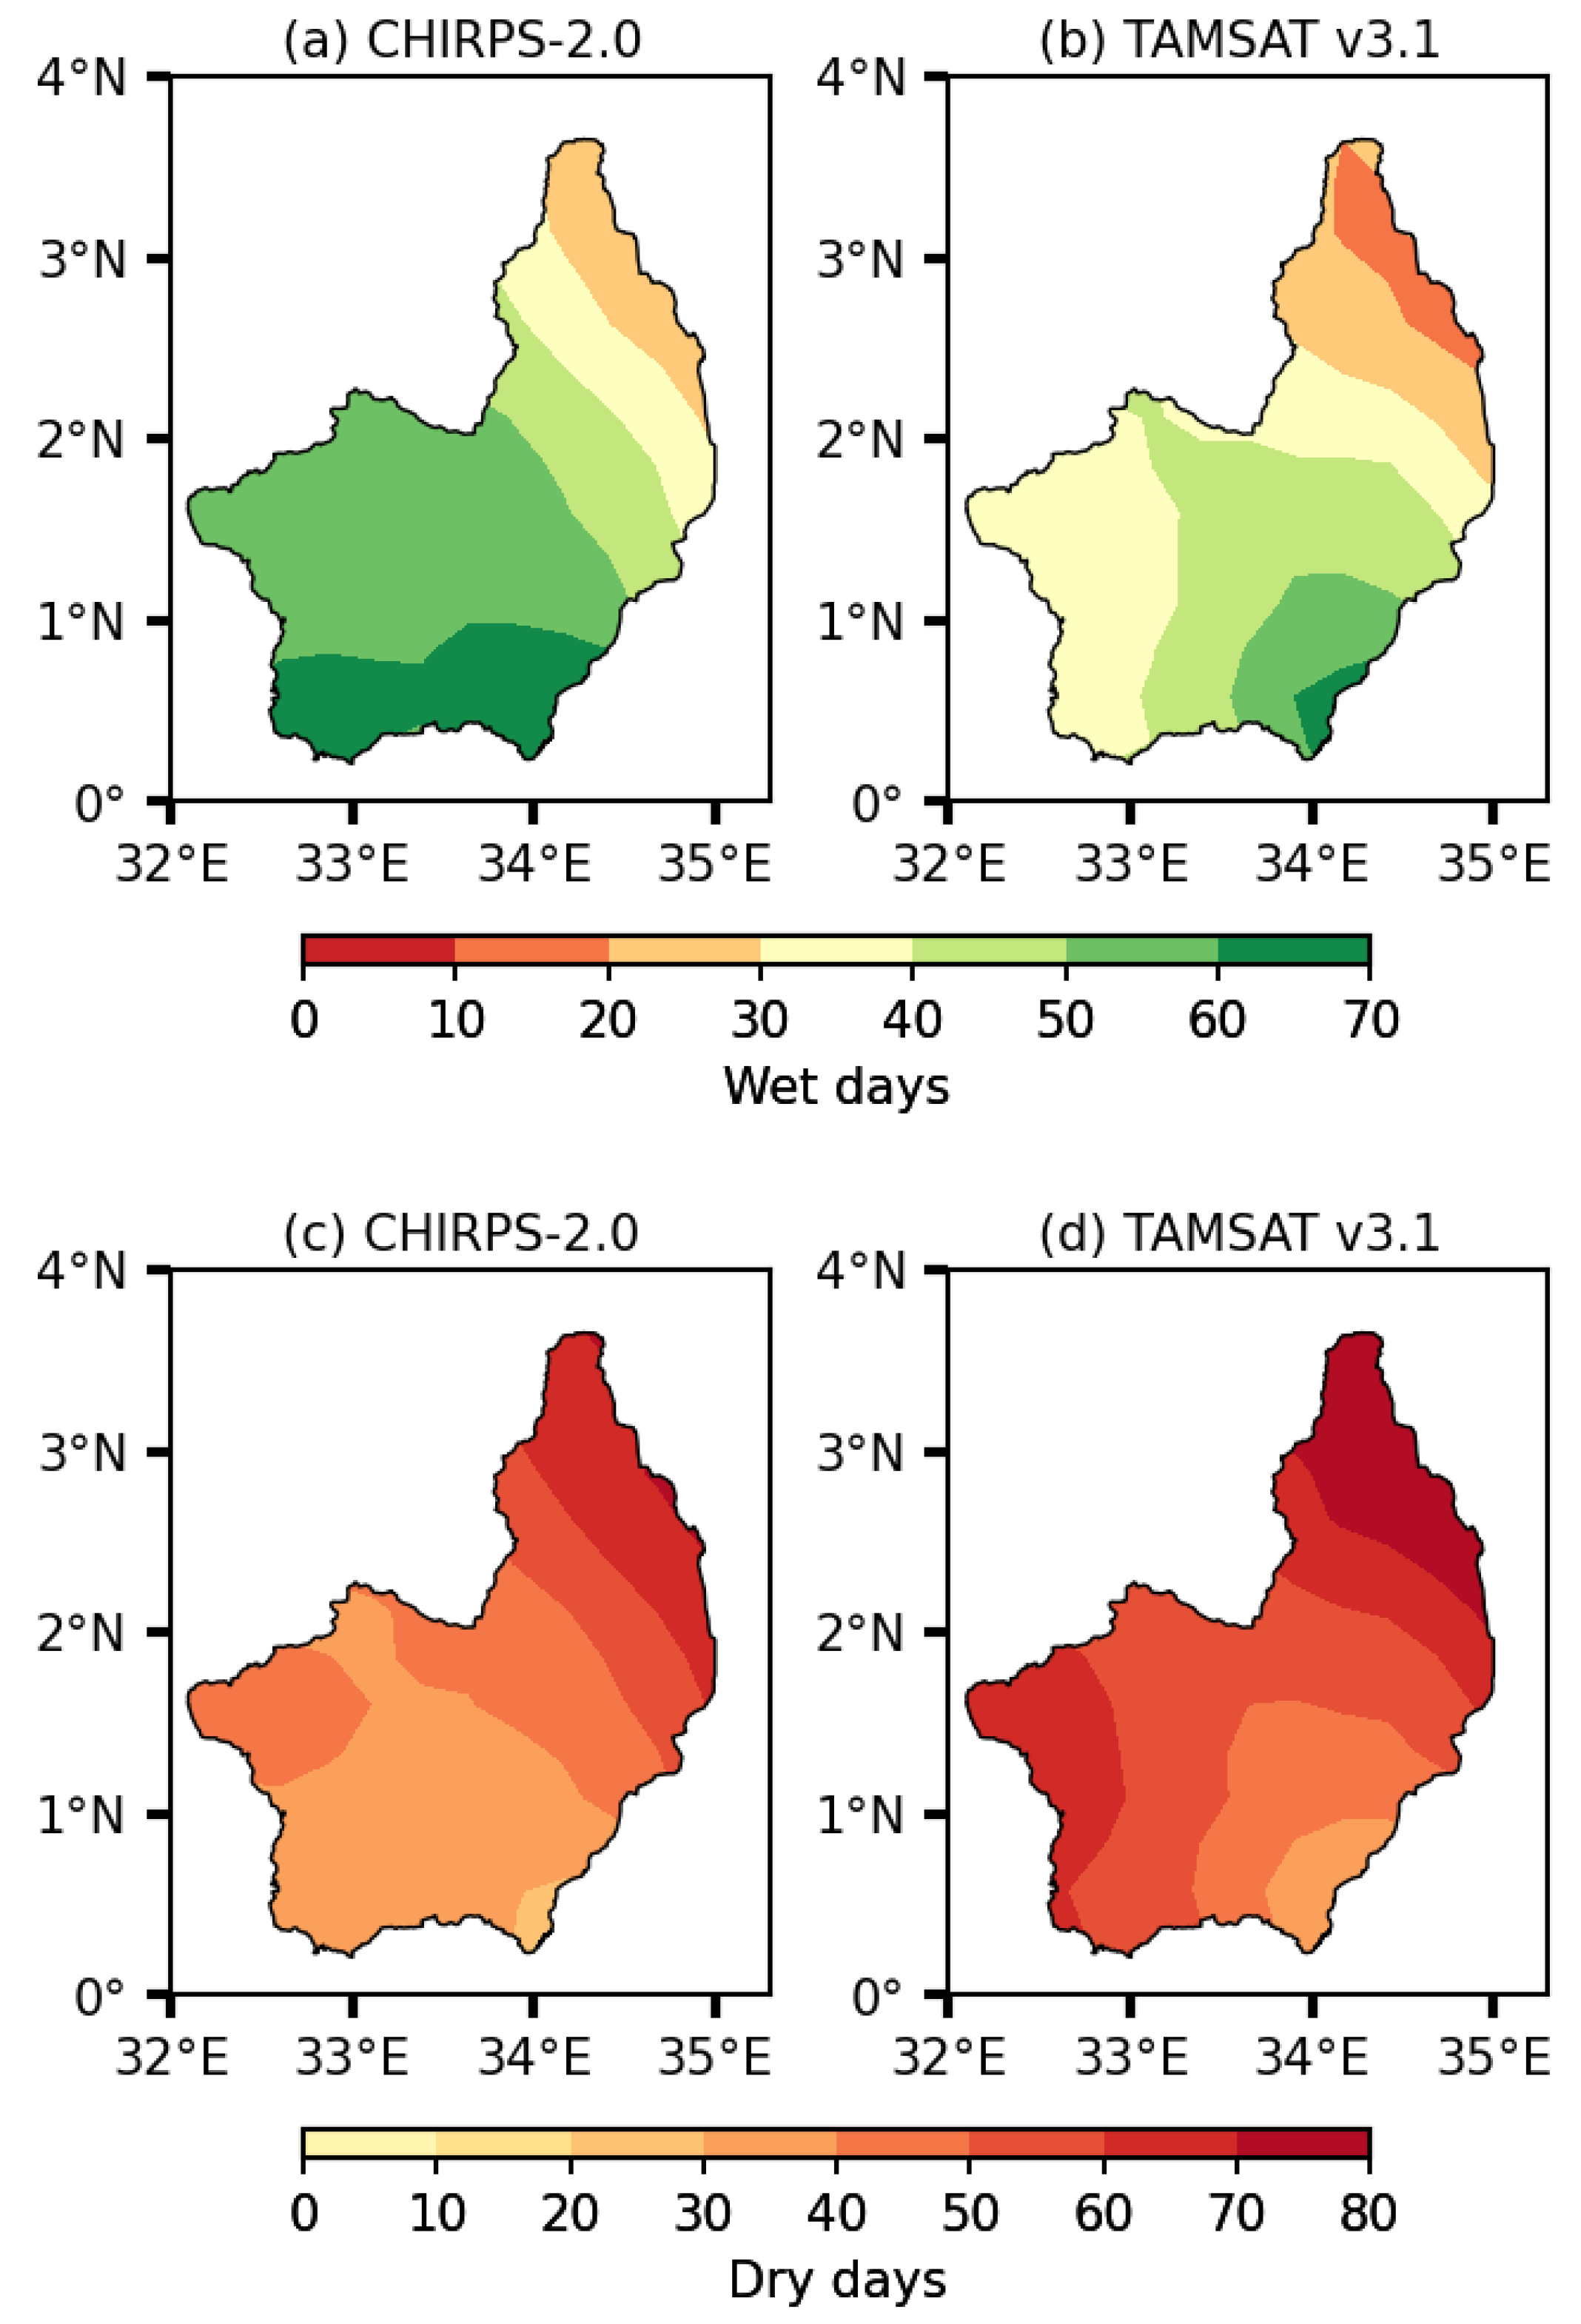
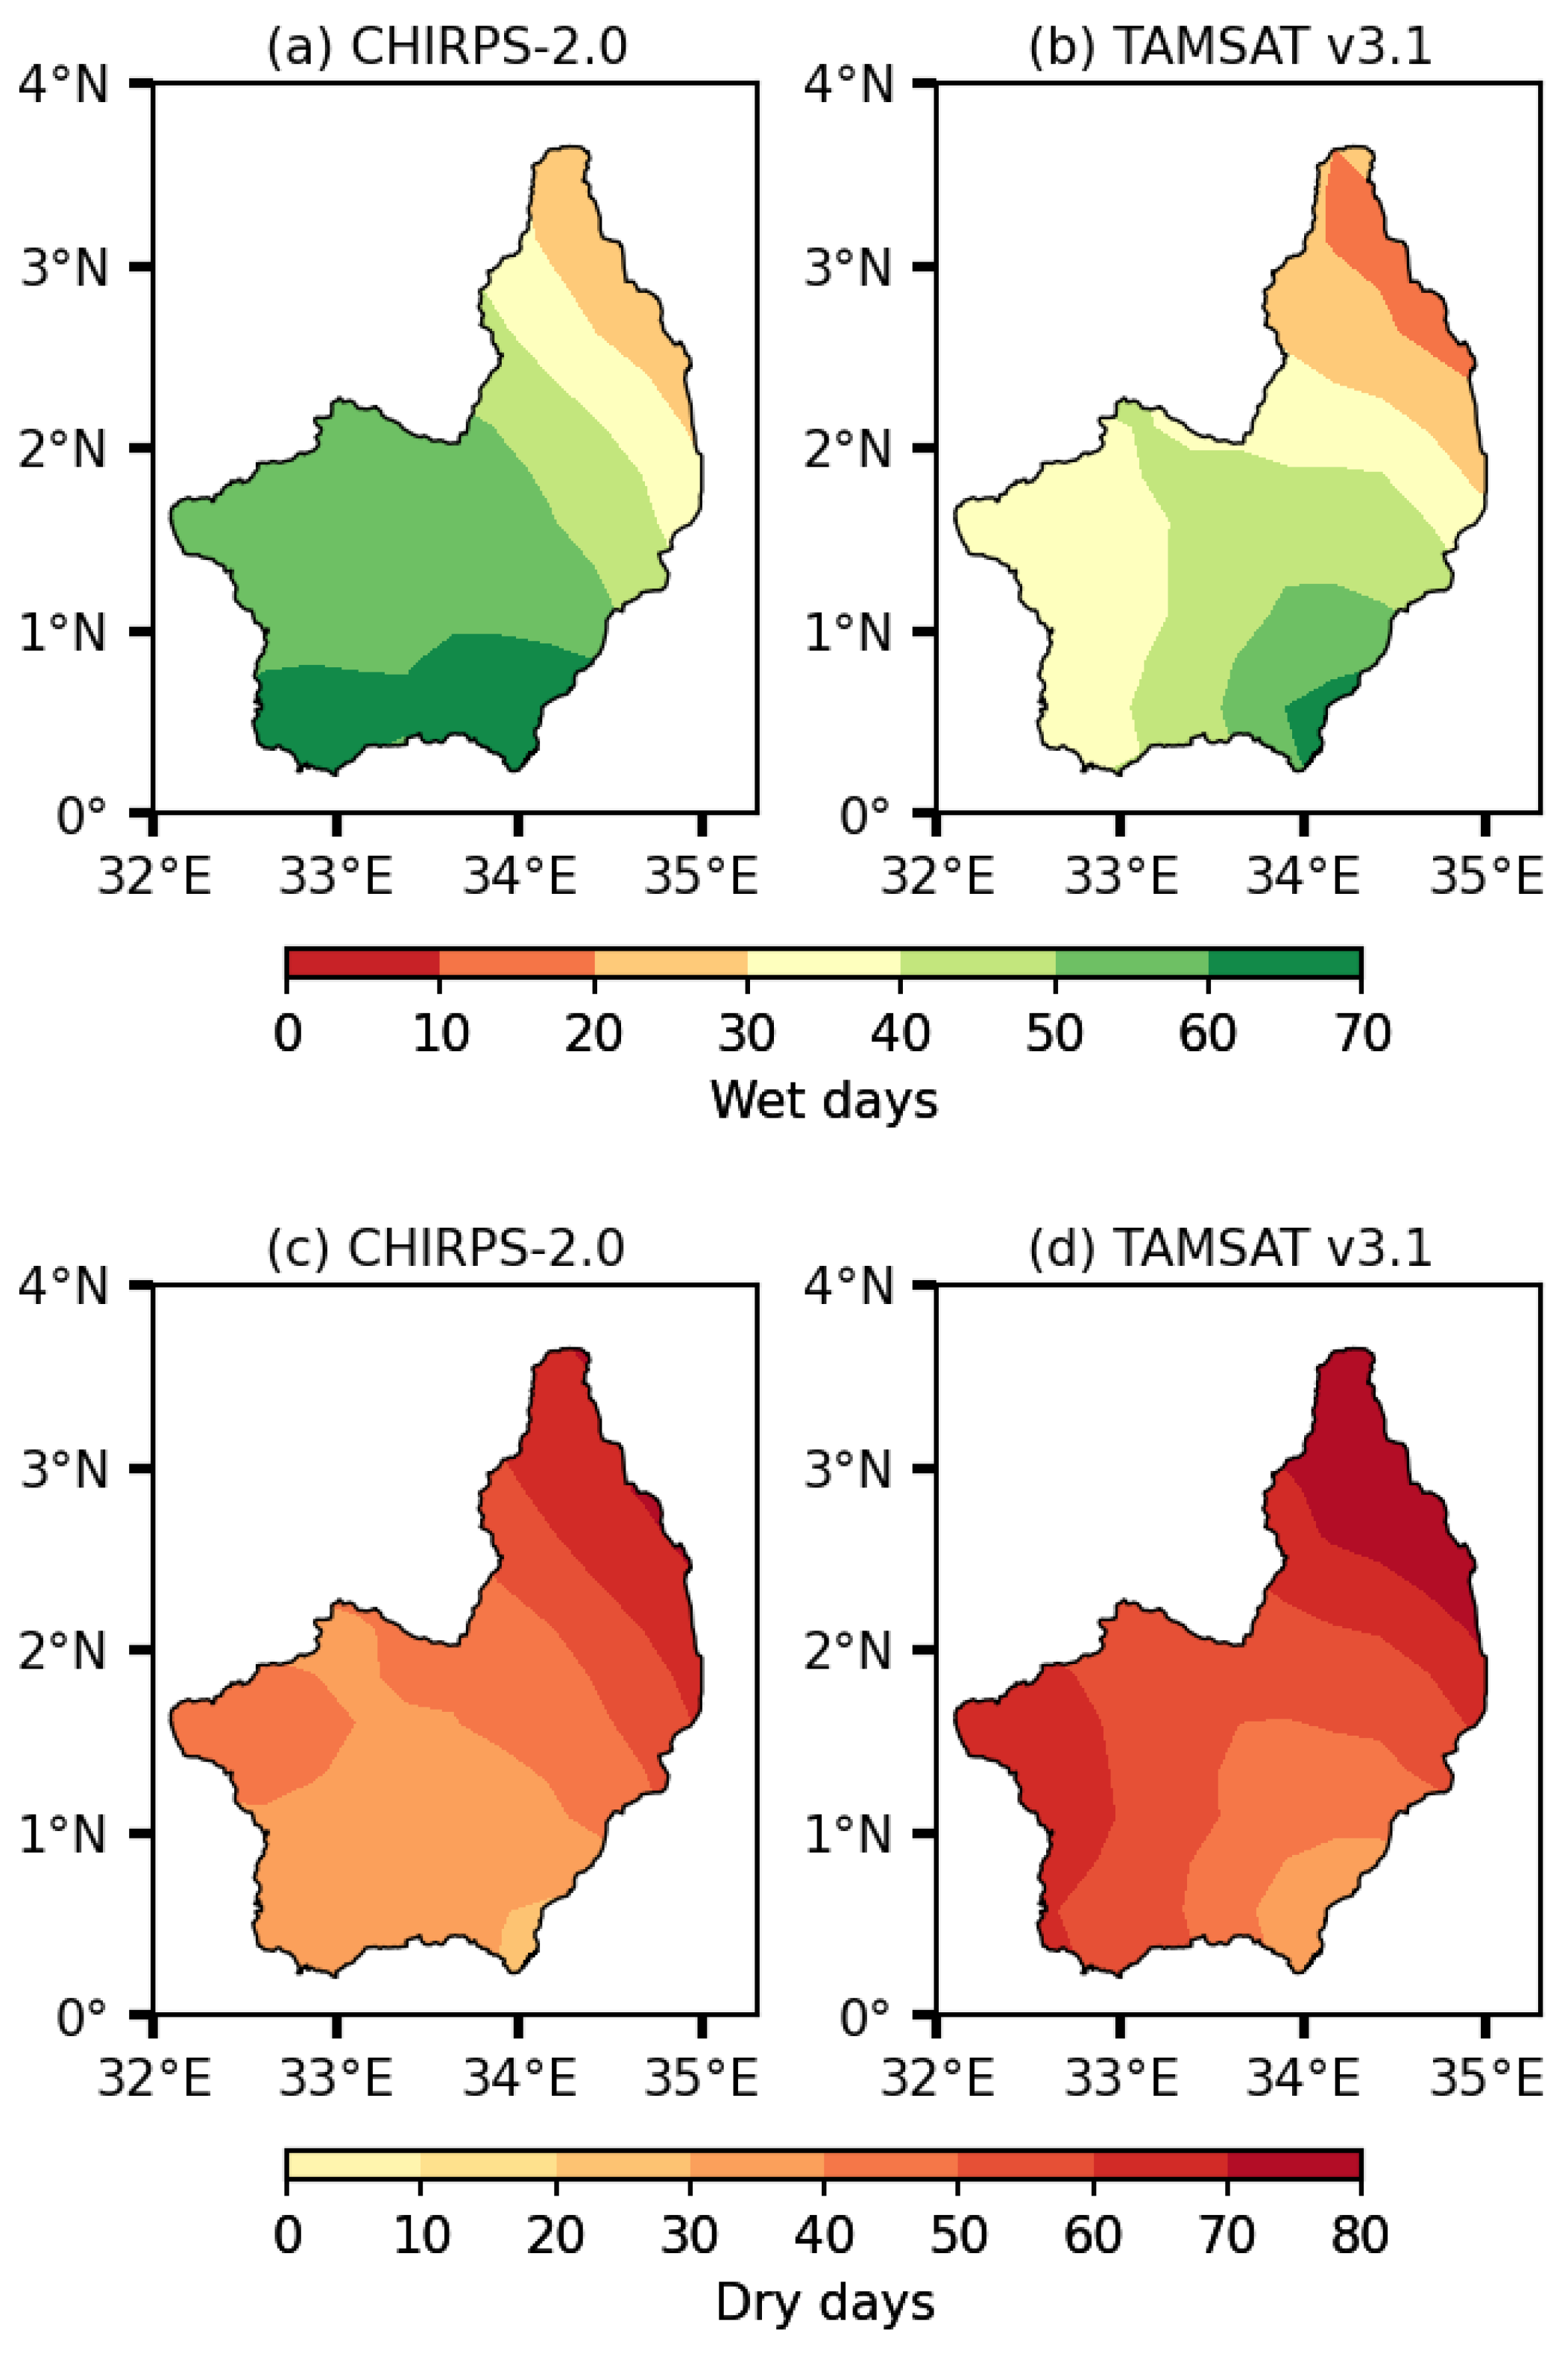
Figure 5.
Comparison of wet/dry days during SOND season using two gridded satellite datasets CHIRPS-2.0, and TAMSAT v3.1 for the historical period 1983–2017.
Figure 5.
Comparison of wet/dry days during SOND season using two gridded satellite datasets CHIRPS-2.0, and TAMSAT v3.1 for the historical period 1983–2017.
4.6.1. Cumulative Departure Index (CDI) over Lake Kyoga Basin
Figure (6 a-i) shows a graphical representation of the seasonal CDI for selected stations in Lake Kyoga Basin over the period 1981-2017. The variability of seasonal rainfall is shown by an upward and downward movement of the CDI graphs which correspond to surplus and deficit rainfall respectively.
For Namulonge station (Fig.6a); the “long rains” (MAM) season is observed to run below average rainfall for most of the years during the period 1983-2017 with only 3 years showing positive rainfall, while SOND showed either near normal rainfall or below average. The years that have anomalously high MAM seasonal rainfall include; 1982, 1997-1998, and 2016. The years which showed anomalously low MAM rainfall at this station include; 1996, 2000, 2007-2008. Meanwhile, analysis of SOND seasonal rainfall revealed anomalously high and low rainfall in 1995 and 1982-1983, 1986, 1989, and 2016 respectively.
At Tororo station, the variability of seasonal rainfall is also evidenced as the CDI graphs presented both downward and upward movement in both seasons (Fig.6b), but both seasons recorded near normal long-term mean rainfall. The CDI curve for MAM indicates extremely high rainfall in 2013, 2012, and 2006 in the last 10 years, and 1990-1991 in the previous decade. Contrarily, 2004, and 2016 are two years that present below-average rainfall for MAM seasons. There is no clear pattern for SOND rainfall season as both downward and upward trends are observed randomly, showing high variability in seasonal rainfall. The season (SOND) revealed, the highest upward trends in rainfall were recorded in 1997, 2006, and 2014; while; 1986, 1990, and 2010 showed highly marked downward movement of the cumulative departure index.
Like in the first two stations above, the seasonal variability of rainfall at Soroti station (Figure 6c) is visibly clear as the MAM season records below-normal rainfall in the first 2 years. An improvement in MAM rainfall is attained during the period 1985-1998, as indicated by the upward movement of CDI graphs. This is subsequently followed by a reduction in MAM rainfall in the next 4 years as the CDI graphs move into the negatives phase from 1999-2002. From 2003-2017, 5 years showed positive CDI values and upward trends in rainfall; while the remaining years indicate below-normal rainfall. The station showed extremely low rainfall during MAM in 1999, and over 2009-2010, while extremely high rainfall was experienced in 1991-1992, and 1996.The results revealed negative CDI graphs for SOND in 22 years during the period 1981-2005 and only 3 years of positive CDI graphs. Toward the last decade (2006-2017); SOND seasonal rainfall expressed improvement as all the years registered positive CDI values and an upward movement of CDI graphs.
At Lira station (Fig.6d), both MAM and SOND seasons are observed to run below average rainfall for most of the years, however; a few years recorded extremely high rainfall (Above average) during MAM rainy season including;1982, 1997-1998, 2015-2016, and extremely below average rainfall during; 1983-1984, 1999-2000, 2007-2008, 2010, 2012, and 2014. The worst-case scenario is seen during SOND where only 3 years show above average rainfall namely the years; 1994-1995, and 2002, extremely dry and below normal rainfall are observed in all the years and most notably in;1982-1983,1986, 1989, 20042006, 2009-2010, and 2015.
Further; Jinja station (Fig.6e), showed clear seasonal variability of rainfall from 1981-1993 when most years displayed below average rainfall in both MAM and SOND seasonal rainfall except in a few cases such as in 1987-1988 and previously in 1982-1983 that indicated above-average seasonal rainfall. From 1995-2002, MAM received two years of extremely high rainfall (1996 and 1999) as SOND recorded above-average rainfall in six years. Similarly, the years 2003-2011, showed below-normal rainfall in both seasons except on a few occasions such as in 2003, and 2006. The last 6 years (2011-2017) showed more upward movement in SOND seasonal and downward movement in MAM rainfall. The season MAM received substantially high rainfall during the period 1995-1997, 2000, and a drastic reduction in MAM seasonal rainfall in 1985-1986, 1990-1991, 2005, and 2013. The CDI bars showed a negative trend in rainfall in the second season of SOND from 1981-1987, and 1991-1995. From 1996 onwards, SOND rainfall indicated a positive trend punctuated with years of reduced rainfall most predominantly in 2006 and 2008-2009.
Buginyanya station (Fig.6f), in the montane region, shows the downward movement of MAM seasonal rainfall from 1981-1996 with exception of 1984 and 1994 with near-normal rainfall. There is no difference in the observed trends for SOND seasonal rainfall at Buginyanya stations as most years (1981-1999) show decreased rainfall (below average rainfall) except on a few occasions in 1985-1987 and 1994-1995. Proceeding from 2000-2002, a positive trend indicated by upward bars in rainfall is recorded followed by below average rainfall over the period 2003-2004, which is proceeded by near normal rainfall from 2005-2011. CDI graphs showed that the last 6 years registered the wettest years for SOND rainfall including; 2001-2002 and 2013-2014, while 1982-1984,1988-1993 and 2007 were shown to be the driest years in terms of SOND rainfall for this period of analysis.
At Namalu station (Fig.4.5g); the years 1983-1987, 1992-1995, 1999-2005, 2008-2009, 2014-2015, and 2017 were significantly dry (below average) in terms of MAM seasonal rainfall. The dry MAM seasons are punctuated with occasionally wet seasons (Above average rainfall) such as during the period 2006-2007, 1996-1999, and 2012-2013. The second season, (SOND) showed below-average rainfall over the period 1981-1998, and above-average rainfall in the following 4 years (1999-2002), followed by farther 3 years of below-average rainfall (2003-2005). Over the last 12 years (2006-2017), SOND received improved rainfall performance with the only drop in 2009. Extremely high and low rainfall during SOND is experienced in 2012 and 1986 respectively.
4.6.2. RAI over Lake Kyoga Basin for 1981-2017
The result of the annual “rainfall anomaly index” (RAI) is presented in Table 4.6. The results showed that annual rainfall varied a lot about the long-term mean as different stations revealed different ranges of RAI values throughout the analysis years. The graphical time series of the annual RAI for selected stations in Lake Kyoga Basin (Figure 7): For example; Namulonge station recorded an extreme range of -5.4 to 6.3 in 1983 and 1997 respectively. For the case of Tororo station, the two extreme values of range -5.2 to 7.5 are reported in more recent years 2001 and 2004. The range at Soroti is from -3.9 to 5.6, which occurred in the earlier years of 1984 and 1988. Meanwhile, Serere stations recorded a range of -4.8 to 6.7 in 2012 and 2000 respectively. The negative indices represent dry years and the positive indices show wet or rainy years with varying intensities in each case.
For the first 20 years (1981-2000), 12 cases of extremely dry conditions are revealed within the lake Kyoga Basin. In such circumstances, Soroti station reported 3 cases of extremely dry years in 1982, 1984, and 1989, while Namulonge station also reported 3 cases in 1983, 1993, and 2000. Meanwhile; the other remaining stations showed one case of an extremely dry year. RAI values indicate that 1981 and 1999 were the wettest years when all the stations reported extremely wet conditions (positive RAI). Moreover; during the period (2000-2017); 34 cases of extremely dry years were experienced in 9 locations examined in Lake Kyoga Basin. The distribution of extremely dry conditions was uniform in some stations such as Soroti, Serere, and Buginyanya stations each recorded 5 years of extremely dry conditions; while Jinja registered 4 years of extremely dry years. The remaining stations recorded at least 3 years of extremely dry years.
5. Discussions
Results from Cummulative departure index these studies have several years of below average rainfall showing the drying or drought tendencies over the region during the first rainy period of March-May (MAM). The March-May long rains are critical for the eastern African region and have been quite poor in recent years [25] The decline in MAM rainfall in EA region has been prominently analyzed and discussed [43]. The last 10 years of the study showed rainfall increasing in both MAM and SOND seasons contributing to an increase in annual rainfall over most stations in the basin. However, the increase in rainfall over the basin is punctuated with extreme or severe drought years as witnessed in results in 2009- 2010, 2014, 2016, and 2017 further indicating a drought condition in the region. Ongoma et al [8] also showed a positive trend in March-April and May (MAM) and October-November-December (OND) seasonal rainfall over the Eat African region. The months of November-December have seen an increase, probably reflecting an increased November rainfall in eastern Africa [44]
These results showed high positive RAI values for Namulonge station in the same region in the years; 1989,1997, and 2001 indicating that they were extremely wet, which is in agreement with the recent studies which analyzed rainfall variability for the Lake Victoria Basin adjacent to the lake Kyoga basin[45] and found that the years 1989, 1997, and 2001 had anomalously high total annual rainfall in the region. The most notable extremely wet years are; 1981 for most stations except Namulonge station, and 1999, 2011, and 2015 for most stations. However; using rainfall data for 1949-2009, [46] found that rainfall at this Namulonge station was on the decrease.
The main controlling mechanism of these extremely high rainfall events has been linked to the reversal of dipole in atmospheric circulation and Indian Ocean sea surface temperatures [47]. The rains are moderated by weather phenomena such as El Niño Southern Oscillation (ENSO) [34] and the Indian Ocean Dipole (IOD) [48] The El Niño Southern Oscillation (ENSO) phenomena are strongly associated with the inter-annual variability of rainfall in this region [34]. This agrees with our present study as years with El Niño events such as 1981, 1997-1998, 2006-2007, and 2015 as the wet years recorded.
The result showed high spatial variability as stations indicate different results when similar weather phenomena occur, for example; in 1996 and 2015 most stations show extremely high rainfall but a few stations still show extremely dry conditions over the same period. Such differences in weather conditions are closely related to the contribution of the local circulation systems resulting from land surface heterogeneity induced by biophysical factors such as vegetation, large open water bodies, and topography [49]. Drought conditions exhibited in some years in most stations severely affect agricultural, water, economic, and health sectors, and human death have been reported in the Lake Kyoga Basin [50] .
In the East African tropical climate, rainfall remains one of the most important drivers of many socio-economic activities like agriculture and electricity generation [51], but such variability in rainfall imposes greater risks to such socio-economic sectors. Extreme drought and famine occurred in other parts of Africa at the beginning of 2006, spreading to the East African region especially the northern part of Uganda, Kenya, and Somalia, and more severe than those of 1984, 1999, and 2000 in the East African region [40,42]
Globally, an estimated eleven million people died of drought-related causes while two billion people affected by drought since 1900 [52]. The frequencies and intensity of drought are predicted to increase [2] which confirmed the results that the current years (2001-2017) had the highest frequencies and more intense droughts than the period 1981-2000.
Generally, 2010 was extremely dry for Soroti, Jinja, and Buginyanya and severely dry for most stations including; Tororo, and Namalu, possibly caused by the failure of the “short rains” of 2010 linked to the La-Nina condition. Much of this was followed by a further decline in the “long rains” in MAM in 2011 in the EA [53]. The year 2011 was one of the wettest years in the Lake Kyoga Basin as most of the RAI values were greater than 0.3. The results also showed that in the period 1997/1998 some stations such as Namulonge, Tororo, Jinja, and Kiige, had positive RAI representing extremely wet years, this could be associated with the strong El-Nino episode of that year which is referred to as the “climate event” of the century [54].
Similarly, the extreme El-Nino events in 1982/1983 could have boosted the rainfall of other stations in the region, however extremely dry conditions were recorded in stations such as Namulonge, Tororo, and Soroti. This also shows the variability of rainfall in the region occurring within short distances [55].The recently wet year (2015), is possibly another effect of El-Nino events experienced in the region. This increased the chances of most locations recording extremely wet conditions [56], but this is usually followed by the opposite phase “La-Nina Event” which is usually dry and less rainfall in some areas[57] and is consistent with the results of 2016 in this study. This is though not exclusively true as some patches of dry conditions persisted at some stations within the basin in the same year (2016).
According to these results, the region registered five incidences of extremely dry years and seven cases of severely dry years at different stations. The results agree with seven droughts cases reported between 1991 and 2000 [58].The Greater Horn of Africa has been affected by droughts almost every year for the past two decades and the most severe drought occurred in 2009 and 2011 in Kenya [51]), which is true of the test results for RAI in 2009.
6. Conclusions
This study analyzed the rainfall data for Lake Kyoga Basin using the CDI and RAI. The results show a declining trend in the March-May (MAM) rainfall, indicating drying or drought tendencies over the region. However, the last decade of the study period showed an increase in rainfall in both MAM and October-December (SOND) seasons. The study also identified extreme wet and dry years, with El Niño events contributing to the wet years. The results highlight the high spatial variability of rainfall in the region, with local circulation systems playing a significant role. The study's findings have important implications for agricultural, water, economic, and health sectors in the region, which are vulnerable to rainfall variability and droughts. Overall, this study contributes to the understanding of rainfall variability in the Lake Kyoga Basin and highlights the need for effective climate risk management strategies to mitigate the impacts of droughts and floods in the region.
The study's findings highlight the need for effective climate risk management strategies to mitigate the impacts of droughts and floods in the Lake Kyoga Basin which can be achieved through the development of early warning systems, climate-resilient agriculture practices, and water harvesting and storage infrastructure. Finally; the study's findings emphasize the importance of understanding rainfall variability and its impacts on socio-economic sectors. To improve climate monitoring and prediction capabilities, investing in climate observation networks, enhancing climate modeling and forecasting capabilities, and promoting climate information dissemination and application are essential. This will enable decision-makers to make informed decisions and develop effective adaptation strategies.
Author Contributions
For research articles with several authors, a short paragraph specifying their individual contributions must be provided. The following statements should be used “Conceptualization, M.O. and H.B.; methodology, M.O.; software, M.O. and H.B.; validation, M.O.; formal analysis M.O. and H.B.; investigation, M.O; resources M.O. and H.B.; data curation, M.O. and H.B.; writing—original draft preparation, M.O.; writing—review and editing, M.O.; visualization, M.O. and H.B.; supervision, M.O; project administration, M.O.; funding acquisition, M.O. and H.B.; All authors have read and agreed to the published version of the manuscript.
Funding
Please add: This research received no external funding.
Data Availability Statement
data available upon request.
Conflicts of Interest
The authors declare no conflicts of interest.
References
- Min, S.; Zhang, X.; Zwiers, F.W.; Hegerl, G.C. Human Contribution to More-Intense Precipitation Extremes. Nature 2011, 470, 378–381. [Google Scholar] [CrossRef] [PubMed]
- IPCC Managing the Risks of Extreme Events and Disasters to Advance Climate Change Adaptation; 2012.
- IPCC; Pachauri, R.K.; IPCC; Pachauri, R.K.; IPCC; Pachauri, R.K.; IPCC; Pachauri, R.K. CLIMATE CHANGE 2014,Synthesis Report; 2014.
- Adhikari, U.; Nejadhashemi, A.P.; Woznicki, S.A. Climate Change and Eastern Africa : A Review of Impact on Major Crops. Food Energy Secur. 2015, 4, 110–132. [Google Scholar] [CrossRef]
- Almazroui, M.; Saeed, F.; Saeed, S.; Islam, M.N.; Ismail, M. Projected Change in Temperature and Precipitation Over Africa from CMIP6. Earth Syst. Environ. 2020, 4, 455–475. [Google Scholar] [CrossRef]
- Nuwagira, U.; Yasin, I. East African Journal of Environment and Natural Resources Review of the Past, Current, and the Future Trend of the Climate Change and Its Impact in Uganda. East African J. Environ. Nat. Resour. 2022, 5, 115–126. [Google Scholar] [CrossRef]
- Lobell, D.B.; Burke, M.B.; Tebaldi, C.; Mastrandrea, M.D.; Falcon, W.P.; Rosamond, L. Naylor Prioritizing Climate Change Adaptation Needs for Food Security in 2030. Science 2008, 319, 607–610. [Google Scholar]
- Ongoma Victor, Haishan Chen, G.W.O. Variability of Extreme Weather Events over the Equatorial East Africa , a Case Study of Rainfall in Kenya and Uganda. Theorectical Appl Climatol. 2018, 295–308. [CrossRef]
- GoU; UNFPA The State Of Uganda Population Report 2009: Addressing the Effects of Climate Change on Migration; 2009.
- Macleod David, C.C.; Macleod, D.; Caminade, C. The Moderate Impact of the 2015 El Ni ñ o over East Africa and Its Representation in Seasonal Reforecasts. J. Clim. 2019, 32, 7989–8001. [Google Scholar] [CrossRef]
- Palmer, P.I.; Wainwright, C.M.; Dong, B.; Maidment, R.I.; Wheeler, K.G.; Gedney, N.; Hickman, J.E.; Madani, N.; Folwell, S.S.; Abdo, G.; et al. Drivers and Impacts of Eastern African Rainfall Variability. Nat. Rev. earth &environment. [CrossRef]
- Thornton, P.K.; Owiyo, T.; Jones, P.G.; Owiyo, T.; Kruska, R.L.; Herrero, M.; Orindi, V.; Bhadwal, S.; Kristjanson, P.; Notenbaert, A.; et al. Climate Change and Poverty in Africa: Mapping Hotspots of Vulnerability. African J. Agric. Resour. Econ. 2008, 2, 24–44. [Google Scholar] [CrossRef]
- Shikuku, K.M.; Winowiecki, L.; Twyman, J.; Eitzinger, A.; Perez, J.G.; Mwongera, C.; Läderach, P. Climate Risk Management Smallholder Farmers ’ Attitudes and Determinants of Adaptation to Climate Risks in East Africa. Clim. Risk Manag. 2017, 16, 234–245. [Google Scholar] [CrossRef]
- Schlenker, W.; Lobell, D.B. Robust Negative Impacts of Climate Change. Environ. Res. Lett. 2010, 5. [Google Scholar] [CrossRef]
- Pachauri, R.K.; Reisinger, A. Climate Change 2007: Synthesis Report. Contribution of Working Groups I, II and III to the Fourth Assessment Report of the Intergovernmental Panel on Climate Change . Intergovernmental Panel on Climate Change , Geneva, Switzerland; 2007.
- AU STATE OF AFRICA ’ S POPULATION 2017 Keeping Rights of Girls, Adolescents and Young Women at the Centre of Africa’s Demographic Dividend; 2017.
- Onyutha, C.; Acayo, G.; Nyende, J. Analyses of Precipitation and Evapotranspiration Changes across the Lake Kyoga Basin in East Africa. Water (Switzerland) 2020, 12, 1–23. [Google Scholar] [CrossRef]
- Mubialiwo, A.; Chelangat, C.; Onyutha, C. Changes in Precipitation and Evapotranspiration over Lokok and Lokere Catchments in Uganda. Bull. Atmos. Sci. Technol. 2021, 2. [Google Scholar] [CrossRef]
- Atube, F.; Malinga, G.M.; Nyeko, M.; Okello, D.M.; Mugonola, B.; Omony, G.W.; Uma, I.O. Farmers ’ Perceptions of Climate Change, Long - Term Variability and Trends in Rainfall in Apac District, Northern Uganda. CABI Agric. Biosci. 2022, 4, 1–16. [Google Scholar] [CrossRef]
- Onyutha, C.; Acayo, G.; Nyende, J. Analyses of Precipitation and Evapotranspiration Changes across the Lake Kyoga Basin in East Africa. Water (Switzerland) 2020, 12, 23. [Google Scholar] [CrossRef]
- Onyutha, C. Trends and Variability of Temperature and Evaporation over the African Continent : Relationships with Precipitation. Atmosfera 2021, 34, 267–287. [Google Scholar] [CrossRef]
- Obubu, J.P.; Mengistou, S.; Fetahi, T.; Alamirew, T.; Odong, R.; Ekwacu, S. Recent Climate Change in the Lake Kyoga Basin, Uganda : An Analysis Using Short-Term and Long-Term Data with Standardized Precipitation and Anomaly Indexes. 2021.
- Filahi, S.; Tanarhte, M.; Mouhir, L.; El Morhit, M.; Tramblay, Y.; Morhit, M. El; Tramblay, Y.; El Morhit, M.; Tramblay, Y.; Morhit, M. El; et al. Trends in Indices of Daily Temperature and Precipitations Extremes in Morocco. Theor. Appl. Climatol. 2016, 124, 959–972. [Google Scholar] [CrossRef]
- Funk, C.; Peterson, P.; Landsfeld, M.; Pedreros, D.; Verdin, J.; Shukla, S.; Husak, G.; Rowland, J.; Harrison, L.; Hoell, A.; et al. The Climate Hazards Infrared Precipitation with Stations - A New Environmental Record for Monitoring Extremes. Sci. Data 2015, 2, 1–21. [Google Scholar] [CrossRef]
- Wainwright, C.M.; Marsham, J.H.; Keane, R.J.; Rowell, D.P.; Finney, D.L.; Black, E.; Allan, R.P. ‘Eastern African Paradox’ Rainfall Decline Due to Shorter Not Less Intense Long Rains. npj Clim. Atmos. Sci. 2019, 2, 1–9. [Google Scholar] [CrossRef]
- Maidment, R.I.; Grimes, D.; Black, E.; Tarnavsky, E.; Young, M.; Greatrex, H.; Allan, R.P.; Stein, T.; Nkonde, E.; Senkunda, S.; et al. Data Descriptor : A New, Long-Term Daily Satellite-Based Rainfall Dataset for Operational Monitoring in Africa. Nat. Publ. Gr. 2017, 4. [Google Scholar] [CrossRef]
- Caloiero, T.; Coscarelli, R. Analysis of the Characteristics of Dry and Wet Spells in a Mediterranean Region. Environ. Process. 2020. [Google Scholar] [CrossRef]
- Kendon, E.J.; Stratton, R.A.; Tucker, S.; Marsham, J.H.; Berthou, S.; Rowell, D.P.; Senior, C.A. Enhanced Future Changes in Wet and Dry Extremes over Africa at Convection-Permitting Scale. Nat. Commun. 2019, 10, 1794. [Google Scholar] [CrossRef]
- Tilahun, K. Analysis of Rainfall Climate and Evapo-Transpiration in Arid and Semi-Arid Regions of Ethiopia Using Data over the Last Half a Century. J. Arid Environ. 2006, 64, 474–487. [Google Scholar] [CrossRef]
- Recha, C.W.; Makokha, G.L.; Traore, P.S.; Shisanya, C.; Lodoun, T.; Sako, A. Determination of Seasonal Rainfall Variability, Onset and Cessation in Semi-Arid Tharaka District, Kenya. Theor. Appl. Climatol. 2012, 108, 479–494. [Google Scholar] [CrossRef]
- Oladipo, E.O. A COMPARATIVE PERFORMANCE ANALYSIS OF THREE. J. Climatol. 1985, 5, 655–664. [Google Scholar]
- Hänsel, S.; Schucknecht, A.; Matschullat, J. The Modified Rainfall Anomaly Index ( MRAI ) — Is This an Alternative to the Standardised Precipitation Index ( SPI ) in Evaluating Future Extreme Precipitation Characteristics ? Theor. Appl. Climatol. 2015. [Google Scholar] [CrossRef]
- Kansiime, M.K.; Wambugu, S.K.; Shisanya, C.A. Perceived and Actual Rainfall Trends and Variability in Eastern Uganda : Implications for Community Preparedness and Response. J. Nat. Sci. Res. 2013, 3, 179–195. [Google Scholar]
- Indeje, M.; Semazzi, F.H.M.; Ogallo, L.J. ENSO Signals in East African Rainfall Seasons. Int. J. Climatol. 2000, 46, 19–46. [Google Scholar] [CrossRef]
- Brown, E.; Sutcliffe, J. V; Brown, E.; John, V. The Water Balance of Lake Kyoga, Uganda The Water Balance of Lake Kyoga, Uganda. Hydrol. Sci. J. 2013, 58, 341–353. [Google Scholar] [CrossRef]
- Ogwang, B.A. ; Alex Nimusiima, Teddy Tindamanyire, Margaret N. Serwanga, Godwin Ayesiga, Moses Ojara, Fred Ssebabi, Gordon Gugwa, Yusuf Nsubuga1, R.A.; Robert Kibwika, Joseph Kiwuwa Balikudembe, Herbert Kikonyogo, Abubakar Kalema, Victor Ongoma, Aggrey Taire, Anne Kiryhabwe, Musa Semujju, Felix Einyu, Rashid Kituusa, L.A. Characteristics and Changes in SON Rainfall Over. J. Environ. Agric. Sci. 2016. [Google Scholar]
- Mubiru, Drake N. ; Komutunga, Everline; Agona, Ambrose; Apok, Anne; Ngara, T. Characterising Agrometeorological Climate Risks and Uncertainties : Crop Production in Uganda. S. Afr. J. Sci. 2012, 108, 108–118. [Google Scholar] [CrossRef]
- Nsubuga, F.W.; Rautenbach, H. Climate Change and Variability : A Review of What Is Known and Ought to Be Known For. Int. J. Clim. Chang. Strateg. Manag. 2018. [CrossRef]
- Camberlin, P.; Philippon, N. The East African March – May Rainy Season : Associated Atmospheric Dynamics and Predictability over the 1968 – 97 Period. J. Clim. 2002, 15, 1002–1019. [Google Scholar]
- Nandozi, C.S.; Omondi, P.; Komutunga, E.; Aribo, L.; Isubikalu, P.; Tenywa, M.M.; Box, P.O.; Zonal, M.; Unit, C.C.; Centre, A. Regional Climate Model Performance and Prediction of Seasonal Rainfall and Surface Temperature of Uganda. African Crop Sci. J. 2012, 20, 213–225. [Google Scholar]
- Masih, I.; Maskey, S.; Trambauer, P.; Mussá, F.E.F.; Trambauer, P. A Review of Droughts on the African Continent: A Geospatial and Long-Term Perspective. Hydrol. Earth Syst. Sci. 2014, 18, 3635–3649. [Google Scholar] [CrossRef]
- Gebremeskel, G.; Tang, Q.; Sun, S.; Huang, Z.; Zhang, X.; Liu, X. Droughts in East Africa: Causes, Impacts and Resilience. Earth-Science Rev. 2019, 193, 146–161. [Google Scholar] [CrossRef]
- Rowell, D. Booth, S. Nicholson, and P.G. Reconciling Past and Future Rainfall Trends over East Africa. J. Clim. 2015. [Google Scholar] [CrossRef]
- Clive A, S. The Changing Climate of Africa Part I: Introduction and Eastern Africa. In African Ecology - Benchmarks and Historical Perspectives; 2012; pp. 57–140 ISBN 9783642228711.
- Kizza, M.; Rodhe, A.; Xu, C.-Y.; Ntale, H.K.; Halldin, S. Temporal Rainfall Variability in the Lake Victoria Basin in East Africa during the Twentieth Century. Theor. Appl. Climatol. 2009, 98, 119–135. [Google Scholar] [CrossRef]
- Nsubuga, F.W.N.W.N.W.; Olwoch, J.M.; Rautenbach, C.J. de W. Climatic Trends at Namulonge in Uganda: 1947-2009. J. Geogr. Geol. 2011, 3, 119–131. [Google Scholar] [CrossRef]
- Saji, N.H.; Vinayachandran, P.N. A Dipole Mode in the Tropical Indian Ocean. Nature 1999, 401, 360–363. [Google Scholar]
- Behera, S.K.; Luo, J.J.; Masson, S.; Delecluse, P.; Gualdi, S.; Navarra, A.; Yamagata, T. Paramount Impact of the Indian Ocean Dipole on the East African Short Rains: A CGCM Study. J. Clim. 2005, 18, 4514–4530. [Google Scholar] [CrossRef]
- Ogwang, B.A.; Chen, H.; Li, X.; Gao, C.; Bob Alex Ogwang, Haishan Chen, Xing Li, and C. G. The Influence of Topography on East African October to December Climate: Sensitivity Experiments with RegCM4. Adv. Meteorol. 2014, 2014, 14. [Google Scholar] [CrossRef]
- NAPA Climate Change: Uganda National Adaptation Programmes of Action (NAPA). 2007.
- Ayugi, B.; Tan, G.; Rouyun, N.; Zeyao, D.; Ojara, M.; Mumo, L.; Babaousmail, H.; Ongoma, V. Evaluation of Meteorological Drought and Flood Scenarios over Kenya, East Africa. Water (Switzerland) 2020, 11, 307. [Google Scholar] [CrossRef]
- Ghaleb, F.; Mario, M.; Sandra, A. Regional Landsat-Based Drought Monitoring from 1982 to 2014. Climate 2015, 3, 563–577. [Google Scholar] [CrossRef]
- Lyon, B.; Dewitt, D.G. A Recent and Abrupt Decline in the East African Long Rains. Geophys. Res. Lett. 2012, 39, 1–5. [Google Scholar] [CrossRef]
- Cai, W.; Borlace, S.; Lengaigne, M.; Rensch, P. Van; Collins, M. Increasing Frequency of Extreme El Niño Events Due to Greenhouse Warming. Nat. Clim. Chang. 2014, 4, 111–116. [Google Scholar] [CrossRef]
- Nicholson, S.E. Climate and Climatic Variability of Rainfall over Eastern Africa. Rev. Geophys. 2017, 55, 590–635. [Google Scholar] [CrossRef]
- ACF 2015/ 16 El Nino Event Global Report. Action Against Hunger (ACF UK) Greenwich High Road London, SE10 8JA; 2015.
- Ntale, H.K.; Gan, T.Y. East African Rainfall Anomaly Patterns in Association with El Niño/Southern Oscillation. J. Clim. 2004, 9, 257–268. [Google Scholar] [CrossRef]
- UNISDR Progress and Challenges in Disaster Risk Reduction: A Contribution towards the Development of Policy Indicators for the Post-2015 Framework for Disaster Risk Reduction - UNISDRUNISDR. (2014). Progress and Challenges in Disaster Risk Reduction: A Contribut; 2014.
Figure 1.
Map of Lake Kyoga Basin in Uganda (inset) showing elevation of Lake Kyoga Basin and the Weather stations (black dots).
Figure 1.
Map of Lake Kyoga Basin in Uganda (inset) showing elevation of Lake Kyoga Basin and the Weather stations (black dots).
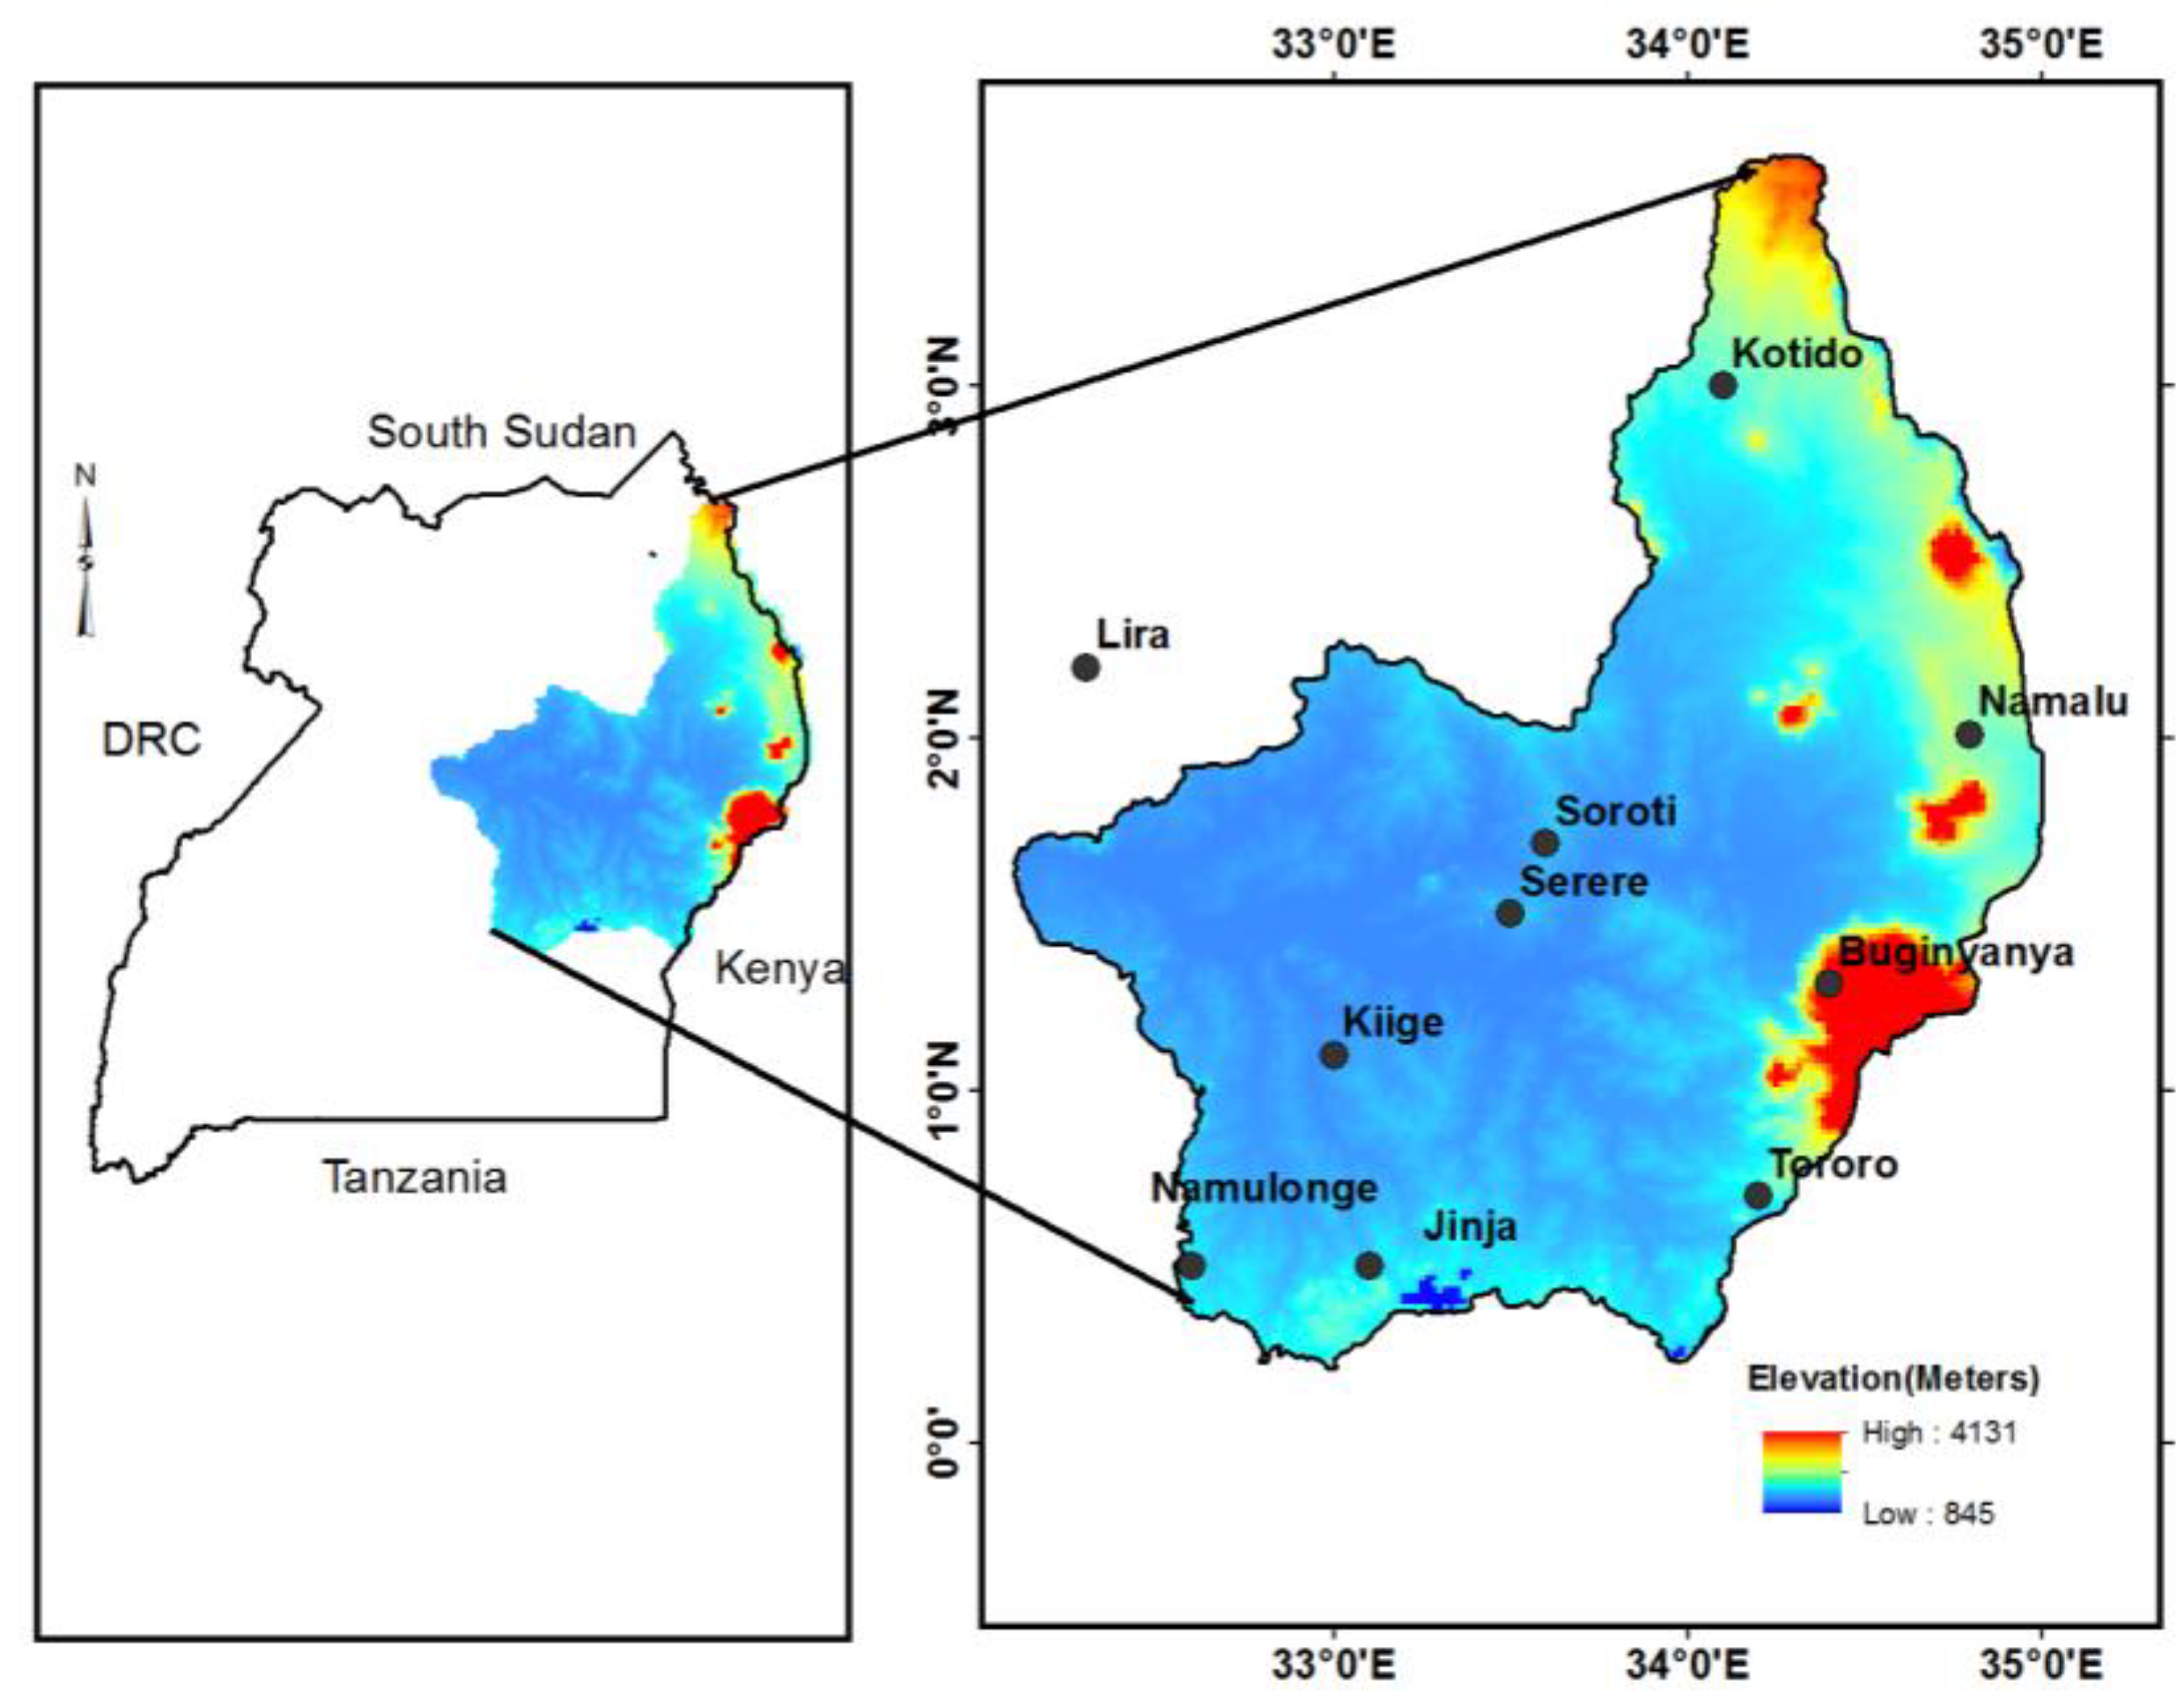
Figure 2.
Mean monthly rainfall cycle for different stations for the period 1981-2017.
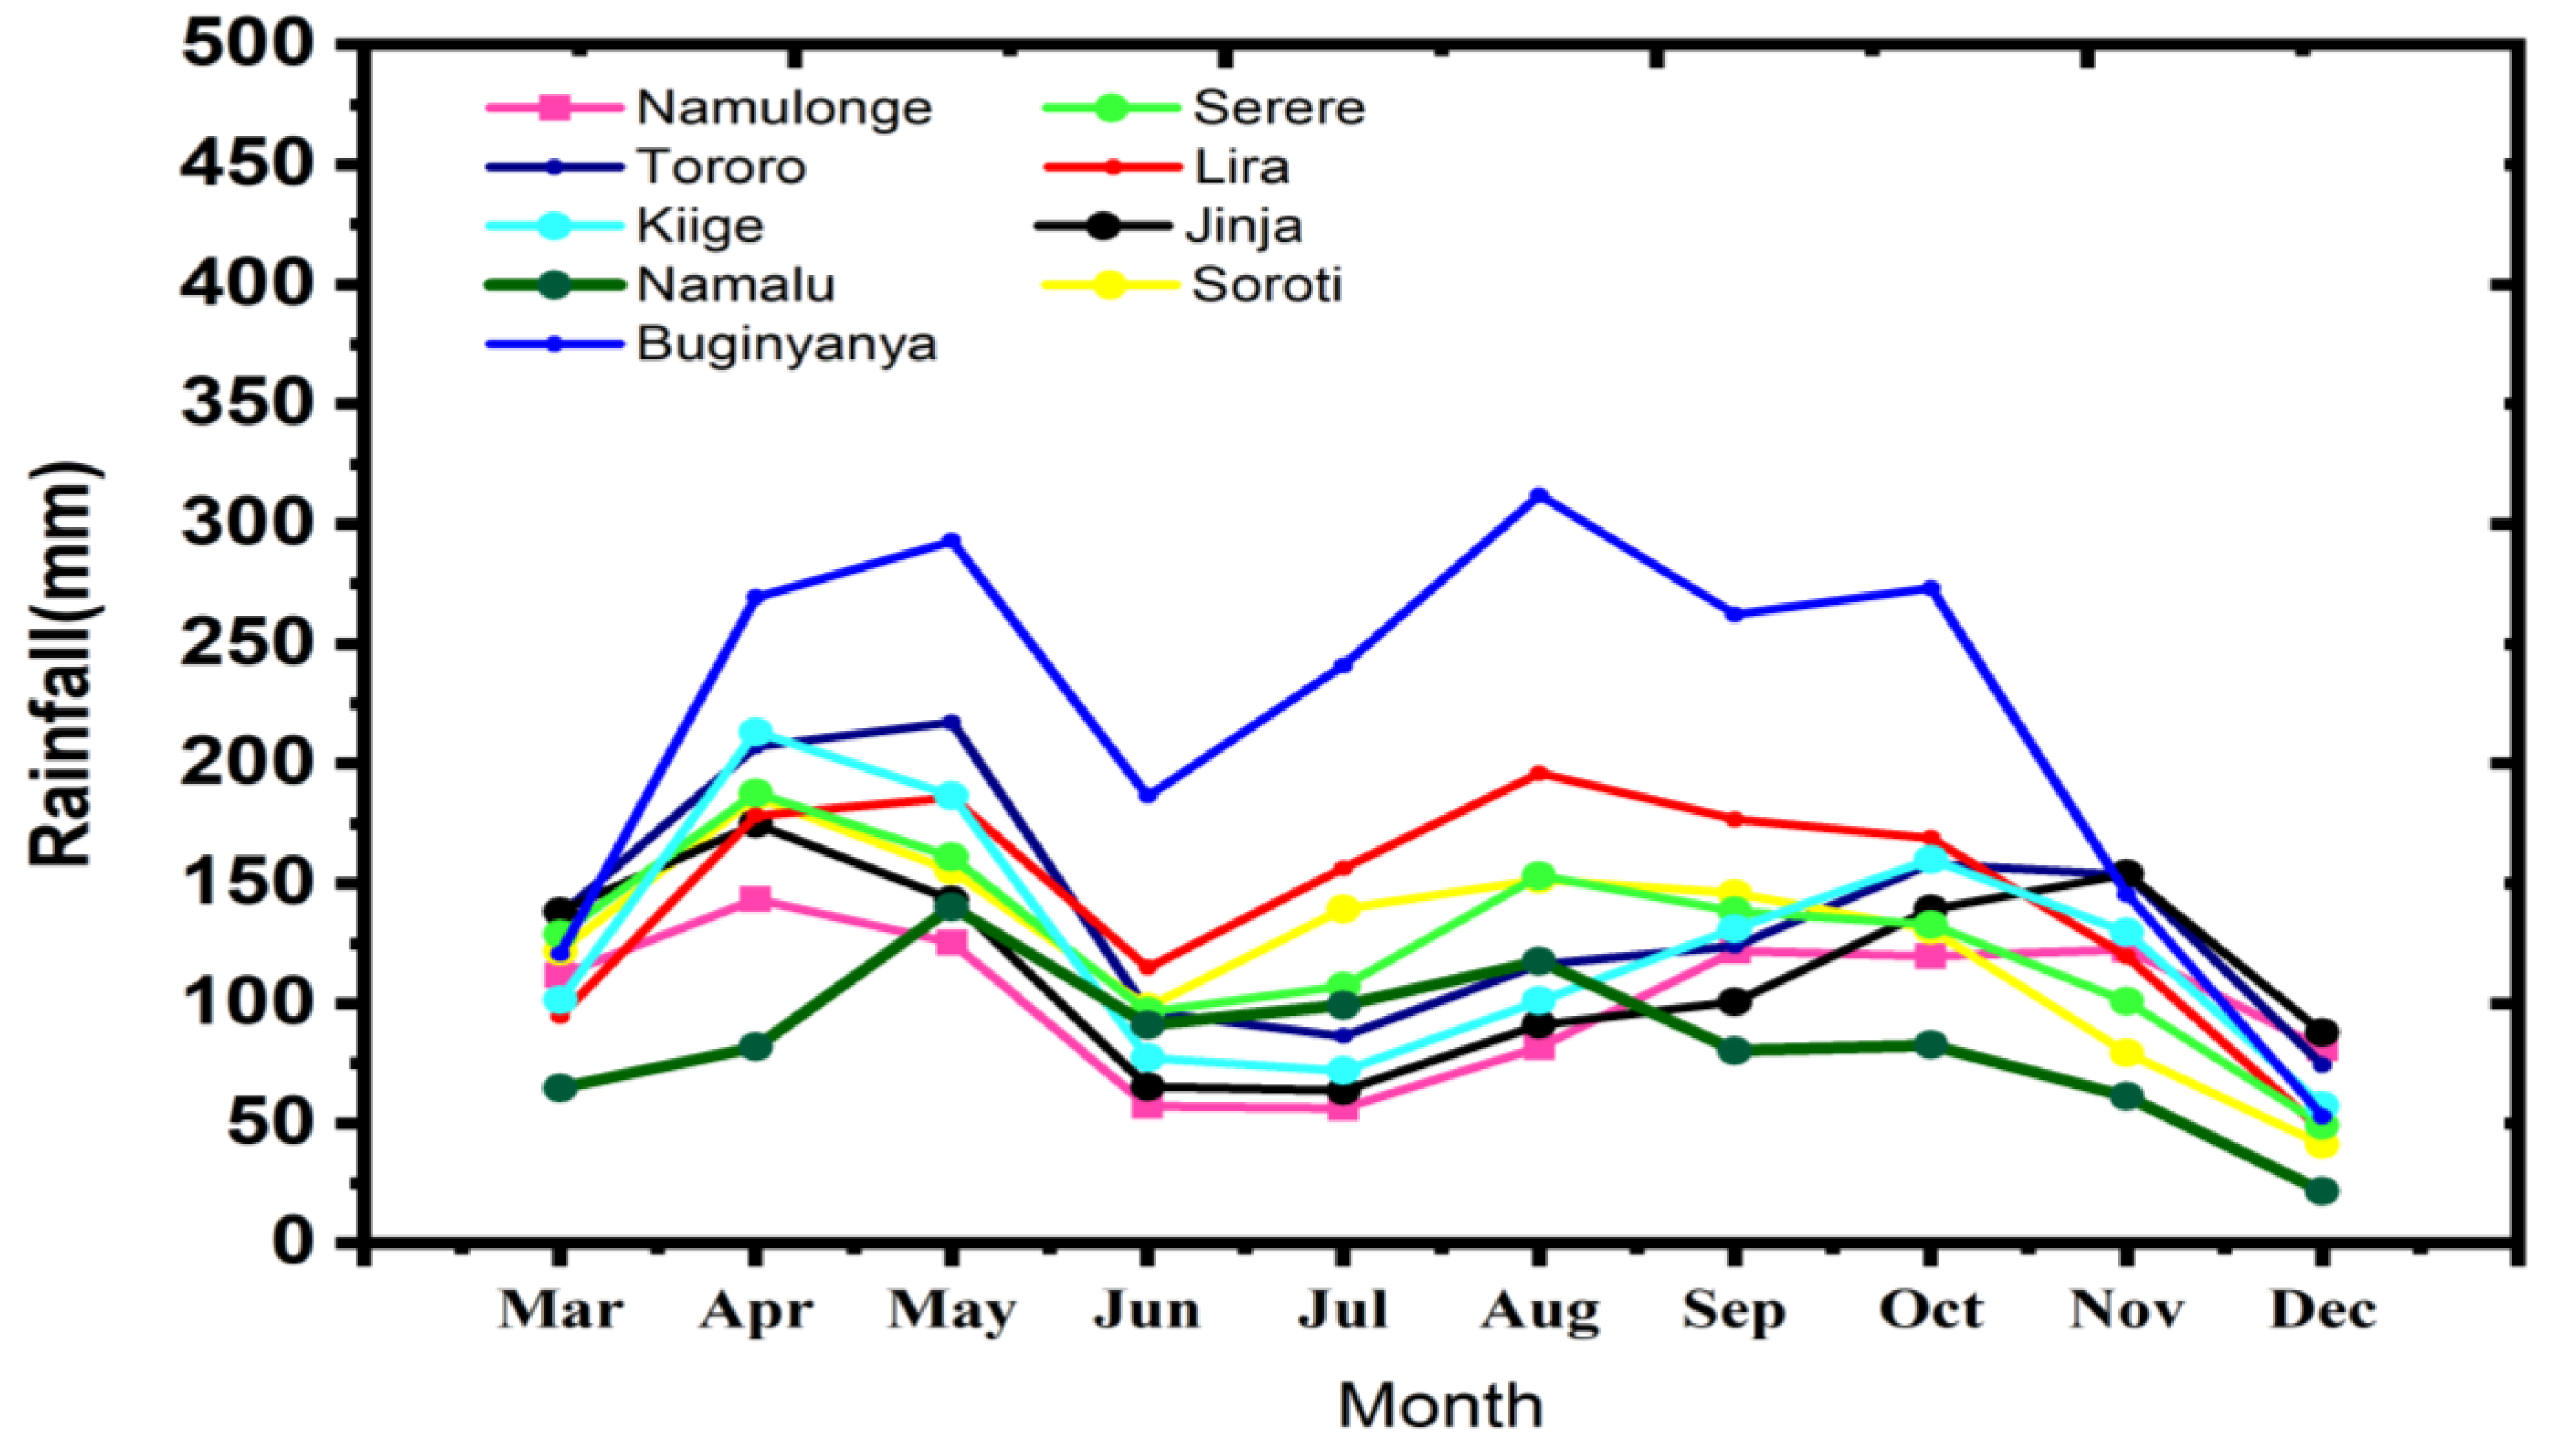
Figure 3.
Temporal variation of total annual rainfall for selected stations during 1983-2017.
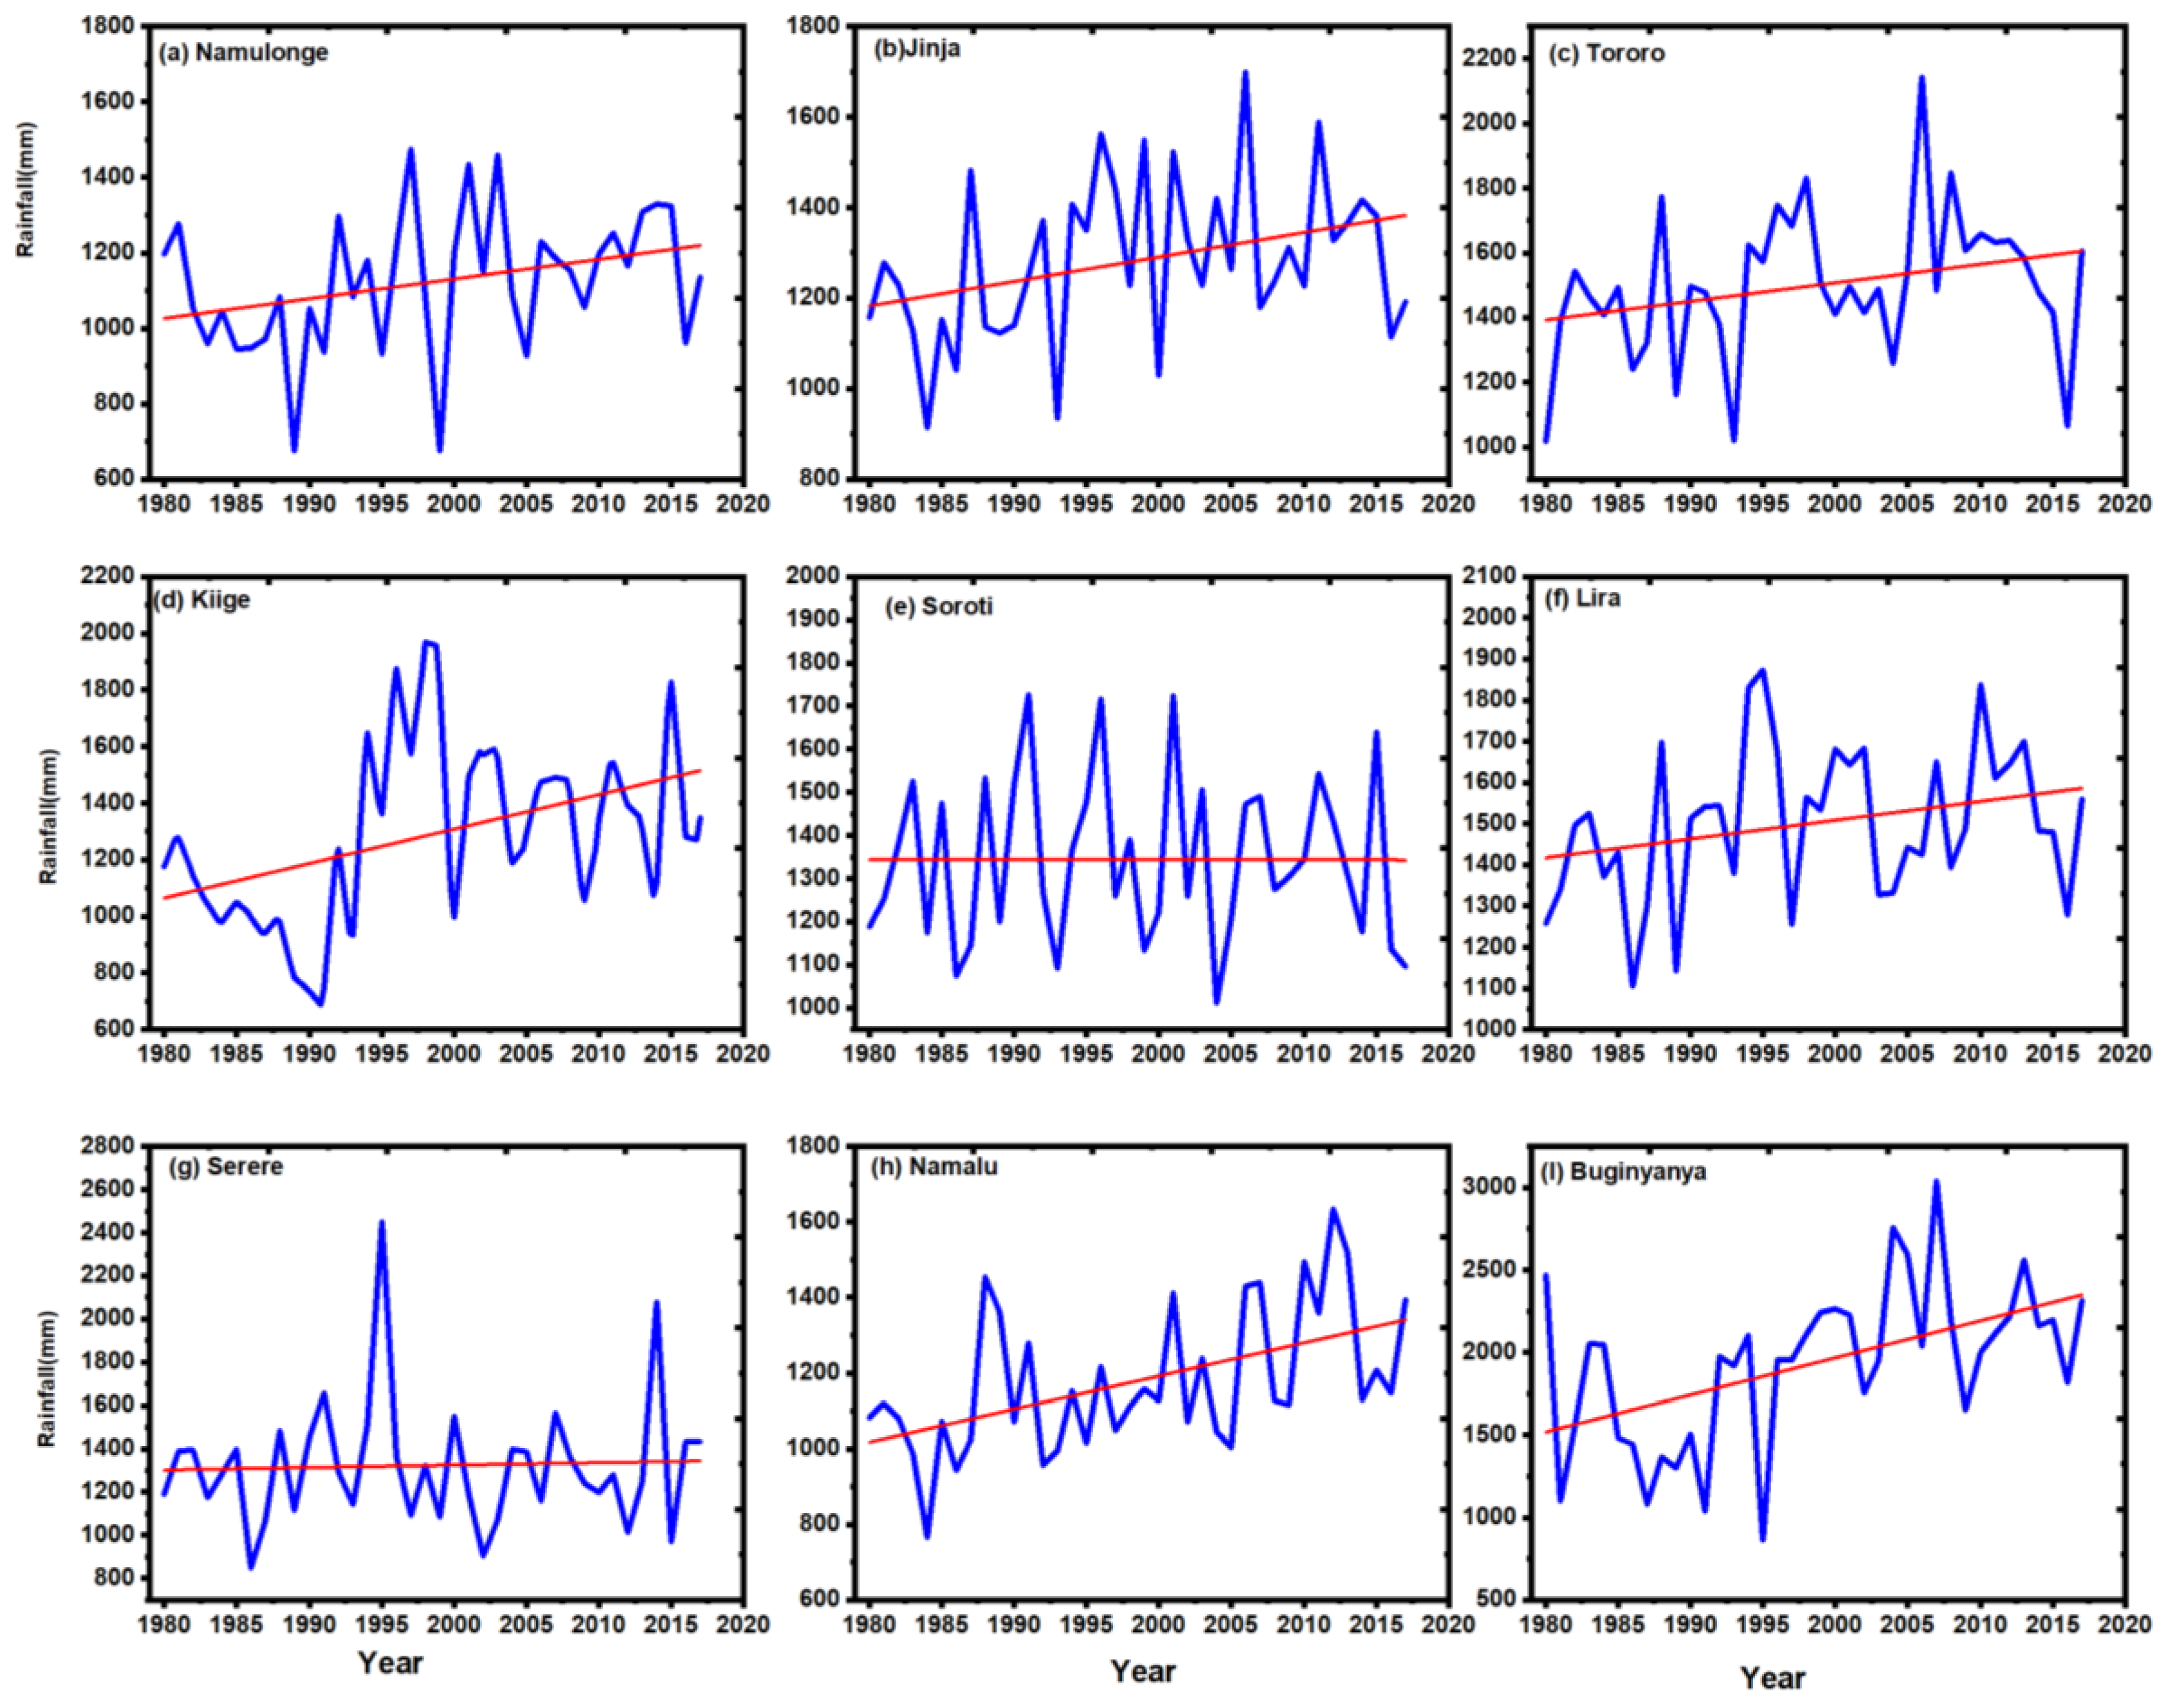
Figure 6.
(a-i). Graphical representation of the time series of seasonal cumulative departure index (CDI) for selected stations in Lake Kyoga Basin. The light grey color bar chat represents MAM) and the Black color chart shows SOND.
Figure 6.
(a-i). Graphical representation of the time series of seasonal cumulative departure index (CDI) for selected stations in Lake Kyoga Basin. The light grey color bar chat represents MAM) and the Black color chart shows SOND.
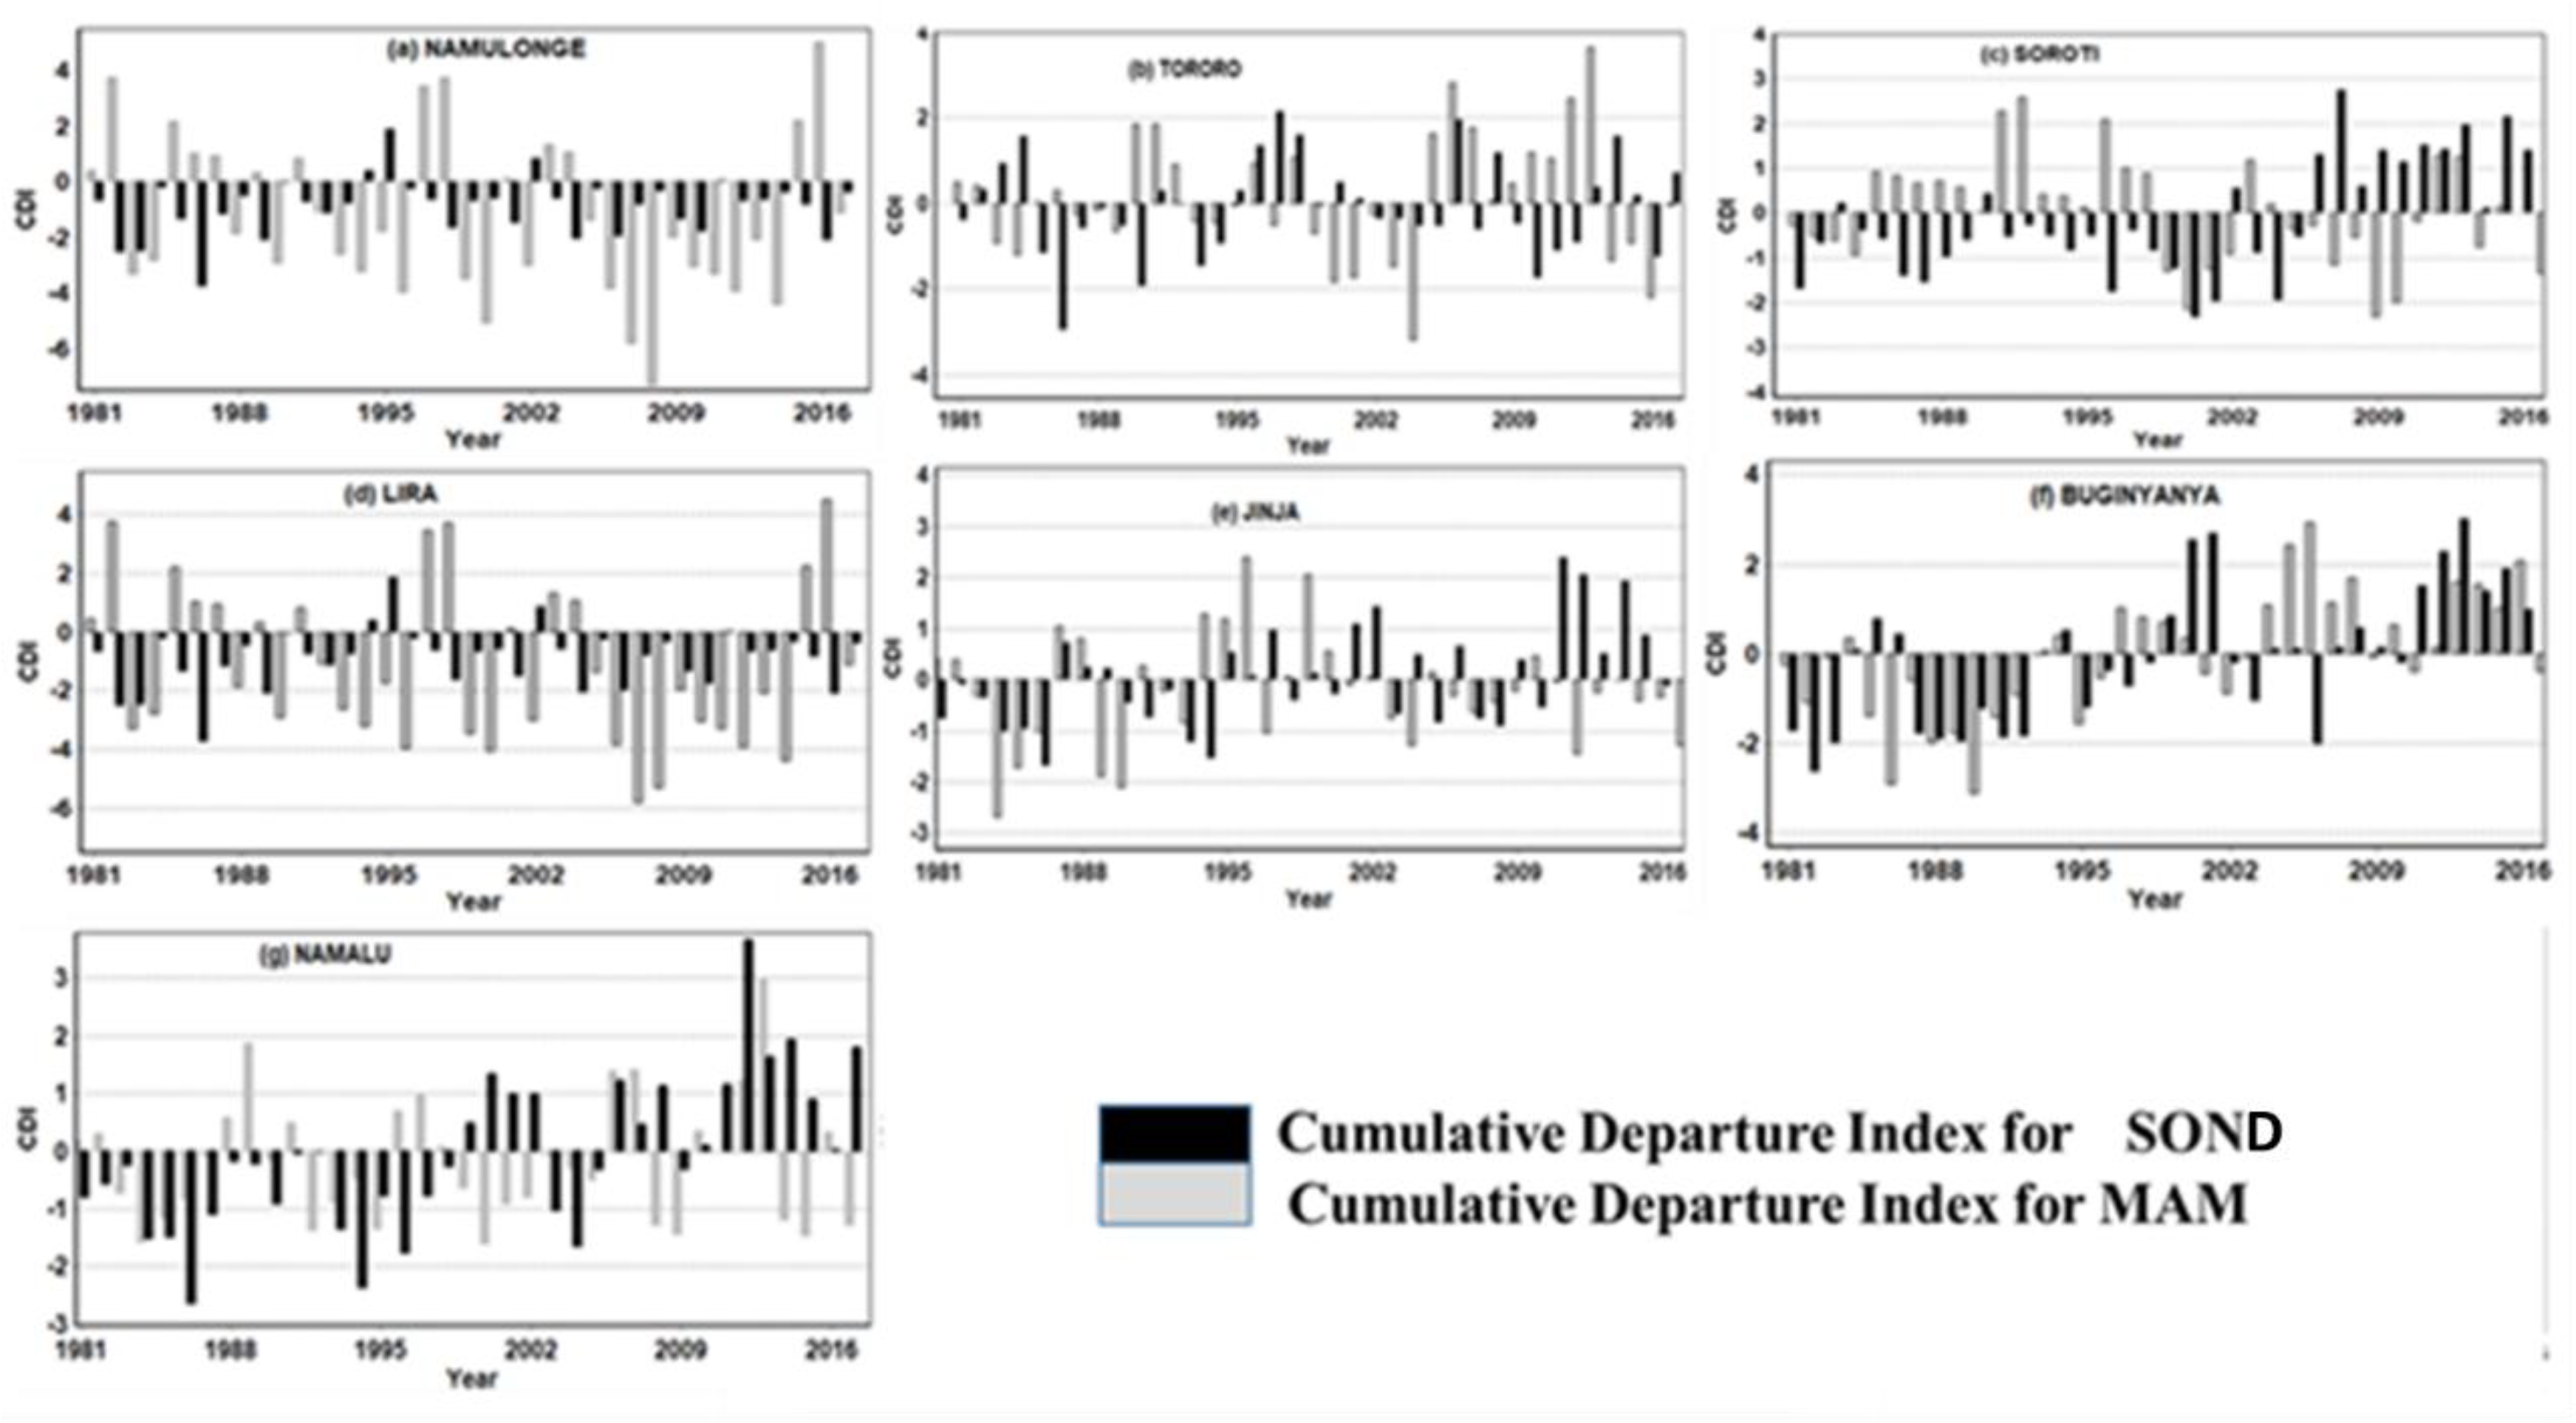
Figure 7.
The annual rainfall anomaly index (RAI) for selected stations in Lake Kyoga Basin in Uganda.
Figure 7.
The annual rainfall anomaly index (RAI) for selected stations in Lake Kyoga Basin in Uganda.
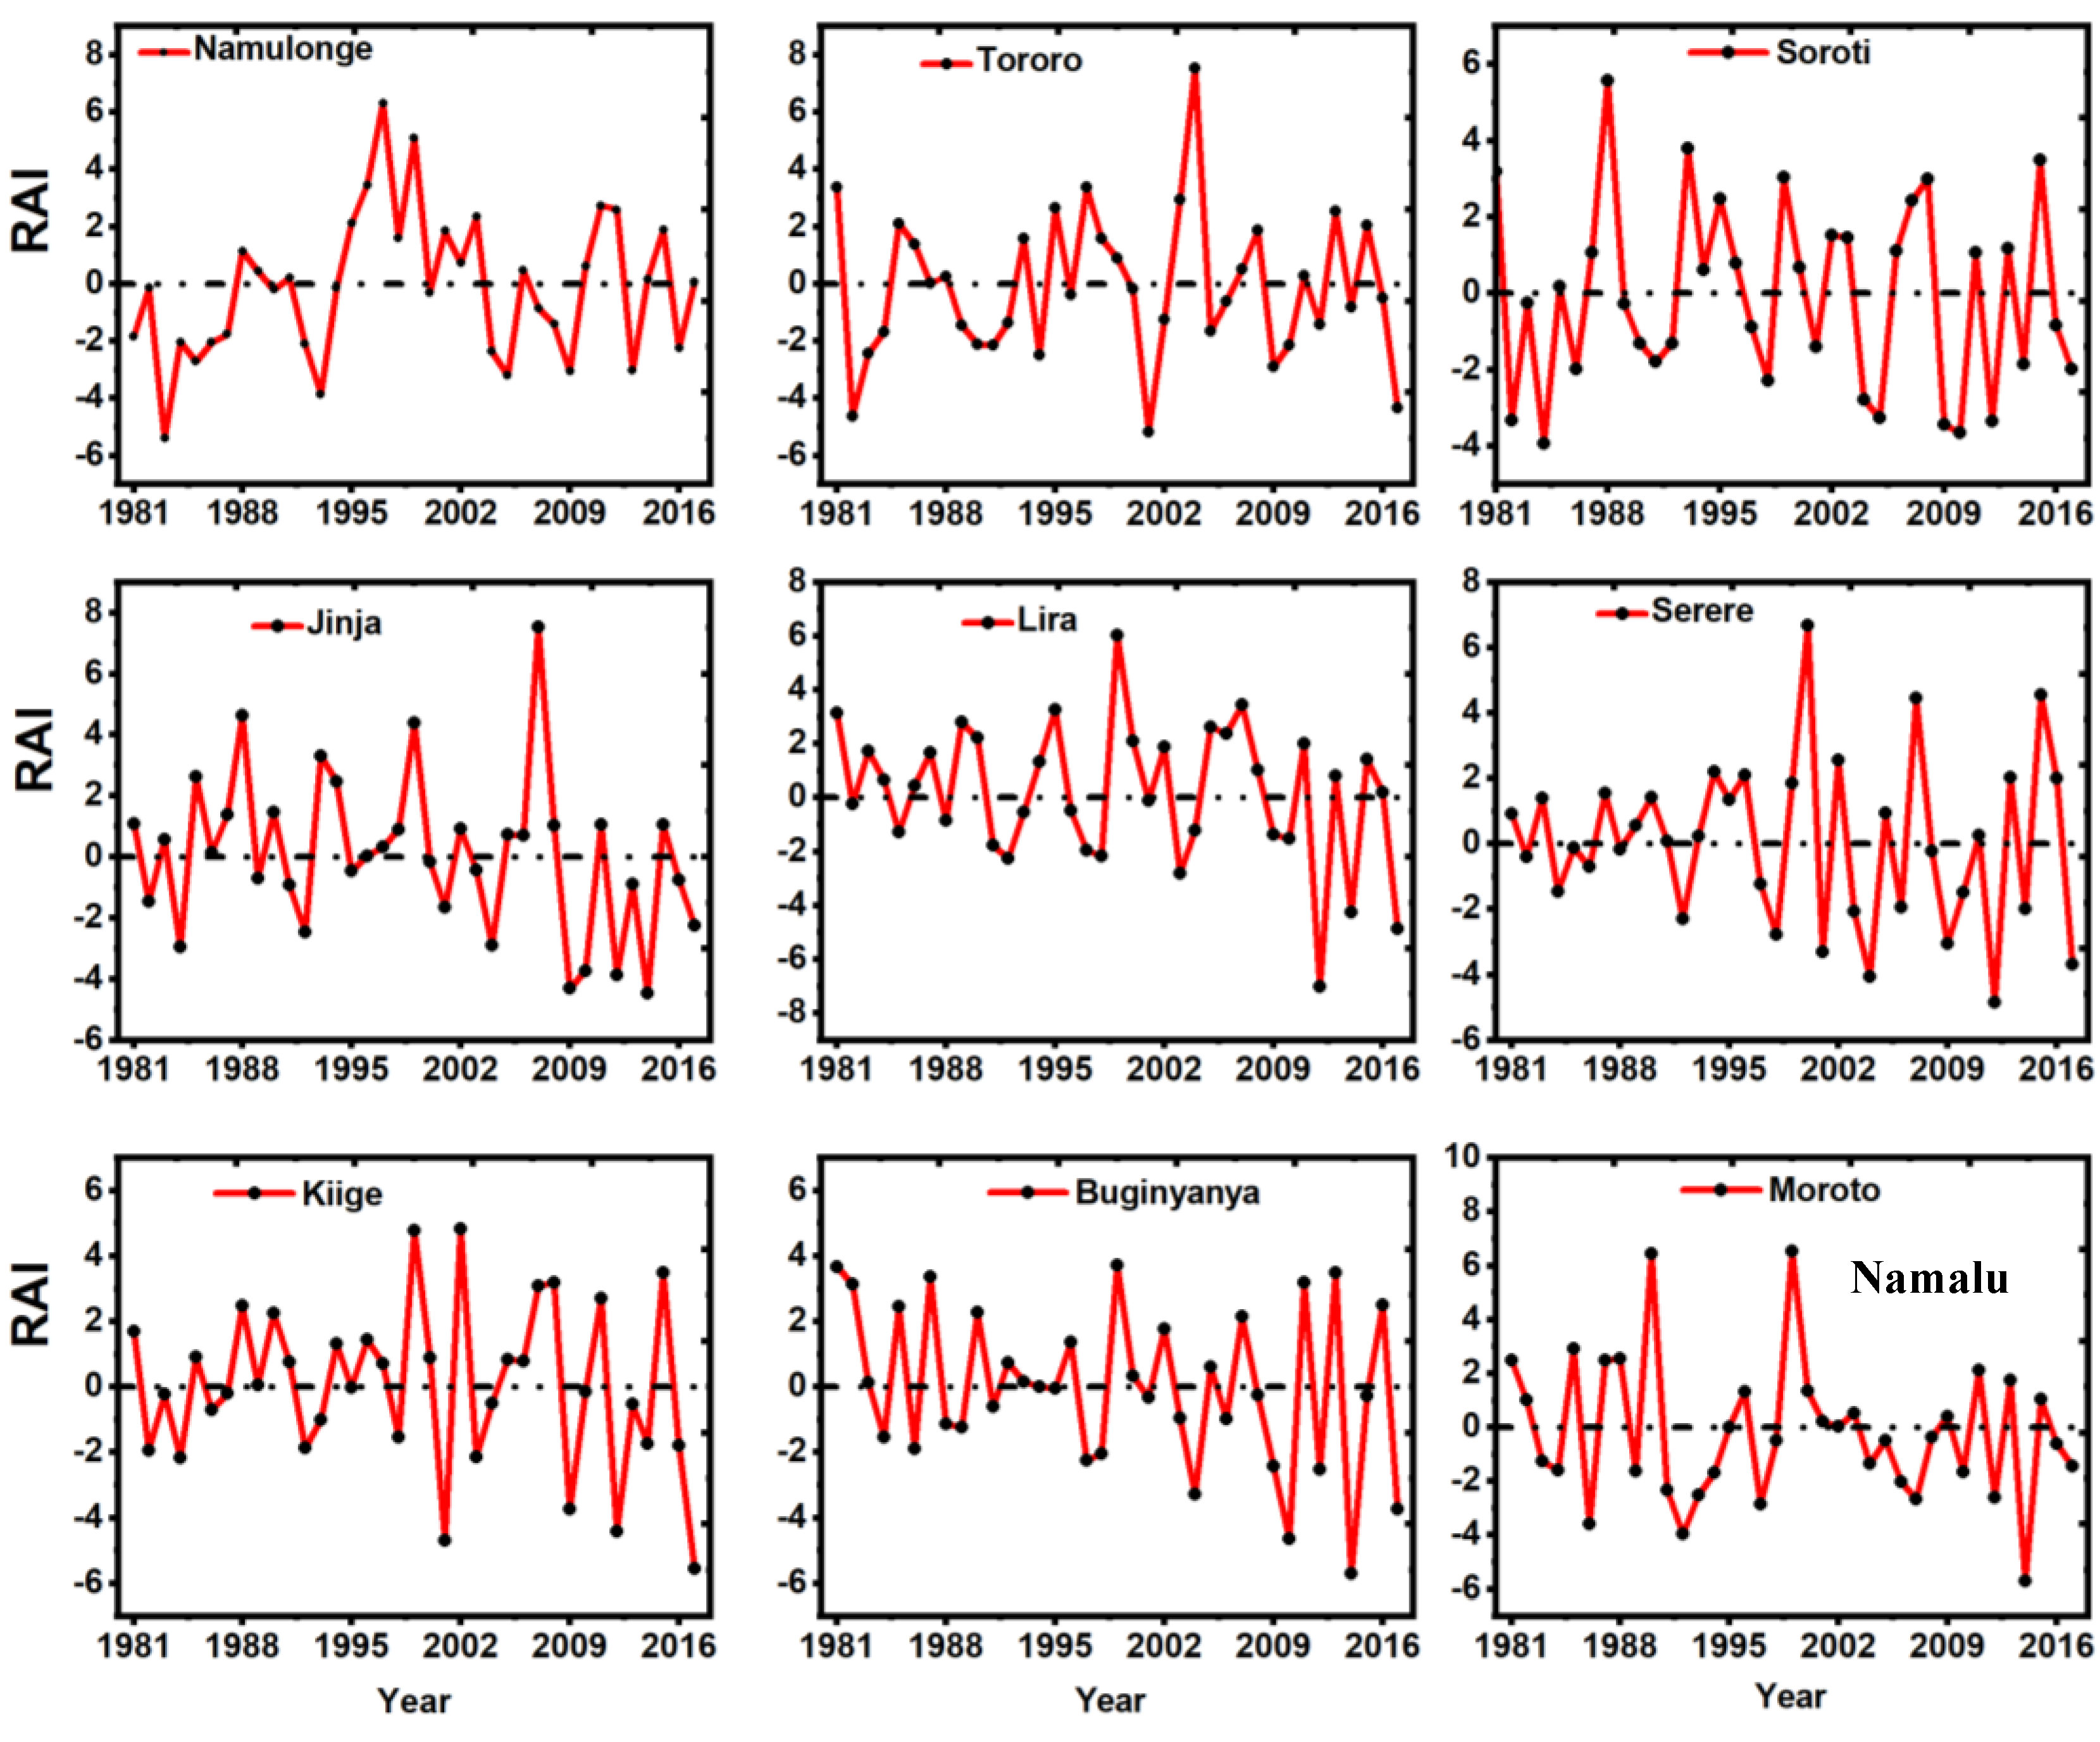

Table 1.
Detailed geographical information of meteorological stations in Lake Kyoga Basin.
| Stations | Longitude (degree) |
Latitude (degree) |
Elevation (meters) |
Data period (Years) |
Rainfall zones |
|---|---|---|---|---|---|
| Namulonge | 32.6 | 0.5 | 1128.3 | 1981- 2017 | B |
| Tororo | 34.2 | 0.7 | 1176.0 | 1981- 2017 | D |
| Soroti | 33.6 | 1.7 | 1115.8 | 1981-2017 | E |
| Jinja | 33.1 | 0.5 | 1175.1 | 1981-2017 | A2 |
| Lira | 32.3 | 2.2 | 1120.2 | 1981-2017 | I |
| Serere | 33.5 | 1.5 | 1098.0 | 1961-2017 | E |
| Kiige | 33.0 | 1.1 | 1089.4 | 1981-2017 | B |
| Buginyanya | 34.4 | 1.3 | 1875.0 | 1981-2017 | F |
| Kotido | 34.1 | 3.0 | 1219.5 | 1981-2017 | G |
| Namalu | 34.8 | 2.0 | 1274.4 | 1981-2017 | L |
Disclaimer/Publisher’s Note: The statements, opinions and data contained in all publications are solely those of the individual author(s) and contributor(s) and not of MDPI and/or the editor(s). MDPI and/or the editor(s) disclaim responsibility for any injury to people or property resulting from any ideas, methods, instructions or products referred to in the content. |
© 2025 by the authors. Licensee MDPI, Basel, Switzerland. This article is an open access article distributed under the terms and conditions of the Creative Commons Attribution (CC BY) license (http://creativecommons.org/licenses/by/4.0/).
Copyright: This open access article is published under a Creative Commons CC BY 4.0 license, which permit the free download, distribution, and reuse, provided that the author and preprint are cited in any reuse.


