
Submitted:
03 March 2025
Posted:
04 March 2025
You are already at the latest version
Abstract
As a typical and widely used passive jamming method, chaff cloud has a strong jamming ability on radar, and still can not be well resolved. It is exceedingly necessary to improve the anti-chaff jamming ability of the radar. In this paper, we address this challenge by proposing an effective residual attention network named RA-Net. Specifically, we introduce the attention mechanism to enable the network to focus on the most informative and stable hierarchical features of the high resolution range profile (HRRP) data, effectively improving the model’s feature extraction capability and overall performance. In addition, we address the limitation of insufficient measured chaff cloud echo data by establishing a remarkably rich and diverse dataset of chaff cloud HRRP data through extensive field experiments, providing a valuable resource and critical foundation for advancing HRRP recognition research in this domain. Experimental results on measured HRRP data demonstrate that RA-Net achieves superior recognition accuracy 97.10% and outstanding generalization performance compared to traditional methods, establishing a new benchmark for chaff cloud HRRP recognition.
Keywords:
chaff jamming
; dataset
; radar
; HRRP
; residual
; attention mechanism
1. Introduction
Chaff jamming has always been a key factor affecting the normal operation of radar. Because of its simple manufacture, low cost, and good jamming effect, it has been widely used in wars and has become a research hotpot in jamming and anti-jamming technology [1,2,3,4,5,6]. Chaff jamming will seriously reduce the detection performance of the radar, resulting in false detection of targets by radar. Therefore, it is of great significance to carry out research on the anti-chaff jamming of radar.
In order to improve the anti-chaff jamming ability of radar, [7] studies the target recognition technology of pulse doppler radar based on bandwidth characteristics. [8] completes the simulation and analysis of target echo signal under the chaff cloud jamming, and gets the chaff cloud jamming effect on radio fuze based on the previous researches. [9] conducts research based on sparseness characteristic of chaff cloud echo signal and target echo signal. [10] proposes two alternative methods to estimate the direction of arrival (DOA) of the target when the chaff jamming is present. Omni-directional radar cross section (RCS) simulation of chaff cloud and ship in CST electromagnetic simulation software is carried out, and the high resolution range profile (HRRP) and polarization characteristics of chaff cloud and ship are analyzed [11]. However, due to the lack of real experimental data on chaff cloud, these methods mentioned above are analyzed based on simulated data, and the practical performances need to be further verified. Therefore, it is exceedingly necessary to establish a real chaff cloud dataset.
Some researchers carry out anti-chaff method research based on range doppler two-dimensional profile, and validate the effectiveness of the identification method [12,13], but these methods need to consume more computational resources. Some researchers [14,15,16,17] mainly focus the research on polarization information, but the methods based on polarization information have more complex hardware design and are more complicated to implement. [18] studies the HRRP characteristics of chaff cloud and provides theoretical supports for the development of jamming and anti-jamming of radio fuze. [19] utilizes the range profile data for the input of the convolutional neural networks (CNN) to discriminate the chaff cloud and the ship. However, the generalization performance of the network is not validated.
In this paper, we propose an effective recognition framework named RA-Net, specifically designed to enhance classification accuracy and robustness. A key component of RA-Net is the integration of an attention mechanism, which enables the network to focus on the most informative and stable hierarchical features, effectively improving the model’s feature extraction capability and overall performance. Furthermore, we construct a comprehensive and diverse dataset of chaff cloud HRRP data by conducting extensive field experiments, providing a solid foundation for exploring chaff cloud HRRP recognition in complex real-world scenarios. Experimental results on the measured HRRP dataset reveal the superiority of our method over traditional approaches, achieving outstanding recognition accuracy 97.10% with excellent generalization performance.
2. Chaff Cloud HRRP Dataset
In order to establish a comprehensive chaff cloud HRRP dataset, we conduct a large number of field experiments. A linear frequency modulation continuous wave radar is used to collect the chaff cloud echo signal. The modulation signal is a triangle wave, the modulation voltage range is 6 v to 9 v, the modulation signal period is 0.5 ms, the frequency range of the radio frequency (RF) signal is 34 GHz to 35.5 GHz, the bandwidth of the RF signal is 1.5 GHz, and the range resolution is 10 centimeters. The content of the field experiment is to carry out extensive chaff cloud diffusion experiments under different conditions. The acquisition time for the chaff cloud echo signal in each field experiment is set to the range of 3 s to 6 s, and the sampling frequency is 2 MHz. The program of the field experiment for the chaff cloud HRRP data acquisition is shown in Figure 1.
HRRP can be considered to be the amplitude of the coherent summations of the complex time returns from target scatterers in each range cell, which represents the reflected radar intensity versus range along the target extent [20]. Because our radar operates in millimeter-wave frequency band and when the chaff cloud is in the diffusion stage, the size of the chaff cloud is much larger than the wavelength of the radar, radar can effectively divide the chaff cloud into many range cells. The radar signals from scattering centers within the same range cell will be coherently summed into a single signal for that rang cell. Performing fast Fourier transform of the chaff cloud echo signal for each period, we can obtain the HRRP data of the chaff cloud.
Two measured chaff cloud HRRP dataset versions are provided: standard chaff cloud HRRP dataset, the chaff length covers 4 mm and 15 mm and the interference band is the X band and the Ka band, and non-standard chaff cloud HRRP dataset, the chaff length covers 4.1 mm, 8.2 mm, 9.6 mm, 12 mm, 14.5 mm, 17.7 mm and 20 mm and the interference band is from the C band to the Ka band. The measured chaff cloud HRRP sample data from standard chaff cloud HRRP dataset and non-standard chaff cloud HRRP dataset are shown in Figure 2.
3. Proposed Methods
In this section, we show the details of the proposed RA-Net, including the overview of the network architecture, fundamental components of the network, and the loss function.
3.1. Design of RA-Net
The RA-Net architecture employs a modular design, combining base block, residual block, attention block, and fully connected layer, followed by a softmax layer. The network takes the HRRP data as input and outputs the final predictions. The overall architecture of the RA-Net is shown in Figure 3. The base block is used to extract initial low-level features from the input HRRP data and the output of the base block is passed to the residual block to enhance gradient flow and enable deeper feature extraction without the risk of degradation. The attention block improves the model’s ability to focus on relevant features, enhancing recognition accuracy and generalization.
3.2. Residual Block
With the network depth increasing, the accuracy of the network gets saturated, so even networks with great depth also face the problem of performance degradation. To ensure maximum information flow between the layers of the network, we chose to link all the matched feature maps by introducting residual blocks and to reuse the low-level features in high levels to improve the accuracy of classification.
Each residual block in our proposed network is composed of convolutional layer, batch normalization layer and ReLU layer. In the convolutional layer, the convolutional kernel is particularly effective for extracting local features along one dimension, making it well suited for processing HRRP data. The output of the convolutional layer is normalized using a batch normalization layer. Batch normalization helps stabilize and accelerate training by normalizing the feature distributions to have zero mean and unit variance, which reduces internal covariate shift. The normalized feature map is passed through the ReLU activation function. ReLU introduces nonlinearity and sparsity, which is essential for learning complex data representations, and also helps improve computational efficiency and reduce the risk of overfitting. Mathematically, the output of the residual block can be expressed as:
where x is the input, the function F represents residual mapping to be learned by the convolutional layer, batch normalization layer and ReLU layer, and represent the weights of the convolutional layer and batch normalization layer respectively, and y is the final output.
3.3. Attention Block
Considering that not all features are equally important in HRRP data, some regions may contain more discriminative information, thus, we add the attention block to enable the network to assign higher weights to the important features while supressing less relevant or noise features. Focusing on informative information to improve the network’s efficiency and accuracy for chaff cloud jamming identification.
Firstly, the input feature map is processed through a global average pooling layer. Then, the global average pooling layer computes the spatial average of the feature map with (2), effectively summarizing the global spatial information into a single scalar. This operation compresses the feature map from a spatial dimension to a vector size .
where represents the global average pool, X is the input feature map, denotes the value of input feature map at position .
The compressed global feature vector is passed through two fully connected layers connected by the ReLU layer. The output of the second fully connected layer is processed through a sigmoid activation function to scale the recalibrated weight to the range [0,1]. The scaled weight represents the relative importance of the HRRP data, which can be expressed as follows:
where is the output of the global average pooling layer, and are the learnable weight matrices of the fully connected layers, and are the learnable bias of the fully connected layers, and refer to the ReLU function and sigmoid activation function respectively.
The original feature map is multiplied by the learned attention weight. This operation reweights the features according to its importance, as determined by the attention mechanism:
where is the input feature map, is the recalibrated output, s represents the attention weight, and ⊗ denotes element-wise multiplication.
3.4. Loss Function
In order to train our proposed network to achieve more performance, we choose the cross-entropy loss as our optimization function. The cross-entropy loss formula is defined as follows:
where N is the number of HRRP samples, K is the number of classes, is the indicator that HRRP sample n belongs to class i, and is the output for HRRP sample n for class i, which in this case, is the value from the softmax function. In other words, is the probability that the network associates observation n with class i.
4. Experiments
In this section, combined the measured chaff cloud HRRP dataset, we conduct extensive experiments to evaluate the proposed RA-Net against other methods in terms of the recognition performance and generalization performance, respectively.
4.1. Training and Test Sets
Our experiments involve two datasets: the training dataset and the test dataset. The ratio of the number of the training and test sets is 7 : 3. The training dataset comprises 8,400 sets of chaff cloud HRRP data and 8,400 sets of target HRRP data. Subsequently, the test dataset is utilized, which includes 3,600 sets of chaff cloud HRRP data and 3,600 sets of target HRRP data. This setup allows us to rigorously evaluate the performance of the radar under controlled conditions.
4.2. Training Details
We train our RA-Net for 700 epochs on all training data sets on a single NVIDIA GeForce RTX 3080 GPU. The size of batch used to evaluate the gradient of the loss function and update the weights is 10. The initial learning rate is set at 0.001, and the learning rate schedule drops the learning rate by a factor of 10 every 10 epochs. The root mean square propagation (rmsprop) optimizer is used for training the proposed neural network. The training progress of the RA-Net is shown in Figure 4.
4.3. Recognition Performance
In Table 2, we present a comparative analysis of the classification performance achieved by the proposed model and several traditional methods, using a consistent dataset and evaluation criteria. The results clearly demonstrate the superiority of the proposed model in achieving high classification performance compared to traditional clustering methods of K-Means, Fuzzy C-Means and FCM-, machine learning method of support vector machine (SVM), and baseline deep learning method CNN. The architecture of CNN does not include the residual blocks and attention blocks, and the parameter settings of the other parts are identical to those of RA-Net. Classification results and recognition performance obtained by different traditional algorithms using various feature combinations are shown in Figure 5, Figure 6, Figure 7, Figure 8 and Table 1 respectively. The definitions of entropy, correlation coefficient and scattering intensity ratio are shown in Appendix A.
As shown in Table 1, Traditional machine learning algorithms show strong dependence on features, have different recognition performance with different feature inputs. K-Means, Fuzzy C-Means, FCM- and SVM achieve the best recognition performance using the feature combination of correlation coefficient and scattering intensity ratio as input.
The CNN method demonstrates a clear improvement over SVM, achieving 94.35% recognition performance. This result emphasizes the ability of deep learning to automatically learn and extract discriminative features, outperforming traditional machine learning techniques that rely on manually extracted features.
The proposed model achieves the highest recognition performance of 97.10%, representing a 2.75% absolute improvement over CNN and an even larger margin over SVM and clustering-based methods. The significant performance boost and substantial improvement can be attributed to the inclusion of architectural innovations of residual blocks, which facilitate the propagation of features and gradients across network layers, and attention mechanisms, which dynamically recalibrate feature importance, allowing the model to focus on the most discriminative information. These architectural enhancements enable the proposed model to set a new benchmark for classification tasks, offering a robust and highly effective solution for scenarios requiring accurate recognition.
4.4. Generalization Performance
In order to evaluate the generalization performance of the proposed model, we take another dateset which is different from the training and test set as a new test set. The new test set consists of 1,000 sets of chaff cloud HRRP data and 1,000 sets of target HRRP data. Table 3 illustrates the classification performance of the proposed model compared to traditional methods across a different test set. The proposed model still achieves the highest recognition performance of 94.85%, which demonstrates its robustness and adaptability in handling complex HRRP data under varying conditions.
The results emphasize the importance of model architecture design and highlight the limitations of other traditional methods, making it well-suited for real-world applications requiring reliable classification across diverse datasets.
5. Conclusions
In this paper, we present a novel and effective method called RA-Net for chaff cloud HRRP recognition. In addition, we establish a remarkably rich and diverse dataset of chaff cloud HRRP by conducting extensive filed experiments. We further introduce the attention mechanism to the network to learn more useful and stable hierarchical features from HRRP data and improve the network performance. The experimental results on measured HRRP data reveal that our proposed method achieves superior recognition performance of 97.10% and exceptional generalization performance compared with other methods.
Funding
This research was funded by National Natural Science Foundation of China under Grant NO. 61871442.
Data Availability Statement
The original contributions presented in this study are included in this paper. For more detailed information, please contact the corresponding author directly.
Acknowledgments
Thanks to the authors of this paper for their work on the research content, as well as the journal staff for their comments and revisions to this paper.
Conflicts of Interest
The authors declare no conflicts of interest.
Appendix A
Appendix A.1. Entropy
The concept of entropy is introduced to assess the complexity of the HRRP sequence of chaff cloud echo and target echo. Let the echo HRRP sequence be represented as . We first normalize the echo HRRP sequence using the following formulas:
The waveform entropy of the HRRP sequence can be expressed as follows:
The waveform entropy reflects the degree of dispersion of the HRRP sequence distribution, the smaller the value indicates that the energy distribution of the object scattering center is more concentrated, and vice versa indicates that the energy distribution of the object scattering center is more dispersed.
Appendix A.2. Correlation Coefficient
The geometric differences between target and chaff cloud lead to variations in the distribution of scattering points. These differences, in turn, affect the characterization of the echo HRRP and influence the correlation observed within the echo HRRP sequence.
The correlation coefficient of the HRRP sequence between different echo periods is defined as follows:
where cov represents the operation of covariance, represents the operation of standard deviation, and represent the HRRP sequence of different echo periods, and denote the expectation of the HRRP sequence of different echo periods, respectively.
The average correlation coefficient of the HRRP sequence across N different echo periods is defined as follows:
Appendix A.3. Scattering Intensity Ratio
Firstly, the HRRP sequence for each period is sorted in descending order according to the amplitude, and the sorted HRRP sequence of each period can be expressed as .
To calculate the scattering intensity ratio, we first determine the power value of the first m strong scattering points in the sorted HRRP sequence and compare it to the total power value of the entire HRRP sequence. The scattering intensity ratio can be expressed as:
References
- Li, J.; Zuo, Y.; Guo, L.; Liu, W. A Distribution Feature Prediction Method for Chaff Using Polarized Scattering Data. IEEE Antennas and Wireless Propagation Letters 2022, 22, 452–456. [Google Scholar]
- Zuo, Y.; Guo, L.; Liu, W.; Ding, J. Determination of the Forward Electromagnetic Coupling Radius in Chaff Cloud. IEEE Antennas and Wireless Propagation Letters 2022, 21, 262–266. [Google Scholar] [CrossRef]
- Marcus, S. Dynamics and radar cross section density of chaff clouds. IEEE Transactions on Aerospace and Electronic Systems 2004, 40, 93–102. [Google Scholar] [CrossRef]
- Žák, J.; Vach, M.; Dvořáček, F. Advanced Chaff usage in modern EW. In Proceedings of the 2016 IEEE Radar Methods and Systems Workshop (RMSW); 2016; pp. 56–59. [Google Scholar] [CrossRef]
- Wang, L.P. Study on Interference Method of Fuze Anti - Chaff Based on Electrostatic Characteristics. In Proceedings of the 2021 7th International Conference on Condition Monitoring of Machinery in Non-Stationary Operations (CMMNO), 2021, pp. 115–121. [CrossRef]
- Sun, P.; Cai, Q.; Tang, J.; Li, N.; Du, J. On spreading chaff cloud for countering the terminal guidance missile. In Proceedings of the Proceedings of 2011 IEEE CIE International Conference on Radar, 2011, Vol. 1, pp. 845–849. [CrossRef]
- Yan, Z.; Hao, X.; Li, R.; Li, P. Target Recognition Technology of Pulse Doppler Radio Fuze Based on Bandwidth Characteristics for Anti-Chaff Jamming. In Proceedings of the 2019 IEEE Asia-Pacific Conference on Applied Electromagnetics (APACE), 2019, pp. 1–6. [CrossRef]
- Zhang, F.; Liu, J.; Lin, H. Study on Chaff Interference for Doppler Fuze. In Proceedings of the 2019 IEEE MTT-S International Microwave Biomedical Conference (IMBioC), 2019, Vol. 1, pp. 1–4. [CrossRef]
- Guangfu, T.; Ke, Z.; Hongzhong, Z.; Zhenzhen, Z. A novel discrimination method of ship and chaff based on sparseness for naval radar. In Proceedings of the 2008 IEEE Radar Conference, 2008, pp. 1–4. [CrossRef]
- Liu, Y.; Xing, S.; Liu, Y.; Li, Y.; Wang, X. Maximum Likelihood Angle Estimation of Target in the Presence of Chaff Centroid Jamming. IEEE Access 2018, 6, 74416–74428. [Google Scholar] [CrossRef]
- HU, S.; WU, L.; ZHANG, J.; Xu, J. Research on Chaff Jamming Recognition Technology of Anti-Ship Missile Based on Radar Target Characteristics. In Proceedings of the 2019 12th International Conference on Intelligent Computation Technology and Automation (ICICTA), 2019, pp. 222–226. [CrossRef]
- Hong, Z.; Yu-jian, P.; Qing-ping, W.; Ning, T.; Naichang, Y. An anti-chaff jamming method for millimeter wave wideband coherent radar based on range Doppler feature. In Proceedings of the 2015 IEEE International Conference on Signal Processing, Communications and Computing (ICSPCC), 2015, pp. 1–6. [CrossRef]
- Zhang, T.; Zhang, J.; Liang, Z.; Chen, X.; Song, Y. Chaff jamming recognition based on pulse Doppler radar. In Proceedings of the IET International Radar Conference (IRC 2023), 2023, Vol. 2023, pp. 3677–3681. [CrossRef]
- Shao, X.; Du, H.; Xue, J. A recognition method depended on enlarge the difference between target and chaff. In Proceedings of the 2007 International Conference on Microwave and Millimeter Wave Technology, 2007, pp. 1–4. [CrossRef]
- Li, M.; Lang, P.; Fu, X.; Dong, J.; Liu, C.; Jiang, J. A Novel Chaff Cloud Recognition Method Based on Wideband Polarization Radar. In Proceedings of the 2021 CIE International Conference on Radar (Radar), 2021, pp. 1927–1930. [CrossRef]
- Gang, C.; Longfei, S.; Jiazhi, M.; Jian, L. Identification of chaff interference based on polarization parameter measurement. In Proceedings of the 2017 13th IEEE International Conference on Electronic Measurement & Instruments (ICEMI), 2017, pp. 392–396. [CrossRef]
- Li, J.; Zuo, Y.; Guo, L.; Liu, W. A Distribution Feature Prediction Method for Chaff Using Polarized Scattering Data. IEEE Antennas and Wireless Propagation Letters 2023, 22, 452–456. [Google Scholar] [CrossRef]
- Hong-Jie, X.; Jian-Bing, L.; Zhong-Fu, X.; Tao, W. Analysis of wideband characteristics and jamming technology of chaff cloud. In Proceedings of the Proceedings of 2014 3rd Asia-Pacific Conference on Antennas and Propagation, 2014, pp. 1053–1057. [CrossRef]
- Kaydok, U. Chaff Discrimination Using Convolutional Neural Networks and Range Profile Data. In Proceedings of the 2020 IEEE International Radar Conference (RADAR); 2020; pp. 373–377. [Google Scholar] [CrossRef]
- Feng, B.; Chen, B.; Liu, H. Radar HRRP target recognition with deep networks. Pattern Recognition 2017, 61, 379–393. [Google Scholar]
Figure 1.
The program of the field experiment for the chaff cloud HRRP data acquisition.
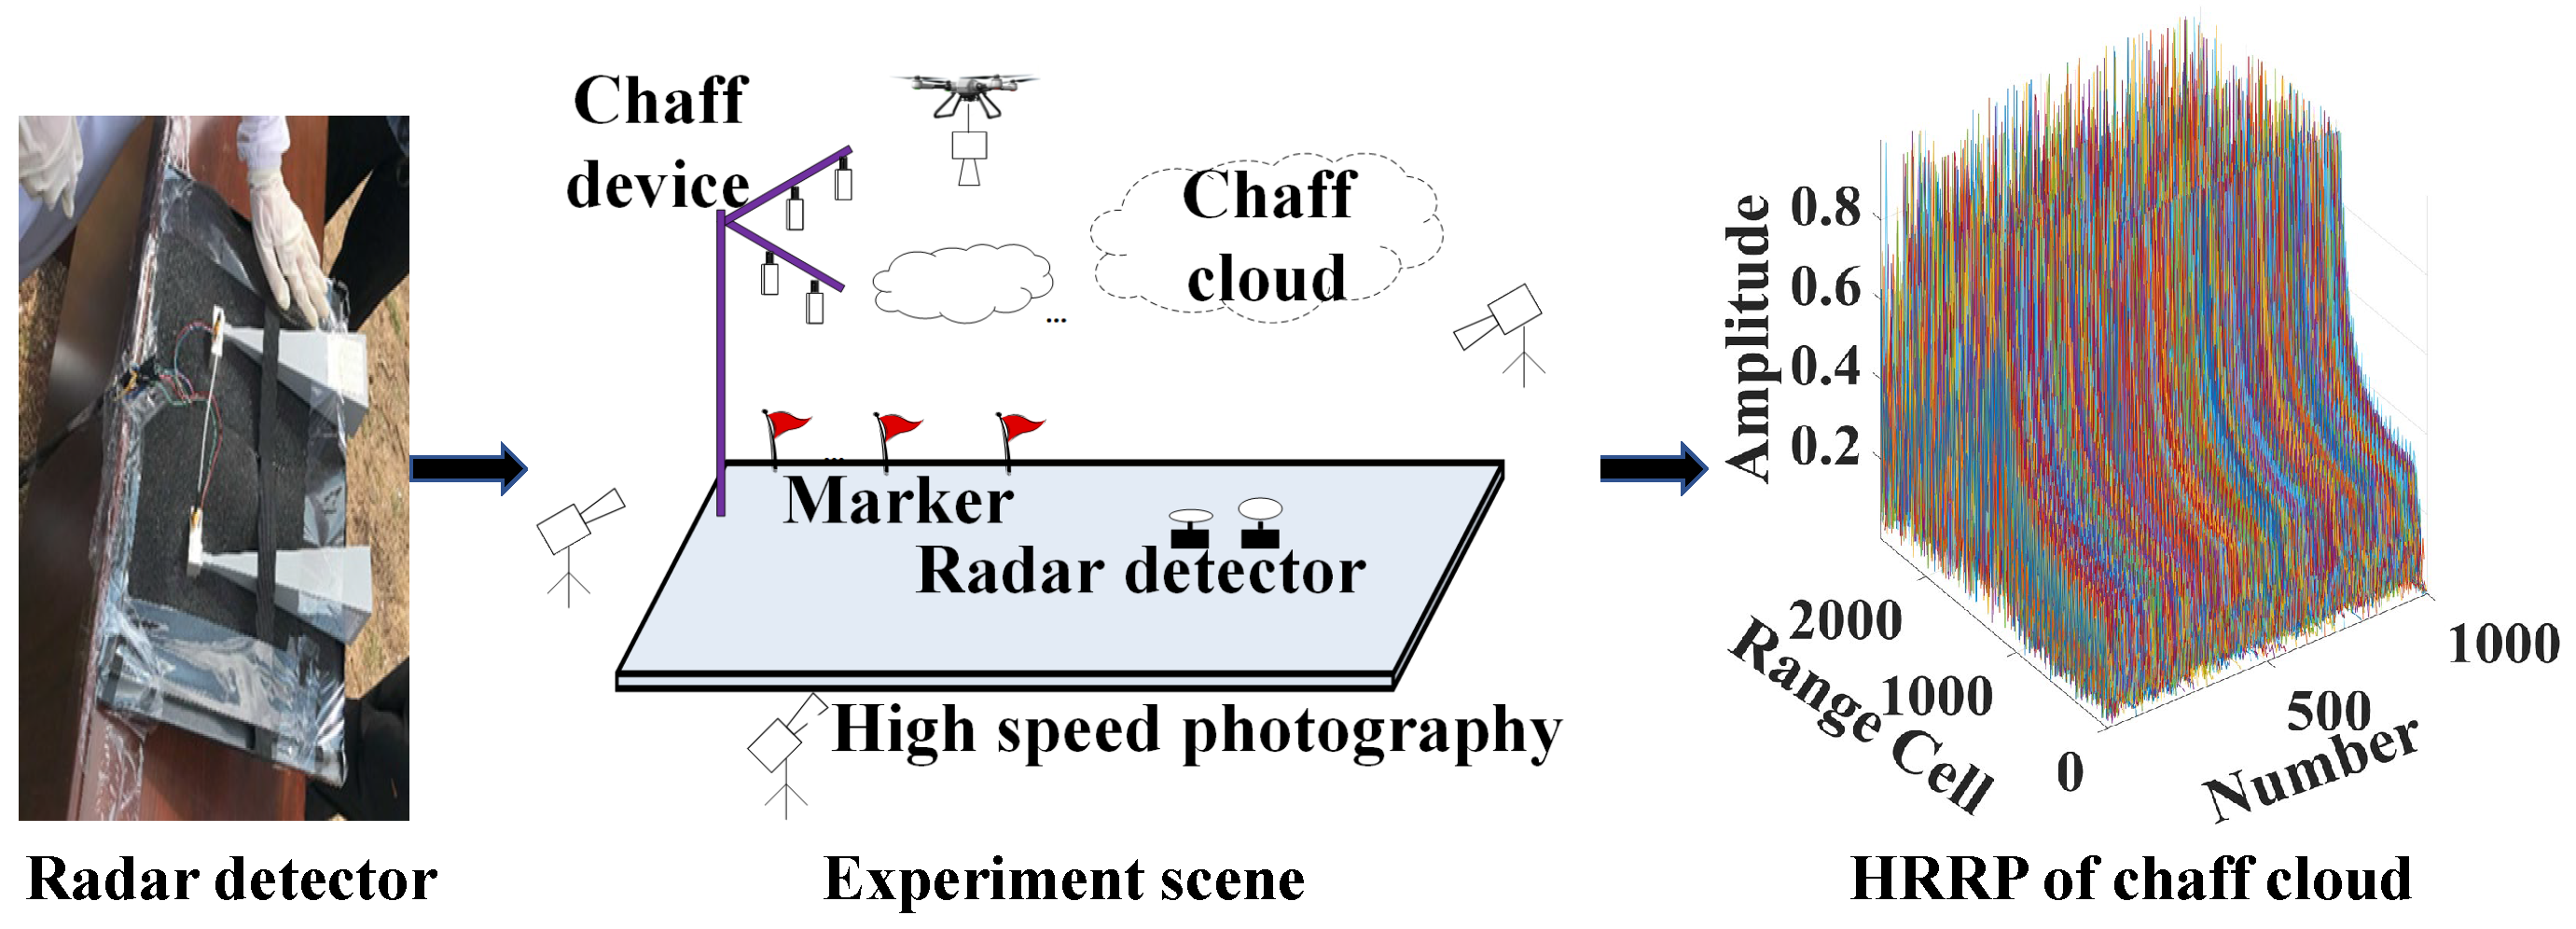
Figure 2.
Measured chaff cloud HRRP sample data from standard chaff cloud HRRP dataset and non-standard chaff cloud HRRP dataset. (a) standard chaff cloud HRRP data. (b) non-standard chaff cloud HRRP data.
Figure 2.
Measured chaff cloud HRRP sample data from standard chaff cloud HRRP dataset and non-standard chaff cloud HRRP dataset. (a) standard chaff cloud HRRP data. (b) non-standard chaff cloud HRRP data.
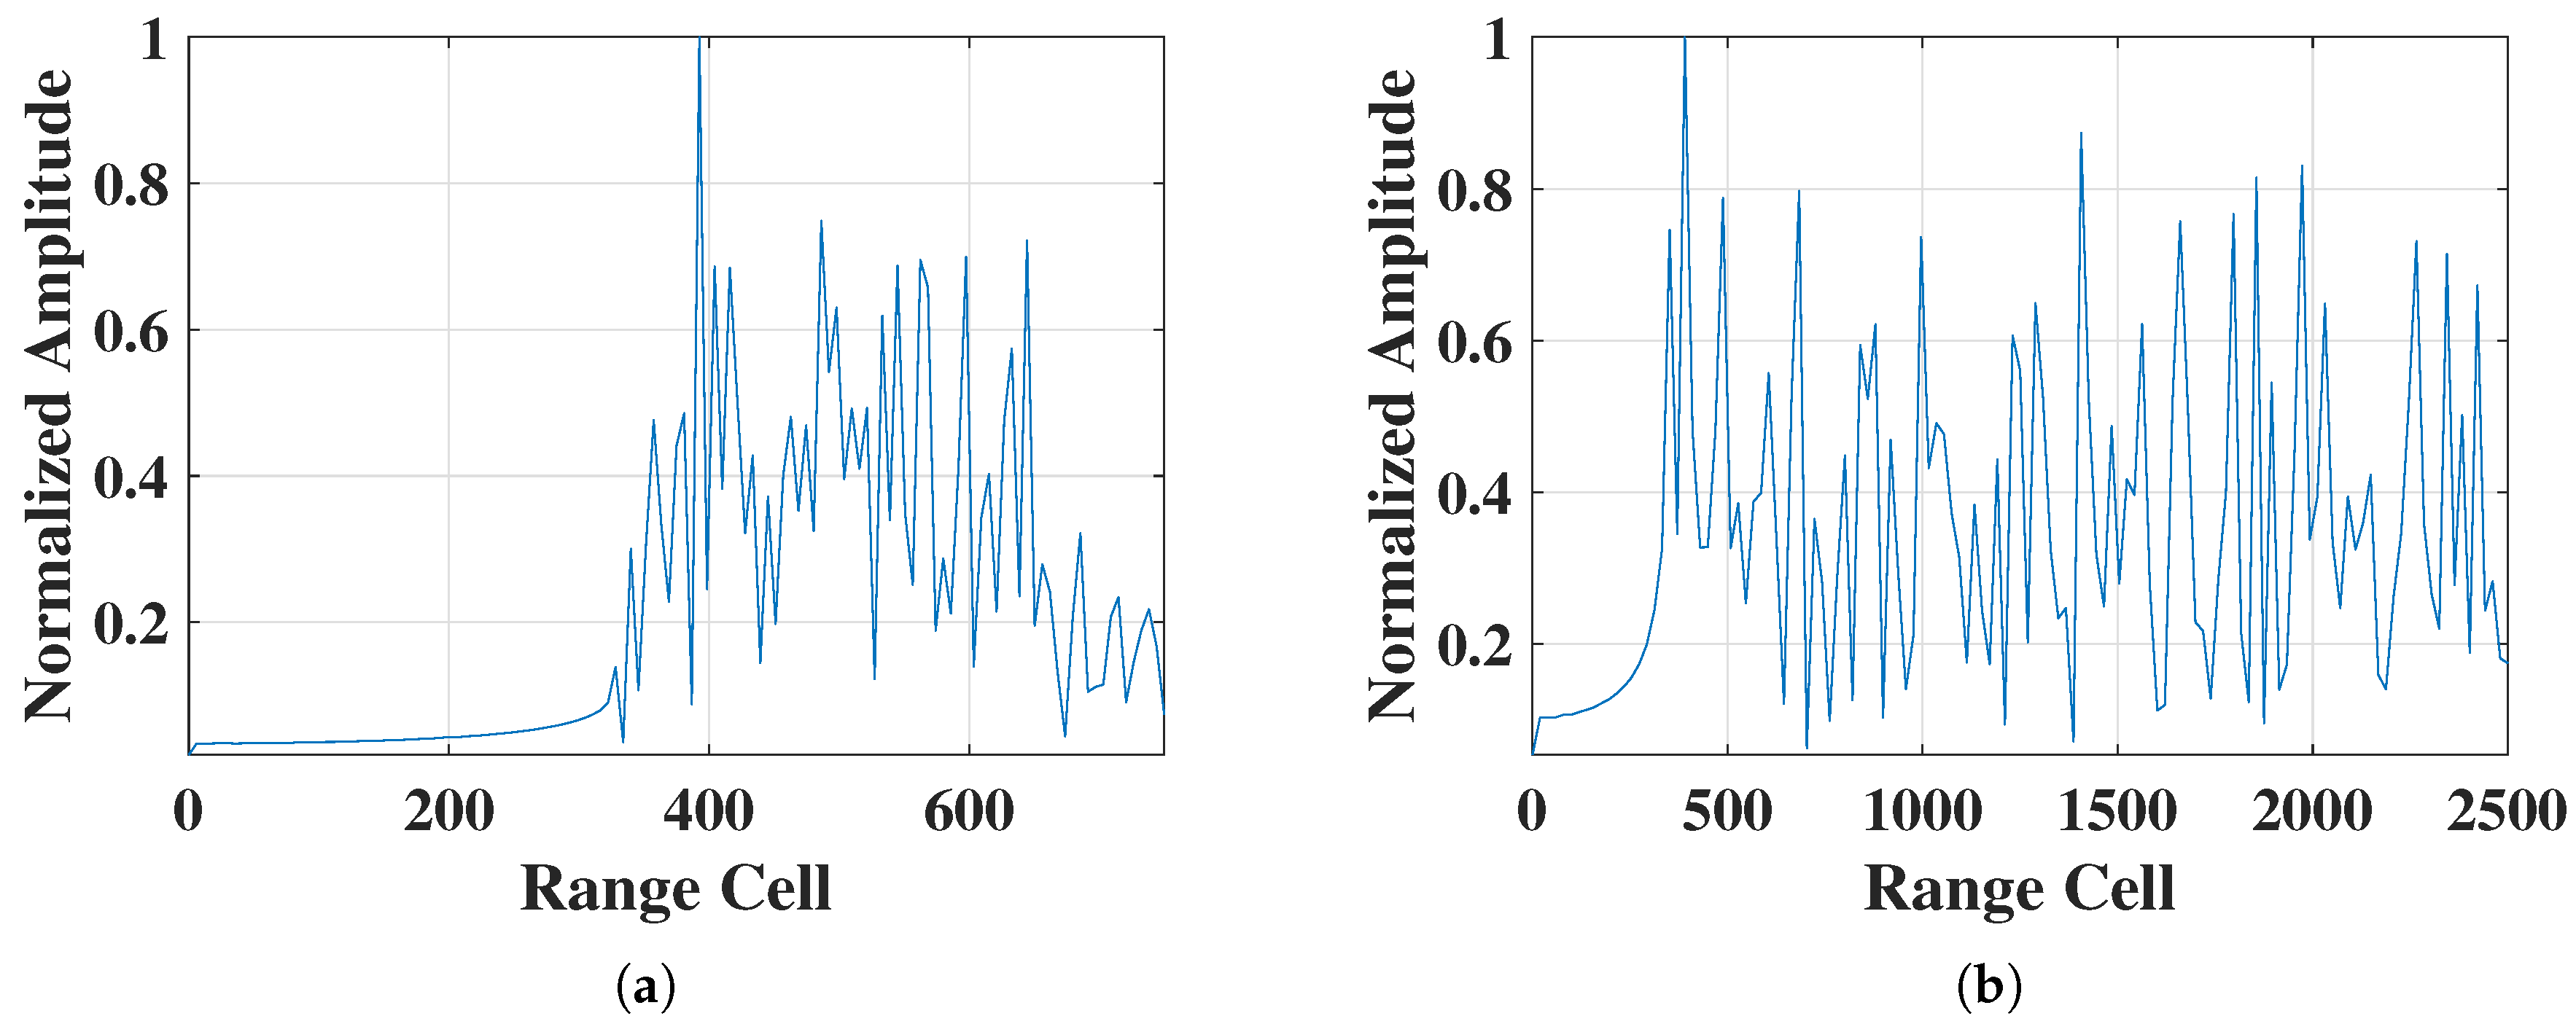
Figure 3.
Architecture of our proposed method.
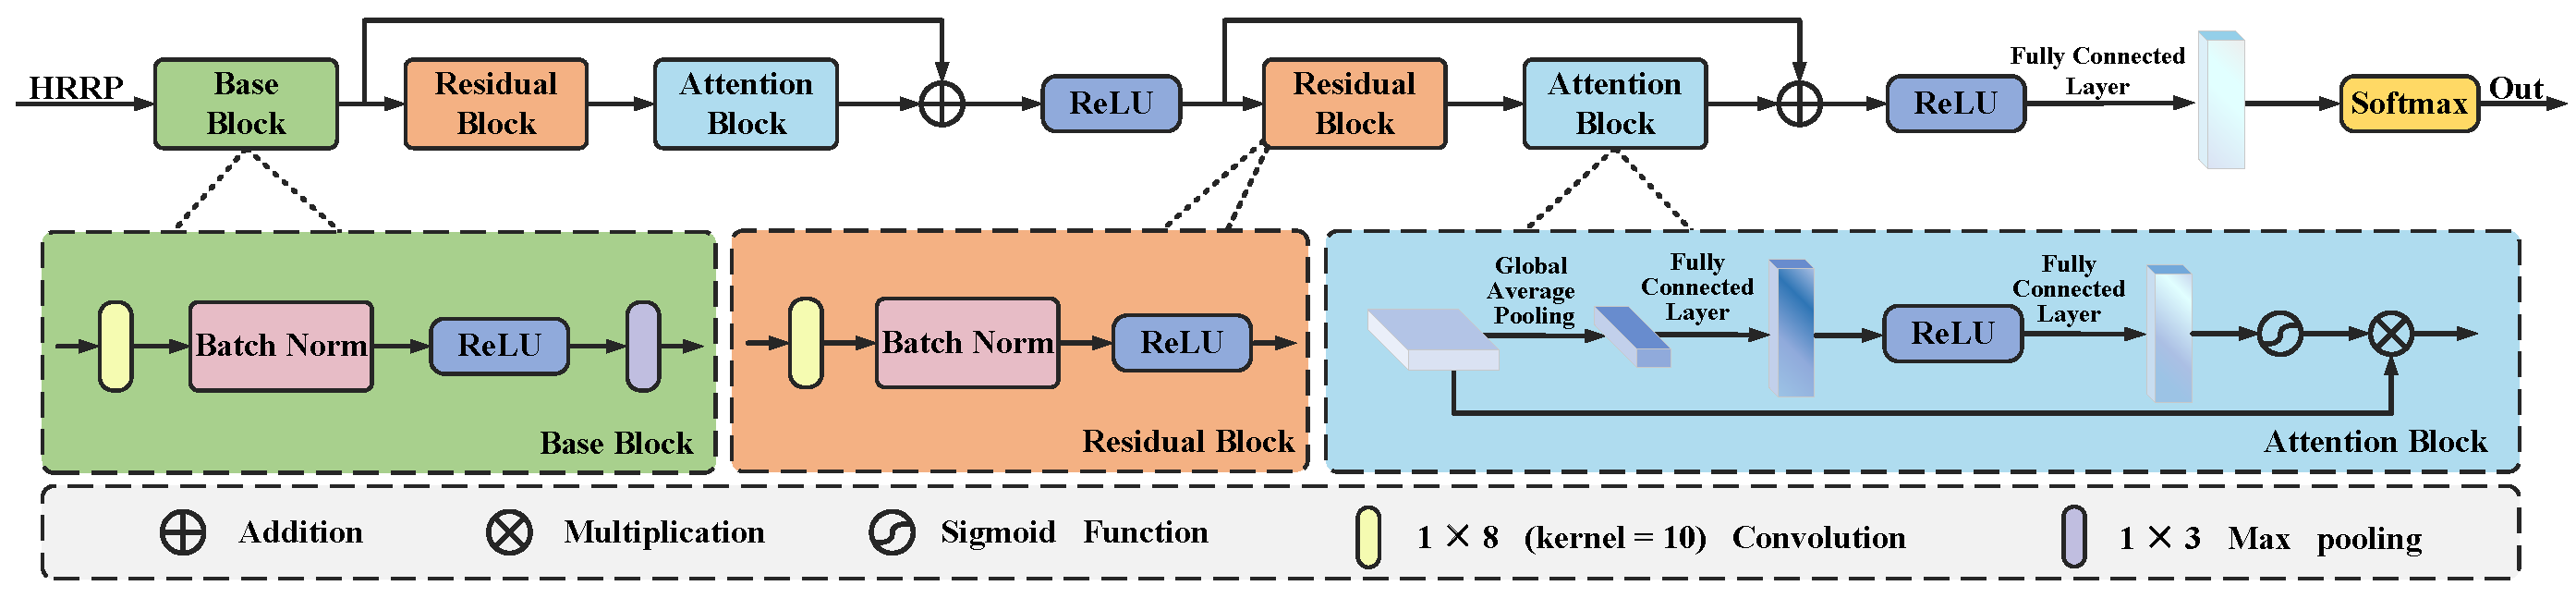
Figure 4.
The training progress of our proposed RA-Net.
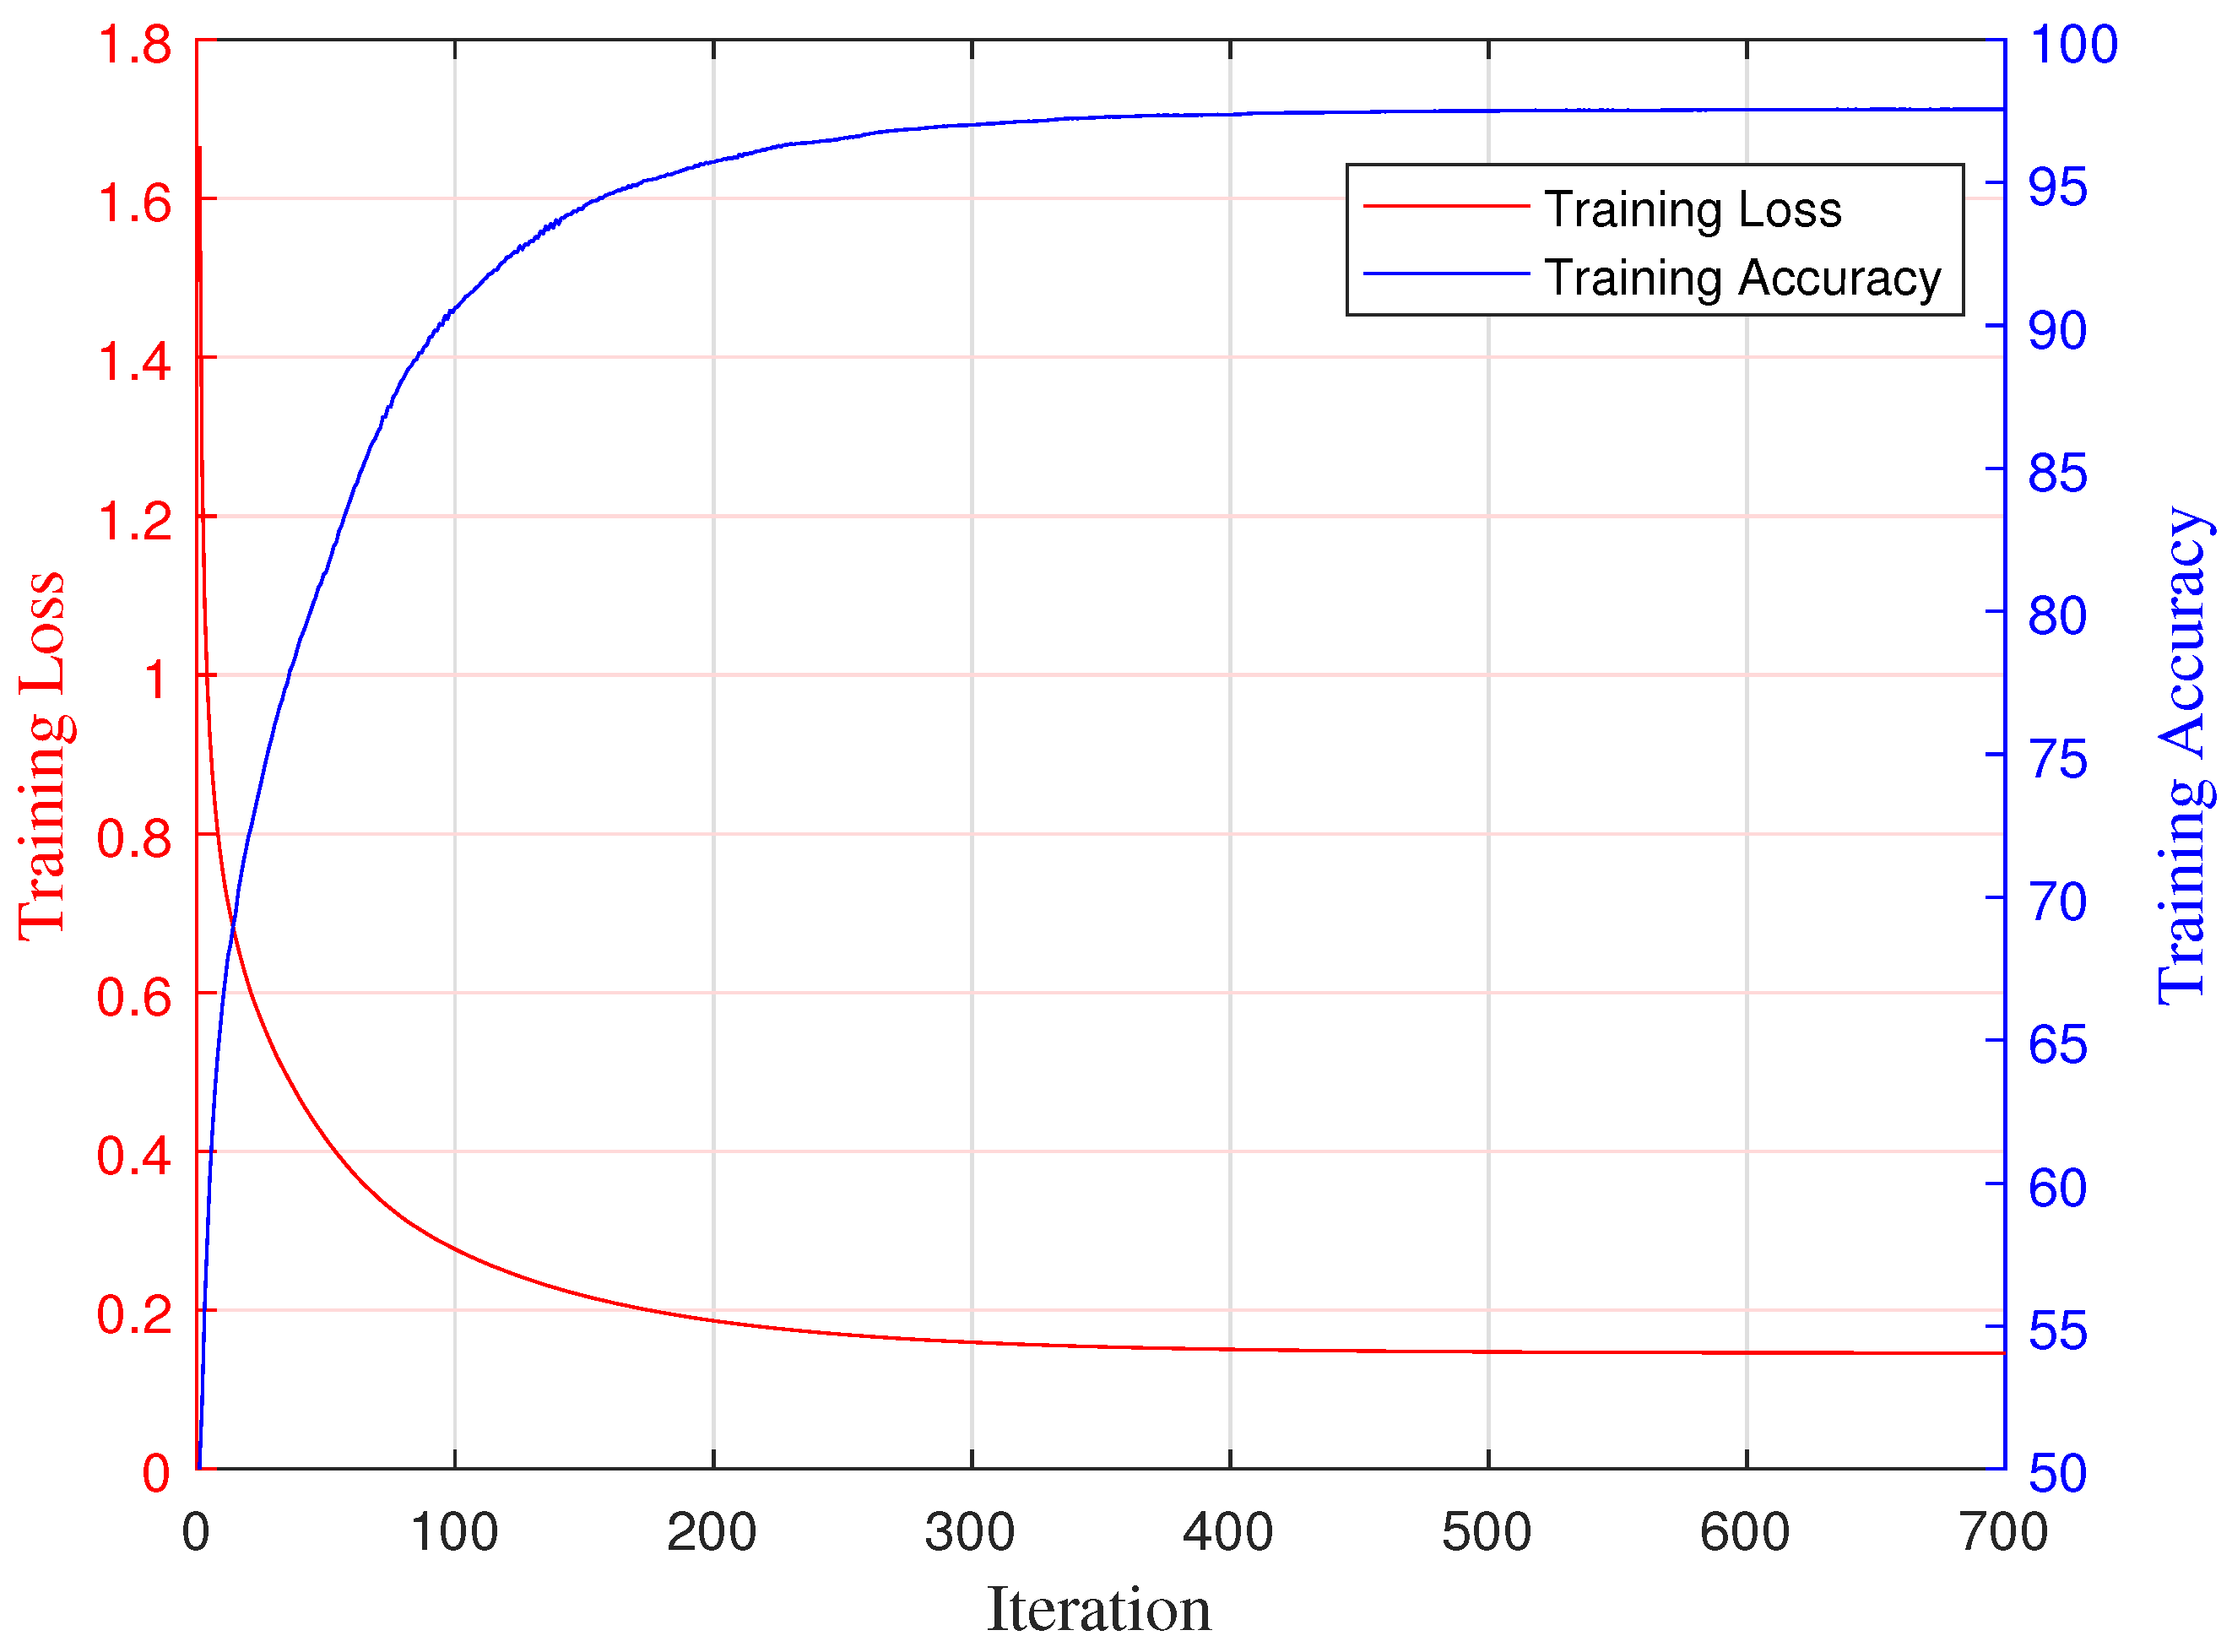
Figure 5.
Classification results obtained by different algorithms using features of entropy and correlation coefficient. (a) K-Means. (b) Fuzzy C-Means. (c) FCM-. (d) SVM.
Figure 5.
Classification results obtained by different algorithms using features of entropy and correlation coefficient. (a) K-Means. (b) Fuzzy C-Means. (c) FCM-. (d) SVM.
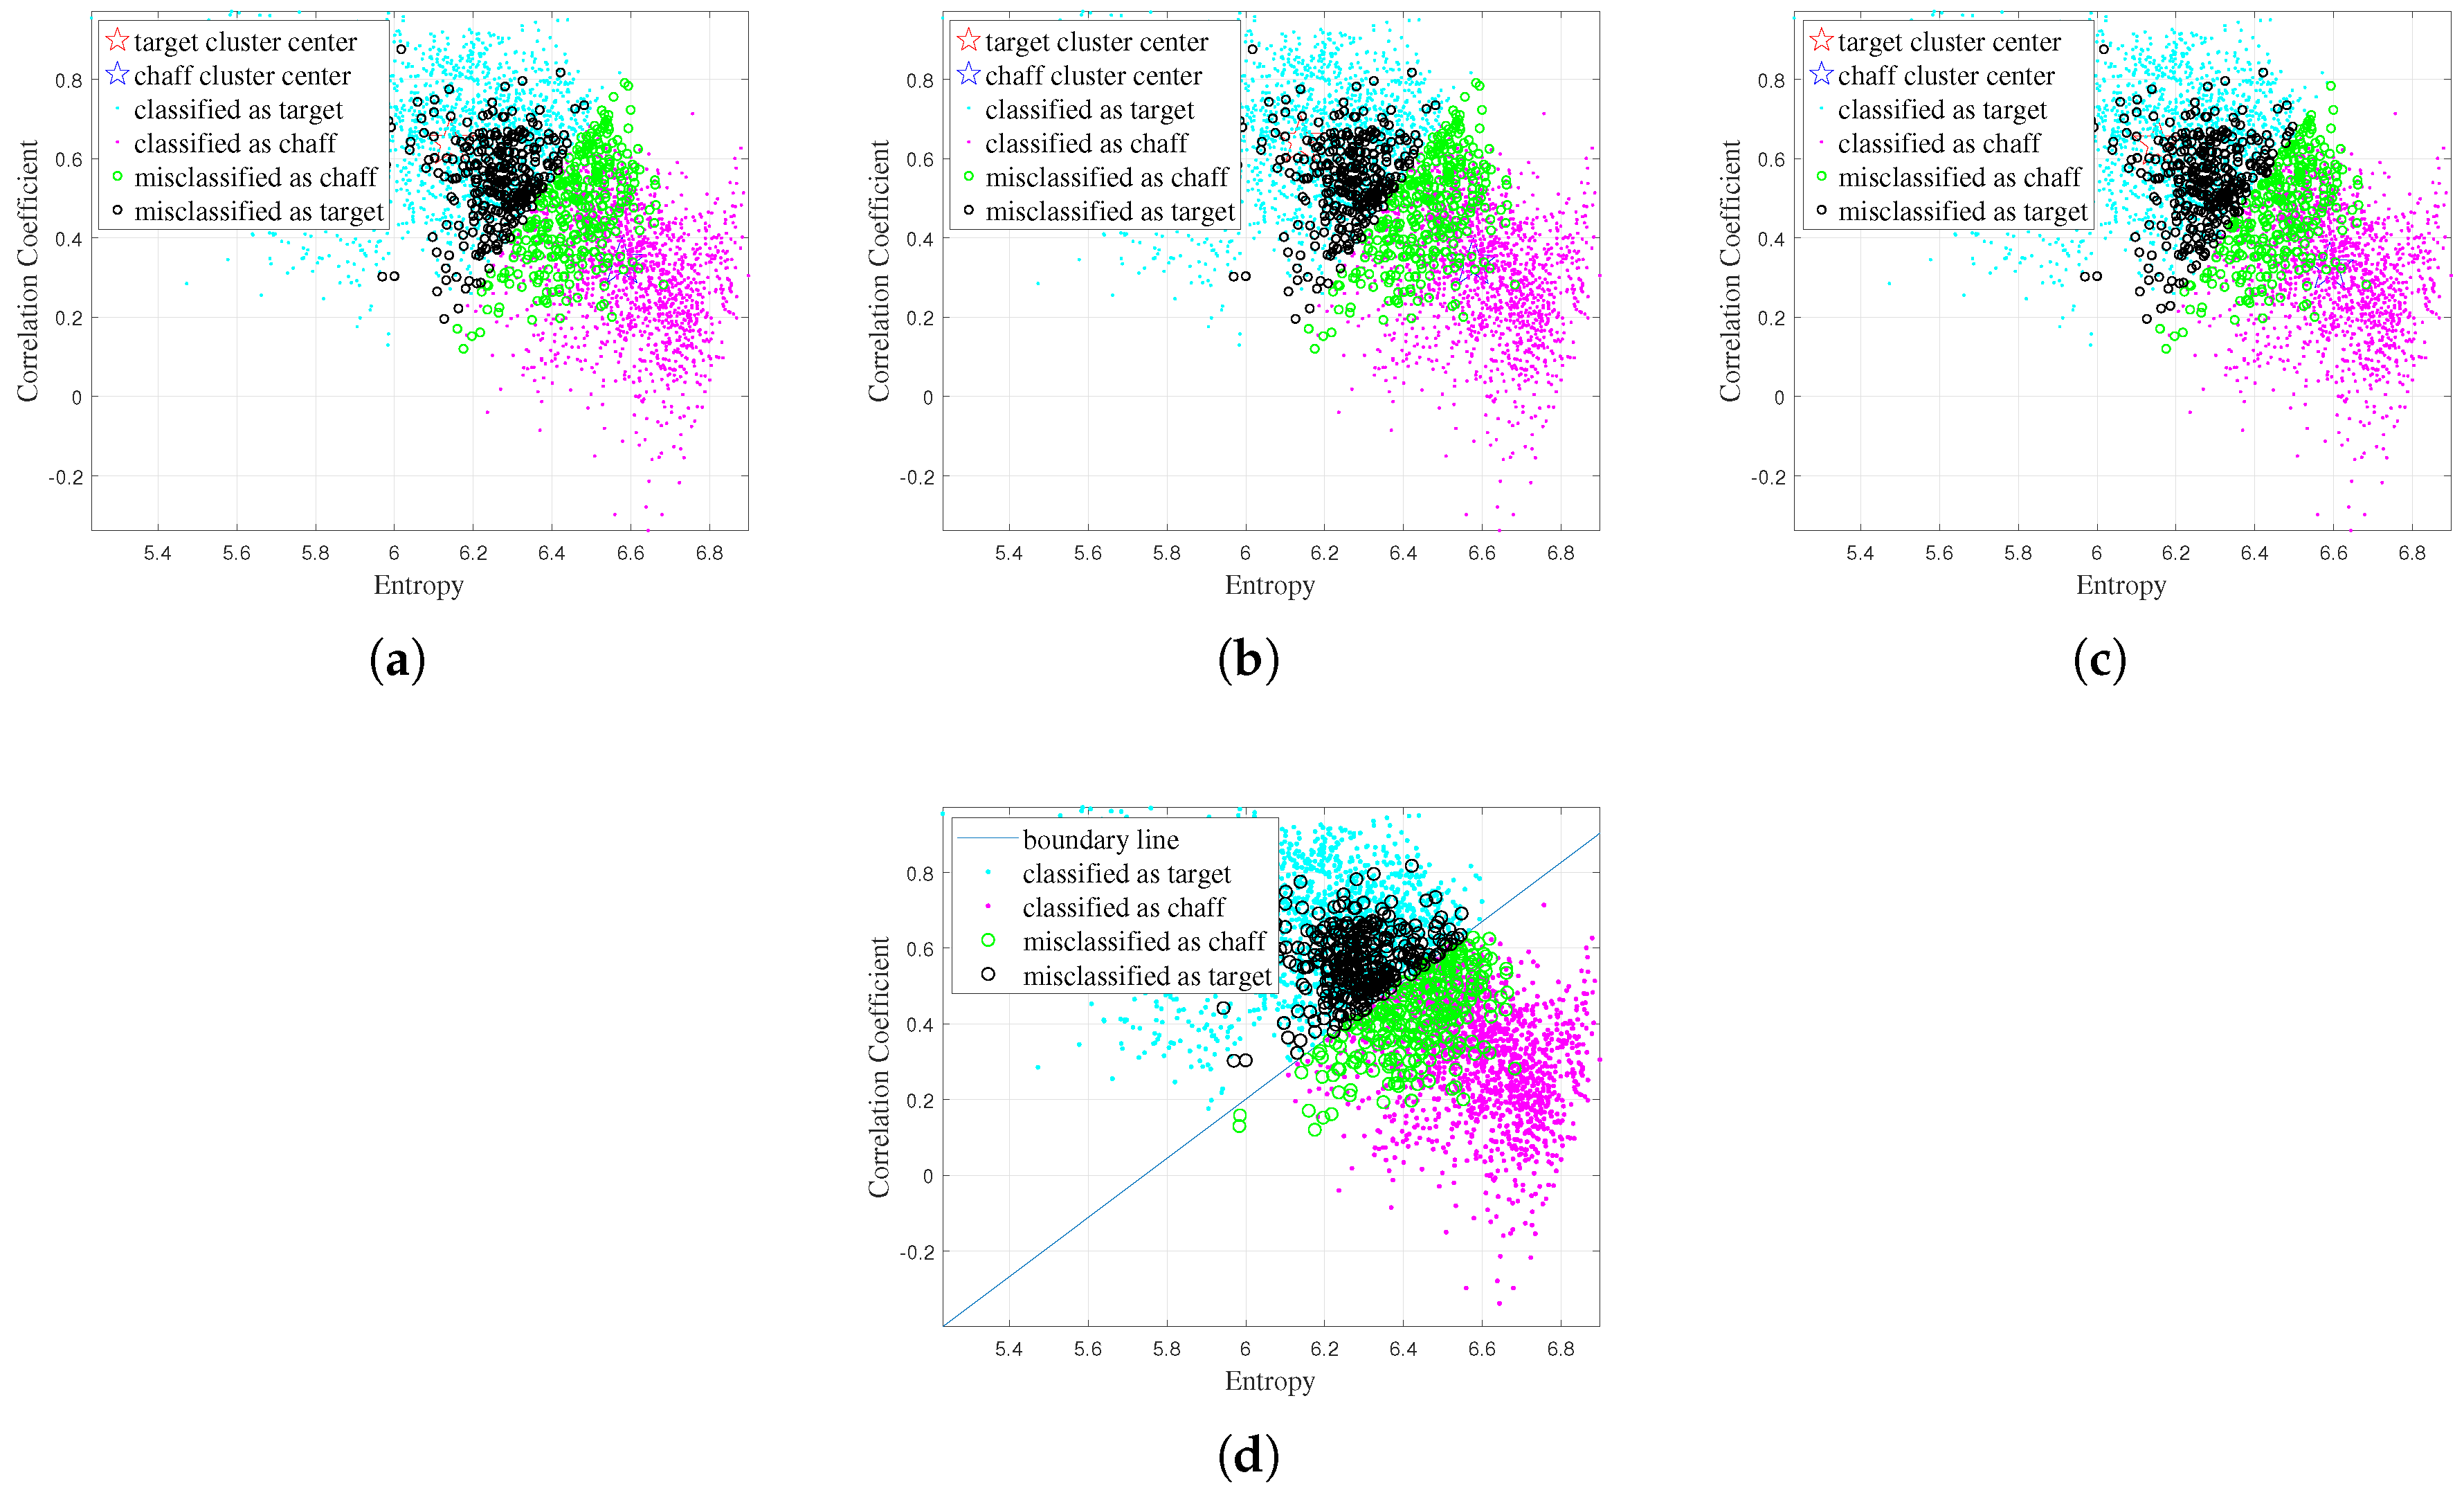
Figure 6.
Classification results obtained by different algorithms using features of entropy and scattering intensity ratio. (a) K-Means. (b) Fuzzy C-Means. (c) FCM-. (d) SVM.
Figure 6.
Classification results obtained by different algorithms using features of entropy and scattering intensity ratio. (a) K-Means. (b) Fuzzy C-Means. (c) FCM-. (d) SVM.
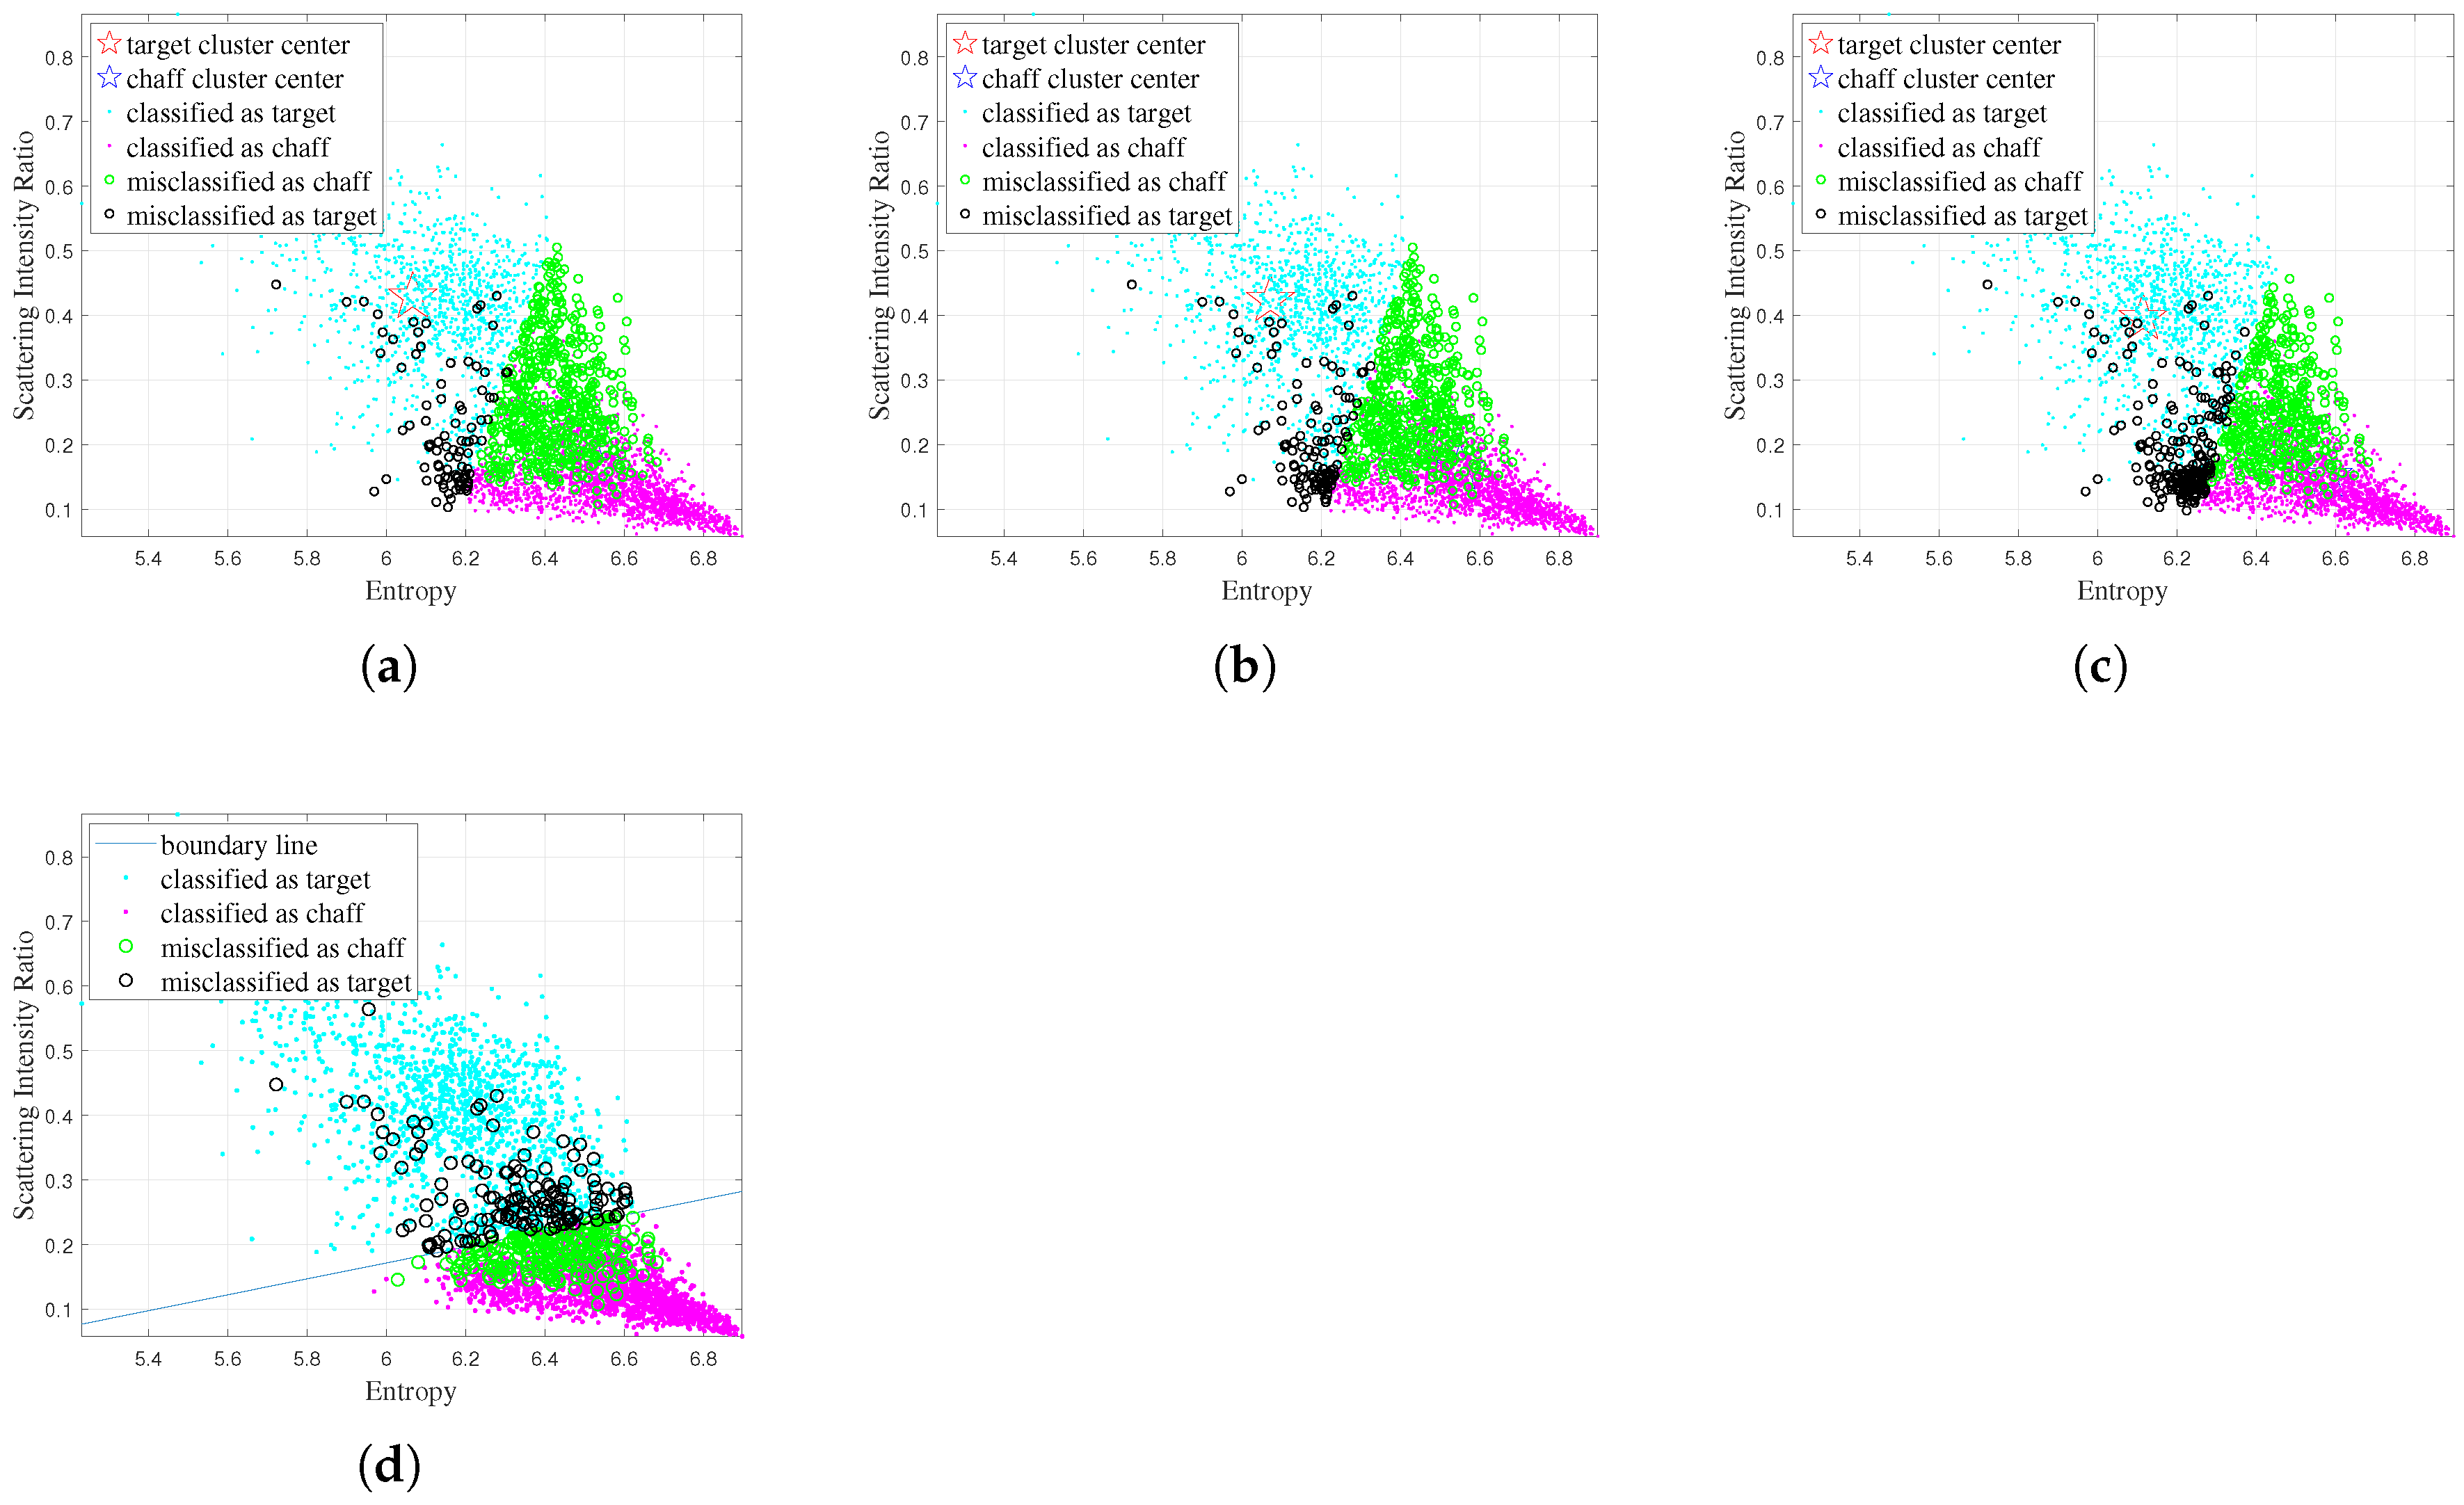
Figure 7.
Classification results obtained by different algorithms using features of correlation coefficient and scattering intensity ratio. (a) K-Means. (b) Fuzzy C-Means. (c) FCM-. (d) SVM.
Figure 7.
Classification results obtained by different algorithms using features of correlation coefficient and scattering intensity ratio. (a) K-Means. (b) Fuzzy C-Means. (c) FCM-. (d) SVM.
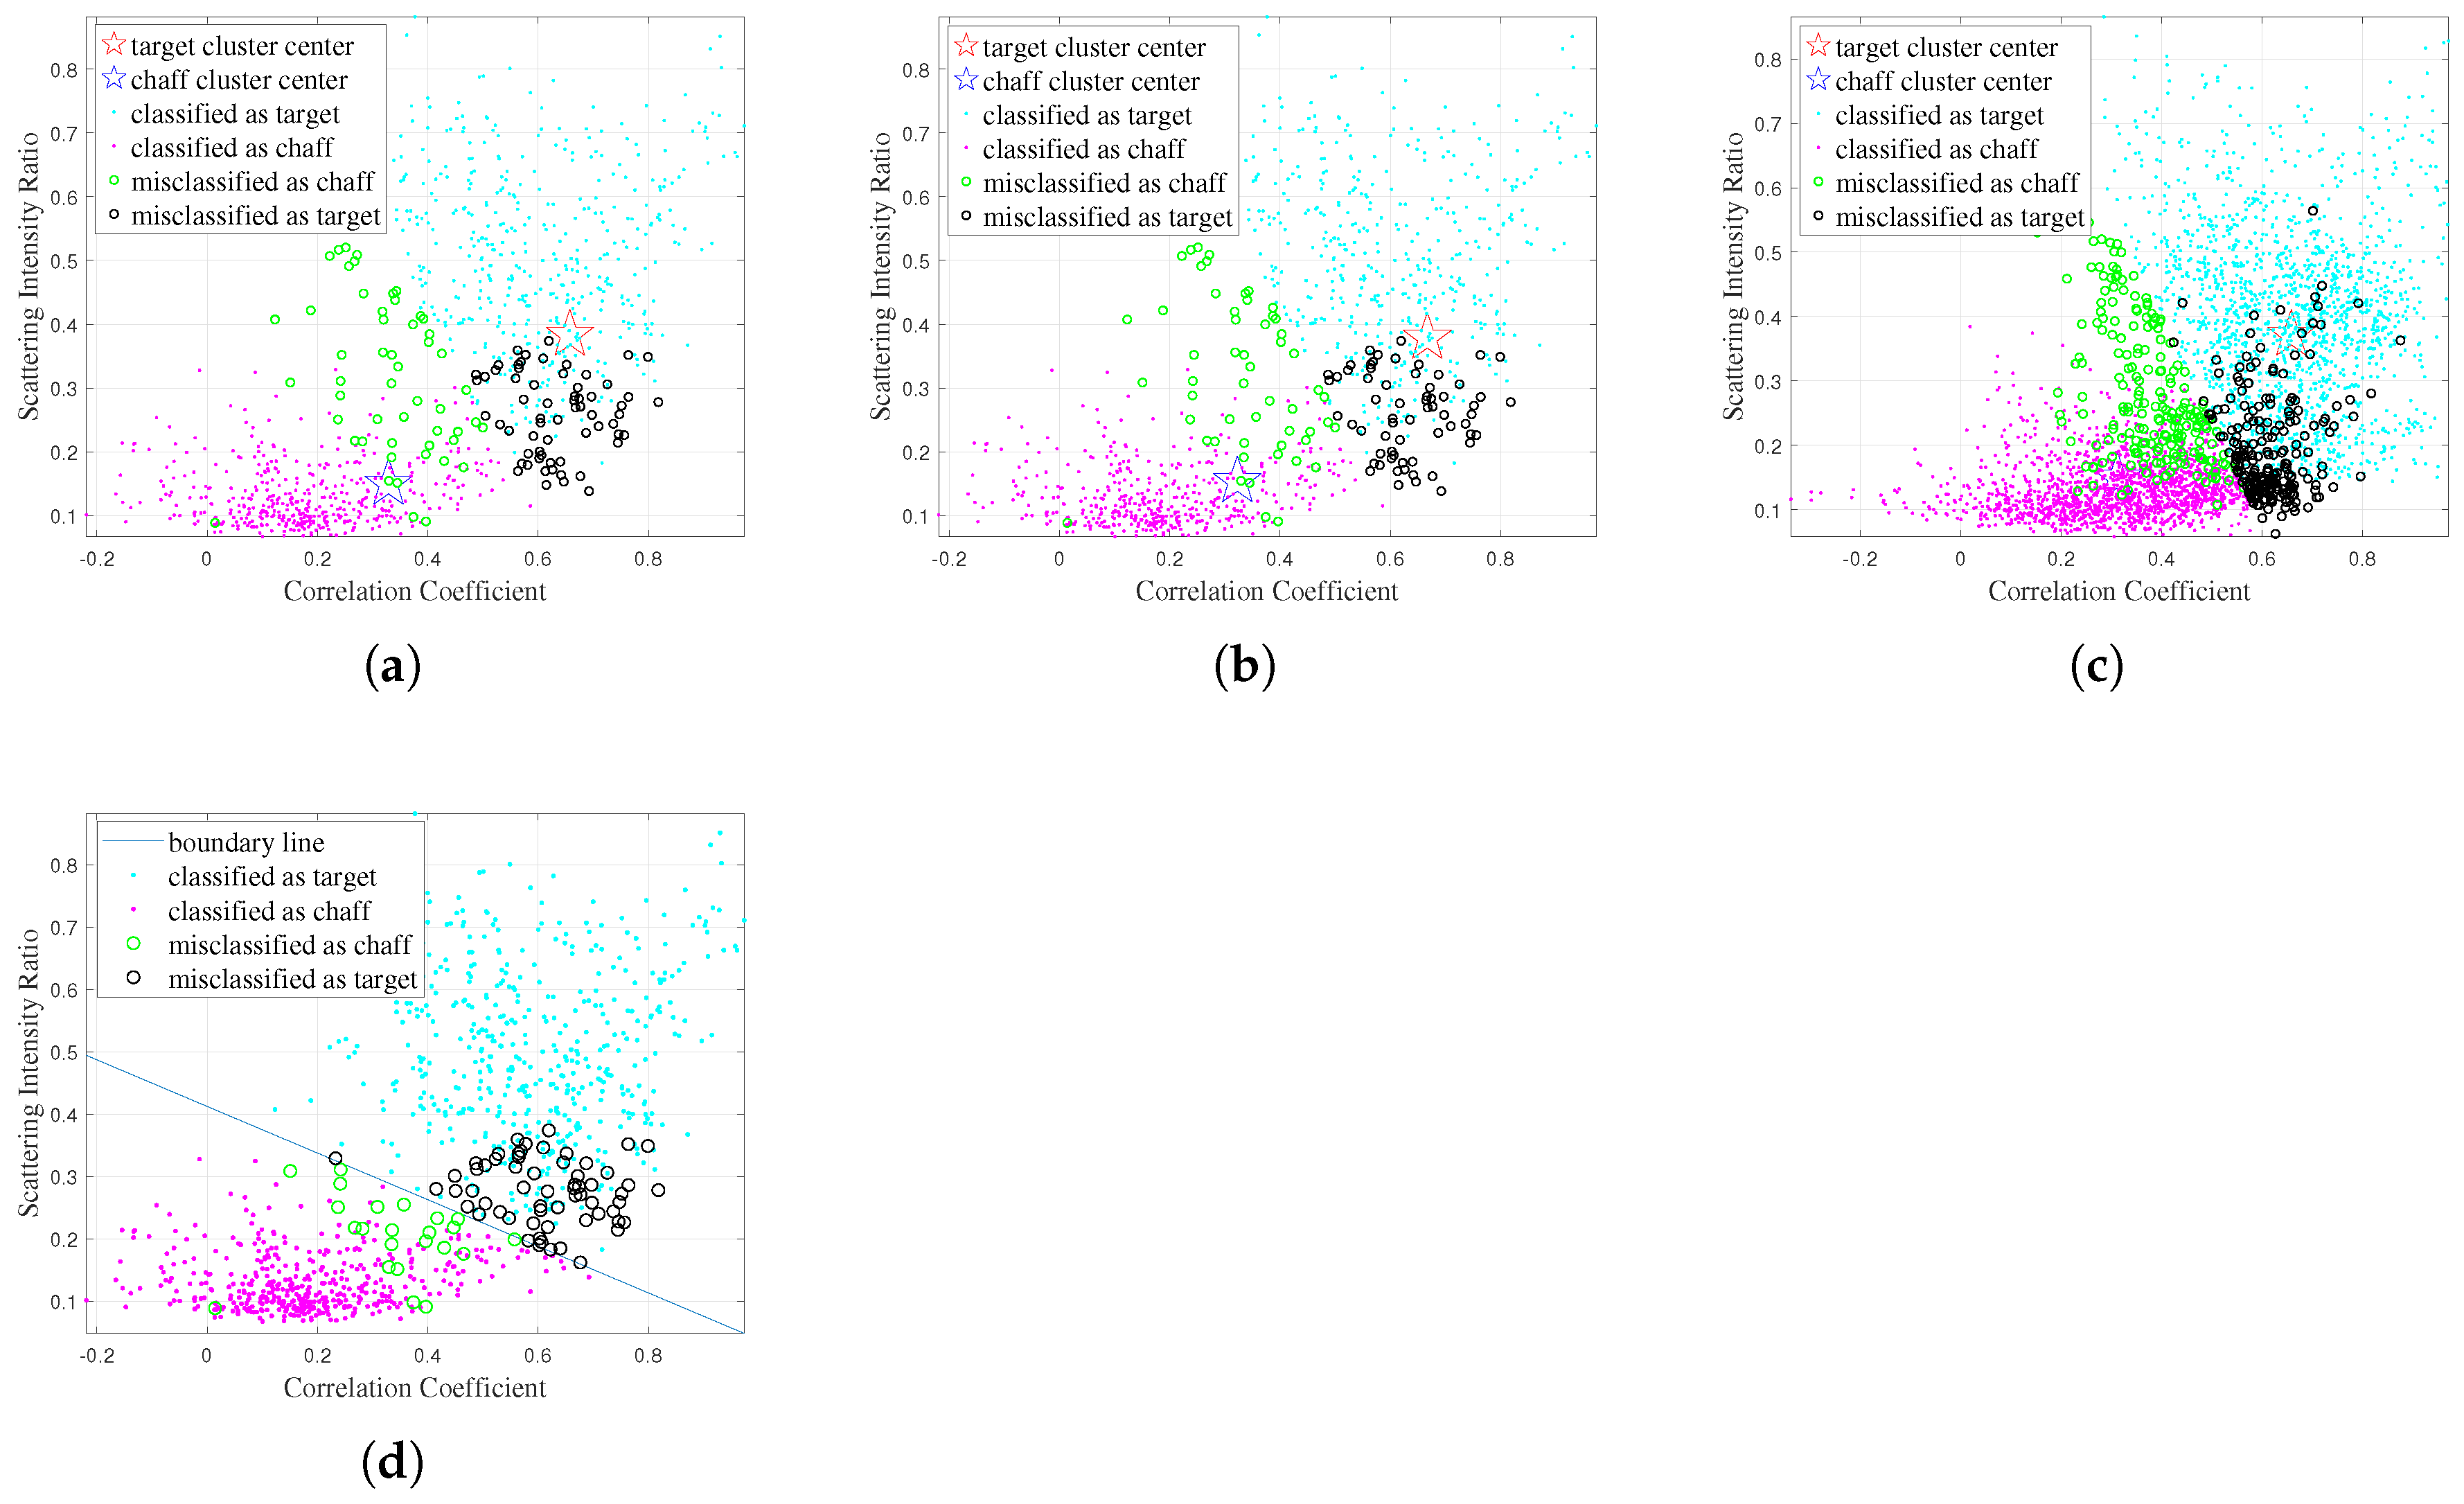
Figure 8.
Classification results obtained by different algorithms using features of entropy, correlation coefficient and scattering intensity ratio. (a) K-Means. (b) Fuzzy C-Means. (c) FCM-. (d) SVM.
Figure 8.
Classification results obtained by different algorithms using features of entropy, correlation coefficient and scattering intensity ratio. (a) K-Means. (b) Fuzzy C-Means. (c) FCM-. (d) SVM.
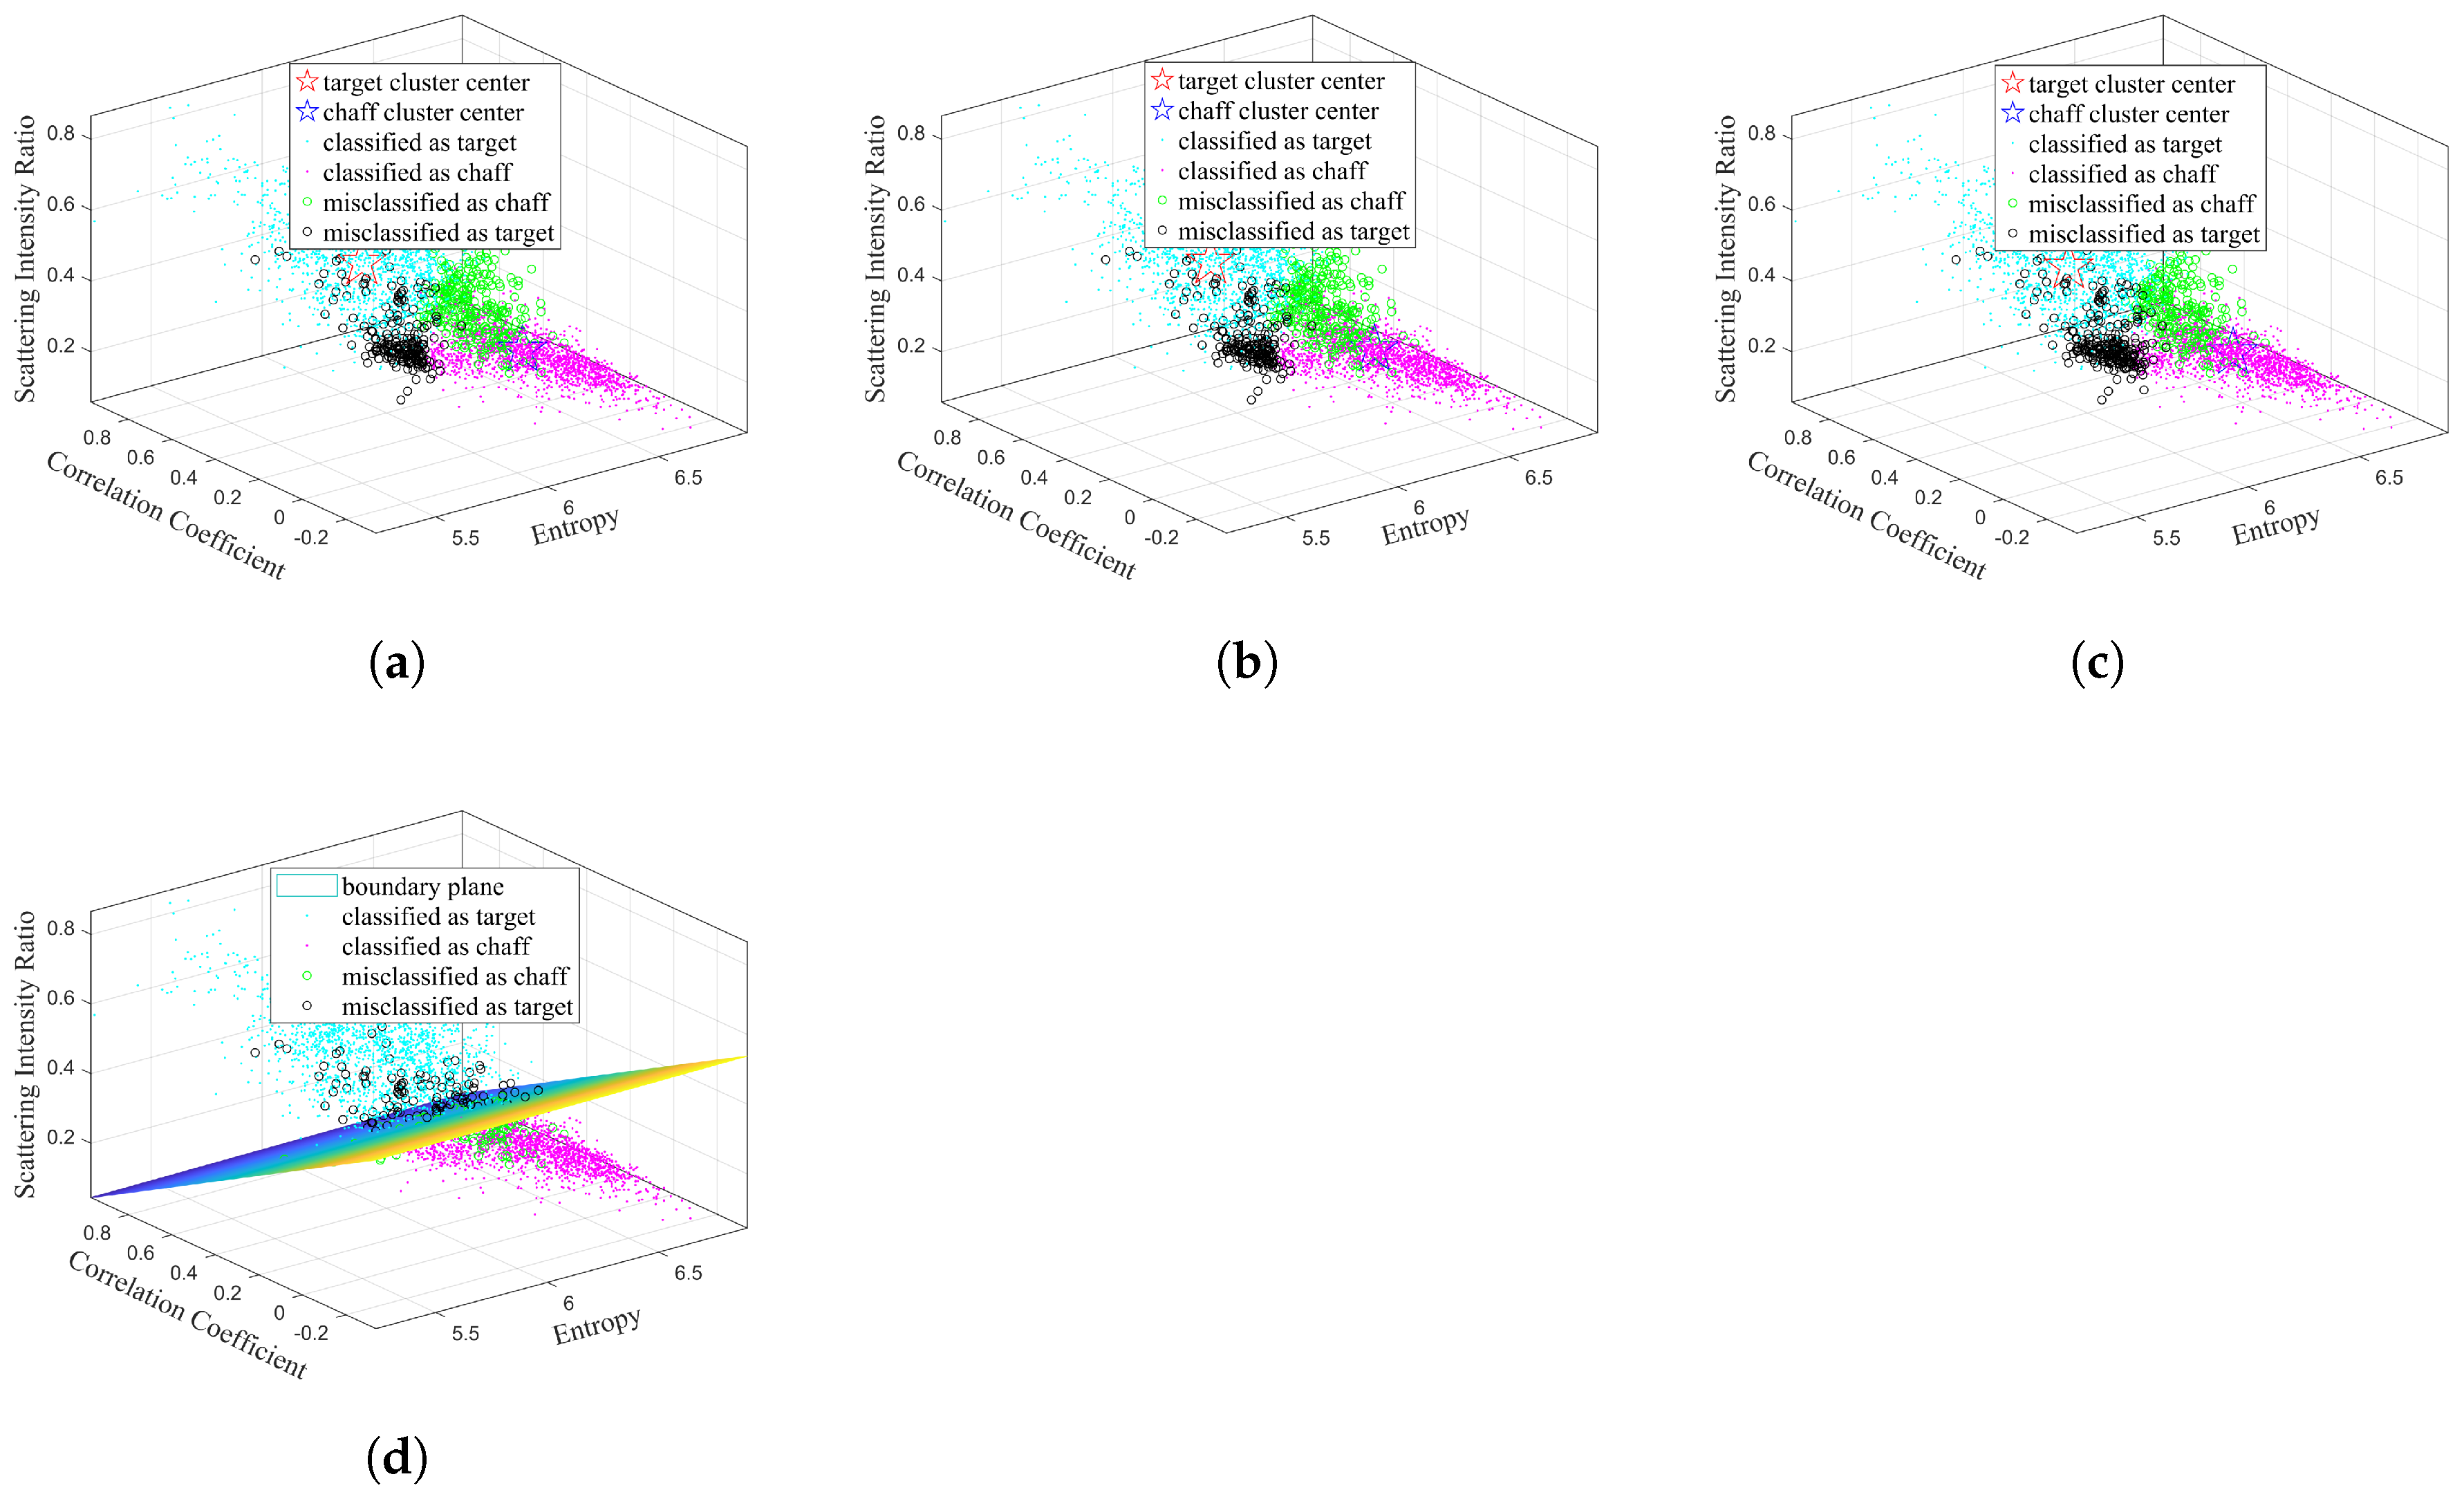

Table 1.
Recognition rates of different algorithms across various feature combinations. A, B and C represents entropy, correlation coefficient and scattering intensity ratio respectively.
Table 1.
Recognition rates of different algorithms across various feature combinations. A, B and C represents entropy, correlation coefficient and scattering intensity ratio respectively.
| Features | K-Means | Fuzzy C-Means | FCM- | SVM |
|---|---|---|---|---|
| A+B | 83.17% | 83.20% | 83.20% | 84.33% |
| A+C | 81.74% | 81.90% | 82.59% | 89.53% |
| B+C | 88.71% | 88.51% | 88.02% | 93.25% |
| A+B+C | 86.56% | 86.53% | 86.61% | 93.20% |
Table 2.
Classification performance of the proposed model with several traditional methods.
| Methods | Recognition Performance |
|---|---|
| K-Means | 88.71% |
| Fuzzy C-Means | 88.51% |
| FCM- | 88.02% |
| SVM | 93.25% |
| CNN | 94.35% |
| Ours | 97.10% |
Table 3.
Classification performance of the proposed model with several traditional methods in the case of other test sets.
Table 3.
Classification performance of the proposed model with several traditional methods in the case of other test sets.
| Methods | Recognition Performance |
|---|---|
| K-Means | 88.30% |
| Fuzzy C-Means | 88.10% |
| FCM- | 88.50% |
| SVM | 91.50% |
| CNN | 90.05% |
| Ours | 94.85% |
Disclaimer/Publisher’s Note: The statements, opinions and data contained in all publications are solely those of the individual author(s) and contributor(s) and not of MDPI and/or the editor(s). MDPI and/or the editor(s) disclaim responsibility for any injury to people or property resulting from any ideas, methods, instructions or products referred to in the content. |
© 2025 by the authors. Licensee MDPI, Basel, Switzerland. This article is an open access article distributed under the terms and conditions of the Creative Commons Attribution (CC BY) license (http://creativecommons.org/licenses/by/4.0/).
Copyright: This open access article is published under a Creative Commons CC BY 4.0 license, which permit the free download, distribution, and reuse, provided that the author and preprint are cited in any reuse.


