
Submitted:
27 February 2025
Posted:
03 March 2025
You are already at the latest version
Abstract
Military researchers have long maintained a keen interest in the contributing factors of combat effectiveness (CFCE), as these factors serve as the underlying causes behind the changing trends in combat effectiveness (CE). This paper introduces an innovative method for measuring CFCE, which builds upon the Two-Dimensional Frontline Advancement Rate (TFR) combat effectiveness measurement method. This approach enables a comprehensive evaluation of the integrated effect of all explanatory variables that influence combat effectiveness. To demonstrate the unique advantages of this method and the era-specific characteristics of data acquisition, we present six case studies. These include the Battle of Red Cliffs (208 AD) and the First Battle of Constantinople (678-679 AD) from ancient warfare, the Miracle of the Marne (1914) and the first phase of the Korean War (1950-1951) from modern warfare, the first year of the ongoing Russo-Ukrainian War (2022), and a future all-dimensional war involving military, economic, and propaganda fronts (future).
Keywords:
Contributing Factors to Combat Effectiveness (CFCE)
; Combat Effectiveness (CE)
; Two-Dimensional Frontline Advancement Rate (TFR)
; Two-Dimensional Frontline Advancement Acceleration (TFA)
Introduction
Military researchers have long maintained a keen interest in the contributing factors of combat effectiveness(CFCE), as they are the underlying causes behind the changing trends of combat effectiveness(CE). For example, as early as over 2,000 years ago, in the ancient Chinese military text The Art of War by Sun Tzu, it is mentioned:
(1) Which of the two sovereigns is imbued with the Moral law?(2) Which of the two generals has most ability?(3) With whom lie the advantages derived from Heaven and Earth?(4) On which side is discipline most rigorously enforced?(5) Which army is stronger?(6) On which side are officers and men more highly trained?(7) In which army is there the greater constancy both in reward and punishment?By means of these seven considerations I can forecast victory or defeat.
Of course, the research conducted during this period and afterward, until the 20th century, was primarily focused on qualitative thinking. After the mid-20th century, a quantitative approach emerged that aimed to identify as many contributing factors to combat effectiveness as possible and conduct integrated mathematical modeling. For example, Hayward (1968) endeavored to account for all contributing factors, categorizing them into three main classes: (a) capabilities, (b) environment, and (c) missions. Each category encapsulates a range of elements. "Capabilities" involve the quality and quantity of personnel and equipment, training level, morale, leadership, and logistics. "Environment" typically covers the physical landscape, climate, and potential interference from non-combat factors, such as political constraints. Lastly, "missions" represent the specific objectives the force is tasked to achieve, which can differ vastly in nature, scale, and complexity. Epstein (1985) argued that the Lanchester equations overlooked too many contributing factors of combat effectiveness, which led him to consider a large number of such factors in his own model. Dupuy (1986) augmented the variables that impact combat effectiveness. Their research highlighted additional factors previously overlooked, such as logistics, intelligence, medical services, terrain and weather conditions, and military budgets—collectively considering over 20 variables. As documented in the comprehensive collections of combat effectiveness models assembled by Przemieniecki (2000) and Tolk (2012), this approach has been widely prevalent since the 1960s. Subsequently, Krondak (2007) recognized the complexity and infinite divisibility of explanatory variables for combat effectiveness. He proposed the concept of 'Joint Functions' to categorize these variables. Kanatliev (2014) argued that combat effectiveness was based on three main pillars: numerical preponderance, technology, and force employment. Moreover, he classified explanatory variables into tangible (directly measurable) and intangible (indirectly measurable) categories and suggested different methods for data acquisition accordingly.
However, this research approach faces three key issues:
1.The number of contributing factors to combat effectiveness is infinite and cannot be fully identified. For example, as the nature of warfare evolves, new factors may emerge, limiting the applicability of existing models.
2.Many of the contributing factors to combat effectiveness are subjective and cannot be quantified or weighted precisely. For instance, factors such as soldier morale and the decision-making ability of leaders are highly subjective, making it challenging to accurately quantify these factors within a model.
3.Many contributing factors are random, which means that the weight data obtained from case studies is only applicable to the specific cases studied. For example, factors like weather conditions or errors in enemy command may significantly influence the outcome of a particular battle, but these random factors are unlikely to be repeated in other conflicts.
As a result, the above approach began to decline after the 1990s. Researchers effectively shifted away from exploring the overall impact of contributing factors and instead focused on studying the effects of individual contributing factors on combat effectiveness. For example, in addressing the relationship between weapons and combat effectiveness, and focusing particularly on lethality and destructive power, Raymond (1991) and Carrier (2015) discussed the role of actual combat training in weapon performance, emphasizing its impact on combat effectiveness from a social perspective. Nielsen (2002) focused on the impact of civil-military relations on combat effectiveness, while Reiter (1998) and Heinecken (1998) adopted a macroscopic perspective to assess the social system’s influence on morale and logistics, considering the resulting impact on combat effectiveness. Rotte (2003) and Sloan (2012) expanded beyond soldiers and weapons to consider how a general's tactical ability impacts combat effectiveness. Annas (2009) identified that the main weakness of the Lanchester equation was its failure to account for individual differences (both mental and physical) between soldiers, which could significantly affect combat effectiveness. Consequently, they proposed a detailed study of this issue. Meanwhile, Zanella (2012) and King (2016) explored the different roles of army sizes in modern warfare. Mehrl (2022) examined the impact of gender composition on military combat effectiveness.
Additionally, similar studies include those by Millet et al. (1986), Pollack (2002), Desch (2002/2008), Biddle and Long (2004), Farrell (2005), Brooks and Stanley (2007), Downes (2009), and Lyall and Wilson (2009). In the 2010s, influential studies were conducted by Millett and Murray (2010), Beckley (2010), Biddle (2010), Friedman (2011), Pilster and Böhmelt (2011), Johnson (2012), Apostolou (2015), and Reiter (2017). More recently, ongoing discussions have continued to shape the field, with notable works by Reiter (2020, 2022), Lyall (2020), Grauer and Quackenbush (2021), Plapinger (2022), and Kuo (2022).
Despite the value of the aforementioned studies, they do not address the current gap in the academic research on quantifying the overall impact of contributing factors to combat effectiveness. Unfortunately, there is still no method capable of measuring the combined effect of all contributing factors in a comprehensive manner. After spending eight years refining and modifying the method, Sun and Wang (2025) provided the complete theoretical framework and case analysis for combat effectiveness measurement, naming it the TFR method. Building on this approach, we have developed a novel method for measuring the combined effect of all contributing factors to combat effectiveness using two-dimensional frontline advancement acceleration—this method is referred to as the TFA method.
Method
At the end of Sun and Wang (2025), the authors propose a method for measuring the contributing factors of combat effectiveness by comparing the combat effectiveness across different stages of operations:
CERussia - Ukraine(Feb.,2014- Feb.,2024) = CEoverall =108.9ksqkm/10.0a = 10.9ksqkm/a
CERussia - Ukraine(Feb.,2022- Feb.,2024)=CEstage II = 65.7ksqkm/2.0a =32.9ksqkm/a
By comparing these two values, we can observe that CEoverall is significantly lower than CEstage II, amounting to only one-third of the latter. This is because during the 2014-22 period, Russia could not publicly convert its theoretical combat effectiveness into tactical combat effectiveness for direct deployment to the Ukrainian battlefield; instead, it could only support the pro-Russian separatist forces in eastern Ukraine against the Ukrainian government troops through covert means of supplying war resources. This clearly dragged down the overall combat effectiveness on the Russian side…
CERussia - Ukraine (Feb. 2014 - Feb. 2022) = CEstage I =…=5.4 ksqkm/a.
CEstage I is less than one-sixth of CEstage II and less than half of CEoverall.
This quantifies the extent to which the combat effectiveness of the Russian side has been dragged down by the pro-Russian separatists in eastern Ukraine, relying solely on Russian military resources and technical support.
The comparison of combat effectiveness across different stages of operations in Sun and Wang (2025) can indeed capture the impact of changes in contributing factors to combat effectiveness, such as the shift from Russia providing only military assistance and tactical support to direct Russian military involvement, thereby reflecting the variation in CFCE. However, we believe the method requires further refinement in the following two aspects:
1.The combat effectiveness measurement formula proposed by Sun and Wang (2025) measures the average combat effectiveness over a period of time. For example, 10.9 ksqkm/a represents the average combat effectiveness of the Russian camp relative to Ukraine during the period from February 2014 to February 2024, 32.9 ksqkm/a represents the average combat effectiveness of the Russian camp relative to Ukraine from February 2022 to February 2024, and 5.4 ksqkm/a represents the average combat effectiveness of the Russian camp relative to Ukraine from February 2014 to February 2022. Therefore, the comparison of these combat effectiveness values only roughly reflects the trends in the fluctuating changes of contributing factors in different stages and cannot precisely measure the CFCE itself.
2.Like CE, CFCE also has dual dimensions: the magnitude of change in combat effectiveness and the time required to achieve that change. The same magnitude of change over different durations holds different significance. For instance, in reality, over a span of ten years (February 2014 - February 2024), the change in the combat effectiveness of the Russian camp is 32.9 ksq km/a - 5.4 ksq km/a = 27.5 ksq km/a. If this change were to occur in just five years, the contribution of the factor of direct Russian involvement would be greater than in reality, while if it took twenty years, the contribution of the same factor would be smaller than in reality.
Based on this, we can optimize the method in Sun and Wang (2025) as follows:
1.Derive the instantaneous CE formula from the average CE formula, which corresponds to the CE when the time duration approaches zero. We need to adjust the formula as follows:
2.Based on the comparison of two instantaneous combat effectiveness values, incorporate the consideration of the time required for the change:
where CE is the instantaneous combat effectiveness, and t represents the time required to alter CE. The unit of CE is sqm/h or sqkm/a. Therefore, it is clear that the unit of CFCE is sqm/h² or sqkm/a². The relationship between CE and CFCE is similar to the relationship between velocity and acceleration in physics.
Given that the calculation of CFCE via Formula (2) requires obtaining instantaneous CE at both the start and end points of the action time, this proves to be a challenging task under the present conditions of human war documentation. Therefore, we procure CFCE in this study through the following approximate formula.
The indicators for “average combat effectiveness” contain the time period as a subscript; for instance, CEa~c signifies the average combat effectiveness from ta to tc. If we assume that the combat effectiveness remains stable from time a to b and from time b to c (the CFCE in ta~b and tb~c is approximately zero, b∈[a,c]), then according to Formula(2):
Formula (3) only requires the acquisition of average combat effectiveness to compute CFCE. Although it inevitably carries some errors, the exposition of the central theme of this study is acceptable.
Case Analysis I&II: Ancient Wars
Case Analysis I: The Battle of Red Cliffs1
Before the imminent demise of the Eastern Han Dynasty, three fiefdoms competed for domination in China and to unify the land, namely Cao Cao, Liu Biao & Liu Bei, and Sun Ce & Sun Quan. In 208, Cao Cao, the most powerful state, declared war against the other two. Liu and Sun were forced to unite against the enemy, and the Battle of Red Cliffs broke out.
Cao (Cao Cao) was able to expand its territory in the period between 189 and 208. After 19 years of expansion, its total area rose to about 805,000 square kilometers:
CECao(189~208) =805ksqkm/19a=42.37ksqkm/a
The territory of Liu (Liu Biao and Liu Bei) expanded in the period between 190 and 208. After 18 years of expansion, they occupied an area of about 364,000 square kilometers:
CELiu(190~208) = 364ksqkm/18a=20.22ksqkm/a
Sun (Sun Ce and Sun Quan) expanded their territory in the period between 195 and 208. After 13 years of expansion, the state controlled an area of about 270,000 square kilometers:
CESun(195~208)=270ksqkm/13a=20.77ksqkm/a
We must remind the reader that the combat effectiveness measured above is dyadic combat effectiveness (relative to the local armed forces in the late Eastern Han period). However, for more than 1800 years, data on the area of expansion of these local arms have been lost. Therefore, in this case, we assume that the combat effectiveness of these additional enemies is entirely equal.
The combined combat effectiveness of Liu and Sun (40.99 ksqkm/a) is lower than that of Cao (42.37 ksqkm/a), suggesting that Cao should have emerged victorious in this conflict. However, historical facts indicate that the Liu and Sun alliance successfully compelled Cao’s forces to retreat from parts of the middle Yangtze River region, which they had occupied for approximately one year (around 40,000 square kilometers). Using the TFR method, we can deduce:
CELiu&Sun-Cao(209-210)=40ksqkm/1a=40ksqkm/a
That is because the Liu and Sun used fire to destroy tents and wooden boats of the Cao, which explains the remarkable disparity between the theoretical results and the actual outcome. The Liu&Sun allied forces used fire and other collateral attacks against Cao's army to force it to retreat from its occupied power-space. By using this deviation, we can obtain the CFCE of fire attack tactics.
For,
CELiu&Sun(Not using the fire attack tactic)=
CELiu(190~208) +CESun(195~208)=20.22ksqkm/a+20.77ksqkm/a=40.99ksqkm/a
CELiu&Sun(Using the fire attack tactic)=
CECao(189~208) +CELiu&Sun-Cao(209-210)=42.37ksqkm/a+40ksqkm/a=82.37ksqkm/a
Since the above combat effectiveness values are average combat effectiveness, they can only be approximately calculated according to Formula (3):
CFCEFire attack tactic (189/190/195~210)=
=2×(CELiu&Sun(Using the fire attack tactic)-CELiu&Sun(Not using the fire attack tactic))/tAverage of the three parties
=2×(82.37ksqkm/a-40.99ksqkm/a)/18.67a=4.43ksqkm/a2
Case Analysis II: The First Battle of Constantinople2
Between 634 and 678, the wars fought by the Arab Empire against the Byzantine Empire resulted in the latter losing control over Egypt, Syria, and vast stretches of Anatolia, amounting to approximately 1.4 million square kilometers:
CE Byzantium-Arab(634~678) = -1.4Msqkm/44a=-31.8 ksqkm/a
In addition, over two decades before the First Battle of Constantinople, the Arab Empire had already defeated the Byzantine Empire's long-standing rival, the Sassanian Empire (The Second Persian Empire), which had engaged in prolonged conflict with the Byzantine Empire, with both sides experiencing victories and defeats (CEByzantine-Sassanian≈0).Therefore, both from a data and logical perspective, the victor of the First Battle of Constantinople should have been the Arab Empire. However, the historical fact is that the Byzantine Empire not only successfully defended its capital, Constantinople, but also, over the course of about a year, forced the Arab armies to withdraw from the northern part of the Eastern Mediterranean that they had occupied, an area of approximately 50,000 square kilometers. The traditional view is that the use of fire attack tactics, known as Greek fire, played a key role in the successful defense and counteroffensive. Based on these historical sources, we can use the TFR method to calculate the combat effectiveness of the Byzantine Empire following the use of fire attack tactics:
CEByzantine-Arab(Using the fire attack tactic)==50ksqkm/1a=50ksqkm/a
Then, according to Formula (3), we can calculate:
CFCEFire attack tactic (634~679)=
=2×(CEByzantine-Arab(Using the fire attack tactic)-CEByzantine-Arab(Not using the fire attack tactic))/t634~679
=2×(50ksqkm/a-(-31.8ksqkm/a)/45a=3.64ksqkm/a2
Summary and Analysis of Case Analysis I and II
Based on the calculations above, we can observe that the CFCE of fire attack tactics in the Battle of Red Cliffs in China (4.43 ksqkm/a2) was higher than that of the First Battle of Constantinople (3.64 ksqkm/a2). However, this comparison is not meaningful for two reasons:
Firstly, the process of obtaining these two data points is solely to demonstrate our measurement methods, and does not hold historical reproduction value. This is because, for two cases that occurred over 1,800 years and 1,400 years ago respectively, the available data is too limited to provide accurate historical details. Consequently, we had to make several key non-historical assumptions in our calculations. For example, we assumed that the combat effectiveness of the adversaries encountered by the three major warlords of China in the late 2nd to early 3rd centuries during their expansion was equal, effectively neutralizing their influence. Moreover, the most standard method of measuring the CFCE of fire attack tactics would involve using Formula (2), but this requires obtaining the instantaneous combat effectiveness values of both sides before and after the fire attack and the duration of the fire attack. However, current historical records do not support this, so we had to use the approximate Formula (3), which assumes that the combat effectiveness of the three major warlords in China and the three great empires in the Middle East remained constant from their expansion until the outbreak of war. These assumptions are not in line with historical realities but do not affect the introduction and explanation of our measurement and modeling methods, nor do they impact future military research and the adoption of accurate data by researchers and observers for measurement and modeling.
Secondly, even if these two values were the result of precise measurements without any assumptions, they still do not represent a meaningful comparison of the actual impact of fire attack tactics. This is because the CFCE we measure is the cumulative value of all contributing factors to combat effectiveness, meaning that if there are other contributing factors in addition to the fire attack tactic, this value is no longer purely reflective of fire attack tactics. In fact, both cases include such factors. According to Chinese historical records, another reason for Cao's defeat and retreat, apart from the fire attack, was the outbreak of epidemics in his camp before the war (Chen, 1982, p. 435, 1265).In other words, "4.43 ksqkm/a2" represents the total of the contributions from the fire attack tactics, the impact of the epidemic, and all other contributing factors that have been lost in historical records. Therefore, it should be higher than the result derived from relying solely on fire attack tactics. Similarly, in the case of Byzantium, "3.64 ksqkm/a2" is also a comprehensive result, which may include factors that lead to the CFCE being higher than that derived from solely relying on fire attack tactics. In fact, some scholars have already acknowledged this point. Jankowiak challenges the traditional view that Greek fire played a decisive role in the Battle of Constantinople through an extensive comparison of original documents from both sides. He argues that “this reversal of fortunes in the 670s was enabled less by the discovery of Greek fire than by the return of Byzantine troops from the West after the fall of Mezezios, confirmed by the high proportion of Western names among the Byzantine elites during the reign of Constantine IV”(Jankowiak 2009, p.316). This suggests that, behind the popular understanding of Greek fire, the assistance from potential combat effectiveness transported from the Western part of the Empire had already subtly and significantly narrowed the combat effectiveness gap between Byzantium and the Arabs, both in the background and during the buildup to the siege of Constantinople. Just as the epidemic factor was part of the CFCE in the Battle of Red Cliffs, reinforcements became a contributing factor in the CFCE of the Greek fire in the Battle of Constantinople.
Case Analysis III&IV: Modern War
Case Analysis III: The "Miracle of the Marne" in 19143
On the Western Front of World War I, the German Army initially demonstrated superior combat effectiveness over the Anglo-French alliance during the first month of conflict. Having achieved the original strategic objective of the Schlieffen Plan, the Germans defeated British and French forces in Belgium and northeastern France, coming within 30 miles of Paris. However, in early September, a sudden reversal in combat effectiveness occurred. The British and French forces repelled the German Army to the Aisne, 150 miles away, preventing the Germans from achieving the subsequent strategic objectives of the Schlieffen Plan. This event is often referred to in history as the "Miracle of the Marne." However, behind this turning point lie diplomatic variables that are complex and immeasurable.
One such key sub-variable is the "diplomatic security commitment." The French High Command believed that Germany would respect the British commitment to protect the Low Countries and thus would not dare to violate Belgian neutrality to initiate an attack on France. As a result, the French High Command positioned most of its forces on the Franco-German border, leaving only the Fifth Army to safeguard the Franco-Belgian border. However, with an apparent disregard for the British security commitment, Germany followed the Schlieffen Plan, which focused on quickly defeating France before Russia could fully mobilize its forces, thus avoiding a two-front war. In this strategy, Germany allocated two-thirds of its forces to the Franco-Belgian border-actually this is a weakened version, and the original plan is four-fifths. This overwhelming concentration of forces resulted in a significant combat advantage for Germany's right-wing over the French left. However, as the strategic inadequacy of Plan XVII came to light - a plan that relied heavily on proactive attacks on the Franco-German border while leaving the defense of the Franco-Belgian border largely dependent on international commitments - the French began to change. More French forces, such as the Third and Fourth Armies, which were initially used for the attack to the direction of the north in France-German border, and the newly formed Sixth and Ninth Armies were rapidly redeployed to the direction of the Franco-Belgian border to counter the German offensive. This strategic shift resulted in the German right wing's numerical advantage over the left wing of the French army, including the British army, quickly disappearing.
One of the secondary sub-variables of the "security commitment" is the deterrent power of the protecting country, which embodies the potential countermeasures the protecting country could deploy against harmful actions targeting the protected state. The deterrent effect is often subjective, hinging upon the perceived willingness and capability of the protecting nation to honor its commitment in conjunction with the potential aggressor's evaluation of the possible costs and benefits of violating this commitment. An additional significant secondary sub-variable is the reputation of the protecting nation regarding fulfilling its commitments. This factor is established through historical precedents and the current geopolitical standing of the country. This component, too, is inherently subjective and subject to differing interpretations by the involved states. Moreover, the strategic interest of the potential aggressor state is a crucial secondary sub-variable. It is also subjective and varies based on the cost-benefit analysis of the national interests potentially gained or lost by respecting or ignoring the commitment.
Another key sub-variable is the "urging to participate in war." Under diplomatic pressure from Britain and France, the Russian army launched a campaign against Germany on the Eastern Front before their war preparations were completed. This sudden attack caught the Germans off guard, as it significantly predated their predictions of when Russia could feasibly join the war. The Schlieffen Plan was predicated on defeating the Anglo-French alliance on the Western Front before Russia could mobilize its forces in the East. Russia's premature campaign, though quickly failed due to inadequate preparation, disrupted the implementation of the Schlieffen Plan, compelling the Germans to shift some of their troops to the East. It effectively reduced their operational troops on the Western Front.
One secondary sub-variable of "urging to participate in war" is the benefits the urging party could provide in exchange. However, these interests and alliances are often subjective and intertwined with a nation's foreign policy objectives and geopolitical strategy, making them challenging to quantify. The mode of communication or diplomatic rhetoric employed by the urging party is another critical secondary sub-variable. The appeal's tone, intensity, and framing could significantly sway the response of the being urged. This aspect is profoundly subjective, as its interpretation hinges on cultural nuances, historical context, and the diplomatic relationship between the involved parties. Moreover, the international relations literacy of the decision-makers or decision-making team, along with the importance they place on the advice of the civil service, the significance they attach to the evaluation reports from military professionals, and the attention they pay to public opinion, all serve as secondary sub-variable that influence the potential for diplomatic urgings to be translated into concrete action. However, these factors, deeply rooted in a nation's societal and conceptual fabric, are challenging to quantity in their influence.
Likewise, other explanatory variables, such as the geographical location— the Marne River is far from Berlin but close to Paris—cannot be overlooked. The German forces felt fatigued due to the long-distance offensive. In contrast, the French could conscript or transfer forces from nearby regions to rejuvenate their forces ("physical endurance" sub-variable). Hundreds of miles extended the German supply line compared to the beginning of the war. In contrast, the French supply line was considerably shortened due to proximity to the battlefield ("logistics" sub-variable). The extended communication distance led to a rapid deterioration in the German High Command's understanding of the frontline situation(Terraine, 1960); contrastingly, the French High Command could keep abreast of the latest and most comprehensive frontline situation("communication" sub-variable). Regarding the micro-topography and recent hydrological and river bank changes in the Marne region, the French general had a greater understanding than the German general ("locals vs. outsiders" sub-variable). The quantity of sub-variables and the number of unquantifiable variables within the "geographical location" variable is no less than the "diplomatic" variable.
Faced with incredibly complex and volatile situations like the "Miracle of the Marne," the current research methods in academia — which involve examining the relationship between each sub-variable, or even more secondary sub-variables, and the dependent variable — not only become endless in scope, but also fail to determine the weight of each sub-variable when aggregated at the end. However, using our TFA method, we can easily obtain a quantifiable result for the combined effect of all the contributing factors. In simple terms, our method only requires two steps:
First, we use the TFR method to separately measure the combat effectiveness of both sides before and after the Battle of the Marne:
CEFrench&British-German(Aug.2-Sep.5,1914)=-40.00Gsqm/792h=-50.51Msqm/h
CEFrench&British-German(Sep.5-12,1914)=6.00Gsqm/168h=35.71Msqm/h
Since the two combat effectiveness values mentioned above are both average combat effectiveness rather than instantaneous combat effectiveness, they cannot be substituted into the standard CFCE measurement formula — Formula (2). Instead, they should be substituted into the approximate formula for CFCE — Formula (3):
CFCEFrench&British-German(Aug.2-Sep.12,1914)=
=2×(CEFrench&British-German(Sep.5-12,1914)-CEFrench&British-German(Aug.2-Sep.5,1914))/tAug.2-Sep.12,1914
=2×(35.71Msqm/h-(-50.51sqm/h))/(792h+168h)=179.63ksqm/h2
The value "179.63ksqm/h2" not only encompasses the two primary contributing factors (diplomacy and geography) and their respective sub-variables that led to the "Miracle of the Marne," but also includes all other secondary contributing factors at play in the event, even those hidden deep in history—unknown, subjective, and accidental. In other words, regardless of whether these contributing factors have been thoroughly identified or whether they are quantifiable, our method enables us to quantify and determine the cumulative final impact of these variables.
Case Analysis IV: The first stage of the Korean War (1950-1951)4
From June 25 to September 15, 1950 (from the start of the war to the Incheon Landing), the Democratic People's Republic of Korea (DPRK) exhibited superior combat effectiveness relative to the Republic of Korea (ROK). This resulted in North Korea occupying approximately 93,000 square kilometers of territory in the southern part of the peninsula over a period of 82 days. According to the TFR method, we can deduce:
CEDPRK - ROK(Jun.25-Sep.15,1950)=93Gsqm/1968h=47.26Msqm/h
From September 15 to October 25, 1950—a period spanning from the Incheon Landing to the intervention of the People's Republic of China in the war—there was a noticeable reversal in combat effectiveness between the conflicting parties. U.S. forces regained the lost territory in the southern peninsula and seized control of approximately 77,000 square kilometers of territory in the northern peninsula within 40 days. According to the TFR method, we can deduce:
CEDPRK - US&ROK(Sep.15-Oct.25,1950)=(-93Gsqm-77Gsqm)/960h=-177.08Msqm/h
Based on the above two measurements of average combat effectiveness, we can approximate the contribution of the Incheon Landing to the combat effectiveness of both parties using Formula (3):
CFCEDPRK - US&ROK(Sep.15-Oct.25,1950)=-CFCEUS&ROK- DPRK (Sep.15-Oct.25,1950)
=2×(CEDPRK -US&ROK (Sep.15-Oct.25,1950)-CE DPRK- ROK(Jun.25-Sep.15,1950))/tJun.25-Oct.25,1950
=2×(-177.08Msqm/h-47.26Msqm/h))/(1968h+960h)=-153.24ksqm/h2
The Incheon Landing is a complex composite of multiple contributing factors to combat effectiveness, as it directly triggered changes in combat effectiveness across various levels:
The DPRK benefited substantially from Soviet aid at the war's outset, including military hardware such as tanks, artillery, and military advisors. These contributing factors were part of the basis for North Korea's superior combat effectiveness. However, following the Incheon Landing, the direct intervention of the United States introduced a significant influx of advanced weaponry and equipment to the South Korean side. The formidable aerial capabilities of U.S. forces quickly secured air dominance over the Korean Peninsula, effectively neutralizing the contribution of Soviet support to North Korea.
In the early stages of the war, North Korea's combat effectiveness was further bolstered by its flexible tactics—namely, concentrating forces to assault enemy transportation and communication lines and making key breakthroughs at these hubs, rather than engaging in positional confrontations with the main South Korean force. This caught the South Korean forces by surprise. Coupled with the Republic of Korea’s (ROK) cumbersome decision-making process, this strategy led to a disorganized and haphazard response to the initial North Korean offensive. However, the "element of surprise," which had been a contributing factor to North Korea's initial success, became a factor that increased the combat effectiveness of the United States after the Incheon Landing. The surprise nature of the landing caught the North Korean forces off guard, causing significant disruption to their logistical lines and leading to the fragmentation of their forces, creating a situation where the North Korean army was attacked from both fronts.
These factors encompass a wide range of complex and multidimensional elements, many of which contain an infinite number of immeasurable subjective sub-factors. This complexity makes it infeasible to achieve a comprehensive quantification of all contributing factors through a single factor analysis. Moreover, an even more intricate situation arises, as there are contributing factors to the changes in North Korean combat effectiveness before and after the Incheon Landing that are unrelated to the landing itself. For instance, the initial combat effectiveness advantage of the DPRK also stemmed from their active ideological propaganda, wherein they twisted liberalism into a hypothetical enemy and reframed their expansionist war against South Korea as a patriotic defense to boost military morale. However, by the time of the Incheon Landing, the relentless combat engagement had inflicted considerable fatigue on North Korean forces, leading to a marked decline in individual combat morale compared to the previous phase.
The result we obtain, "-153.24 ksqm/h2," not only encompasses the new CFCE brought about by the Incheon Landing but also includes CFCE factors unrelated to the landing, representing the overall cumulative result of all CFCEs.
From October 25, 1950, to January 8, 1951 — the period from PRC's entry into the war to the US-ROK forces' counteroffensive from the 37th parallel — the second reversal in combat effectiveness among the conflicting parties was observed. Under the attack of the allied forces of China and North Korea, the United States and South Korea retreated to the south continuously for 75 days until the 37th parallel. It means that in addition to the previously occupied land in the north, the US-South Korea Coalition forces also lost control of the approximate 23,000 square kilometers of land between the 37th and 38th parallel. Thus, the combat effectiveness for this period is computed as follows:
CEPRC&DPRK-US&ROK(Oct.25,1950-Jan.8,1951)=(77Gsqm+23Gsqm)/1800h=55.56Msqm/h
By substituting the above result and the previously obtained CEDPRK -US&ROK (Sep.15-Oct.25,1950) values into Formula (3), we obtain:
CFCEPRC&DPRK-US&ROK(Oct.25,1950-Jan.8,1951)=-CFCEPRC&DPRK - US&ROK(Oct.25,1950-Jan.8,1951)
=2×(CEPRC&DPRK-US&ROK(Oct.25,1950-Jan.8,1951)-CEDPRK -US&ROK (Sep.15-Oct.25,1950))/tSep.15,1950-Jan.8,1951
=2×(55.56Msqm/h-(-177.08Msqm/h))/2760h=168.58ksqm/h2
From January 8 to April 10, 1951 — the period spanning the US-ROK forces' northward counteroffensive until crossing the 38th parallel again — a third reversal of combat effectiveness between the belligerents was observed. On April 10, 1951, the US-ROK forces pushed the front northward to the 38th parallel within approximately 92 days. Thus, the combat effectiveness of the belligerent forces during this period can be calculated as follows:
CEPRC&DPRK-US&ROK(Jan.8-Apr.10,1951)=-23Gsqm/2208h=-10.42Msqm/h
By substituting the above result and the previously obtained CEPRC&DPRK-US&ROK(Oct.25,1950-Jan.8,1951) values into Formula (3), we obtain:
CFCEPRC&DPRK-US&ROK(Jan.8-Apr.10,1951)=-CFCEUS&ROK-PRC&DPRK (Jan.8-Apr.10,1951)
=2×(CEPRC&DPRK-US&ROK(Jan.8-Apr.10,1951)-CEPRC&DPRK-US&ROK(Oct.25,1950-Jan.8,1951))/tOct.25-Apr.10,1951
=2×(-10.42Msqm/h-55.56Msqm/h)/4008h=-32.92ksqm/h2
The two opposing values, "168.58ksqm/h2" and "-32.92ksqm/h2," together illustrate a more complex situation in the contributing factors to combat effectiveness—namely, the interaction of contributing factors. Specifically, this is the result of the complex interplay between the factor of China's intervention and other contributing factors:
1.In the northern part of the Korean Peninsula, the uneven mountainous terrain significantly limits the line of sight and mobility of U.S. mechanized forces. On the other hand, the southern part of the Korean Peninsula, with its vast plains, provides an ideal platform for U.S. mechanized forces to demonstrate their potent offensive capabilities and maneuverability. The terrain factors lead to stark differences in the CFCE brought about by China's intervention at different stages of the conflict. Specifically, the complex terrain of the northern Korean Peninsula, marked by towering mountains and narrow valleys, favored the Chinese and North Korean forces, who employed highly effective ambush tactics, nocturnal raids, and infiltration strategies. Conversely, the mechanized equipment of the U.S.-ROK alliance struggled to execute standard offensive maneuvers in this difficult terrain. On one hand, the elevated ridgelines provided optimal cover to avoid the parabolic trajectories of incoming artillery. On the other hand, compared to the lighter equipment of the PRC-DPRK forces, the heavier weapons of the U.S.-ROK alliance became a burden for mountain marches. It is akin to walking being slower than driving on a highway, but faster than driving on an unmodified mountain road. In contrast, as the battlefield shifted south of the 38th parallel, the proportion of plains terrain increased significantly. As the battlefront moved into the Han River Plain region, the mechanized units of the U.S.-ROK forces began to fully utilize their combat effectiveness. Conversely, the advantages gained by the PRC-DPRK forces from their mountain warfare tactics no longer held the same efficacy.
2.In addition to terrain factors, other variables, such as the length of supply lines, also contribute to the uncertainty in the CFCE values triggered by China's intervention. At the onset of China's involvement, the battlefield was close to northeastern China, allowing the Sino-Korean forces to easily obtain supplies and personnel from China and the Soviet Union. However, as the battlefront shifted further south, the supply lines for the Sino-Korean forces lengthened, increasingly complicating their logistics and making them more susceptible to disruption. In contrast, given the proximity of the southern Korean Peninsula to U.S.-occupied Japan, a steady stream of logistical supplies was provided to the U.S.-ROK forces, facilitated by the U.S.'s robust sea and air transport capabilities.
3.The aforementioned factors can be analyzed qualitatively, allowing us to assess their varying effects on China's intervention during different periods, either strengthening or weakening its impact. However, some variables, such as the "snow-earth" factor, cannot be evaluated for their specific impact, as they have both strengthening and weakening effects. On the one hand, the combination of mountainous terrain and snow further intensified the difficulties in the mobility of mechanized units and increased fuel requirements (extra fuel consumption for uphill movements and heating). On the other hand, the snowy terrain also led to numerous cases of frostbite among the Chinese troops, who lacked proper cold protection equipment, thus reducing their human resources. Clearly, the impact of the snow variable on China's intervention is difficult to determine, as it has dual effects.
It is clear that after 1951, the most crucial contributing factor was China’s intervention. However, with the 38th parallel as a dividing line, other factors such as terrain and logistics had a significant and divergent impact on the CFCE brought about by China’s intervention. These factors could either amplify the changes in combat effectiveness to over 150 or diminish them to below zero. The two data points we obtained clearly capture the complex interplay between these combat effectiveness contributing factors.

Table 1.
Qualitative and Quantitative Results of CFCE during the Stalemate Stage of the Korean War.
| Period | Major Contributing Factors | CE | CFCE |
|---|---|---|---|
| Jun.25-Sep.15,1950 | Soviet support, South Korea caught off guard | 47.26Msqm/h | —— |
| Sep.15-Oct.25,1950 | Incheon Landing, North Korean troop fatigue | -177.08Msqm/h | -153.24ksqm/h2 |
| Oct.25,1950- Jan.8,1951 |
China’s intervention, battlefield environment favorable for China (mountainous terrain favored guerrilla warfare, supply lines shorter for China, longer for the US) | 55.56Msqm/h | 168.58ksqm/h2 |
| Jan.8-Apr.10,1951 | China’s intervention, battlefield environment unfavorable for China (plains favored advanced weapons, supply lines shorter for the US, longer for China) | -10.42Msqm/h | -32.92ksqm/h2 |
Note: In this table, CE refers to CE PRC & DPRK-US & ROK and CFCE refers to CFCE PRC & DPRK-US & ROK.
Summary and Analysis of Case Analysis III and IV
Compared to Case I from over 1800 years ago and Case II from 1400 years ago, Case III, which occurred more than a century ago, and Case IV from over half a century ago, no longer require counterfactual assumptions regarding missing data. This reflects the more comprehensive nature of modern warfare records compared to ancient times. As history has progressed, the methods of recording wars and collecting data have continuously improved, making the measurement and analysis of combat effectiveness more reliable and thorough. However, despite these advancements, it remains necessary to use Formula (3) for approximate calculations, as the war data from these periods typically cover only the beginning and end stages of the conflict, rather than continuous time series data. Consequently, they can only provide accurate average combat effectiveness data. Thus, traditional methods of war data recording have, to some extent, limited the precise analysis of CFCE.
However, this issue is no longer relevant in the case of the ongoing Russo-Ukrainian War, as this conflict is the first modern war to be continuously under close global media scrutiny. It marks the first time in history that daily detailed data on frontline changes can be obtained in real time, breaking the limitations of past war records. The precision of these data—capable of capturing daily fluctuations on the frontlines—makes it possible to measure instantaneous combat effectiveness. Especially in a prolonged conflict, daily data can be considered nearly equivalent to instantaneous data. This represents a revolutionary leap in accuracy and timeliness compared to historical records. The availability of frontline time series data also enables the accurate measurement of CFCE.
Case Analysis V&VI: The Current and Future Wars
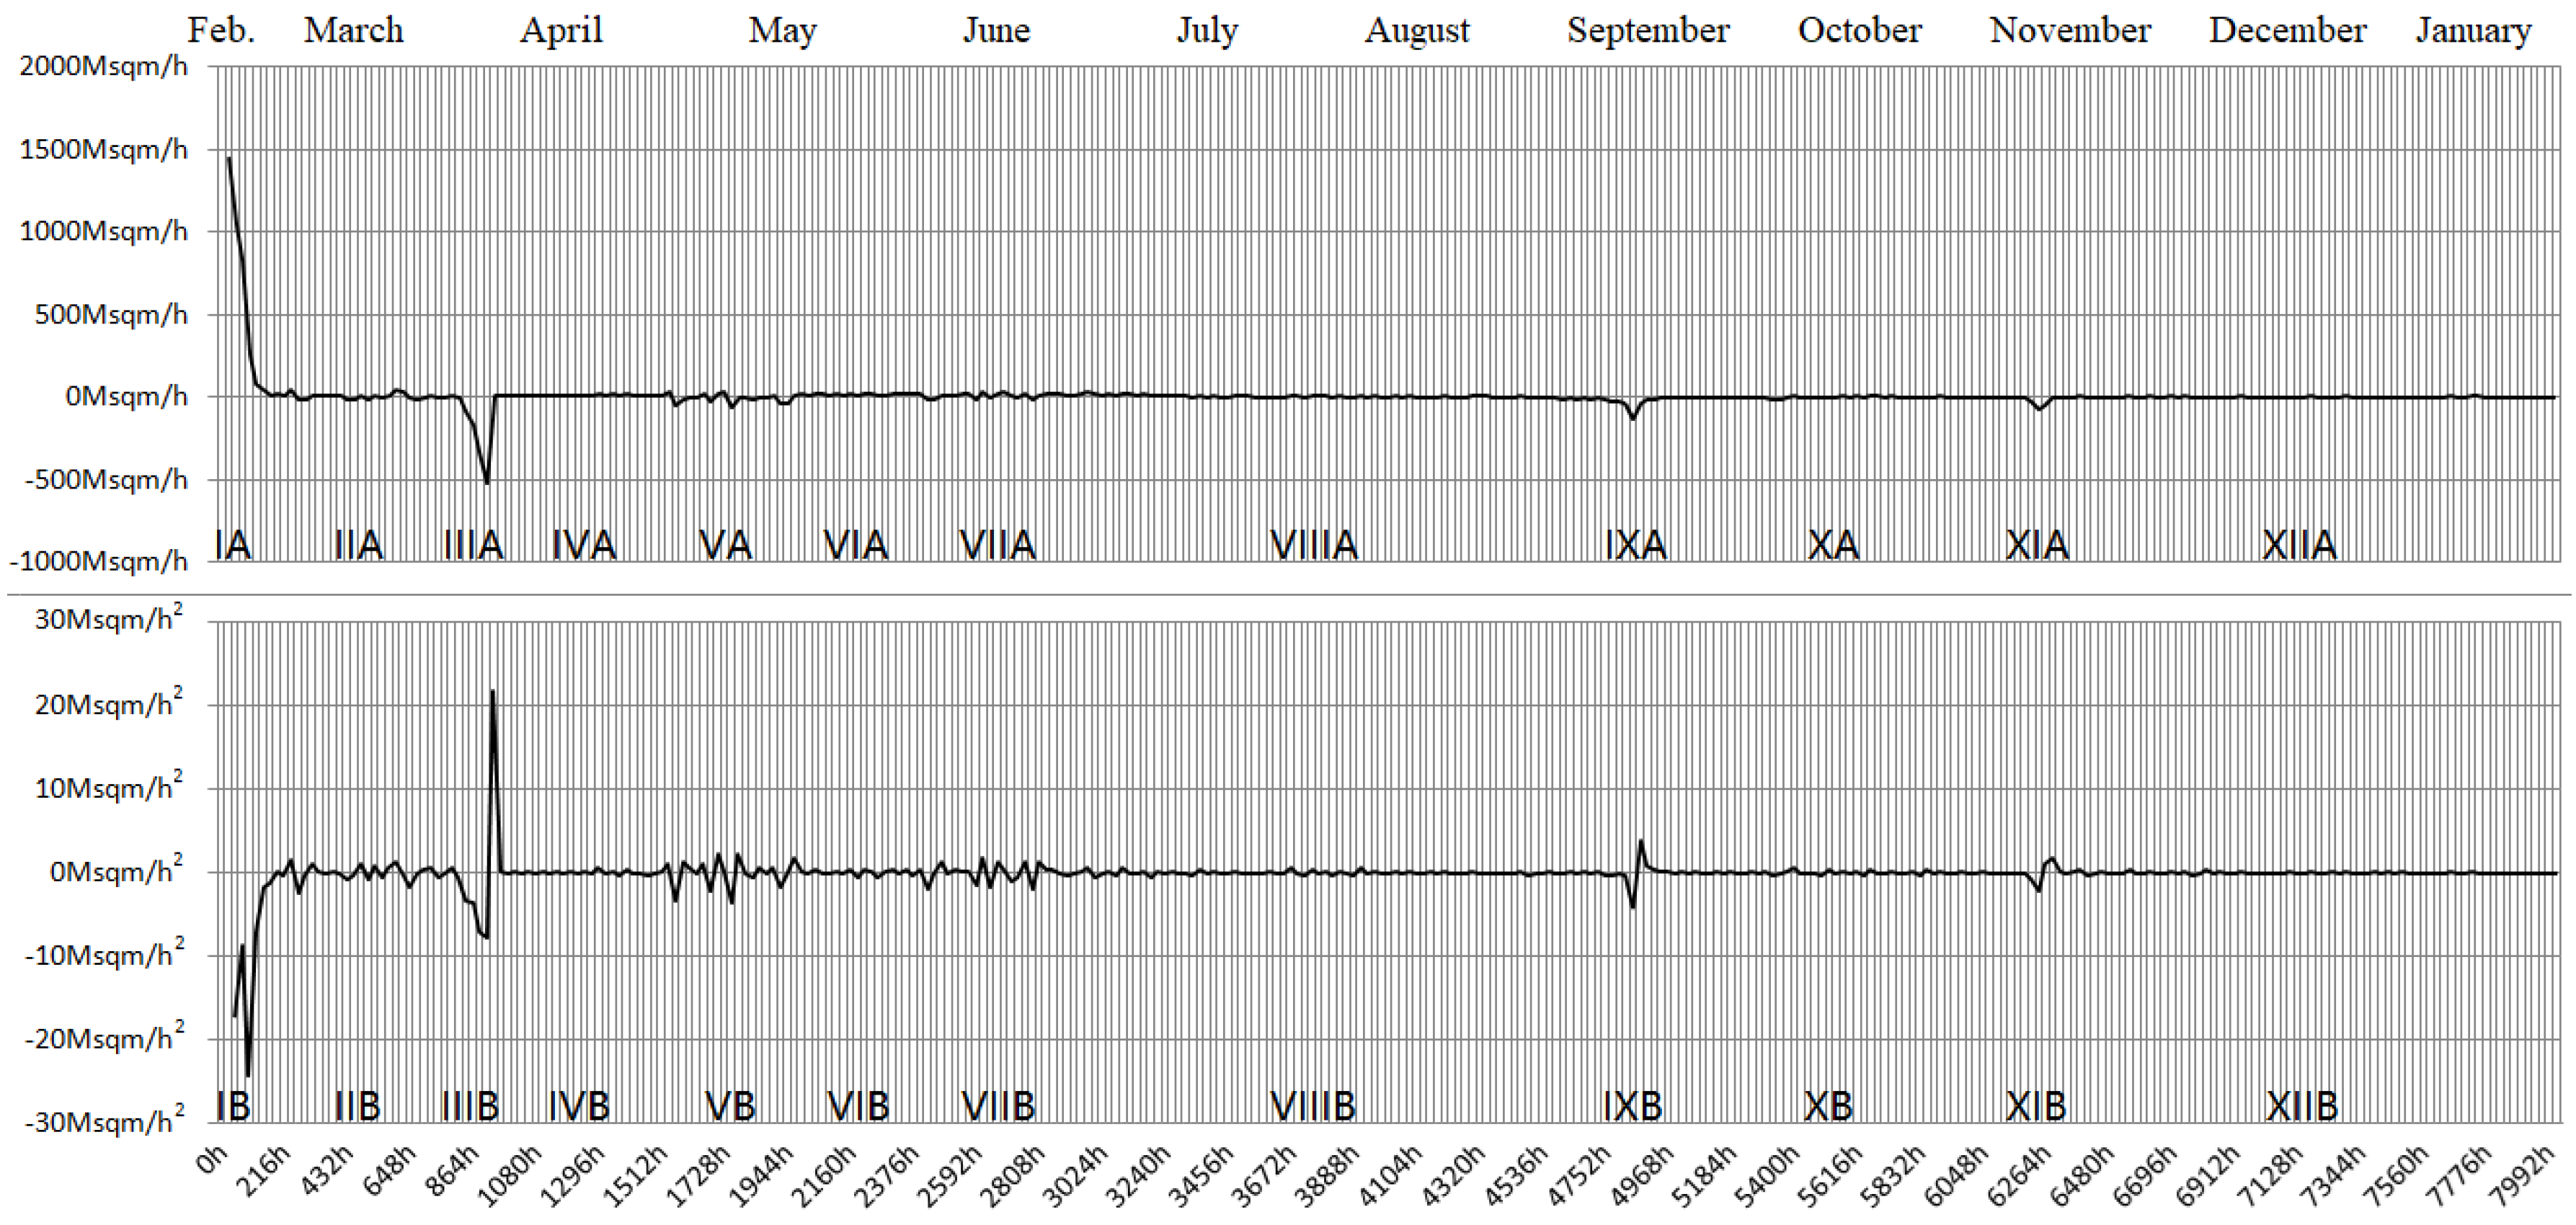
Case Analysis V:The first year of the Russia-Ukraine war5
Figure 1 shows that at the beginning of the war, Russia had the advantage of sudden attack, whereas for Ukraine, then fighting alone, the battlefield situation was extremely unfavorable. This is reflected in the fact that the CE of Russia operates at a high position above the abscissa axis (Waveform IA). However, at this time, Russia's CFCE was opposite to its CE, dropping to a low position below the abscissa axis (Waveform IB), which means that the above two favorable factors for the Russian army ("Russian sudden attack" and "Ukraine fighting alone") were rapidly reduced. With the arrival of a series of CFCEs that were conducive to improving Ukraine's CE, the Russian offensive was significantly weakened and the resistance of the retreating side significantly increased, reflected in the significantly narrowed fluctuation of both the CE and CFCE (IIA and IIB).
By the end of March and the beginning of April 2022, Russia gradually realized that it lacked the required combat effectiveness to annex the whole of Ukraine. As a result, the Russian high command decided to withdraw its troops from Kyiv. Waveform IIIA shows that Russia's CE is positioned on one side of the abscissa axis, while the CFCE of Russia (Waveform IIIB) appears on both sides of the axis. This indicates that the "retreat" is more likely a strategic shift than a rout. If it were the latter, the chart would show both CE and CFCE running on the same side of the abscissa axis. During the period when Russia adjusted its military deployment, no large-scale military contact occurred between the two sides, which is reflected in the CE and CFCE (Waveform IV) oscillating within a narrow range around the abscissa axis.
Russia transferred the troops withdrawn from Kyiv to the front line in East Ukraine, which became the theatre of many fierce battles that were termed the "Battle of Donbas" by global mainstream news media. The battle can be divided into three stages. The first stage spanned middle and late April, when fighting between the two sides resumed. This reflects the emergence of Waveform V. The second stage took place in the early and middle days of May. Tired troops from both sides needed rest, reflected in the CE and CFCE fluctuating within a narrow range around the abscissa axis (Waveform VI), similar to Waveform IV. The third stage was from the end of May to the beginning of July. Fighting recommenced after a period of rest, reflected in the Waveform VII, similar to Waveform V.
As the Russo-Ukrainian war entered long-term war of attrition in mid-July 2022, Waveform VIII appeared. At this stage, the CE of Russia was still slightly higher than that of Ukraine, hence most VIIIA fluctuate above the abscissa axis, and are very close to each other. This indicates Russia's slow encroachment of Ukraine's power-space during the summer of 2022, although external assistance greatly delayed this process.
Increasing external assistance and the return of Ukrainian soldiers trained by NATO to participate in the war changed the situation in terms of combat effectiveness. That of Ukraine began surpassing that of Russia in September 2022, when the Ukrainian army first achieved victory in the Kharkiv region. This is where the combat effectiveness of the Russian army was relatively weak. As Waveform IX shows in the chart, similar to Waveform III, this Ukrainian victory did not lead to a continuous rout of Russia (IXA are on one side of the abscissa axis, but IXB appear on both sides). It can be seen that the CE of Ukraine is not significantly higher than that of Russia. This also reveals that when combat effectiveness was slightly in Russia's favor, the Russian high command's tactical approach leaned more towards slow, gradual advancement in multiple areas (in July and August), whereas the Ukrainian army's tactical style was to concentrate forces in one area for a counterattack (in September). Therefore, after October 2022, Ukraine needed to gain strength again, and narrow amplitude oscillations (Waveform X) similar to Waveform VIII reappear in the chart.
After nearly two months' accumulation of CE weak advantages again, Waveform XI, similar to Waveforms III and IX, began to appear at the end of November. This corresponded to the fact that the Ukrainian army recovered half of the territory of Kherson (the land on the west bank of the Dnieper River, including the capital). Similarly, this victory did not lead to the overall defeat of Russia (XIA are on one side of the abscissa axis, but XIB appear on both sides). Since the beginning of December 2022, narrow amplitude oscillations have re-emerged (Waveform XII), similar to Waveforms VIII and X.
However, by the end of Waveform XII, Waveforms IX and XI, which had appeared after Waveforms VIII and X, did not reappear. This is because, in response to the defeat at Kharkiv, Russia initiated a partial mobilization in September 2022. The newly mobilized soldiers, once deployed to the battlefield by the end of the year, offset the advantage gained by Ukraine’s additional mobilized forces from September to November (which had been the foundation of Ukraine's victories in Kharkiv and Kherson). Subsequently, both sides, with equal combat effectiveness, engaged in the Battle of Bakhmut, characterized by heavy casualties on both sides, yet with little movement on the frontline.
Case Analysis VI: Future Wars
As Harold Laswell said, “Modern war must be conducted on three fronts: the military front, the economic front, and the propaganda front. The military front is a mere consequence of the other two. The economic blockade will be the decisive factor in the war, and the propaganda that precedes and accompanies it will serve to confuse and demoralize the enemy”(Lasswell 1927,p.208). This trend will only become more pronounced in future warfare. It implies that one of our tasks is to extend the formula for measuring combat effectiveness in the military domain to encompass the economic and propaganda domains. The TFR method proposed by Sun and Wang (2025) uses the two-dimensional frontline advancement rate as a measure of military combat effectiveness. We can extend this method by employing a two-dimensional market share advancement rate to measure economic combat effectiveness (treating market boundaries as frontlines and calculating the area enclosed by the old and new market boundaries over a unit of time), and a two-dimensional ideological advancement rate to measure propaganda combat effectiveness (treating ideological boundaries as frontlines and calculating the area enclosed by the old and new ideological boundaries over a unit of time).
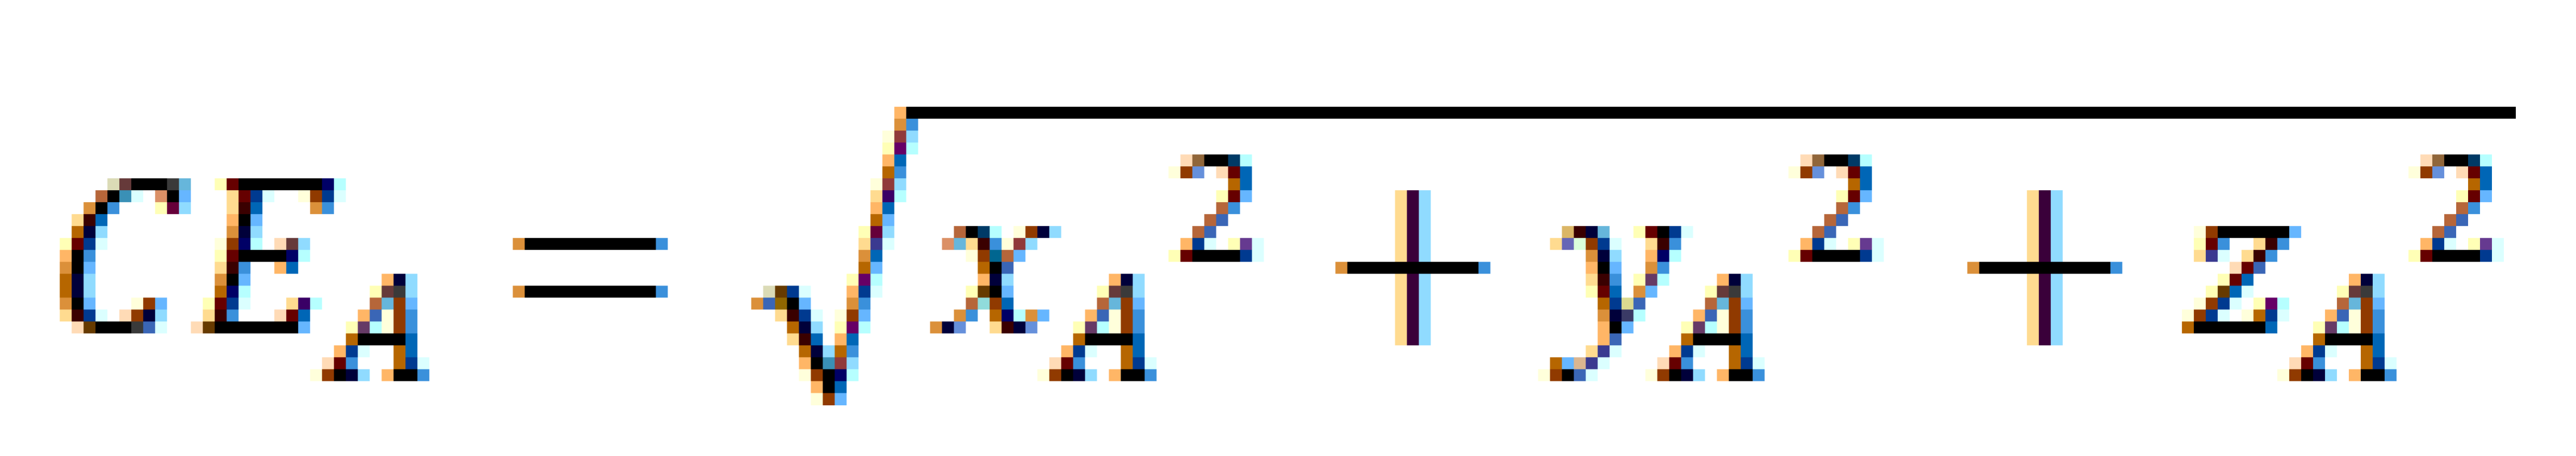
Due to the independence between the three types of combat effectiveness, as exemplified by the statement from Mrs. Thatcher, the former British Prime Minister: “The Soviet Union is a superpower militarily, but it has failed abysmally in economic and moral terms” (delivered by Margaret Thatcher in a speech to the Conservative Party Conference on October 9, 1983), it reflects that high military combat effectiveness does not necessarily imply high effectiveness in other domains. Therefore, the three-dimensional combat effectiveness of a country is not a simple sum of the three types of combat effectiveness. Instead, it is more appropriate to create a Cartesian coordinate system to measure combat effectiveness in military & politics, economy, or propaganda on the x, y, and z axes, respectively. In such a coordinate system, the three-dimensional combat effectiveness of a country, sub-national entity (e.g.; political parties or associations), or a supra-national entity (such as the UN or the EU) can be expressed as A (xA(military&politics), yA(economy), zA(propaganda)). The dyadic three-dimensional combat effectiveness between A and B (xB, yB, zB) is calculated as:

and the monadic three-dimensional combat effectiveness of A as:
The unit of measurement for both is still sqm/h or sqkm/a.
When we extend combat effectiveness from one dimension to three dimensions, it means that CFCE can also undergo a similar extension, incorporating the contributing factors of combat effectiveness in the military, economic, and propaganda domains. In the Cartesian coordinate system, we can model three-dimensional CE and three-dimensional CFCE as follows:
In the ideal state P, the three-dimensional combat effectiveness of country P is represented by (x, y, z), which is influenced by a three-dimensional CFCE, capable of simultaneously affecting the military, economic, and propaganda combat effectiveness. When the CFCE value is m, its direction can be represented as (m·cosθ1·cosθ2, m·cosθ1·sinθ2, m·sinθ1) with the origin at (0,0,0). Here, θ1 represents the included angle between the CFCE and the xOy plane, and θ2 represents the angle between the projection of the CFCE on the xOy plane and the Ox axis. After a period of time (t), the three-dimensional combat effectiveness of Country P becomes (x', y', z'), where
Based on the above model, if the initial CE and three-dimensional CFCE are known, it becomes possible to calculate and simulate the comprehensive progression and impact of a war on a country across the political, economic, and cultural dimensions.
Summary and Analysis of Case Analysis V and VI
We have not provided specific case studies for Case VI because the current data acquisition capabilities are insufficient to support it. However, through Case V, we can observe that obtaining current military CE and CFCE data is relatively easy. For example, by tracking military websites daily, we can gather information on the daily frontline changes in the Russo-Ukrainian War, and subsequently, calculate the CE and CFCE time series data using the measurement formulas. Moreover, the CFCE data obtained through this method is based on the precise measurement of Formula (2), rather than the approximate calculation using Formula (3) as required in Cases I, II, III, and IV.
However, to date, obtaining data on economic and propaganda domain CE remains challenging, not to mention calculating CFCE. For instance, although we can roughly estimate the changes in Russia's economic combat effectiveness and propaganda combat effectiveness by tracking the total area of countries imposing sanctions on Russia and the total area of countries willing to participate in aid to Ukraine over time, the data gathered in this way are clearly only analogous to the average CE in Cases III and IV. Some of this data may even require assumptions, much like in Cases I and II. In other words, the difficulty in acquiring economic and propaganda domain frontline change data currently lies somewhere between the ease of obtaining modern military frontline data and the challenges of obtaining ancient military data.
Therefore, while instantaneous military combat effectiveness can now be accurately obtained, instantaneous data in the economic and propaganda domains remains difficult to access. This is why our Case VI does not include real-world examples. However, with the expansion of this work and the increasing involvement of researchers, once scholars recognize the importance of accurately measuring frontline change data in the economic and propaganda spheres, it is likely that, in future wars, three-dimensional instantaneous data will be readily available on military websites, just as the Russo-Ukrainian War has made military frontline change data publicly accessible online for the first time.
Conclusions
In summary, our research introduces a novel method for measuring the contributing factors of combat effectiveness (CFCE), a method that could add significant depth and detail to our understanding of military conflicts. The practical challenges of identifying and accurately quantifying all CFCE have long constrained the measurement of CFCE. However, our measurement method, based on the TFR combat effectiveness measurement approach, bypasses these issues. The case studies conducted in our research have validated this method, demonstrating its ability to effectively measure the combined impact of all CFCEs on combat effectiveness (CE).
In academic research, achieving accurate and comprehensive measurement of CFCE contributes to a more nuanced understanding of warfare. It helps to dissect the complex interactions between the various variables that contribute to combat processes, enhancing the richness and robustness of theoretical models. It may also encourage further exploration of under-explored areas, such as psychology and sociology within the military domain. This broadens and deepens the scope of military science, international relations, political science, and related fields.
For policy-making, the CFCE measurement method can assist decision-makers in making more informed choices. It provides quantitative insights that can guide military budget allocation, inform troop deployment decisions, and aid in the design of training programs. Crucially, it can also better support the assessment of the actual effects of various military policies. By accurately measuring the contributing factors of combat effectiveness suitable for specific contexts, it will have a significant impact on strategic planning to enhance military combat effectiveness.
Moreover, the CFCE measurement method can be applied to improve the realism and utility of competitive video games and military analysis simulation software. These tools are increasingly important for developing tactical electronic training systems and artificial intelligence (AI)-driven strategic planning systems. Successful measurement of CE and CFCE could lead to the development of better military mathematical models, resulting in more effective strategies and combat operations.
Overall, improving the measurement of combat effectiveness contributing factors can significantly advance our theoretical understanding of warfare and play a crucial role in the practical application of military strategy and technological development.
References
- Annas, C.; Annas, G. Enhancing the Fighting Force: Medical Research on American Soldiers. The Journal of Contemporary Health Law and Policy 2009, 25, 283–308. [Google Scholar] [PubMed]
- Apostolou, C. (2015). The dictator’s army: Battlefield effectiveness in authoritarian regimes. Cornell University Press.
- Banks, A. (2001). A Military Maps of the First World War. Pen & Sword Military.
- Beckley, M. Economic development and military effectiveness. The Journal of Strategic Studies 2010, 33, 43–79. [Google Scholar] [CrossRef]
- Biddle, S. (2010). Military effectiveness. In R. A. Denemark (Ed.), The International Studies Encyclopedia (pp. xx–xx). Wiley-Blackwell.
- Biddle, S.; Long, S. Democracy and military effectiveness: A deeper look. Journal of Conflict Resolution 2004, 48, 525–546. [Google Scholar]
- Brooks, R.; Stanley, E.A. (2007). Creating military power: The sources of military effectiveness. Stanford University Press.
- Carrier, R. Some Reflections on the Fighting Power of the Italian Army in North Africa, 1940–1943. War in History 2015, 22, 503–528. [Google Scholar] [CrossRef]
- Chen, S. (1982). The Records of the Three Kingdoms. Zhonghua Book Company.
- Clodfelter, M. (2017). Warfare and armed conflicts: A statistical encyclopedia of casualty and other figures, 1492-2015 (4th ed.). McFarland.
- Desch, M.C. (2008). Power and military effectiveness: The fallacy of democratic triumphalism. Johns Hopkins University Press.
- Desch, Michael C. Democracy and Victory: Why Regime Type Hardly Matters. International Security 2002, 27, 5–47. [Google Scholar] [CrossRef]
- Downes, A.B. How smart and tough are democracies? Reassessing theories of democratic victory in war. International Security 2009, 33, 9–51. [Google Scholar] [CrossRef]
- Dupuy. Mythos or verity? The Quantified Judgment Model and German Combat Effectiveness. Military Affairs: The Journal of Military History, including Theory and Technology 1986, 204–210.
- Epstein, Joshua. In The Calculus of Conventional War: Dynamic Analysis without Lanchester Theory.; Brookings Institution Press: Washington DC, 1985.
- Farrell, T. World culture and military power. Security Studies 2005, 14, 448–488. [Google Scholar] [CrossRef]
- Friedman, J.A. Manpower and counterinsurgency: Empirical foundations for theory and doctrine. Security Studies 2011, 20, 556–591. [Google Scholar] [CrossRef]
- Grauer, R.; Quackenbush, S.L. Initiative and military effectiveness: Evidence from the Yom Kippur War. Journal of Global Security Studies 2021, 6, 191–205. [Google Scholar] [CrossRef]
- Haldon, J. (2005).The Palgrave Atlas of Byzantine History. Palgrave Macmillan.
- Harwood, Jeremy. 2013. Atlas of History's Greatest Military Victories: The 50 Most Significant Moments Explored in Words and Maps. London: Icon Books Ltd.
- Hayward, P. The measurement of combat effectiveness. Operations Research 1968, 16, 314–323. [Google Scholar]
- Heinecken, L. Social Equality Versus Combat Effectiveness: An Institutional Challenge for the Military. African Security Review 1998, 7, 3–16. [Google Scholar] [CrossRef]
- Jankowiak, Marek. 2009. The First Siege of Constantinople by the Arabs (674–678): Problems–Iconography. East and West: Essays on Byzantine and Arab Worlds in the Middle Ages. Gorgias Press, pp. 325–336.
- Johnson, P.B. Does decapitation work? Assessing the effectiveness of leadership targeting in counterinsurgency campaigns. International Security 2012, 36, 47–79. [Google Scholar]
- Kanatliev, Rosen. 2014. In Improving Relative Combat Power Estimation: The Road to Victory.; Army command and general staff college: Fort Leavenworth, KS, 2014.
- King, A. On Combat Effectiveness in the Infantry Platoon: Beyond the Primary Group Thesis. Security Studies 2016, 25, 699–728. [Google Scholar] [CrossRef]
- Krondak, W.J.; Cunningham, R.; Hunsaker, O.; Derendinger, D.; Cunningham, S.; Peck, M. Unit combat power (and beyond). Paper presented at the 24th International Symposium on Military Operational Research (ISMOR), August 28–31, 2007. [Google Scholar]
- Kuo, K. Dangerous changes: When military innovation harms combat effectiveness. International Security 2022, 47, 48–87. [Google Scholar] [CrossRef]
- Lasswell, H.D. (1927). Propaganda technique in the world war. New York: Knopf.
- Lyall, J. (2020). Divided armies: Inequality and battlefield performance in modern war. Princeton University Press.
- Lyall, J.; Wilson, I. III. Rage against the machines: Explaining outcomes in counterinsurgency wars. International Organization 2009, 63, 67–106. [Google Scholar] [CrossRef]
- Mehrl, M. Female combatants and rebel group behaviour: Evidence from Nepal. Conflict Management and Peace Science 2022, 40, 260–280. [Google Scholar] [CrossRef]
- Millett, A.R.; Murray, W. (Eds.) Military effectiveness (Vols. 1–3). Cambridge University Press, 2010. [Google Scholar]
- Nielsen, S.C. Civil-Military Relations Theory and Military Effectiveness. Policy & Management Review 2002, 2. [Google Scholar]
- Pilster; Ulrich; Bohmelt, T. Coup-Proofing and Military Effectiveness in Interstate Wars, 1967–1999. Confl. Manag. Peace Sci. 2011, 28, 331–50. [Google Scholar]
- Plapinger, S.H. Insurgent recruitment practices and combat effectiveness in civil war: The Black September conflict in Jordan. Security Studies 2022, 31, 251–290. [Google Scholar] [CrossRef]
- Pollack, K.M. (2002). Arabs at war: Military effectiveness. University of Nebraska Press. [CrossRef]
- Przemieniecki, Janusz Stanislaw. In Mathematical Methods in Defense Analyses.; The American Institute of Aeronautics and Astronautics, Inc.: Reston, 2000.
- Raymond, A.D. (1991). Assessing Combat Power: A Methodology for Tactical Battle Staffs. Army Command and General Staff Coll, Fort Leavenworth, KS, School of Advanced Military Studies.
- Reiter, D. Avoiding the coup-proofing dilemma: Consolidating political control while maximizing military power. Foreign Policy Analysis 2020, 16, 312–331. [Google Scholar] [CrossRef]
- Reiter, D. Command and military effectiveness in rebel and hybrid battlefield coalitions. Journal of Strategic Studies 2022, 45, 211–233. [Google Scholar] [CrossRef]
- Reiter, D. (Ed.) . (2017). The sword's other edge: Trade-offs in the pursuit of military effectiveness. Cambridge University Press.
- Reiter, D.; Stam III, A.C. Democracy and battlefield military effectiveness. Journal of Conflict Resolution 1998, 42, 259–277. [Google Scholar] [CrossRef]
- Rotte, R.; Schmidt, C. On the Production of Victory: Empirical Determinants of Battlefield Success in Modern War. Defence and Peace Economics 2003, 14, 175–192. [Google Scholar] [CrossRef]
- Ruthven, M. and Nanji, A. (2004). Historical Atlas of the Islamic World. Harvard University Press.
- Sloan, G. Military Doctrine, Command Philosophy and the Generation of Fighting Power: Genesis and Theory. International Affairs 2012, 88, 243–263. [Google Scholar] [CrossRef]
- Sun Tzu, The Art of War. Translated from the Chinese by Lionel Giles, Luzac & Co.; 1910.
- Sun, W.; Wang, J. Measuring combat effectiveness: a novel method based on two-dimensional frontline advancement rate. Int Polit 2025. [Google Scholar] [CrossRef]
- The Palgrave Concise Historical Atlas of the Cold War;. New York: Palgrave Macmilian.
- Tan, Q. (1996). The Historical Atlas of China (Volume 2). China Cartographic Publishing House.
- Terraine, J. (1960). Mons: The Retreat to Victory. Wordsworth Military Library.
- Tolk, A. (2012). Engineering principles of combat modeling and distributed simulation. John Wiley & Sons, Inc.
- Zanella, J.A. (2012). Combat Power Analysis is Combat Power Density. Army Command and General Staff Coll, Fort Leavenworth, KS, School of Advanced Military Studies.
Figure 1.
Daily Russian combat effectiveness (CE) and daily CFCE in the first year of the war. Note: The upper chart shows Russia’s daily CE, which is the same as Figure IV in Sun and Wang (2025), with an extension to February 2023. The lower chart displays Russia's daily CFCE in the first year of the war, calculated based on the daily CE data and applying Formula (2).
| 1. | The data used in the calculations of this section are sourced from Tan(1996). |
| 2. | Data sources: Ruthven and Nanji(2004, p.26-29),Haldon(2005, p.29-32,102),Roland(1992), p.655-679 and Pryor(2006), p.26-27, 607-631. |
| 3. | The data used in the calculations of this section are sourced from Banks (2001). All calculations in this paper need to use the International System of Units (SI) prefix symbols (G=109, M=106, k=103). |
| 4. | The data used in the calculations of this section are sourced from Swift (2003, p.36-39) and Harwood (2013, p.200-203). |
| 5. | Data on daily Two-Dimensional Frontline Advancement Rate in Russia is sourced from respected military analysis platforms such as the Institute for the Study of War (ISW, https://www.understandingwar.org/) and Political Geography Now (PolGeoNow, https://www.polgeonow.com/). These datasets are derived from traditional frontline reporting, high-resolution satellite imagery, and shortwave infrared monitoring of fire points. Prominent military commentators, including Poulet Volant (https://twitter.com/Pouletvolant3) and War Mapper (https://twitter.com/war_mapper), have also analyzed the scale of frontline changes on the Russo-Ukrainian battlefield, publishing their calculations on Twitter. Their contributions serve as valuable cross-references, enhancing the reliability and accuracy of our data. |
Disclaimer/Publisher’s Note: The statements, opinions and data contained in all publications are solely those of the individual author(s) and contributor(s) and not of MDPI and/or the editor(s). MDPI and/or the editor(s) disclaim responsibility for any injury to people or property resulting from any ideas, methods, instructions or products referred to in the content. |
© 2025 by the authors. Licensee MDPI, Basel, Switzerland. This article is an open access article distributed under the terms and conditions of the Creative Commons Attribution (CC BY) license (http://creativecommons.org/licenses/by/4.0/).
Copyright: This open access article is published under a Creative Commons CC BY 4.0 license, which permit the free download, distribution, and reuse, provided that the author and preprint are cited in any reuse.


