Preprint
Article

This version is not peer-reviewed.

Evaluating Active Learning and Classifiers on Laying Hens’ Motion Data of 27-Behavioral Classes

Submitted:

02 March 2025

Posted:

03 March 2025

You are already at the latest version

Abstract

Animal welfare research increasingly relies on behavioral analysis as a non-invasive and scalable alternative to traditional metabolic and hormonal indicators. However, there remains an annotation challenge due to the diversity and spontaneity of animal actions, which may require expertise and knowledge in annotations, thorough look-back examination, and re-annotation to ensure the models can generalize well. In this regard, a scheme to facilitate the annotation scenarios is to selectively annotate less proportional but informative samples, called "Active Learning." We comprehensively evaluated combining 7-Active learning and 11-Classifiers to expose their different converge effects until they are fine-tuned. Including 3-uncertainty, Random Sampling, Core-Set-Scores (CSS), Expected-Maximized-Change (EMC), and Density-Weighted Uncertainty (DWU) sampling strategies let classifiers of linear-based, boosting-based, rule-based, instance-based, backpropagation-based, and ensemble-based classifiers to simulate the annotation process on laying hens of 27-Classes dataset collected by sensors of accelerometer and gyroscope. Results indicate that simpler AL strategies in handled high-dimensional feature space outperform complex-designed AL in efficiency and performance. Also, we found that the ensemble classifiers (Random Forest Classifier and Extra Trees Classifier) and the boosting-based models (LightGBM and Hist Gradient Boosting Classifier) exhibited learning instabilities. Additionally, increasing the query batch sizes can enhance annotation efficiency with slight performance loss. These findings contribute to the advancement of efficient behavior recognition in precision livestock farming, offering a scalable framework while the real-world applications are appealing to well-annotated animal datasets.

Keywords: 
;  ;  ;  ;  ;  ;  ;  ;  

1. Introduction

1.1. Regulations and Policies on Animal Welfare

Innovations on animals have been continuously striking domain interest in clinical medicine [1], livestock [2], emergence rescue [3], and disable assistance [4]. Accordingly, to protect animals widely from domestic pets, livestock, wildlife, laboratory-using, etc., policies and regulations have been established and triggered a decent amount of controversial inquiries of animal welfare [5,6]. Ideally, animals shall be provided with conditions as defined: (i) animals living without pain, (ii) control of the species-adequate living environment, and (iii) positively stimulated activities and social interactions of animals, both with humans and other animals [7].

1.2. Metabolic Signs and Hormones as Indicators of Animal Welfare

Despite these ideals, fulfilling each requirement is difficult, especially given the challenge of assessing animal welfare. From a veterinary perspective, welfare assessment often relies on metabolic and hormonal indicators [8,9], including body temperature, perspiration rate, heart rate, serotonin, urinary cortisol, cortisol, and epinephrine. These parameters are considered effective for accurately understanding animal well-being. However, these procedures can be time-consuming or labor-intensive and risk disrupting the animals’ subsequent behavior, particularly in group settings [10].

1.3. Behavior Patterns as Indicators of Animal Welfare

In contrast to detailed biochemical assessments, animal behaviors offer a more scalable means of welfare evaluation, particularly when managing large flocks or herds. Behaviors often convey critical psychological information—such as fear, freedom, or aggression [11]. Therefore, employing behavior patterns as a tool to interpret welfare is common, provided non-intrusive and non-manipulative research protocols are followed [12]. For individual animals, behavior markers such as water intake frequency [13,14] can signify levels of activity. Lameness is also a concerning issue in poultry, involving biomechanical damage. Previous research combined sensor technology with direct observation of birds’ gait parameters—including speed, cadence, step length, step width, step angle, and walking gait scores—to assess welfare [15]. As the broilers walked, varying pressure on their feet yielded different light-scatter patterns, captured by a mirror beneath the walking surface and processed with image analysis software. However, due to the development limitation of that age, it was difficult to calibrate uniformly among devices. At the group level, thermal stress can serve as an important indicator of environmental comfort, evaluated by measuring distances between broilers in their activity space [16]. Besides behavior, egg production is also a critical welfare indicator in poultry practice [17]; declines in egg quality can signal disease or infection [18] or nutrient deficiencies [19]. These group indicators can be interrelated, as poultry exposed to high thermal stress show reduced fertility and egg production [20].

1.4. Smart Computing and Smart Sensing for Animal Welfare

Developments in smart sensing and computing have produced compact, cost-effective sensors with larger storage capacity and higher data throughput. Such advancements enable the use of machine learning models to analyze animal behavior [21,22,23]. For example, wearable devices containing accelerometers and magnetometers can identify multiple behaviors (e.g., standing, walking, eating, lying down) [24,25,26]. GPS allows for monitoring large-scale grazing movements [27], and radio-frequency identification (RFID) systems localize individuals within high-density enclosures [28].

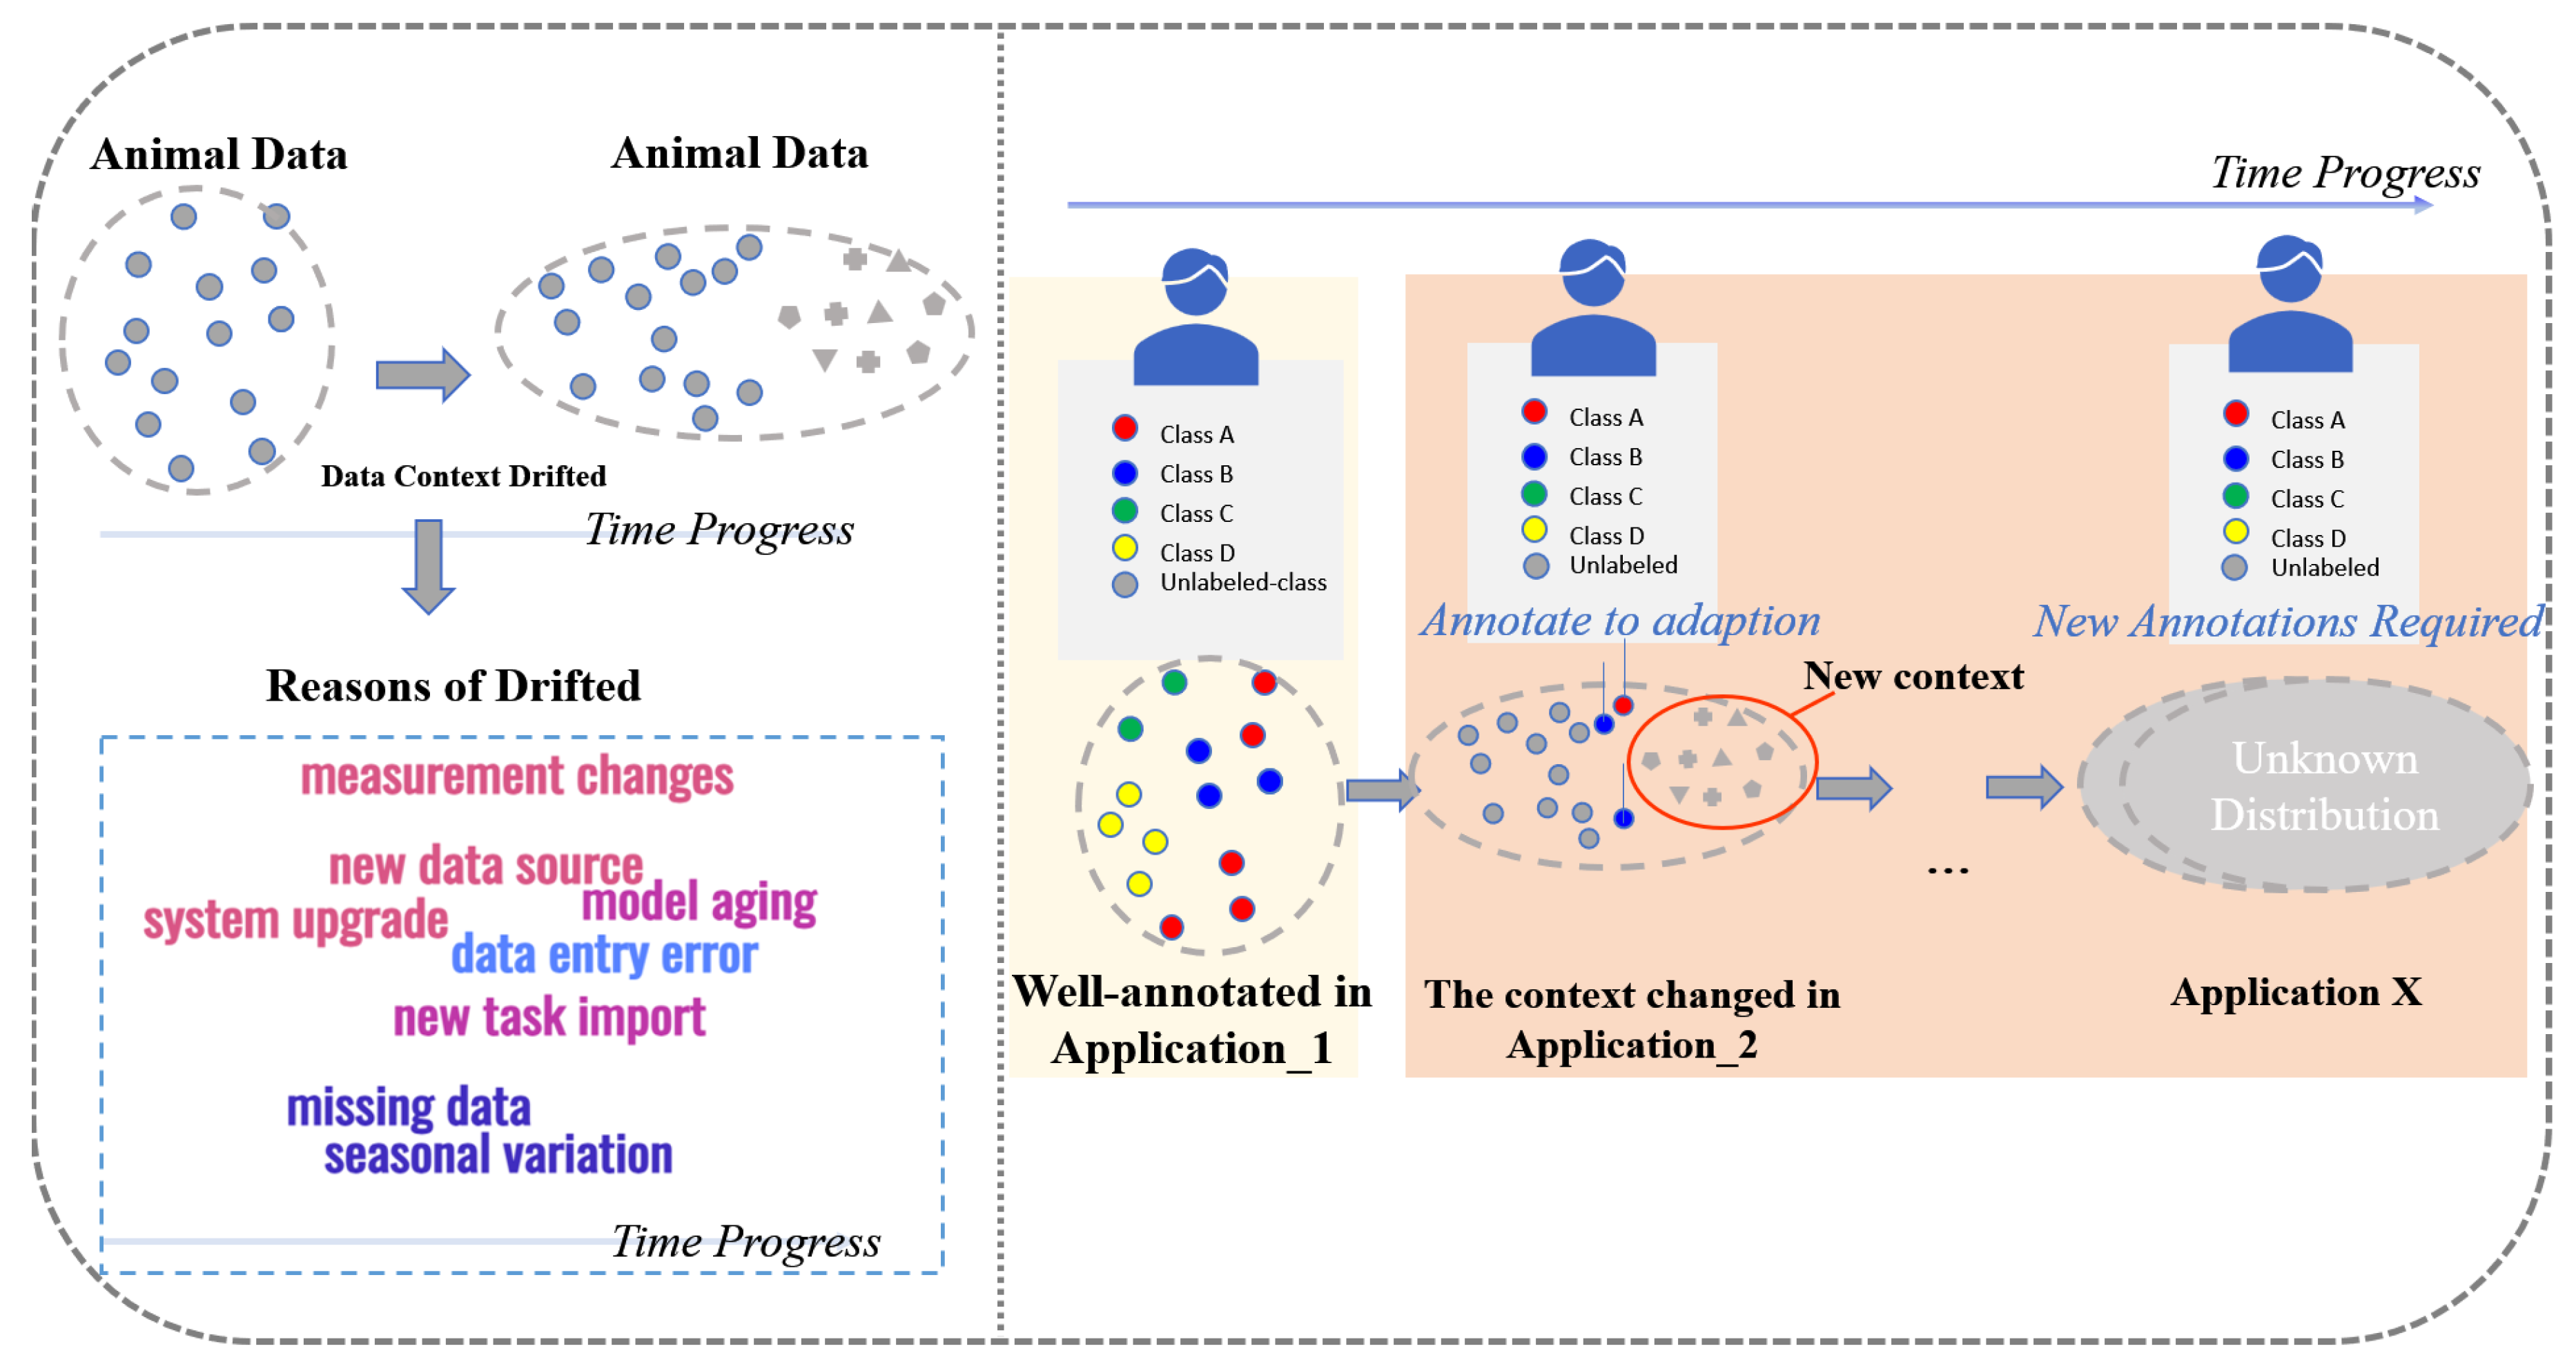
1.5. Annotation Issue in Animal Behavior Analysis

Studies on animal behavior recognition generally pose the issue of lakc of well-annotated data [29,30], and to the result, there possibly existing variations in experimental design and individual animal differences can introduce biases at multiple stages, including: (1)data acquisition, (2) data preprocessing, (3) model training, (4) model prediction, and (5) model application.
During data acquisition, biases may stem from different operators, animal subjects, environmental factors (e.g., seasonal changes, diseases), and device limitations (e.g., humidity, battery power, occlusions). During preprocessing and model training, annotators may mislabel data or apply inconsistent labels owing to differences in expertise. Previous research notes that observer bias often exists in behavior experiments dependent on extensive observation [31].
Because of these factors, real-world scenarios generally demand time-intensive annotation to maintain model adaptability. As shown in Figure 1, dataset drift can occur in large-scale commercial or industrial settings, complicating animal welfare implementations. An approach that builds lightweight models and queries less biased data is thus encouraged to create efficient annotation environments that facilitate research on behavioral pattern detection, quantification, and analysis. This paper’s contributions are as follows:
  • We introduce a 27-class behavior recognition framework for laying hens, which surpasses the classification scope of many existing animal behavior studies. The high complexity and class imbalance inherent in this dataset provide a unique opportunity to examine the impact of imbalanced class distributions on machine learning model performance and active learning strategies.
  • We conduct a systematic evaluation of machine learning classifiers and active learning strategies, identifying distinct model convergence patterns and revealing performance degradation in boosting classifiers, a phenomenon rarely addressed in the literature.
  • We integrate uncertainty-based sampling with recent advancements in active learning, incorporating density, representativeness, and diversity metrics, and assess their effectiveness in annotating both majority and minority behavior classes.
  • We analyze the effect of different query batch sizes to annotation efficiency and model performance, demonstrating that larger batch sizes significantly enhance annotation efficiency while maintaining only a marginal reduction in predictive accuracy.
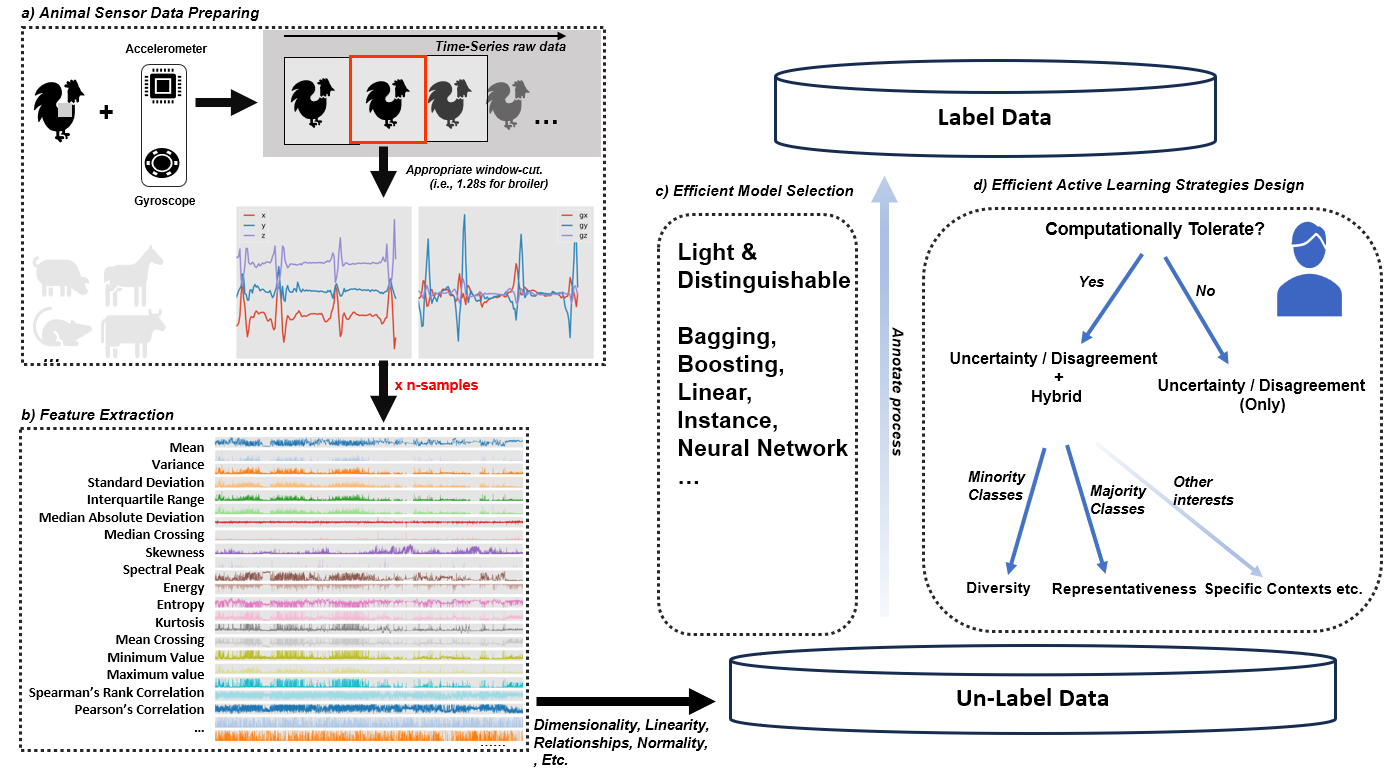
The remaining parts are structured. Section 2 introduces mainstream methodologies from machine learning, active learning, and feature extraction techniques. Section 3 presents experiment design of broiler 27-classes active learning. Section 4 demonstrate the results of multiple active learning informativeness driven by various algorithmic classifiers. Section 5 discusses the effectiveness of our annotation framework, limitations, and future aspects and conclusion in Section 6.

2. Methodology

We introduce the pertinent machine learning and active learning, followed by the adopted feature extraction techniques based on our precedential studies [32,33], and our proposed generalized annotation framework.

2.1. Machine Learning

We focus on the classifiers used in previous studies of animal behavior recognition. However, as they are regarded as the base for the latter active learning, we have to consider the efficiency of fitting time. There is a set of classifiers covering the mainstream categories, including tree, linear, ensemble, and neural network.
  • Support Vector Machine (SVM): SVM [34] is excellent in generating decision boundaries among varying dimensional space, to fine-tune its model, and avoiding issues of under-fitting or over-fitting; its regularization adjusts through shrinking or expanding distance between two types of margin (e.g. sort margin and hard margin), enabling capturing a variety of relationships of data such as the radial, linear or nonlinear. In earlier studies, it is used in cow behavior recognition on a 9-features low-dimensional accelerometer dataset with respect to standing, lying, ruminating, feeding, walking normaly, walking abnormally, however, it is unable to recognize the lying down of cows with zero sensitivity and zero precision [35].
  • K-nearest-neighboughrs (KNN): KNN is well-known in predicting house prices, since its mechanism is superior to learning the class-centroid samples and their neighbor samples, which adhering with the house prices correlated in regionally. However, its performance largely depends on whether the data has clustering characteristics to discriminate easily. In previously, it is proposed in GPS telemetry or dead-reckoning of animal position recognition and outperforming other complex models [36].
  • Logistic Regression (LR): LR as one of linear models learning features linearly, and then, using sigmoid or softmax to transform the numerical values, enabling multi-classification, optimized in the direction of maximum likelihood function, it can yield probability for classifications so that can be used in animal movement analyses [37].
  • Gaussian Naive Bayes (GNB): GNB is based on the Bayes theorem based on an assumption of features that are independent and follow Gaussian distribution, therefore, it is fast to handle high-dimensional data. In earlier study of dog behavioral classification with respect to standing, walking, running, sitting, lying down, and resting, it outperforms Decision Tree, KNN, and SVM [38].
  • Decision Tree (DT): DT constructed with tree nodes and splitted branch hierarchically, samples will be separated into subsets driving by infomration gain. It can handle features containing missing values based on the directional mechanism. In animal behavior recognition, it especially takes priority in classifying the behavior at different activity intensity levels, such as sports momentum at different levels, still and walking. Also, the transition state between standing and lying down between animal durations [39].
  • Random Forest Classifiers (RF): RF is based on an ensemble of trees by consolidating a multitude of tree’s decisions on classifications. It selects the best split at each node by considering a subset of features and using bootstrapped samples which is part of the whole training dataset. Compared with DT, which takes advantages at learning data with higher generalizability and robustness, thus avoiding over-fitting. It was applied in accelerometer-based free-grazing cows behavior recognition of feeding, lying, standing and walking [40].
  • Bagging Classifier (BAG): BAG is an ensemble of classifers at meta level, in this study we adopted theDTas its basic component to benchmark.
  • Extra Trees (ET): ET as ensemble classifier which is similar to RF, however, it introduces with more randomness into threshold for each feature and using the whole dataset (e.g. No Bootstrapping) for training each tree, therefore, it competing to RF with higher generalizability and speed, also previous study claims that it can be used for a wide variety of animal species, when recognizing 13-behaviors of cattle based on with accelerometer-based motion data [41].
  • Light Gradient Boosting Machine (LGBM): LGBM as a boosting algorithm is efficient to training on large-scale data since it used histogram-based feature which are discretized from origin features. Its optimization relying on an ensemble of trees conducted in a leaf-wise way [42].
  • Histogram Based Gradient Boosting Classifier (HGBC): HGBC is faster than LGBM in handling large-scale dataset, which is as the same boosting-based and histogram feature-based components as LGBM, where its difference optimized in a level-wise way. In previous study of accelerometer-based cattle behavior recogntion, it outperforms RF, SVM, and KNN [43].
  • Multi layers perceptrons (MLP): MLP as deep learning consisted of layers of interconnected neurons and corresponding weights to pass through the activation function, input values from features therefore can transformed into output values for prediction. With a variety of loss functions, it enables learning non-linear relationship from features, however, it usually requires large amount of data to support its generalizability for multi-classifcation [44].

2.2. Active Learning

Active learning as a sub-domain of machine learning is used for efficient annotation or alleviating the issue that data are scarce or insufficient [45]. In contrast to annotating randomly or passively, active learning selectively querying the annotator with samples that are decision boundary-nearby, therefore facilitating the machine learning models to converge or optimize faster without requiring the majority of samples that are decision boundary-distant and redundant.
Active learning is emerged across various domains, including nature language process [46], medical image process [47], website data mining [48], genetics [49]. Recently, its emergences with identifying patterns or relationships based on their special or novel intricacies so that can be integrated into animal behavior analyses, including home range estimation [50] and wildlife camera trap images [51], have stressed its novel insights in exploring the animal world of finding the machine-learnable characteristics of patterns.
Those commonly used active learning strategies are: Least Confidence [52], Entropy [53], Margin [54], Model Expected Change [55], and hybrid approaches that consider density [56], cluster [57], or distance [58]. Because their mechanisms are orchestrated in multiple ways, it is necessary to validate their effectiveness and robustness for efficiently annotating animal data.

2.3. Query Strategies

2.3.1. Least Confidence (UNCERTAINTY)

Assuming that the data space { D | L U } consists of labeled L and the other unlabeled U, where the latter is much larger than the former in the volumes. After model training based on L; For an unlabeled x U , there is a c max takes the largest possiblility in-between [ 0 , 1 ] . The Least Confidence strategy querying the most informative sample accordingly:
arg min x U P ^ ( c max x )
or
arg max x U 1 P ^ ( c max x )
Note that the c max belong to n-classes { C | c 1 , c 2 , . . , c n } .

2.3.2. Entropy

Assuming that x i U has the posterior probabilities P ^ ( c i | x ) , the Entroy can be denoted as c i n P ^ ( c i | x ) log P ^ ( c i | x ) , which can be seen as equal to the best sample’s informativeness:
arg max x U c i n P ^ ( c i | x ) log P ^ ( c i | x )
The most-possible class c i belongs to a set of k-classes { c 1 , c 2 , . . , c k } , similar to Least Confidence, which uses posterior probabilities generated by the model.

2.3.3. Margin

Assuming that x U , P ^ ( c m a x | x ) is the largest possibility predicted by the model, followed by the secondary possible class P ^ ( c m a x 1 | x ) , where the samples closing to the decision boundaries are informative to provide informativeness, must have a relatively lower margin, the queried samples can be targeted as:
arg min x U P ^ ( c m a x | x ) P ^ ( c m a x 1 | x )
The most-possible class c i and the second-possible class c m a x 1 belong to a set of k-classes c 1 , c 2 , . . , c k . Margin refers to the difference between the most possible class and the secondary possible class predicted by the model. Theoretically, they mutually provide information about the decision boundary; thus, the smaller it is, the more effective it is in optimization.

2.3.4. Disagreement by Query-By-Committee

Assuming that there is a committe that contains classifiers and classes with numbers of m and k, respectively. On a sample x i U , If x i get the most votes for number of h, then the disagreement can be denoted as m h m , function that can search informative sample therefore:
arg max x U m h m
Instead of relying on individual model outputs, Query-By-Committee (QBC), constituting its membership from a set of candidate models, leverages each model’s outputs to contribute to the final decision, where the informative samples mainly possess the disagreements. However, QBC driven by multiple classifiers is inappropriate for large-size, high-dimensional, and multi-classification in our study. Heuristically, we may look at some ensemble models driven by UNCERTAINTY, which consist of weak classifiers performing the same as theoretical QBC. Therefore, we excluded them.

2.3.5. Expected Maximized Change (EMC)

Assuming that x U with its probabilities across two consecutive time-steps P ^ t 1 ( x ) and P ^ t ( x ) , the difference between the intersection of deciding the change, we use the Euclidean distance norm-2 to measure the changes based on posterior probabilities, where the informative samples can be querying:
arg max x U P ^ t 1 ( x ) P ^ t ( x ) 2
EMC is to trace the most prominent change between two continuous time steps of annotating before and after according to the model behavior. Since model optimization is a process that leads to fine-tuning, as well as expanding the labeled L through annotating, therefore, querying unlabeled U led to the largest change toward the final optimization in theory.

2.3.6. Core-Set-Score (CSS)

Assuming that m-samples of x i U (unlabeled data) and n-samples of x j L (labeled data), CSS process can be decomposed into 2-steps:
  • For each x i , there could a sample x j taking the minimal difference represented as core-score.
  • Querying the sample with the largest core score among x i .
At step-1, the core-score is row-wise min of norm-1 Euclidean distance · 2 :
c s s ( x i ) = min j { 1 , 2 , . . . , n } x i x j 2
At step-2, the informative sample at each iteration:
arg max x i U c s s ( x i )
CSS focuses on the diversity of samples, which leverages the unsupervised knowledge of samples’ feature vectors. The core-set-score denotes the diversity of x i U to labeled L, which is the same as thinking how far we use our hand to touch the surface of an objective, but in CSS, using the unlabeled U to touch labeled L and viewing the most-distant sample x i U as informative with diversity.

2.3.7. Density Weighted Uncertainty (DWU)

Assuming that a sample x i U and n e i g h b o r s ( x i ) U denote its surrounded samples, DWU also can be decomposed into 2-steps:
  • Calculating the average difference between x i U and samples belonging to its predefined k-neighbors as density.
  • Synthesized the density and the UNCERTAINTY as informativeness score, querying based on the samples that contribute max value.
At step-1, we attain the density based on · 1 , the norm-1 Manhattan distance:
d e n s i t y ( x i ) = x i n e i g h b o r s ( x i ) 1 k
At step-2, we query the synthesized informative samples:
arg max x i U ( 1 p ^ ( c m a x | x i ) ) × d e n s i t y ( x i )
Where the ( 1 p ^ ( c m a x | x i ) ) is the Least Confidence and Density Weighted Uncertainty (DWU) further accounting for the representativeness of the sample in unlabeled U.
The above mechanism-driven active learning query strategies were used for efficiency in annotation. However, no strategy can always take priority when applied in a broader context of real-world datasets. The reasons that beside the data knowledge shapes vary, individual model’s interpretability for linear, non-linear, or radial varying also. Except for the animal races and manual experiments creating the data purpose usage and structures, respectively; For the group-living animals, possibly the known phenomenon, "pecking order" in the group life. Such contexts vary for frequencies, food intake, gaits, postures, or social behaviors. For an animal individual, potentially, at different time phases, would demonstrate a behavior transition, implicating response to environmental stress. The bias seems unavoidable. However, it is also a key to animal research interest [59].

2.4. High-Dimentional Linearity of Feature Extraction

We here propose our generalized annotation framework shown in Figure 2, enabling a workflow of annotation algorithm design that is systematic and efficient. The approach includes feature extraction, selection, and behavior classification, and is designed to be transferable among various species. Although we examined in this experiment were the laying hens, there is flexibility follows from the fact that motion-based features extracted from sensor data are universally applicable; measurements of acceleration, angular velocity, and statistical time derivatives have proved useful in behavior classification for a variety of species, including sheep, dogs, and some types of wildlife [60,61,62]. The framework’s feature extraction methods capture basic movement behavior, and its labeling of behavior can be changed without altering the underlying methodology in order to suit different animals. The time-series data is extracted into high dimensional feature space with multiple statistical knowledge, including mean, standard deviation, variances, ENTROPY, moving average, and Pearson relationships combined linearly to provide the deeper informativeness to active learning. These features are detailed in Table 1.
Assuming that there are universally applicable motion-based features which can be fetched from sensor data (e.g., acceleration and angular velocity along the X-Y-Z axes) provides the generalizability across species. These traits of motion are not species-specific; they don’t represent unique biomechanical properties — they’re applicable to many animals. Whereas traditional methods are based upon species-specific behavior patterns, we explore feature abstraction, which ensures that the model learns general motion signatures instead of species-dependent features.
Additionally, active learning strategies utilized in this framework work in a species-independent manner, selecting informative samples based on probability distributions, instead of relying on prior knowledge of branch-specific behavior. So, the annotation process is data-driven uncertainty measures guided, which means that we will have the input of the most valuable and representative samples for performing the annotations, which gives efficiency while handling with accuracy. This decoupling of species-specific traits means the framework is scalable, flexible, and widely applicable to animal behavior research, decreasing the annotation burden for other animal studies, including precision livestock farming and wildlife surveillance.

3. Experiment Design

Data from sixteen laying hens were collected over four days—March 4, June 8, July 13, and July 20, 2020—between 10:00 a.m. and 4:00 p.m. Each day, a group of four individuals (weighing approximately 2112 g and aged between 61 and 75 weeks) was selected from each pen. We chose these four days specifically because laying hens among these days behaved higher mobility with more number of behavioral patterns never used in previous studies.
The primary device that accesses motion data is via a wearable device of a wireless inertial measurement unit. It contains a 3-axis accelerometer (19.62 m/s2 [2 G]) and 3-axis angular velocity sensor (500 degree/s) (i.e., gyroscope), marked as "TSDN151, 282 ATR-Promotions".
Another device is a camera placed on the inside box-top area, used to record video streams of broilers living in 100cm X 76cm cages, They are synchronized so that the annotator can thoroughly examine the animal’s behavior through a moment of videoframes and decide to annotate the sequences of sensor recordings of 1.28 sec.
The remaining environment-enrichment equipment, including a nest-box and a perch bridged at a higher position of the nest-box, a food pool, and a water pool placed aligned to the cage outward, they can be used to collect and distinguish data of various contexts, including pecking box, skipping to box from the ground, skipping from box to stretch, skipping down, eating with a lower posture, and drinking with a higher posture.
We stress that our annotation framework is designed for standardized and generalized annotation-efficient work, the annotation scenarios may vary in behavioral contexts introduced by animal-self and experimental operations. Therefore, we use 27-classes that, beyond other studies [63,64,65], where introduce more similar contexts (e.g. rest and standing), abnormal contexts (e.g., pecking others, pecking sensors, pecked by others), which is smaller in frequency but rigorously according to annotators’ multiple observations of targets and the conducted discussion afterward. Table 2. and Table 3. detail our 27- classes of broiler behaviors. We categorized the behaviors by frequency to better understand the variability and distribution of behavioral patterns observed in the hens. This categorization allows for a more nuanced analysis by differentiating between common, less frequent, and rare behaviors, enabling us to identify both typical and atypical behavioral trends. Additionally, by distinguishing between Common Behaviors, Less Frequent Behaviors, Rare Behaviors, Very Rare Behaviors, Uncommon Events, and Highly Rare Events, we could prioritize behaviors that are of greater interest for further analysis and modeling. This approach helps highlight key behaviors that may not be immediately apparent from an overall analysis of the data, ensuring a comprehensive study of the hens’ behavioral spectrum.

3.1. Simulation

There are 9081 samples of sixteen broilers labeled by experts as resources to simulate active learning, as we expect to validate the real efficiency through an array of querying strategies and classifiers, we define the basis of the simulation process as below:
  • Firstly, the whole dataset is separated into training and testing parts, as 70% (6356) vs 30% (2725), respectively.
  • Secondly, choose 1% of training (63) to learn our classifiers as the initial label pool, where the remaining 99%(2725) parts are regarded as unlabeled pool.
  • Thirdly, the batch size of 5, 10, 15, 20, 25, and 30 are the label frequencies to inform classifiers to update themselves and the informativeness rank of the unlabeled pool, which is viewed as an iteration of active learning.
  • Lastly, iteratively runs the active learning process to query the sample from the unlabeled pool into the labeled pool until the latter is exhausted.

3.2. Metrics

We use the A c c u r a c y and F 1 macro as our metrics, also, we recorded the time cost for running each iteration. In a multi-classification task, A c c u r a c y is viewed as an overall measure that is unable to inspect the model’s predictive capabilities on the minority classes, since the minority classes take a significantly small proportion. At the same time, the F 1 macro score can expose the model interpretability of minority classes and the generalizability. Considering both are suitable for our imbalanced 27-classes laying hens behavior dataset. They are defined as below:
  • True Positive ( T P ): The number of correctly predicted positive class sample.
  • False Positive ( F P ): The number of incorrectly predicted positive class.
  • True Negative ( T N ): The number of correctly predicted negative class sample.
  • False Negative ( F N ): The number of incorrectly predicted negative class sample.
A c c u r a c y = T P T P + F P + T N + F N
p r e c i s i o n = T P T P + F P
r e c a l l = T P T P + F N
The F 1 score for a class i:
F 1 - score i = 2 · Precision i · Recall i Precision i + Recall i
F 1 - macro score is to take the average of classes of number k:
F 1 - macro = i k F 1 - score i K

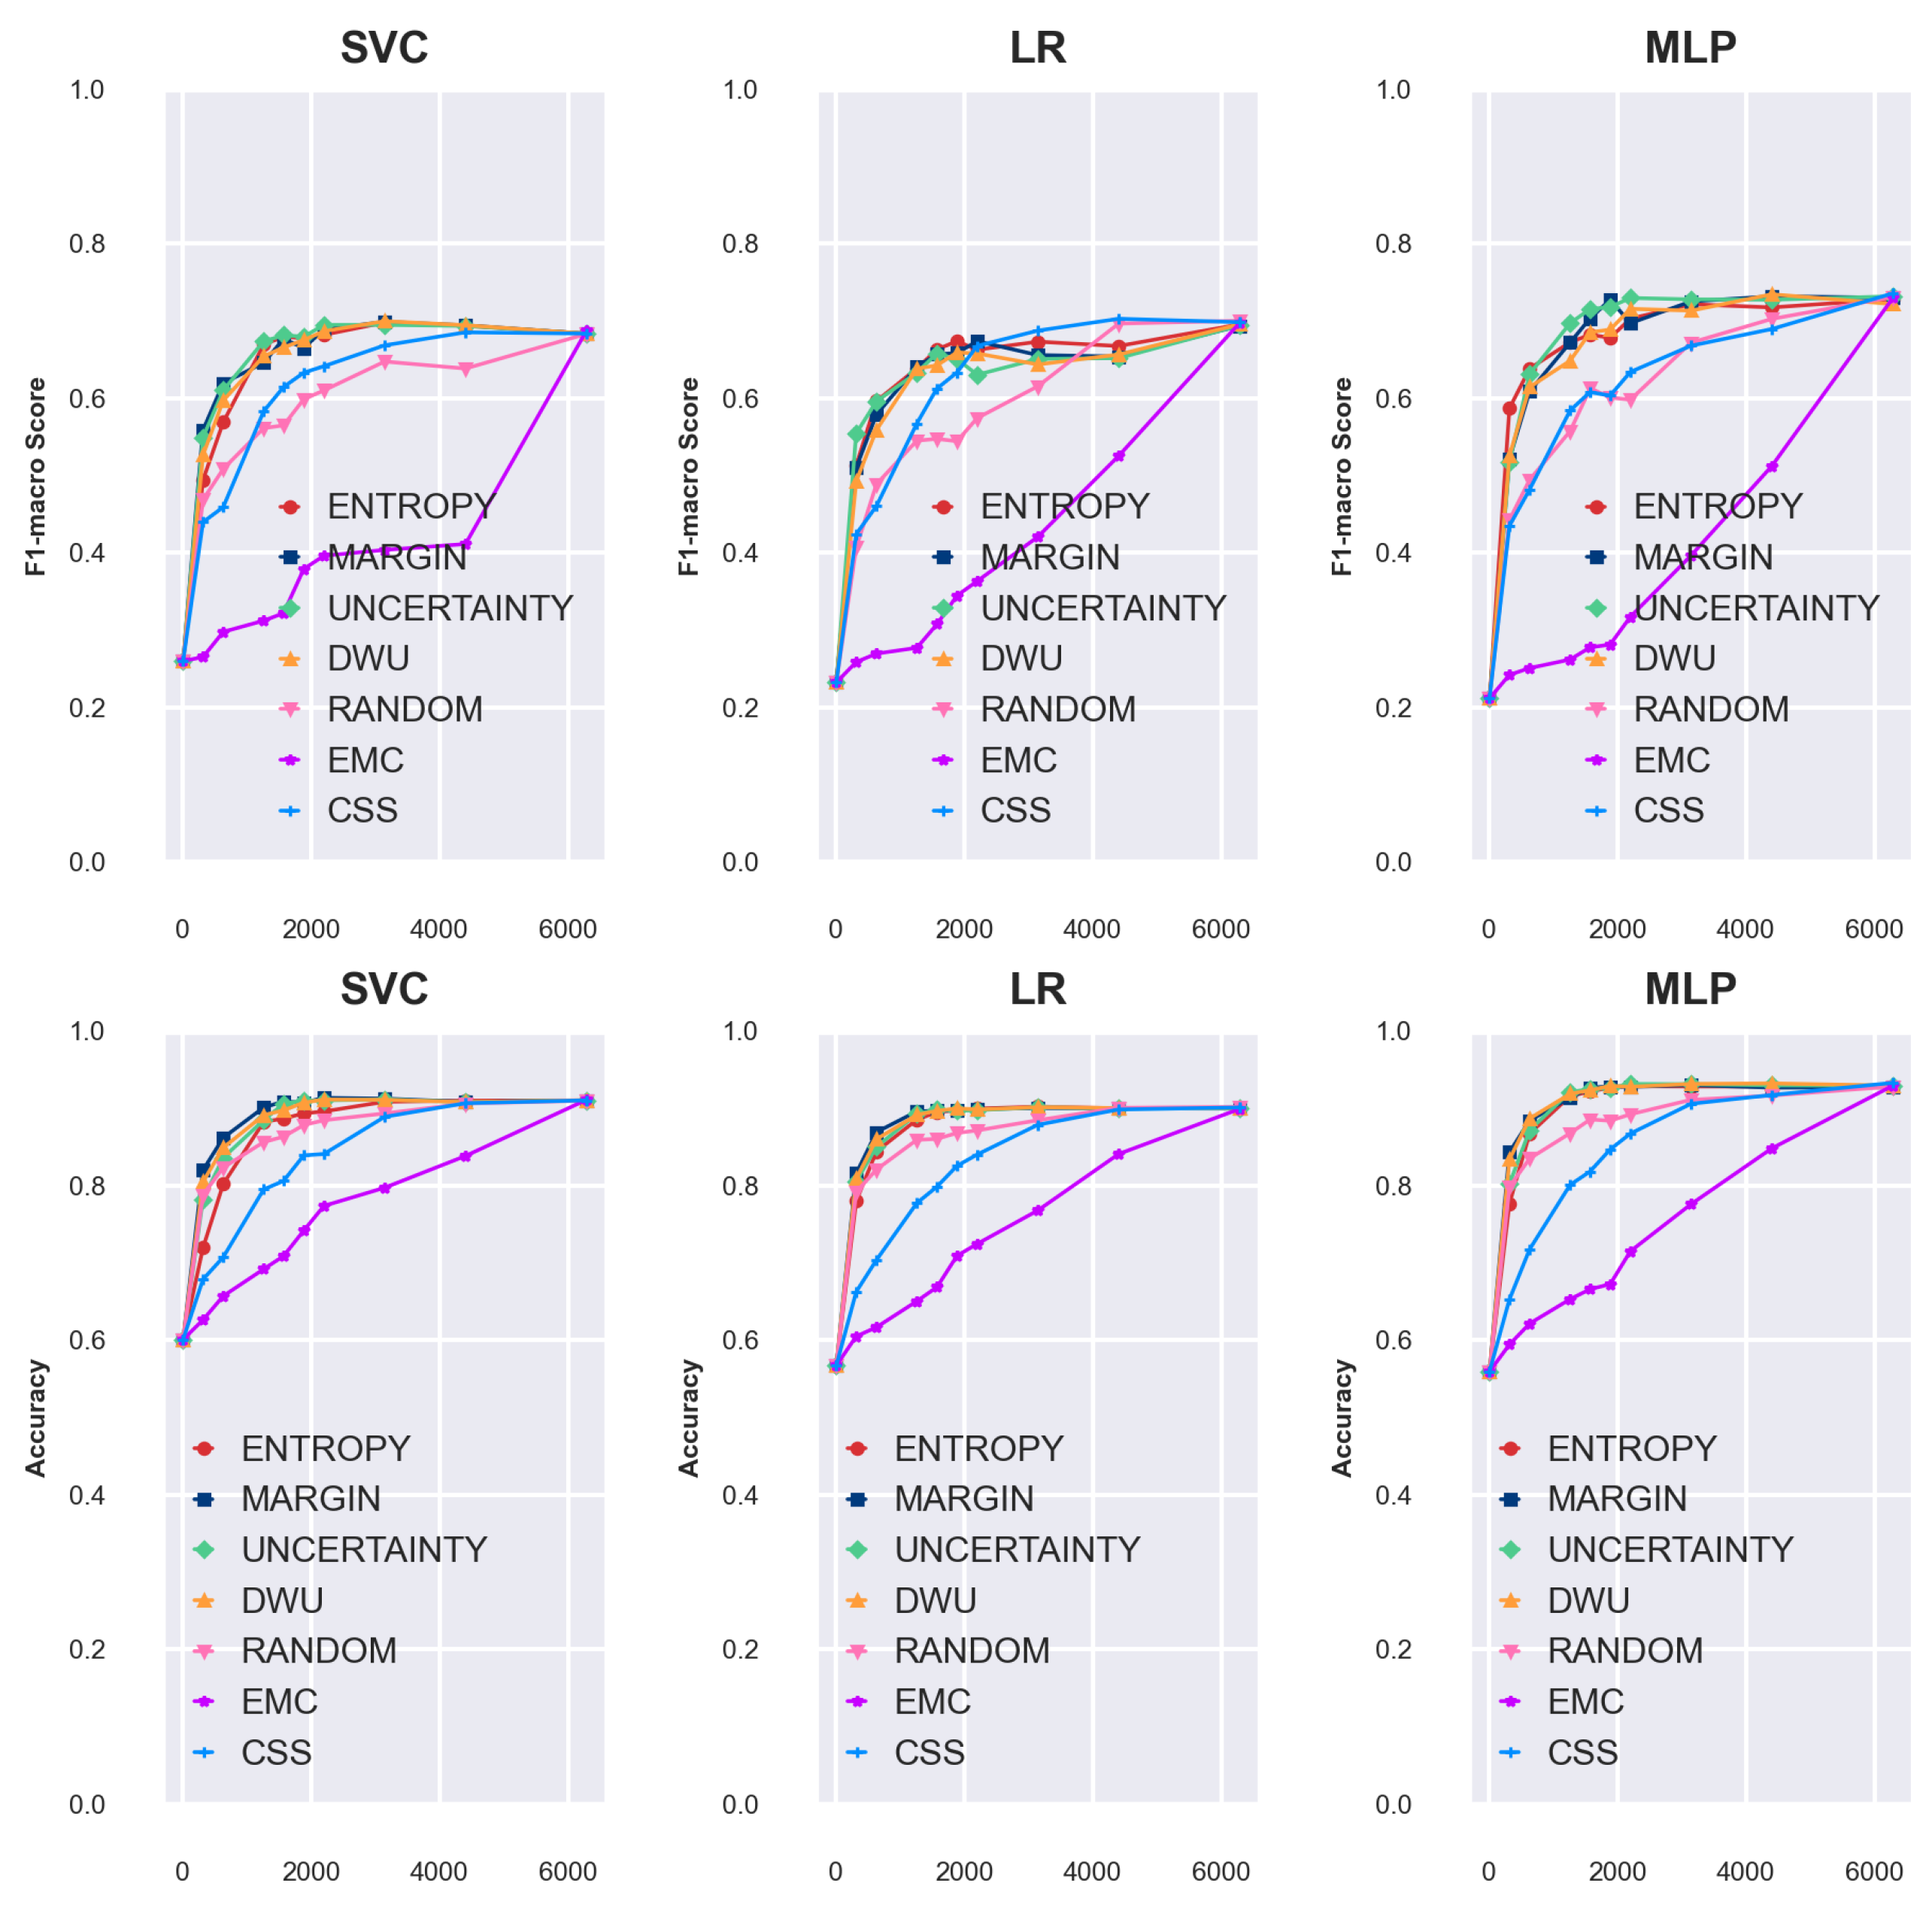
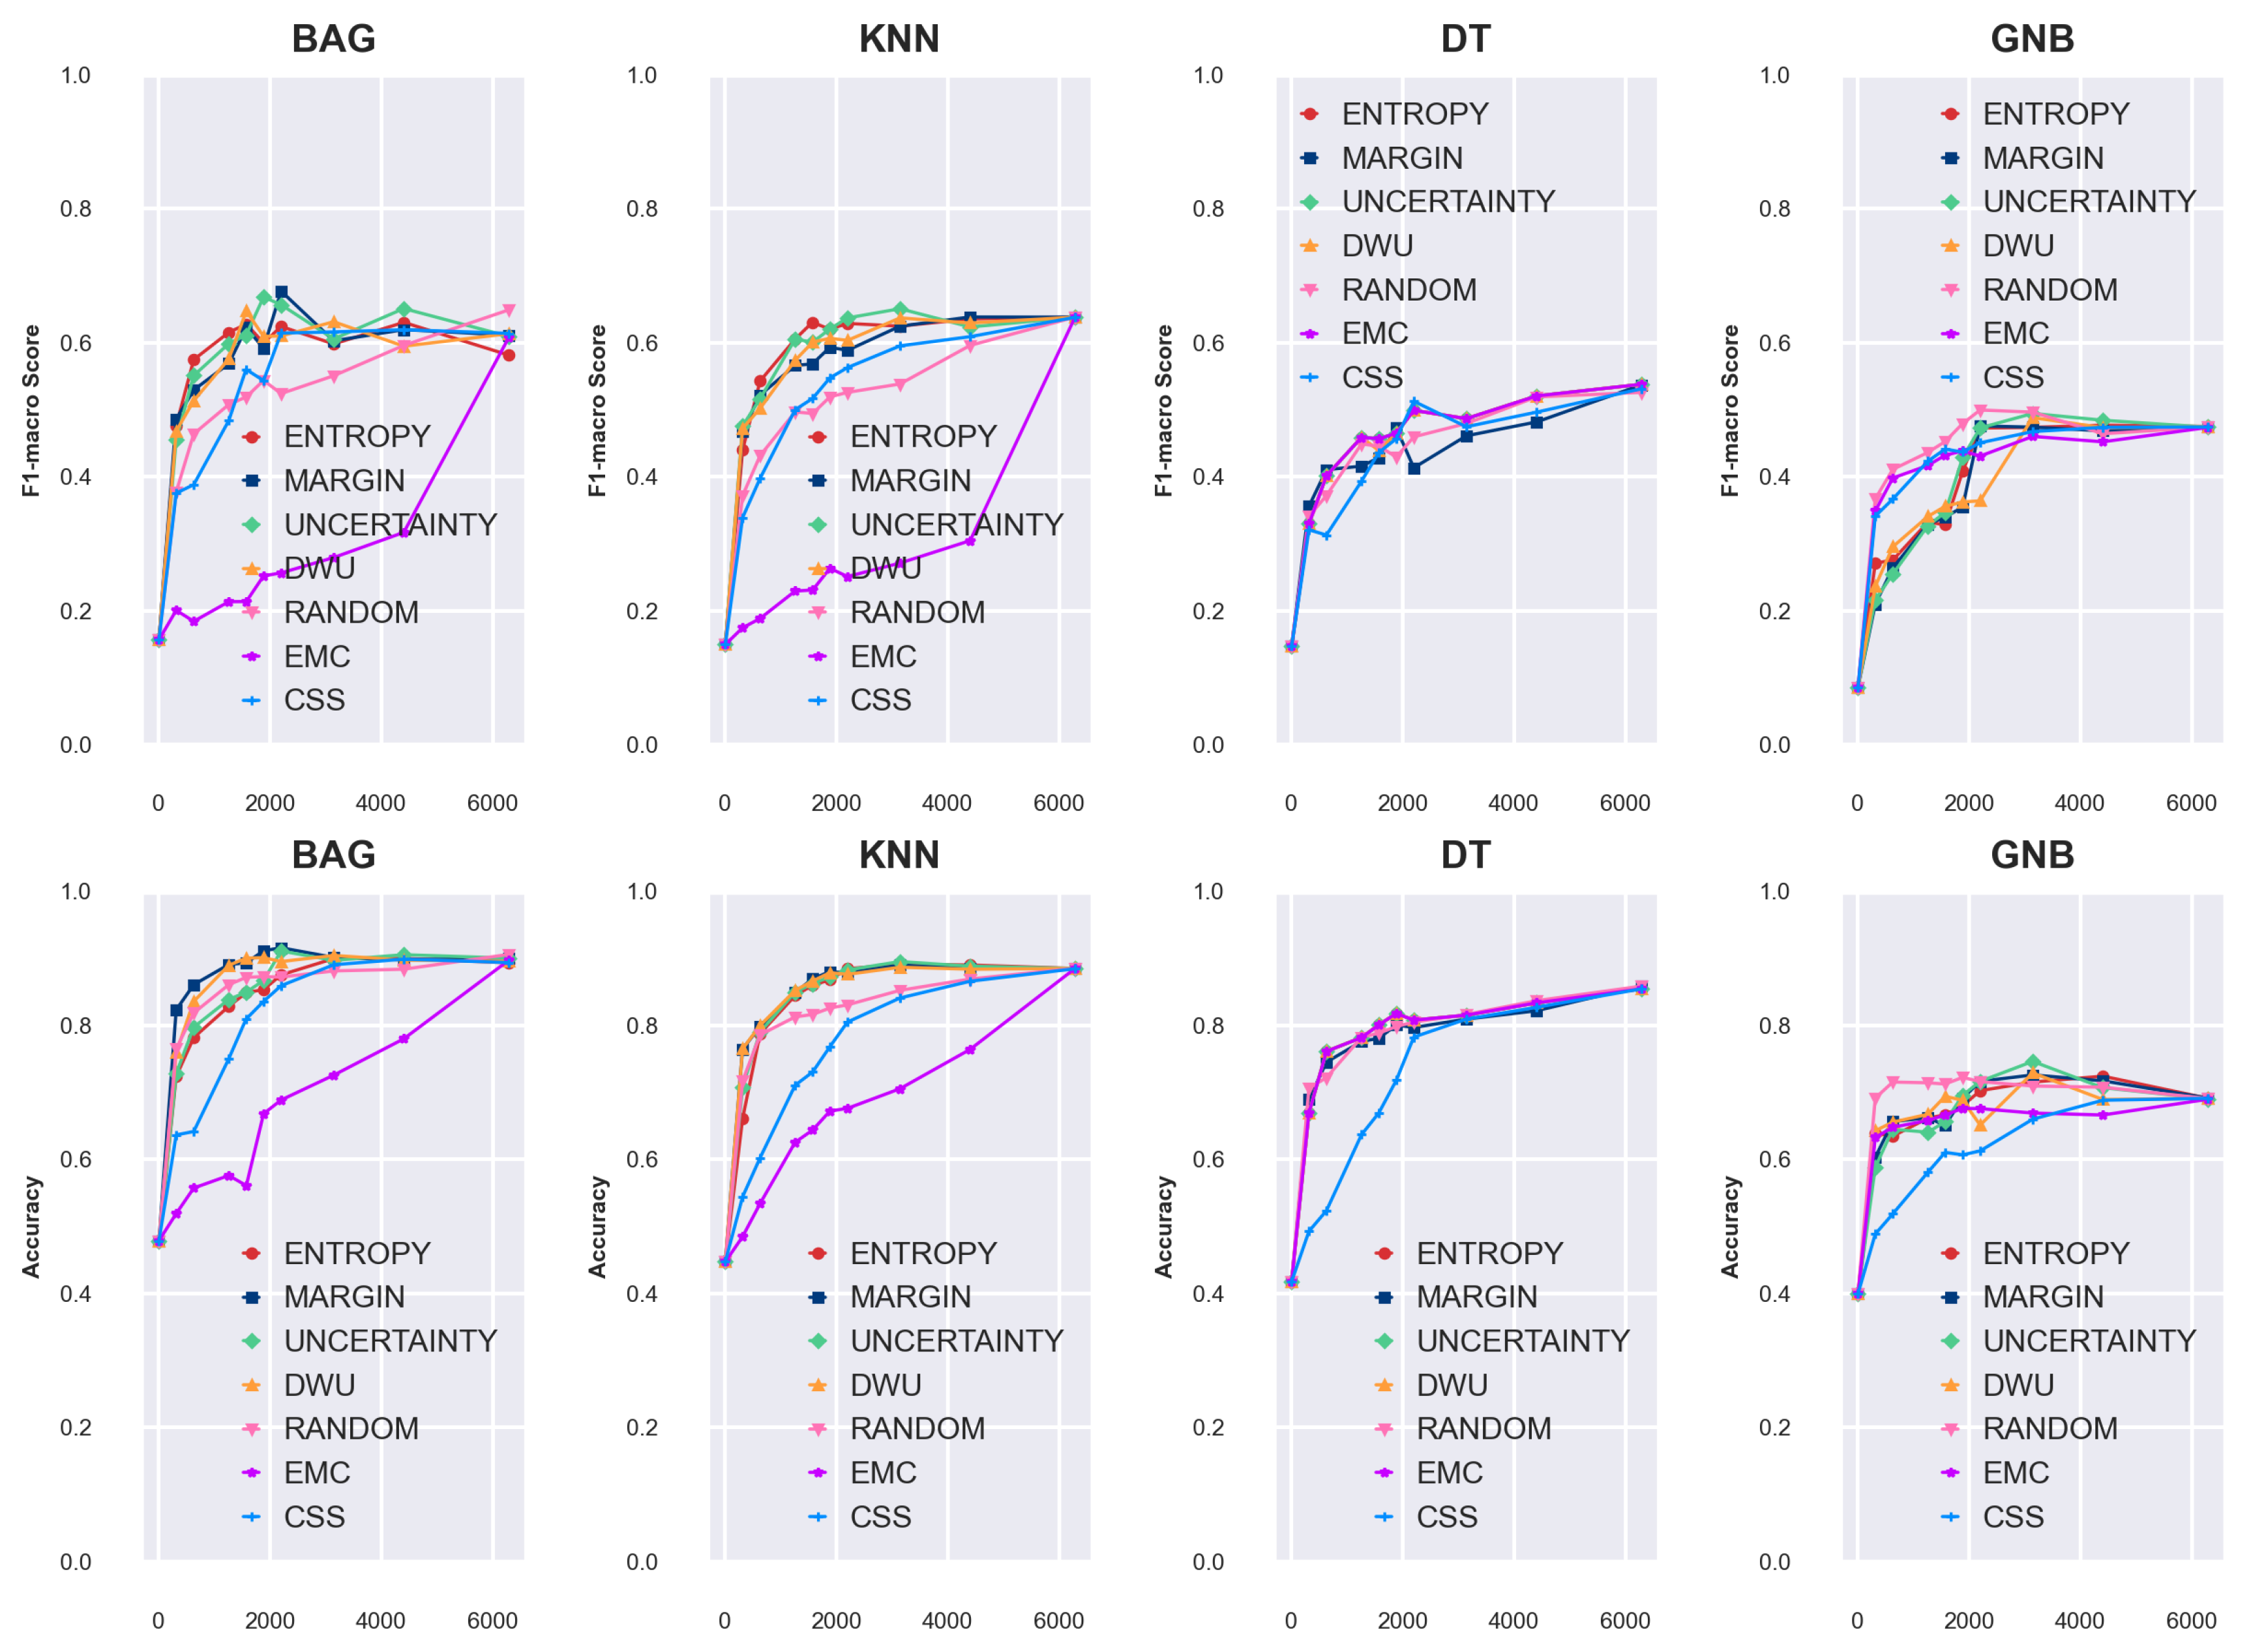
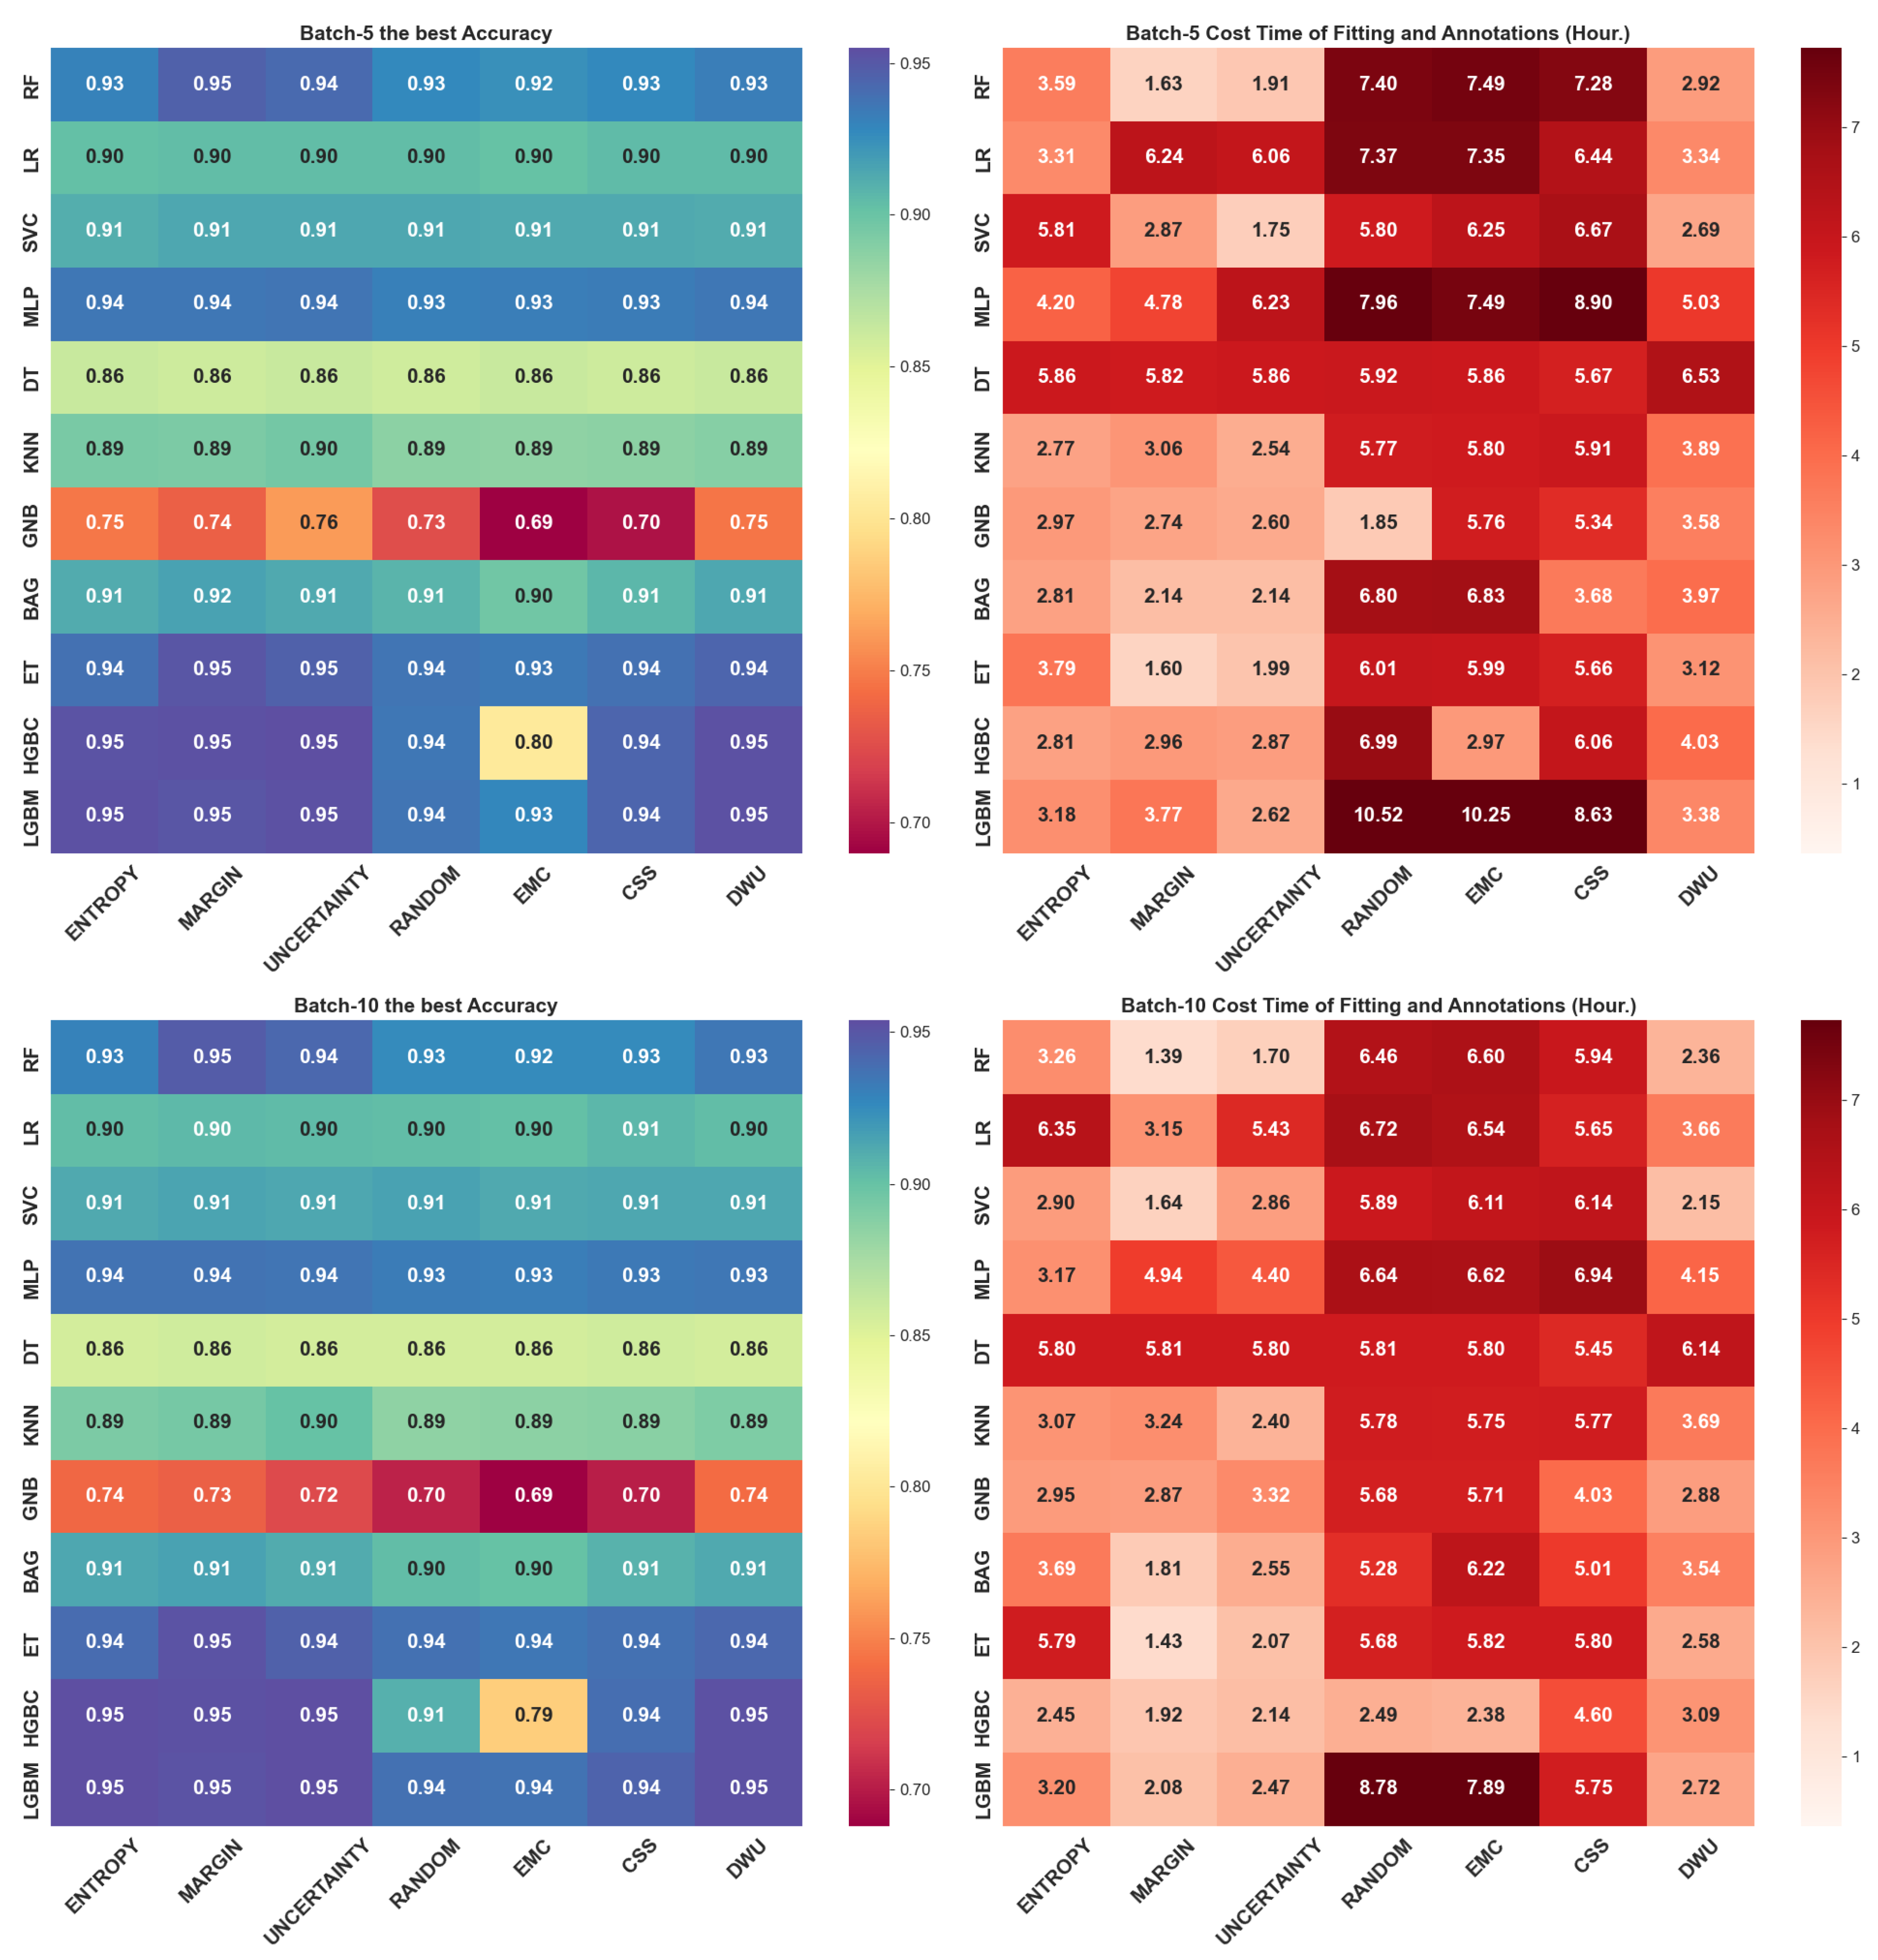
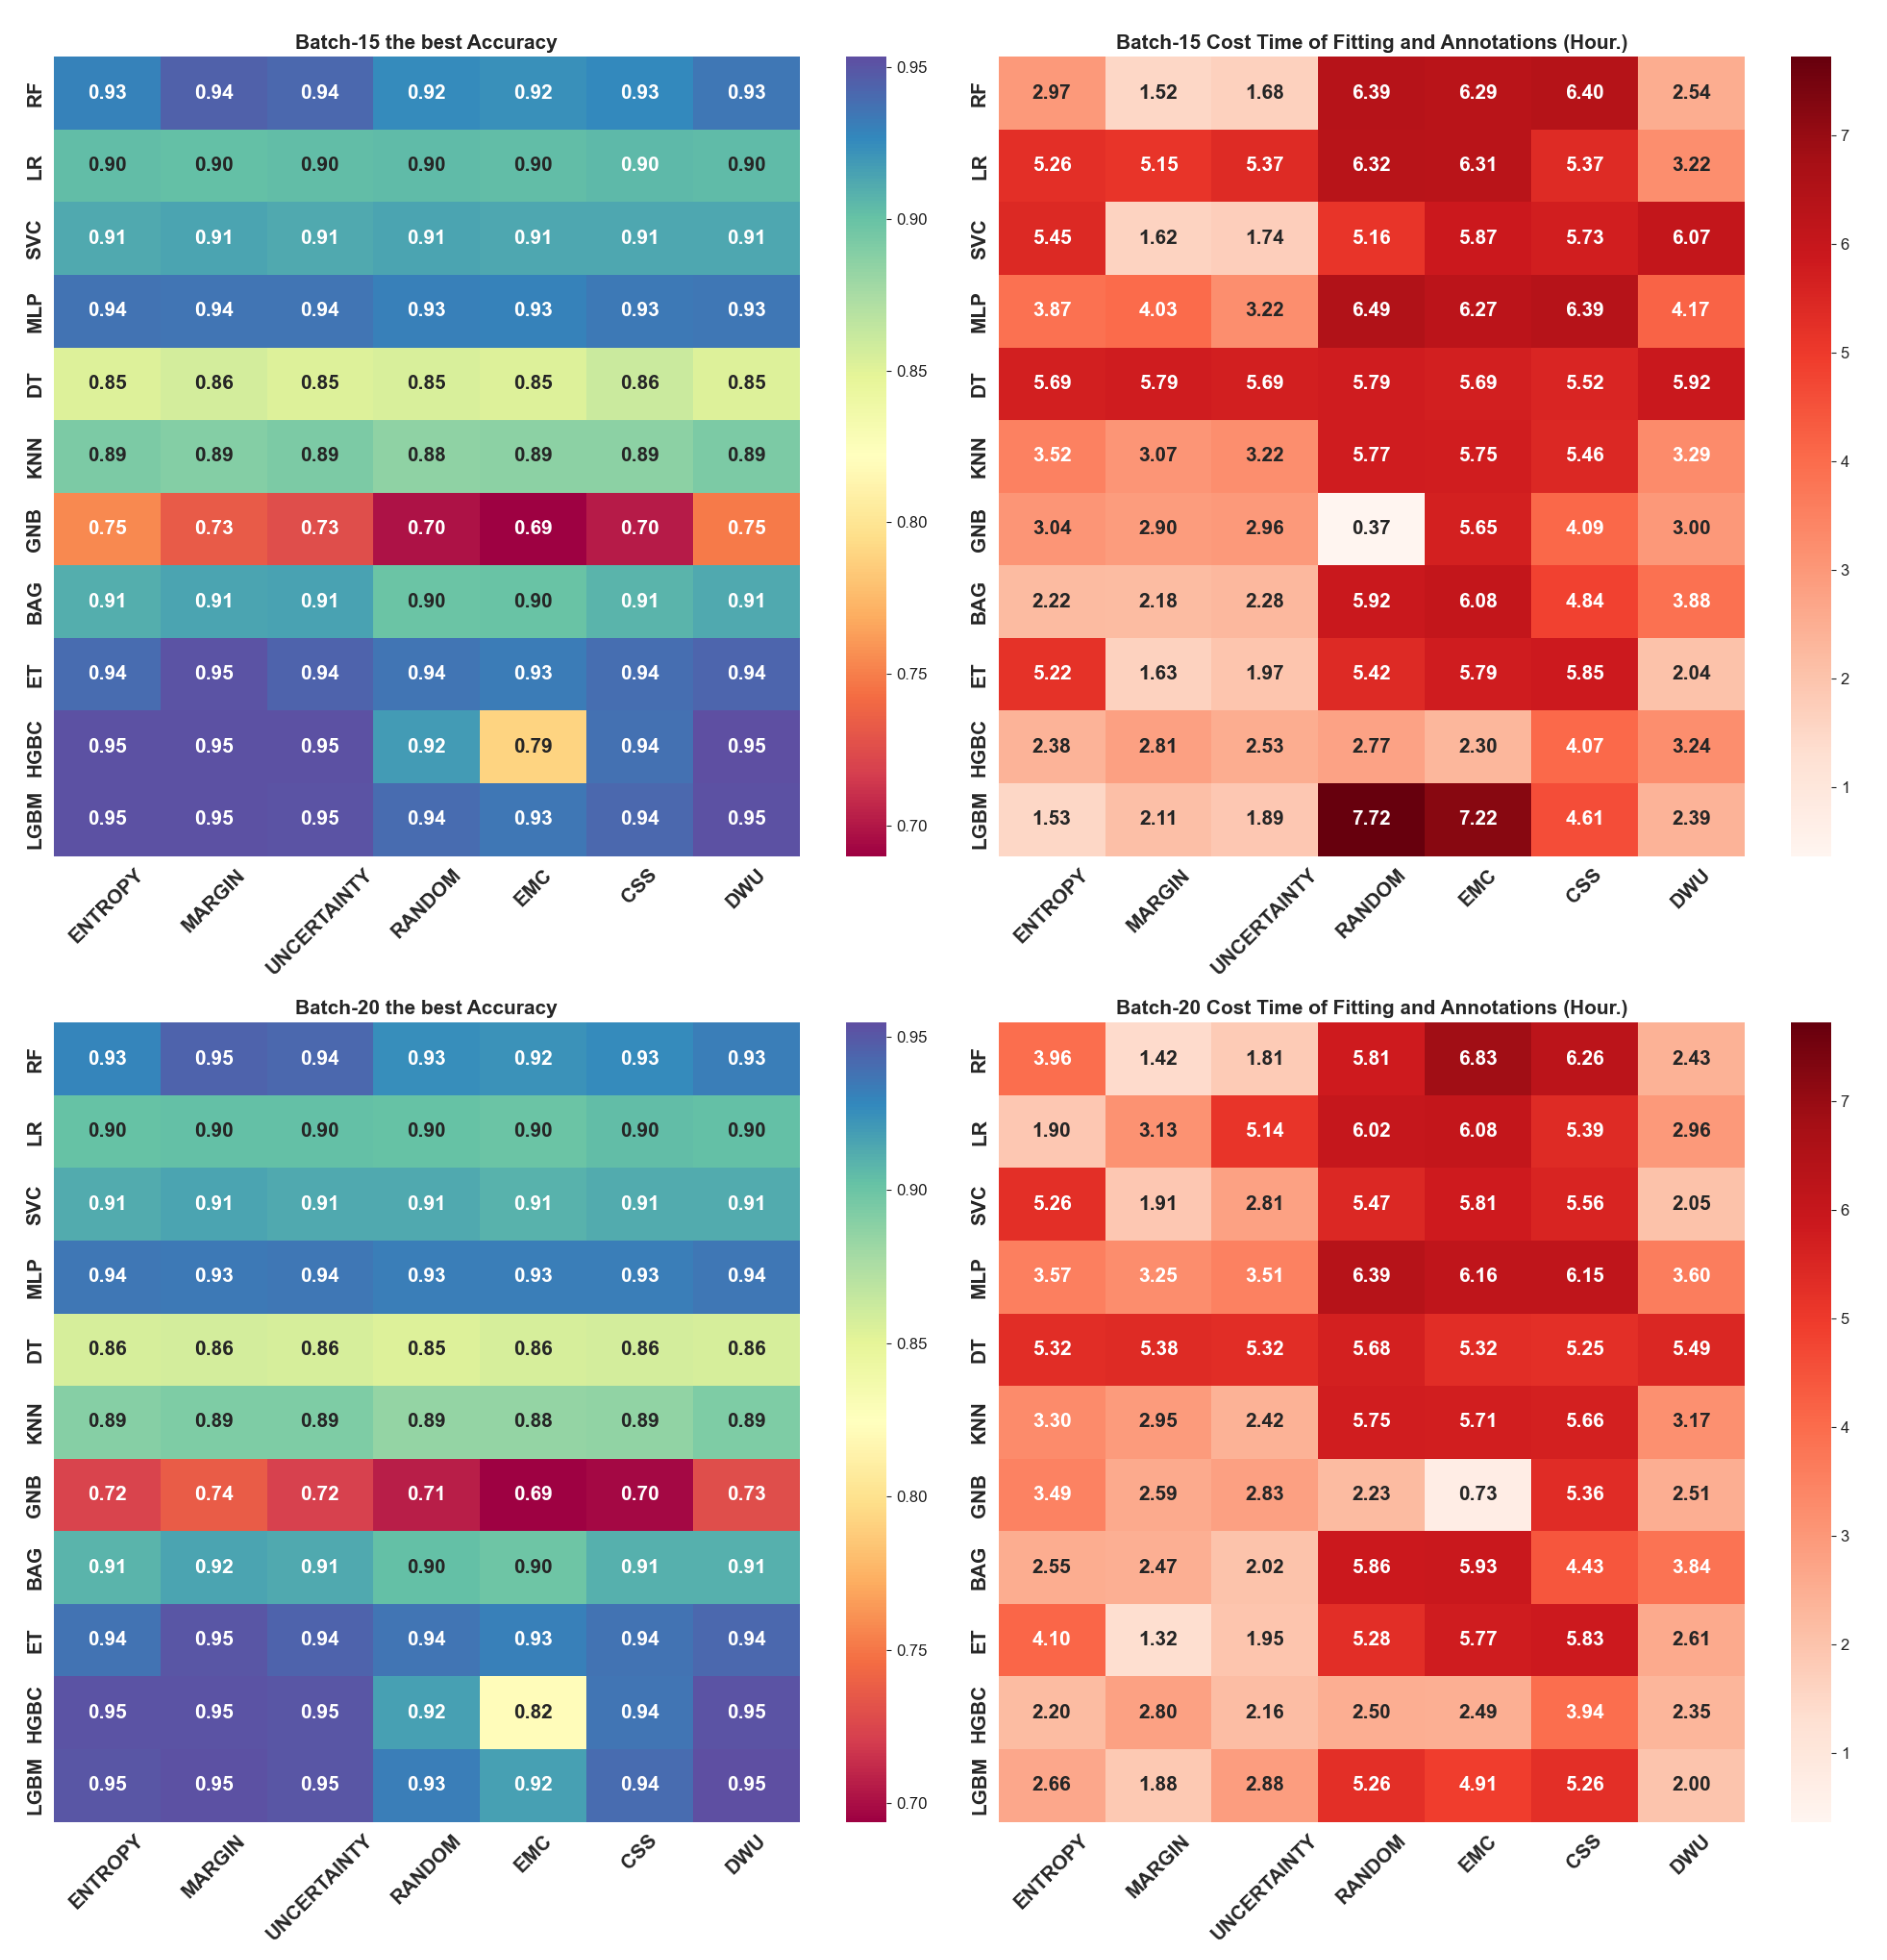
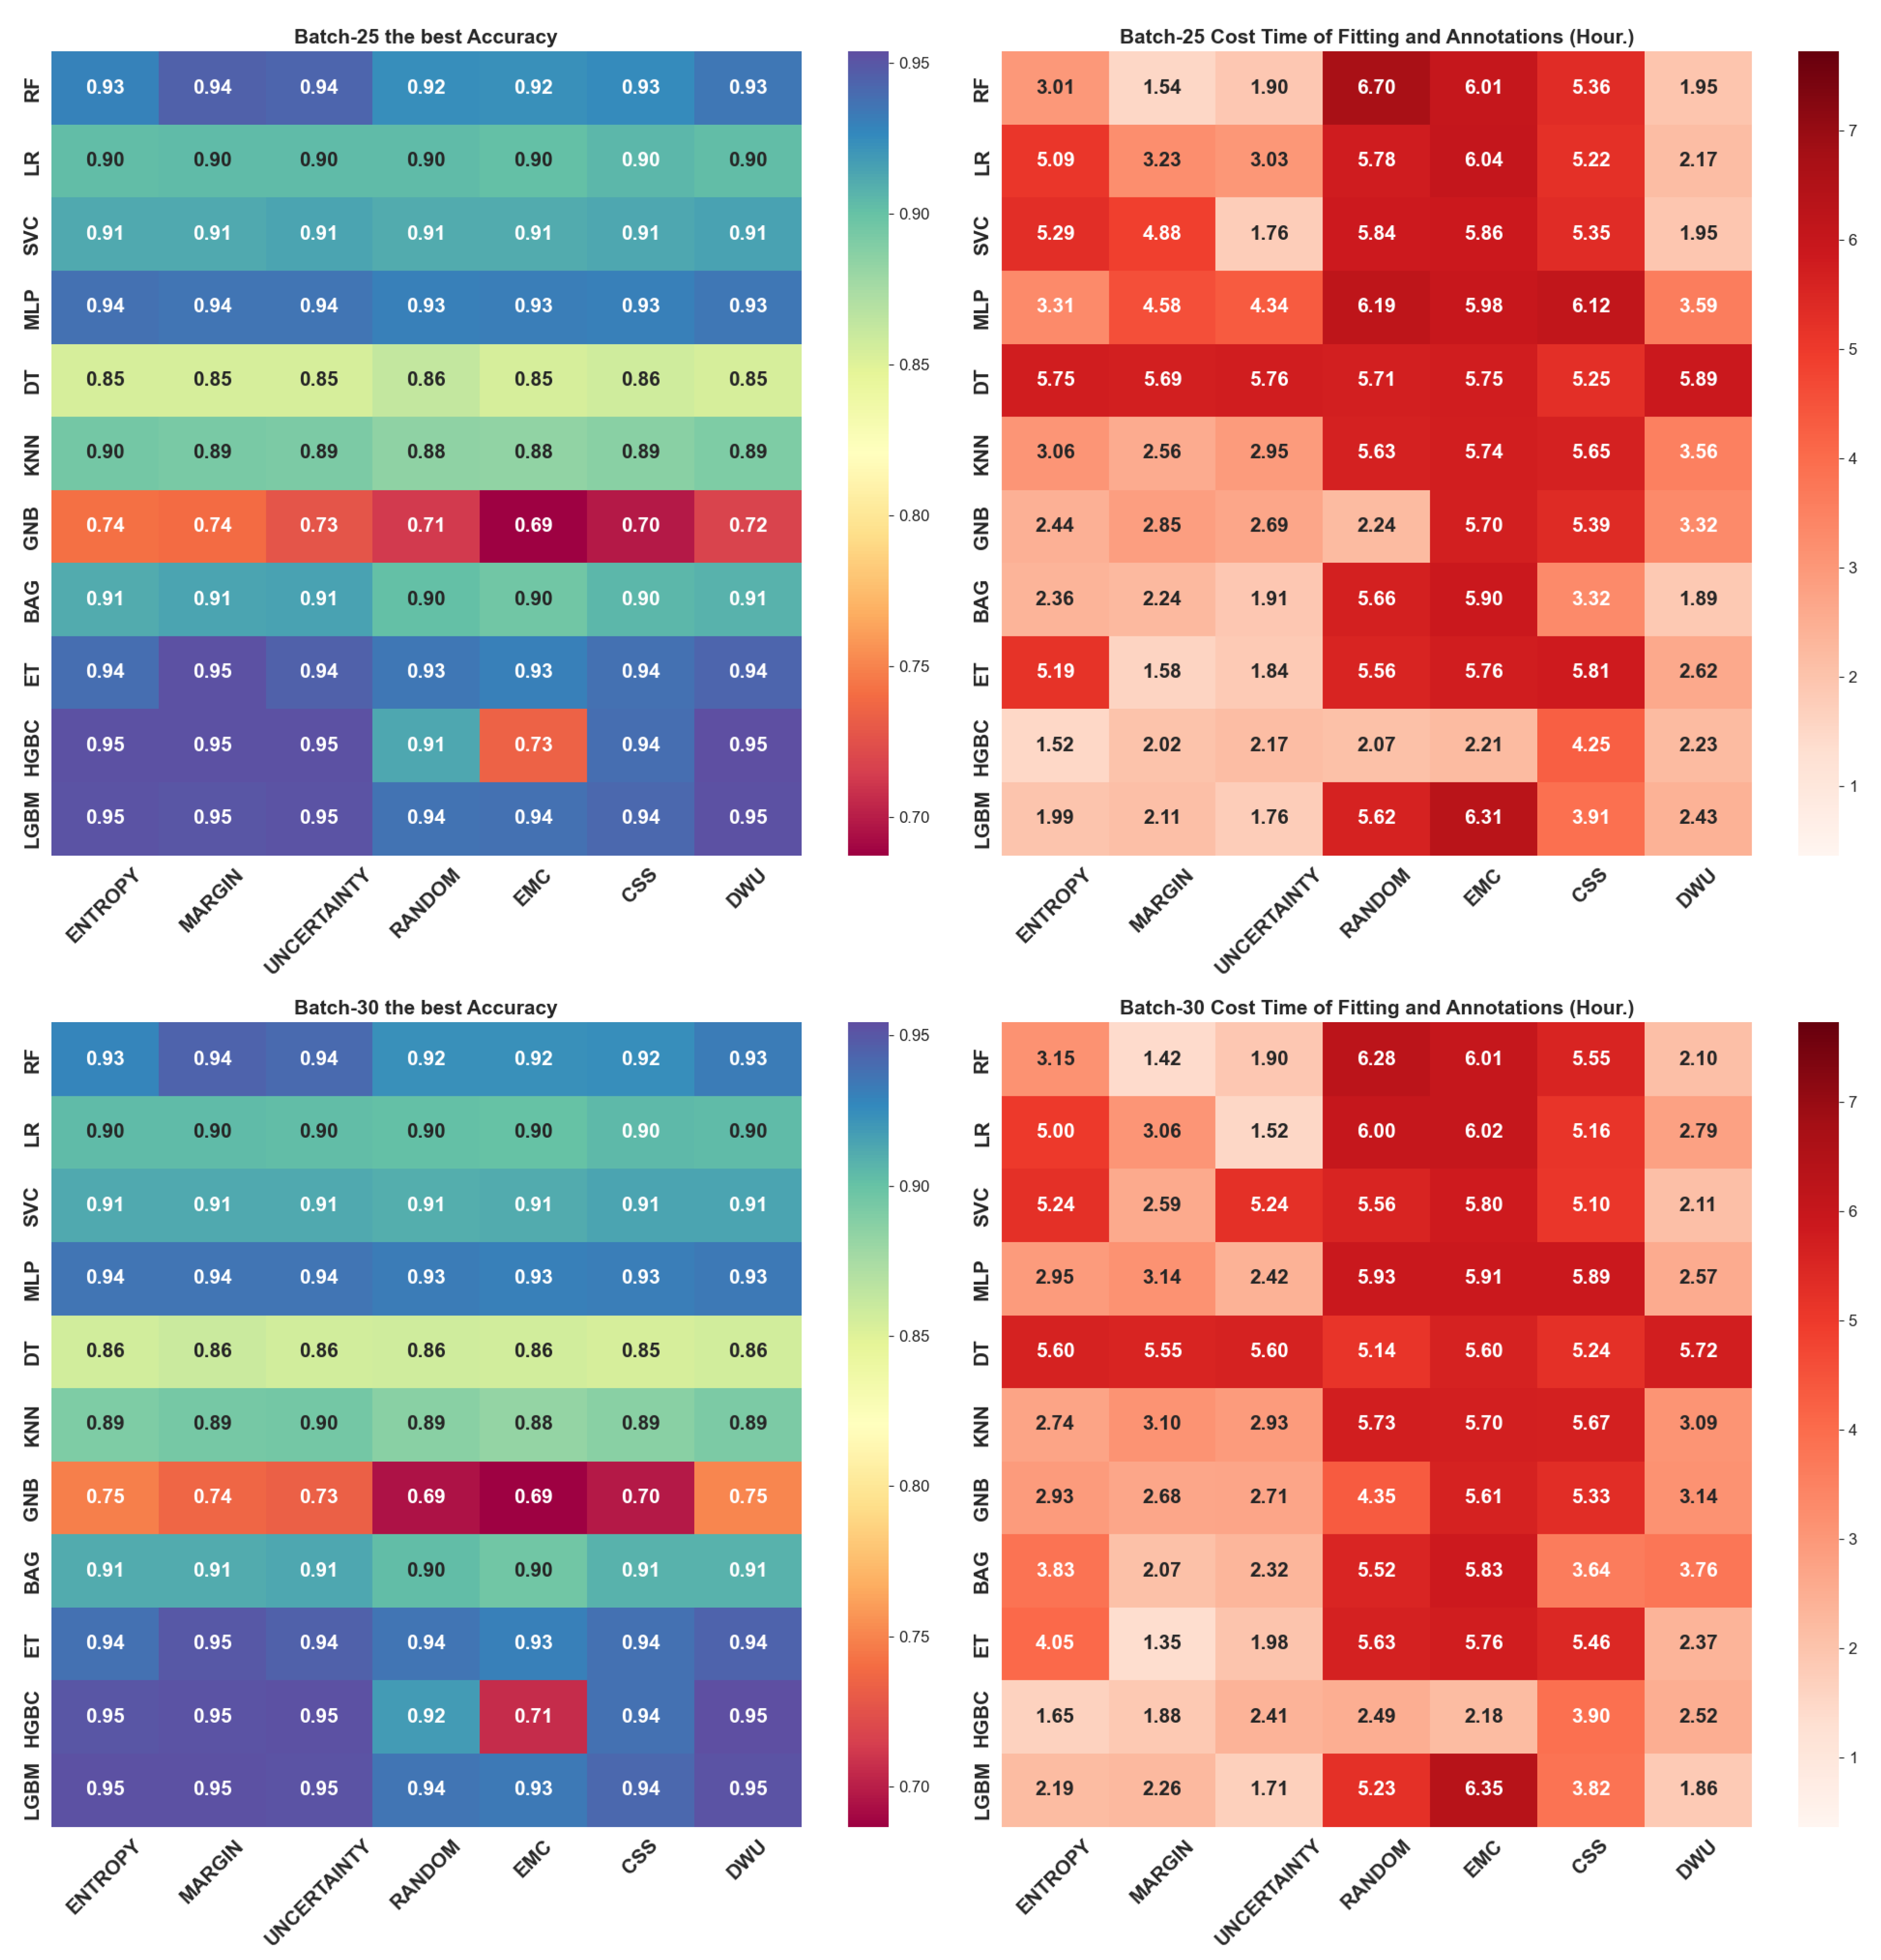
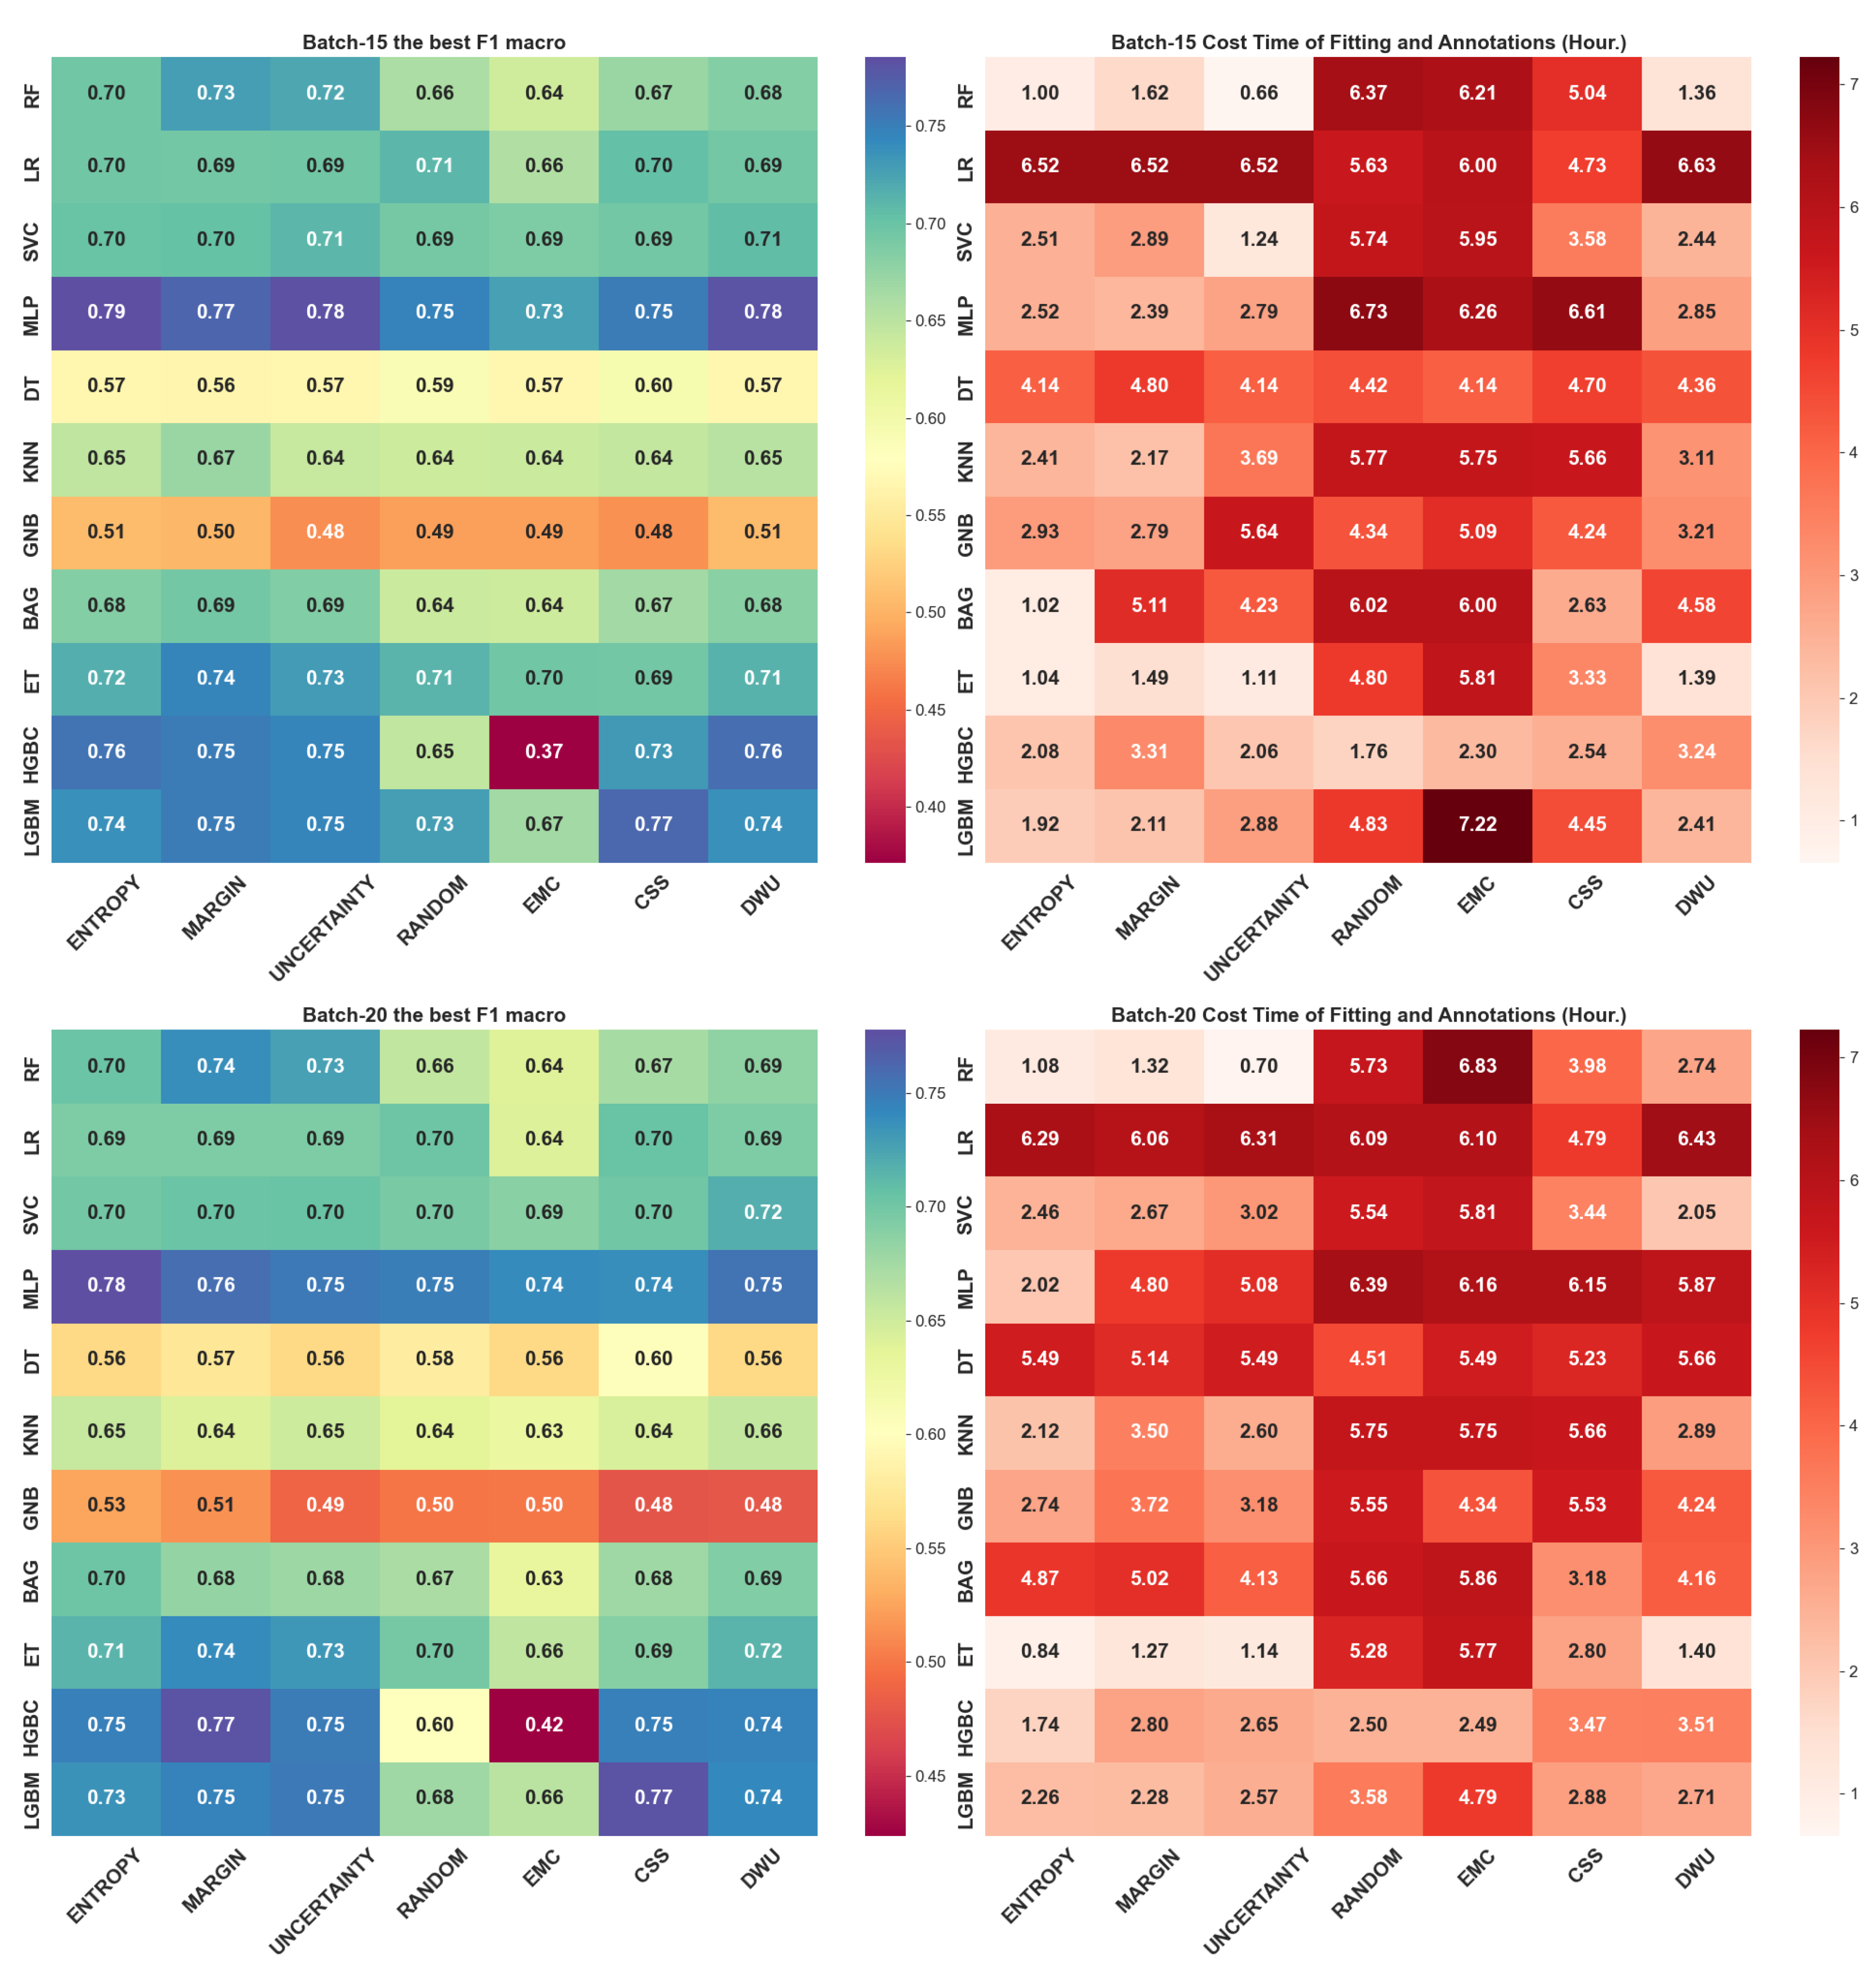
4. Experimental Results

As our goal is to deal with real-world animal behavior annotation scenarios using our generalized annotation framework, therefore, the referred mechanisms of the model optimization process were analyzed qualitatively. The 11-Classifiers (linear-SVC, LR, MLP, BAG, KNN, DT, GNB, ET, RF, HGBC, and LGBM) and 7-Active learning strategies (ENTROPY, MARGIN, UNCERTAINTY, RANDOM, EMC, CSS, and DWU) were carried out to provide us with valuable implications and findings.

4.1. Simulation of Batch Size 5

Based on the simulation described in Section 3.2. We adopted the additional parameters as
  • Active Learning: batch_size = 5
  • Data Split: random_state = 2021
  • Model : random_state = 42
  • Scaler Wrapping: Model would be wrapped with a preprocessing function of standardscaler before fitting, which is z = ( x u ) s , where the x represents feature vector, u is mean of the feature, and s is standard deviation of the feature.
As we split the dataset according to parameter setting, the seed data always maintain the same, this is crucial because the Random strategies and cluster-based strategies can be influenced significantly by initial seed data settings. Our DWU and CSS strategies, which query the structural information as analogous to cluster strategies, as prior study observed that applying active learning for document classification [66].
To demonstrate the overall performance of each pair qualitatively, we separate classifiers based on their learning curves into three levels: 1) O p t i m u m , 2) S u b o p t i m u m , and 3) I r r e g u l a r , based on their efficacy and resilience during the learning process.
In Figure 3, SVC, LR, and MLP drive ENTROPY, MARGIN, UNCERTAINTY, RANDOM, EMC, CSS, and DWU. We categorize these classifiers as " O p t i m u m " since they generate robust learning curves without degradation.
Our analysis shows that ENTROPY, UNCERTAINTY, MARGIN, and DWU outperform RANDOM, EMC, and CSS in terms of learning curves for both A c c u r a c y and F 1 - macro . DWU incorporates density into UNCERTAINTY; however, it performs worse than UNCERTAINTY and ENTROPY on F 1 - macro . In contrast, for A c c u r a c y , DWU surpasses ENTROPY in SVC, LR, and MLP. This suggests that DWU tends to query representative samples from high-density regions dominated by majority classes, thereby improving A c c u r a c y but inadvertently excluding minority-class instances, leading to lower F 1 - macro .
Furthermore, CSS outperforms RANDOM SAMPLING in SVC, LR, and MLP on F 1 - macro , indicating that CSS is more effective at capturing minority-class animal behaviors. Among all methods, EMC exhibits the weakest performance.
In Figure 4, ENTROPY, MARGIN, UNCERTAINTY, RANDOM, EMC, CSS, and DWU are driven by BAG, KNN, DT, and GNB. We classify these models as " S u b o p t i m u m " since their learning curves perform worse than those of the " O p t i m u m " group on F 1 - macro , which we attribute to the weaker performance of the models themselves. Interestingly, in contrast to the " O p t i m u m " classifiers, CSS behaves inconsistently on BAG and KNN. When comparing CSS with RANDOM SAMPLING, CSS is superior in F 1 - macro but inferior in A c c u r a c y . This suggests that CSS effectively explores minority classes, enhancing F 1 - macro , but at the expense of querying majority-class instances, thereby reducing overall A c c u r a c y .
In Figure 5, ENTROPY, MARGIN, UNCERTAINTY, RANDOM, EMC, CSS, and DWU are driven by ET, RF, HGBC, and LGBM, which we categorize as " I r r e g u l a r " due to their learning curves exhibiting severe or slight declines after reaching peak performance. A slight decline in F 1 - macro was observed for both ET and RF after 2000 queries. However, after an initial drop, their curves stabilized and flattened. In contrast, HGBC and LGBM experienced drastic declines with extreme volatility, leading to unreliable predictions. This instability may stem from the inherent characteristics of ensemble models, where ET and RF outperform the boosting-based models HGBC and LGBM.
Beyond enhancing active learning efficiency, these strategies also help mitigate redundancy among data points. The best A c c u r a c y , F 1 - macro , and their respective stopping points are presented in Table 5 and Table 4.
Table 5 presents the highest achieved A c c u r a c y for each model-strategy combination. The best-performing pairs were LGBM & UNCERTAINTY, achieving 0.953 at 1470 annotation points, and HGBC & DWU, achieving 0.953 at 1710 annotation points. However, as shown in Figure 5, their learning curves exhibited severe perturbations after reaching their peak performance. In contrast, ET & MARGIN and RF & MARGIN showed only slight perturbations in Figure 5, achieving 0.952 at 1685 and 0.946 at 1495 annotation points, respectively. Meanwhile, for DT, all strategies failed under large annotation volumes, nearly exhausting the unlabeled pool to reach a maximum A c c u r a c y of 0.86.
Table 4 compares the highest achieved F1-score across different model-strategy pairs. The best-performing combination was MLP & UNCERTAINTY, achieving 0.778 at 2440 annotation points, followed by HGBC & DWU with 0.770 at 2355. Other notable results include:
  • LGBM & ENTROPY: 0.773 at 3160 annotation points
  • ET & MARGIN: 0.756 at 1515 annotation points
  • RF & MARGIN: 0.746 at 1310 annotation points
Once again, DT exhibited the worst performance across all strategies. However, CSS provided some improvement, helping DT achieve 0.614 at 5080 annotation points, indicating that CSS can aid in identifying minority-class behaviors in broiler data to some extent.

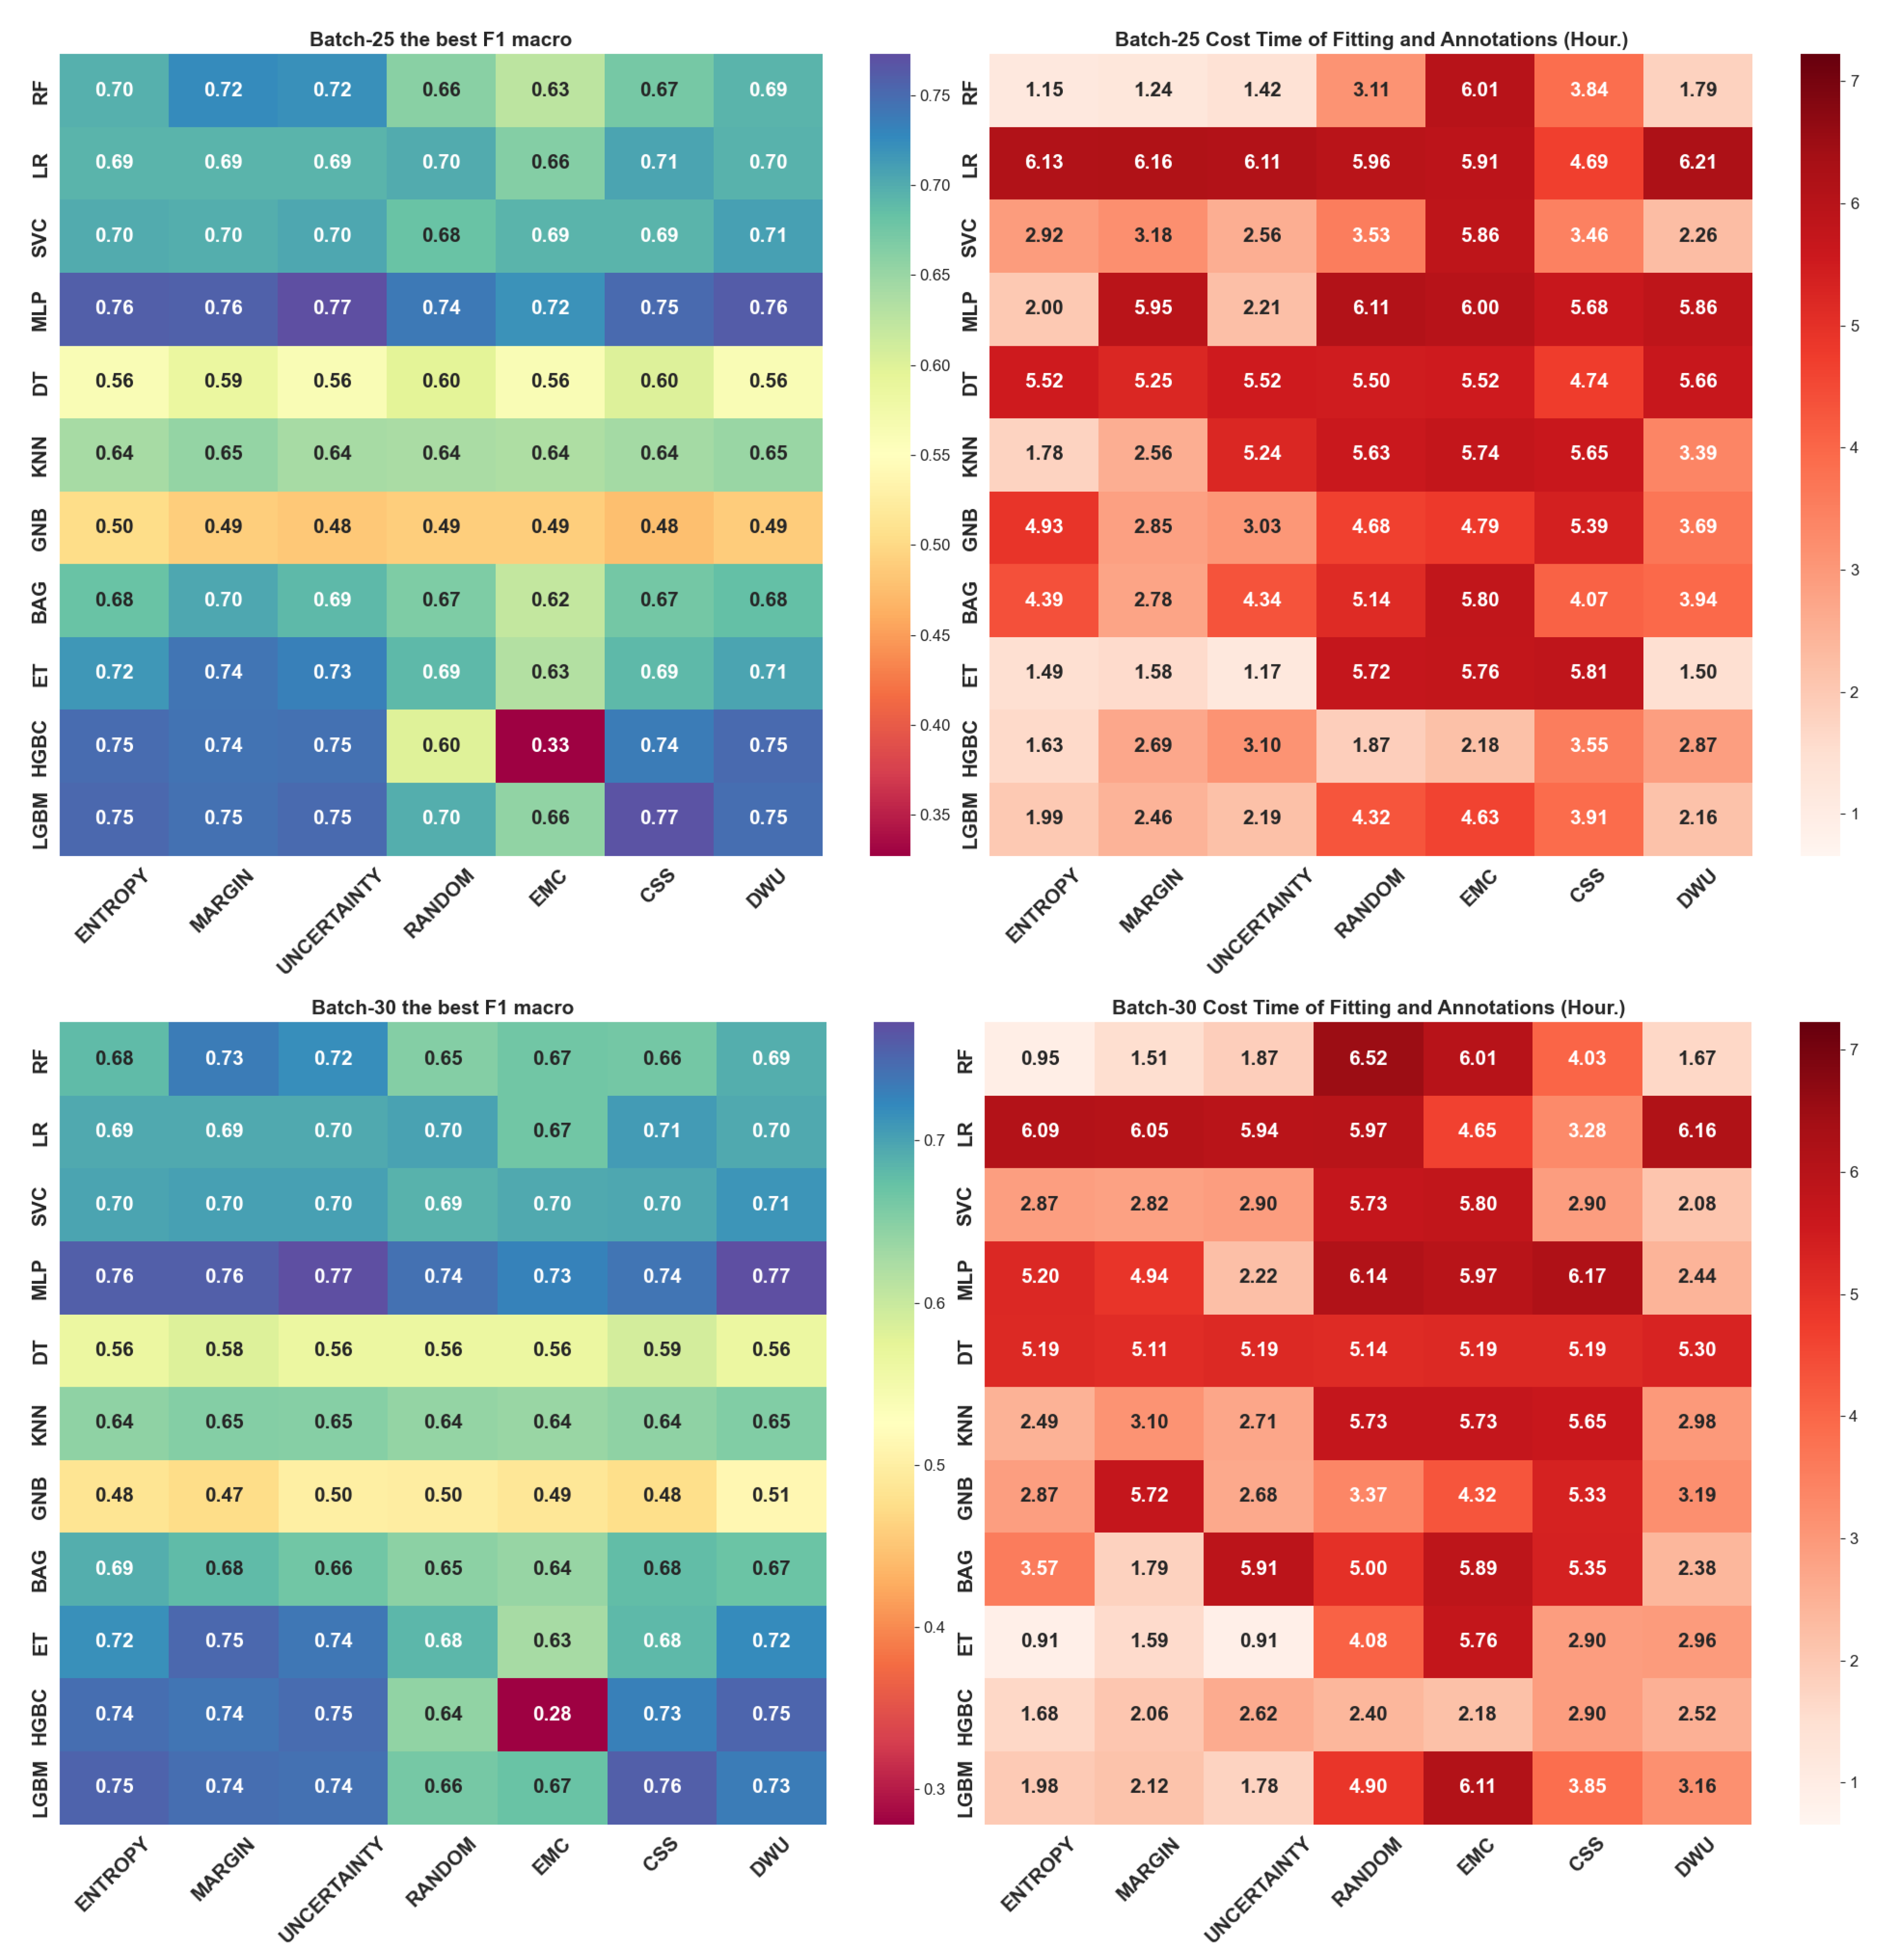
4.2. Query Batch Size Effect

Given the challenge of optimizing active learning, approaches can be categorized as aggressive or conservative, depending on whether they prioritize maximizing efficiency or optimizing performance through algorithmic complexity [67]. However, less attention has been given to the learning process itself when considering a more calibrated cost metric.
Active learning inherently involves two complementary processes: exploiting existing knowledge and exploring new patterns within the data distribution. To analyze these dynamics, we examine the effects of different batch sizes and introduce real-time annotation cost at the best performance point across different classifier-strategy pairs.
While the larger query batch size hinder exploitation but enhance exploration, smaller batch sizes hinder exploration but facilitate exploitation. To quantify annotation cost, we assume 3.28 seconds per annotation, comprising 1.28 seconds per sample plus 2 seconds for expert label verification. For instance, if a classifier stops at 1000 annotation points, the real-time cost is computed as:
"1000 * 3.28 + model fitting time" "1000 * 3.28 + model fitting time" The results presented in Figure 6, Figure 7, and Figure 8 illustrate the effects of progressively increasing batch sizes on accuracy, while Figure 9, Figure 10, and Figure 11 present their impact on F1-macro score.
Generally, larger batch sizes lead to a slight performance drop (approximately 0.01 to 0.02); however, this trade-off significantly reduces annotation time, as reflected in the gradual fading of the heatmap colors—particularly when comparing batch size 5 vs. batch size 30 from Figure 6 and Figure 8, and also, Figure 9 and Figure 11.
In most cases, ENTROPY, MARGIN, and UNCERTAINTY consistently outperform RANDOM, EMC, CSS, and DWU. Furthermore, ensemble classifiers—including ET, RF, LGBM, and HGBC—demonstrated remarkable efficiency and performance under the 3.28-second annotation assumption, underscoring their effectiveness in balancing exploitation and exploration. However, as seen in Figure 5, these classifiers were affected by perturbations to varying degrees.

5. Discussion

5.1. Discussion-Hybird of Diversity, Representativeness and Density

We made a comprehensive evaluation among combinations of Classifiers & Active learning to interpret and promote a light annotation framework, the key principle is to leveraging the feature engineering to transfer enriched knowledge of origin for active learning, so that the complex algorithmic design in query strategies would become unnecessary, where other animal species would be proposed as we depicted our framework in Fig. Figure 2, We propose the high-dimensional feature engineering forms containing linear, non-linear, radial, time-domain, and frequency-domain analyses, which also can be found in our previous studies focusing on laying hens [32,33].
We found that simple designed query strategies such as Entropy, Uncertainty, and Margin tend to take absolute superiority in both convergence efficiency and final predictive capability in most cases. The ensemble classifiers exhibited decreasing performance in learning curves, with LightGBM (LGBM) and HistGradientBoostingClassifier (HGBC) showing severe instability, while Random Forest (RF) and ExtraTrees (ET) classifiers returned to stability, nevertheless, they have exhibited impressive predictive performance and efficiency outperform the others, which indicates that a boosting-specific stopping criterion that can recognize the peak of performance is crucial.
When 11-Classifiers querying samples aggressively, by increasing the batch size from 5 to 30, the exploring efficiency can be boosted obviously with slight performance declinement around 0.01 for sacrifice. We adopted 11-Classifiers for simulation based on the same initial pool setting [66]. While some may argue that our results lack sufficient experimental evidence to support the general-purpose application of our generalized annotation framework for animal behavior annotation, we believe that active learning—where multiple models are trained at each update—can be viewed as a series of iterative experiments. At each step, the sample introduced into the labeled space represents an initial stage of learning, with each subsequent training session acting as a new "shuffle experiment." This process is influenced by the initial seed data, which impacts the final outcomes of the active learning process.
When we looking at recent studies of active learning, there are versatile techniques integrated into searching diversity, representativeness and density from data distribution space [68,69,70,71,72]. Most of them focusing on the algorithmic design and have achieved the state-of-the-art performances. The primary objective of machine learning is to drive the models to thoroughly learn the knowledge offered by data distribution and be able to extending the generalizability on the unseen dataset, where the primary objective of active learning is seeking for the points where the machine learning can be converged efficienly and precisely.
Study also poses that exploring and exploiting are two faces of active learning [67]. For exploiting, the boundary-closing samples are the typically similiarly confusing but informative if they could be exploited by the vehicle of classifiers, therefore, the key notions such as UNCERTAINTY or disagreement have been emerged as an essential aspect of active learning.
In previous studies comparing QBC and 3-uncertainty strategies, QBC generally take the advantage [73]. However, if we comprehense the mechanism that QBC leveraging multiple classifiers’ vote disagreements to perform classifications, there could be an analogous mechanism when integrating UNCERTAINTY into RF, since RF consisted of multiple weak classifiers, their posterior probabilities calculated by vote of each, and to the results, under the setting of batch size 5, in Figure 6 and Figure 9, RF with least confidence, MARGIN, and ENTROPY have achieved relative satisifying outcomes if considering the efficiency.
This study offers valuable insights for generalizing annotation tasks when selecting classifiers across diverse contexts. Specifically, in animal behavior recognition, the context can vary significantly because the behavioral classes are often mixed due to the spontaneous nature of animal actions. This leads to complex scenarios involving imbalanced and long-tailed data distributions. The Density-Weighted Uncertainty (DWU) method presents a versatile active learning paradigm. It is particularly effective for identifying representative samples, as it can improve accuracy more than UNCERTAINTY-based methods alone in certain cases. However, the Core-Set-Score (CSS) method, designed primarily for enhancing diversity, outperforms RANDOM SAMPLING strategies by better exploring minority classes. This approach is especially valuable for uncovering rare or scarce patterns in animal behaviors.

5.2. Supporting Artificial Neural Network

Deep learning, as an advanced version of Artificial Neural Networks (ANN), can learn complex non-linear relationships from data, and promoting higher generalizability on unseen datasets. However, their predictive capability relies on updating parameters based on learning from a large volume of annotated data. In the interdisciplinary field of animal behavior and deep learning, a major challenge is the shortage of well-annotated datasets and the operations involved in conducting animal experiments can differ [74,75].

5.3. Facilitate Muti-Modal Animal Behavior Recognition

Using computer vision to recognize animal behavior is another critical aspect of real-time monitoring compared with using wearable sensors. However, challenges such as image occlusions, shot height, and angle variations, along with environmental disturbances are inevitable. Fortunately, growing research is focusing on aggregating information from multiple sources or models, utilizing data forms that fuse both linear and non-linear characteristics to train the final model. This sort of approaches, known as multi-modal learning [76], has been shown to improve model performance. In most cases, they are based on the fusion of data coming from RFID, GPS, IMU as a wearable device, and an optical heart rate sensor. These methods are mainly focused on information fusions. More elaborate approaches align data structures with objective functions for richer contemplation. But working with multiple sources of data increases complexity, resulting in frictions in processes or risks of bias. Integrating these components may be useful in ascertaining certain facets of animal welfare when evident in non-stationary environments. Animal bio-mechanisms, topologies, and reinforcement learning can also be exposed through data mining and/or applied animal science or engineering methodologies. These methods usually depend on the collection of large, well-annotated datasets from all sources and devices. We propose a generalized annotation framework, which could serve as a potential solution for IoT-based applications for Industry 4.0.

6. Conclusion

In this study, we evaluated the mainstream machine learning and active learning strategies, the efficiency of "Classifier & Active Learning" are visualized by learning curves and heatmaps. The 27 classes of inherent high diversity and spontaneities of animal nature is an example for other animal behavior recognition. We proposed a framework that comprises high-dimensional feature extraction processes, light classifier selection, and a simple active learning design, the development of an annotation platform or interface with the purpose of high-quality data and scarce patterns would benefit from this framework. We used 3.28 seconds in the annotator’s action of observation and decision-making, whereas most active learning applications typically focus on the number of queries. The versatility but with a degree of complexity in algorithmic design has been emerged in recent active learning studies, however, in our comparison of DWU and standard UNCERTAINTY, we found that DWU was mostly inferior, which indicates that the high complexity introduced by feature extraction, can enrich the distribution information allowing alternative simpler active learning. Nevertheless, hybrid density and diversity are novel aspects of active learning and, have the risk of being redundant and burdensome in high-dimensional feature space. In future research, the stopping criterion for boosting-based classifiers and the identification of individual behavior of laying hens are expected.

Author Contributions

Conceptualization, G. Zhang and K. Fujinami; methodology, G. Zhang; software, G. Zhang; validation, G. Zhang; formal analysis, G. Zhang; investigation, G. Zhang; resources, T.S.; data curation, G. Zhang; writing—original draft preparation, G. Zhang; writing—review and editing, K. Fujinami; visualization, G. Zhang; supervision, K. Fujinami; project administration, K. Fujinami.;funding acquisition, K.F. and T.S. All authors have read and agreed to the published version of the manuscript.

Funding

This research was funded by the Kayamori Foundation of Informational Science Advancement, grant number K32XXV562, and by Tokyo University of Agriculture and Technology TAMAGO Program for FY2020.

Institutional Review Board Statement

Animals were treated in accordance with the guidelines of the Tokyo University of Agriculture and Technology, Japan. All experimental protocols were approved by the Animal Experiment Committee of the Tokyo University of Agriculture and Technology, Japan.

Informed Consent Statement

Not applicable.

Data Availability Statement

The data presented in this study are available from the corresponding author upon reasonable request.

Conflicts of Interest

The authors declare no conflicts of interest. The funders had no role in the design of the study; in the collection, analyses, or interpretation of data; in the writing of the manuscript; or in the decision to publish the results.

Abbreviations

The following abbreviations are used in this manuscript:
ANN Artificial Neural Network
BAG Bagging Classifier
CSS Core-Set-Score
DWU Density-Weighted Uncertainty
EMC Expected Maximized Change
ET Extra Trees Classifier
F1-macro Macro-averaged F1 Score
GNB Gaussian Naive Bayes
GPS Global Positioning System
HGBC Histogram-Based Gradient Boosting Classifier
IMU Inertial Measurement Unit
IoT Internet of Things
KNN K-Nearest Neighbors
LGBM Light Gradient Boosting Machine
LR Logistic Regression
MDPI Multidisciplinary Digital Publishing Institute
MLP Multi-Layer Perceptron
QBC Query-by-Committee
RF Random Forest
RFID Radio-Frequency Identification
SVC Support Vector Classifier

References

  1. Alves, R.R.N.; Policarpo, I.d.S. Ethnozoology. Ethnozoology 2018, 233–259. [Google Scholar] [CrossRef]
  2. García, R.; Aguilar, J.; Toro, M.; Pinto, A.; Rodríguez, P. A systematic literature review on the use of machine learning in precision livestock farming. Computers and Electronics in Agriculture 2020, 179, 105826. [Google Scholar] [CrossRef]
  3. Chadwin, R. Evacuation of Pets During Disasters: A Public Health Intervention to Increase Resilience. American Journal of Public Health 2017, 107, 1413–1417. [Google Scholar] [CrossRef]
  4. Aydin, N.; Krueger, J.I.; Fischer, J.; Hahn, D.; Kastenmüller, A.; Frey, D.; Fischer, P. “Man’s best friend:” How the presence of a dog reduces mental distress after social exclusion. Journal of Experimental Social Psychology 2012, 48, 446–449. [Google Scholar] [CrossRef]
  5. Hammarberg, K.E. Animal Welfare in Relation to Standards in Organic Farming. Acta Veterinaria Scandinavica 2002, 43, S17. [Google Scholar] [CrossRef]
  6. Miki-Kurosawa, T.; Park, J.H.; Hong, C.C. Laboratory Animals 2014. pp. 267–294. [CrossRef]
  7. Jukan, A.; Masip-Bruin, X.; Amla, N. Smart Computing and Sensing Technologies for Animal Welfare. ACM Computing Surveys (CSUR) 2017, 50, 1–27. [Google Scholar] [CrossRef]
  8. Ministry for Primary Industries, N.Z. Animal Welfare (Calves): Code of Welfare 2012, 2012. Accessed online: https://www.mpi.govt.nz/dmsdocument/5089/direct.
  9. of Naval Research, O. Final Workshop Proceedings: Effects of Stress on Marine Mammals Exposed to Sound, 4–5 November, 2008. Accessed online: https://www.onr.navy.mil/media/document/final-workshop-proceedings-effects-stress-marine-mammals-exposed-sound-4-5-november.
  10. Gonzalez, J.J.; Nasirahmadi, A.; Knierim, U. Automatically Detected Pecking Activity in Group-Housed Turkeys. Animals 2020, 10, 2034. [Google Scholar] [CrossRef]
  11. Dawkins, M.S. Behaviour as a tool in the assessment of animal welfare1. Zoology 2003, 106, 383–387. [Google Scholar] [CrossRef]
  12. Strauss, E.D.; Curley, J.P.; Shizuka, D.; Hobson, E.A. The centennial of the pecking order: current state and future prospects for the study of dominance hierarchies. Philosophical Transactions of the Royal Society B 2022, 377, 20200432. [Google Scholar] [CrossRef]
  13. Silva, M.I.L.d.; Paz, I.C.d.L.A.; Chaves, G.H.C.; Almeida, I.C.d.L.; Ouros, C.C.d.; Souza, S.R.L.d.; Milbradt, E.L.; Caldara, F.R.; Satin, A.J.G.; Costa, G.A.d.; et al. Behaviour and animal welfare indicators of broiler chickens housed in an enriched environment. PLoS ONE 2021, 16, e0256963. [Google Scholar] [CrossRef]
  14. Minnig, A.; Zufferey, R.; Thomann, B.; Zwygart, S.; Keil, N.; Schüpbach-Regula, G.; Miserez, R.; Stucki, D.; Zanolari, P. Animal-Based Indicators for On-Farm Welfare Assessment in Goats. Animals 2021, 11, 3138. [Google Scholar] [CrossRef] [PubMed]
  15. Corr, S.; McCorquodale, C.; Gentle, M. Gait analysis of poultry. Research in Veterinary Science 1998, 65, 233–238. [Google Scholar] [CrossRef] [PubMed]
  16. Pereira, D.F.; Lopes, F.A.A.; Filho, L.R.A.G.; Salgado, D.D.; Neto, M.M. Cluster index for estimating thermal poultry stress (gallus gallus domesticus). Computers and Electronics in Agriculture 2020, 177, 105704. [Google Scholar] [CrossRef]
  17. ScienceDirect. Egg Production, n.d. ScienceDirect. Egg Production, n.d. Accessed: 2024-11-30.
  18. Roberts, J.R.; Souillard, R.; Bertin, J. Avian diseases which affect egg production and quality. In Improving the Safety and Quality of Eggs and Egg Products; Woodhead Publishing, 2011; pp. 376–393. [CrossRef]
  19. Jin, J.; Li, Q.; Zhou, Q.; Li, X.; Lan, F.; Wen, C.; Wu, G.; Li, G.; Yan, Y.; Yang, N.; et al. Calcium deposition in chicken eggshells: role of host genetics and gut microbiota. Poultry Science 2024, 103, 104073. [Google Scholar] [CrossRef]
  20. El-Tarabany, M.S. Effect of thermal stress on fertility and egg quality of Japanese quail. Journal of Thermal Biology 2016, 61, 38–43. [Google Scholar] [CrossRef]
  21. Aquilani, C.; Confessore, A.; Bozzi, R.; Sirtori, F.; Pugliese, C. Review: Precision Livestock Farming technologies in pasture-based livestock systems. Animal 2022, 16, 100429. [Google Scholar] [CrossRef]
  22. Li, N.; Ren, Z.; Li, D.; Zeng, L. Review: Automated techniques for monitoring the behaviour and welfare of broilers and laying hens: towards the goal of precision livestock farming. Animal 2020, 14, 617–625. [Google Scholar] [CrossRef]
  23. García, R.; Aguilar, J.; Toro, M.; Pinto, A.; Rodríguez, P. A systematic literature review on the use of machine learning in precision livestock farming. Computers and Electronics in Agriculture 2020, 179, 105826. [Google Scholar] [CrossRef]
  24. Walton, E.; Casey, C.; Mitsch, J.; Vzquez-Diosdado, J.A.; Yan, J.; Dottorini, T.; Ellis, K.A.; Winterlich, A.; Kaler, J. Evaluation of sampling frequency, window size and sensor position for classification of sheep behaviour. Royal Society Open Science 2018, 5, 171442. [Google Scholar] [CrossRef]
  25. Banerjee, D.; Biswas, S.; Daigle, C.; Siegford, J.M. Remote Activity Classification of Hens Using Wireless Body Mounted Sensors. 2012 Ninth International Conference on Wearable and Implantable Body Sensor Networks 2012, 1, 107–112. [Google Scholar] [CrossRef]
  26. Ikurior, S.J.; Marquetoux, N.; Leu, S.T.; Corner-Thomas, R.A.; Scott, I.; Pomroy, W.E. What Are Sheep Doing? Tri-Axial Accelerometer Sensor Data Identify the Diel Activity Pattern of Ewe Lambs on Pasture. Sensors 2021, 21, 6816. [Google Scholar] [CrossRef] [PubMed]
  27. Awasthi, A.; Riordan, D.; Walsh, J. Sensor Technology For Animal Health Monitoring. International Journal on Smart Sensing and Intelligent Systems 2020, 7, 1–6. [Google Scholar] [CrossRef]
  28. Taylor, P.S.; Hemsworth, P.H.; Groves, P.J.; Gebhardt-Henrich, S.G.; Rault, J.L. Ranging Behaviour of Commercial Free-Range Broiler Chickens 1: Factors Related to Flock Variability. Animals 2017, 7. [Google Scholar] [CrossRef]
  29. Ziegler, L.v.; Sturman, O.; Bohacek, J. Big behavior: challenges and opportunities in a new era of deep behavior profiling. Neuropsychopharmacology 2021, 46, 33–44. [Google Scholar] [CrossRef] [PubMed]
  30. Shimmura, T.; Sato, I.; Takuno, R.; Fujinami, K. Spatiotemporal understanding of behaviors of laying hens using wearable inertial sensors. Poultry Science 2024, 103, 104353. [Google Scholar] [CrossRef]
  31. Tuyttens, F.; Graaf, S.d.; Heerkens, J.; Jacobs, L.; Nalon, E.; Ott, S.; Stadig, L.; Laer, E.V.; Ampe, B. Observer bias in animal behaviour research: can we believe what we score, if we score what we believe? Animal Behaviour 2014, 90, 273–280. [Google Scholar] [CrossRef]
  32. Fujinami, K.; Takuno, R.; Sato, I.; Shimmura, T. Evaluating Behavior Recognition Pipeline of Laying Hens Using Wearable Inertial Sensors. Sensors 2023, 23, 5077. [Google Scholar] [CrossRef]
  33. Shimmura, T.; Sato, I.; Takuno, R.; Fujinami, K. Spatiotemporal understanding of behaviors of laying hens using wearable inertial sensors. Poultry Science 2024, 103, 104353. [Google Scholar] [CrossRef]
  34. Cortes, C.; Vapnik, V. Support-vector networks. Machine Learning 1995, 20, 273–297. [Google Scholar] [CrossRef]
  35. Martiskainen, P.; Järvinen, M.; Skön, J.P.; Tiirikainen, J.; Kolehmainen, M.; Mononen, J. Cow behaviour pattern recognition using a three-dimensional accelerometer and support vector machines. Applied Animal Behaviour Science 2009, 119, 32–38. [Google Scholar] [CrossRef]
  36. Bidder, O.R.; Campbell, H.A.; Gómez-Laich, A.; Urgé, P.; Walker, J.; Cai, Y.; Gao, L.; Quintana, F.; Wilson, R.P. Love Thy Neighbour: Automatic Animal Behavioural Classification of Acceleration Data Using the K-Nearest Neighbour Algorithm. PLOS ONE 2014, 9, 1–7. [Google Scholar] [CrossRef] [PubMed]
  37. Nicosia, A.; Duchesne, T.; Rivest, L.P.; Fortin, D. A Multi-State Conditional Logistic Regression Model for the Analysis of Animal Movement. arXiv, 2016; arXiv:1611.02690. [Google Scholar] [CrossRef]
  38. Muminov, A.; Mukhiddinov, M.; Cho, J. Enhanced Classification of Dog Activities with Quaternion-Based Fusion Approach on High-Dimensional Raw Data from Wearable Sensors. Sensors 2022, 22. [Google Scholar] [CrossRef]
  39. Diosdado, J.A.V.; Barker, Z.E.; Hodges, H.R.; Amory, J.R.; Croft, D.P.; Bell, N.J.; Codling, E.A. Classification of behaviour in housed dairy cows using an accelerometer-based activity monitoring system. Animal Biotelemetry 2015, 3, 15. [Google Scholar] [CrossRef]
  40. Tran, D.N.; Nguyen, T.N.; Khanh, P.C.P.; Tran, D.T. An IoT-Based Design Using Accelerometers in Animal Behavior Recognition Systems. IEEE Sensors Journal 2022, 22, 17515–17528. [Google Scholar] [CrossRef]
  41. Pütün, A.; Yılmaz, D. Classification of Cattle Behavior Leveraging Accelerometer Data and Machine Learning. In Proceedings of the 2024 8th International Artificial Intelligence and Data Processing Symposium (IDAP); 2024; pp. 1–6. [Google Scholar] [CrossRef]
  42. Ke, G.; Meng, Q.; Finley, T.; Wang, T.; Chen, W.; Ma, W.; Ye, Q.; Liu, T.Y. LightGBM: a highly efficient gradient boosting decision tree. In Proceedings of the Proceedings of the 31st International Conference on Neural Information Processing Systems, NIPS’17. Red Hook, NY, USA, 2017; pp. 3149–3157. [Google Scholar]
  43. Zhao, Z.; Shehada, H.; Ha, D.; Dos Reis, B.; White, R.; Shin, S. Machine Learning-Driven Optimization of Livestock Management: Classification of Cattle Behaviors for Enhanced Monitoring Efficiency. In Proceedings of the Proceedings of the 2024 7th International Conference on Machine Learning and Machine Intelligence (MLMI), MLMI ’24. New York, NY, USA, 2024; pp. 85–91. [Google Scholar] [CrossRef]
  44. Gutierrez-Galan, D.; Dominguez-Morales, J.P.; Cerezuela-Escudero, E.; Rios-Navarro, A.; Tapiador-Morales, R.; Rivas-Perez, M.; Dominguez-Morales, M.; Jimenez-Fernandez, A.; Linares-Barranco, A. Embedded neural network for real-time animal behavior classification. Neurocomputing 2018, 272, 17–26. [Google Scholar] [CrossRef]
  45. Settles, B. Active Learning Literature Survey. Technical Report 1648, University of Wisconsin-Madison, 2009. Computer Sciences Technical Report.
  46. Kaseb, A.; Farouk, M. Active learning for Arabic sentiment analysis. Alexandria Engineering Journal 2023, 77, 177–187. [Google Scholar] [CrossRef]
  47. Mahapatra, D.; Tennakoon, R.; George, Y.; Roy, S.; Bozorgtabar, B.; Ge, Z.; Reyes, M. ALFREDO: Active Learning with FeatuRe disEntangelement and DOmain adaptation for medical image classification. Medical Image Analysis 2024, 97, 103261. [Google Scholar] [CrossRef]
  48. Forman, G.; Kirshenbaum, E.; Rajaram, S. A novel traffic analysis for identifying search fields in the long tail of web sites. In Proceedings of the 19th international conference on World wide web - WWW ’10; 2010; pp. 361–370. [Google Scholar] [CrossRef]
  49. Pandi, A.; Diehl, C.; Kharrazi, A.Y.; Scholz, S.A.; Bobkova, E.; Faure, L.; Nattermann, M.; Adam, D.; Chapin, N.; Foroughijabbari, Y.; et al. A versatile active learning workflow for optimization of genetic and metabolic networks. Nature Communications 2022, 13, 3876. [Google Scholar] [CrossRef]
  50. Guo, J.; Du, S.; Ma, Z.; Huo, H.; Peng, G. A Model for Animal Home Range Estimation Based on the Active Learning Method. ISPRS International Journal of Geo-Information 2019, 8, 490. [Google Scholar] [CrossRef]
  51. Bothmann, L.; Wimmer, L.; Charrakh, O.; Weber, T.; Edelhoff, H.; Peters, W.; Nguyen, H.; Benjamin, C.; Menzel, A. Automated wildlife image classification: An active learning tool for ecological applications. Ecological Informatics 2023, 77, 102231. [Google Scholar] [CrossRef]
  52. Li, M.; Sethi, I. Confidence-based active learning. IEEE Transactions on Pattern Analysis and Machine Intelligence 2006, 28, 1251–1261. [Google Scholar] [CrossRef] [PubMed]
  53. Holub, A.; Perona, P.; Burl, M.C. Entropy-based active learning for object recognition. In Proceedings of the 2008 IEEE Computer Society Conference on Computer Vision and Pattern Recognition Workshops; 2008; pp. 1–8. [Google Scholar] [CrossRef]
  54. Balcan, M.F.; Broder, A.; Zhang, T. Margin based active learning. In Proceedings of the International Conference on Computational Learning Theory. Springer; 2007; pp. 35–50. [Google Scholar]
  55. Cai, W.; Zhang, Y.; Zhou, J. Maximizing expected model change for active learning in regression. In Proceedings of the 2013 IEEE 13th international conference on data mining. IEEE; 2013; pp. 51–60. [Google Scholar]
  56. Jin, Q.; Li, S.; Du, X.; Yuan, M.; Wang, M.; Song, Z. Density-based one-shot active learning for image segmentation. Engineering Applications of Artificial Intelligence 2023, 126, 106805. [Google Scholar] [CrossRef]
  57. Urner, R.; Wulff, S.; Ben-David, S. Plal: Cluster-based active learning. In Proceedings of the Conference on learning theory. PMLR; 2013; pp. 376–397. [Google Scholar]
  58. Notar, C.E.; Restauri, S.; Wilson, J.D.; Friery, K.A. Going the distance: Active learning. 2002.
  59. Schjelderup-Ebbe, T. Beiträge zur Sozialpsychologie des Haushuhns. Zeitschrift für Psychologie und Physiologie der Sinnesorgane 1921, 88, 225–252. [Google Scholar]
  60. Brandes, S.; Sicks, F.; Berger, A. Behaviour Classification on Giraffes (Giraffa camelopardalis) Using Machine Learning Algorithms on Triaxial Acceleration Data of Two Commonly Used GPS Devices and Its Possible Application for Their Management and Conservation. Sensors 2021, 21. [Google Scholar] [CrossRef] [PubMed]
  61. Gunner, R.M.; Wilson, R.P.; Holton, M.D.; Scott, R.; Hopkins, P.; Duarte, C.M. A new direction for differentiating animal activity based on measuring angular velocity about the yaw axis. Ecology and Evolution 2020, 10, 7872–7886. [Google Scholar] [CrossRef]
  62. Chambers, R.; Yoder, N.; Carson, A.; Junge, C.; Allen, D.; Prescott, L.; Bradley, S.; Wymore, G.; Lloyd, K.; Lyle, S. Deep Learning Classification of Canine Behavior Using a Single Collar-Mounted Accelerometer: Real-World Validation. Animals 2021, 11, 1549. [Google Scholar] [CrossRef] [PubMed]
  63. García, R.; Aguilar, J.; Toro, M.; Pinto, A.; Rodríguez, P. A systematic literature review on the use of machine learning in precision livestock farming. Computers and Electronics in Agriculture 2020, 179, 105826. [Google Scholar] [CrossRef]
  64. Aquilani, C.; Confessore, A.; Bozzi, R.; Sirtori, F.; Pugliese, C. Review: Precision Livestock Farming technologies in pasture-based livestock systems. Animal 2022, 16, 100429. [Google Scholar] [CrossRef]
  65. Li, N.; Ren, Z.; Li, D.; Zeng, L. Review: Automated techniques for monitoring the behaviour and welfare of broilers and laying hens: towards the goal of precision livestock farming. Animal 2020, 14, 617–625. [Google Scholar] [CrossRef]
  66. Mahoney, C.J.; Huber-Fliflet, N.; Jensen, K.; Zhao, H.; Neary, R.; Ye, S. Empirical Evaluations of Seed Set Selection Strategies for Predictive Coding. arXiv, 2019; arXiv:1903.08816. [Google Scholar] [CrossRef]
  67. Dasgupta, S. Two faces of active learning. Theoretical Computer Science 2011, 412, 1767–1781. [Google Scholar] [CrossRef]
  68. Sui, Q.; Ghosh, S.K. Similarity-based active learning methods. Expert Systems with Applications 2024, 251, 123849. [Google Scholar] [CrossRef]
  69. Flesca, S.; Mandaglio, D.; Scala, F.; Tagarelli, A. A meta-active learning approach exploiting instance importance. Expert Systems with Applications 2024, 247, 123320. [Google Scholar] [CrossRef]
  70. Wang, L.; Hu, X.; Yuan, B.; Lu, J. Active learning via query synthesis and nearest neighbour search. Neurocomputing 2015, 147, 426–434. [Google Scholar] [CrossRef]
  71. Sener, O.; Savarese, S. Active learning for convolutional neural networks: A core-set approach. arXiv, 2017; arXiv:1708.00489 2017. [Google Scholar]
  72. Li, J.; Chen, P.; Yu, S.; Liu, S.; Jia, J. Bal: Balancing diversity and novelty for active learning. IEEE Transactions on Pattern Analysis and Machine Intelligence 2023. [Google Scholar] [CrossRef] [PubMed]
  73. Haussler, D.; Seung, H.S.; Opper, M.; Sompolinsky, H. Query by committee. In Proceedings of the fifth annual workshop on Computational learning theory, 1992; pp. 287–294. [Google Scholar] [CrossRef]
  74. Womble, J.N.; Horning, M.; Lea, M.A.; Rehberg, M.J. Diving into the analysis of time–depth recorder and behavioural data records: A workshop summary. Deep Sea Research Part II: Topical Studies in Oceanography 2013, 88, 61–64. [Google Scholar] [CrossRef]
  75. Turner, P.V.; Bayne, K. Research Animal Behavioral Management Programs for the 21st Century. Animals 2023, 13, 1919. [Google Scholar] [CrossRef]
  76. Deng, Q.; Deb, O.; Patel, A.; Rupprecht, C.; Torr, P.; Trigoni, N.; Markham, A. Towards Multi-Modal Animal Pose Estimation: An In-Depth Analysis. arXiv 2024, arXiv:2410.09312. [Google Scholar] [CrossRef]
Figure 1. Multiple factors that can cause dataset drift in animal studies, leading to redundant and labor-intensive annotations.
Preprints 151056 g001
Figure 2. A generalized annotation framework comprises dimensional feature extraction and selection of classifier and active learning.
Preprints 151056 g002
Figure 3. O p t i m u m learning curves.
Preprints 151056 g003
Figure 4. Suboptimum learning curves.
Preprints 151056 g004
Figure 5. Irregular Learning Curves.
Preprints 151056 g005
Figure 6. Learning the best Accuracy and time cost under batch size of 5 and 10.
Preprints 151056 g006
Figure 7. Learning the best Accuracy and time cost under batch size of 15 and 20
Preprints 151056 g007
Figure 8. Learning the best Accuracy and time cost under batch size of 25 and 30.
Preprints 151056 g008
Figure 9. Learning the best F1-macro and time cost under batch size of 5 and 10.
Preprints 151056 g009
Figure 10. Learning the best F1-macro and time cost under batch size of 15 and 20.
Preprints 151056 g010
Figure 11. Learning the best F1-macro and time cost under batch size of 25 and 30.
Preprints 151056 g011
Table 1. Summary of Time-domain, Frequency-domain, and Correlation Features.
Category Feature Description Type Notes
Time-domain Features Mean Represents the central tendency of the data. Statistical measure
Variance Measures how much the data spreads around the mean. Statistical measure
Standard Deviation Measures the extent of variability around the mean. Statistical measure
Interquartile Range Indicates the range between the 25th and 75th percentiles. Robust measure
Median Absolute Deviation Measures variability using the median as a reference. Robust measure
Median Crossing Counts how many times the data crosses its median. Oscillation indicator
Skewness Captures asymmetry in the data distribution. Statistical measure
Frequency-domain Features Spectral Peak Identifies the dominant frequency component. Frequency analysis
Energy Represents the total power of the signal. Frequency analysis
Entropy Quantifies the randomness in the frequency domain. Frequency analysis
Kurtosis Indicates the "peakedness" of the data distribution. Statistical measure
Crossing Features Mean Crossing Counts the number of times the signal crosses its mean. Oscillation indicator
Minimum Value Smallest value in the signal data. Extremum
Maximum Value Largest value in the signal data. Extremum
Correlation Features Spearman’s Rank Correlation Measures the monotonic relationship between signal pairs. Relationship indicator
Pearson’s Correlation Coefficient Measures the linear relationship between signal pairs. Relationship indicator
Features are calculated based on signal processing for behavioral data.
Table 2. Summary of Hen Behaviors and Frequency Categories (Up to Uncommon Events).
Category Behavior Occurrences Notes
Common Behaviors Eat 2235 Indicates general health and well-being
Stop 1365 Potential indicator of stress or discomfort
Preening 1327 Indicates grooming and self-care, sign of comfort
Rest 1051 Reflects a healthy rest cycle and energy recovery
Less Frequent Behaviors Peck the nest box 585 Suggests nesting behavior, potential environmental enrichment indicator
Peck the ground 558 Exploration or foraging behavior, can reflect access to resources
Move 339 Indicates activity level, could be linked to space or environmental stimulation
Head scratch 277 May suggest comfort or behavior related to hygiene and health
Dust bathing 274 Indicates self-maintenance and health care, behavioral enrichment
Drink 191 Hydration status, key welfare indicator
Rare Behaviors Look around 164 Vigilance behavior, possible indicator of environmental awareness or anxiety
Peck the sensor 124 Interaction with environment, may indicate curiosity or stress
Very Rare Behaviors Head swing 114 Possible sign of discomfort or agitation
Shivering 105 Welfare concern, potentially due to cold or distress
Get on the nest box 73 Indicates nesting behavior, may reflect environmental comfort
Get off the nest box 66 Potential indicator of disturbance or stress in the environment
Uncommon Events Litter exploration 47 Exploration behavior, could indicate resource availability and environmental enrichment
Get on the perch 35 Indicates perching behavior, related to comfort and space utilization
Get off the perch 35 May reflect anxiety or environmental disturbance
Stretching 28 Sign of physical comfort, stretch can indicate health and well-being
To keep balance 24 Can indicate stress or instability, potentially environmental stressor
Behaviors are categorized based on their frequency of occurrence and related to animal welfare indicators.
Table 3. Summary of Highly Rare Hen Behaviors.
Category Behavior Occurrences Notes
Highly Rare Events Tail swing 23 Indicates agitation or distress in response to the environment
Attack another hens 13 Aggression, possible welfare concern or dominance behavior
Beak sharpening 11 Potential sign of frustration or need for environmental enrichment
Pecked the sensor 9 Interaction with environmental stressor or curiosity
Pecked 5 Possible indication of aggression or discomfort
Box Bumping Behavior 3 Potential stress or agitation, welfare concern
Behaviors are categorized based on their frequency of occurrence and related to animal welfare indicators.
Table 4. The best F 1 macro and costed labels for pairs of 11-Classifiers and 7-strategies.
ENTROPY MARGIN UNCERTAINTY RANDOM EMC CSS DWU
F . c o s t F . c o s t F . c o s t F . c o s t F . c o s t F . c o s t F . c o s t
Model
SVC 0.7 2875 0.702 2865 0.706 1175 0.701 5900 0.701 6260 0.694 3670 0.711 2435
BAG 0.678 1445 0.692 2400 0.684 3260 0.674 4765 0.617 6250 0.675 3720 0.711 4745
DT 0.577 5305 0.595 6010 0.577 5305 0.597 5615 0.577 5305 0.614 5080 0.577 5305
ET 0.731 970 0.756 1515 0.733 2440 0.707 6235 0.687 6220 0.699 5700 0.711 1805
GNB 0.491 3940 0.492 3645 0.501 2830 0.516 3225 0.484 4860 0.477 5670 0.502 3820
HGBC 0.759 2335 0.755 2195 0.757 1905 0.69 3065 0.382 2345 0.745 2490 0.77 2355
KNN 0.643 6005 0.642 5760 0.652 3065 0.639 6250 0.641 6265 0.644 6115 0.651 3255
LGBM 0.773 3160 0.747 1410 0.765 3275 0.674 5370 0.607 5540 0.766 3525 0.761 3105
LR 0.696 6290 0.696 6025 0.696 5965 0.7 6290 0.698 6290 0.704 4795 0.696 6290
MLP 0.771 2550 0.776 2270 0.778 2440 0.743 6035 0.74 6270 0.753 5680 0.778 2460
RF 0.692 1000 0.746 1310 0.722 1190 0.674 6155 0.66 6270 0.674 5720 0.693 1620
*Note that F . is the abbrevation of F 1 macro , and c o s t is the number of queries.
Table 5. (Batch Size 5) The best Accuracy and costed labels for pairs of 11-Classifiers and 7-strategies.
ENTROPY MARGIN UNCERTAINTY RANDOM EMC CSS DWU
A c c . c o s t A c c . c o s t A c c . c o s t A c c . c o s t A c c . c o s t A c c . c o s t A c c . c o s t
Model
SVC 0.911 5390 0.914 2830 0.914 1780 0.914 5580 0.913 6145 0.913 6100 0.912 2215
BAG 0.912 2825 0.916 2200 0.913 2205 0.908 6240 0.897 6290 0.906 3555 0.914 3350
DT 0.862 6235 0.86 6175 0.862 6235 0.859 6290 0.862 6235 0.86 5880 0.862 6235
ET 0.939 3930 0.952 1685 0.946 2100 0.937 6235 0.934 6285 0.939 5700 0.944 2710
GNB 0.748 3240 0.736 2985 0.762 2840 0.726 2015 0.69 6290 0.698 5670 0.746 3255
HGBC 0.952 1625 0.953 1790 0.955 1770 0.935 4770 0.804 2345 0.943 3870 0.953 1710
KNN 0.895 2980 0.893 3290 0.897 2740 0.887 6215 0.886 6250 0.887 6195 0.889 3475
LGBM 0.953 1735 0.951 1980 0.954 1470 0.937 5325 0.929 6160 0.944 4325 0.953 1645
LR 0.902 3040 0.904 5185 0.903 5150 0.903 6145 0.902 6260 0.905 5425 0.905 2580
MLP 0.936 3050 0.935 3365 0.937 4575 0.931 6120 0.933 6270 0.933 5945 0.936 3150
RF 0.931 3090 0.946 1495 0.942 1795 0.927 6120 0.924 6270 0.927 5755 0.932 2005
*Note that A c c . is the abbrevation of A c c u r a c y , and c o s t represents the number of queries.
Disclaimer/Publisher’s Note: The statements, opinions and data contained in all publications are solely those of the individual author(s) and contributor(s) and not of MDPI and/or the editor(s). MDPI and/or the editor(s) disclaim responsibility for any injury to people or property resulting from any ideas, methods, instructions or products referred to in the content.
Copyright: This open access article is published under a Creative Commons CC BY 4.0 license, which permit the free download, distribution, and reuse, provided that the author and preprint are cited in any reuse.
Prerpints.org logo

Preprints.org is a free preprint server supported by MDPI in Basel, Switzerland.

Subscribe

Disclaimer

Terms of Use

Privacy Policy

Privacy Settings

© 2025 MDPI (Basel, Switzerland) unless otherwise stated