
Submitted:
27 February 2025
Posted:
02 March 2025
You are already at the latest version
Abstract
Background The severity of autism spectrum disorder (ASD) is clinically assessed through a comprehensive evaluation of social communication deficits, restricted interests, repetitive behaviors, and the level of support required (ranging from level 1 to level 3), according to DSM-5 criteria. Along with its varied clinical manifestations, the neuroanatomy of ASD is characterized by heterogeneous abnormalities. Notably, brain MRI of children with ASD often reveal an increased number of perivascular spaces (PVS) compared to typically developing children. Our recent findings indicate that enlarged PVS (ePVS) are more common in younger male patients with severe ASD, and that specific ePVS locations are significantly associated with ASD symptoms.
Objectives In this study, we mapped ePVS across key regions of three major cognitive networks: the default mode network (DMN), the combined central executive/frontoparietal network (CEN/FPN), and the salience network (SN) in 36 individuals with different symptoms severity and rehabilitation needs due to ASD. We explored how the number, size, and location of PVS in these networks are related to specific ASD symptoms and the overall need for rehabilitation and support.
Results Our results suggest that ePVS in the DMN, CEN/FPN, and SN are strongly correlated with the severity of certain ASD symptoms, including verbal deficits, stereotypies, and sensory disturbances. We found a mild association between ePVS and the level of support needed for daily living and quality of life. Conclusion Dysfunction in cognitive networks associated with the presence of ePVS has a significant impact on the severity of ASD symptoms. However, the need for assistance may also be influenced by other comorbid conditions and dysfunctions in smaller, overlapping brain networks.
Keywords:
autism
; brain functional networks
; default mode network
; central executive network
; frontoparietal network
; salience network
; perivascular spaces
; symptoms
; needs
1. Introduction
Autism spectrum disorder (ASD) is a neurodevelopmental disorder characterized by a range of communication and social reciprocity deficits, along with repetitive behaviors (e.g., stereotypies) and atypical responses to sensory stimuli (e.g., hypo- or hypersensitivity) [1,2]. Early signs of ASD can appear very early in life, although a formal diagnosis is typically made around 18 months of age [3,4]. Diagnosing ASD requires both direct clinical observation [5] and a multidisciplinary approach [6], supported by parental interviews [7,8]. The severity of ASD is categorized by the DSM-5 into three levels based on the amount of support required for daily living [1]. However, the individual need for assistance and intervention often does not take into account the frequent neurodevelopmental comorbidities associated with ASD, such as intellectual disability and attention-deficit hyperactivity disorder (ADHD), as well as other common conditions like anxiety, depression, epilepsy, and sleep disorders [2,9,10].
Alongside the diverse clinical manifestations seen across patients, the neuroanatomy of ASD is characterized by heterogeneous brain abnormalities. These include transient brain enlargement, region-specific volumetric changes on MRI, alterations in the thickness of grey and white matter, and microstructural brain tissue changes observed in neuropathology [11–14].
Some children with ASD show an excess of extra-axial cerebrospinal fluid (CSF) [15] and reduced diffusivity along the perivascular spaces (PVS) compared to healthy children [16]. PVS are pial-lined spaces surrounding the brain’s arterioles and venules, facilitating CSF flow, which is essential for clearing interstitial fluid and waste products from the brain [17]. As the primary pathway of the glymphatic system, PVS play a crucial role in maintaining brain homeostasis [18]. While PVS are typically small, they can become visible on MRI when enlarged (ePVS), due to a reduction in glymphatic flow. This enlargement is often seen in aging, neuroinflammatory, and neurodegenerative conditions [19–21]. PVS dilation has also been observed in the brains of children with ASD [22–24].
More recently, children who later develop ASD have been found to exhibit an enlargement of PVS, accompanied by an increased CSF volume during the second year of life [25]. This suggests that PVS enlargement in ASD may indicate impaired CSF flow, potentially leading to stagnation and the accumulation of neurotoxic metabolites, which could contribute to progressive neurodegeneration throughout the brain [12,15–17,25,26]. Indeed, individuals with ASD, compared to typically developing children, show atypical patterns of brain connectivity across functional MRI networks [27].
Functionally, these networks are not isolated but interact dynamically, depending on age and the task at hand [28]. Currently, there is no universal taxonomy or brain network atlas for children that fits all circumstances. This is because many networks are large-scale and stable, while others overlap and exhibit varying properties [27,29]. Among the proposed fMRI brain networks (e.g., somatomotor, sensorimotor, language, visual, and limbic networks) [30], those associated with key cognitive functions are likely the most studied, particularly in the context of ASD [31].
The Default Mode Network (DMN) is active during rest and when a person is not engaged in specific tasks. It is thought to play a role in self-referential and internal thoughts. Key regions of the DMN include the medial prefrontal cortex, posterior cingulate cortex, and angular gyrus [32].
The Central Executive Network (CEN) is associated with high-level cognitive functions and works in concert with the overlapping Frontoparietal Network (FPN) [31,33]. While the CEN primarily supports higher-order functions such as working memory, decision-making, and problem-solving, the FPN is more flexible and adaptive, particularly in shifting between distinct cognitive states. Key regions of the CEN include the dorsolateral prefrontal cortex (DLPFC), posterior parietal cortex, and anterior cingulate cortex. The key regions of the FPN include the DLPFC, posterior parietal cortex, inferior parietal lobule, and prefrontal cortex. As a result, the CEN and FPN share important key regions [33,34]. Additionally, the caudate nucleus, which is connected to the prefrontal cortex, plays a role in regulating the activity of the CEN/FPN. Dysfunction in the caudate nucleus may contribute to difficulties in adapting to new situations or shifting focus [35].
Another key cognitive network is the Salience Network (SN), which is essential for emotional regulation. The key regions of the SN include the anterior insula and the anterior cingulate cortex [37].
In summary, several abnormalities in the DMN, CEN/FPN, SN, and other networks have been consistently observed in individuals with ASD [27,38–42]. Under- or over-connectivity within the DMN may be related to difficulties in tasks that require switching between internal and external focus, leading to challenges with self-referential thinking and social cognition. Altered connectivity in the CEN/FPN could contribute to deficits in cognitive flexibility, planning, and decision-making [43]. Impaired salience detection within the SN may also contribute to social difficulties, as individuals with autism often struggle with switching between tasks and tend to become overly focused on specific activities [35,37].
In two recent studies, we quantified ePVS in the brain MRIs of children with ASD and other neuropsychiatric disorders [44] and found that ePVS is a neuroimaging feature of younger male patients with severe ASD. Additionally, by mapping the number, diameter, and volume of PVS across 72 brain regions, we found that specific ASD symptoms—such as verbal dysfunction, stereotypies, and abnormal sensory processing—are significantly linked to distinct ePVS localizations. Notably, ePVS in the two rostral middle frontal regions, part of the DLPFC, were associated with the most severe clinical manifestations of ASD [45].
In this new study, we mapped PVS in key regions of the cognitive brain networks (DMN, CEN/FPN, and SN) in individuals with ASD and examined how the number, size, and location of PVS relate to overall rehabilitation needs and specific ASD symptoms. Symptoms such as language disorders, stereotypies, and abnormal sensory processing were selected due to their association with potentially distinct underlying brain networks.
2. Materials and Methods
2.1. Study Design and Subjects
This study was approved by the Ethics Committee of Azienda Ospedaliero-Universitaria, Cagliari, Italy (PROT. PG/2023/5144) and conducted in accordance with relevant regulations. Written informed consent was obtained from all parents or legal guardians. Clinical records of consecutive children diagnosed with ASD were retrospectively analyzed at the Child Neuropsychiatry Unit, University Hospital, Sassari, from 2018 to 2022. The diagnosis of ASD, supported by the Autism Diagnostic Observation Schedule, second edition (ADOS-2) [5], has been previously described [44].
All eligible children had previously undergone brain MRI in accordance with guidelines [46], due to abnormal neurological examinations, macrocephaly, dysmorphisms, or EEG abnormalities, as outlined in earlier work [44,45]. Thirty-six children were ultimately included in this study based on the exclusion criteria detailed elsewhere [44,45].
The presence (yes/no) and severity of language impairment, the presence (yes/no) of motor stereotypies, and the presence (yes/no) of sensory distortion were extracted from the specific ADOS-2 subtest scores. The three progressive levels of the patients’ rehabilitation needs were defined according to the DSM-5 guidelines [1].
2.2. MRI Processing
Standard MRI acquisition and subsequent PVS mapping were performed as detailed in our previous studies [44,45]. Brain MRI was conducted on all individuals using the same 1.5 Tesla Philips Achieva MRI scanner at the University Hospital in Sassari. The MRI protocol included a T1-weighted spin-echo axial sequence (TR: 357–895 ms; TE: 10–15 ms; flip angle: 69°; resolution: 0.8 × 0.8 × 4.4 mm³) and a T2-weighted turbo spin-echo axial sequence (TR: 4,000–7,000 ms; TE: 100 ms; flip angle: 90°; resolution: 0.4 × 0.4 × 4.4 mm³). Both sequences were available for all subjects and used for the segmentation of PVS.
In brief, white matter (WM) and basal ganglia (BG) masks were generated using a fast, sequence-adaptive whole-brain segmentation algorithm applied to the T1 images [47]. T2 images were then rigidly transformed to the T1 space. Intensity was uniformized across the brain using the 3dUnifize function in AFNI [48]. We then calculated voxel-wise intensity differences between each voxel and its surrounding voxels in the white matter and basal ganglia. A voxel was defined as a PVS if the intensity difference was greater than 60, as described in our previous study [44,45]. The PVS maps were reviewed blind to the clinical status and demographic information. Because the slice thickness was larger than the PVS thickness, we used the number of voxels rather than the volume in mm³ to measure the PVS volumes. Additionally, as PVS volume is highly correlated with WM volume [49], the PVS volume value was normalized by the amount of WM for each individual. PVS voxels were considered part of the same cluster if their edges or corners were in contact.
For qualitative PVS scoring, we used the visual rating scale described by Potter et al. [50], which assigns scores as follows: 0 if PVS are not visible, 1 for 1–10 PVS, 2 for 11–20 PVS, 3 for 21–40 PVS, and 4 for > 40 PVS. We then compared our visual PVS scores with the corresponding quantitative measures and found a significant correlation between the two (Spearman R = 0.61, P < 0.0001). Quantitative measures offer several advantages over visual scoring, including higher sensitivity, better reproducibility, and the ability to assess more structural properties of PVS, such as volume and diameter, which are typically not quantifiable via visual rating scales [44,45,51].
2.3. Mapping and Measurement of Perivascular Spaces
We designed the study to achieve a detailed mapping of the PVS, their predominance in specific cognitive networks, and their correlation with reported symptoms and general assistance needs. As a preliminary step, we measured the number, volume, and diameter of the PVS, along with the volume of the underlying WM in the cortical areas listed below, as well as within the individual basal ganglia regions [44,45,51].
For this purpose, we parcellated brain areas using the Mindboggle-101 dataset, a comprehensive and publicly accessible collection of manually labeled macroscopic anatomy in MRI scans of the human brain [52]. For each hemisphere, we mapped PVS in the WM underlying the following cortical areas:
- Temporal lobe: Entorhinal cortex, Parahippocampal gyrus, Fusiform gyrus, Superior temporal gyrus, Middle temporal gyrus, Inferior temporal gyrus, Transverse temporal gyrus, temporal pole (8 areas).
- Frontal lobe: Superior frontal, Middle frontal gyrus (Rostral, Caudal), Inferior frontal gyrus (Pars opercularis Pars triangularis, Pars orbitalis), Orbitofrontal gyrus (Lateral, Medial), Precentral gyrus, Paracentral lobule, Frontal pole (11 areas).
- Parietal lobe: Postcentral gyrus, Supramarginal gyrus, Superior parietal lobule, Inferior parietal lobule, Precuneus (5 areas).
- Occipital lobe: Lingual gyrus, Pericalcarine cortex, Cuneus cortex, Lateral occipital cortex (4 areas).
- Cingulate cortex: Rostral anterior, Caudal anterior, Posterior, Isthmus (4 areas).
- BG areas were subdivided, for each side, into the followings: Thalamus, Caudate, Putamen and Pallidus (4 areas).
For each individual, a total of 288 data points were obtained (72 areas, each with 4 variables). Due to the limited sample size, rather than performing a dimensional analysis of specific clinical symptoms, we applied an „extreme of outcome” approach to compare clinical and MRI data. Specifically, language impairment, motor stereotypies, and sensory disturbances were analyzed as binary variables (present/absent). For each region, the following three variables were measured: PVS count (number of PVS), total PVS volume (expressed as the number of PVS voxels), and PVS diameter (in mm).
2.4. Brain Functional Networks
We also analyzed the number, diameter, and volume of PVS within key cognitive brain networks, as represented in Figure 1, using MRI-based (Klein, 2012) and fMRI-based parcellations [30,53]. Given the shared key regions and substantial functional overlap between the Central Executive Network (CEN) and the Frontoparietal Network (FPN), we arbitrarily merged the key areas of these two networks into one combined network (CEN/FPN), which also included the caudate nucleus [54]. Details of the parcellation are shown in Figure 1.
2.5. Statistical Analysis
Sample characteristics were analyzed using descriptive statistics: means and standard deviations (SD) for normally distributed quantitative variables, and medians and interquartile ranges (IQR) for non-normally distributed quantitative variables. Absolute and relative (percentage) frequencies were used for qualitative variables. The normality of distribution was assessed through visual inspection and the Shapiro-Wilk test. Comparisons between two groups (with or without symptoms) were conducted using the Mann-Whitney U test. A p-value of less than 0.05 was considered statistically significant. All statistical analyses were performed using R software, version 4.4.2.
Additionally, since PVS volume is highly correlated with the volume of the corresponding region [49], we calculated the „PVS volume fraction” and „PVS count fraction” for each region as recommended [50]. These normalized measures were obtained by dividing the PVS volume and count by the number of voxels in the corresponding region, as done in previous studies [44,45]. Given the exploratory nature of this study, no corrections for multiple comparisons were applied.
The collected data were stored in an ad hoc database and are available from the corresponding author upon reasonable request.
3. Results
Of the 36 young patients with ASD, 22 (61%) were male, with a mean age of 4 years (SD = 2.3), ranging from 1 to 9 years. Twenty-one children were under the age of 3, and fifteen were over 3 (detailed in Table 1).
Analysis of PVS in the selected cognitive networks (5 areas of the DMN, 6 areas of the CEN/FPN, and 2 areas of the SN) was performed across the entire patient cohort. PVS count, diameter, and volume contributed to distinguishing between patients with low and high symptom severity. Findings are depicted in Figure 2, Figure 3, Figure 4 and Figure 5, where coloured gradient areas (from yellow to red) represent PVS alterations. Detailed PVS findings for each brain network and statistical results are provided in the Supplementary Tables (Supplementary Table S1 for DMN, Supplementary Table S2 for CEN/FPN, and Supplementary Table S3 for SN).
3.1. Language Impairment
Patients were divided into those with no or low impairment (n = 17) and those with severe language impairment (i.e., “non-verbal” patients; n = 15). The 4 patients with intermediate language impairment were excluded based on the extreme-of-outcome approach. A significant, direct relationship was found between the severity of language deficits and the number, diameter, and volume of PVS across all networks. Notably, the left CEN/FPN exhibited significant enlargement of all PVS measures in severely impaired patients (Supplementary Table S2: P = 0.005 for PVS count, P = 0.01 for PVS diameter, P = 0.029 for PVS volume; Figure 2, red). Additionally, the right and left DMN (P = 0.01, P = 0.001, P = 0.004, P = 0.01; Supplementary Table S1), right CEN/FPN (P = 0.028, P = 0.01; Supplementary Table S2), and both SN (P = 0.029, P = 0.001, P = 0.03, P = 0.02; Supplementary Table S3) showed alterations in two PVS measures (Figure 2, orange).
3.2. Sensorial Alterations
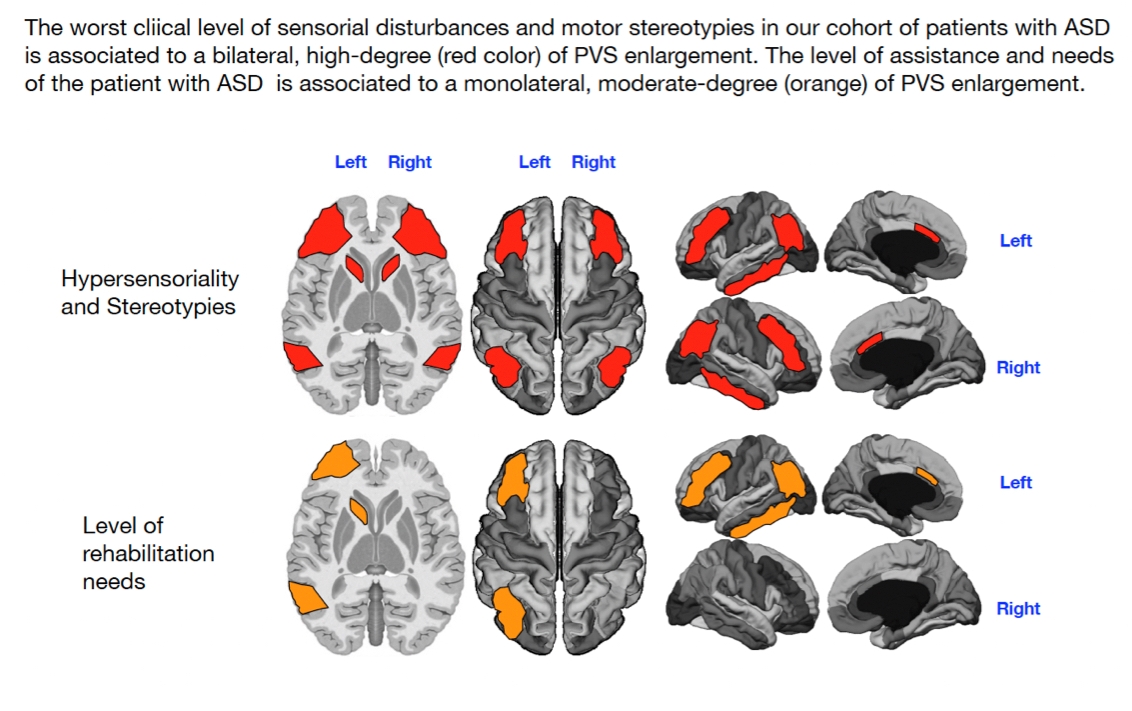
Patients were categorized as sensorially unimpaired (n = 13) or impaired (n = 20), irrespective of the type of sensory disturbance (e.g., hearing, smell). Three patients were excluded due to missing data on sensory alterations. A significant, direct relationship was found between sensory impairment and the number, diameter, and volume of PVS in the CEN/FPN networks (P = 0.04, P = 0.04, P = 0.03, P = 0.04, P = 0.01, P = 0.003; Supplementary Table S2, red in Figure 3) and in the right DMN (P = 0.029, P = 0.047, P = 0.046; Supplementary Table S1, red in Figure 3). The left DMN (P = 0.01; Supplementary Table S1, yellow in Figure 3) and right SN (P = 0.04; Supplementary Table S3) also showed significant but smaller PVS enlargements (yellow in Figure 3).
3.3. Motor Stereotypies
Patients were divided into those with (n = 17) and without (n = 16) motor stereotypies. Three patients were excluded due to missing data on stereotypies. Motor stereotypies were significantly and positively associated with the number, diameter, and volume of PVS in the left DMN (P = 0.01, P = 0.048, P = 0.00001; red in Figure 4) and in both CEN/FPN (P = 0.009, P = 0.007, P = 0.003, P = 0.02, P = 0.001, P = 0.04; red in Figure 4). The right DMN exhibited significant association with only one PVS measure (P = 0.0001; yellow in Figure 4), while the right SN also showed a significant but weak association (P = 0.002; Supplementary Table S3, yellow in Figure 4).
3.4. Level of Rehabilitation Needs
The 36 patients were stratified according to their rehabilitation needs: low-level (ASD level 1; n = 10) and high-level (ASD level 3; n = 20). The remaining 6 patients, classified as intermediate (ASD level 2), were excluded owing to the extreme-of-outcome strategy, as already described. As shown in Supplementary Tables S1 and S2, and Figure 5, significant relationships were observed between ASD severity level and PVS number (left DMN) and volume (right DMN) in the WM of both DMN (P = 0.02, P = 0.006; Supplementary Table S1, yellow in Figure 5) and the count and diameter of PVS in the left CEN/FPN (P = 0.014, P = 0.018; Supplementary Table S2, orange in Figure 5). No significant PVS enlargement was associated with ASD severity level in the SN bilaterally (Supplementary Table S3, Figure 5).
4. Discussion
The severity of ASD is typically determined through a comprehensive assessment that includes deficits in social communication (both verbal and non-verbal), interaction difficulties, restricted and repetitive behaviors (such as repetitive movements, inflexible behaviors, or distress when routines are disrupted), and the patient’s need for support, as outlined by the DSM-5 classification system (from level 1 to level 3) [1]. However, it is crucial to recognize that ASD is a spectrum, with its severity varying significantly among individuals, even within the same level of need. Comorbid conditions such as ADHD, intellectual disabilities, and epilepsy further complicate the assessment of severity. A reasonable evaluation of ASD severity should be individualized, taking into account clinical assessments, parent/caregiver reports, and a careful estimation of the level of support required for daily functioning [55]. With this background in mind, our findings of altered PVS in cognitive networks may have important implications for individualized treatment strategies for ASD symptoms.
Language Impairment
Our study demonstrates that the left CEN/FPN is particularly affected by PVS enlargement in children with the most severe language impairments. Moderate PVS enlargements in the bilateral DMN and SN were also associated with language deficits (Figure 2).
The CEN/FPN plays a critical role in language processing, encompassing functions such as production, comprehension, and monitoring speech flow to interpret complex meanings and respond appropriately [56]. These networks collaborate with others, including the DMN and SN, to regulate attention and understanding within linguistic contexts [57]. Dysfunction in the DMN and SN in autism is known to contribute to social communication deficits, especially in interpreting non-verbal and emotional cues in speech [57–60]. Additionally, the caudate nucleus may exhibit altered connectivity with regions of the CEN, which could further contribute to the language dysfunctions observed in ASD [61].
Sensorial Issues
Sensory processing dysfunction is a hallmark feature of ASD, leading to hypersensitivity, hyposensitivity, unusual sensory-seeking behaviors or sensory avoidance [62]. In our study, PVS enlargement in the two CEN/FPN networks was significantly associated with the most severe sensory processing problems. Additionally, significant PVS enlargement in the right DMN (indicated by red) and smaller PVS alterations in the right SN (yellow) were observed in patients with more pronounced sensory concerns (Figure 3).
The CEN plays an essential role in processing sensory information and managing sensory inputs, while the SN is crucial for coordinating communication between the DMN and CEN, prioritizing relevant internal and external stimuli [62,63]. This coordination allows the brain to efficiently process sensory events, including emotional states and sensory cues, focusing attention on the most pertinent information. The integration of these functions is essential for adaptive behavior in a dynamic environment [64]. The observed PVS enlargement in these networks may reflect disruptions in the brain’s ability to effectively process sensory information, leading to the sensory difficulties commonly reported in ASD.
Motor Stereotypes
Our findings indicate that the left DMN and both CEN/FPN networks are significantly affected by PVS enlargements in children with motor stereotypies (highlighted in red in Figure 4). Additionally, low-grade (yellow color) PVS enlargement in the right DMN and right SN was also associated with motor stereotypies.
Motor stereotypies in autism are likely driven by altered connectivity between networks that control motor actions, including the basal ganglia, sensory processing networks, and cognitive networks such as the FPN and DMN [65,66]. The basal ganglia, including the caudate nucleus, are essential in regulating voluntary movement and inhibiting unwanted actions. In ASD, dysfunction in striatal connections often leads to excessive or repetitive motor movements [36,67]. The FPN, which is involved in higher-order cognitive processes like cognitive control and task switching, may contribute to difficulties in inhibiting or shifting attention away from repetitive movements. Additionally, dysfunction in the DMN, particularly when these behaviors serve a self-calming function, may further exacerbate motor stereotypies in individuals with autism [60].
Level of Support
In contrast to the significant associations found between PVS enlargement and specific ASD symptoms such as language, sensory, and motor issues, we observed only a low-grade significant association between PVS enlargement and the level of support required by the patients. Specifically, this association was observed as a low-grade PVS enlargement (highlighted in yellow in both DMN regions and orange in the left CEN/FPN), with no notable involvement of the SN (Figure 5).
The DSM-5 [1] defines severity levels based on the need for support, categorizing patients as follows: Level I (requiring support), Level II (requiring substantial support), and Level III (requiring very substantial support). These levels are typically based on core symptoms of ASD. However, it is important to acknowledge that the presentation of these core symptoms is influenced by comorbid conditions, such as intellectual disabilities, anxiety, and depressive disorders, which can significantly impact an individual’s quality of life [55].
Recent literature, including a consensus by Lord et al. [2], introduced the term „profound autism” to describe individuals who are unable to live independently due to co-occurring intellectual disability, language impairment, epilepsy, or self-injury (e.g., hand-biting). Conversely, individuals with minimal or no language or intellectual impairment, without epilepsy or self-injury, can still experience extreme depression, high suicide risk [68], severe anxiety, and hypersensitivity, which may necessitate continuous support from family members or government services.
These factors likely explain why, in our cohort, the estimated severity levels based on required support were only weakly correlated with the dysfunction of cognitive brain networks. The presence of comorbidities and the complexity of individual needs may not be fully captured by a simple level of support measure based on core ASD symptoms alone.
Limitations
Our study has a few important limitations that should be considered when interpreting these findings. First, our study uses a cross-sectional approach to examine MRI patterns of neuroanatomical alterations across patients with varying levels of ASD severity. Additionally, we did not include a control group of age-matched typically developing individuals, which limits our ability to assess the magnitude of PVS dilation in ASD relative to typical development. This also prevents us from determining when PVS formation starts to manifest in ASD and how it compares to neurodevelopment in typically developing children.
Second, we selected key brain network regions based on an MRI-based parcellation [52] and several fMRI atlases [30,53,69], which are inherently different. The spatial definition of brain networks varies across parcellation methods, meaning that particular regions may be included or excluded depending on the specific approach used. Thus, while our results offer valuable insights, they may differ if other parcellation schemes or atlases were used.
Third, the relatively small sample size, along with the hospital-based case selection, may have introduced a bias towards more severe cases of autism, particularly those requiring MRI due to additional neurological or syndromic symptoms [46]. This could limit the generalizability of the results to the broader ASD population, as milder cases or those without additional comorbidities might not have been represented adequately.
Fourth, due to the exploratory nature of this study and the small sample size, we did not adjust for multiple comparisons. While this approach allowed us to identify potentially significant trends, it also introduces a risk of false positives. Further studies with larger sample sizes and proper multiple comparison adjustments are needed to confirm our findings.
Finally, the large amount of data analyzed may raise concerns regarding the casual or causal association between symptoms or assistance needs and the PVS measurements. However, it is important to note that the relationships between increased ePVS and the severity of symptoms or assistance needs were consistently unidirectional in all our analyses. Specifically, we observed that as ePVS increased, the severity of symptoms and the level of assistance required also increased, suggesting a clear pattern of association.
5. Conclusions
This study examined the neuroanatomical alterations associated with functional connectivity within three large-scale cognitive brain networks: the Default Mode Network (DMN), Salience Network (SN), and Central Executive/Frontal Parietal Network (CEN/FPN). Our findings demonstrate a significant association between enlarged PVS and the clinical expression of three core symptoms of ASD: language impairment, sensory disturbances, and motor stereotypies. Across the examined networks, the severity of symptomatology was consistently related to the extent of PVS enlargement—measured by count, diameter, and volume—though with some variability in terms of intensity and lateralization. These results align with our previous findings [44,45].
However, we observed only a weak association between PVS in key regions of the DMN and the left CEN/FPN and the level of support required for independent living. This weaker relationship may reflect that the demands for achieving a higher quality of life in ASD are not solely dependent on the functioning of cognitive networks but also on the dysfunction of smaller-scale, overlapping networks such as sensory, somatomotor, sensorimotor, language, visual, and limbic networks, in addition to comorbid psychiatric and neurological issues [39]. Previous studies have highlighted underconnectivity in regions outside classical cognitive networks, such as the anterior cingulate with eye-controlling areas of the frontal lobe [70], the insula with sensory processing areas [71], the amygdala with temporal regions [72], and motor areas with the cerebellum and thalamus [73], which may also contribute to functional impairments in ASD.
In conclusion, our study suggests that ePVS in the white matter underlying the DMN, CEN/FPN, and SN are strongly linked to the severity of ASD symptoms, but only moderately associated with the level of support needed for daily living. These findings underscore the importance of considering cognitive network alterations when developing individualized treatments for ASD symptoms, although further exploration of additional brain networks and comorbid conditions is essential for a comprehensive understanding of the disorder.
Supplementary Materials
The following supporting information can be downloaded at the website of this paper posted on Preprints.org, The online version contains supplementary material (Supplementary Table S1, Supplementary Table S2, Supplementary Table S3).
Author Contributions
SS and GB: conception and design of the project, elaboration and analysis of the database, writing the manuscript, read and approved the final manuscript. V.C. performed the clinical assessment of the patients, provided help and support for analysis and feedback on the manuscript, read and approved the final manuscript. MVP: statistical analysis of the data, provided feedback on the manuscript, read and approved the final manuscript; AN: performed clinical assessment of the patients, provide feedback on the manuscript, read and approved the final manuscript; SM: performed brain MRI of the patients, provide feedback on the manuscript, read and approved the final manuscript. AC: conception and design of the project, performed the clinical assessment of the patients, provided help and support for analysis and feedback on the manuscript, writing the manuscript, read and approved the final manuscript, writing the manuscript.
Funding
This work was supported by the grant “Bando Fondazione di Sardegna 2022 E 2023-Progetti di ricerca di Base e Dipartimentali (D.R.16/2022)”. The funding sources were not involved in study design, collection, analysis, interpretation of data and in the writing of the report.
Institutional Review Board Statement
This study was approved by the Ethics Committee of Azienda Ospedaliero-Universitaria, Cagliari, Italy (PROT. PG/2023/5144) and conducted in accordance with relevant regulations. Written informed consent was obtained from all parents or legal guardians.
Data Availability Statement
The dataset that support the findings of this study are available from the corresponding author, upon reasonable request.
Acknowledgments
We are very grateful to the patients, their parents and legal guardians who agreed to participate in this study. We are also grateful to Fondazione Banco di Sardegna for the unconditioned support.
Conflicts of Interest
The authors declare that there is no conflict of interest that could prejudice the impartiality of the research reported.
Abbreviations
| ADHD | Attention deficit hyperactivity disorder |
| ADOS-2 | Autism Diagnostic Observation Schedule, second edition |
| ASD | Autism spectrum disorder |
| CEN | Central executive network |
| CSF | Cerebrospinal fluid |
| DLPFC | Dorsolateral prefrontal cortex |
| DMN | Default mod network |
| DSM-5 | Diagnostic and Statistical Manual of Mental Disorders, Fifth Edition |
| ePVS | Enlarged |
| fMRI | functional Magnetic resonance imaging |
| FPN | Frontoparietal network |
| MRI | Magnetic resonance imaging |
| PVS | Perivascular spaces |
| SN | Salience network |
| WM | White matter |
References
- American Psychiatric Association aAPAD-TF. Diagnostic and Statistical Manual of Mental Disorders: DSM-5 (American Psychiatric Association, 2013).
- Lord C, Charman T, Havdahl A, et al. The Lancet Commission on the future of care and clinical research in autism. Lancet. 399, 271-334 (2022).
- Zuckerman, K. E. , Broder-Fingert, S., & Sheldrick, R. C. (2021). To reduce the average age of autism diagnosis, screen preschoolers in primary care. Autism, 25(2), 593-596. [CrossRef]
- Hadders-Algra, M. Emerging signs of autism spectrum disorder in infancy: Putative neural substrate. Dev Med Child Neurol. 2022 Nov;64(11):1344-1350. [CrossRef]
- McCrimmon A and Rostad, K. (2014). Test Review: Autism Diagnostic Observation Schedule, Second Edition (ADOS-2) Manual (Part II): Toddler Module. Journal of Psychoeducational Assessment, 32(1), 88-92. [CrossRef]
- Santos CLD, Barreto II, Floriano I, et al. Screening and diagnostic tools for autism spectrum disorder: Systematic review and meta-analysis. Clinics (Sao Paulo). 2024 Mar 13;79:100323. [CrossRef]
- Lord, C. , Rutter, M., & Le Couteur, A. (1994). Autism Diagnostic Interview—Revised: A revised version of a diagnostic interview for caregivers of individuals with possible pervasive developmental disorders. Journal of Autism and Developmental Disorders, 24(5), 659–685. [CrossRef]
- Schopler, E. , Reichler, R. J., DeVellis, R. F., & Daly, K. (1980). Childhood Autism Rating Scale (CARS, CPRS) APA PsycTests. [CrossRef]
- Carta A, Fucà E, Guerrera S, et al. Characterization of Clinical Manifestations in the Co-occurring Phenotype of Attention Deficit/Hyperactivity Disorder and Autism Spectrum Disorder. Front Psychol. 11, 861 (2020).
- Lai MC, Kassee C, Besney R, Bonato S, Hull L, Mandy W, et al. Prevalence of co-occurring mental health diagnoses in the autism population: a systematic review and meta-analysis. Lancet Psychiatry. 2019 Oct;6(10):819-829.
- Brambilla, P. , Hardan, A., di Nemi, S. U., Perez, J., Soares, J. C., & Barale, F. (2003). Brain anatomy and development in autism: review of structural MRI studies. Brain Res Bull, 61(6), 557-569.
- Nordahl CW, Lange N, Li DD, et al. Brain enlargement is associated with regression in preschool-age boys with autism spectrum disorders. Proc Natl Acad Sci USA. 108, 20195-20200 (2011).
- Donovan AP, Basson MA. The neuroanatomy of autism - a developmental perspective. J Anat. 2017 Jan;230(1):4-15. [CrossRef] [PubMed]
- Lamanna J, Meldolesi J. Autism Spectrum Disorder: Brain Areas Involved, Neurobiological Mechanisms, Diagnoses and Therapies. Int J Mol Sci. 25, 2423 (2024).
- Shen MD, Nordahl CW, Li DD, et al. Extra-axial cerebrospinal fluid in high-risk and normal-risk children with autism aged 2-4 years: a case-control study. Lancet Psychiatry. 5, 895-904 (2018).
- Li X, Ruan C, Zibrila AI, et al. Children with autism spectrum disorder present glymphatic system dysfunction evidenced by diffusion tensor imaging along the perivascular space. Medicine (Baltimore). 101:e32061 (2022).
- Wardlaw JM, Benveniste H, Nedergaard M, et al. Perivascular spaces in the brain: anatomy, physiology and pathology. Nat Rev Neurol. 6, 137-153 (2020).
- Yu L, Hu X, Li H, Zhao Y. Perivascular Spaces, Glymphatic System and MR. Front Neurol. 2022 May 3;13:844938. [CrossRef]
- Kamagata K, Saito Y, Andica C, et al. Noninvasive Magnetic Resonance Imaging Measures of Glymphatic System Activity. J Magn Reson Imaging. 59,1476-1493 (2022).
- Duering M, Biessels GJ, Brodtmann A, et al. Neuroimaging standards for research into small vessel disease-advances since 2013. Lancet Neurol. 2023 Jul;22(7):602-618. Erratum in: Lancet Neurol. 2023 Sep;22(9): e10. Erratum in: Lancet Neurol. 2023 Sep;22(9):e10.
- Granberg, T. et al. Enlarged perivascular spaces in multiple sclerosis on magnetic resonance imaging: a systematic review and meta-analysis. J Neurol 267, 3199-3212 (2020).
- Taber KH, Shaw JB, Loveland KA, et al. Accentuated Virchow-Robin spaces in the centrum semiovale in children with autistic disorder. J Comput Assist Tomogr. 28, 263-268 (2004).
- Zeegers M, Van Der Grond J, Durston S, et al. Radiological findings in autistic and developmentally delayed children. Brain Dev. 28, 495-499 (2006).
- Boddaert N, Zilbovicius M, Philipe A, et al. MRI findings in 77 children with non-syndromic autistic disorder. PLoS One. 4, e4415 (2022).
- Garic D, McKinstry RC, Rutsohn J. et al. Enlarged Perivascular Spaces in Infancy and Autism Diagnosis, Cerebrospinal Fluid Volume, and Later Sleep Problems. JAMA Network Open. 6, e2348341 (2023).
- Hayden MR. Brain endothelial cell activation and dysfunction associate with and contribute to the development of enlarged perivascular spaces and cerebral small vessel disease. Histol Histopathol. 2024 Dec;39(12):1565-1586. [CrossRef]
- Uddin LQ, Castellanos FX, Menon V. Resting state functional brain connectivity in child and adolescent psychiatry: where are we now? Neuropsychopharmacology. 2024 Nov;50(1):196-200. [CrossRef]
- Supekar K, Musen M, Menon V. Development of large-scale functional brain networks in children. PLoS Biol. 2009;7:e1000157.
- Uddin, LQ, Betzel RF, Cohen JR, Damoiselastx JS, De Brigard F, Eickhoff SB, et al (2023). Controversies and progress on standardization of large-scale brain network nomenclature. Network Neuroscience. 7 (3): 864–903.
- Dadi, K. , Varoquaux, G., Machlouzarides-Shalit, A., Gorgolewski, K., Wassermann, D., Thirion, B., et al. (2020). Fine-grain atlases of functional modes for fMRI analysis. NeuroImage 221:117126. [CrossRef]
- Blume J, Dhanasekara CS, Kahathuduwa CN, Mastergeorge AM. Central Executive and Default Mode Networks: An Appraisal of Executive Function and Social Skill Brain-Behavior Correlates in Youth with Autism Spectrum Disorder. J Autism Dev Disord. 2024 May;54(5):1882-1896. [CrossRef]
- Menon, V. 20 years of the default mode network: a review and synthesis. Neuron. 2023;111:2469–87.
- Zhang Y, Lin L, Zhou D, Song Y, Stein A, Zhou S, et al. Age-related unstable transient states and imbalanced activation proportion of brain networks in people with autism spectrum disorder: A resting-state fMRI study using coactivation pattern analyses. Netw Neurosci. 2024 Dec 10;8(4):1173-1191.
- Zhu JS, Gong Q, Zhao MT, Jiao Y. Atypical brain network topology of the triple network and cortico-subcortical network in autism spectrum disorder. Neuroscience. 2025 Jan 9;564:21-30. [CrossRef]
- Miller EK, Cohen JD. An integrative theory of prefrontal cortex function. Annu Rev Neurosci. 2001;24:167-202. [CrossRef]
- Turner KC, Frost L, Linsenbardt D, et al. Atypically diffuse functional connectivity between caudate nuclei and cerebral cortex in autism. Behav Brain Funct 2, 34 (2006).
- Uddin, LQ. Salience processing and insular cortical function and dysfunction. Nat Rev Neurosci. 2015;16:55–61.
- Lin P, Zang S, Bai Y, Wang H. Reconfiguration of Brain Network Dynamics in Autism Spectrum Disorder Based on Hidden Markov Model. Front Hum Neurosci. 2022 Feb 8;16:774921. [CrossRef]
- Hong S-J, Vogelstein JT, Gozzi A, Bernhardt BC, Yeo BTT, Milham MP, et al. Toward neurosubtypes in autism. Biol Psychiatry. 2020;88:111–28.
- Di Martino A, Yan CG, Li Q, Denio E, Castellanos FX, Alaerts K, Anderson JS, et al. The autism brain imaging data exchange: towards a large-scale evaluation of the intrinsic brain architecture in autism. Molecular psychiatry. 2013.
- Kennedy DP, Courchesne E. (2008): „The intrinsic functional organization of the brain is altered in autism.” NeuroImage, 39(4), 1877-1885.
- Guo X, Zhai G, Liu J, Zhang X, Zhang T, Cui D, Zhou R, Gao L. Heterogeneity of dynamic synergetic configurations of salience network in children with autism spectrum disorder. Autism Res. 2023 Dec;16(12):2275-2290. [CrossRef]
- Park S, Thomson P, Kiar G, Castellanos FX, Milham MP, Bernhardt B, Di Martino A. Delineating a Pathway for the Discovery of Functional Connectome Biomarkers of Autism. Adv Neurobiol. 2024;40:511-544. [CrossRef]
- Sotgiu MA, Lo Jacono A, Barisano G, et al. Brain perivascular spaces and autism: clinical and pathogenic implications from an innovative volumetric MRI study. Front Neurosci. 17, 1205489 (2023).
- Sotgiu S, Cavassa V, Puci MV, Sotgiu MA, Turilli D, Lo Jacono A, et al. Enlarged perivascular spaces under the dorso-lateral prefrontal cortex and severity of autism. Scientific Report 2025, submitted, (the manuscript is under the second round of revision).
- NICE—National Institute for Health and Clinical Excellence Autism—Quality standard (QS51) 2014 (n.d.). Available at: https://www.nice.org.uk/guidance/qs51.
- Puonti O, Iglesias JE, Van Leemput K. Fast and sequence-adaptive whole-brain segmentation using parametric Bayesian modeling. Neuroimage. 2016;143:235-249. [CrossRef]
- Cox RW. AFNI: software for analysis and visualization of functional magnetic resonance neuroimages. Comput Biomed Res. 1996 Jun;29(3):162-73. [CrossRef] [PubMed]
- Barisano G, Sheikh-Bahaei N, Law M, et al. Body mass index, time of day and genetics affect perivascular spaces in the white matter. J Cereb Blood Flow Metab. 41, 1563-1578 (2021).
- Potter GM, Chappell FM, Morris Z, and Wardlaw JM (). Cerebral perivascular spaces visible on magnetic resonance imaging: development of a qualitative rating scale and its observer reliability. Cerebrovasc Dis. 39, 224–231 (2015).
- Barisano G, Lynch KM, Sibilia F, et al. Imaging perivascular space structure and function using brain MRI. Neuroimage. 257, 119329 (2022).
- Klein A, Tourville J. 101 labeled brain images and a consistent human cortical labeling protocol. Front Neurosci. 6, 171 (2012).
- Schaefer, A. , Kong, R., Gordon, E., Laumann, T., Zuo, X., Holmes, A., et al. (2018). Local-global parcellation of the human cerebral cortex from intrinsic functional connectivity MRI. Cereb. Cortex 28, 3095–3114. [CrossRef]
- Greene DJ, Marek S, Gordon EM, Siegel JS, Gratton C, Laumann TO, et al. Integrative and Network-Specific Connectivity of the Basal Ganglia and Thalamus Defined in Individuals. Neuron. 2020 Feb 19;105(4):742-758.e6. [CrossRef]
- Waizbard-Bartov E, Fein D, Lord C, David G, Amaral DG. Autism severity and its relationship to disability Autism Res. 2023 April ; 16(4): 685–696.
- Ye Z, Zhou X. Executive control in language processing. Neurosci Biobehav Rev. 2009 Sep;33(8):1168-77. [CrossRef]
- Sherman LE, Rudie JD, Pfeifer JH, Masten CL, McNealy K, Dapretto M. Development of the default mode and central executive networks across early adolescence: a longitudinal study. Dev Cogn Neurosci. 2014 Oct;10:148-59. [CrossRef]
- Adolphs, R. The neurobiology of social cognition. Curr Opin Neurobiol. 2001 Apr;11(2):231-9. [CrossRef]
- Gordon EM, Laumann TO, Marek S, Raut RV, Gratton C, Newbold DJ, et al. Default-mode network streams for coupling to language and control systems. Proc Natl Acad Sci U S A. 2020 Jul 21;117(29):17308-17319. [CrossRef]
- Maximo JO, Cadena EJ, Kana RK. The implications of brain connectivity in the neuropsychology of autism. Neuropsychol Rev. 2014 Mar;24(1):16-31. [CrossRef]
- Crinion J, Turner R, Grogan A, Hanakawa T, Noppeney U, Devlin JT, et al. Language control in the bilingual brain. Science. 2006 Jun 9;312(5779):1537-40.
- Baron-Cohen S, Ashwin E, Ashwin C, Tavassoli T, Chakrabarti B. Talent in autism: hyper-systemizing, hyper-attention to detail and sensory hypersensitivity. Philos Trans R Soc Lond B Biol Sci. 2009 May 27;364(1522):1377-83. [CrossRef]
- Koziol LF, Budding DE, Chidekel D. Sensory integration, sensory processing, and sensory modulation disorders: putative functional neuroanatomic underpinnings. Cerebellum. 2011 Dec;10(4):770-92. [CrossRef]
- Menon V, Uddin LQ. Saliency, switching, attention and control: a network model of insula function. Brain Struct Funct. 2010 Jun;214(5-6):655-67. [CrossRef]
- Wang Y, Xu L, Fang H, Wang F, Gao T, Zhu Q, et al. Social Brain Network of Children with Autism Spectrum Disorder: Characterization of Functional Connectivity and Potential Association with Stereotyped Behavior. Brain Sci. 2023 Feb 7;13(2):280. [CrossRef]
- Lemonda BC, Holtzer R, Goldman S. Relationship between executive functions and motor stereotypies in children with Autistic Disorder. Res Autism Spectr Disord. 2012 Jul 1;6(3):1099-1106. [CrossRef]
- Di Martino A, Kelly C, Grzadzinski R, et al. Aberrant striatal functional connectivity in children with autism. Biol Psychiatry. 69, 847-856 (2011).
- Kolves, K., Fitzgerald, C., Nordentoft, M., Wood, S.J., & Erlangsen, A. Assessment of suicidal behaviors among individuals with autism spectrum disorder in Denmark. JAMA Network Open 2021, 4, e2033565.
- Eickhoff SB, Yeo BTT, Genon S. Imaging-based parcellations of the human brain. Nat Rev Neurosci. 2018 Nov;19(11):672-686. [CrossRef]
- Agam Y, Joseph RM, Barton JJ, Manoach DS. Reduced cognitive control of response inhibition by the anterior cingulate cortex in autism spectrum disorders. NeuroImage. 2010; 52:336–347. [PubMed: 20394829].
- Ebisch SJ, Gallese V, Willems RM, Mantini D, Groen WB, Romani GL, Buitelaar JK, Bekkering H. Altered intrinsic functional connectivity of anterior and posterior insula regions in highfunctioning participants with autism spectrum disorder. Human brain mapping. 2011; 32:1013–1028. [PubMed: 20645311].
- Monk CS, Weng SJ, Wiggins JL, Kurapati N, Louro HM, Carrasco M, et al. Neural circuitry of emotional face processing in autism spectrum disorders. Journal of psychiatry & neuroscience: JPN. 2010; 35:105–114. [PubMed: 20184808].
Figure 1.
Key regions of the three networks under study. DMN = Default Mode Network (purple: angular gyrus, medial orbitofrontal, middle temporal, posterior cingulate, and precuneus); CEN/FPN = Central Executive and Frontotemporal Networks (dark blue: caudal anterior cingulate, inferior parietal, inferior temporal, lateral orbitofrontal, caudate head, and rostral middle frontal); SN = Salience Network (light blue: insula and rostral anterior cingulate). The DMN key regions are: angular gyrus, medial orbitofrontal cortex, middle temporal cortex, posterior cingulate, and precuneus. The CEN/FPN key regions include: caudal anterior cingulate, inferior parietal cortex, inferior temporal cortex, lateral orbitofrontal cortex, caudate (head), and rostral middle frontal cortex.
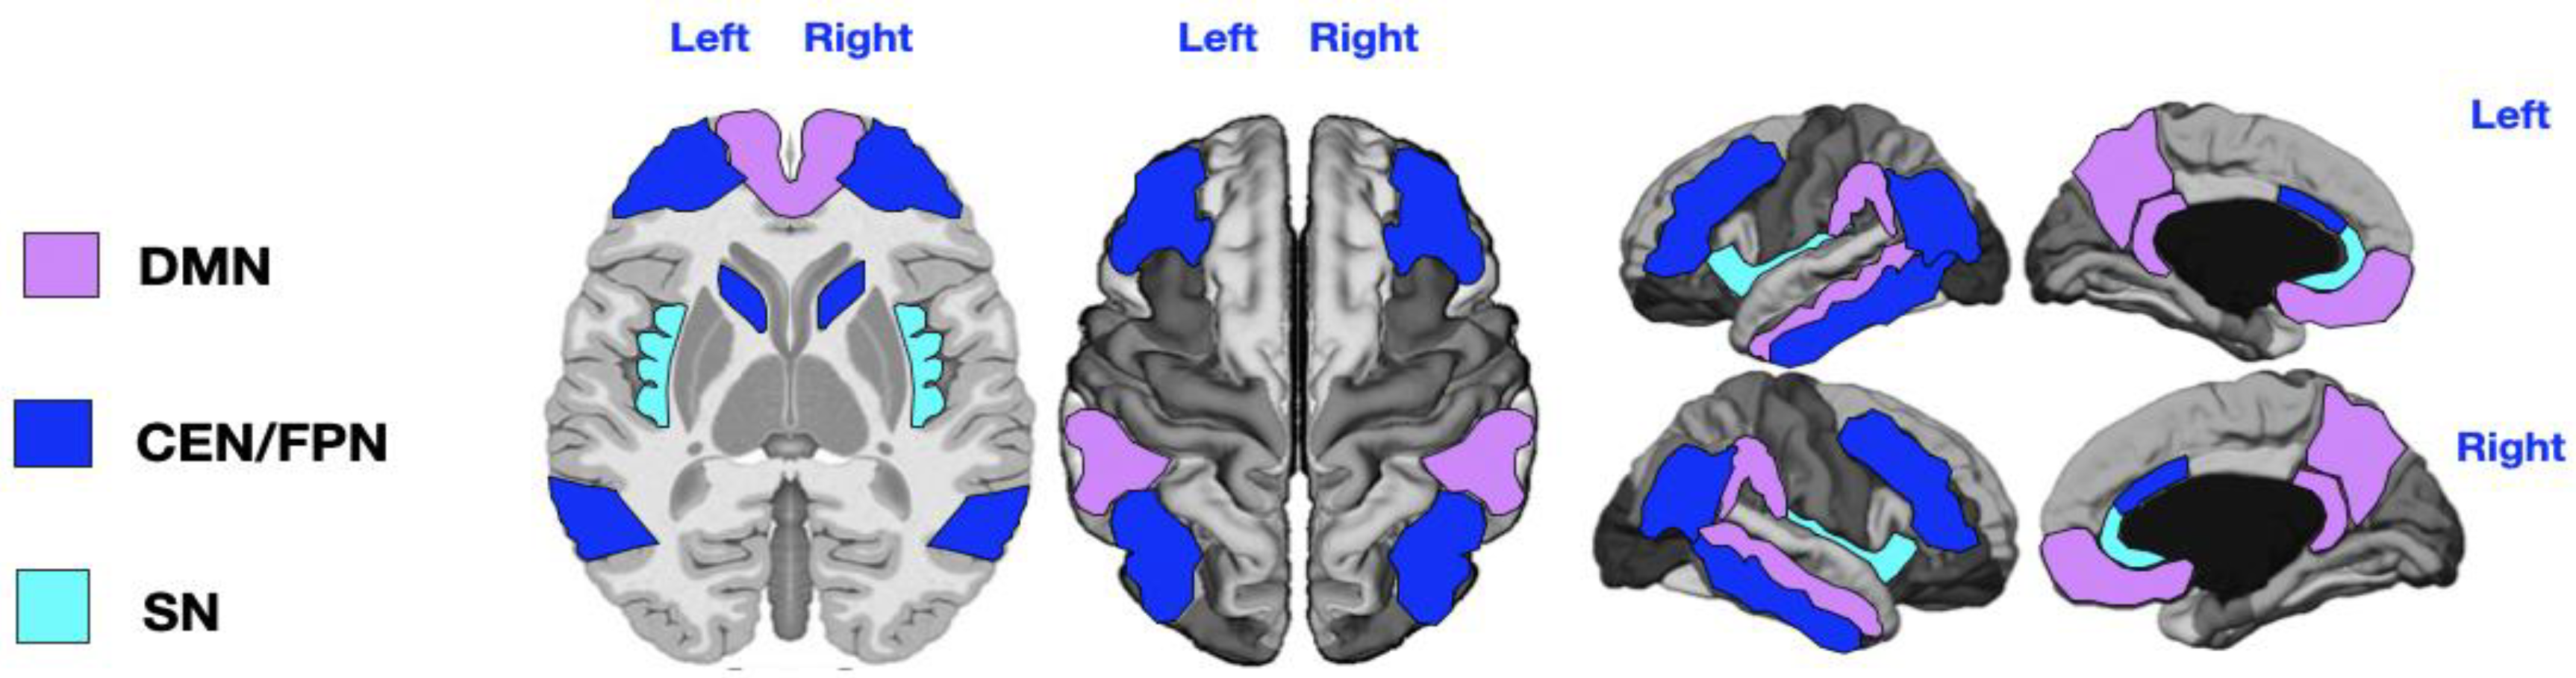
Figure 2.
Mapping of PVS enlargement in relation to the degree of language impairment. Colored areas represent significant differences in median values (IQR) of PVS number, volume, and diameter between ASD patients with low vs. high language impairment. Areas are colored based on the extent of PVS abnormalities: Yellow = single abnormality (PVS count, volume, or diameter); Orange = two PVS abnormalities; Red = all three PVS abnormalities. Worse language symptoms are associated with more pronounced PVS alterations, particularly in the left CEN/FPN (red).
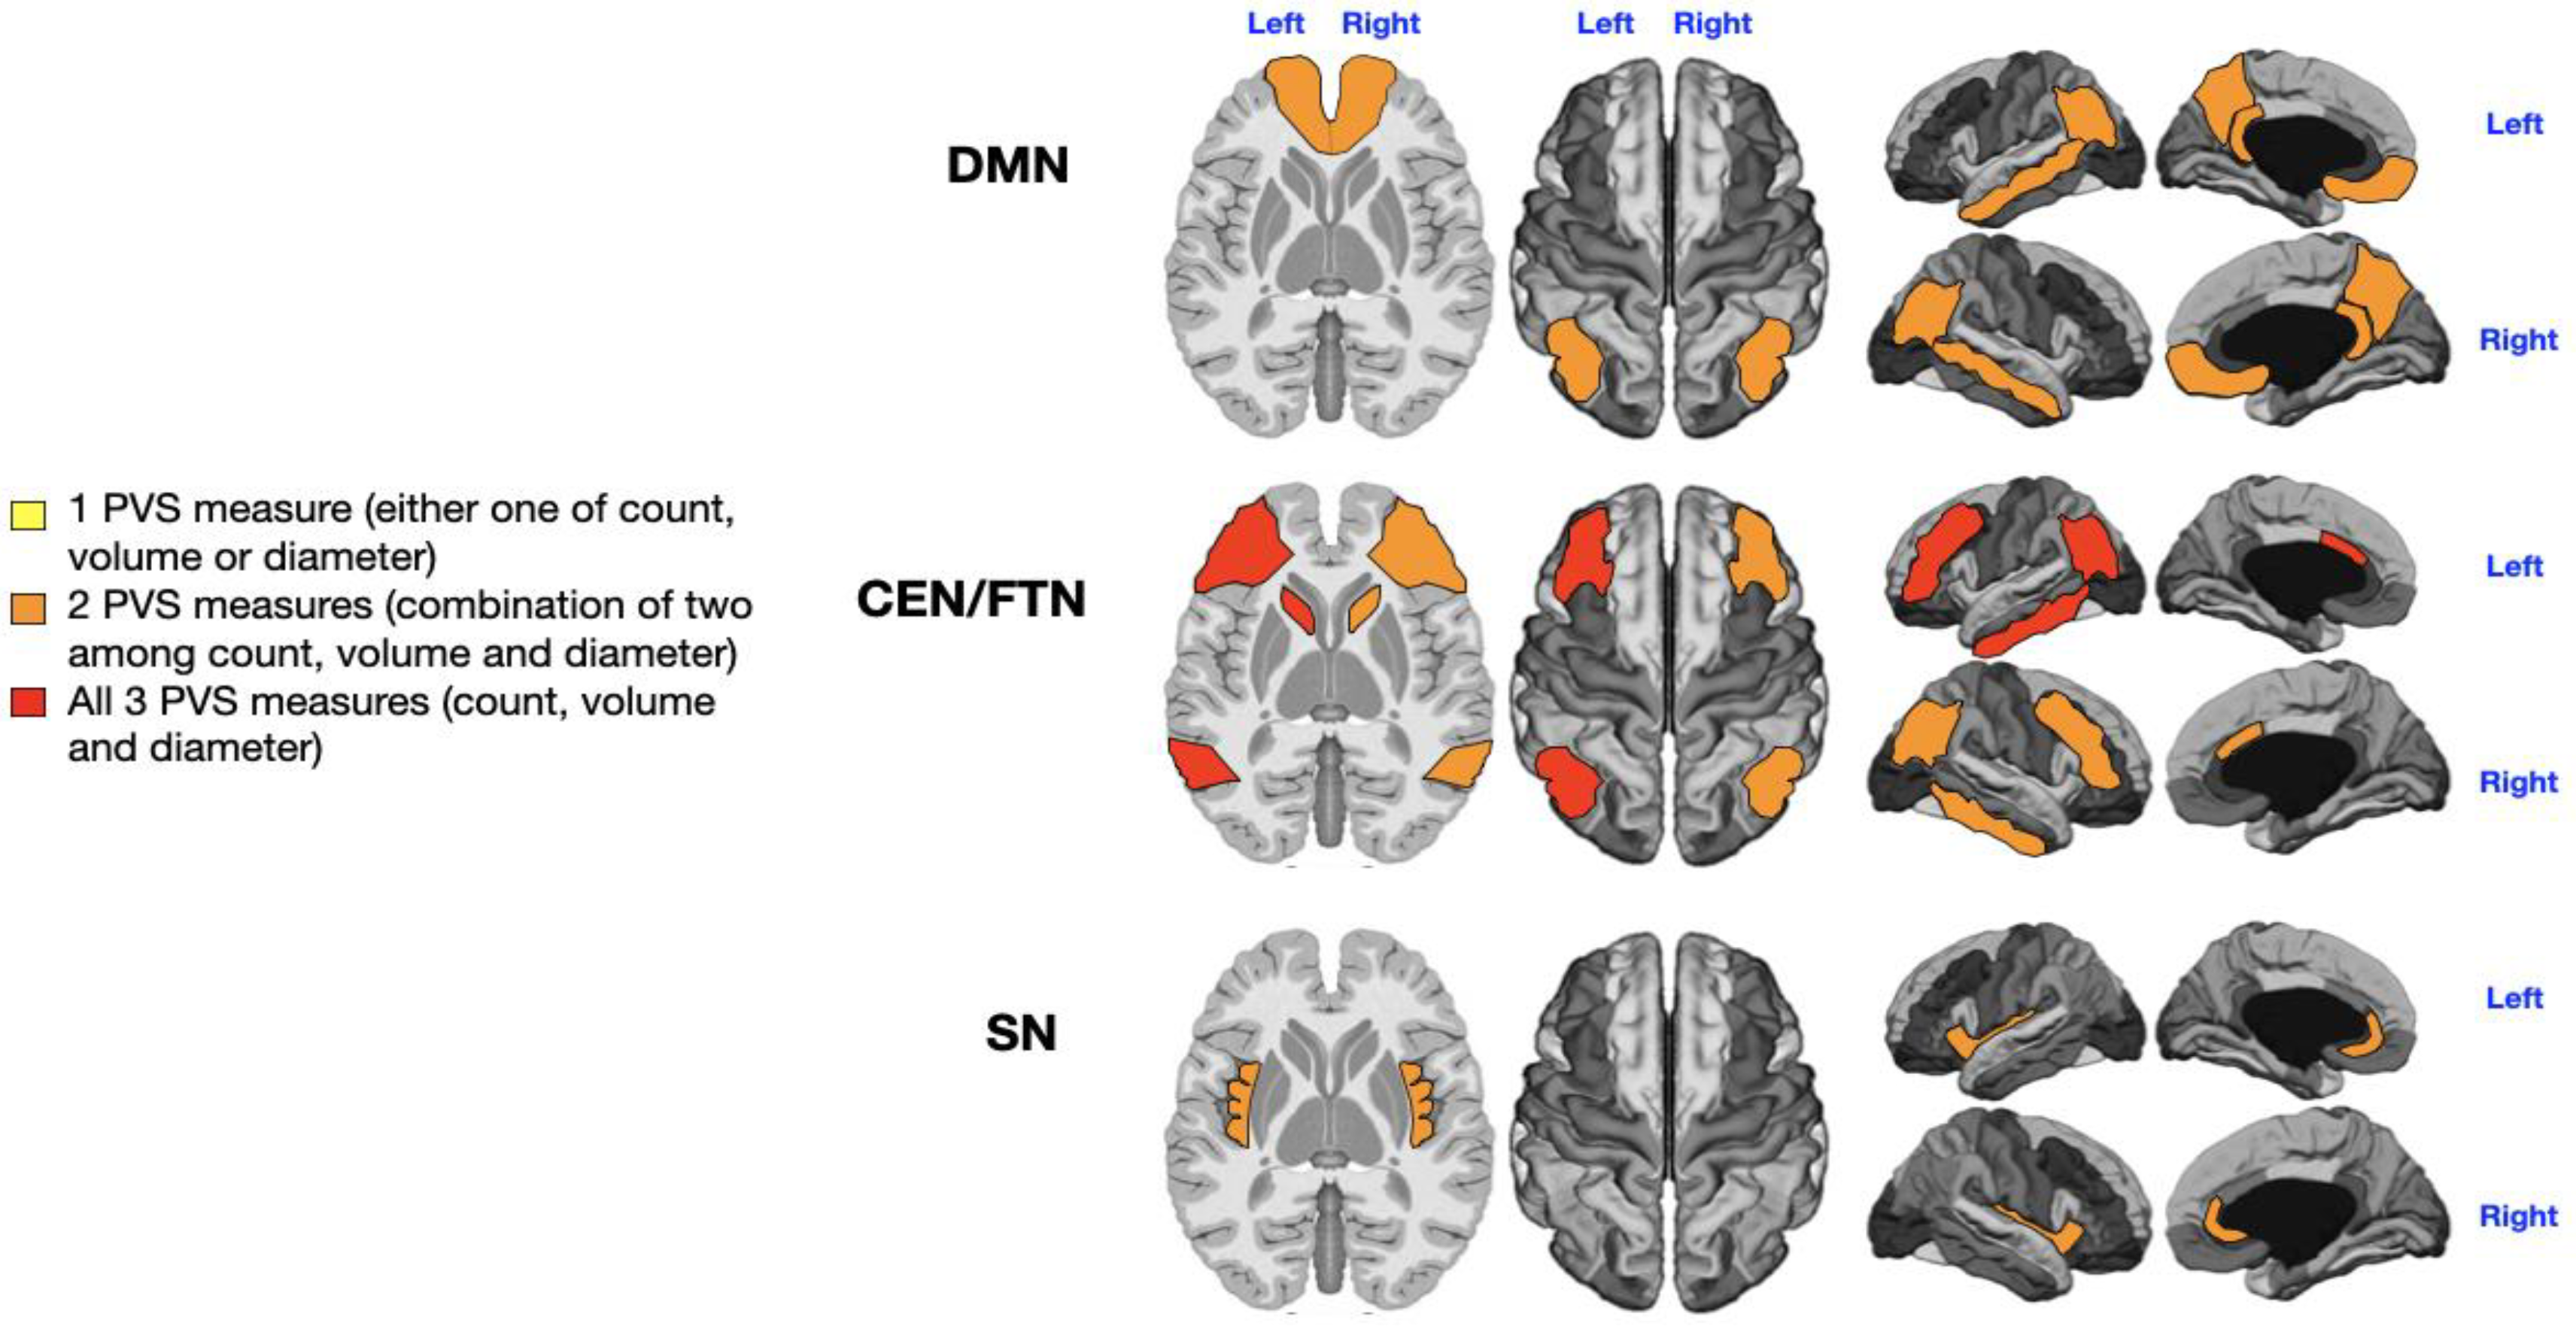
Figure 3.
Mapping of PVS enlargement in relation to the presence or absence of sensory disturbances. Colored areas represent significant differences in median values (IQR) of PVS number, volume, and diameter between ASD patients with low vs. high sensory disturbances. Areas are colored based on the extent of PVS abnormalities: Yellow = single abnormality (PVS count, volume, or diameter); Orange = two PVS abnormalities; Red = all three PVS abnormalities. The presence of sensory symptoms is associated with more severe PVS alterations in both CEN/FPNs and the right DMN (red). Minimal enlargement (yellow) in the left DMN and right SN are also significantly associated with sensory issues.
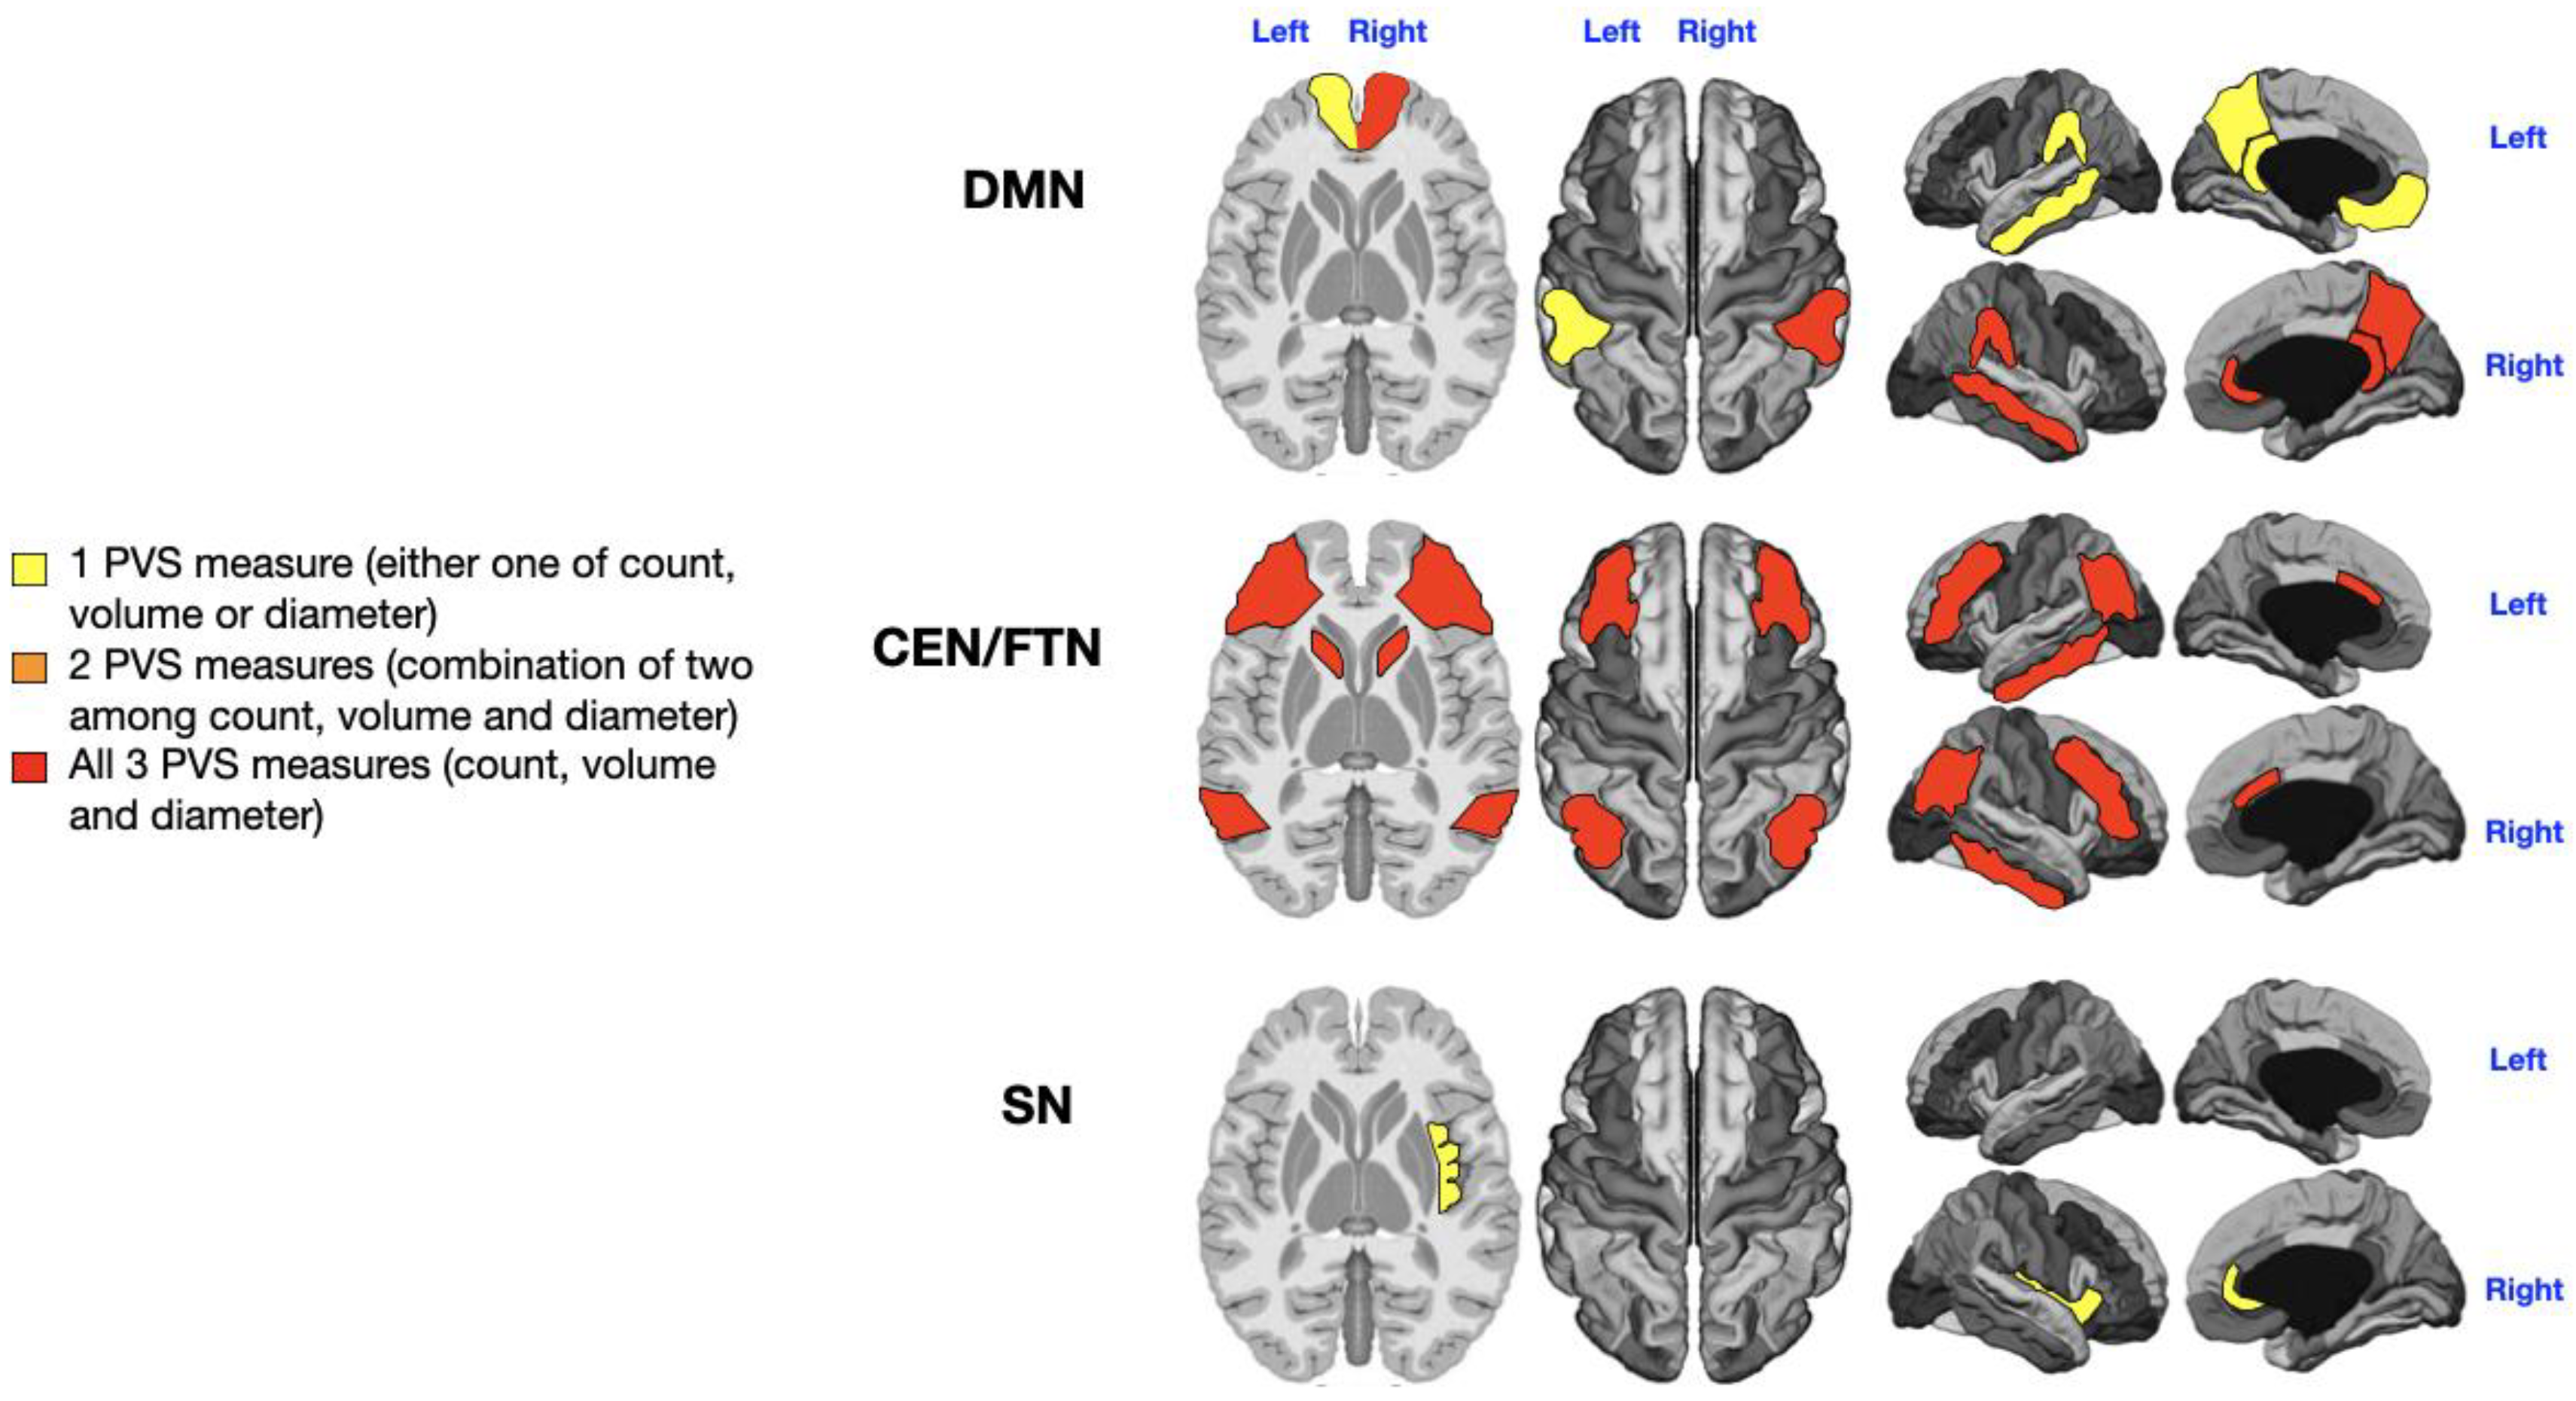
Figure 4.
Mapping of PVS enlargement in relation to the presence or absence of motor stereotypies. Colored areas represent significant differences in median values (IQR) of PVS number, volume, and diameter between ASD patients with low vs. high motor stereotypies. Areas are colored based on the extent of PVS abnormalities: Yellow = single abnormality (PVS count, volume, or diameter); Orange = two PVS abnormalities; Red = all three PVS abnormalities. Motor stereotypies are linked to more significant PVS alterations in both CEN/FPNs and the left DMN (red). A minimal enlargement (yellow) in the right DMN and right SN are also significantly associated with motor stereotypies.
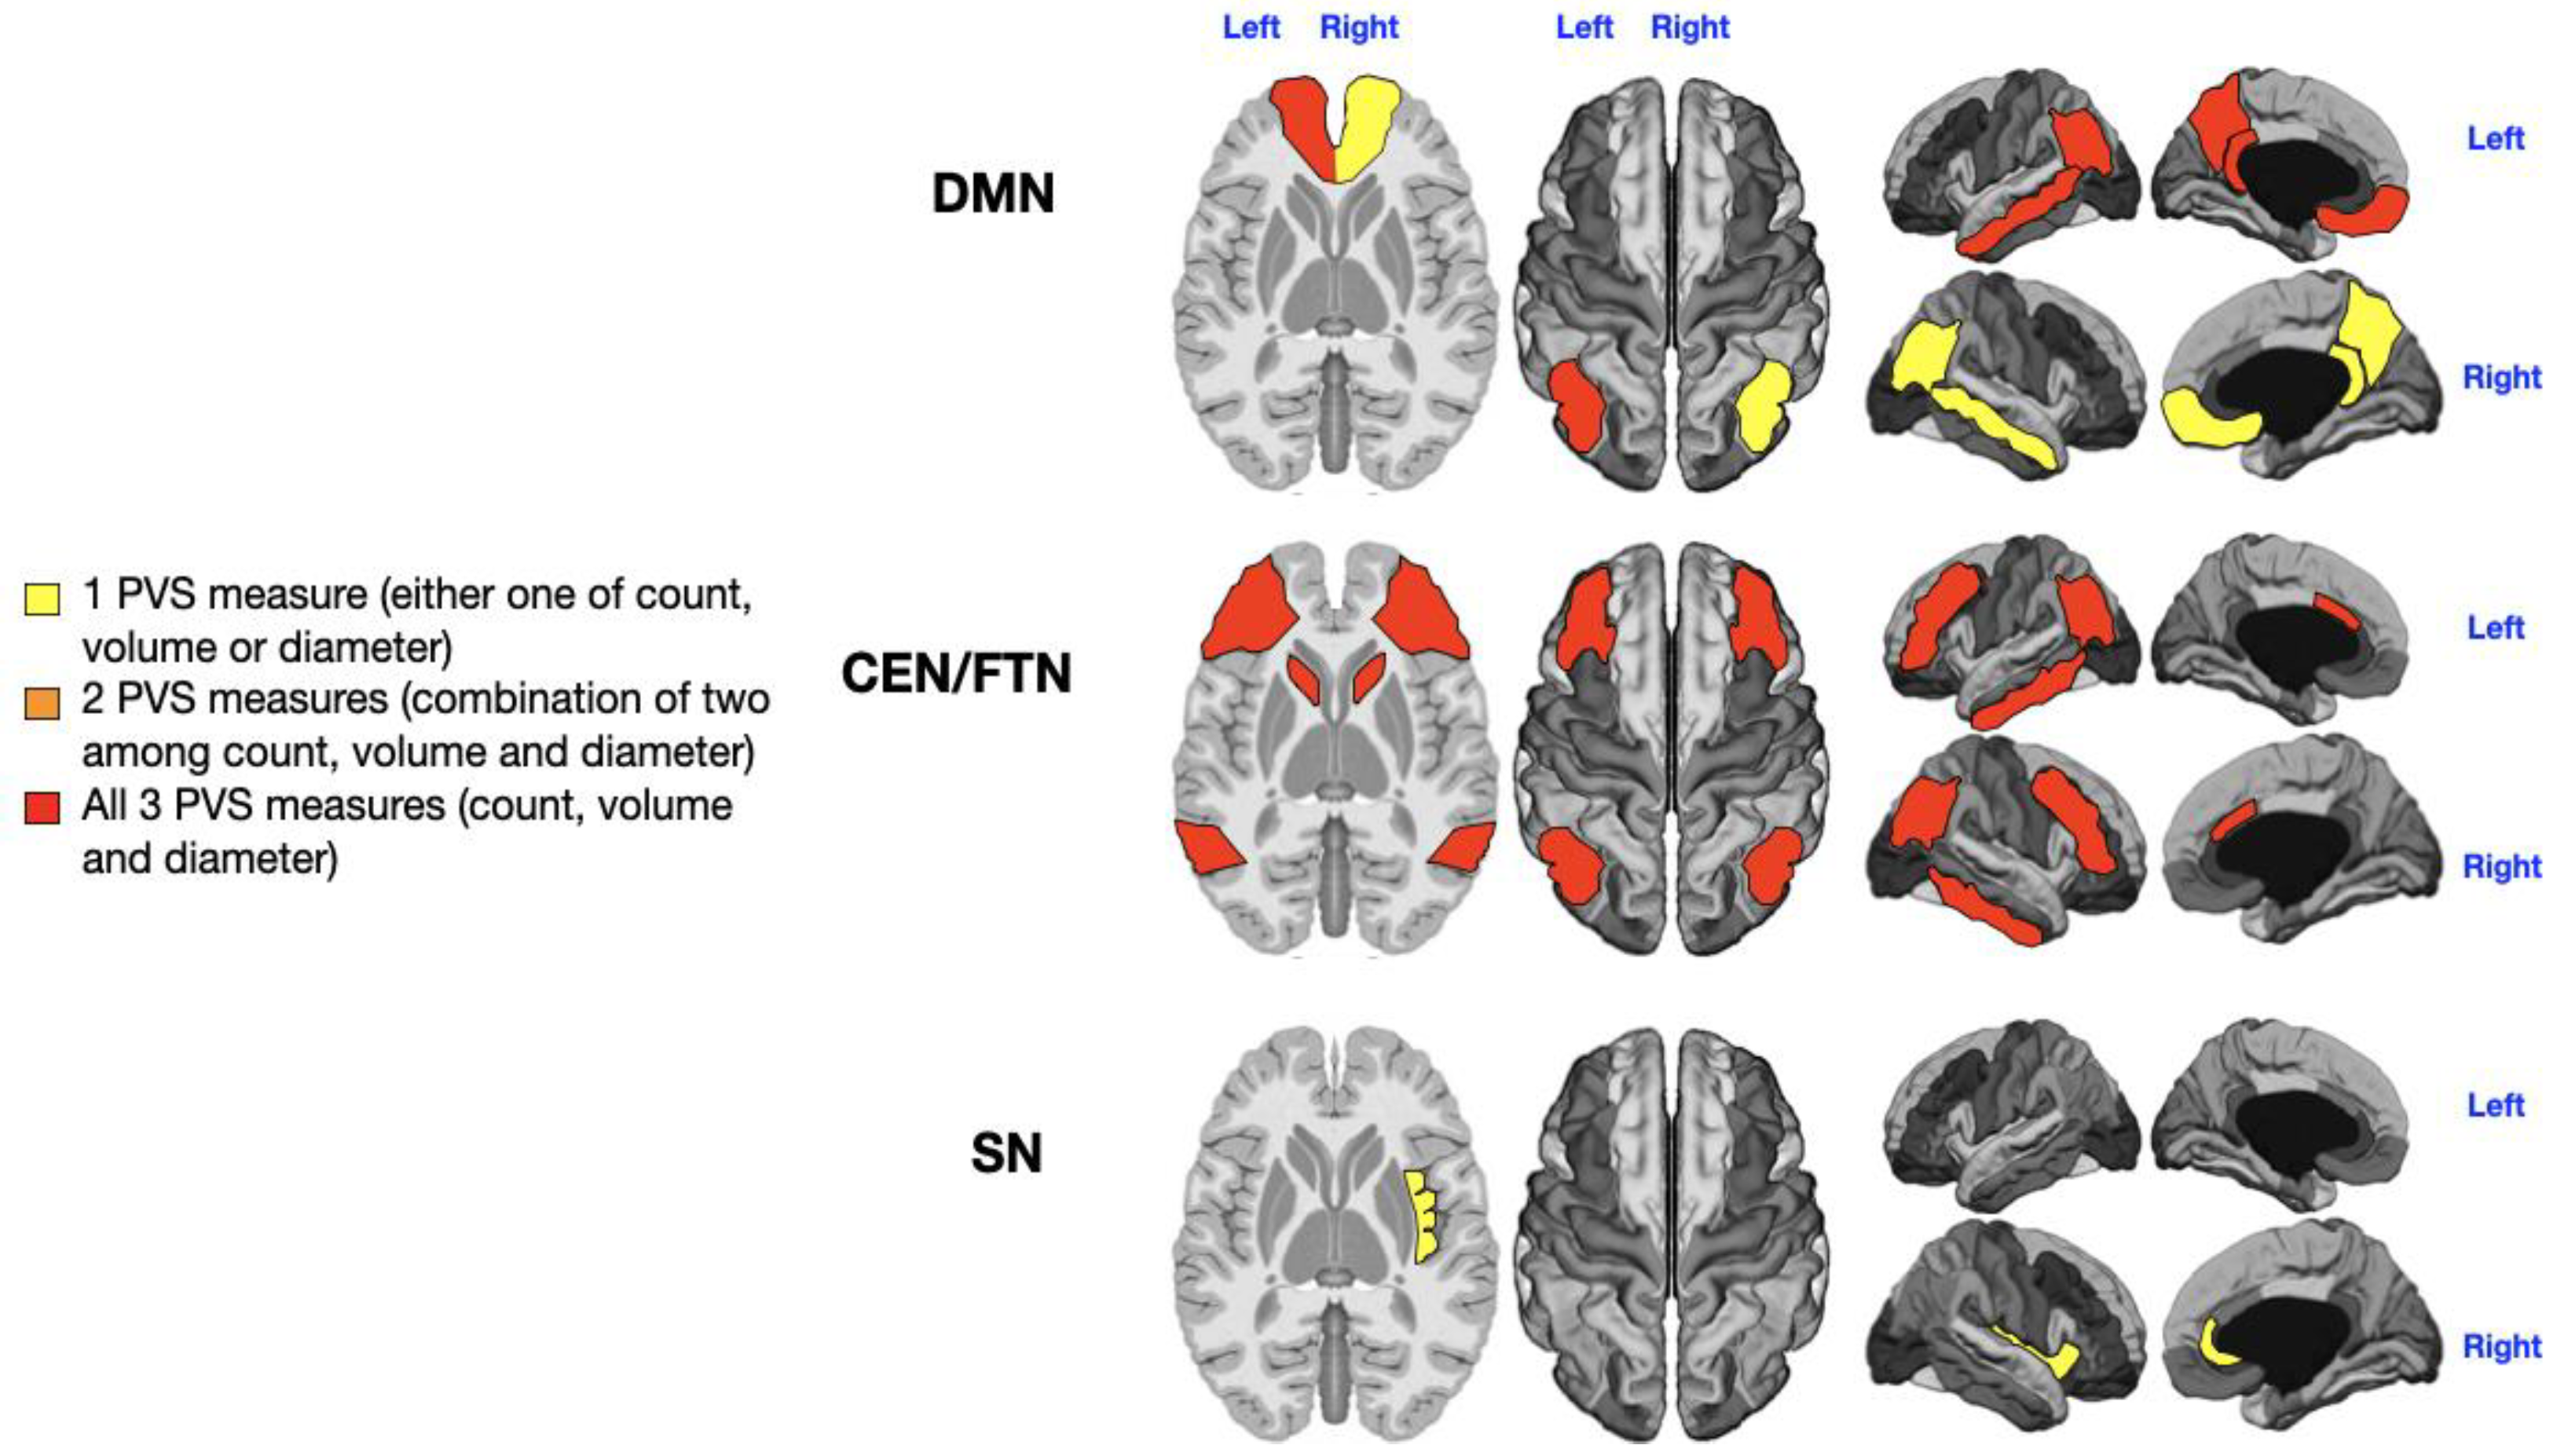
Figure 5.
Mapping of PVS enlargement in relation to the level of rehabilitation needs. Colored areas represent significant differences in median values (IQR) of PVS number, volume, and diameter between ASD patients with low vs. high rehabilitation needs. Areas are colored based on the extent of PVS abnormalities: Yellow = single abnormality (PVS count, volume, or diameter); Orange = two PVS abnormalities; No areas showing all three PVS abnormalities (count, volume, and diameter). Higher rehabilitation needs are associated with moderate PVS alterations, especially in the left CEN/FPN (orange). A minimal enlargement (yellow) in both DMNs is also significantly associated with rehabilitation needs.
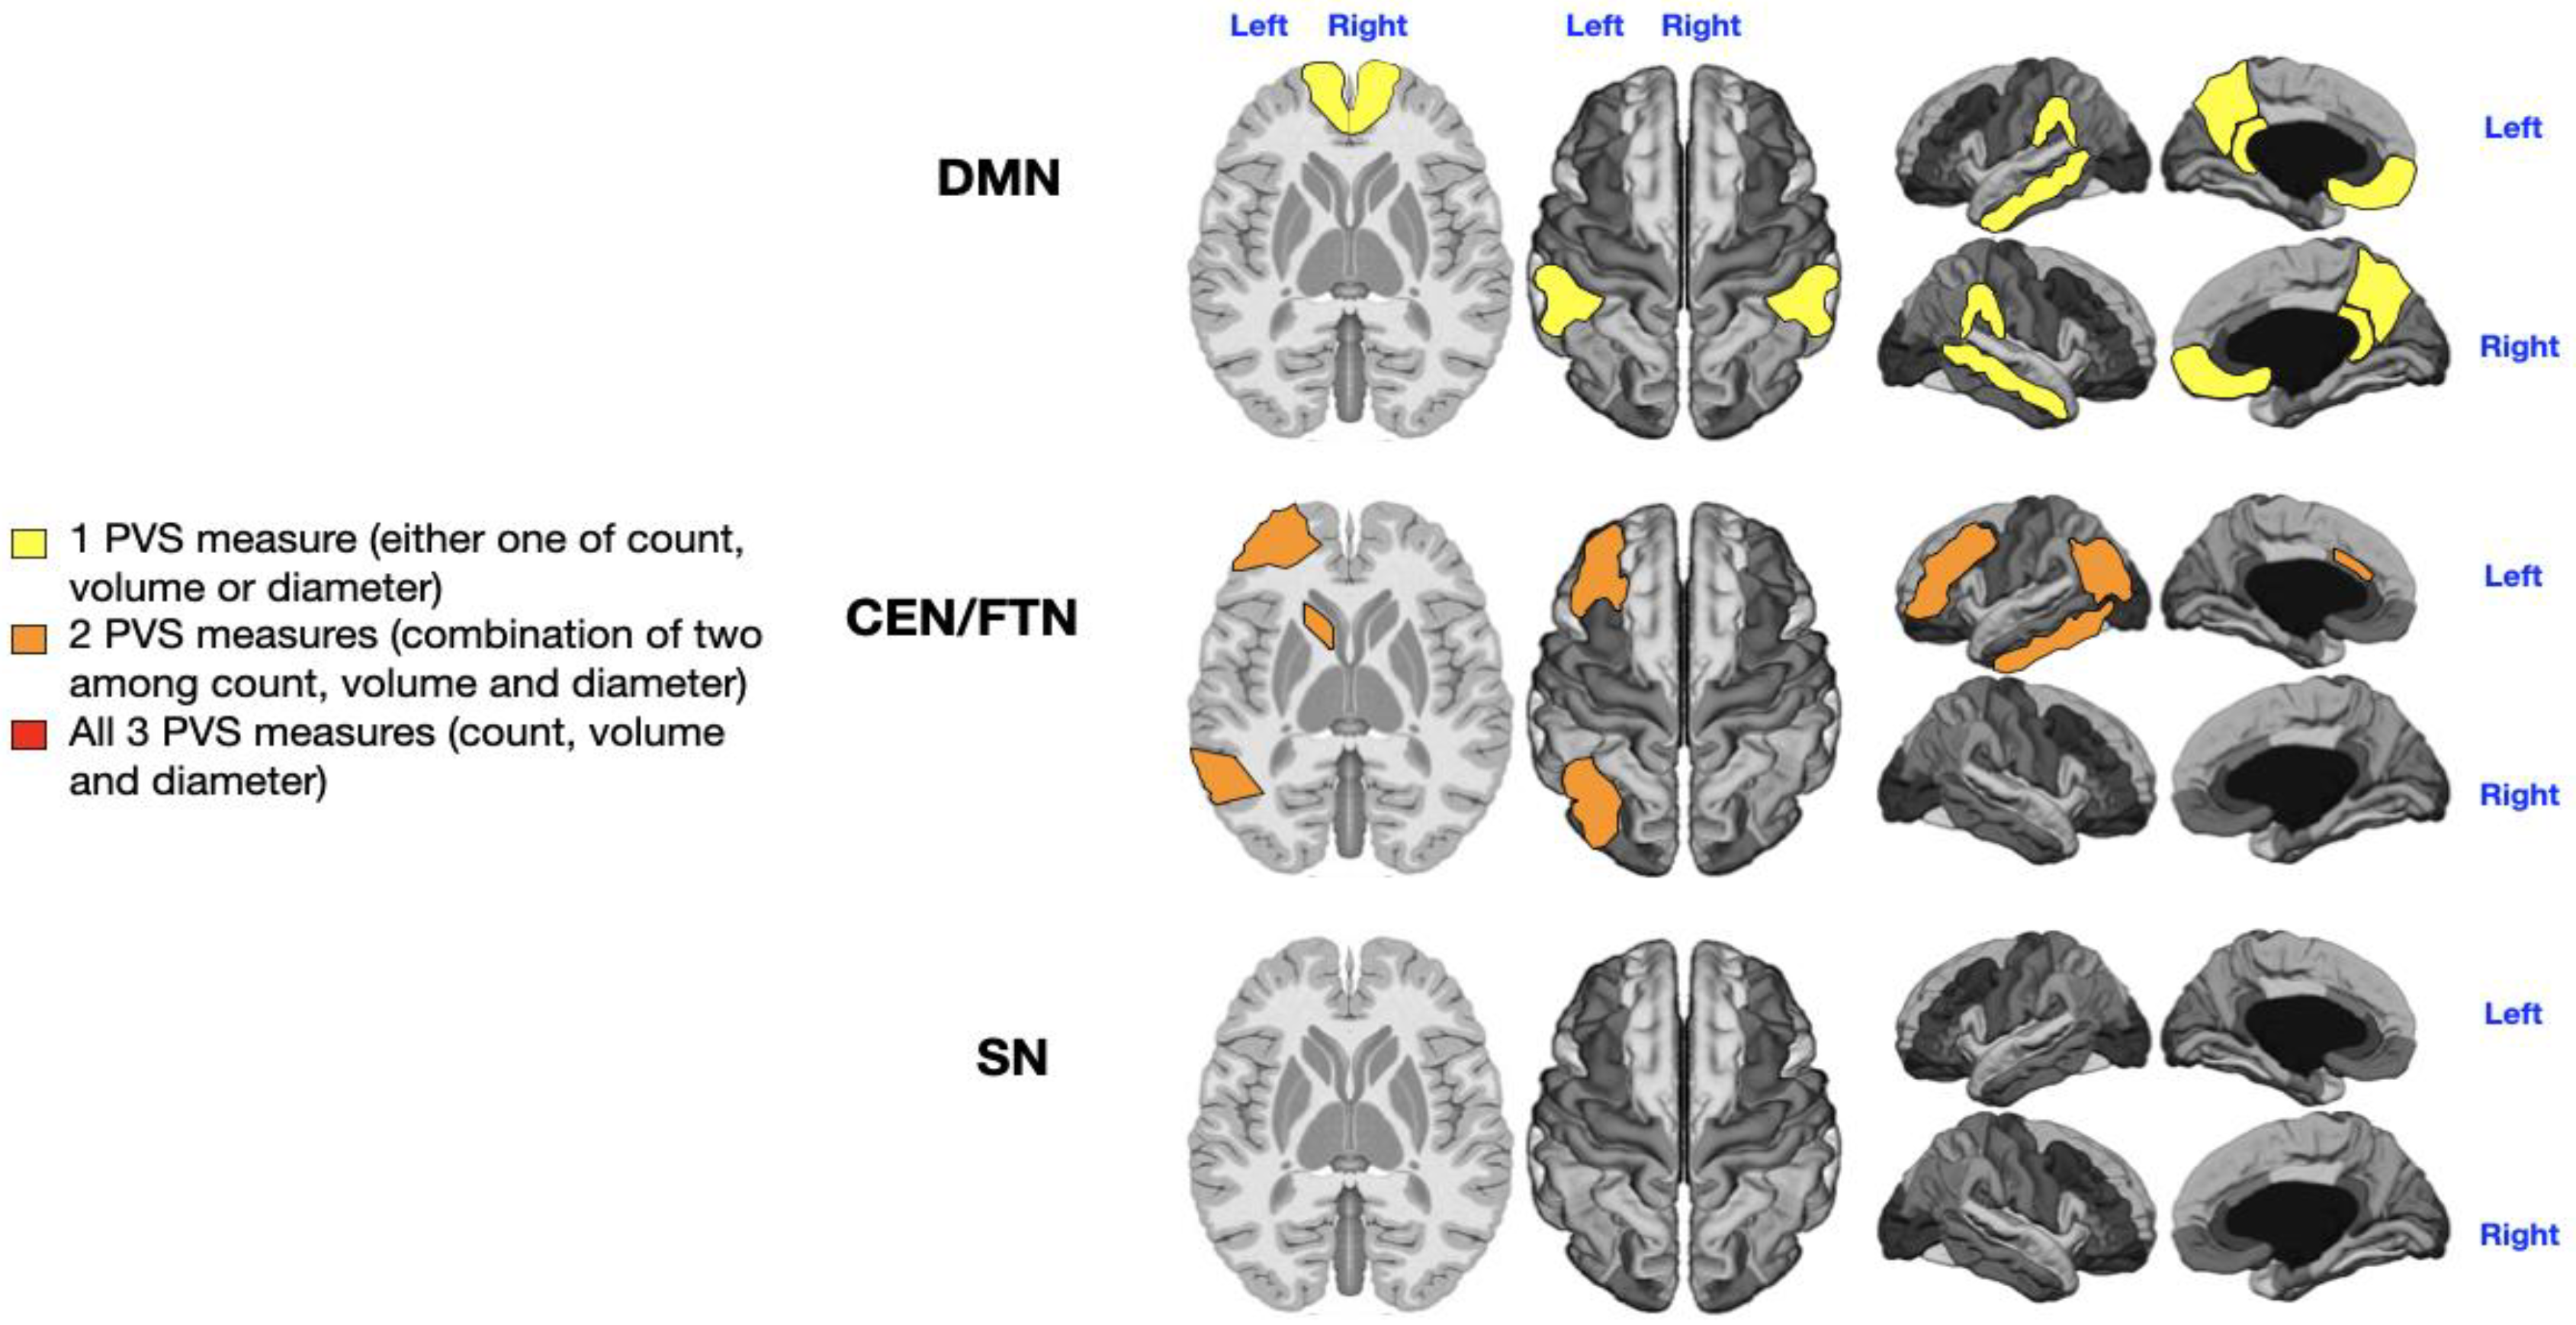

Table 1.
Clinical and demographic information of the cohort of subjects with ASD.
| Age (n= 36) |
Mean= 4 y (SD 2.3) Range= 1-9 y |
≤3y (n =21) >3y (n =15) |
|
|---|---|---|---|
| Sex (n= 36) | M= 22 | F = 14 | |
| Level of rehab needs (n=36) | Level 1 and 2 (n= 16) | Level3 (n= 20) | |
| Motor stereotypes (n= 33) | Yes (n= 17) | No (n= 16) | n.k. (n= 3) |
| Sensorial disturbances (n= 33) | Yes (n= 20) | No (n= 13) | n.k. (n= 3) |
| Language impairment (n= 36) | low-moderate (n= 21) | Absent language (n= 15) |
M= males; F= females; y= years; SD= standard deviation; n.k.= not known.
Disclaimer/Publisher’s Note: The statements, opinions and data contained in all publications are solely those of the individual author(s) and contributor(s) and not of MDPI and/or the editor(s). MDPI and/or the editor(s) disclaim responsibility for any injury to people or property resulting from any ideas, methods, instructions or products referred to in the content. |
© 2025 by the authors. Licensee MDPI, Basel, Switzerland. This article is an open access article distributed under the terms and conditions of the Creative Commons Attribution (CC BY) license (http://creativecommons.org/licenses/by/4.0/).
Copyright: This open access article is published under a Creative Commons CC BY 4.0 license, which permit the free download, distribution, and reuse, provided that the author and preprint are cited in any reuse.


