
Submitted:
25 February 2025
Posted:
28 February 2025
You are already at the latest version
Abstract
Tracing the root causes of defective products in liquid storage tank (LST) production poses a formidable challenge due to the complexity and coupling of the processes within the production. In this paper, the problem of tracing the root cause of defective LST products which is caused by process parameter deviations or human operation errors during production is studied. A root cause tracing method that is based on the dynamic multi-fault diagnosis (DMFD) framework is proposed. First, a factorial hidden Markov model (FHMM) is established to depict the state-transition process of the LST product, where its status changes over time and across production processes. This is achieved by considering the product state at each production process as a hidden state and the outcomes of each inspection process as an observation state. Then, the Viterbi algorithm is employed to solve the hidden state transition matrix and diagnostic matrix within the framework of the FHMM. Finally, experimental verification is carried out on a real LST assembly production line, and the influence of imperfect testing on the model accuracy is also considered. Experimental results show that the proposed method achieves a 100% accuracy rate for root cause tracing of three typical quality issues.
Keywords:
liquid storage tanks (LST)
; automotive component manufacturing
; defective products
; root cause tracing
; dynamic multi-fault diagnosis
1. Introduction
In discrete manufacturing systems, root cause tracing of defective products plays a pivotal role in quality control. This is because it not only precisely pinpoints the underlying causes of defective products but also clearly uncovers the fault propagation path within the production process. Such insights are essential for optimizing processes and enhancing product quality [1,2]. Take the LST assembly line, a quintessential complex discrete manufacturing system, as an example. It encompasses processes like welding, sensor assembly, and filter mesh installation. These processes are intricately interlinked. A single production process failure can potentially cascade through the entire process [3]. This leads to the generation of defective products with complex causes and causes other processes to deviate from normal levels. Consequently, these challenges pose significant hurdles to the root cause tracing of defective products[4,5,6].
In recent years, root cause tracing for defective products has garnered increasing attention in industry, with many effective methods emerging in engineering practice. These methods mainly include model-based [7,8], logic inference-based[9,10], and artificial intelligence-based [11,12]approaches. Logic inference-based methods analyze and identify the underlying causes by applying logical rules and reasoning. For example, Yan Feng Li et al. [13] proposed a fault tree-based root cause tracing method, and its effectiveness was experimentally verified through the CNC machining center’s hydraulic system platform. However, logic inference-based methods often rely heavily on expert experience, and they struggle to capture the dynamic characteristics of the system in real-time. Additionally, artificial intelligence methods have gained increasing attention in recent years due to their powerful data processing and pattern recognition capabilities. Qiuping Ma et al. [14] proposed a KNN clustering and MLP-driven root cause identification method for product quality inspection, aimed at automatically predicting the root causes of various quality issues. However, the black-box problem severely affects the interpretability of artificial intelligence methods, limiting their further application in actual industrial production. In contrast, model-based methods grounded in the white-box concept construct dynamic models of the production system, clearly revealing each process’s operation logic, their interconnections, and the mechanisms linking these processes to product quality. Ruan Sui [15] proposed a DMFD framework for complex systems. It can infer the most likely set of faults in real-time, reveal the fault propagation path, and accurately identify the root causes of defective products. Shakeri et al. [16] developed a modeling method for a two-level coordinated solution framework, where the dynamic programming techniques were used to solve the original DMFD problem. On this basis, Anuradha et al. [17] conducted validation experiments on an automotive power generation and storage system, thereby demonstrating the effectiveness of the two-level coordinated framework. Similar successful applications of model - based methods have also been achieved in diverse fields including electronics [18], mechatronic systems [19], mechanical systems [20,21], and chemical engineering [22]. However, when it comes to specific scenarios like the LST assembly production line, existing model-based methods exhibit certain limitations. The production processes of LST assembly lines are complex and interconnected, while the test results of LST products are often imperfect, such as data missing or inadequate testing precision. There is a lack of modeling applications capable of effectively addressing these issues, making it difficult to meet the practical needs of precise analysis, fault diagnosis, and quality control in the production process.
Hidden Markov Models (HMM) are an ideal choice for modeling DMFD problems. In discrete manufacturing systems, HMM can use observed states to represent product inspection results related to quality and hidden states to describe the actual states associated with quality. Ying et al. [23] were the first to use HMM to formalize dynamic fault diagnosis problems. In addition, Q. Suxiang et al. [24] introduced the theory of HMM into the field of power transformer fault diagnosis. Qiu et al. [25] integrated multi-feature fusion technology with Gaussian mixture hidden Markov models to conduct fault diagnosis on a multi-axis engraving machine platform. However, the HMM typically assumes that the system has only a single - component state at most, which restricts its capacity to comprehensively model multiple faults [19]. As an extension of the HMM, the FHMM supposes the system to be composed of multiple independent Markov chains, which endows it with the capability to handle multiple related factors simultaneously. For instance, Satnam Singh et al. [20] proposed a fault diagnosis method based on the FHMM, which provides important theoretical support for modeling and analysis of dynamic multi-faults.
Inspired by the aforementioned methods, a dynamic multi-fault diagnosis modeling method based on the FHMM is proposed, and it is applied to trace the root causes of defective products on the LST production line. First, the problem of tracing the root causes of defective products is mathematically modeled and an FHMM within the dynamic multi-fault diagnosis framework is constructed. Then, the model parameters are iteratively optimized by applying the EM algorithm. Finally, the hidden state transition matrix and the diagnostic matrix are solved using the Viterbi algorithm so that the optimal root cause tracing path for the defective LSTs can be obtained.
The contributions of this paper are as follows:
- A DMFD-based framework is proposed to locate the root causes of defective products in the LST production line. An FHMM is established by utilizing key factors such as production, inspection processes and inspection results to describe the changes in product quality. This transformation turns the problem of root causes analysis into a solvable DMFD problem.
- The impact of imperfect testing on the root cause tracing of defective products is taken into account, and a model that is closely aligned with the actual scenario is constructed. Through formula derivation, the missing detection results are incorporated into the model. Moreover, experiments are designed to quantify the influence of incorrect results on the accuracy of root cause tracing. Consequently, the reliability of root cause tracing for defective products in practical production is enhanced.
- Experimental verification has been carried out on a real LST assembly production line. The experimental results show that the proposed method can achieve a 100% accuracy rate for root cause tracing of three typical quality issues, namely welding misalignment, missing installation of the valve body, and sensor offset.
The structure of this paper is as follows. In Section 2, we provide a system description and mathematical modeling of the LST production line. Section 3 presents the dynamic inference algorithm based on the FHMM. Section 4 presents the results of the computational experiments to evaluate the performance of the inference algorithm. Section 5 provides a conclusion of the paper.
2. System Description and Mathematical Modeling
The LST shown in Figure 1 is produced by a company. It is typically made of transparent material and mainly consists of the tank cover, upper and lower tank bodies, liquid level alarm, float, and filter screen. The functional description of each of these components is presented in Table 1, which provides a detailed understanding of how each part contributes to the overall function of the LST. The production of the LST is mainly accomplished through the cooperation of three workshops, namely the injection molding workshop, the small parts workshop, and the assembly workshop. The injection molding workshop manufactures the main components of the LST, including the upper and lower parts of the tank body. The small parts workshop produces the accessories for the liquid storage tank. The semi-finished products produced by the injection molding workshop and the small parts workshop are transferred to the assembly workshop. In the assembly workshop, the upper and lower parts of the LST are welded into a sealed tank body, and the accessories are assembled with the tank body to complete the final assembly of the LST. Specifically, only the production process of the assembly workshop is focused on in this paper, with the assumption that the semi-finished products provided by the injection molding workshop and the small parts workshop are of qualified quality.
The schematic diagram of the LST production line in the assembly shop is shown in Figure 2. The automotive braking LST undergoes a series of processes from raw materials to finished products. Key production processes include corresponding detection steps. Due to the high scrap cost caused by quality issues, the production quality indices of both semi-finished and finished products are tested at the early, middle, and late stages of the production process. Figure 3 shows the production installation and testing steps in the core of the assembly plant, including upper and lower body welding, check valve installation, air-tightness test, mechanical performance test, check valve plus shell air-tightness test, sensor installation, and sensor pull-out force test.
First, the upper and lower bodies of the LST with the float are welded using a servo welding machine. Then, a check valve is installed on the welded tank. Additionally, the LST undergoes an air-tightness test, which is included in the air-tightness test table. The mechanical performance test is recorded in the mechanical performance test table, and the check valve test is noted in the check valve shell air-tightness test table. After completing these three tests, the sensor is installed, followed by the sensor pull test, which tests the firm pull force of the sensor installation. Once the pull-out test is completed, the product is finished, and the process of marking and packaging begins.
In this article, the root cause tracing of defective LST products task is defined as a dynamic multi-fault diagnosis problem (DMFD). The problem can be represented as a three-part directed graph, as shown in Figure 4, consisting of three layers of nodes representing the fault category, the test and the test results. Formally, a DMFD problem can be defined as:
Let represent the set of M production processes related to the storage tank production line fault. The set denotes the discrete observation epochs, where at the k-th time, the state of the i-th production process is represented as . If there is a fault source at this time, then ; otherwise, . At time k, the overall state of the components is denoted by .
We define as a finite set of N available binary test results, which can be used to determine the integrity of the system. The test results are binary: if the j-th test fails, then ; otherwise, .
Each test result is associated with a set of fault states through a diagnostic matrix. We set , where is the set of failed tests at epoch k, is the set of passed tests at epoch k. Since the test results may be imperfect and there may be missing data, we set . Then, we define the matrix as the diagnostic matrix, which represents the dependencies between the fault-related production processes and the detection processes . This matrix captures the causality between the failure component (or root cause failure) of the system and the corresponding test.
We introduce the collection , which includes the fault detection and false alarm probabilities. Specifically, we have the fault detection probability , which is the probability that the j-th test detects the failure of the i-th component, and the false alarm probability , which is the probability that the j-th test falsely indicates a failure when the i-th component is functioning.
The state of each fault is modeled as a non-homogeneous Markov chain. For each fault state, we define , where is the probability that the fault occurs at time k, given that it was not present at time , and is the probability that the fault disappears at time k, given that it was present at time .
3. Inference Algorithm for Fault Localization and Diagnosis
The fault diagnosis task in this paper can be defined as a problem of finding maximum a posterior estimation to evaluate the evolution of fault sequence state with time step.
The solution of can be used to explain the sequence of observed test results:
where K is the total number of epoch, when , the problem is simplified to a static fusion problem. Using the Bayes formula, the objective function is equivalent to
In the case of a given fault state and the Markov property of the fault state evolution, the passed and failed test results are conditional independent, so the objective function is equivalent to
where and represent the set of passed and failed tests at time k, respectively. A new function is defined:
Given the failure state state , the test results are independent. Therefore
Assuming the test results pass, it should pass all of its associated failure status, therefore
where
Obviously,
Similarly, since the fault is independent of this assumption,
where
Therefore, the objective function of formula (1) is equivalent to
where
The goal of the EM algorithm is to estimate the model parameters and maximize the log-likelihood function of the observed sequence .
The log-likelihood function involves: Due to the difficulty of directly optimizing the logarithms that contain hidden variables, E-step computes the expectation of the posterior distribution under the current parameter, So, the joint probability of sum expands to
where
So, changed to:
Step M update to maximize:
For fault sequences, the inference formula can be expressed as:
where
Next, we use the Viterbi algorithm to find the optimal , where each path corresponds to a state sequence.
Initialization step: Assume that the initial state is known for all fault states. Let the maximum value of the function at time K be denoted as , and the maximum value of at this time is represented by .
When ,
where and , for .
Recursive step: This step involves maximizing the target function at each epoch K.
where
Termination step: This step computes the objective function for time .
Optimal State sequence backtracking: The backtracking step computes the optimal state sequence through the backtracking path. The optimal state of the i-th fault at time k is derived from the following formula:
4. Experiment
Based on the data from the LST production line in a rubber and plastic enterprise, multi-coupling faults in the production process were analyzed. As an essential liquid storage component in automotive brakings, the production process of LSTs is complex and involves many key processes. Due to equipment aging, process errors, or improper operations, various types of faults may occur during production, and strong coupling exists among these faults, posing significant challenges for fault diagnosis.
As shown in Table 2, the LST production line primarily consists of the following key processes:
- Welding misalignment (S1): This process is used to weld and secure the upper and lower parts of the LST. It is a fundamental step in the production process, but defects during welding may lead to tank leakage or breakage during pressure testing or actual use.
- Missing installation of the valve body (S2): The check valve ensures the unidirectional flow of liquid within the tank. Deviations in its installation location, insecure installation, or inherent defects in the valve itself may prevent the liquid from flowing in one direction or cause leakage, resulting in failure during the production process.
- Sensor offset (S3): The LST sensor monitors the operational state of the tank. If the sensor is improperly installed or experiences signal transmission issues, the monitoring data may become inaccurate, and it may fail the pull-out test, leading to suboptimal performance of the tank.
As shown in Table 3, the production line also includes several critical testing procedures to evaluate the quality and reliability of key processes:
- Drawing Test (T1): This test is designed to assess the stability of the sensor by applying a drawing force. If the sensor is improperly installed, excessive displacement may occur, affecting the tank’s stability and its performance.
- Performance Testing (T2): This test evaluates the mechanical properties of the LST, particularly the strength of the welded structure and the integrity of the check valve installation. Defects in either may cause failure during this test.
- Air-Tight Test (T3): This procedure checks the overall sealing performance of the LST by applying pressurization to ensure that the tank does not leak under high or negative pressure conditions. Defects such as holes in welds, cracks, or voids in the check valve may result in test failure.
- check valve Airtightness Test with Shell (T4): This test is focused on verifying the airtightness of the check valve and its shell. It ensures the valve’s unidirectional flow function and sealing performance after installation. If the valve is poorly installed or has manufacturing defects, it may lead to substandard results during this test.
These tests and processes provide valuable insights into the production quality of LSTs, enabling identification and diagnosis of faults during production.
Experimental Procedure:
1) Data Pre-processing: Data pre-processing is performed based on prior knowledge by collecting data from various processes and tests of the LST production line. The result states of the processes are categorized. The related data is further divided into a training set and a test set, which will be used for subsequent model training and testing.
2) Model Training: The FHMM is constructed, and the data from the pre-processed training set is fed into the model. The probability distribution learned by the hidden state chain after model training is used to analyze the coupling relationships between the process and the tests on the test set data.
3) Result Analysis: The Correct Isolation Rate (CI) and False Isolation Rate (FI) are calculated. Additionally, the detection probability/false alarm probability matrix is described.
The following formulas are used to compute the rates:
5. Analysis of the Results
As shown in Table 4, a model’s dependency matrix is typically used to represent relationships between different elements in some systems or models. The upper and lower body welding, check valve installation, and sensor installation are denoted as S1, S2, and S3, respectively. The drawing test, performance test, airtight test, and check valve shell airtight test are represented as T1, T2, T3, and T4, respectively.
As shown in Table 5, the detection probability refers to the probability that the test (T1, T2, T3, T4) will correctly identify and diagnose a state (S1, S2, S3) when it actually occurs. False positives represent the probability that a test will incorrectly identify a state (S1, S2, S3) as occurring when that state does not occur.
Table 6 provides performance metrics for the model in different fault states, including the correct isolation rate with 95% confidence intervals and the error isolation rate with 95% confidence intervals. These metrics are used to assess the diagnostic performance of the model and its ability to isolate different states.
On this basis, we note that in the actual production line there may be mislabeling, the so-called mislabeling refers to the fault will be the cause of the fault into the product. To simulate this, we added a small number of negative samples to the training dataset. After the same test set, we obtained the model performance metrics shown in Table 7.
6. Summary
In this paper, a root cause tracing method for defective products based on the DMFD framework has been proposed. This framework has used the FHMM to model the real LST assembly production line. It has fully taken into account the production and inspection processes of the automotive braking LST assembly line, as well as the dependency relationships between the actual states related to product quality and the inspection results. Experimental results have shown that the proposed algorithm has been able to effectively locate and trace the root causes of defective products. Future research will expand this by incorporating multiple fault states, to build a more comprehensive model for more precise root cause identification of defective products, especially when faults interact complexly. Also, it will address the situation where multiple cascading or coupling processes cause a single fault by developing new algorithms and models, possibly using advanced data-driven techniques. This is expected to make significant progress in solving the complex root cause tracing problem, improving product quality and enhancing production system efficiency and competitiveness.
References
- Venkatasubramanian, V. Rengaswamy, R., Yin, K., et al. A review of process fault detection and diagnosis Part I: Quantitative model - based methods [J]. COMPUTERS & CHEMICAL ENGINEERING, 2003, 27, 293–311. [Google Scholar]
- Huang, X., Gao, J., Jiang, H., et al. A systematic fault root causes tracing method for process systems[C]. 2011 PROCEEDINGS - ANNUAL RELIABILITY & MAINTAINABILITY SYMPOSIUM, 2011, 1–7.
- Huang, X. Gao, J., Jiang, H., et al. Fault root cause tracing of complicated equipment based on fault graph[C]. PROCEEDINGS OF THE INSTITUTION OF MECHANICAL ENGINEERS, PART E: JOURNAL OF PROCESS MECHANICAL ENGINEERING, 2013, 227, 17–32. [Google Scholar] [CrossRef]
- Wang, R. Xu, G., Gao, J., et al. An information transfer based novel framework for fault root cause tracing of complex electromechanical systems in the processing industry[J]. MECHANICAL SYSTEMS & SIGNAL PROCESSING, 2018, 101, 121–139. [Google Scholar]
- Latino, M. A. Latino, R. J., Latino, K. C. Root Cause Analysis: Improving Performance for Bottom Line Results, 2019. [Google Scholar]
- Wang, R. Xu, G., Gao, J., et al. An information transfer based novel framework for fault root cause tracing of complex electromechanical systems in the processing industry[J]. MECHANICAL SYSTEMS & SIGNAL PROCESSING, 2018, 101, 121–139. [Google Scholar]
- Medina Oliva, G. Iung, B., Barberá, L., et al. Root cause analysis to identify physical causes[C]. 11TH INTERNATIONAL PROBABILISTIC SAFETY ASSESSMENT & MANAGEMENT CONFERENCE & THE ANNUAL EUROPEAN SAFETY & RELIABILITY CONFERENCE 2012, PSAM11 ESREL 2012, 1.
- Purushotham, V. Narayanan, S., An, P. S. Multi - fault diagnosis of rolling bearing elements using wavelet analysis and hidden Markov model based fault recognition[J]. NDT & E INTERNATIONAL, 2005, 38, 654–664. [Google Scholar]
- Pandian, A. Ali, A. A review of recent trends in machine diagnosis and prognosis algorithms[C]. 2009 WORLD CONGRESS ON NATURE & BIOLOGICALLY INSPIRED COMPUTING (NABIC), 2009. [Google Scholar]
- Gao, Z. Cecati, C., Ding, S. X. A Survey of Fault Diagnosis and Fault - Tolerant Techniques - Part I: Fault Diagnosis With Model - Based and Signal - Based Approaches[J]. IEEE TRANSACTIONS ON INDUSTRIAL ELECTRONICS, 2015, 62, 3757–3767. [Google Scholar]
- Velásquez, A. R. M. Lara, M. J. V. Root cause analysis improved with machine learning for failure analysis in power transformers[J]. ENGINEERING FAILURE ANALYSIS, 2020, 115, 104684. [Google Scholar] [CrossRef]
- Panchal, G. Ganatra, A., Kosta, Y. P., et al. Behaviour Analysis of Multilayer Perceptrons with Multiple Hidden Neurons and Hidden Layers[J]. INTERNATIONAL JOURNAL OF COMPUTER THEORY & ENGINEERING.
- Li, Y. F. Huang, H. Z., Liu, Y., et al. A NEW FAULT TREE ANALYSIS METHOD: FUZZY DYNAMIC FAULT TREE ANALYSIS[J]. EKSPLOATACJA I NIEZAWODNOSC, 2012, 14, 208–214. [Google Scholar]
- Ma, Q. Li, H., Thorstenson, A. A Big Data - driven Root Cause Analysis System: Application of Machine Learning in Quality Problem Solving[J]. COMPUTERS & INDUSTRIAL ENGINEERING, 2021, 160, 107580. [Google Scholar]
- Ruan, S. Zhou, Y., Yu, F., et al. Dynamic multiple - fault diagnosis with imperfect tests[J]. IEEE TRANSACTIONS ON SYSTEMS, MAN, & CYBERNETICS - PART A: SYSTEMS & HUMANS, 2009, 39, 1224–1236. [Google Scholar]
- Shakeri, M. Pattipati, K. R., Pattipati, K. R., et al. Optimal and near - optimal algorithms for multiple fault diagnosis with unreliable tests[J]. IEEE TRANSACTIONS ON SYSTEMS, MAN & CYBERNETICS, PART C (APPLICATIONS & REVIEWS), 1998, 28, 431–440. [Google Scholar]
- Kodali, A. Zhang, Y., Sankavaram, C., et al. Fault diagnosis in the automotive electric power generation and storage system (EPGS)[J]. IEEE/ASME TRANSACTIONS ON MECHATRONICS, 2013, 18, 1809–1818. [Google Scholar] [CrossRef]
- Zhang, J. Liu, M., Deng, W., et al. Research on electro - mechanical actuator fault diagnosis based on ensemble learning method[J]. INTERNATIONAL JOURNAL OF HYDROMECHATRONICS, 2024, 7, 113–131. [Google Scholar]
- Li, Y. Yang, Y., Li, G., et al. A fault diagnosis scheme for planetary gearboxes using modified multi - scale symbolic dynamic entropy and mRMR feature selection[J]. MECHANICAL SYSTEMS & SIGNAL PROCESSING, 2017, 91, 295–312. [Google Scholar]
- Tu, F. Pattipati, K. R., Deb, S., et al. Computationally efficient algorithms for multiple fault diagnosis in large graph - based systems[J]. IEEE TRANSACTIONS ON SYSTEMS, MAN, & CYBERNETICS - PART A: SYSTEMS & HUMANS, 2003, 33, 73–85. [Google Scholar]
- Jiang, H. Li, C., Li, H. An improved EEMD with multiwavelet packet for rotating machinery multi - fault diagnosis[J]. MECHANICAL SYSTEMS & SIGNAL PROCESSING, 2013, 36, 225–239. [Google Scholar]
- Luo, J. Jin, Z., Jin, H., et al. Causal temporal graph attention network for fault diagnosis of chemical processes[J]. CHINESE JOURNAL OF CHEMICAL ENGINEERING, 2024, 70, 20–32. [Google Scholar] [CrossRef]
- Ying, J. Kirubarajan, T., Pattipati, K. R., et al. A hidden Markov model - based algorithm for fault diagnosis with partial and imperfect tests[J]. IEEE TRANSACTIONS ON SYSTEMS, MAN & CYBERNETICS, PART C (APPLICATIONS & REVIEWS), 2000, 30, 463–473. [Google Scholar]
- Qian, S., Jiao, W., Hu, H., et al. Transformer power fault diagnosis system design based on the HMM method[C]. 2007 IEEE INTERNATIONAL CONFERENCE ON AUTOMATION & LOGISTICS, 2007, 1077–1082.
- Qiu, X., Chen, W., Wu, Q., Wang, Y. W., Gu, C., Zhang, W. A. Fault diagnosis for multi - axis carving machine systems with Gaussian mixture hidden Markov models: A data - model interactive perspective. Control Engineering Practice, 2025 Jan 1, 154, 106163.
Figure 1.
schematic diagram of LST structure.
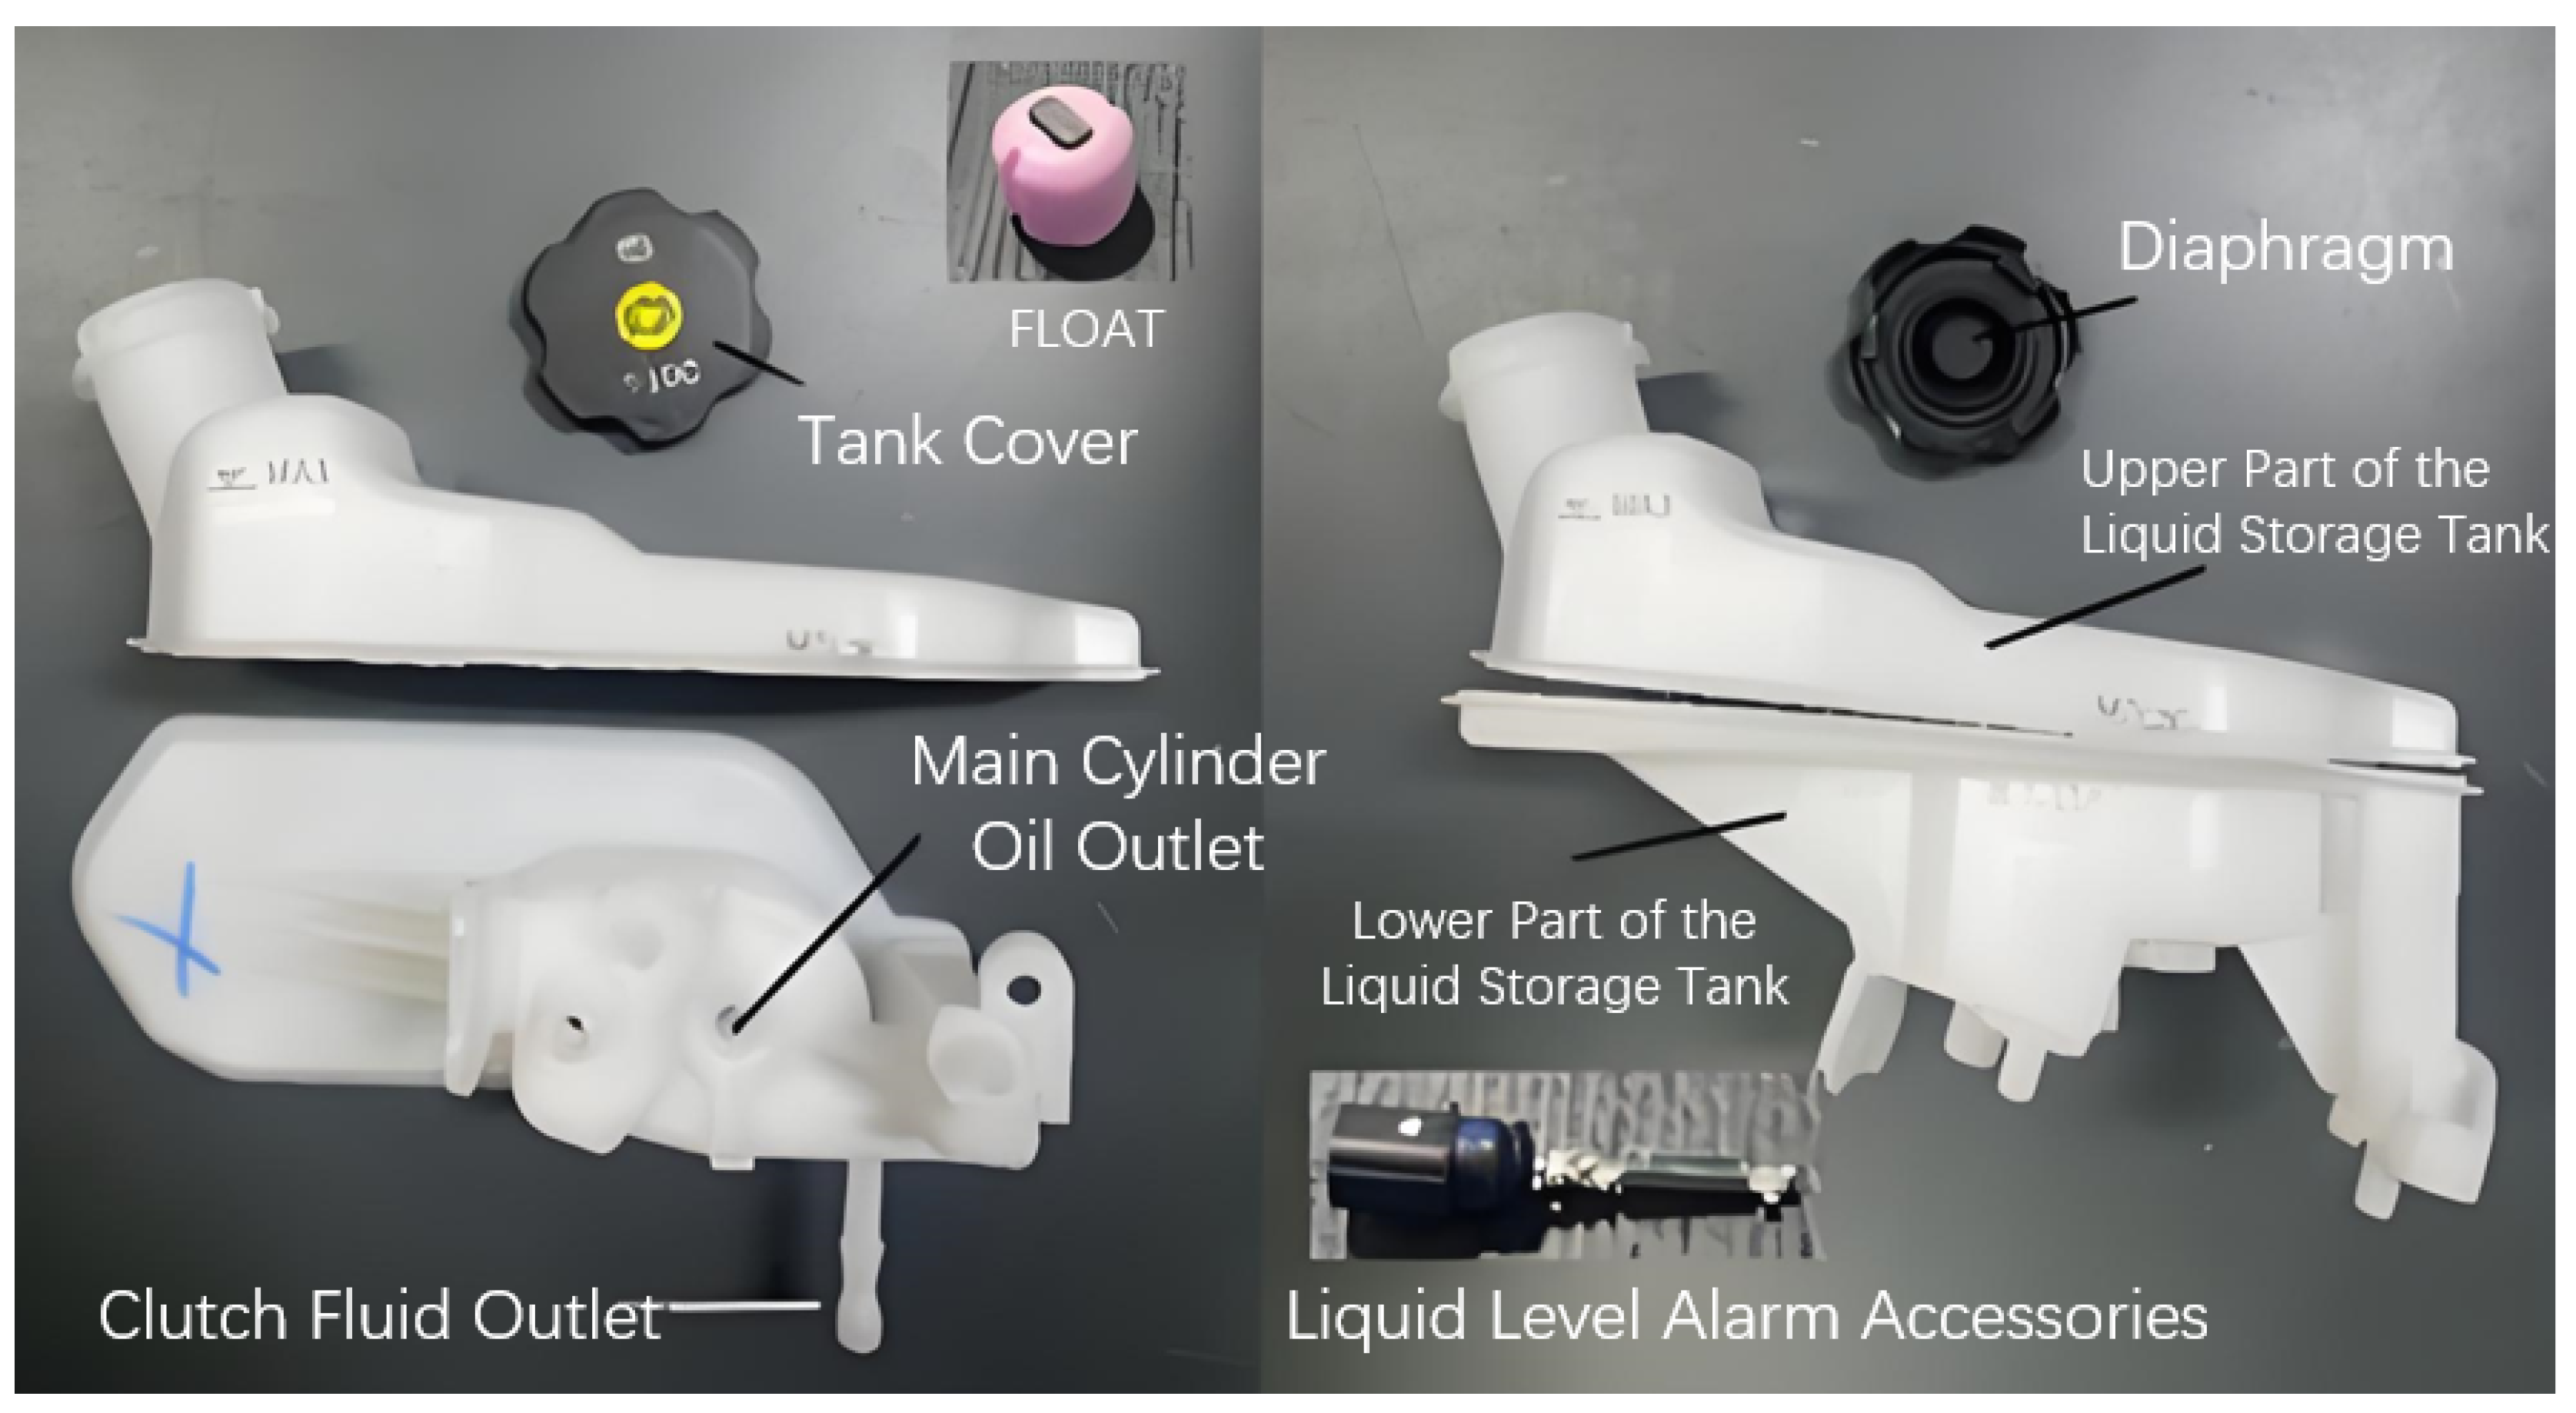
Figure 2.
Schematic diagram of liquid storage tank assembly line
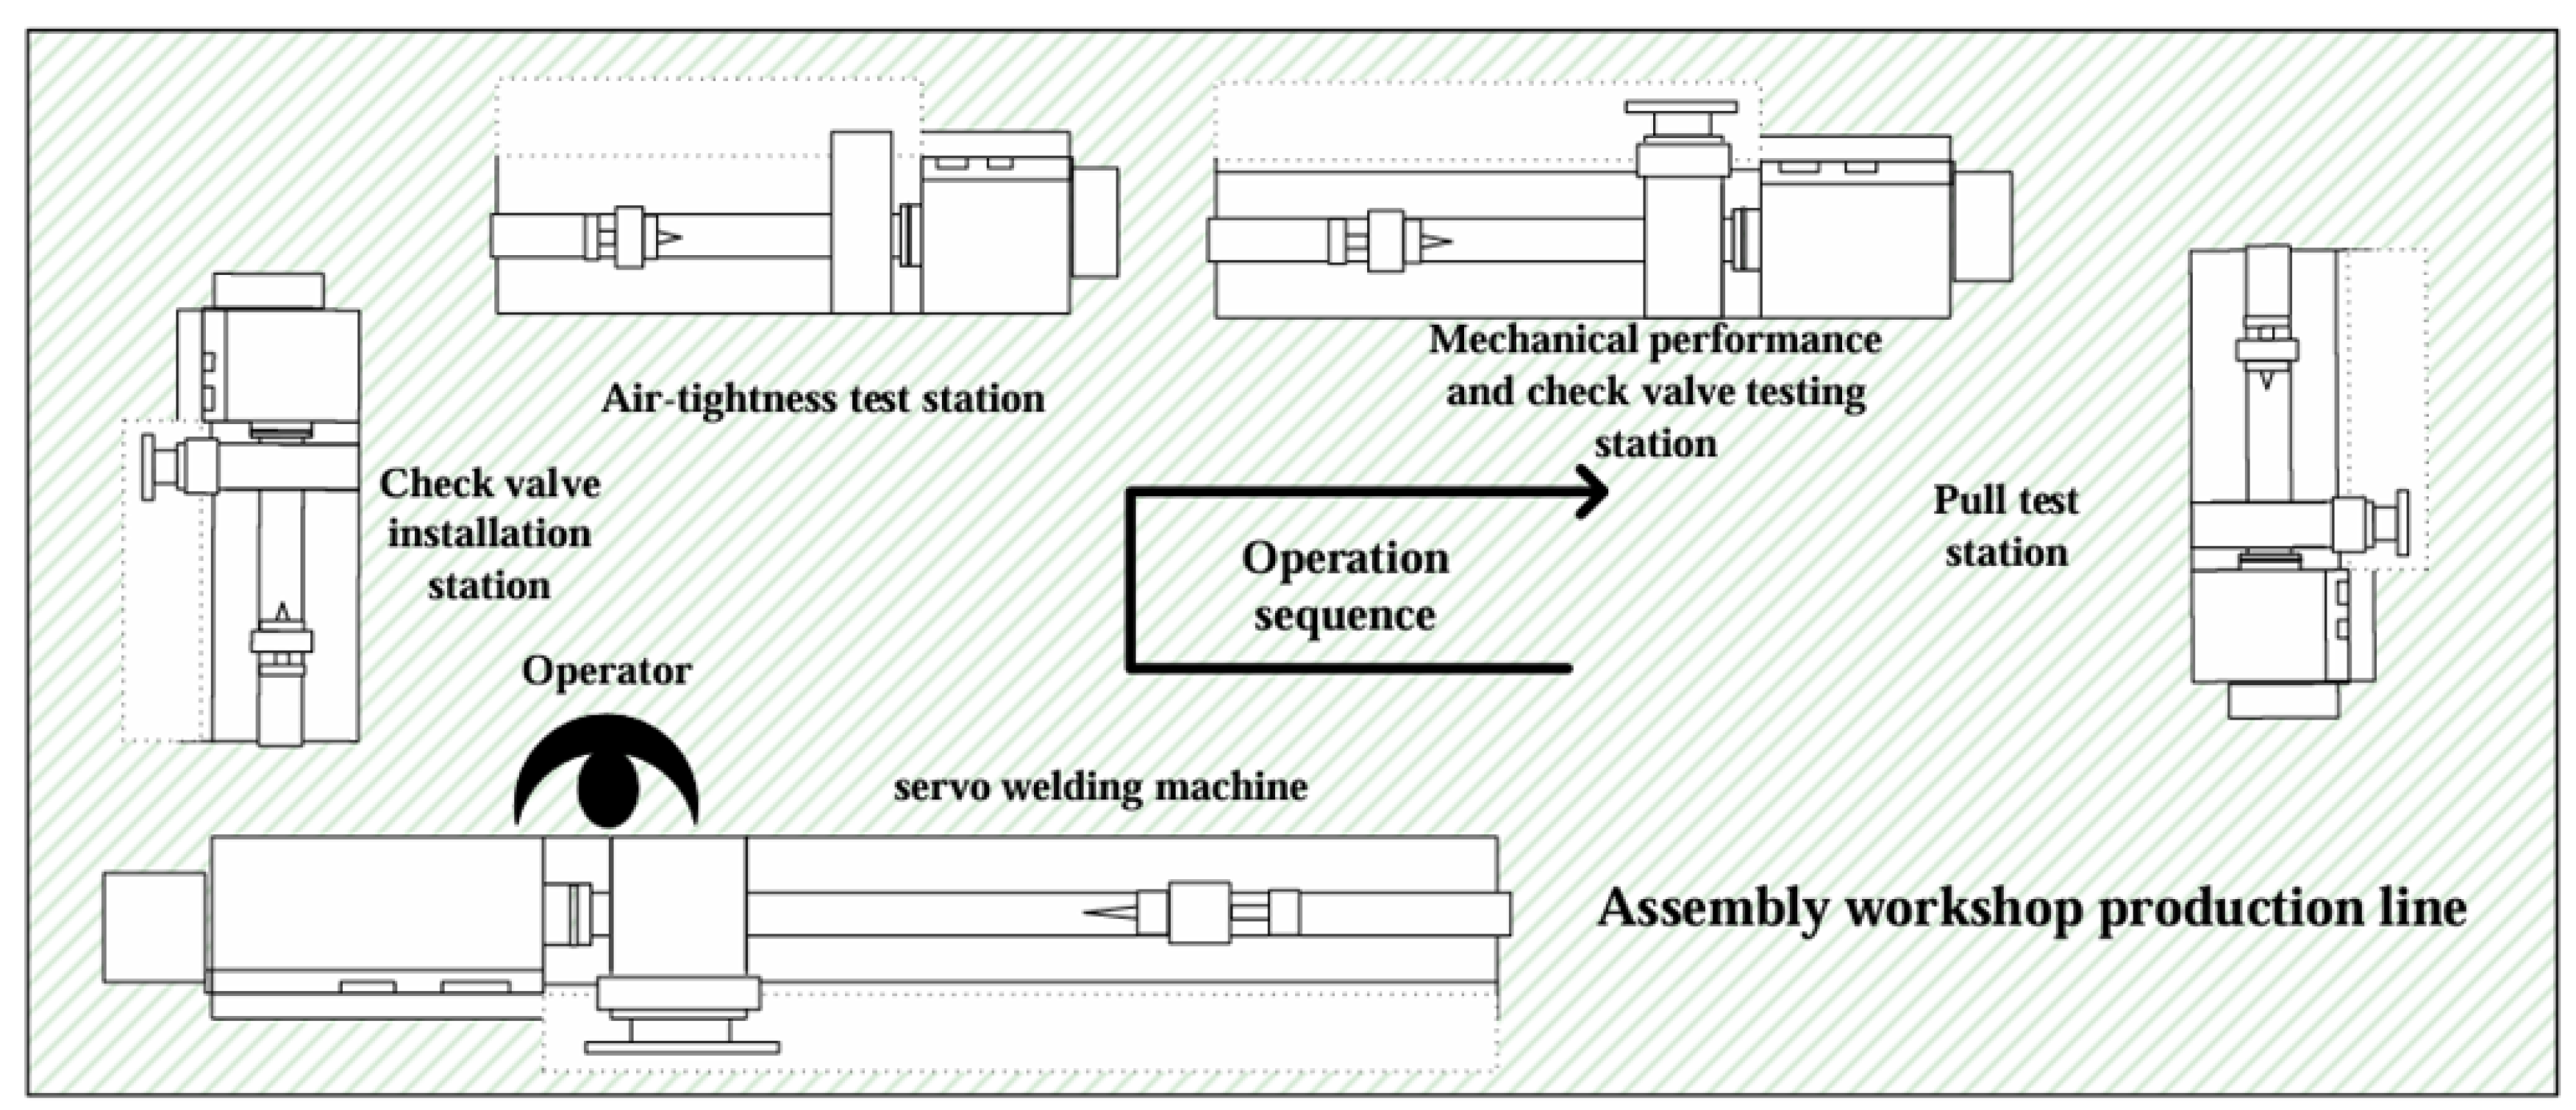
Figure 3.
Flow chart of liquid storage tank assembly
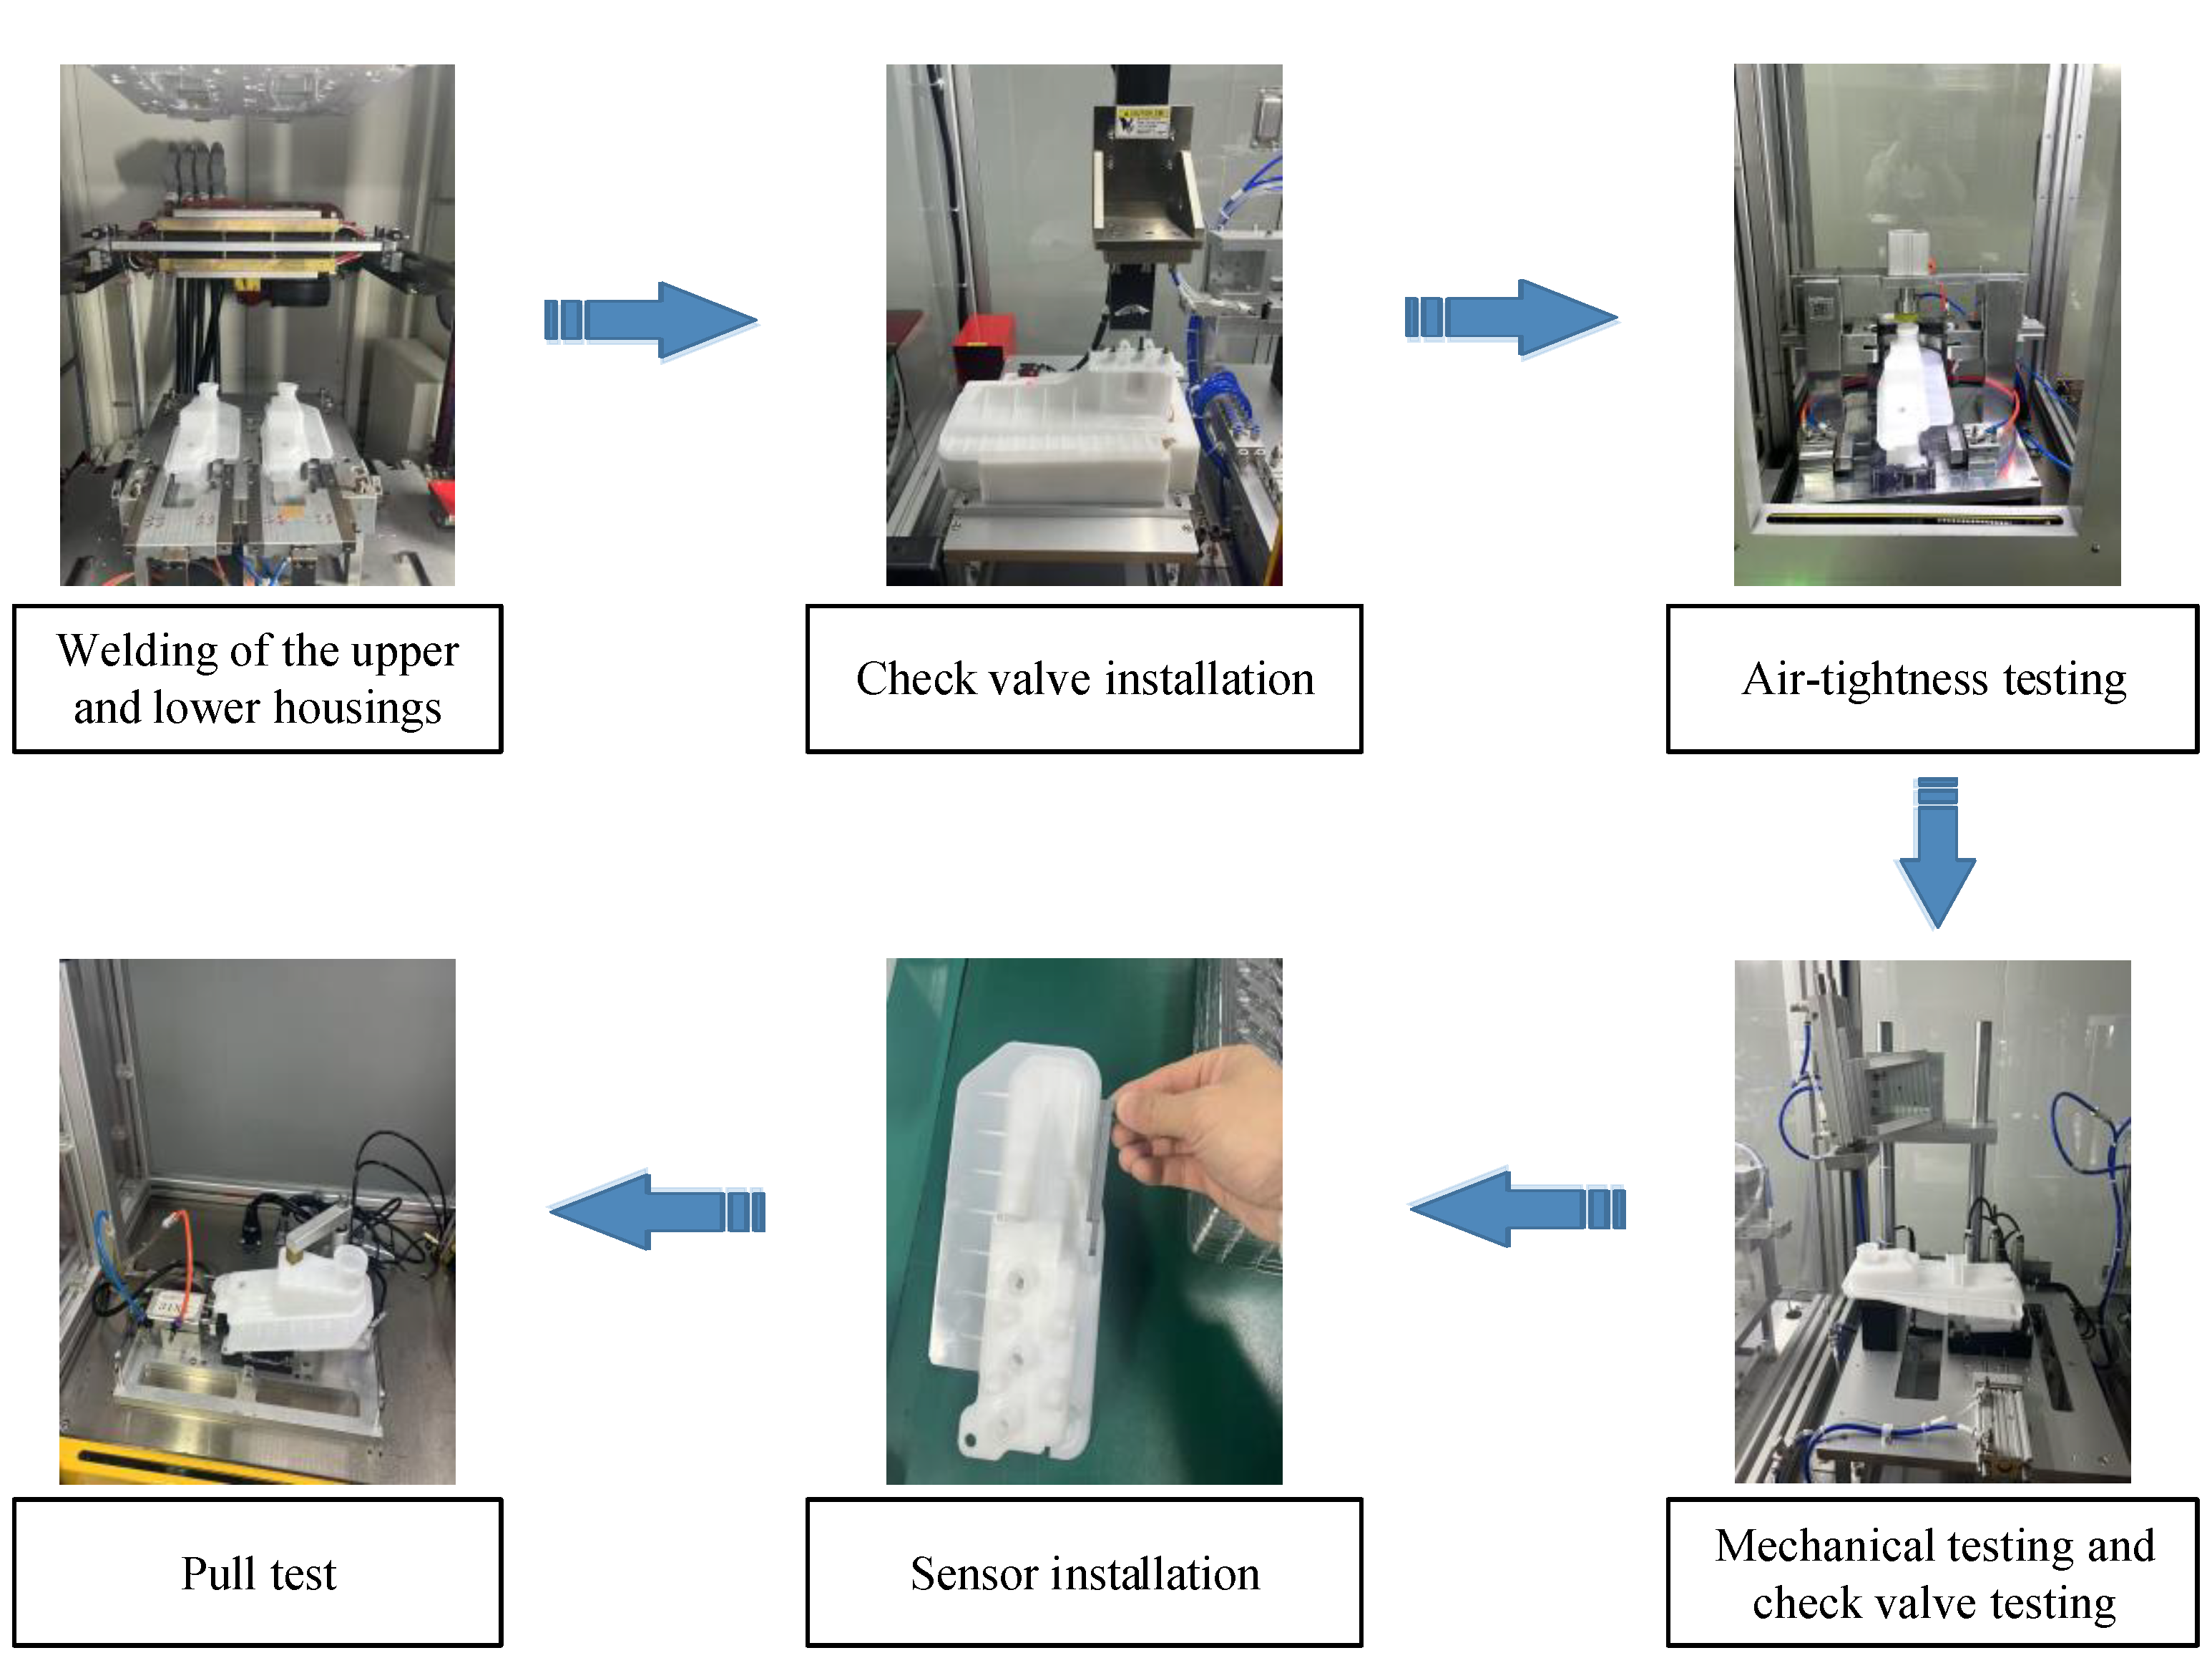
Figure 4.
three-part digraph of the DMFD problem.
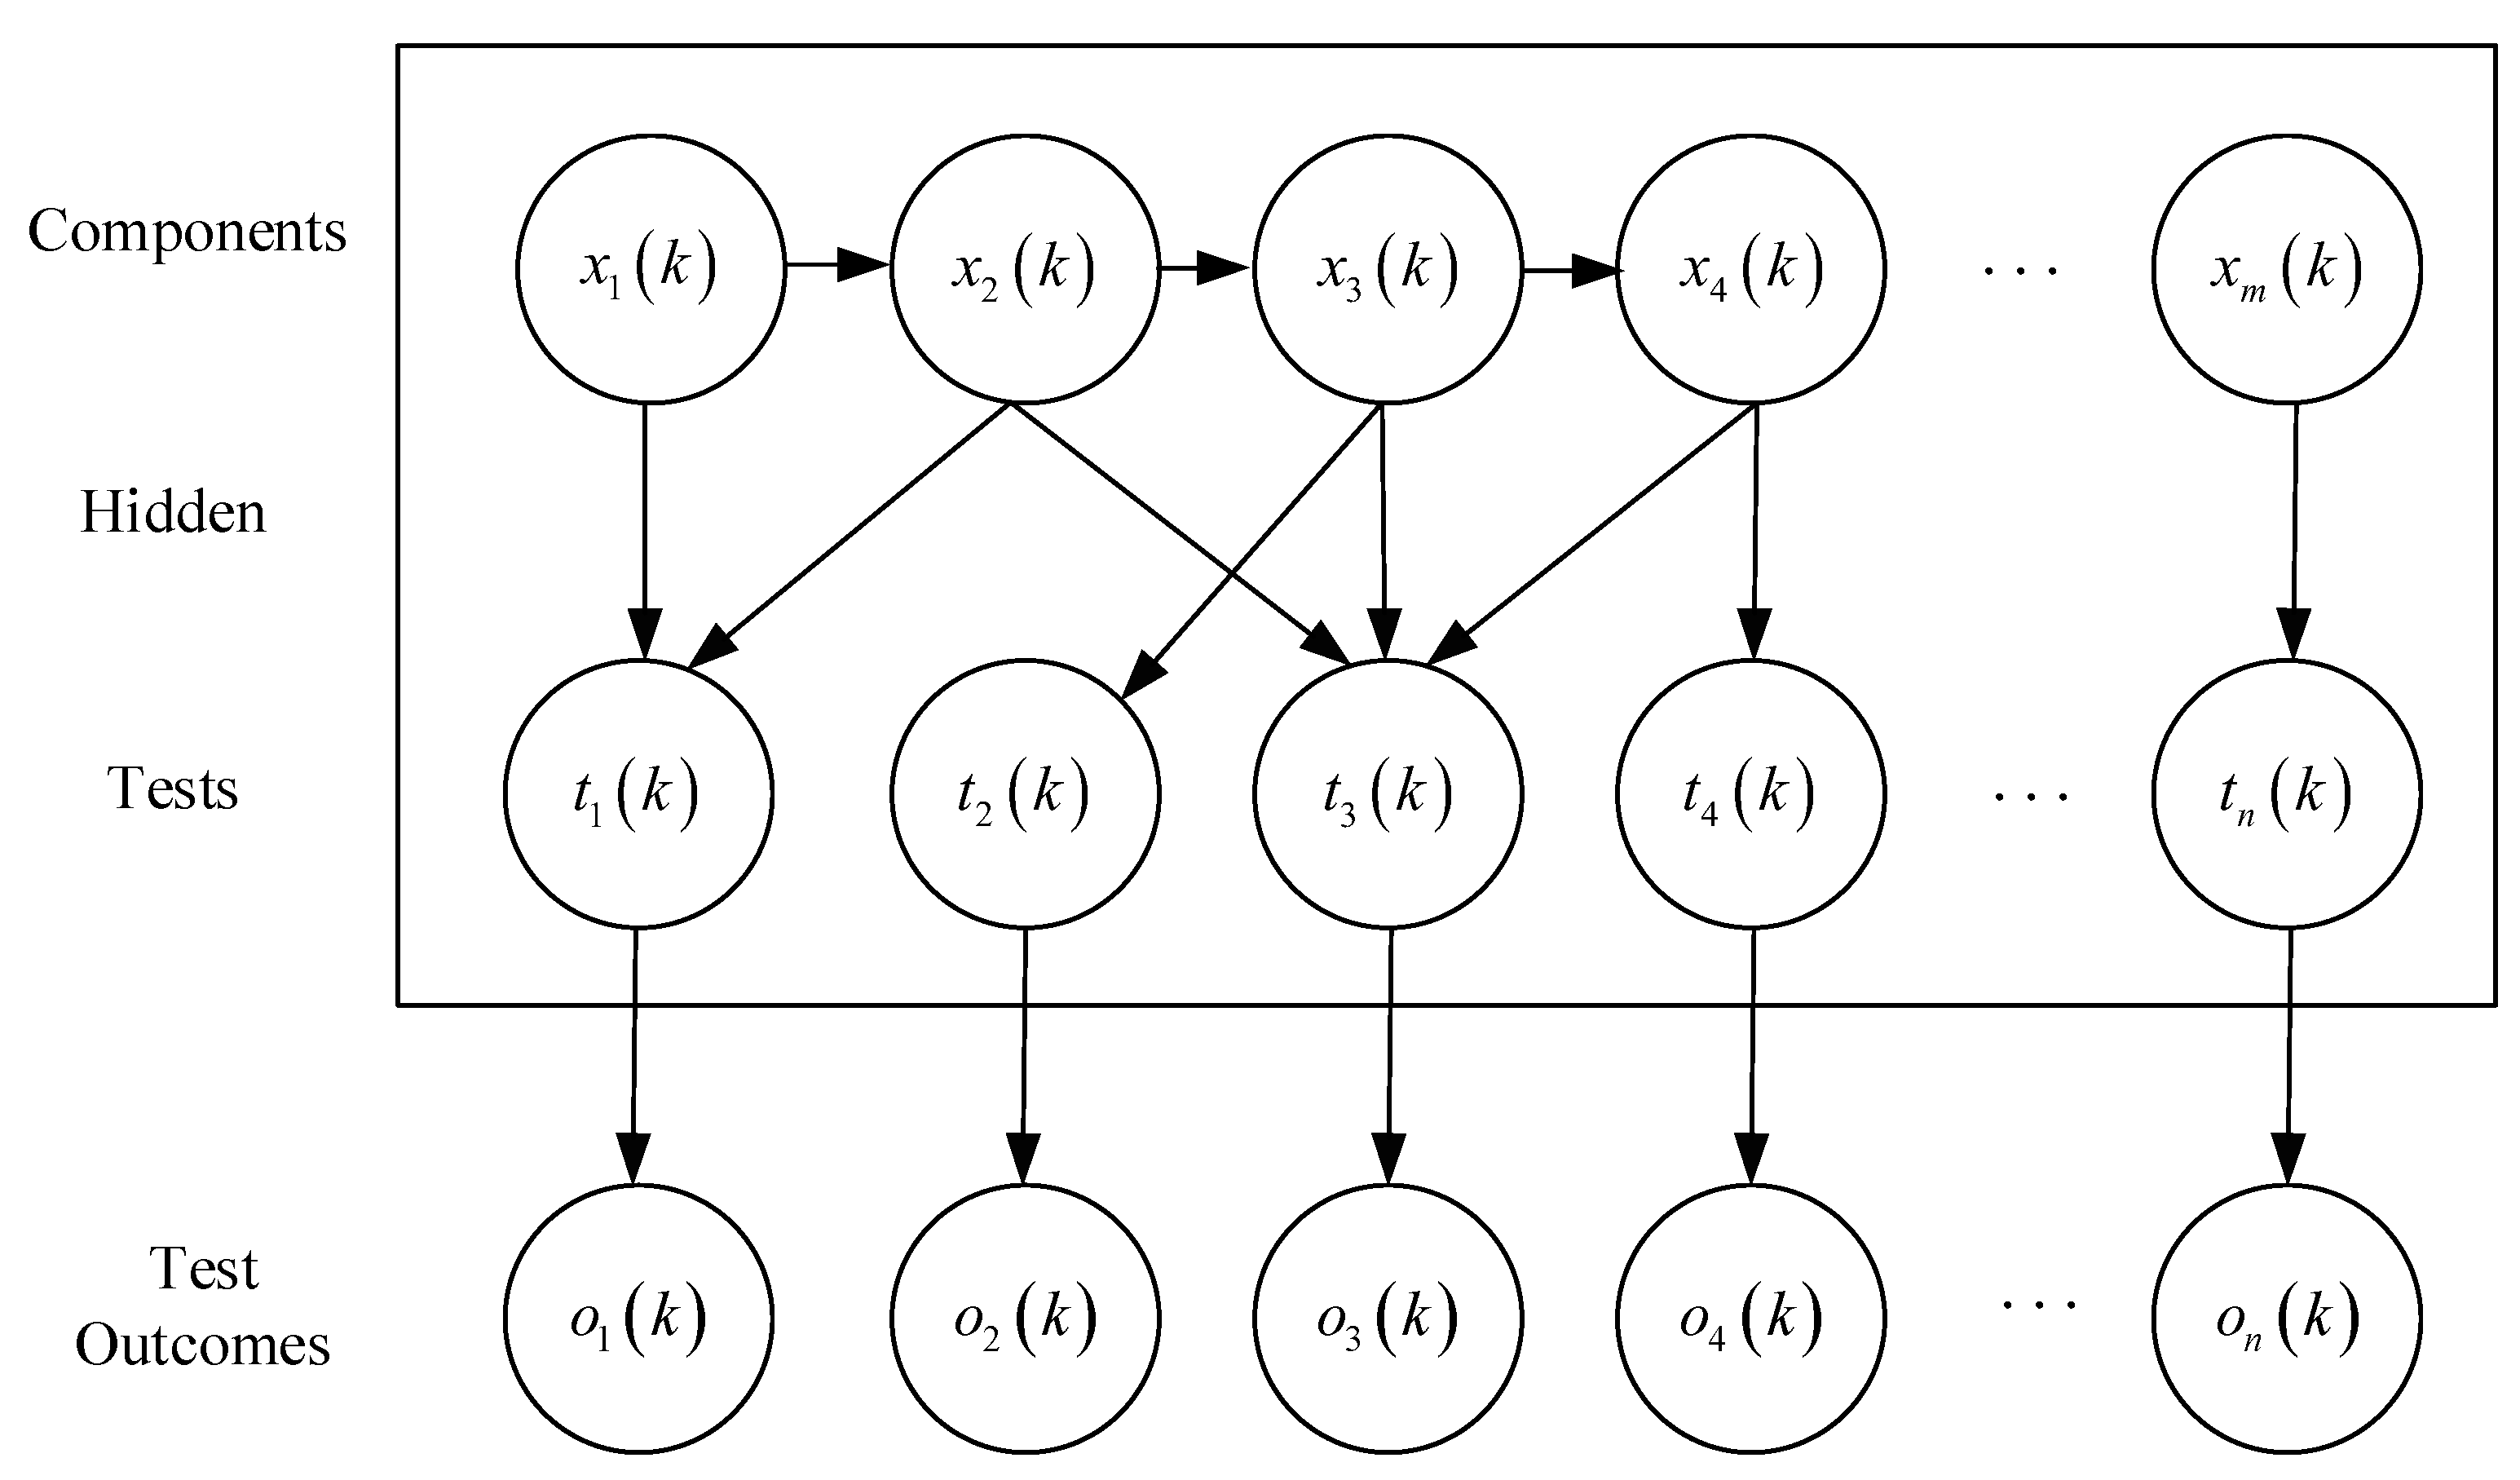

Table 1.
LST components and their roles
| Components | Effect |
|---|---|
| Tank caps | The tank caps in the tank cover can be used to balance the air pressure in the tank to keep the liquid flowing smoothly |
| Up and down tank | The upper tank is usually used to store and supply brake liquid, while the lower tank is used to collect and discharge brake liquid. The upper and lower tanks are operated by a welding process and are combined to form a tank assembly |
| Floater | The floater is a liquid level monitoring element, it has a certain density, built-in magnetic structure, its function is to detect the brake liquid level of the liquid height, and through floating movement of the liquid level information into mechanical or electrical signals, for monitoring and control of the system |
| Liquid level alarm | The liquid level alarm belongs to the liquid level monitoring device, which is matched with the float, and its function is to detect the brake oil level height and send a signal to the system |
Table 2.
list of failures.
| Fault | Fault number |
|---|---|
| Welding misalignment | S1 |
| Missing installation of the valve body | S2 |
| Sensor offset | S3 |
Table 3.
test list.
| Fault | Fault number |
|---|---|
| Pull results | T1 |
| Mechanical performance test results | T2 |
| Air tightness test results | T3 |
| Check valve plus shell air tightness test | T4 |
Table 4.
dependency matrix of the model.
| T1 | T2 | T3 | T4 | |
|---|---|---|---|---|
| S1 | 0 | 1 | 1 | 0 |
| S2 | 0 | 1 | 1 | 1 |
| S3 | 1 | 0 | 0 | 0 |
Table 5.
reliability index (detection probability/false positive probability).
| T1 | T2 | T3 | T4 | |
|---|---|---|---|---|
| S1 | 0 | 1/0 | 1/0 | 0 |
| S2 | 0 | 1/0 | 1/0 | 1/0 |
| S3 | 1/0 | 0 | 0 | 0 |
Table 6.
model performance indicators.
| Fault | Correct isolation rate with 95% confidence interval | Error isolation rate with 95% confidence interval |
|---|---|---|
| S1 | 1 | 0 |
| S2 | 1 | 0 |
| S3 | 1 | 0 |
Table 7.
model performance indicators.
| Fault | Correct isolation rate with 95% confidence interval | Error isolation rate with 95% confidence interval |
|---|---|---|
| S1 | [0.8966 0.9741] | [0.0227 0.1153] |
| S2 | [0.8231 0.9224] | [0.0738 0.1965] |
| S3 | [0.9265 0.9828] | [0.0139 0.0881] |
Disclaimer/Publisher’s Note: The statements, opinions and data contained in all publications are solely those of the individual author(s) and contributor(s) and not of MDPI and/or the editor(s). MDPI and/or the editor(s) disclaim responsibility for any injury to people or property resulting from any ideas, methods, instructions or products referred to in the content. |
© 2025 by the authors. Licensee MDPI, Basel, Switzerland. This article is an open access article distributed under the terms and conditions of the Creative Commons Attribution (CC BY) license (http://creativecommons.org/licenses/by/4.0/).
Copyright: This open access article is published under a Creative Commons CC BY 4.0 license, which permit the free download, distribution, and reuse, provided that the author and preprint are cited in any reuse.


