Preprint
Article

This version is not peer-reviewed.

Management Strategies for Napier Grass (Pennisetum purpureum Schumach): Impact on Dry Matter Yield, Nutritive Characteristics and Cattle Growth

A peer-reviewed article of this preprint also exists.

Submitted:

27 February 2025

Posted:

27 February 2025

You are already at the latest version

Abstract

Napier grass is widely used across the tropics and subtropics as a feed for dairy and beef cattle, but its quality is poor under current management with resultant poor animal productivity. Current management is focused on achieving high yields and as such is harvested at ground level with longer harvest interval when grass becomes 200 cm or higher, which reduces quality. The opportunity to improve the nutritive value of this grass is largely unexplored alongside the opportunity to increase livestock productivity and food security in the tropics and subtropics. Here we determined the impact of three Napier grass (cv. Pakchong) leaf number (total) or stage (LS; 6, 9 and 14) at harvest, where, 14 LS represents current management practice and three severity height (SH; cutting or harvest height from the ground; 5, 10, and 20 cm) on nutritive value of Napier grass throughout the year. Napier grass was sown (from cutting) at a density of 50 cm x 50 cm with three replicates per treatment. Increasing LS from 6 to 14 decreased crude protein (CP) content from 184 g/kg DM to 118 g/kg DM and metabolisable energy (ME) content from 10.4 to 7.3 MJ/kg DM These results suggest that Napier grass should be harvested at a lower LS to increase plant nutritive value but there was a trade-off between yield and quality as yield decreased by half to improve such quality. The impact of offering Napier grass harvested at 6, 9 or 14 LS on cattle growth was then determined across 113 days in a second experiment. Red Chittagong bulls were enrolled at a weight of a 181.9 ± 2.30 (Mean ± SE) Kg with an age of between 18 and 22 months. The 6 LS treatment cattle had a greater growth rate and lower feed conversion ratio (FCR) than the 14 LS treatment (610 versus 270g/day and 6.4 versus 16.2, respectively) indicating a trade-off of yield with quality. Our results demonstrate that Napier grass should be harvested at 6 LS for feed nutritive value, cattle growth and FCR. Further research is required to ameliorate yield loss associated with this recommended management strategy with a focus on increasing plant density.

Keywords: 
;  ;  ;  ;  ;  

1. Introduction

Napier grass (Pennisetum purpureum Schumach) is a key forage for tropical and subtropical smallholder animal production systems due to its robust growth [1,2,3]. Despite being a highly suitable forage species for these regions [4], Napier grass is deemed to be of low quality due to its high fibre content and low protein (70-100 g/kg DM) and energy (6.0-8.0 MJ/kg DM) levels [5,6], limiting the growth of animals. Farmers typically harvest Napier grass at a height of 150-200 cm or greater [7,8] in order to maximise forage production from their limited landholdings. Nevertheless, the majority of children in the same regions where Napier grass is grown are stunted and malnourished in part due to the low productivity of livestock and associated protein supply. Therefore, the challenge is to optimise the nutritional content of Napier grass while maintaining high biomass yields, with the aim of enhancing milk and meat production in tropical and subtropical regions. This, in turn, can contribute to the overall goal of ensuring food and nutrition security, as well as reducing malnutrition, stunting, and wasting among children in these areas [9].
Evidence suggests that Napier grass can be managed to contain higher protein and energy to meet the nutritional requirements of ruminants for milk and meat production. This management follows the principles of leaf stage (LS), defoliation height (DH), severity height (SH), or defoliation/harvest intervals (DI) used to manage quality of grasses such as kikuyu (Pennisetum clandestinum ex chiov) or ryegrass. For example, Fulkerson et al. [10] demonstrated that kikuyu grass harvested at 4.5 LS (16 days DI) contains approximately 200 g CP/kg DM CP and 10 ME MJ/kg DM, supporting 15 L milk/cow/day in mid-lactating Holstein cows. Similarly, Napier grass also shown to contain low fibre (300-350 g ADF/kg DM, 490-530 g NDF/kg DM) and high CP (170-250 g CP/kg DM) when harvested at a DI intervales of 14-49 days [11]. Sileshi et al. [12] also showed that Napier grass harvested at a DI of 14-28 days contain 190-230 g CP/kg DM, 490-500 g NDF/kg DM and 11.7 MJ ME/kg DM. These findings suggest high quality Napier grass can be managed and produced by simple LS and defoliation management. However, one of the limitations is that none of these Napier grass related experiments investigated year-round biomass yield and quality to determine the trade-off between yield and quality. Furthermore, there is no animal experimentation in the literature investigating the performance of animals with such high-quality Napier grass
Here we explored strategies for enhancing the yield and nutritional quality of Napier grass to boost milk and meat production in tropical and subtropical regions. The focus was on developing a best management practice (BMP) for this purpose. We hypothesised that a simple management of harvesting Napier grass at an earlier LS will increase nutritional composition by increasing the proportion of leaf to stem (Experiment 1) which, in turn, will increase cattle growth (Experiment 2).

2. Materials and Methods

2.1. Experiments, Location and Duration of the Study

Both experiments were conducted from May 2019 to April 2020 at the Pachutia Research Farm, Bangladesh Livestock Research Institute (BLRI), Savar, Dhaka, Bangladesh. The experimental site is known as Madhupur Tract, which is a part of Agro-ecological Zone (AEZ-28) of Bangladesh. It is located at an altitude of 4 m above sea level, with coordinates of 24°42′0″ N latitude, and 90°22′30″ E longitude. The soil of the site is clay textured, strongly acidic (pH 4.5-5.7) soil and contains low (<1.5%) organic matter. The climate of the site site is characterised by a maximum temperature during April-July (summer months) accompanied by high rainfall (370 mm/month). Minimum temperature occurs during December-January (winter months) when it may drop below 10° C accompanied by low rainfall (1-6mm/month). Average humidity is 70.4% and the total annual rainfall is 1990 mm (https://en.climate-data.org/asia/bangladesh/dhaka-division/savar-123710/; https://weatherandclimate.com/bangladesh/dhaka/savar).
Experiment 1 focused on Napier grass nutritive value, which was conducted over 12 months. Experiment 2 aimed at cattle growth offering extreme treatments from Napier grass, which was conducted over a period of 113 days.

2.2. Experiment-1: Management of Napier Grass

Preparation of Experimental Plots and Management

Prior to start of the experiment, soil samples were collected from three different locations across the site at a depth of 0-30 cm. These samples were mixed thoroughly to make a composite sample and five composite soil sub-samples, each weighing approximately 100 g were prepared and sent to the Soil Resource Development Institute, Farmgate, Dhaka-1215 for analysis (Table 1).
The experimental land was then ploughed four times with a tractor, with weeds then removed manually from the ploughed land and finally, the land was levelled to ensure uniformity. A basal dose of urea (as N), triple superphosphate (as P), muriate of potash (as K), and gypsum at 297, 214, 56, and 90 kg/ha were applied according to the soil nutrient analysis report (Table 1). In addition, limestone was applied at a rate of 1,976 kg/ha, 14 days before planting to adjust soil pH. Napier grass was planted by stem cuttings, where two cuttings were planted in a hole at a 45o angle and each cutting had two nodes. Plant to plant distance was 50 cm and row-to-row distance was also maintained at 50 cm. During the experimental period, urea fertiliser was applied to each plot at a rate of 249 g/cut (115 g N; Urea contains 46% N). All plots were irrigated to ensure non limiting soil moisture for plant growth.

2.3. Experimental Design

The experimental design was a Randomized Complete Block Design (RCBD). Treatments included 3 LS (6, 9, and 14, respectively), each harvested at 3 SH (5, 10, and 20 cm above the ground level). These treatments were arranged in a 3 × 3 factorial arrangement and replicated each treatment three times randomly across blocks, making a total of 27 plots. Each plot was 4 × 4 m2 and each plot consisted of 64 plants. Each plot was separated by a buffer alley of 2 m.
Plants after the initial planting reached 6, 9, and 14 LS on 28 June, 11 July, and 18 August 2019, respectively and were harvested (i.e., 1st harvest) on these dates for each SH of 5, 10, and 20 cm from the ground level. Subsequently, plants in each treatment were harvested at regular interval throughout the year as plants reached their respective LS. During the harvesting time, we recorded morphological characteristics such as total leaf number (LS), normal and raised plant height (cm), the number of dead and green leaves, the number of tillers, the number of nodes, the leaf-stem ratio, and the biomass yield. Normal height is defined as the plant height at canopy and raised plant height was measured by straitening the canopy. Fresh biomass yield from each plot was weighed using a scale immediately after harvest and was converted to DM yield/plot. according to the equation DM yield/plot = weight of fresh biomass × (%) DM.
To determine DM content, a representative sample (approximately 750 g) was taken and chopped to a length of 1-2 cm using Wiley Mill (Dietz-Motoren, KG, Elektromotorenfabrik, 7311 Dettinger-Tech, Germany). Chopped sample was mixed properly and ~250 g sample, replicated twice were taken in paper bags. Sample bags were dried at 60°C for 48 h in an oven. Fresh (WW) and dried (DW) weight were recorded and DM content was calculated using the following formula:
% DM = DW/WW X 100) Here, WW; total sample weight while wet, DM; total sample weight while dry.

2.4. Napier Grass Nutritive Value

All grass samples were ground up using a 1.0-mm mesh sieve (Retsch GmbH, 5657 HAAN, Germany) for chemical analysis; adhering to the procedure established by the Association of Official Analytical Chemists (AOAC) [13] for the determination of dry matter (DM), crude protein (CP), organic matter (OM), and ash. Fibre, ADF, and NDF were quantified according to the methodology established by Van Soest et al. [14]. All samples were analyses at the Animal Nutrition Laboratory, BLRI, Savar, Dhaka-1341 with duplicate, and mean values were recorded.
A bomb calorimeter (C 5000; IKa-Werke GmbH and Co. KG Staufen, Germany) was used to assess the gross energy (GE) applying benzoic acid as a standard.
Oxalate content was determined using the method described by Rahman et al. [15] through HPLC and WSC by Smith [16].
In vitro digestibility was determined using gas production (GP) technique described by Asanuma et al. [17].

2.5. Experiment-2: Cattle Growth

In this experiment, Napier grass was maintained and harvested to offer grass to cattle at 6, 9 and 14 LS, all harvested at 5cm SH above ground level. Eighteen Red Chittagong cattle of 18-22 months of age growing bull, with an initial average live weight of 181.9 ± 2.30 kg (mean ±SE), were divided into three groups. Each group included 6 cattle and offered with Napier grass harvested at 5 cm from the ground level at one of the three LS. All cattle were fed ad libitum and individually in a shed under stall fed condition. The experiment was conducted for a period of 113 days, comprising a 7-day adjustment period, a 100-day feeding trial followed by a 7-day digestibility trial. No concentrate or supplementation was provided during the trial. Grass was supplied twice daily (at 8:00 a.m. and at 4:00 p.m.). Fresh and clean drinking water was supplied ad libitum to cattle throughout the experimental period. All cattle were weighed at an interval of 10-days. Growth of an individual was calculated from the final body weight deducted from the initial body weight, and the resultant was divided by the duration of feeding periods and finally expressed as g/day.
Feed intake of each cattle was monitored daily throughout the experiment. Daily feed intake was calculated from the differences in amount of offer and leftover remained from that offer the next day. Before each feeding time in the morning and afternoon, grass to be offered was weighed and offered to the cattle in the individual feed trough. Left overs were collected the next morning, weighed individually, and recorded. The DM content of offer and remaining grass was measured every 10 days to align with the liveweight measurements. Fresh grass samples from all three LS treatments were collected twice a week for analysis (total sample 26) and these samples were stored in a freezer at -18°C. For proximate analysis, these collected samples were combined to produce one sample for each individual animal.

2.6. Feed Digestibility

The digestibility study started 10 days prior to the conclusion of the experiment, with three days allocated for the adjustment to the new system and seven days for data collection. Left over feed was weighed before the morning feeding, a sample was taken and stored at -18° C for proximate analysis. Faeces from each cattle was collected throughout the day (24 hours) and kept in individual containers with lids. After 24 hrs, the total faeces of each cattle were weighed, thoroughly mixed, and a 5% subsample was collected in an empty container and stored in the freezer at -18° C. Following the collection period, all stored faecal samples of each cattle was taken out of the freezer, thawed and carefully sorted, and around 300 g of mixed faeces was taken for proximate analysis. Proximate analysis of feed, left over and faeces was analysed following the methods mentioned above.

2.7. Statistical Analysis

The data on morphological characteristics, yield, and nutritive value of Napier grass were subjected to analysis of variance (ANOVA) using univariate GLM procedure based on a Randomized Complete Block Design (RCBD). The LS and SH were included as main effects. A least squares regression model in Statistical Package for the Social Sciences (SPSS), 20 computer software packages were used to describe statistical relationships between the treatment responses of a 3 x 3 factorial experiment with fixed effect of 3 LS at harvest (6, 9 and 14 LS), and 3 SH (applied as cutting/residual height) of 5, 10 and 20 cm, and the random effect of 3 block (B 1, 2, 3). Duncan test at 5% level of probability was applied as a post hoc test to compare the differences among treatment means. The statistical model was as follows:
Yijkl = µ +LSiLi+ SHj +Bk +DHi × SHj+ Eijkl
where Yijk was the dependent variable, µ was population mean, LSi = fixed effect of leaf stage i (i = 1,2, 3; i.e., 6, 9 and 14 leaf number), SHj = fixed effect of severity height j (j = 1,2, 3; i.e., 5 cm, 10 cm and 20 cm), Bk = random effect of blocks n (n = 3), Eijkl = residual error, assumed to be normally and independently distributed and LSi × SHj were the fixed effect of ith leaf stage jth severity height and their interaction, respectively. However, the response to dietary treatments on feed intake, digestibility, nutritional quality, growth performance and cost-net profit calculation were analyzed statistically in an ANOVA of a Completely Randomized Design (CRD) using GLM procedures with Statistical Package for the Social Sciences, 20 computer software packages. The Duncan test was used when the difference between treatments means was significant.
The response to dietary treatments on intake, digestibility, nutritional quality and growth rate were analysed statistically in an ANOVA of a Completely Randomized Design (CRD) using GLM Procedures of SPSS, 20 for Windows. Duncan’s Multiple Range test was used when the difference between treatment means were significant.

3. Results

3.1. Experiment 1

3.1.1. Morphology

Increasing LS from 6 to 9, decreased leaf proportion (from 100 to 44%) but increased (P<0.001) the stem proportion by more than 50% (from 0 to 56). In contrast, the leaf proportion increased (from 79-87%) but stem proportion decreased significantly (from 21 to 14) as the SH increased from 5 to 20 cm (p<0.01).
Increasing the LS from 6 to 14 increased (p<0.001) normal plant height (height at canopy or defoliation height) five times from 36 to 173 cm; A similar trend appeared for the raised plant height. Increasing LS from 6 to 14 also increased (p<0.001) green leaves (from 6 to11), dead leaves (from 0 to 3), and number of nodes per plant (from 0 to 9). Defoliation interval (DI) was significantly shorter for 6 LS grass compared to those at 14 LS (mean 22 vs 68 days).

3.1.2. Yield, Nutritive Value and In Vitro Digestibility

Increasing LS from 6 to 14 increased DM yield (p<0.001) from 17 to 40 t/ha/yr. However, SH had no impact on DM yield (Table 3). As LS increased from 6 to 14, DM, OM, ADF, NDF, ADL and silica content also increased (P<0.05). In contrast, CP content decreased from 184 to 118 g/kg DM as LS increased, with similar CP across SH treatments. Similarly, ADF, NDF, ADL and silica content decreased with increased LS.
The dOM and ME of Napier grass were the highest (607 g/kg and 10.4 MJ/kg DM) at 6 LS 6 (p<0.001). As the LS increased from 6 to 14, the dOM declined gradually from 610 to 520 g/kg, and ME decreased from 10.4 to 7.30 MJ/kg DM. However, SH had no effect on dOM and ME content of Napier grass.

3.1.3. Minerals, Gross Energy, Nitrate-N, Water-Soluble CHO and Soluble Oxalate

Increasing LS from 6 to 14 decreased (p<0.001) Ca (from 6.7 to 4.1 g/kg DM), K (from 13.8 to 7.8 g/kg DM), Mg (from 6.0 to 3.6 g/kg DM), P (from 3.3 to 1.8 g/kg DM), NO3-N (from 1.2 to 0.8 g/kg DM), WSC (from 153 to 123 g/kg DM) and soluble Ca-oxalate (from 34.8 to 18.0g/kg DM) contents. However, LS did not affect the GE content of Napier grass (Table 4).

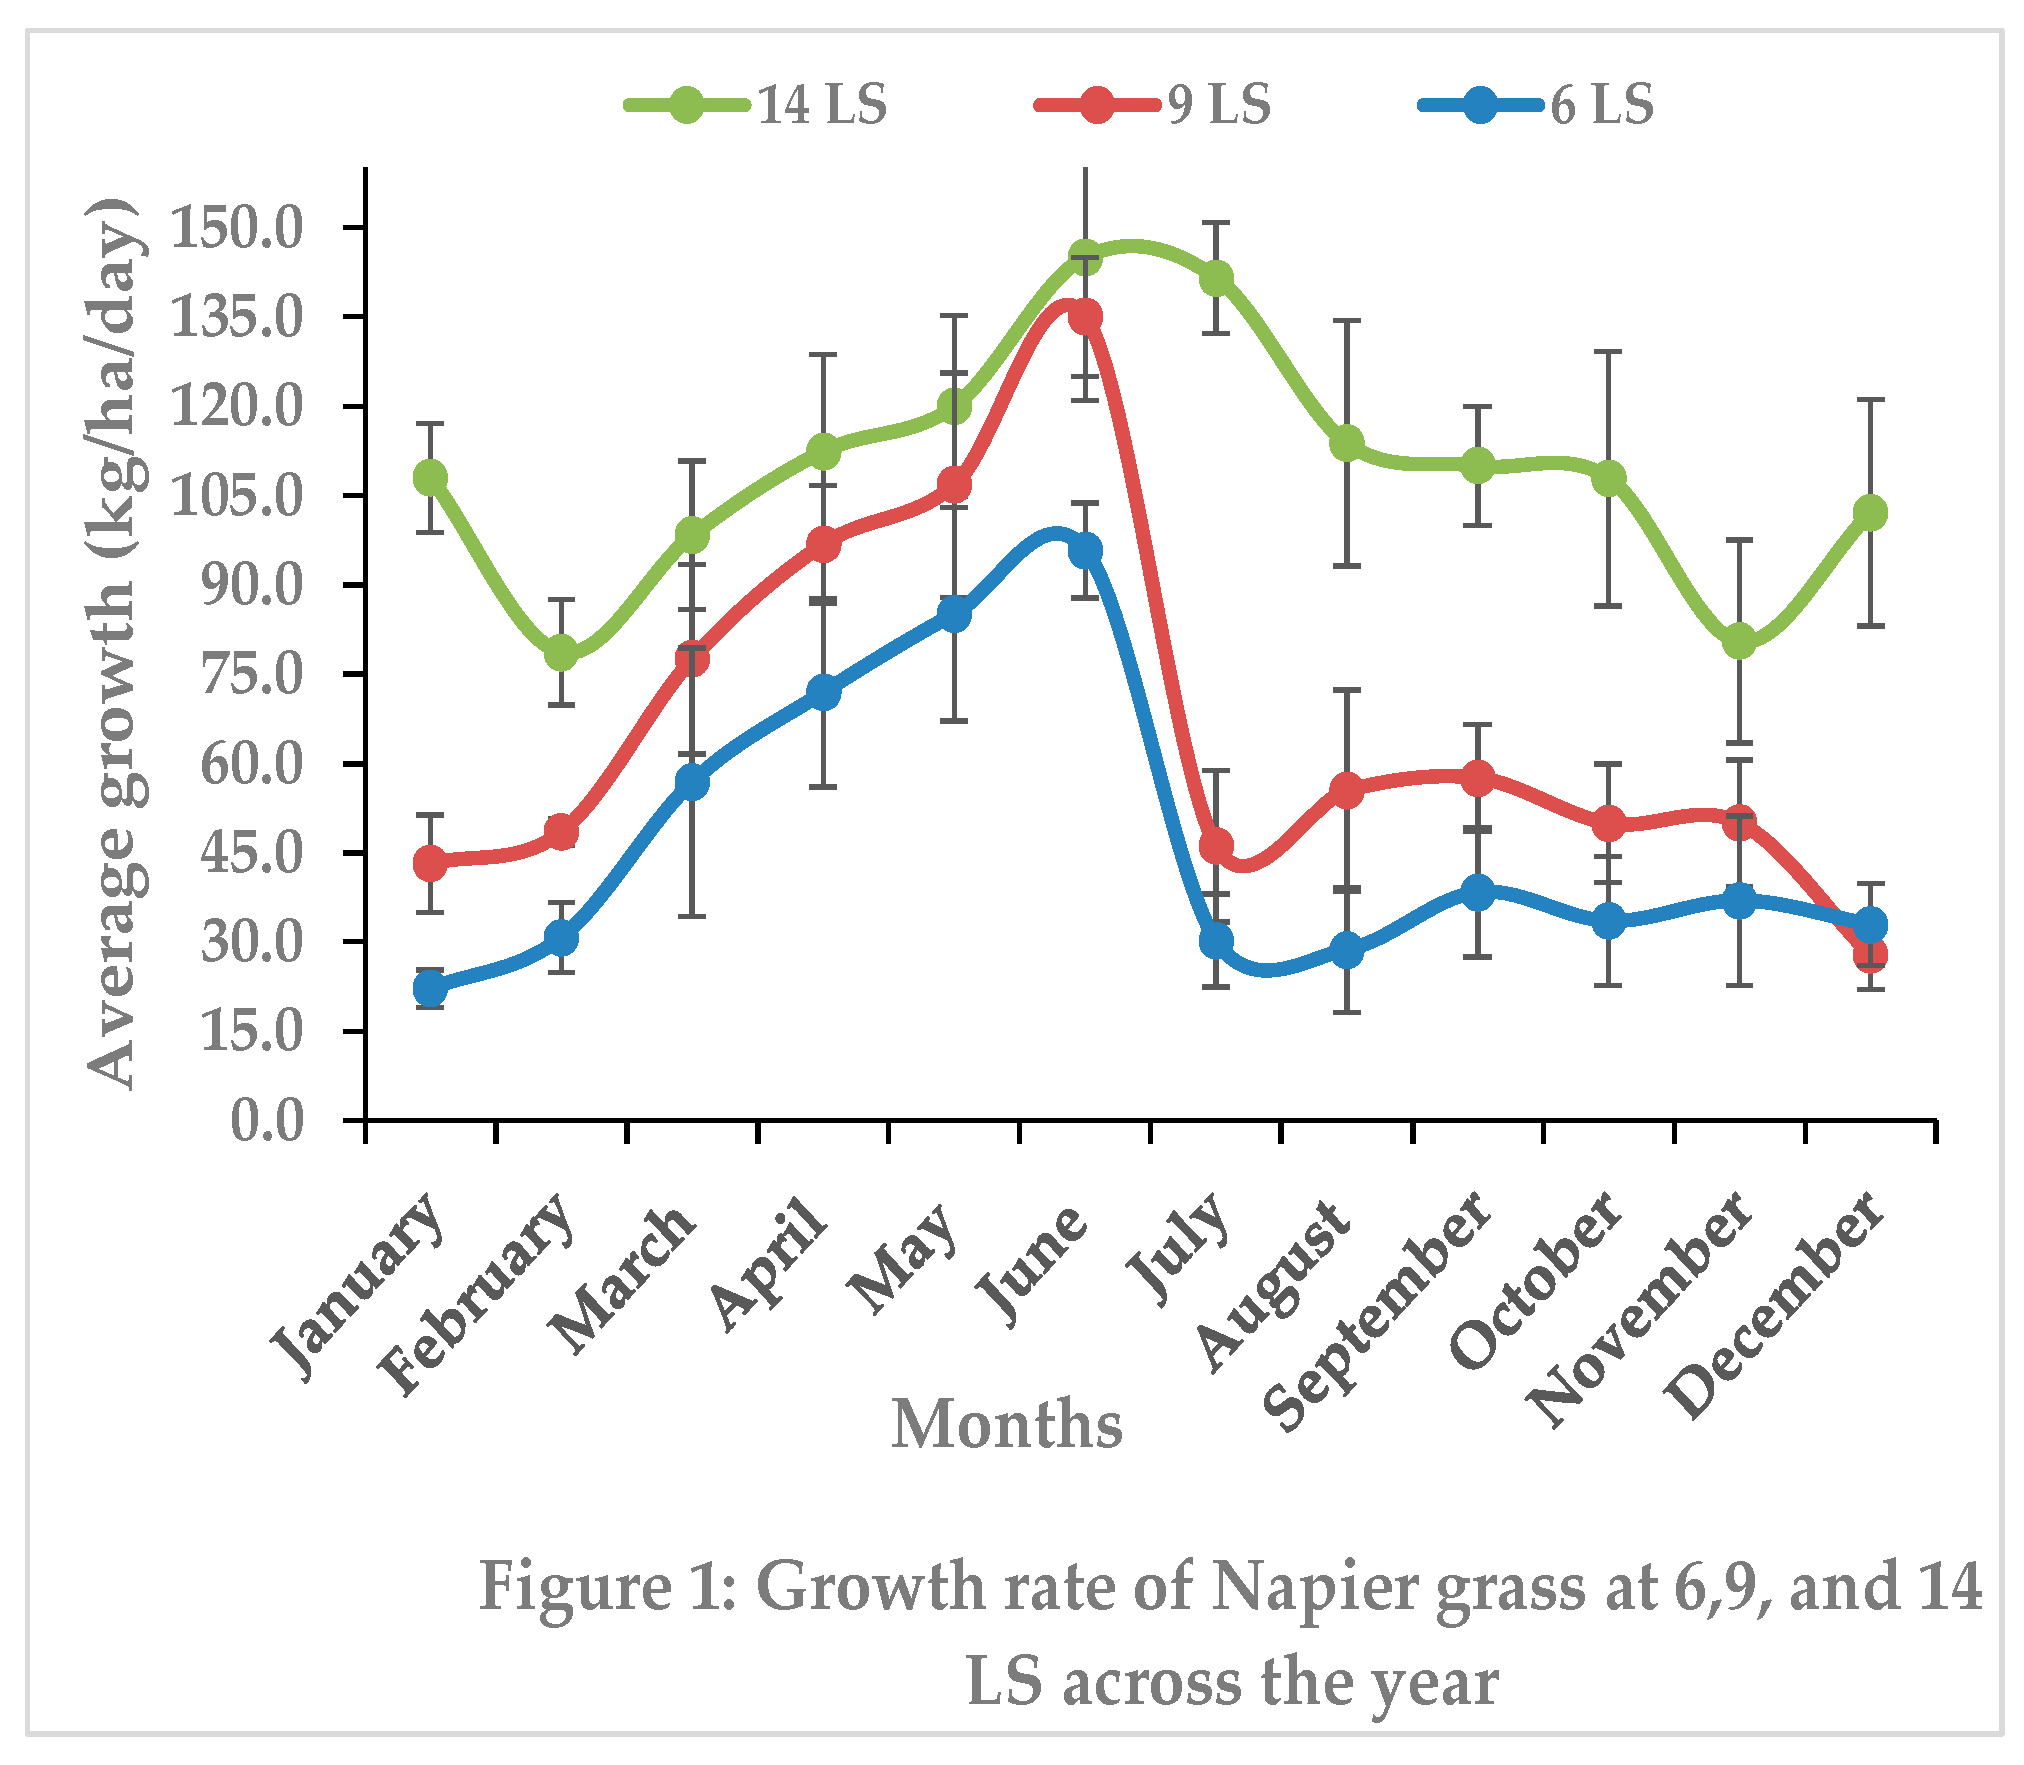
3.1.4. Seasonal Impact on Biomass Yield and Nutritive Value

Napier grass growth in all treatments began to decline in October, reaching its lowest production during December-February. Growth started to peak from March and peaked during July-August (Figure 1). Yearly average growth rate of Napier grass was 47, 66 and 109 kg/ha/day for 6, 9 and 14 LS, respectively. There was no impact of season on CP, ADF and NDF content of grass within a particular season.

3.2. Experiment 2

3.2.1. Nutrient Composition of Napier Grass Offered to Cattle

The nutrient composition (DM, OM, CP, ADF, NDF and ash) of Napier grass offered to cattle during the experiment differed significantly (p<0.001) among treatments (Table 5). Crude protein content of grasses was 155, 113 and 83.7 g/kg DM, and NDF content were 705, 718 and 737 g/kg DM respectively for 6, 9, and 14 LS of Napier grass treatments.

3.2.2. Nutrient Intake and Digestibility of Napier Grass

Total dry matter (including % liveweight or W0.75 basis), ADF and NDF intake of cattle increased (P<0.05) but CP intake decreased (P<0.001) with the increase in LS from 6 to 14 (Table 6). Crude protein intake was in cattle offered with 6 LS and 9 LS Napier grass was 1.8 and 1.3 times greater compared with 14 LS. Similarly, DM, CP and NDF digestibility of grass in cattle offered with 6 LS Napier grass was higher compared to 9 or 14 LS Napier grass (Table 6).

3.3. Growth Performance and Feed Conversion Ratio (FCR)

Cattle on the 6 LS treatment had the greatest growth at 610 g/day which was double that of the 14 LS Napier grass (Table 7). The feed conversion ratio followed similar results with FCRs of 6 and 16 kg DM/kg LW gain for the 6 and 14 LS treatment.

4. Discussion

When Napier grass LS increased from 6 to 14 in experiment 1, there was a substantial decrease in CP from 180 to 120 g/kg DM, dOM (610 to 520 g/kg DM) and ME from 10.4 to 7.3 MJ ME/kg DM. Decreasing CP, dOM and ME with increasing LS of Napier grass in our experiment were associated with increases in NDF (from 540 to 690 g/kg DM), ADF (from 330 to 390 g/kg DM), ADL and silica contents (from 92.5 to 113 g/kg DM and 15.7 to 46.1 g/kg DM, respectively). These findings are consistent with other forages in the literature [1,2,3,10]. These changes in nutritional composition are attributed to a higher proportion of stem (increasing from 0 to 56%) and a greater number of dead leaves (from 0 to 3 dead leaves) as increased from 36 to 173 cm and LS increased from 6 to 14. In addition, minerals, nitrate-N, WSC and soluble oxalate contents decreased as LS increased. These findings were consistent across seasons as seasonal variation did not impact CP, ADF and NDF contents at any specific LS. As hypothesised, increase in fibre (and silica content), along with a decrease in CP, WSC and minerals was associated with a reduced proportion of leaf and an increased number of dead leaves as LS increased from 6 to 14. This pattern is likely to be contributed to the observed decline in CP and ME content of Napier grass with greater LS. The aging process of the plant likely played a role in this decline as plant metabolism and nutrient mobilisation shifts with maturity [18,19]. Islam et al. [2] reviewed similar finding showing that CP content decreases with plant aging. Nitrogen and WSC mobilise are mobilised from leaves for plant development [18,19], ultimately leading to increased fibre and reduced ME content of plants. However, SH did not impact the CP and ME content of Napier grass in this experiment. These results emphasise the importance of a simple best management practice, the LS management. For example, at 6 LS, Napier grass contained 180 g CP/kg DM and 10.4 MJ ME/kg DM compared with 120 g CP/kg DM and 7.3 MJ ME/kg DM at 14 LS. Machado et al. [20] reported similar findings, showing dOM to decrease from 75% to 55% as the interval between defoliations increased from 33 days to 93 days. Likewise, Goorahoo et al. [11] and Sileshi et al. [12] reported reductions in CP and ME content of Napier grass with increasing DI. These findings have significant implications for the livestock industry in the tropics and subtropics. Peyraud and Delagarde [21] reported that a 1% reduction in dOM of grass leads to a loss of 1 kg of milk/cow/day. Islam et al. [1] also reported that each per cent increase in CP in Napier grass corresponds to milk yield increase of 0.83 L/cow/day and for each MJ increase in ME corresponds to milk yield increase of 3.5 L/cow/day. Islam et al. [3] further highlighted the potential of Napier grass containing 200 g CP/kg DM, and 10 MJ ME/kg DM to produce >25000 L milk/ha/yr, underscoring its role in achieving food security and potential to transform the lives of millions of people in the tropics and subtropics where Napier grass is a staple feed for dairy and beef cattle.
Despite the increase in Napier grass nutritive value as LS decreased, yield decreased by >50%. In line with our findings, Tessema et al. [22] reported that increasing DH from 100 to 300 cm doubled Napier grass yield, from 16 to 32 t DM/ha/yr. similarly, Wangchuk et al. [23] also reported a significant increase in yield from 0.24 to 0.83 kg DM/plant when plant height increased from 150 to 260 cm. However, this increase in yield was accompanied by 81% greater biomass production resulting from the enhanced DH and a proportional reduction in the leaf proportion, and overall quality [11,12]. Thus, strategies are required to improve both quality and quantity simultaneously. Islam et al. [2] proposed a simple change, such as increasing plant density and reducing defoliation intervals, which is associated with LS in our experiment, to increase both yield and quality. Further research is needed to validate these strategies and explore their potential to optimise Napier grass production for livestock systems in the tropics and subtropics.
In experiment 2, the 6 LS group achieved a daily gain of 610 g by consuming only 6.44 kg DM, which contained 155 g CP/kg DM (Table 5). This growth rate was greater than the 210-250 g/day reported for young stock offered Napier grass containing <80 g of CP/kg of DM [24,25]. According to ARC [26] standard, grasses with 120 g CP/kg DM enable growing heifers to achieve a daily weight gain of 500 g, as they fulfill the rumen degradable protein requirements necessary for this growth rate. Additionally, a diet consisting solely of Napier grass at 56 days DI, containing 117 g CP/kg DM, resulted in a weight gain of 390–420 g LW/day, which was more effective than a Napier grass diet with 80 g CP/kg DM, yielding 210–250 g LW/day [24,25]. However, Holstein heifers consuming DM at a rate of 3.5% of LW and NDF at a rate of 2% of LW achieved 500 g/day LW. This was despite Napier grass, which was harvested at 42 days DI containing 8.6 MJ ME/kg DM, 118 g/kg DM CP and 587 g/kg DM NDF [27]. This growth of the heifers is consistent with the growth reported by ARC [26], indicating that cattle exclusively fed Napier grass containing approximately 120 g/kg DM CP and 550 g/kg DM NDF will grow at a rate of 500 g/day. Greater growth rate of cattle fed 50 cm DH Napier grass despite similar NDF content (550-570 g/kg DM) used in our experiment compared to those reported previously [26,27] is likely attributable to difference in CP content. In our experiment, the CP content of grass was 180 g/kg DM compared to 120 g/kg DM reported in this literature. Napier grass (Pakchong) in our experiment was harvested and offered to cattle in a rotation of 17 days interval (DI) compared to 42 days DI reported by Kariuki et al. [27]. Interestingly, this Pakchong cultivar contained similar NDF at 17 days DI (57%) compared to that reported for 42 days DI (56%) by Kariuki et al. [27]. Several factors such as morphology, variety, inputs, maturity, DI influence nutritive value of Napier grass [2]. Pakchong is considered a tall variety and likely to contain a higher proportion of stem compared to leafy varieties. Consequently, Pakchong may contain a higher NDF content compared to leafy cultivars, which may have been offered by Kariuki et al. [27]. In our experiment, cattle fed Napier grass containing 83.7 g/kg DM CP and 737 g/kg DM NDF (14 LS) grew at a rate of 270 g/day, which was approximately half of the gains reported by ARC [26] and Kariuki et al. [27]. Similarly, LW gain of cattle was lower (350 g/day) when cattle were offered Napier grass with 113 g/kg DM CP and 718 g/kg DM NDF (9 LS) compared to previous reports [26,27]. These lower growth rates are likely to be due to high grass NDF content even when CP levels of these grasses were relatively high.
Overall, our findings indicate that 6 LS is optimal under the conditions of our experiments without supplementing concentrates. Managing Napier grass using this new best management practice, may have significant implications for transforming animal production systems, thereby contributing food security of the millions of people in the tropics and subtropics.

5. Conclusions

Changing Napier grass management practices to harvest at 6 LS significantly enhanced its nutritional value, resulting in 180 g/kg DM crude protein and 10 MJ ME/kg DM, which helped to boost animal production with a growth rate of 610 g/day, excluding concentrates. This presents a valuable opportunity to enhance food security for populations residing in the tropics and subtropics.

Author Contributions

M.K.B. literature search, data curation, investigation, writing original draft, review and editing. C.E.F.C. conceptualisation, investigation, writing—review and editing. A.R. literature search, data curation, investigation, writing—review & editing. B.K.R. data collection and compilation, data curation and analysis, writing—review & editing. N.R.S. writing—review & editing. M.M.B. writing—review & editing. N.S. writing—review & editing. M.A.M. writing—review & editing. M.R.I. conceptualisation, literature search, data curation, investigation, writing, review and editing. All authors have read and agreed to the published version of the manuscript.

Funding

This research received no external funding.

Institutional Review Board Statement

“The animal study protocol was approved by the Institutional Review Board (or Ethics Committee) of BANGLADESH LIVESTOCK RESEARCH INSTITUTE (protocol code: AEEC/BLRI 00021/25).” for studies involving animals.

Informed Consent Statement

Not applicable.

Data Availability Statement

‘None of the data were deposited in an official repository. The authors will provide the data used and analysed during the current investigation upon request.

Acknowledgments

We express our gratitude to the Director General of BLRI for permitting us to do field research and provide laboratory facilities for analysis.

Conflicts of Interest

There is no conflicts of interest.

References

  1. Islam, M.R.; Garcia, S.C.; Sarker, N.R.; Roy, B.K.; Sultana, N.; Clark, C. The role of napier grass (Pennisetum purpureum schumach) for improving ruminant production effciency and human nutrition in the tropics,” in Climate Change and Livestock Production: Recent Advances and Future Perspectives. Eds. V. Sejian, S. Chauhan, C. Devaraj, K. Malik and R. Bhatta, Singapore: Springer, 2021; pp. 151-160. doi: 10.1007/ 978-981-16-9836-1_13.
  2. Islam, M.R.; Garcia, S.C.; Sarker, N.R.;, Islam, M.A.; Clark, C.E.F. Napier grass (Pennisetum purpureum Schum) management strategies for dairy and meat production in the tropics and subtropics: yield and nutritive value. Front. Plant Sci. 2023, 14:1269976. [CrossRef]
  3. Islam, M.R.; Garcia, S.C.; Islam, M.A.; Bashar, M.K.; Roy, A.; Roy, B.K.; Sarker, N.R.; Clark, C.E.F. Ruminant Production from Napier Grass (Pennisetum purpureum Schum): A Review. Animals 2024, 14, 467. [CrossRef]
  4. Negawo, A.T.; Teshome, A.; Kumar, A.; Hanson, J.; Jones, C. S. Opportunities for Napier grass (Pennisetum purpureum) improvement using molecular genetics. Agronomy 2017, 7, 28. [CrossRef]
  5. Heuzé, V.; Tran, G.; Giger-Reverdin, S.; Lebas, F. Elephant grass (Pennisetum purpureum). Feedipedia, a programme by INRA, CIRAD, AFZ and FAO. https://www.feedipedia.org/node/395 Last updated on June 23, 2016, 17:09.
  6. Bashar, M.K.; Sarker, N.R.; Sultana, N.; Hossian, S.M.J. Assessment of GHG emissions in dairy production systems based on existing feed resources through the GLEAM model under different climatic zones of Bangladesh and their mitigation options. J. Adv. Vet. Anim. Res. 2024, 11(3):664–674.
  7. Roy, B. K.; Sarker, N.R.; Alam M.K.; Huque, K.S. Existing production and marketing system of fodder under Meherpur district as livelihood activity. Bang. J. Livest. Res. 2016, 1-9.
  8. Bashar, M.K.; Haese, E.; Sultana, N.; Rodehutscord, M. In vitro ruminal fermentation, methane emissions, and nutritional value of different tropical feedstuffs for ruminants. J. Adv. Vet. Anim. Res. 2024, 11(4): 924–935.
  9. Adesogan, A.T.; Havelaar, A.H.; McKune, S.L.; Eilittä, M.; Dahl, G.E. Animal source foods: sustainability problem or malnutrition and sustainability solution? Perspective matters. Glob Food Sec. 2020, 25:100325.
  10. Fulkerson, B.; Griffiths, N.; Sinclair, K.; Beale, P. Milk production from kikuyu grass-based pastures. Primefact 1068. Primefact at: 2010. https://www.dpi.nsw.gov.au/primefacts.
  11. Goorahoo, D.; Cassel, F. S.; Adhikari, D.; Rothberg, M. Update on elephant grass research and its potential as a forage crop,” in Proceedings, California Alfalfa and Forage Symposium, 12-14 December 2005, Visalia, CA, UC Cooperative Extension, Agronomy Research and Extension Center, Plant Sciences Department, University of California, Davis 95616.
  12. Sileshi, Z.; Owen, E.; Dhanoa, M.S.; Theodorou, M.K. Prediction of in situ rumen dry matter disappearance of Ethiopian forages from an in vitro gas production technique using a pressure transducer, chemical analyses or in vitro digestibility. Anim Feed Sci Technol. 1996, 61(1–4):73–87.
  13. AOAC. Official methods of analysis of the association of official analytical chemists (AOAC) (20th ed.) 2004. Washington DC.
  14. Van Soest, P.J.; Robertson, J.D.; Lewis, B.A. Methods for dietary fiber, neutral detergent fiber and non-starch polysaccharide in relation to animal nutrition. Journal of Dairy Science 1991, 74: 3583–3597.
  15. Rahman, M.M.; Niimi, M.; Kawamura, O. Simple method for determination of oxalic acid in Forages using high-performance liquid chromatography. Grassland Science 2007, 53, 201–204.
  16. Smith, D. Removing and analysing total non-structural carbohy drates from plant tissue. Wisconsin Agricultural Station, Research Report, University of Wisconsin, Madison, WI, USA, 1969, 41, 1–11.
  17. Asanuma, N.; Iwamoto, M.; Hino, T. Effect of the addition of fumarate on methane production by ruminal microorganisms in vitro. Journal of Dairy Science 1999, 82(4), 780–787.
  18. Islam, M.R.; Garcia, S.C.; Horadagoda, A. Effects of irrigation and rates and timing of nitrogen fertilizer on dry matter yield, proportions of plant fractions of maize and nutritive value and in vitro gas production characteristics of whole crop maize silage. Anim. Feed Sci. Technol. 2012, 172, 125–135. [CrossRef]
  19. Islam, M.R.; Garcia, S.C.; Horadagoda, A.; Kerrisk, K.; Clark, C.E.F. Management strategies for forage rape (Brassica napus L. cv Goliath): Impact on dry matter yield, plant reserves, morphology and nutritive value. Grass Forage Sci. 2020, 75 (1), 96–110. [CrossRef]
  20. MaChado, P.A.S.; Valadares Filho, S.; de, C.; Valadares, R.F.D.; Detmann, E.; Paixao, M.L. et al. Nutritional evaluation of elephantgrass at different regrowth ages. Rev. Bras. Zootec. 2008, 37 (6), 1121–1128. [CrossRef]
  21. Peyraud, J.L.; Delagarde, R. Managing variations in dairy cow nutrient supply under grazing. Animal 2013, 7 (s1), 57–67. [CrossRef]
  22. Tessema, Z.K.; Mihret, J.; Solomon, M. Effect of defoliation frequency and cutting height on growth, dry-matter yield and nutritive value of Napier grass (Pennisetum purpureum (L.) Schumach). Grass Forage Sci. 2010, 65, 421–430. [CrossRef]
  23. Wangchuk, K.; Rai, K.; Nirola, H.; Thukten, Dendup, C.; Mongar, D. Forage growth, yield and quality responses of Napier hybrid grass cultivars to three cutting intervals in the Himalayan foothills. Trop. Grassl.– Forrajes Tropicales 2015, 3, 142-150. [CrossRef]
  24. Wouters, A.P. Dry matter yield and quality of Napier grass on farm level 1983–1986. Research report 1987, Ministry of Livestock Development, Nairobi, Kenya, p. 39.
  25. Gitau, G.K.; McDermott, J.J.; Adams, J.; Lissemore, E.; Waltner-Toews, D. Factors influencing calf growth and daily weight gain on smallholder dairy farms in Kiambu District, Kenya. Prev. Vet. Med. 1994, 21, 179–190.
  26. ARC. The Nutrients Requirements of Ruminant Livestock, 4th ed.; CAB International: Wallingford, UK, 1980; Available online: https://www.cabdirect.org/cabdirect/abstract/19801412232 (accessed on 4 December 2023).
  27. Kariuki, J. N., Gachuiri, C. K., G.K. Gitau, G. K., Tamminga, S., Van Bruchem, J., Muia, J. M. K., et al. Effect of feeding napier grass, lucerne and sweet potato vines as sole diets to dairy heifers on nutrient intake, weight gain and rumen degradation. Livest. Prod. Sci. 1998, 55, 13–20. [CrossRef]
Figure 1. Caption.
Figure 1. Caption.
Preprints 150707 g001
Table 1. Chemical composition of soil (dry soil).
Statistics pH OM (organic matter) N (% dry matter) K (ppm) P (ppm)
Mean 5.3 1.71 0.09 0.17 6.32
SD 0.25 0.22 0.01 0.04 2.56
SD=standard deviation, OM=organic matter, N=nitrogen, K=potassium, P=phosphorus, ppm=parts per million.
Table 2. Effect of leaf stage (LS) and severity height (SH) on morphological characteristics of Napier grass.
Parameters LS (no) SH (cm) SEM Level of Sig.
6 9 14 5 10 20 LS SH LS X SH
Leaf proportion 100a 72b 44c 79b 81b 86a 1.26 *** *** ***
Stem proportion 0c 28b 56a 21a 19b 14c 1.26 *** *** ***
Plant height (cm)
a.
Normal
36c 79b 173a 74 73 68 2.82 *** NS NS
b.
Raised
52c 101b 199a 94 93 87 3.02 *** NS NS
Leaf no./plant
a.
Total
6c 9b 14a 9 9 8 0.19 *** NS NS
b.
Green
6c 8b 11a 8 8 7 0.14 *** NS NS
c.
Dead
0c 1b 3a 1a 0.9a 0.6b 0.06 *** *** ***
Node no./plant 0c 2b 9a 2 2 2 0.19 *** NS NS
Days between harvest 22c 33b 68a 39a 35b 26c 1.24 *** *** NS
Number of harvest 17 11 5 9 10 14
LS, Leaf stage; SH, Severity height; SEM, Standard error of the mean; NS, Not significant (P>0.05); *=P<0.05, **= P<0.01; ***=P<0.001, a-c means with different superscripts in the same row are significantly different.
Table 3. Effect of leaf stage (LS) and severity height (SH) on yield, nutritive value and in vitro digestibility of Napier grass.
Parameters LS (no) SH (cm) SEM Level of Sig.
6 9 14 5 10 20 LS SH LS X SH
Yield (ton/ha/yr)
DM 17c 24b 40a 23.8 25.8 23.9 1.74 *** NS NS
CP 3.2b 3.9ab 4.7a 3.5 3.6 3.4 0.13 *** NS NS
Chemical composition (g/kg DM)
DM 135c 140b 166a 136b 152a 153a 1.20 *** *** *
CP 184a 163b 118c 154 154 157 3.40 *** NS NS
ADF 325c 362b 386a 359 360 354 4.70 *** NS *
NDF 540b 670a 690a 653a 641ab 611b 3.03 *** * NS
ADL 92.5b 103a 113a 112a 100b 97b 2.95 * * NS
Silica 15.7c 29.8b 46.1a 28.6b 28.4b 34.6a 2.82 *** ** ***
OM 913b 917b 939c 918b 919b 931a 5.01 *** * NS
In vitro digestibility
dOM (g/kg DM) 610a 570b 520c 560 560 570 4.60 *** NS NS
ME (MJ/kg DM) 10.4a 7.63b 7.27b 8.07 8.31 8.92 0.36 *** NS NS
LS, Leaf Stage; SH, Severity height; DM, Dry matter; CP, Crude protein; ADF, Acid detergent fibre; NDF, Neutral detergent fibre; dOM, Digestibility of organic matter; ME, Metabolisable energy; SEM, Standard error of the mean; NS, Not significant; *=P<0.05, **= P<0.01; ***=P<0.001, a-c means with different superscripts in the same row are significantly different.
Table 4. Effect of leaf stage on mineral content, gross energy (GE), nitrate- nitrogen (NO3-N), water-soluble carbohydrate (WSC), and soluble oxalate.
Parameters Leaf stage (no.) SEM Level of sig.
6 9 14
Minerals (g/kg DM)
Ca 6.7a 5.5b 4.1c 0.22 ***
K 13.8a 13.8a 7.8b 0.60 ***
Mg 6.0b 6.4a 3.6c 0.26 ***
P 3.3a 2.2b 1.8c 0.22 ***
Zn 0.07b 0.07b 0.09a 0.002 ***
GE (MJ/kg, DM) 15.0 14.6 15.1 0.15 NS
NO3-N (g/kg DM) 1.2a 1.1a 0.8b 0.05 **
WSC (g/kg DM) 153a 129ab 123b 9.20 *
Soluble Ca oxalate (g/kg DM) 34.8a 31.2b 18.0c 2.55 ***
Ca, Calcium; K;Potassium; Mg, Magnesium; P, Phosphorus, Zn, Zinc; GE, Gross energy; NO3-N, Nitrate- N; WSC, Water soluble carbohydrate; SEM, Standard error of the mean; *=P<0.05, **= P<0.01; ***=P<0.001,a-c means with different superscripts in the same row are significantly different.
Table 5. Chemical composition of Napier grass offered to cattle.
Parameters Leaf stage (no.) SEM Level of sig.
6 9 14
DM, Fresh basis (g/kg DM) 125c 145b 174a 2.27 ***
OM (g/kg DM) 877b 878b 895a 1.12 ***
CP (g/kg DM) 155a 113b 83.7c 2.23 ***
ADF (g/kg DM) 406 412 410 1.76 NS
NDF (g/kg DM) 705c 718b 737a 2.36 ***
Ash (g/kg DM) 123a 122a 105b 1.12 ***
DM, Dry matter; OM, Organic matter; CP, Crude protein; ADF, Acid detergent fibre; NDF, Neutral detergent fibre; SEM, Standard error of the mean; NS, Not significant; *=P<0.05, **= P<0.01; ***=P<0.001, a-c means with different superscripts in the same row are significantly different.
Table 6. Nutrient intake and digestibility of Napier grass.
Parameters Leaf stage (no.) SEM Level of sig.
6 9 14
Nutrient intake (kg/day)
DMI 3.92b 3.97b 4.30a 0.50 **
CPI 0.65a 0.47b 0.37c 0.10 ***
ADFI 1.60b 1.65b 1.77a 0.02 **
NDFI 2.76b 2.85b 3.19a 0.04 ***
DMI (Kg; % LW) 1.85c 1.99b 2.12a 0.02 ***
DM intake (g, W0.75) 70.4b 74.7ab 79.9a 0.88 *
Digestibility (g/kg DM)
DM 630a 595b 567b 8.60 **
CP 684a 625b 592b 12.8 **
ADF 654 631 630 6.23 NS
NDF 697a 657b 637b 8.83 **
DMI, Dry matter intake; CPI, Crude protein intake; ADFI, Acid detergent fibre intake; NDFI, Neutral detergent fibre intake; LW, Live weight; SEM, Standard error of the mean; NS, Not significant; *=P<0.05, **= P<0.01; ***=P<0.001, a-c means with different superscripts in the same row are significantly different.
Table 7. Fed sole Napier grass on growth performance and feed conversion ratio (FCR) of growing RCC cattle.
Parameters Leaf stage (no.) SEM Level of sig.
6 9 14
Initial LW (Kg) 181 181 184 4.31 NS
Final LW (Kg) 246a 218b 213b 5.91 *
Total LW gain (Kg) 65.1a 37.4b 29.1c 3.98 ***
ADG (Kg) 0.61a 0.35b 0.27c 0.04 ***
FCR (kg DM/kg LW gain) 6.44a 11.3b 16.2c 1.05 ***
LW, Live weight; ADG, Average daily gain; FCR, Feed conversion ratio; SEM, Standard error of the mean; NS, Not significant; *=P<0.05, **= P<0.01; ***=P<0.001, a-c means with different superscripts in the same row are significantly different.
Disclaimer/Publisher’s Note: The statements, opinions and data contained in all publications are solely those of the individual author(s) and contributor(s) and not of MDPI and/or the editor(s). MDPI and/or the editor(s) disclaim responsibility for any injury to people or property resulting from any ideas, methods, instructions or products referred to in the content.
Copyright: This open access article is published under a Creative Commons CC BY 4.0 license, which permit the free download, distribution, and reuse, provided that the author and preprint are cited in any reuse.
Prerpints.org logo

Preprints.org is a free preprint server supported by MDPI in Basel, Switzerland.

Subscribe

Disclaimer

Terms of Use

Privacy Policy

Privacy Settings

© 2025 MDPI (Basel, Switzerland) unless otherwise stated