Submitted:
27 February 2025
Posted:
27 February 2025
You are already at the latest version
Abstract
The accelerated growth of older adults (the over-65s) in Italy fits within the context of the complex, hybrid nature of the pension system and the welfare benefits financed by tax revenues, which often overlap. As a result, older adults are facing growing inequalities in living and health conditions, both in the Centre-North and the Southern regions, as well as between genders. Through differential analyses, this paper aims to illustrate the progressive increase in older adults, focussing on their most vulnerable component (i.e. the over-85s), especially concerning social assistance and care issues. Our study considers the current characteristics of social ageing and mortality trends that determine older adults’ growth and number, highlighting the pronounced gender disparities that emerge at older ages. Our findings reveal an ongoing process of change that has led to significant territorial disparities in the types of pension benefits and social allowances. This has exacerbated, in turn, inequalities in living conditions across households and between genders.
Keywords:
older adults
; gender gap
; mortality improvement rate
; Italy
; pension system
1. Background
This work focusses on one of the most relevant aspects characterising the population dynamics for the last 40 years (1982-2022), namely the population ageing process [1] that has profoundly changed the Italian age structure. This is due to the progressive increase of older adults (the over-65s) and the significant decline in children and young people (up to 15). The main consequences have not only been a disruption of the population’s age and gender structure but also progressive burdens and pressures on the welfare system. The State gradually took over roles previously managed by households, addressing these needs through three primary chapters of the social security expenditure: pensions, health, and welfare. In 2022, 51.65% of the public expenditure was allocated to the last two chapters [2]. Of the three expenditure chapters, pensions have a social security nature, while the other two are borne by general taxation and therefore burden the State budget. Pensions and welfare are the expenditure items most directly sensitive to population ageing. Over time, this burden has inevitably increased and this paper examines its implications with a focus on the early months of 2023 [3].
On the one hand, their field of intervention and the number of pensioners has gradually expanded; on the other hand, older adults are among the weakest and therefore most vulnerable, albeit with great variability of age and social conditions. At the end of 2022, the overwhelming majority of the 16,131,414 pensioners were older adults: more than 40% were assisted fully or partially. The importance of separating welfare from social security has been frequently emphasised in the debates on pension system sustainability, given the different causes that lead to these benefits. Nonetheless, their often hybrid nature creates ambiguity, and their separation has not yet occurred [4,5].
2. Sources and Methods
To conduct our analyses, we processed data integrating sources from the Italian National Institute of Statistics (Istat) and the Italian National Institute for Social Security (INPS). The population starting age structure we used is from 1982, and the reference period we considered covers 40 years, from 1982 to 2022.
This allowed us to calculate:
- the increase and share of the population aged 65 years and over (older adults);
- the Mortality Improvement Rates (MIRs), yearly and by geometric averages of the reference period;
- the gender gap between life expectancies (Δex) and the related correlation analysis;
- standardised pension rates (invalidity, old-age and survivors’ pensions - IVS, and social assistance allowances).
3. Older Adults’ Structural Changes
The growth and current peculiarities of older adults have been determined by the specificity of the age composition of the starting reference population (that of 1982), the dynamics of birth rates and migratory flows in the past and, above all, the evolution of mortality rates. Presently older adults have an unbalanced composition due to the high incidence of women, especially in the over-85s (roughly twice as many as men), which has had and continues to have major effects on the welfare system. As age increases, the frequency of people with progressive health problems, chronic diseases, and the risk of passing from frailty to disability increases as well. In the past, many older adults did not have a strong awareness of social security, leading to insufficient contributions or an unfeasibility to contribute for a pension, also due to a very different organisation and structure of the labour market. As a result, they are now dependent on State-funded social pensions administered by INPS, which imposes considerable strain on the overall welfare system.
Data show what has generally been the sharp increase in the weight of the over-85s and the Italian differentials between the Centre-North and Mezzogiorno (South and Islands) regarding the evolution of women (Table 1). During the last 40 years, there has been a significant increase in the number of older adults, while the overall population has remained relatively stable. By the beginning of 2023, the Italian population had increased by less than 5% compared to 1982. However, national population growth had already settled in 2014 (+6.8%), leading to a slow and continuous decline, which varies across the different territorial areas. In the Italian Mezzogiorno, the population decrease started earlier than elsewhere, beginning in 2012. There was an initial increase of 3% for men and 5% for women, but by 2023, the total population had slightly decreased compared to 1982 (Table 2). Meanwhile, the largest population increase occurred in the Centre (+8.6%) where men reached their highest value in 2017 (+9.7%), while women in 2015 (+11.2%).
The total population growth in the North was between the Mezzogiorno and the Centre. It continued until 2020, reaching +8.6% for men, while for women stopped in 2014 (+7.4%). During these 40 years, there has been significant and strong growth in older adults. Among them, men have almost doubled uniformly throughout Italy. For women, this has only occurred in the Mezzogiorno.
Concerning older adults’ age groups, their dynamics are very different, although they have relatively similar characteristics in each area (Table 2 and Figure 1). In particular, the over-85s at the national level have more than quintupled in the case of men, slightly less for women. In this age group, especially concerning women, the pension rate registers its highest values, due to the accumulation of several pension and welfare benefits, especially for their precarious economic and health conditions. At the end of the period, older adults in the 75-84 age group multiplied by more than 2.5 and about 1.5 in the 65-74s. About women, in the same age groups they multiplied by almost 2 and 1.4. Several interruptions characterised these increases, especially among those over-85s, however, they were staggered by about 10 years between one age group and another, starting from 65-74 years old. Cohort and period effects represent the main causes [6]. Among the former, there were the entries in these age groups of the empty classes born during the First World War, related to the high infant mortality of those years (visible in 2005 – Figure 1), as well as the consequences of the strong emigration flows. They had taken place since the early 1900s, driven by whole households with young children, and by the migratory chain effects [7]. Regarding the period effect, the 1983, 1985, and 2003 heat waves caused excess mortality. In addition, 2020 and 2021 were marked by COVID-19 [8], with a consequent slowdown in the 74-84s and over-85s, those most affected by the pandemic.
Relating the data to the Italian total population, at the beginning of 2023 the incidence of older adults was 21.6% for men and 26.3% for women. At the territorial macro-areas, the profiles over these 40 years have been very similar, though with varying intensities. Notably, there has been a strong correlation between the aging process in the North and Centre for women, which for men became stronger after 2010. In contrast, the Mezzogiorno region presents a paradoxical divergence, with a lower share of older adults, especially among women, despite their relatively greater increase. This serves as an important indicator for evaluating population aging in relation to territorial disparities [9] in social security and welfare systems.
4. Older Adults’ Differential Mortality: The Impact on the Social Security System
The dynamics of older adults were determined by the amount of those born in 1917-1958, who gradually reached these ages in 1981-2022, and by the evolution of over-65s mortality. Migration also played a role, albeit limited given the age groups analysed. Demographic ageing has become increasingly important due to the growth of older adults, a result of demographic transition, and the increased life expectancy, making Italy one of the longest-living countries in the world [10,11]. This is due above all to the decline in mortality from cardiovascular diseases, followed by cancer, which are the most significant causes of death among older adults. These improvements are linked to ongoing therapeutic advances and the promotion of healthy lifestyles [12,13]. We analysed the annual changes in the time series of death probabilities qx,t at each age x (x=65, ..., 105) between t-1 and t (t=1982, ..., 2022) calculating the Mortality Improvement Rate - MIR [14].
MIRx-x+4; t-1 to t =1-(qx-x+4,t/qx-x+4,t-1)
At the national level, the results indicate a first phase (1982-2000) almost devoid of excess mortality, followed by a phase (2001-2022) where excess mortality became more frequent. Consequently, the decline in mortality rates during this later period was less rapid compared to earlier years. This is mainly due to anomalous heat waves, which have recurred several times after 1983 [15]. In the excess mortality of 2015, the anticipatory effect of the over-85 deaths played a role, also due to certain criticalities in the vaccination campaign. In 2020, COVID-19 had a significant impact on the frailest older adults, especially those at higher ages, with multiple comorbidities, and from lower socioeconomic status [16]. Notably, during the COVID-19 pandemic, mortality was higher among men, whereas in previous years and other circumstances, it was higher among women. Fluctuations in MIR (1), and thus the excess mortality, have a gradually negative effect as age increases, and the summary we proposed by the MIR calculated as period-geometric average (1982-2022) reproduces this:
MIRx-x+4; t to t+k=1-(qx-x+4,t+k/qx-x+4,t)(1/k)
Focusing on the 40 years, no territorial macro-area emerges and improvements are scattered throughout Italy at the various ages of older adults. However, the decrease in mortality for men has shown greater variability than for women.
In the Italian macro-areas, however, different settings resulted from the equation shown above (2) (Figure 2). In the North and Centre, men experienced a greater reduction in mortality compared to women, although this trend was observed only up to the age of 75 and 78, respectively. In contrast, in the Mezzogiorno, the improvement in mortality among women was significantly higher than for men across all age groups. Thus, the effects of these differentiated reductions in mortality risk have been significant, leading to a general homogenisation of life spans, shifting mortality beyond the threshold of old age. Despite this, men have so far always presented higher risks of death than women, with life expectancy (ex) lower at all ages x [17]. Our comparative analyses with previous years highlight the extent of this disparity today: men’s life expectancy at birth in Italy in 2022 was 80.59 years, a figure that women had already reached in 1992 (80.58 years). From 1982 to 2022, there was indeed some convergence between the life expectancies of women and men, but this only occurred up to adulthood. Thereafter, this convergence gradually diminished and, beyond the threshold of old age, the gap between men’s and women’s life expectancies widened in favour of women, who showed an accelerated increase in the older adult population. The correlation coefficient (Bravais-Pearson) r calculated at each age between the mortality differentials, measured by the gap between ex of women and men (Δex = e Fx-eMx; x=0, 5, 10, ...), and the corresponding ex illustrates these results.
Over this period, life expectancy has been on an upward trend at all ages throughout Italy, albeit with clear differences in the territorial macro-areas. In the North and Centre indeed, where the profiles of r curves are nearly overlapping, Δex has been decreasing as age x increases; this is until around the age of 65, i.e. the residual life expectancy gender gap has tended to get closer (Figure 3). At later ages, however, this strong inverse relationship loses robustness and around age 70-74 Δex remains basically constant throughout the period, with r equal to zero. At the following ages, with increasingly modest growths in ex, Δex also increases as r=1 at age 85. The same occurred in the Mezzogiorno, but the inverse correlation between ex and Δex is less high and decreases at lower ages than in the Centre and North. The correlation coefficient is zero between the ages of 55 and 60, but begins to rise at older ages, showing a comparatively early increase in the life expectancy gap between genders.
Our age- and time-based analysis of these profiles reveals convergence and divergence of life histories. Considering these differences and the results provided by (2) regarding mortality trends, we can observe not only the impact on life expectancy at these ages but also a key parameter for social security payments. Concerning men, the largest gains, in relative terms, in residual life expectancy between 1981 and 2022 occurred in the North, where they reached nearly 47.5% at age 75, followed by the Centre where they reached nearly 40% at 74 years, and then the Mezzogiorno, with 34.6% at 75. About women, on the other hand, the largest increase in (ex) was recorded in the Mezzogiorno (36.6% at the age of 80), then in the North (35.1% at the age of 80) and in the Centre (23.8% at the age of 75). Again, in the case of the Mezzogiorno, this is a remarkable result, considering the regional health inequalities in Italy and this territorial macro-area [16,18,19,20]. As a result, while in 1982, men in the North had the lowest life expectancy from age 65, in 2022, it had become the highest together with that in the Centre, with only minimal differences, while the lowest was in the Mezzogiorno. In 1982, women registered the lowest life expectancy in this macro-area; in 2022, the highest value was still in the North, but the Centre and Mezzogiorno were almost on the same level. This confirms the results achieved so far, i.e. that the trend in the mortality of women over-65s was homogeneous throughout Italy. This differential mortality evolution has also gradually changed the population’s gender composition.
As of January 1, 2023, from a territorial perspective, the situation is much more similar to 1982, with a gradual gender convergence taking place over the 40 years analysed. In any case, population ageing has also coincided with the ageing of households, leading to significant impacts on their dynamics, particularly in terms of composition and size.
Mostly at older ages, the mortality differential has produced a significant gender imbalance, related to the great disproportion between widowers and widows. As of January 1, 2023, there was one widower for every five widows in the Mezzogiorno, with a slightly higher ratio in the North and the Centre. The proportion of widows over 75 stands out for its prominence compared to married women. Given their age-related vulnerability, these widows are at greater risk of losing their independence and experiencing instability, which has a significant impact on the management of social security and welfare [21,22].
5. Interconnection Between Population Ageing, Social Security and Welfare Benefits
Integrating INPS data, at the beginning of 2023, it was found that women represented the over-65s pensioners’ majority for both social security (54.6%) and welfare benefits (59.3%), in both the private-sector-employed and self-employed workers and public-sector-employed workers (59.6%). In general, older adults, especially women over 65, dominated every pension category. However, as of January 1, 2023, the distribution of total pension amounts between the private and public sectors was 46.7% for women and 53.3% for men. Moreover, while in many cases pensions are a key component of income for older adults, and in particular for those still in the workforce - in 2021 444,000, likely self-employed - [16], data on the amounts received by individuals relying solely on pensions reveal deep gender disparities, as well as differences across Italian macro-areas and pension management type.
Among these inequalities, the disparity between pension categories for public and private employees stands out as the most noticeable expression of differentiated treatment among pensioners. Paradoxically, it also reveals a further peculiarity. Unlike the private sector, the public-sector pension system not only recorded the highest deficit among all pension schemes but also benefited from a significant additional contribution. Like the deficit, this additional funding is covered by the state or general taxation [2].
Our analysis confirms the gender pension gap [23,24]. Excluding survivors’ pensions, the average pension received by women is consistently lower than that of men, reflecting the gender pay gap in the labour market and the numerous inequalities women face. For older adults in vulnerable conditions, there are additional forms of economic support, such as social and invalidity allowances. These are more equally distributed at the national level compared to social security benefits, but they tend to be smaller on average. More than half of men receiving disability pensions are under the age of 60, while women are primarily concentrated in the over-80 age group, with more than 45% of them in this category.
Our findings confirm that, as age increases, the share of invalidity pensions among women increases much faster than for men, while the share of old-age pensions decreases. This can be attributed to the fact, in the past, comparatively fewer women with working careers histories were able to pay for contributions. Furthermore, the greater women’s longevity, highlighted by the probability of living longer than the residual life expectancy (Figure 4), explains why many women, as age increases, end up receiving two or more pensions, including invalidity pensions. We observed that as age changes, the pension rates cross around the age of 77: initially higher for men, but later much higher for women.
Next, we examined current levels of population ageing and the incidence of social security and welfare pensions by calculating standardised pension rates. Using the standard population method, we considered the age structure of the Italian resident population in 2022. This approach allowed the comparison between ageing and pension rates to be consistent, as older adults are the primary recipients of IVS pensions.
While this method is fully applicable to IVS pensions, it is less so for social assistance pensions, as there are no age restrictions for eligibility. However, even in this scenario, the share of beneficiaries over 65 is significant, largely due to women’s role (Figure 5).
The results confirmed the Italian territorial gradient between the central-northern and southern regions, with the exceptions of Liguria and Lazio.
In the Centre and North, a high share of over-65s prevailed with a high IVS pension rate, but a low social assistance pension rate. In the Mezzogiorno, together with Lazio and Umbria, regardless of over-65s’ share, there was a high social assistance pension rate associated with lower levels of the IVS pension rate.
6. Concluding Remarks
In Italy, the financial pressures of social security and welfare systems are only partially related to population ageing. These strains are more directly linked to demographic changes among older adults, particularly those over 85, leading to a growing demand for assistance. The different spread of IVS and social assistance pensions highlighted differences in living conditions and the labour market across Italy, revealing the weaknesses of a system that has not sufficiently addressed irregularities in contributions. Therefore, it is crucial to integrate social assistance with the healthcare system, by investing in these still limited services to address the resulting gaps [25].
When needed, older adults, especially in the Mezzogiorno, have often provided their family sphere’s caregivers economic support, thanks to their pension and (or) welfare income [26]. The ongoing demographic and social changes have gradually modified household structures and this informal support network from internal members and relatives. Households are increasingly becoming vertical and narrower, raising the implicit risk that older adults’ caregivers are entering the critical stages of life, i.e. youth and maturity, which may negatively affect their entry into the labour market or forced exit and, consequently, their social security prospects.
In the next phases of our research, we will deepen the role of regions and territories. A more detailed territorial analysis is crucial for identifying inequalities and developing targeted interventions and improvement strategies more effectively.
Acknowledgments
The authors acknowledge co-funding from Next Generation EU in the context of the National Recovery and Resilience Plan, Investment PE8—Project Age-It: ‘Ageing Well in an Ageing Society.’ This resource was co-financed by the Next Generation EU [DM 1557 11.10.2022]. The views and opinions expressed are only those of the authors and do not necessarily reflect those of the European Union or the European Commission. Neither the European Union nor the European Commission can be held responsible for them.
References
- Calot, G.; Sardon, J.P. Les facteurs du vieillissement démographique. Population 1999, 54(3), 509-552.
- Centro Studi e Ricerche Itinerari Previdenziali (a cura di) Il Bilancio del Sistema Previdenziale italiano. Andamenti finanziari e demografici delle pensioni e dell’assistenza per l’anno 2022. Rapporto n.11, 2024.
- INPS, Coordinamento Generale Statistico Attuariale (a cura di) Gestione Dipendenti Pubblici: Pensioni vigenti all’1.1.2023 e liquidate nel 2022. Statistiche in breve, 2023.
- Ferrera, M.; Fargion, V.; Jessoula M. Alle radici del Welfare all’Italiana. Origini e futuro di un modello sociale squilibrato. 2012, Marsilio: Padova, Italy.
- INPS Assistenza e Previdenza. Studi e analisi 2022.
- Reynaud, C.; Miccoli, S. Population ageing in Italy after the 2008 economic crisis: A demographic approach. Futures 2019, 105, 17-26.
- Sori, E. L’Emigrazione italiana dall’Unità alla Seconda guerra mondiale; Il Mulino: Bologna, Italy, 1979.
- Istat, ISS Settimo Rapporto Istat-ISS. Impatto dell’epidemia COVID-19 sulla mortalità totale della popolazione residente. Anni 2020-2021 e gennaio 2022, 2022.
- Carella, M.; Benassi, F.; Misuraca, R.; Armenise, M. Accessibility, population ageing, and foreign presence: a first investigation across local heterogeneities in Italy. In La Geografía ante los Retos del Desarrollo Local, Asociación Española de Geografía (AGE), 2024, 186-192.
- Culotta, F. Life Expectancy Heterogeneity and Pension Fairness: An Italian North-South Divide. Risks 2021, 9(3), 1-22. [CrossRef]
- Pace, R.; Mignolli, N. The Impact of Sub-National Demographic Transitions on Demographic Dividends in Italy. In Pace R., Ham-Chande R. (Eds.). Demographic Dividends: Emerging Challenges and Policy Implications., Springer International Publishing : Switzerland, 2016, 135-174.
- Wilmoth, J.R.; Robine, J.M. The World Trend in Maximum Life Span, Population and Development Review 2003, 29, 239-257.
- Kinsella, K.; Phillips, D.R. Global Aging: The Challenge of Success. Population Bulletin 2005, 60 (1), 1-44.
- Hunt, A.; Villegas, A.M. Mortality Improvement Rates: Modeling, Parameter Uncertainty, and Robustness. North American Actuarial Journal 2022, 27(1), 47-73.
- Capocaccia, R.; Farchi, G.; Mariotti, S.; Verdecchia, A.; Angeli, A.; Scipione, R.; Morganti, P.; Panichelli Fucci, M. (Eds.) La mortalità in Italia nell’anno 1983, Rapporti ISTISAN, 87/54. Istituto Superiore di Sanità : Roma, Italy, 1987.
- Istat Condizioni di vita dei pensionati. Anni 2020-21. Statistiche Report, 2022.
- Maccheroni, C. Diverging tendencies by age in sex differentials in mortality in Italy. South-East European Journal of Political Science 2014, 2(3), 42-58.
- Fasano, A.; Mignolli N.; Pace R. Sistemi sanitari nell’Unione Europea. Nuovi modelli e aspetti multidimensionali. McGraw-Hill Education: Milano, Italy, 2016.
- Cartabellotta, A.; Mosti, M.; Luceri, R.; Orsi, F.; Cottafava E. (Eds.) Livelli Essenziali di Assistenza: le diseguaglianze regionali in sanità. Report Osservatorio GIMBE n. 2/2022., Fondazione GIMBE: Bologna, Italy, 2022.
- Betti, M. ; De Tommaso, C.V. ; Maino, F. Health Inequalities in Italy. Comparing regions among prevention, community health services and hospital assistance. Social Dev. Issues 2023, 45(1), 61-76.
- Dabergott, F. The gendered widowhood effect and social mortality gap. Population Studies 2022, 76(2), 295-307. [CrossRef]
- Cornwell, B.; Qu, T. “I Love You to Death”: Social Networks and the Widowhood Effect on Mortality. Journal of Health and Social Behavior 2024, 65(2), 273-291. [CrossRef]
- Zanier, M.L.; Crespi, I. Facing the gender gap in aging: Italian women’s pension in the European context. Social Sciences 2015, 4(4), 1185-1206. [CrossRef]
- Abatemarco, A.; Russolillo, M. The Dynamics of the Gender Gap at Retirement in Italy: Evidence from SHARE. Italian Economic Journal 2022, 982, 445-473.
- Mazzola, P.; Rimoldi, S.M.L.; Rossi, P.; Noale, M.; Rea, F.; Facchini, C.; Maggi, S.; Corrao, G.; Annoni, G. Aging in Italy: the need for new welfare strategies in an old country. The Gerontologist 2016, 56(3), 383-390.
- Maccheroni C.; Piccarreta R. Households’ changing structure and consumption: the effect of the economic crisis during the period 2008-2013. Review of Official Statistics 2018, 2-3, 37-76.
Figure 1.
Relative increase of the total Italian population and older adults, by age group and gender. 1 January 1982-2023 (Index Numbers 1982=100). Source: Authors’ Processing on Istat data.
Figure 1.
Relative increase of the total Italian population and older adults, by age group and gender. 1 January 1982-2023 (Index Numbers 1982=100). Source: Authors’ Processing on Istat data.
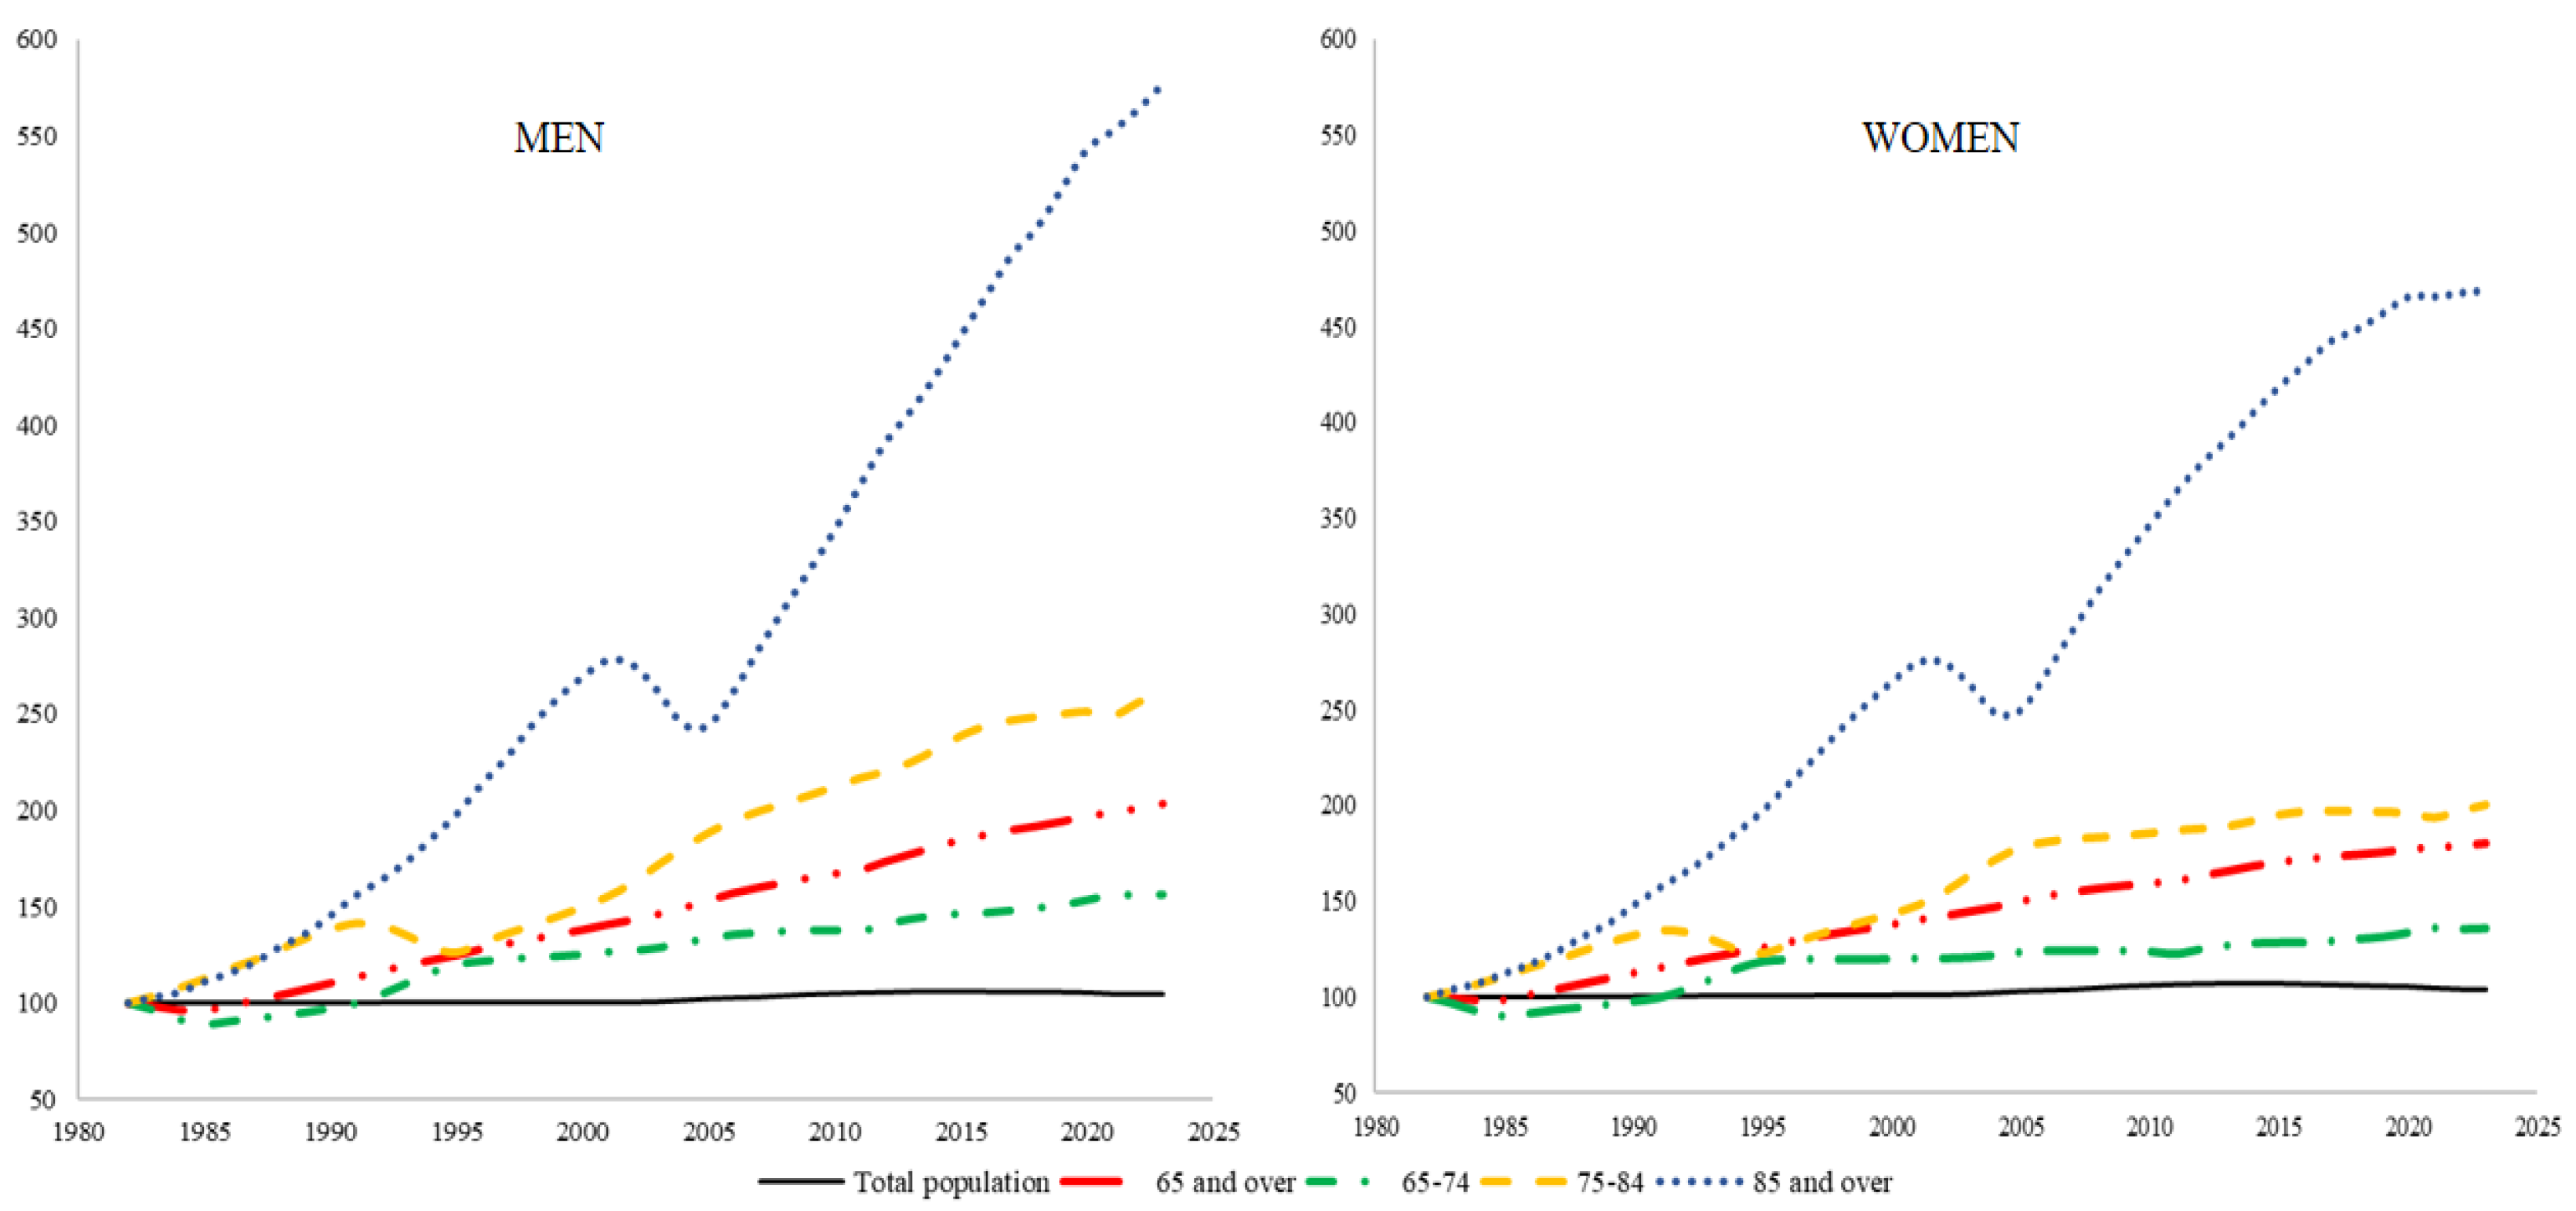
Figure 2.
Older adults’ Mortality Improvement Rate - MIR by Italian macro-areas, age and gender. 1982-2022 (Period geometric average). Source: Authors’ Processing on Istat data.
Figure 2.
Older adults’ Mortality Improvement Rate - MIR by Italian macro-areas, age and gender. 1982-2022 (Period geometric average). Source: Authors’ Processing on Istat data.
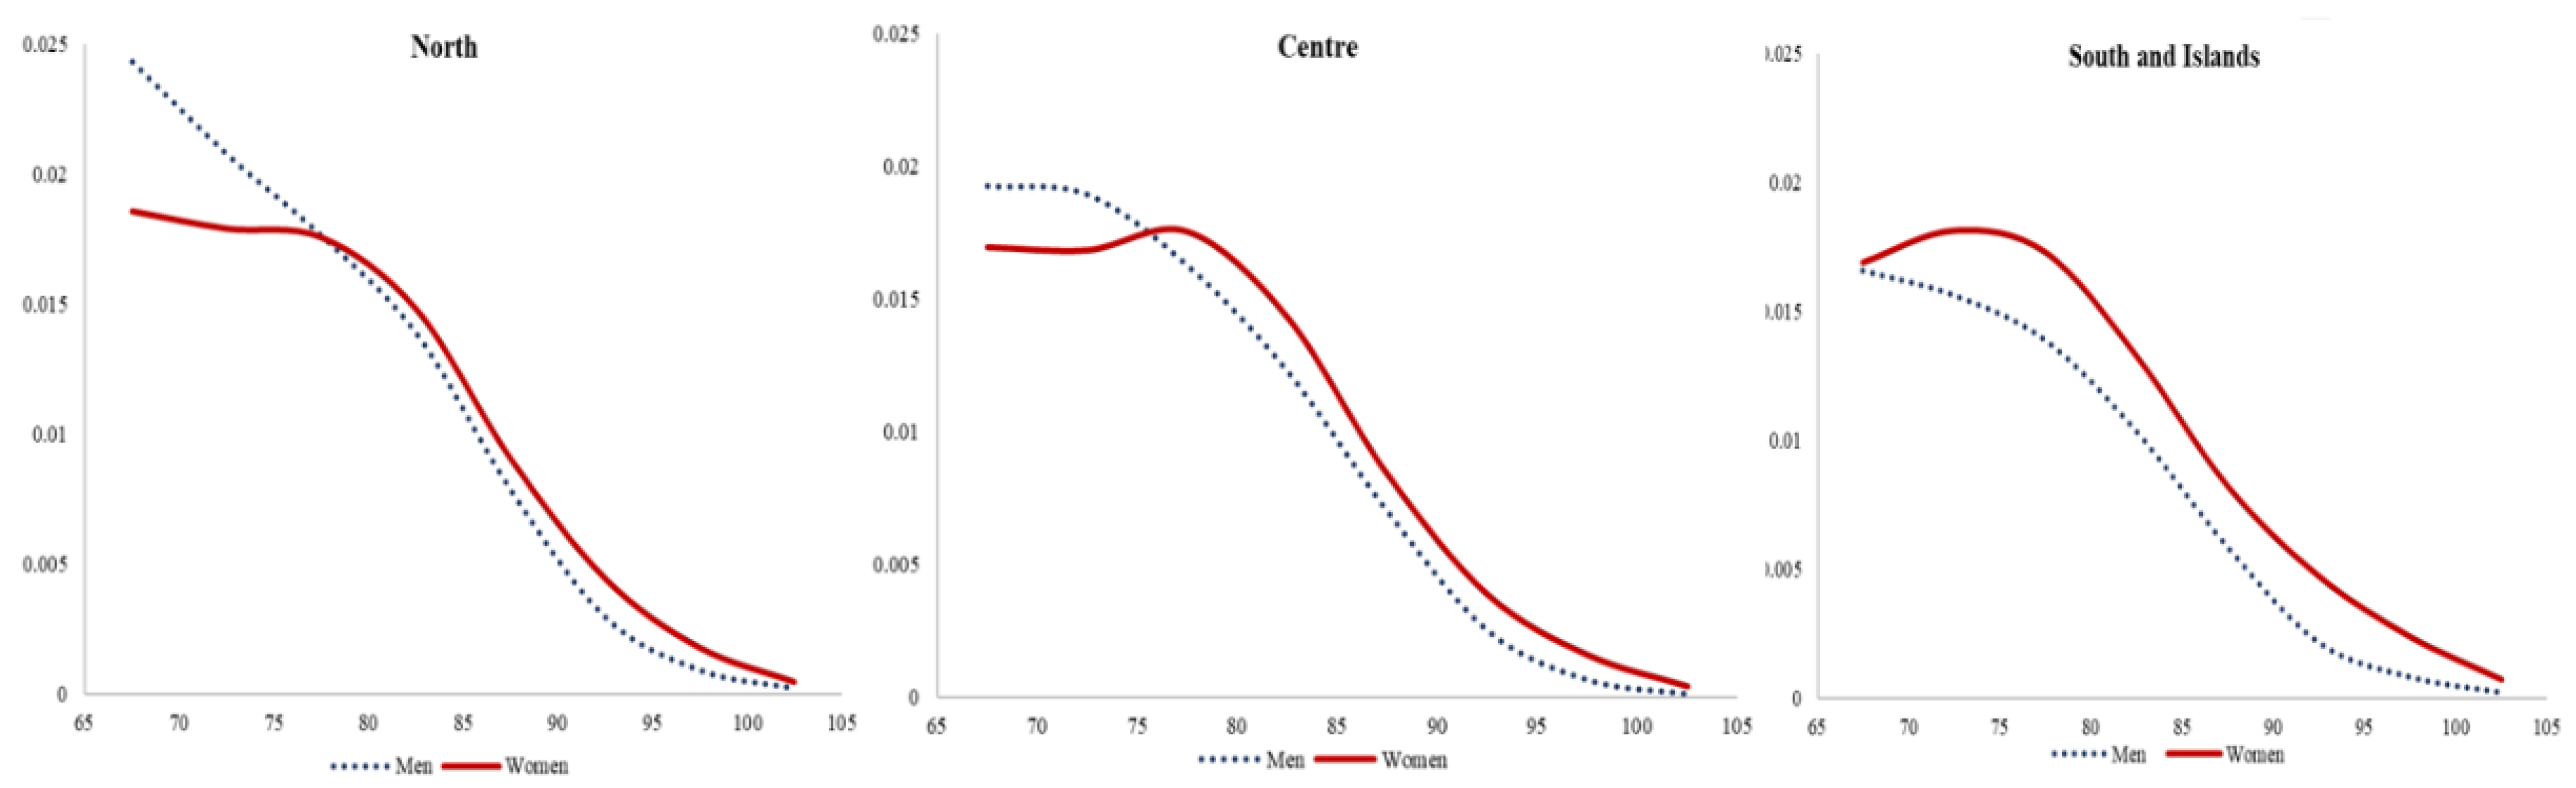
Figure 3.
Correlation Coefficient r between ex and the related Δex by Italian macro-areas, age and gender. 1982-2022. Source: Authors’ Processing on Istat data.
Figure 3.
Correlation Coefficient r between ex and the related Δex by Italian macro-areas, age and gender. 1982-2022. Source: Authors’ Processing on Istat data.
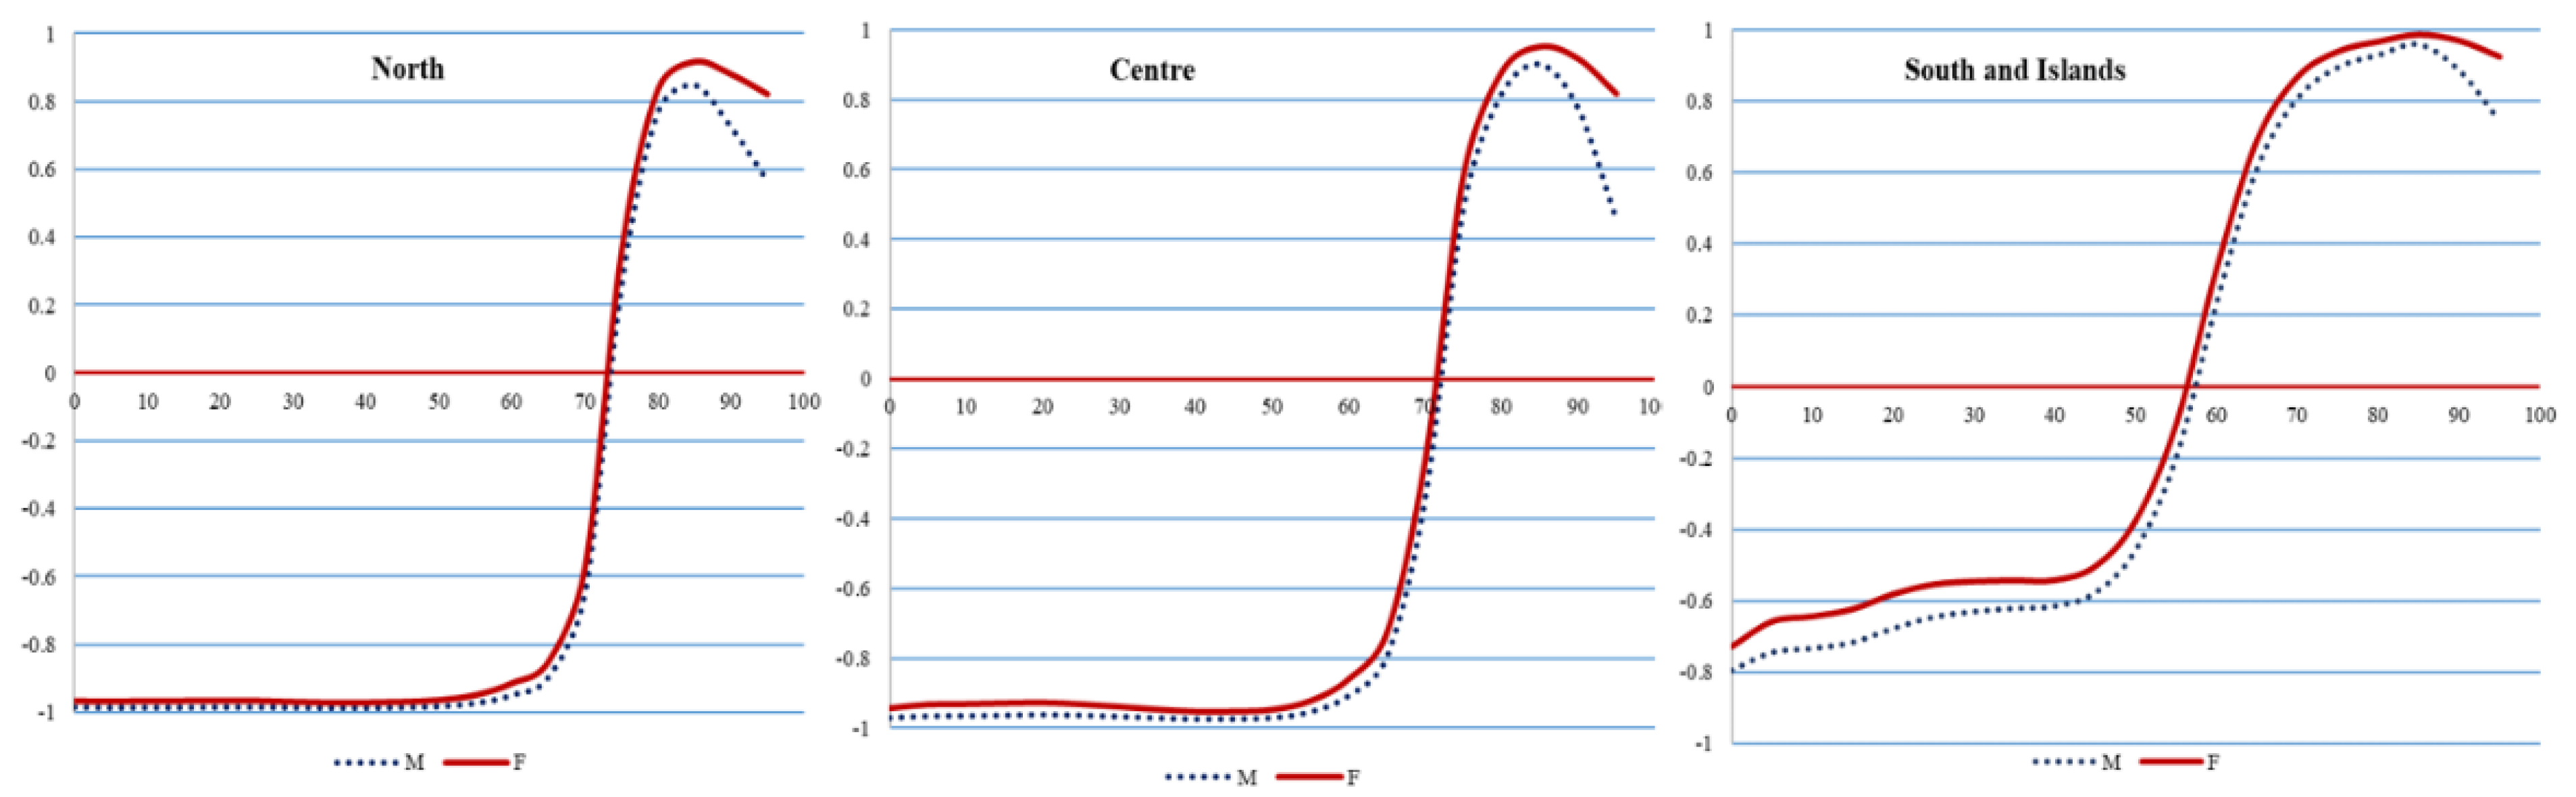
Figure 4.
Probability to live longer than the remaining life expectancy at certain ages (55, 60, 65, and 70 years) in Italy by gender. Years 1974-2022. Source: Authors’ Processing on Istat data.
Figure 4.
Probability to live longer than the remaining life expectancy at certain ages (55, 60, 65, and 70 years) in Italy by gender. Years 1974-2022. Source: Authors’ Processing on Istat data.
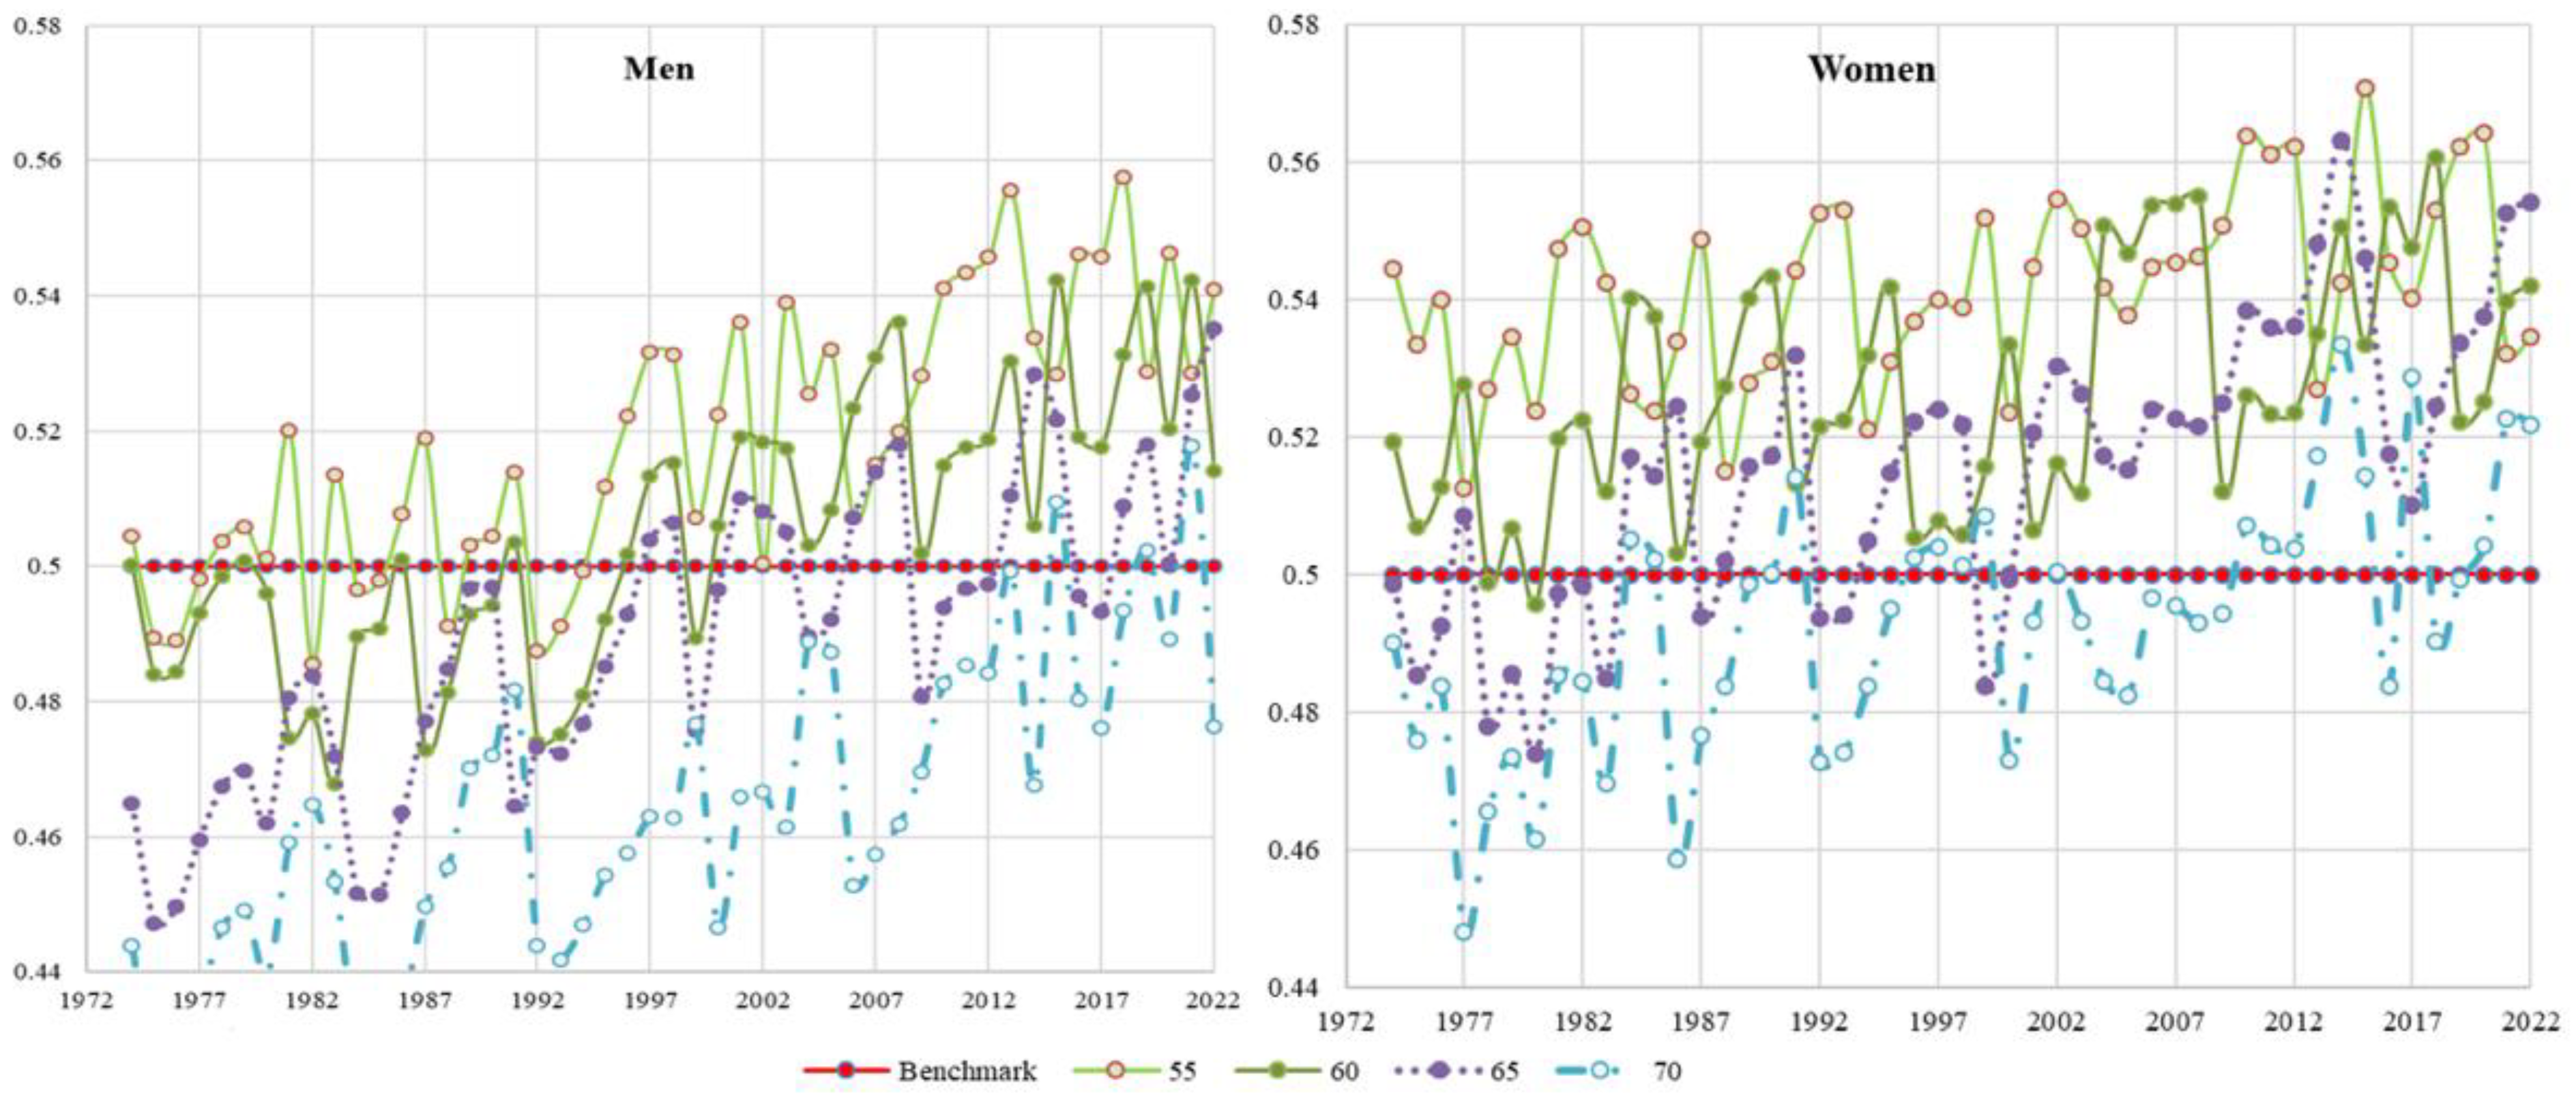
Figure 5.
Population aged 65 years and over and standardised IVS and social assistance pension rate by Italian regions. Values per 1,000 residents. Year 2022. Source: Authors’ Processing [5].
Figure 5.
Population aged 65 years and over and standardised IVS and social assistance pension rate by Italian regions. Values per 1,000 residents. Year 2022. Source: Authors’ Processing [5].
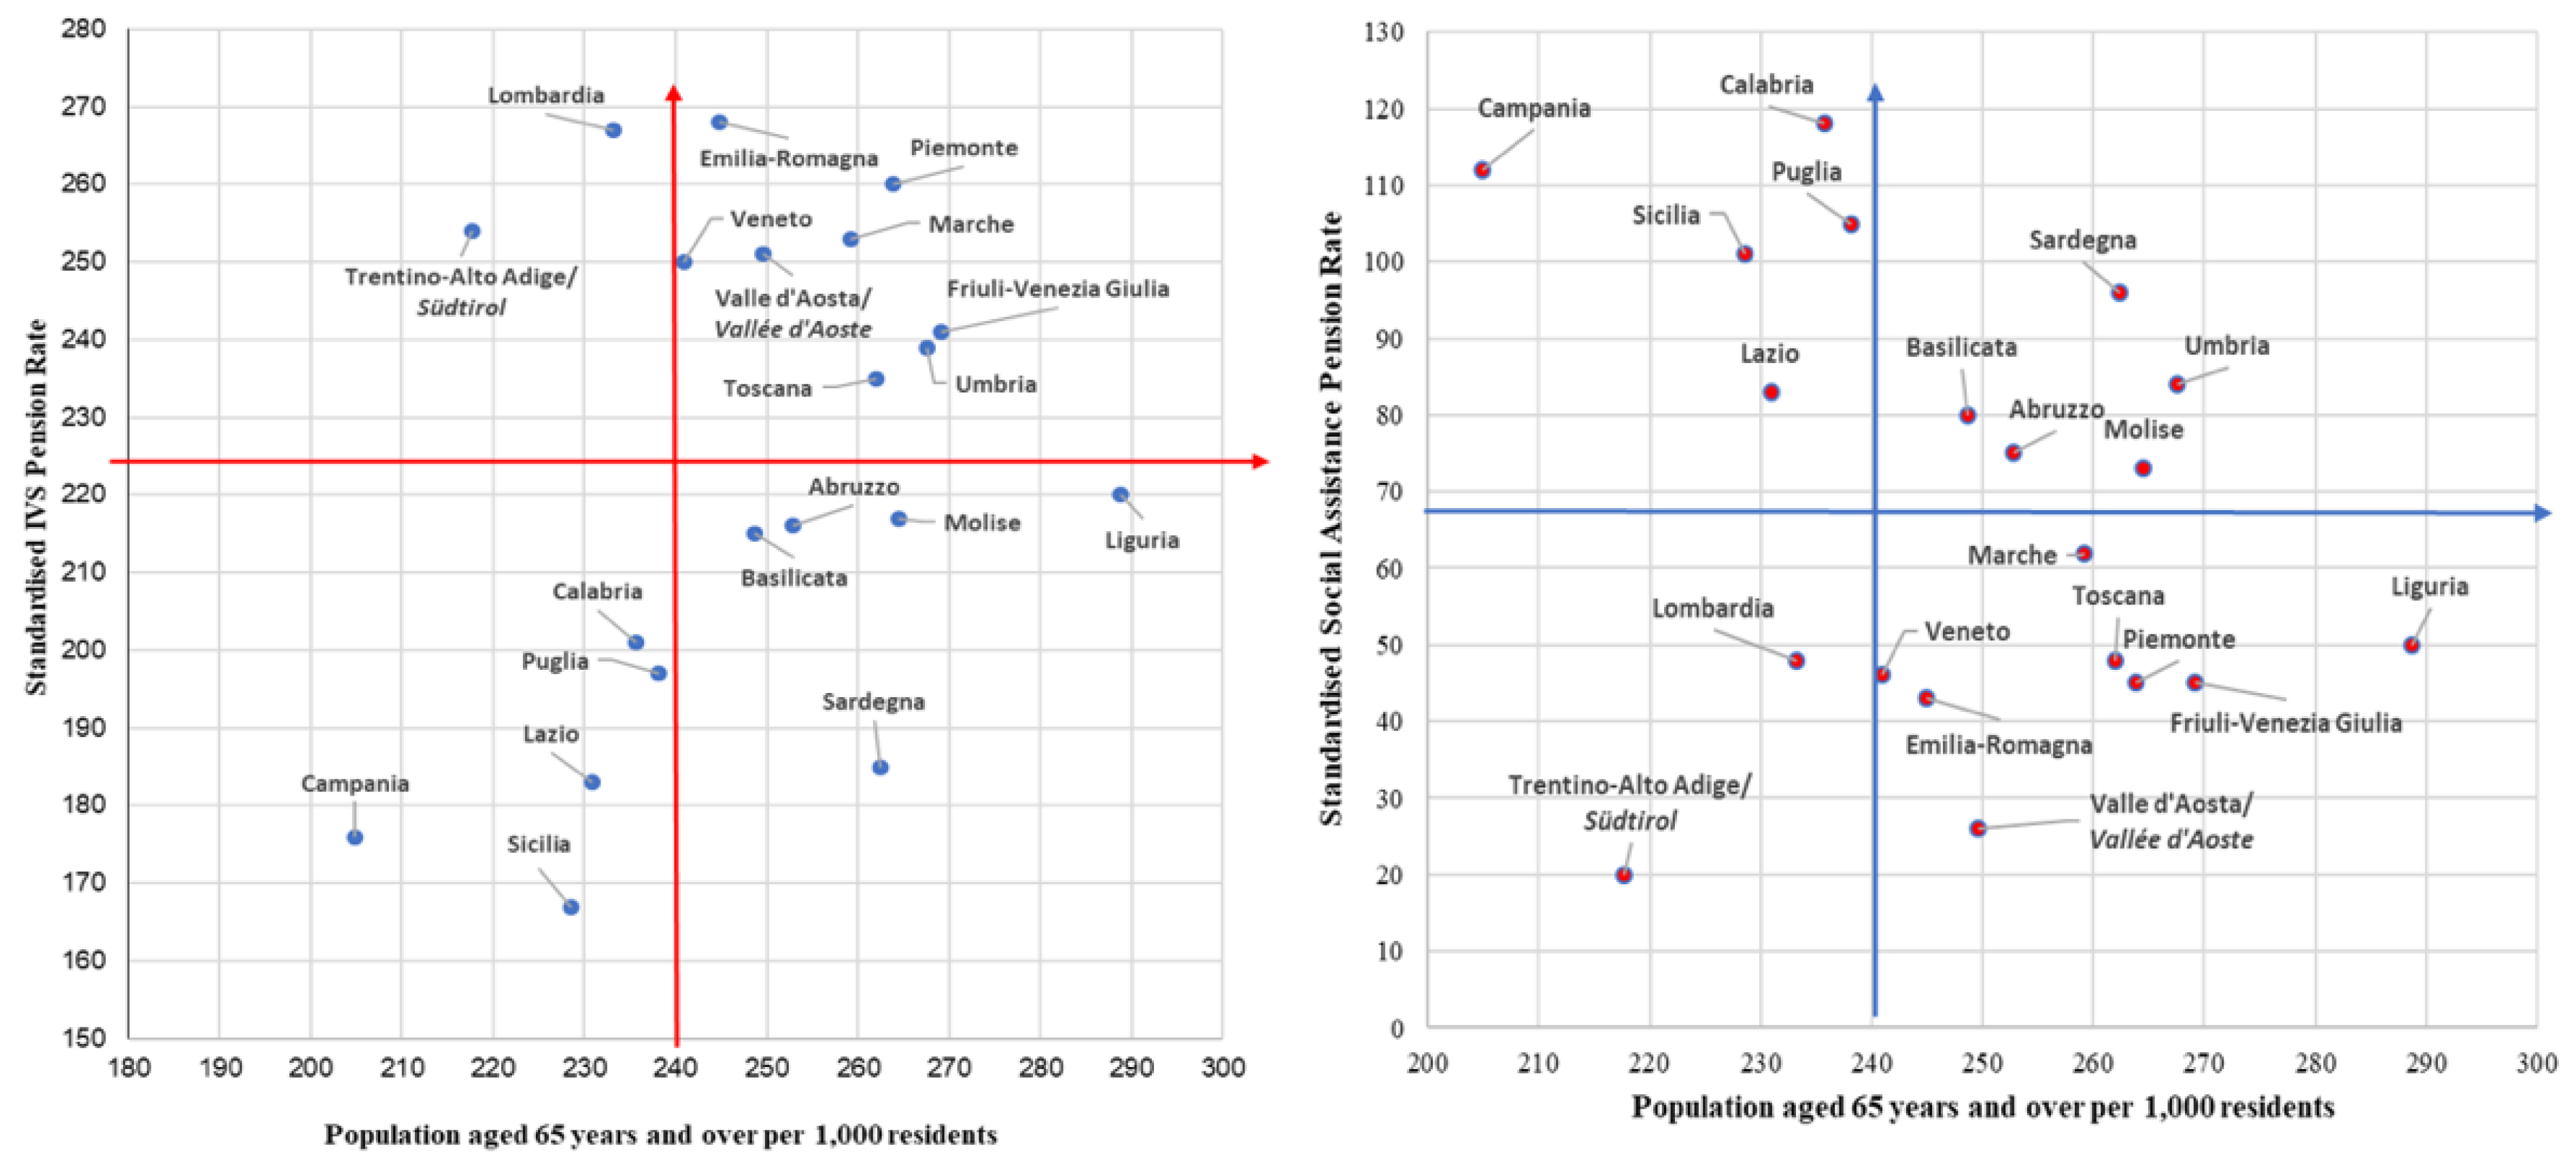

Table 1.
Older adults’ age structure by gender and Italian territorial macro-areas. Years 1982 and 2023 (1 January) (percentage compositions). Source: Authors’ Processing on Istat data.
Table 1.
Older adults’ age structure by gender and Italian territorial macro-areas. Years 1982 and 2023 (1 January) (percentage compositions). Source: Authors’ Processing on Istat data.
| Age groups (in years) |
Men | Women | ||
|---|---|---|---|---|
| 1982 | 2023 | 1982 | 2023 | |
| Italy | ||||
| 65-74 | 68.23 | 52.39 | 60.91 | 45.89 |
| 75-84 | 27.41 | 35.27 | 31.97 | 35.55 |
| 85 and over | 4.36 | 12.34 | 7.13 | 18.55 |
| Total | 100.00 | 100.00 | 100.00 | 100.00 |
| North | ||||
| 65-74 | 68.72 | 51.17 | 60.23 | 44.29 |
| 75-84 | 27.10 | 36.28 | 32.69 | 36.33 |
| 85 and over | 4.18 | 12.55 | 7.08 | 19.37 |
| Total | 100.00 | 100.00 | 100.00 | 100.00 |
| Centre | ||||
| 65-74 | 68.17 | 51.06 | 60.82 | 44.85 |
| 75-84 | 27.38 | 35.73 | 31.76 | 35.90 |
| 85 and over | 4.45 | 13.21 | 7.42 | 19.24 |
| Total | 100.00 | 100.00 | 100.00 | 100.00 |
| South and Islands | ||||
| 65-74 | 67.56 | 55.00 | 62.16 | 48.95 |
| 75-84 | 27.88 | 33.51 | 30.83 | 34.17 |
| 85 and over | 4.55 | 11.49 | 7.00 | 16.88 |
| Total | 100.00 | 100.00 | 100.00 | 100.00 |
Table 2.
Relative increase in the total Italian population and older adults, by age group, gender and territorial macro-areas. 1 January 2023 (Index Numbers 1982=100) Source: Authors’ Processing on Istat data.
Table 2.
Relative increase in the total Italian population and older adults, by age group, gender and territorial macro-areas. 1 January 2023 (Index Numbers 1982=100) Source: Authors’ Processing on Istat data.
| Territorial macro-areas | Total population | 65 and over | 65-74 | 75-84 | 85 and over | |
|---|---|---|---|---|---|---|
| Men | ||||||
| North (a) | 108.2 | 204.0 | 151.9 | 273.1 | 611.9 | |
| Centre (b) | 108.6 | 199.3 | 149.3 | 260.1 | 592.1 | |
| South and Islands (c) Is | 98.5 | 206.0 | 167.7 | 247.6 | 519.7 | |
| Italy (d) | 104.8 | 203.7 | 156.4 | 262.0 | 576.7 | |
| Women | ||||||
| North (e) | 103.9 | 180.0 | 135.6 | 200.2 | 468.6 | |
| Centre (f) | 108.6 | 183.3 | 135.2 | 207.2 | 475.3 | |
| South and Islands (g) | 99.5 | 198.1 | 156.0 | 219.5 | 477.5 | |
| Italy (h) | 103.9 | 180.0 | 135.6 | 200.2 | 468.6 | |
Notes: highest values for the total population: (a) 108.6 in 2020; (b) 109.7 in 2017; (c) 102.8 in 2012; (d) 106.4 in 2014; (e) 107.4 in 2014; (f) 111.2 in 2015; (g) 105.1 in 2012; (h) 107.1 in 2014.
Disclaimer/Publisher’s Note: The statements, opinions and data contained in all publications are solely those of the individual author(s) and contributor(s) and not of MDPI and/or the editor(s). MDPI and/or the editor(s) disclaim responsibility for any injury to people or property resulting from any ideas, methods, instructions or products referred to in the content. |
© 2025 by the authors. Licensee MDPI, Basel, Switzerland. This article is an open access article distributed under the terms and conditions of the Creative Commons Attribution (CC BY) license (https://creativecommons.org/licenses/by/4.0/).
Copyright: This open access article is published under a Creative Commons CC BY 4.0 license, which permit the free download, distribution, and reuse, provided that the author and preprint are cited in any reuse.


