
Submitted:
26 February 2025
Posted:
27 February 2025
You are already at the latest version
Abstract
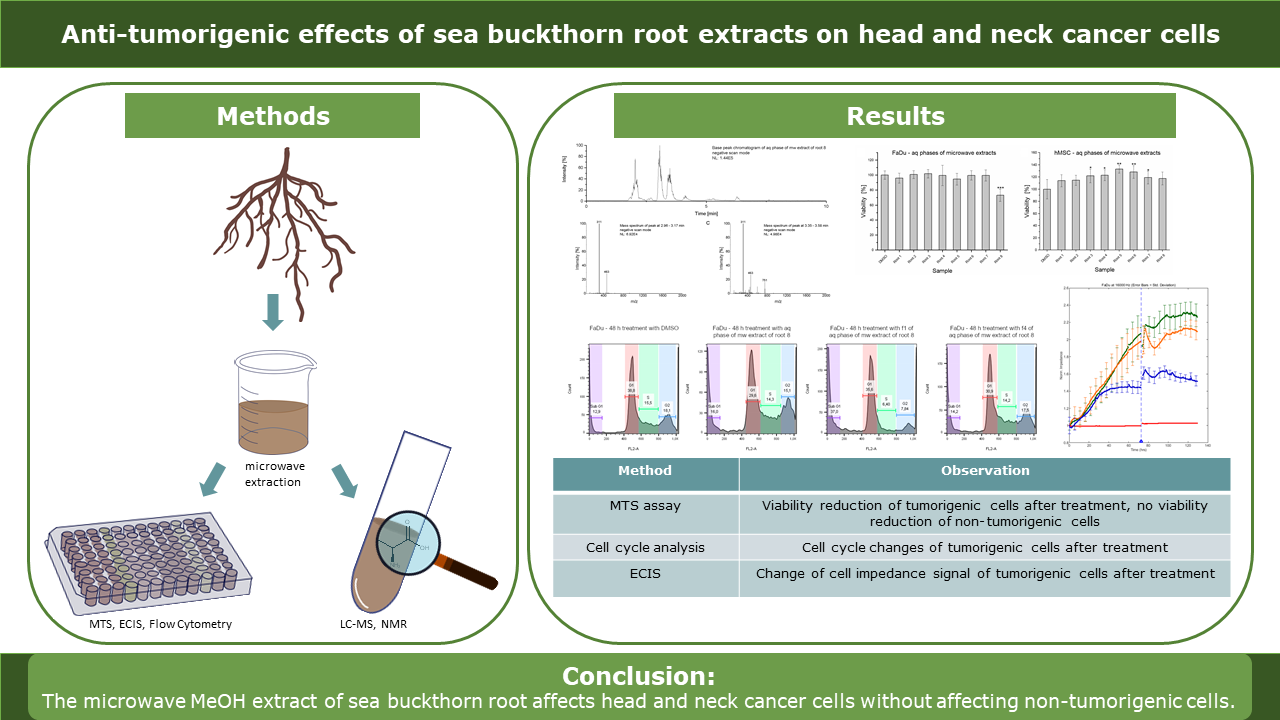
Chemotherapy is a prevalent treatment method for cancer often associated with strong side-effects. To reduce these, research on extracts of medicinal plants and their active ingredients is conducted. Although sea buckthorn (Hippophae rhamnoides) is a well-established medicinal plant, little is known about the chemical components responsible for its putative anticancer activity. This study focuses on both, the chemical and medical analyses of methanolic sea buckthorn root extracts. Cell viability measurements were performed on head and neck cancer cell lines, as well as non-tumorigenic control cells. Microwave and classical extractions under reflux were used to prepare methanolic extracts. LC/MS and NMR were used to determine structures of molecules contained within these extracts. The aqueous phase of one sea buckthorn root extract reduced the viability of cancer cells, whereas the viability of non-tumorigenic control cells remained unaltered. The cell cycle phases of cancer cells treated with the extract have shifted in comparison to control treatment. After 24 h the number of cells in the proliferative phases had increased. Two fractions of the extract that evoked alterations were identified. After 48 h treatment one of the fractions showed a higher number of apoptotic cells than the control. LC/MS and NMR analyses were conducted to attempt to identify the active compounds. We propose that the bioactivity of the extract is caused by a mixture of 2’-hydroxyflavone isomers.
Keywords:
anticancer drugs
; head neck cancer
; LC-MS
1. Introduction
Cancer is one of the leading causes of death worldwide, with nearly 10,000,000 deaths in 2020. Nearly 200,000 of those were lip cancers, 50,000 oral cavity cancers, with almost 400,000 and 100,000 new cases, respectively.[1] The usual treatment for these cancers involves radiotherapy or chemotherapy. Both have side effects, some of which might be severe, long-term or even permanent. For example, radiotherapy may permanently alter or damage mucous membranes and salivary glands, causing permanent dry mouth and difficulty in eating, swallowing and speaking. [2] Common side effects of chemotherapy are hair loss and nausea, as well as mouth and throat and sores. [3] Most are caused by the cytotoxic effects of cytostatic drugs, which affect not only tumorigenic but also non-tumorigenic cells. [4]
To develop drugs that are less toxic to non-tumorigenic cells, either by specifically targeting tumor cells or by protecting non-tumorigenic cells, investigations of plants and naturally occurring constituents are very reasonable. Since plants have been used in medicine for centuries, there is an interest in scientifically analyzing their constituents and identifying their active ingredients. The 4 types of plant-derived substance classes commonly used in chemotherapy are vinca alkaloids, epipodophyllotoxins, taxanes and camptothecin. [5] Paclitaxel, which is one of the most frequently used chemotherapeutic drugs, belonging to the taxane class, was first isolated from pacific yew in 1971. [6]
One of the recently analyzed plants is sea buckthorn (Hippophae rhamnoides). It has been described to have anti-inflammatory [7,8,9], antioxidative [10], anti-stress [9], hepatoprotective [11], cardioprotective [12] properties. Recently, its influence on cancer cells has been investigated. A study showed that isorhamnetin, which was isolated from Hippophae rhamnoides L. displayed an anti-cancer activity on the cell line BEL-7402. [13] Another study described the inhibition of colon cancer cell line HT-29 and breast cancer cell line MCF-7 by sea buckthorn extracts. [14] The berry extracts were found to inhibit the proliferation of Caco-2 cells and cause apoptosis in Caco-2 and Hep-G2 cells. [15] It was further shown that treatment with ethanolic berry extracts caused alterations in MCF-7 metabolism; changes in acidification and respiration were observed. [16]
Despite investigations into the chemical composition and biological activity of sea buckhorn fruit, seeds and leaves, little is known about substances contained within sea buckthorn root (SBR). In a study of Korean sea buckthorn, it was found that the root contained catechin, isorhamnetin and rutin [17], and according to another study, compounds found in SBR such as syringetin, isorhamnetin and pentamethylquercetin are able to inhibit tumor cell proliferation. More importantly, quercetin and myricetin even have an apoptotic effect on cancer cells, while at the same time not affecting non-tumorigenic cells [18]. However, it is noteworthy that no publication in which the effects of SBR extracts were directly tested on cells could be found.
Therefore, the aim of this study was to further analyze the composition of SBR extracts and conduct in vitro experiments on head and neck cancer cells. To achieve these aims we used column chromatography, liquid chromatography/mass spectrometry (LC/MS) and nuclear magnetic resonance spectrometry (NMR) for separation and chemical analysis, as well as metabolic activity assay, flow cytometry and ECIS for in vitro testing.
2. Results
2.1. Metabolic Activity Assay
MTS assays were performed with aqueous phases of SBR extracts on two cancer cell lines (FaDu and Cal-33) and hMSC as a non-tumorigenic control cell line. The results are displayed in Error! Reference source not found. A. Viability of FaDu and Cal-33 decreased by approximately 20% after treatment with SBR 8. Interestingly, hMSC control cells were not affected by the treatment. In addition, viability of Cal-33 treated with SBR 2 also decreased by 20%. However, since this extract did not seem to affect FaDu in the same way, it was not further investigated.
SBR 8 was separated into 7 fractions using column chromatography, which were tested on Cal-33. A moderate viability reduction was observed with fractions 1 and 4. A comparison of the chromatograms of SBR 8 (aqueous phase) and its fractions 1 and 4 is displayed in Error! Reference source not found..
Figure 1.
(A) Viability of FaDu (violet), Cal-33 (blue) and hMSC (green) after 24 h treatment with SBR extracts. (B) Viability of Cal-33 after treatment with SBR 8 and its fractions, obtained through column chromatography. Mean ± SD with n = 6, *p < 0.05, **p < 0.
Figure 1.
(A) Viability of FaDu (violet), Cal-33 (blue) and hMSC (green) after 24 h treatment with SBR extracts. (B) Viability of Cal-33 after treatment with SBR 8 and its fractions, obtained through column chromatography. Mean ± SD with n = 6, *p < 0.05, **p < 0.
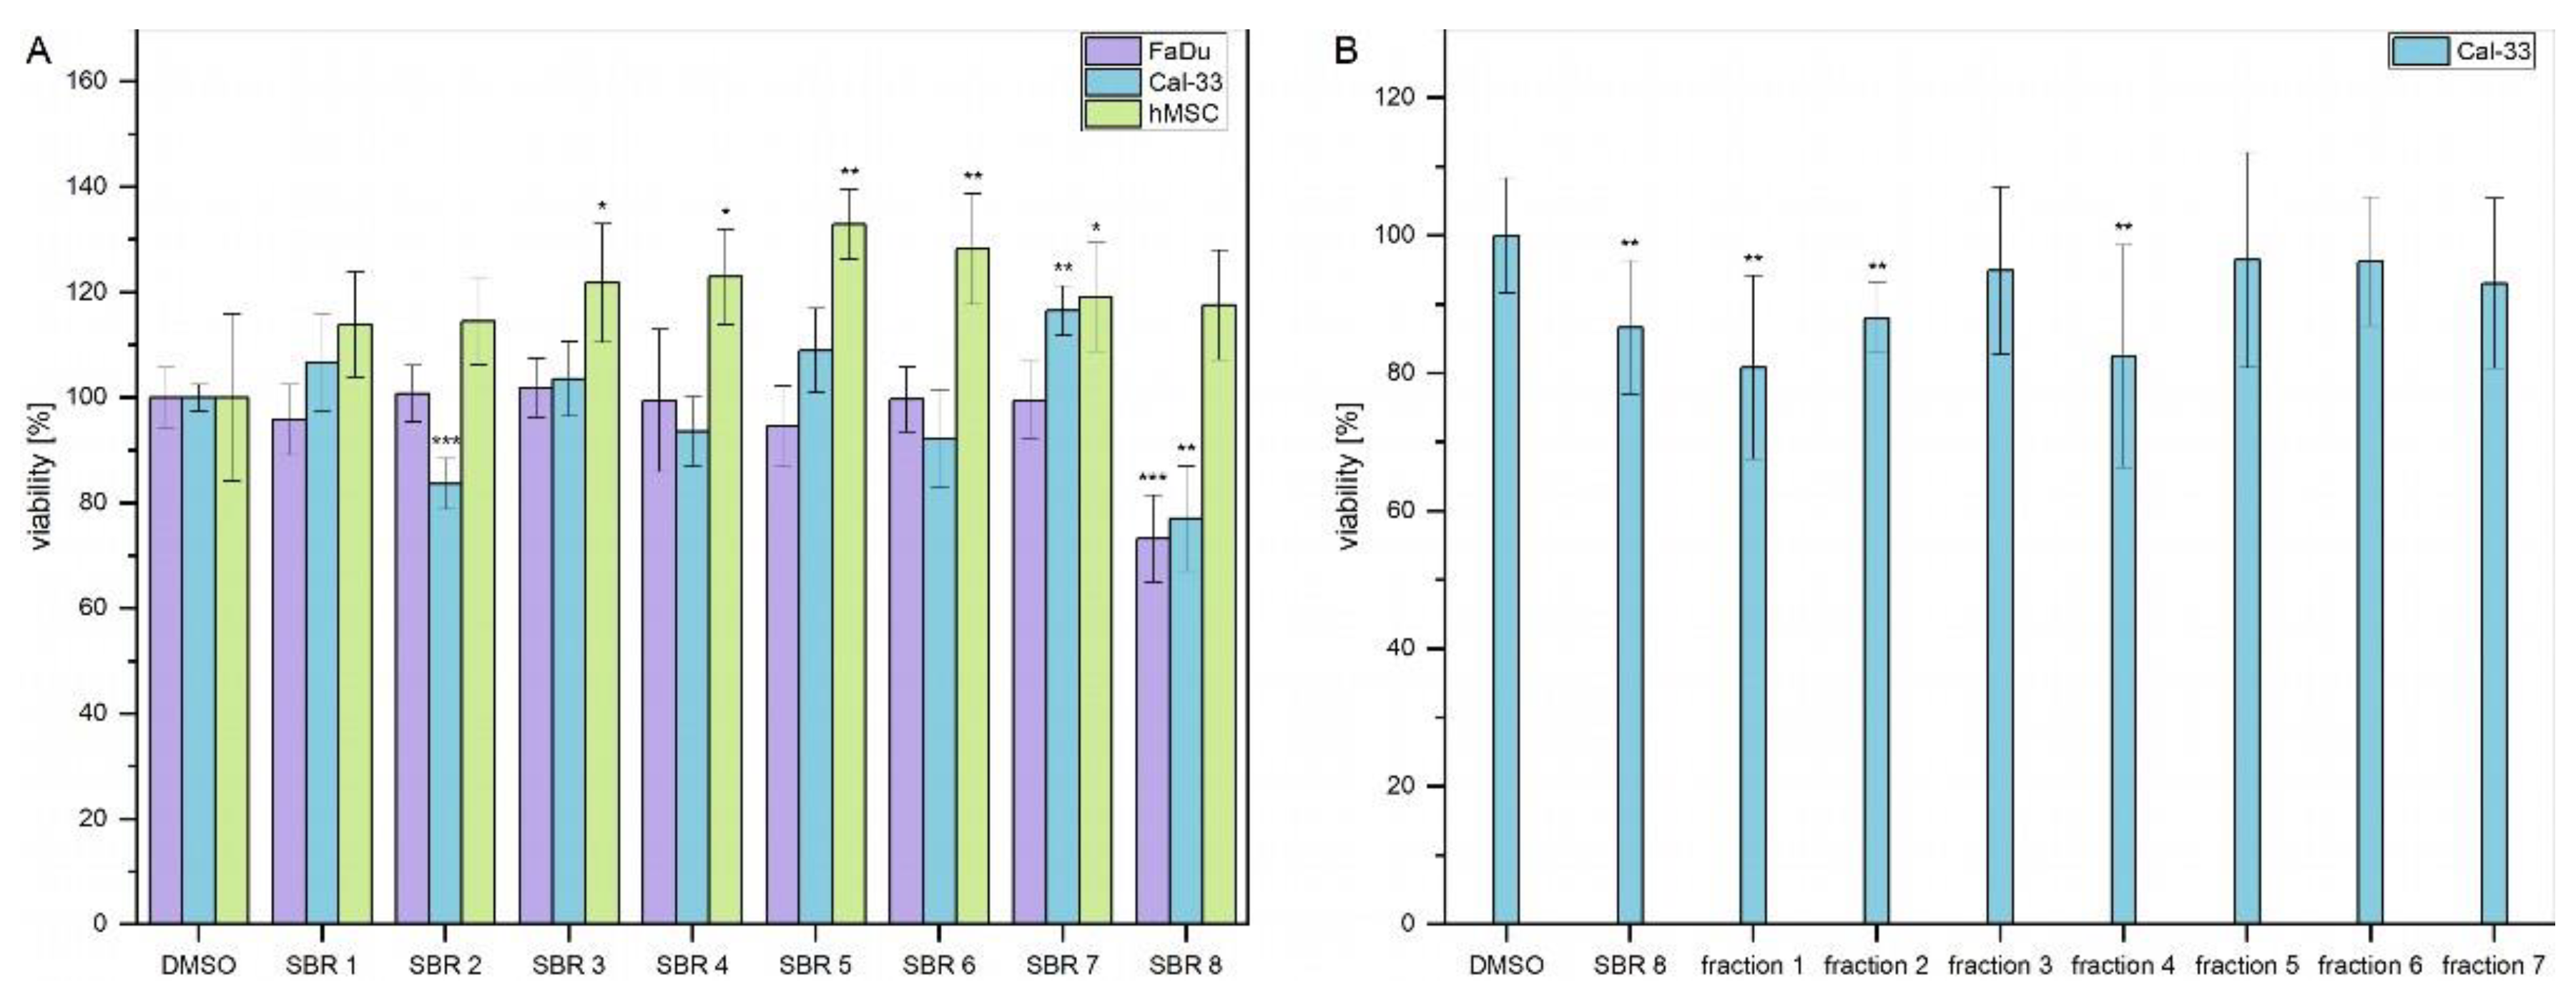
Figure 2.
Negative and positive scan mode chromatograms of the aqueous phase of SBR 8 (A, B) and its fractions 1 (C, D) and 4 (E, F).
Figure 2.
Negative and positive scan mode chromatograms of the aqueous phase of SBR 8 (A, B) and its fractions 1 (C, D) and 4 (E, F).

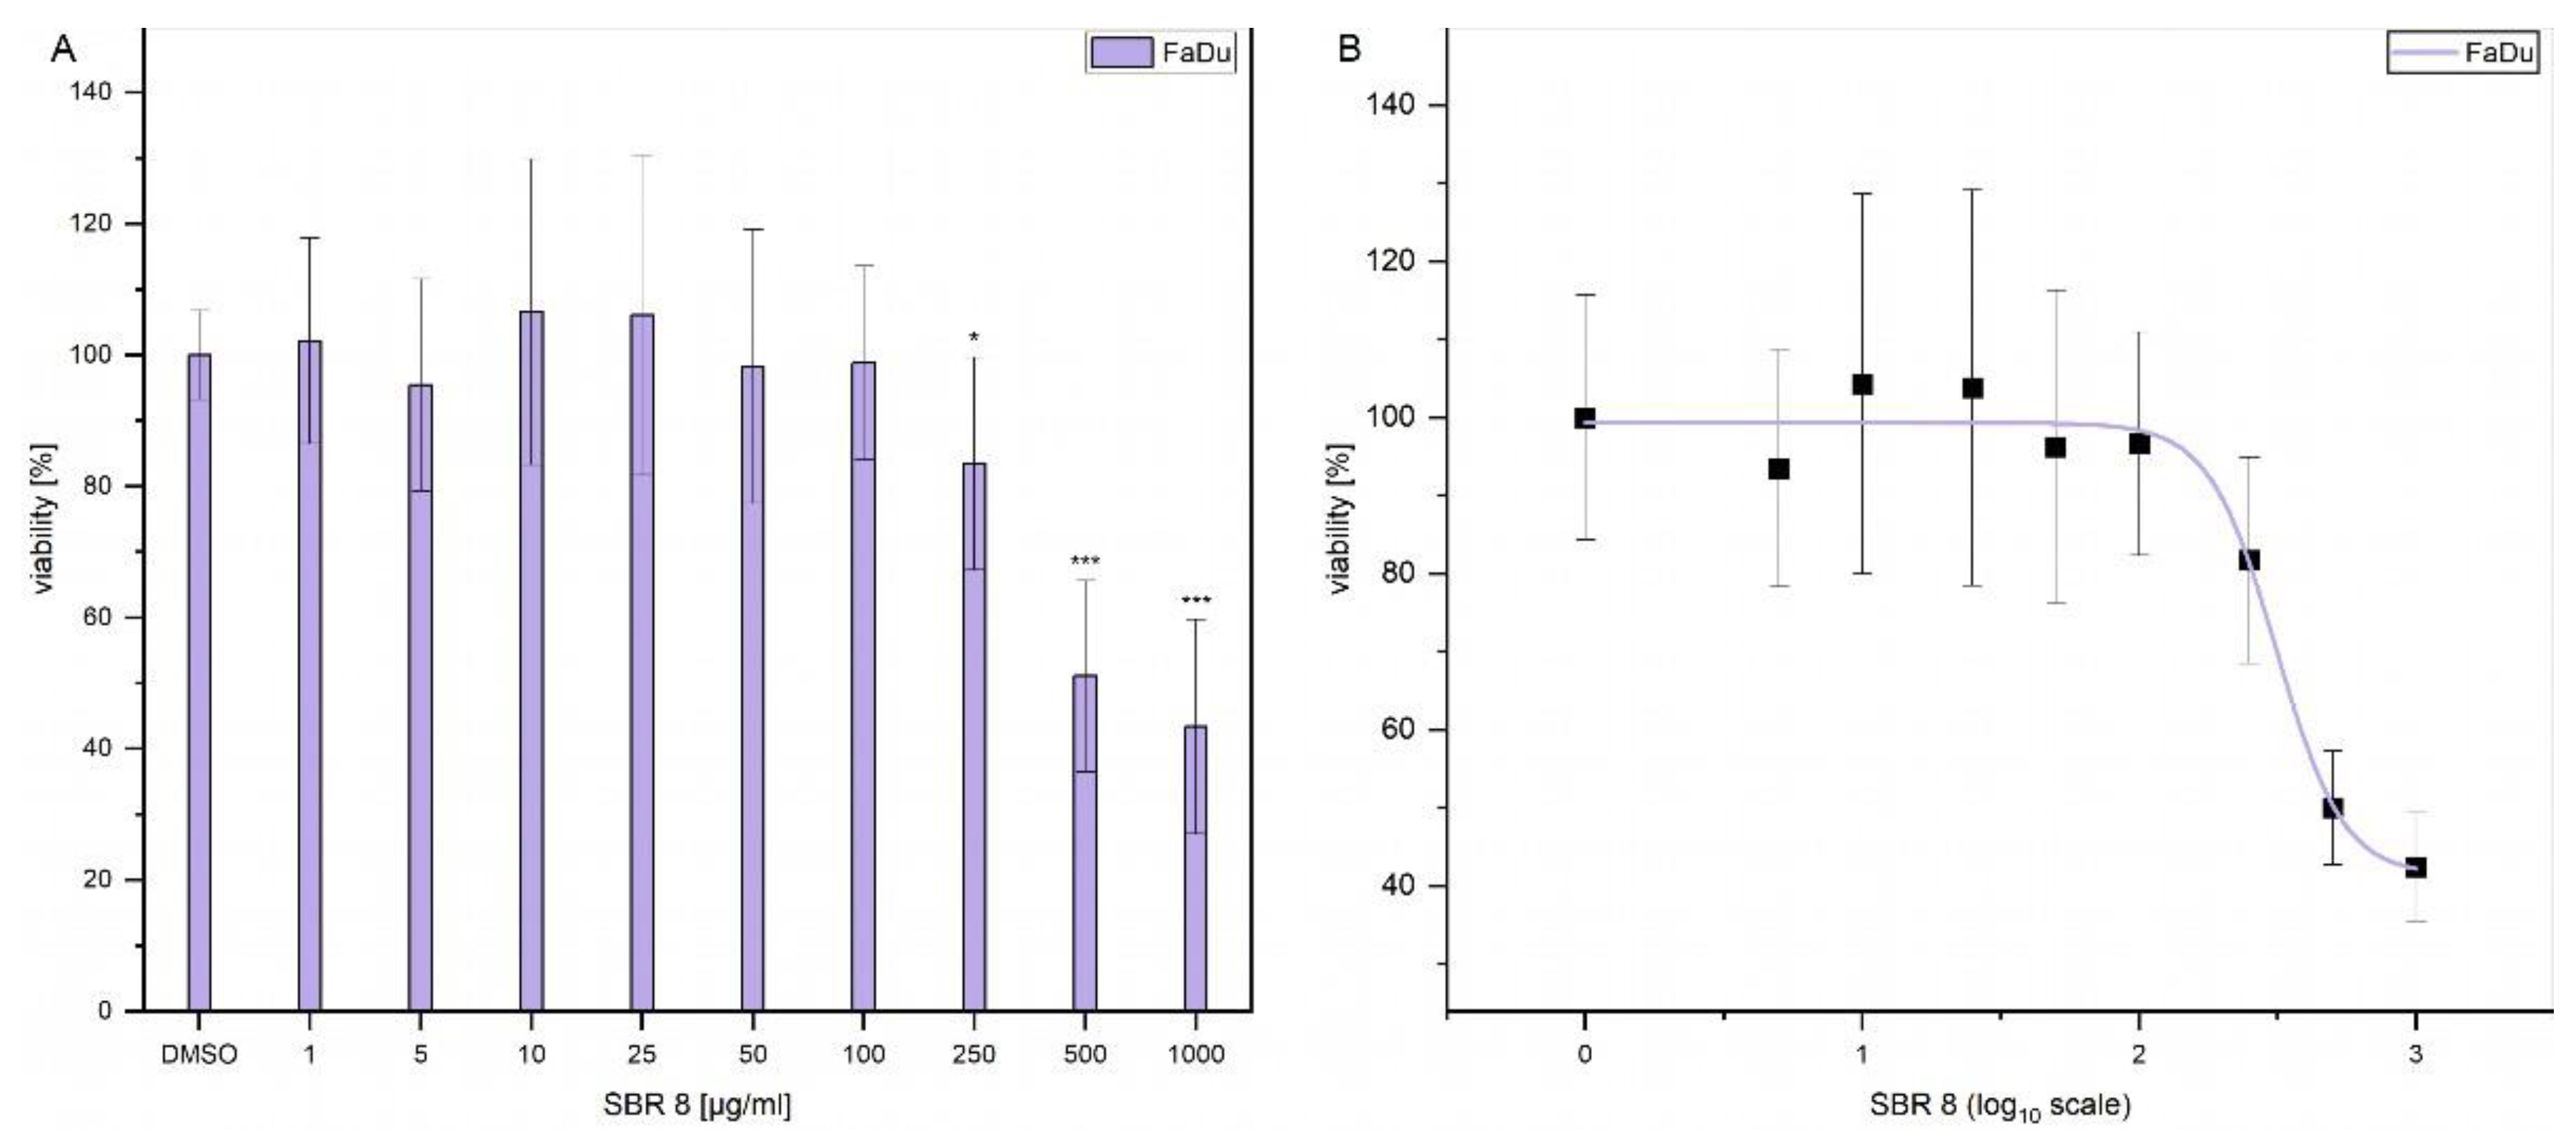
Additionally, LD50 was established by performing dose response experiments on FaDu (Error! Reference source not found. A). The results indicate that a significant reduction of FaDu viability could only be achieved at higher extract concentrations. Error! Reference source not found. B displays the logarithmic plot used to determine LD50. The calculated LD50 value is 299.74 µg/ml. Since the extract that reduced the viability only moderately and contains multiple compounds (Error! Reference source not found. A and B) and not all of them have a reducing effect on cell viability (Error! Reference source not found. B), it is logical that a higher concentration of the extract is needed to reduce the viability by 50 %.
Figure 3.
(A) MTS assay results after 24 h treatment of FaDu with different concentrations of SBR 8. (B) MTS assay results after 24 h treatment of FaDu with different concentrations of SBR 8 plotted on a logarithmic scale for LD50 determination. Mean ± SD with n= 6, *p < 0.05, **p < 0.01, ***p < 0.001.
As displayed in Error! Reference source not found., some of the peaks are much more intensive in the fractions compared to the chromatogram of the whole aqueous phase, especially fraction 1 (Error! Reference source not found. C, D). This fraction had an overall small yield, but the measurements were conducted with a concentration of 1 mg/ml, allowing for a much clearer analysis. It is also visible that the fraction still represents a mixture of compounds which would have to be further separated for proper isolation. This, however, also suggests that low concentrations of an active compound can still show effects on cancer cells. Fraction 4, which appears to consist of only one substance, upon closer inspection still shows more peaks, some of which are consistent with those from fraction 1 (Error! Reference source not found. E, F).
2.2. Cell Cycle Analysis
Cell cycle analyses were performed to validate MTS assay results. Error! Reference source not found. A-D show histogram examples of Cal-33 (A) and FaDu (B, C, D for 24, 48 and 72 h, respectively) treated with DMSO, SBR 8 fraction 1 and fraction 4. Error! Reference source not found. E represents the cell cycle distribution. Cells treated with SBR 8 and its fractions were compared to cells treated with DMSO.
Figure 4.
Example histograms of flow cytometry measurements on (A) Cal-33, 24 h treatment, (B, C, D) FaDu, 24, 48, 72 h treatment, respectively. (E) Statistical analysis of flow cytometry measurement results. Mean ± SD with n = 3, *p < 0.05, **p < 0.01, ***p < 0.
Figure 4.
Example histograms of flow cytometry measurements on (A) Cal-33, 24 h treatment, (B, C, D) FaDu, 24, 48, 72 h treatment, respectively. (E) Statistical analysis of flow cytometry measurement results. Mean ± SD with n = 3, *p < 0.05, **p < 0.01, ***p < 0.
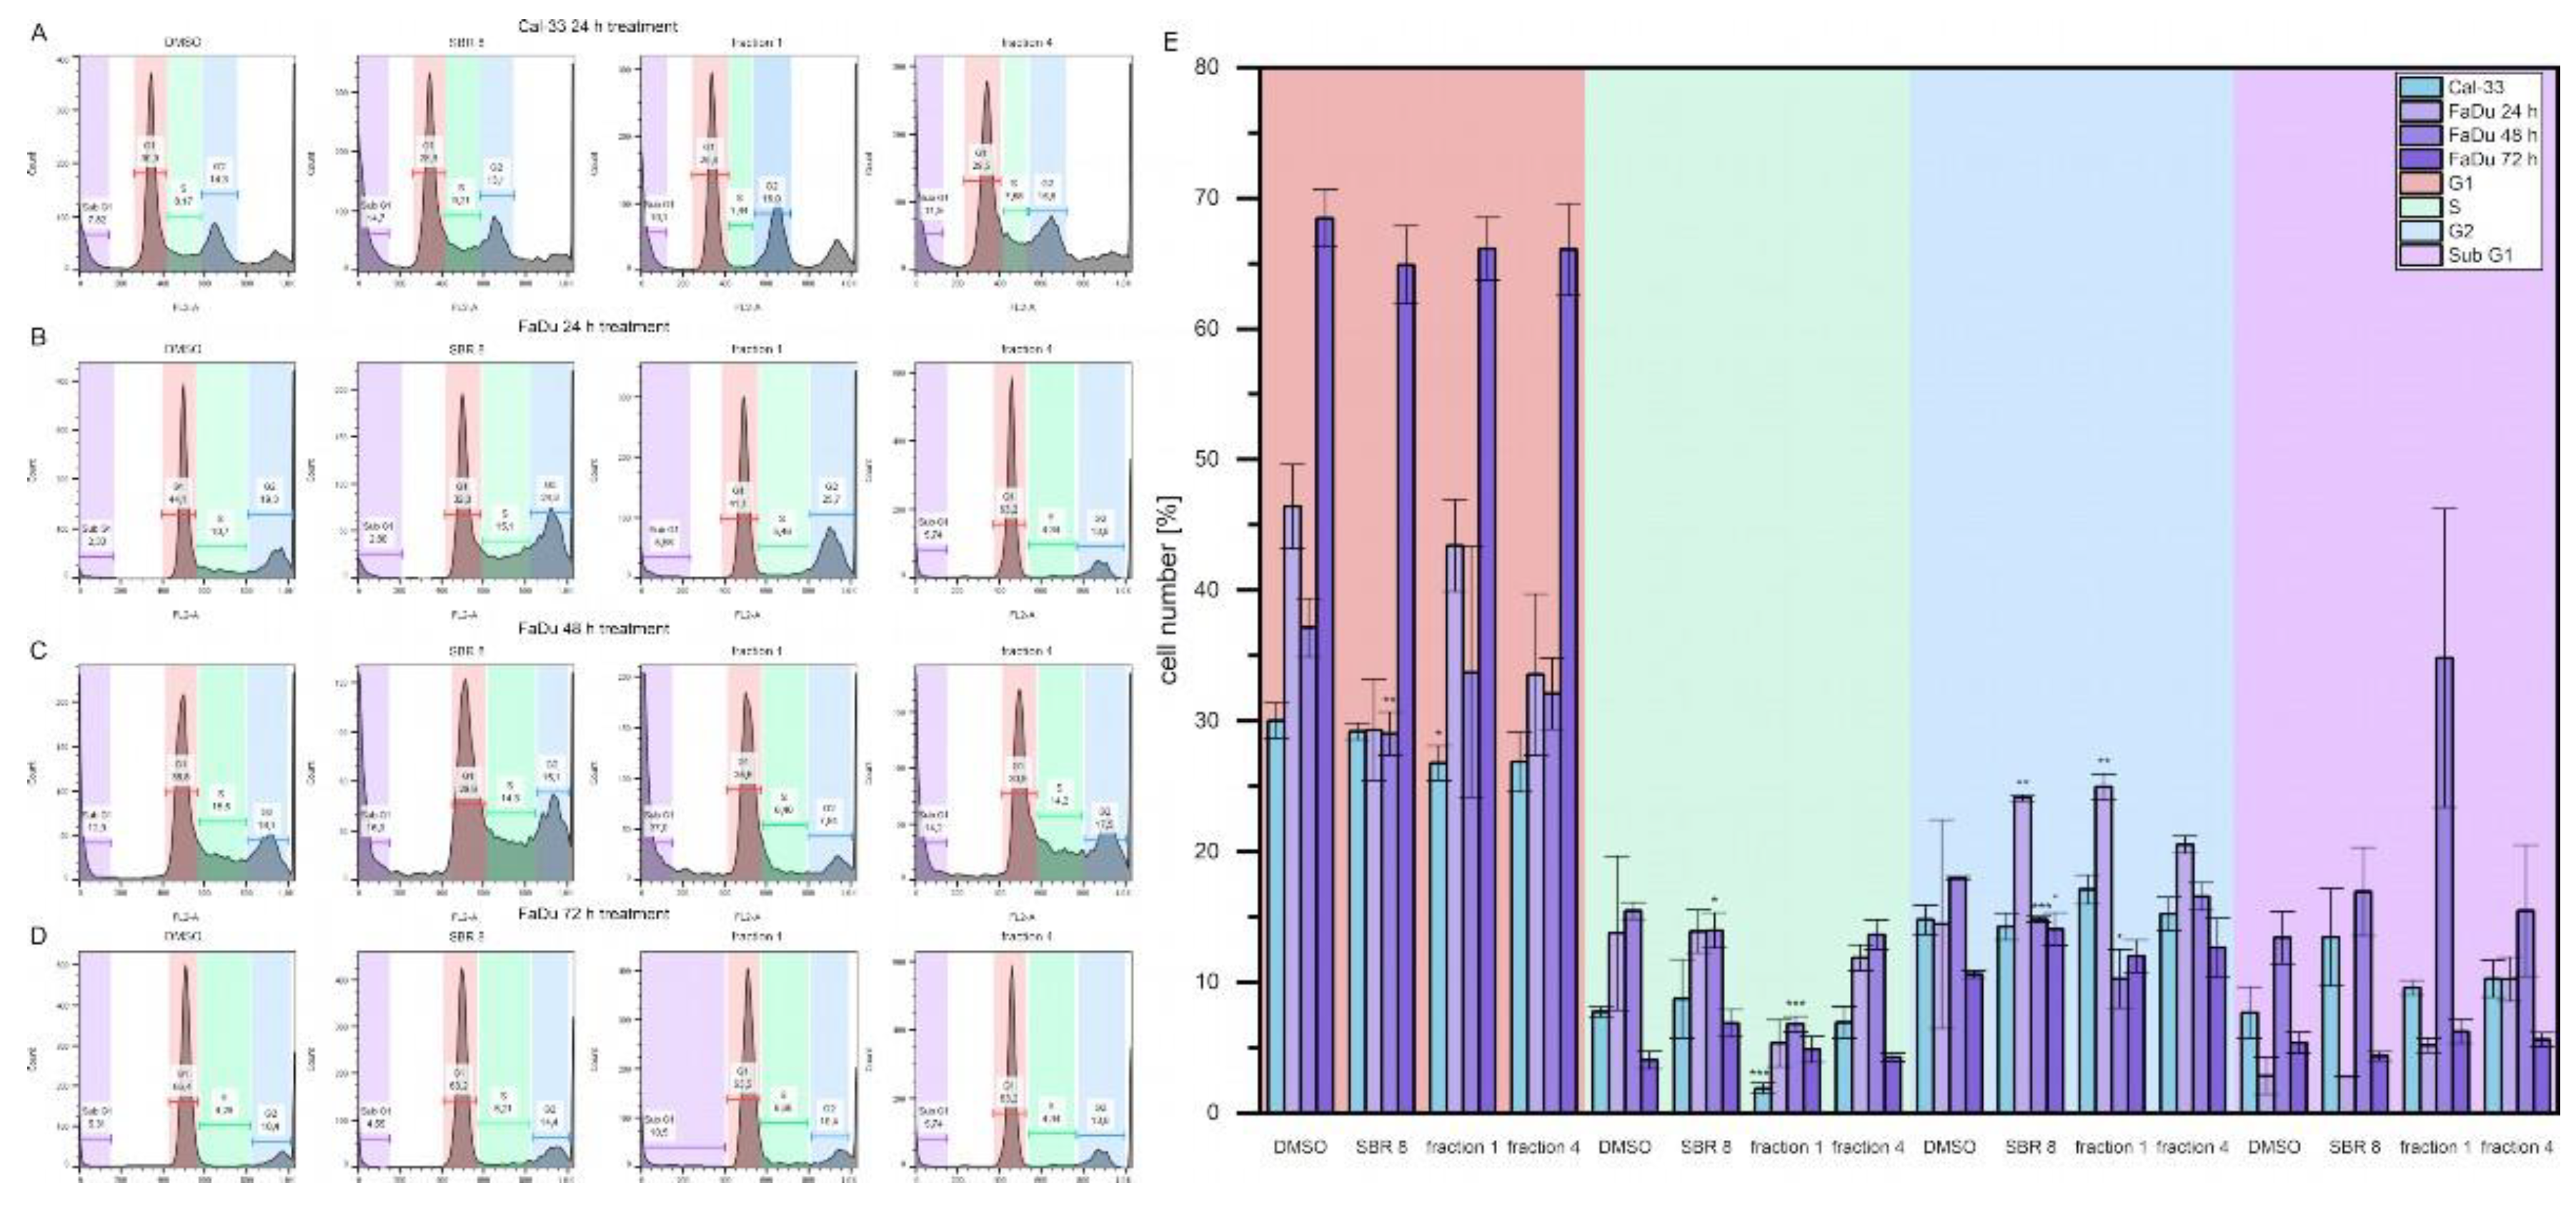
Cal-33 treated with SBR 8 for 24 h display a slightly higher number of cells in the Sub G1 phase (13.5 %) compared to cells treated with DMSO (7.7 %). Treatment with fraction 1 revealed a lower number of cells in G1 and S phases (26.8 % and 1.9 %, respectively) in comparison to DMSO (30.0% and 7.8 %, respectively), whereas G1 and Sub G1 phases remained comparable to DMSO. Fraction 4 did not seem to affect Cal-33 after 24 h treatment.
FaDu treated with SBR 8 for 24 h had a slightly lower number of cells in the G1 phase (29.3 %) in comparison to DMSO (46.4 %) and a significantly higher number of cells in the G2 phase (24.1 %, DMSO: 14.5 %). A similar result is also observed after treatment with fraction 1, where the number of cells in the G2 phase is also significantly higher (25.0 %). Fraction 1 did not seem to affect the G1 phase, however did affect the cell number in the S phase, which was lowered from 13.8% (DMSO) to 5.3 %. A lower number of cells in G1 (33.5 %) and higher number of cells in Sub G1 (10.3%, DMSO: 2.9 %) phases was observed after 24 h treatment with fraction 4.
After 48 h treatment, cell cycle changes of FaDu became more evident. Cell numbers of G1, S and G2 phases dropped significantly after treatment with SBR 8 (29.0, 14.0, 14.8 %, respectively) in comparison to DMSO (37.1, 15.5, 18.0 %, respectively) and the cell number of the Sub G1 phase significantly increased from 13.4 % (DMSO) to 16.9 %. Treatment with fraction 1 showed the same changes to all cell cycle phases (33.7% G1, 6.8 % S, 10.3 % G2, 34.8 % Sub G1). Fraction 4 also slightly lowered the number of cells in the G1 phase (32.0 %). However, 72 h treatment of FaDu did not reveal any significant changes of the cell cycle.
It is evident, that SBR 8 alters the cell cycle of Cal-33 and FaDu. The Sub G1 phase is a strong indicator of apoptosis, while G1, S and G2 phases represent proliferative phases. After 24 h treatment with SBR 8, the cell number in the Sub G1 phase increased for Cal-33, indicating apoptotic cells, while in FaDu the cell number in the G2 phase significantly increased in correspondence with a lowered number of cells in the G1 phase. The number of cells in the S phase was also higher in FaDu. After 48 h treatment of FaDu with SBR 8, cell numbers in all three proliferative phases were significantly lower than in the DMSO control and the number of cells in the Sub G1 phase was higher. This indicates a cell cycle arrest in the G2 phase (24 h treatment) and subsequent apoptosis (48 h). Similarly, in a study of Rheum turkestanicum, it was found that the viability of HeLa and MCF-7 decreased noticeably after 48 and 72 h treatment with the root extract as opposed to treatment for only 24 h. [19] During 72 h treatment, SBR 8 did not appear to alter the cell cycle of FaDu significantly. This could be due to the low extract concentration since the applied concentration was lower than the calculated LD50. Cells not impacted by the extract could still proliferate, leading to the seemingly normal cell cycle. Even though no significant changes were observed, the trends observed after 24 h treatment were also visible after 72 h treatment (Error! Reference source not found. D). Fraction 1 seemed to slightly raise the number of cells in the G2 phase, while Fraction 4 seemed to raise the number of cells in the S phase. SBR 8 seemed to slightly raise both phases. It is also noteworthy, that Paclitaxel, a drug commonly applied in chemotherapeutic cancer treatment, shows similar results, inducing cell cycle arrest in either the G1 or G2/M phase without leading to apoptosis, when applied at low concentrations. [20]
2.3. ECIS
The effects of SBR 8 on FaDu were additionally observed via ECIS (Error! Reference source not found.). The normalized impedance represents electrode coverage by adhered cells. It rises with the attached cell number.
Figure 5.
Results of ECIS measurements; normalized impedance (Ẑ) as a function of time (t). Mean ± SD with n = 3.
Figure 5.
Results of ECIS measurements; normalized impedance (Ẑ) as a function of time (t). Mean ± SD with n = 3.
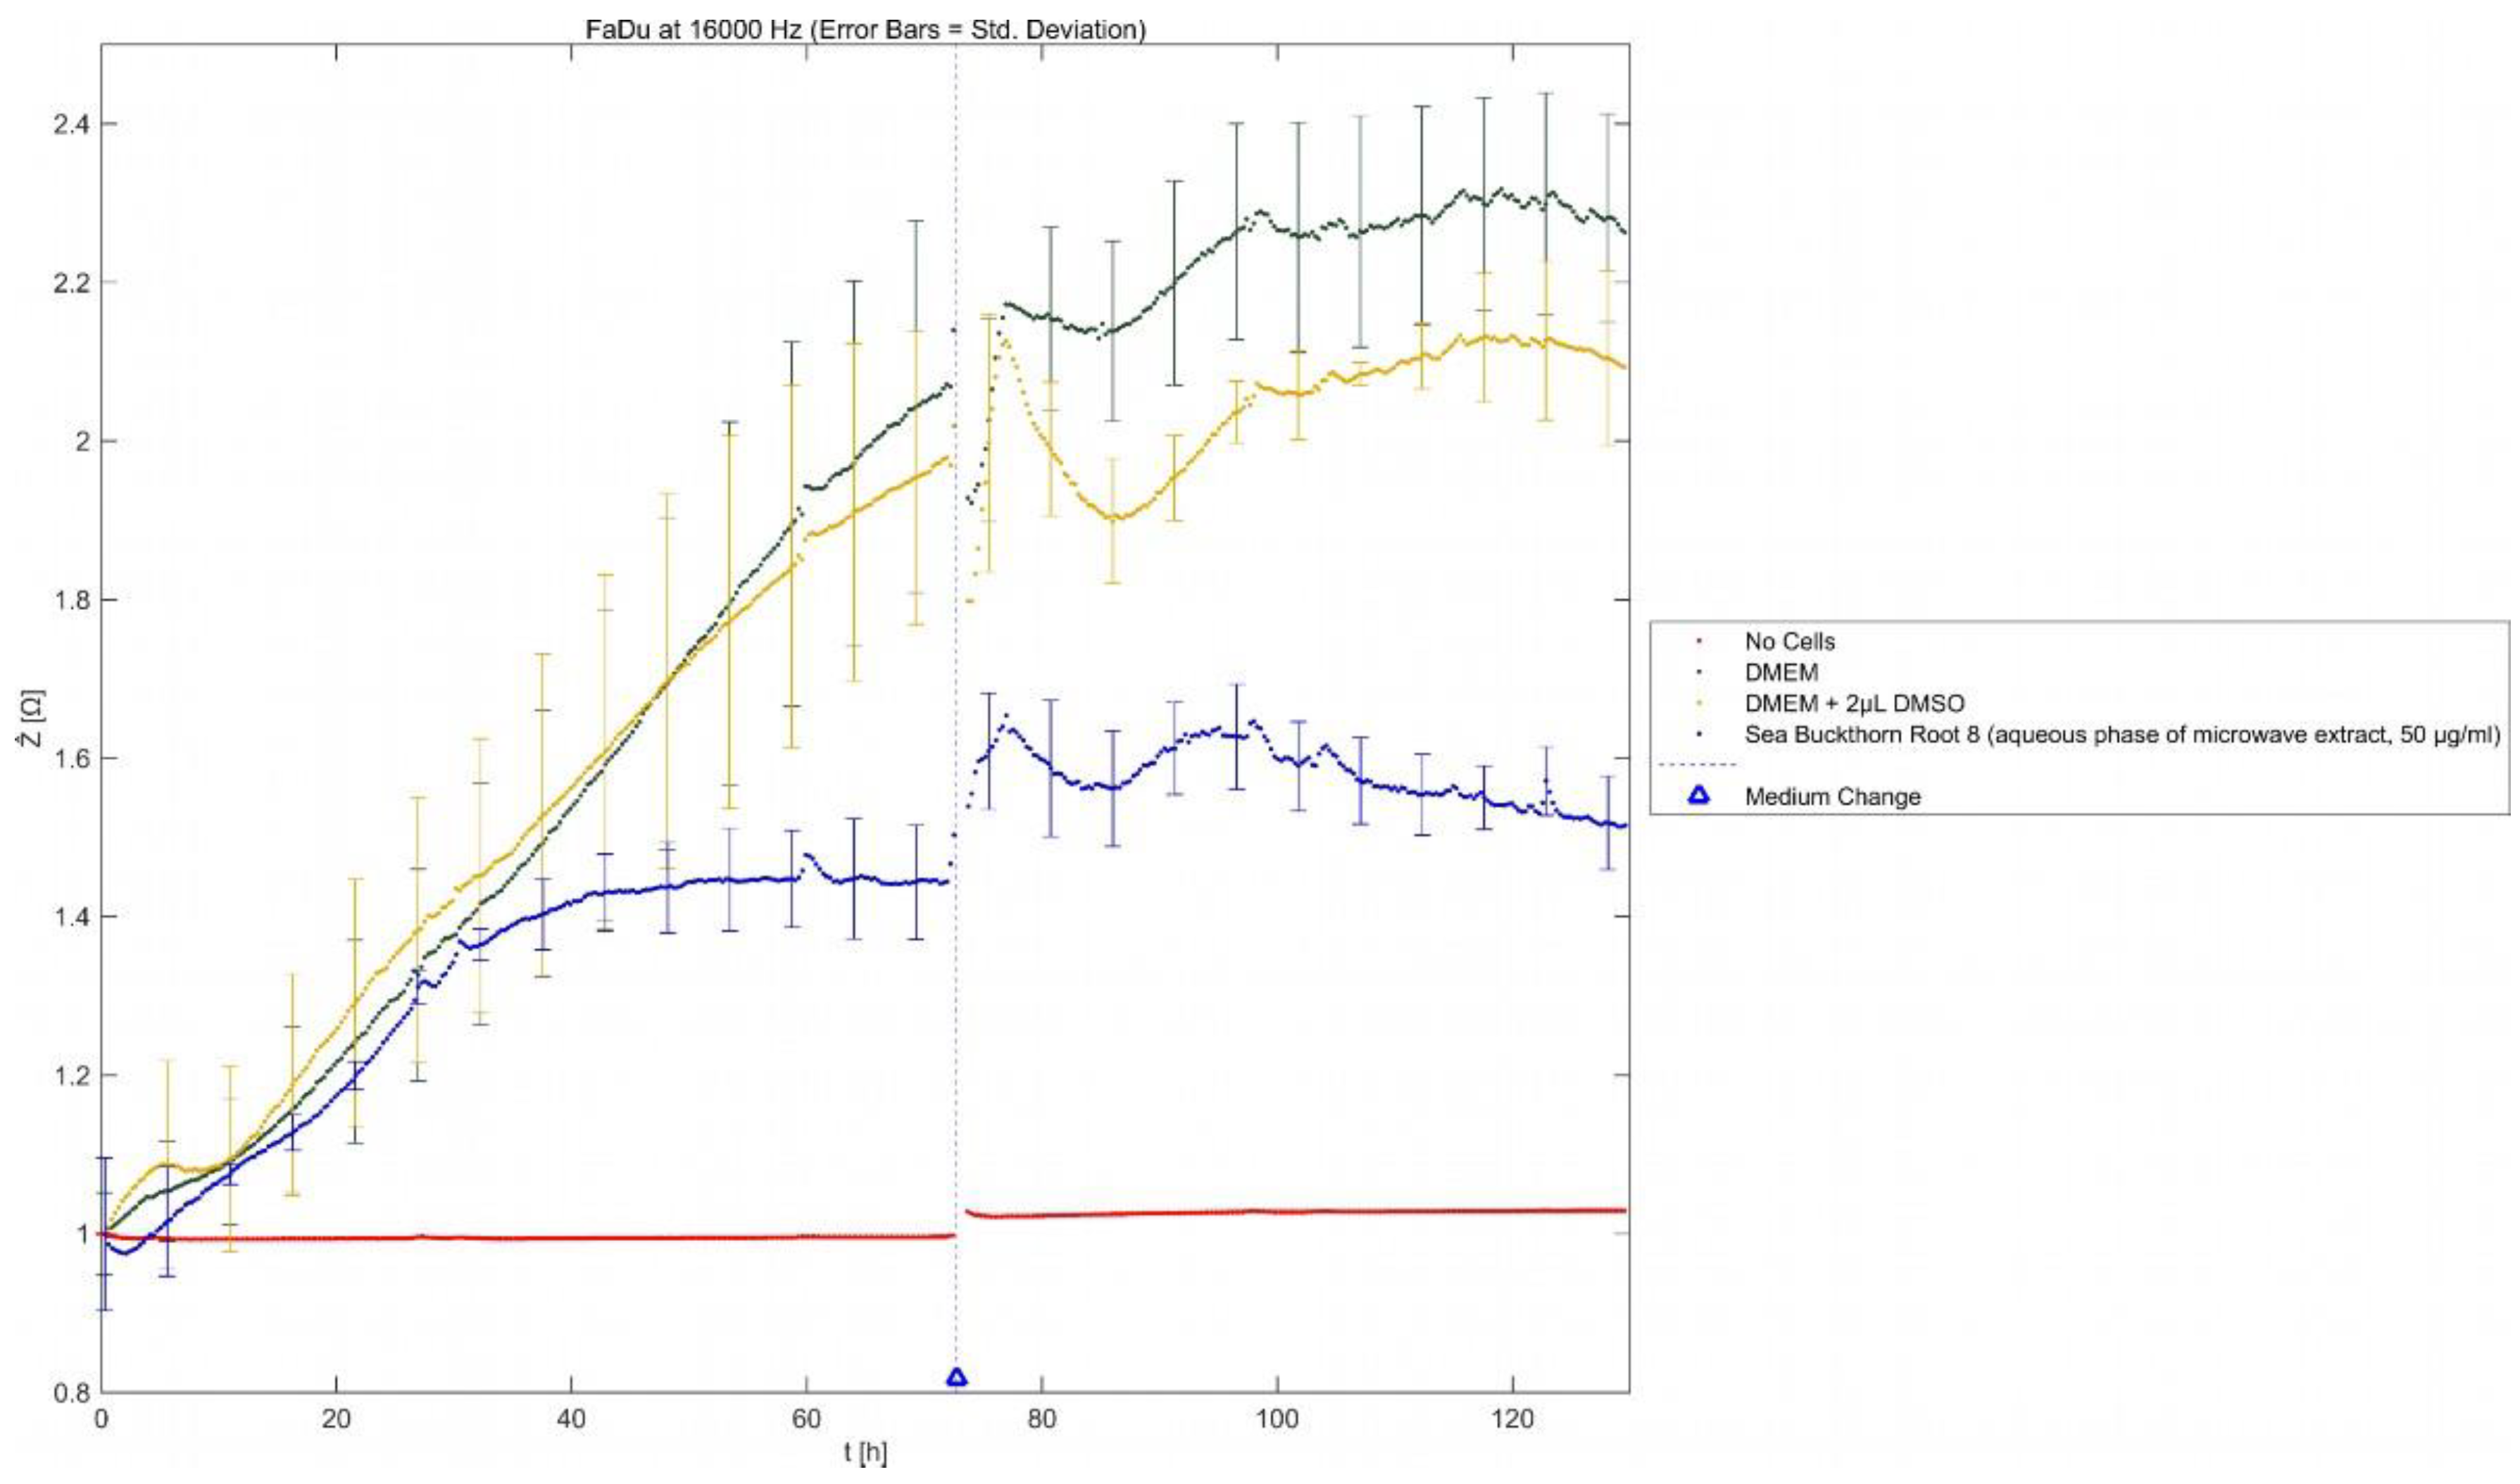
As is visible in Error! Reference source not found., the impedance signal of cells treated with SBR 8 rose similarly to cells treated with DMSO (yellow) for approximately 40 h. Then, while the impedance signal kept rising for DMSO-treated cells, that of cells treated with SBR 8 started stagnating and remained at the same level. Even after the medium change to extract-free medium at 72 h, the signal did not increase but instead remained stagnant.
These observations correspond with FACS results, showing that significant changes can be seen after over 40 h of treatment. A low impedance signal corresponds with low electrode coverage. This could indicate apoptosis since cells detach during apoptosis. However, it is also possible that cells were arrested in their growth without detaching. Impedance not rising after the change to extract-free medium suggests that the cells did not return to their usual proliferation cycle. Therefore, the extract seemed to fundamentally alter the cells. This supports the hypothesis that the extract induces cell cycle arrest.h
2.4. Chemical Analysis of SBR 8 Extract
To attempt to find compounds possibly responsible for the observed biomedical effect, LC/MS² analysis of SBR 8 (Error! Reference source not found.) was performed. In Error! Reference source not found. A, the negative scan mode chromatogram of the aqueous phase of SBR 8 is shown. The peaks at 3.10 and 3.52 min have similar mass spectra (Error! Reference source not found. B, C) and the peaks with m/z 311 and 463 are also found in fraction 1 and fraction 4. Error! Reference source not found. D and E show the MS2 of the peaks at 3.10 and 3.52 min with an m/z 311 parent ion.
Figure 6.
A) Chromatogram of SBR 8 aqueous phase, measured using Method B. (B, C) MS of peaks at 3.10 and and 3.44 min. (D, E) MS² spectra of parent ion at m/z 463. (F, G) MS² spectra of parent ion m/z 463.
Figure 6.
A) Chromatogram of SBR 8 aqueous phase, measured using Method B. (B, C) MS of peaks at 3.10 and and 3.44 min. (D, E) MS² spectra of parent ion at m/z 463. (F, G) MS² spectra of parent ion m/z 463.
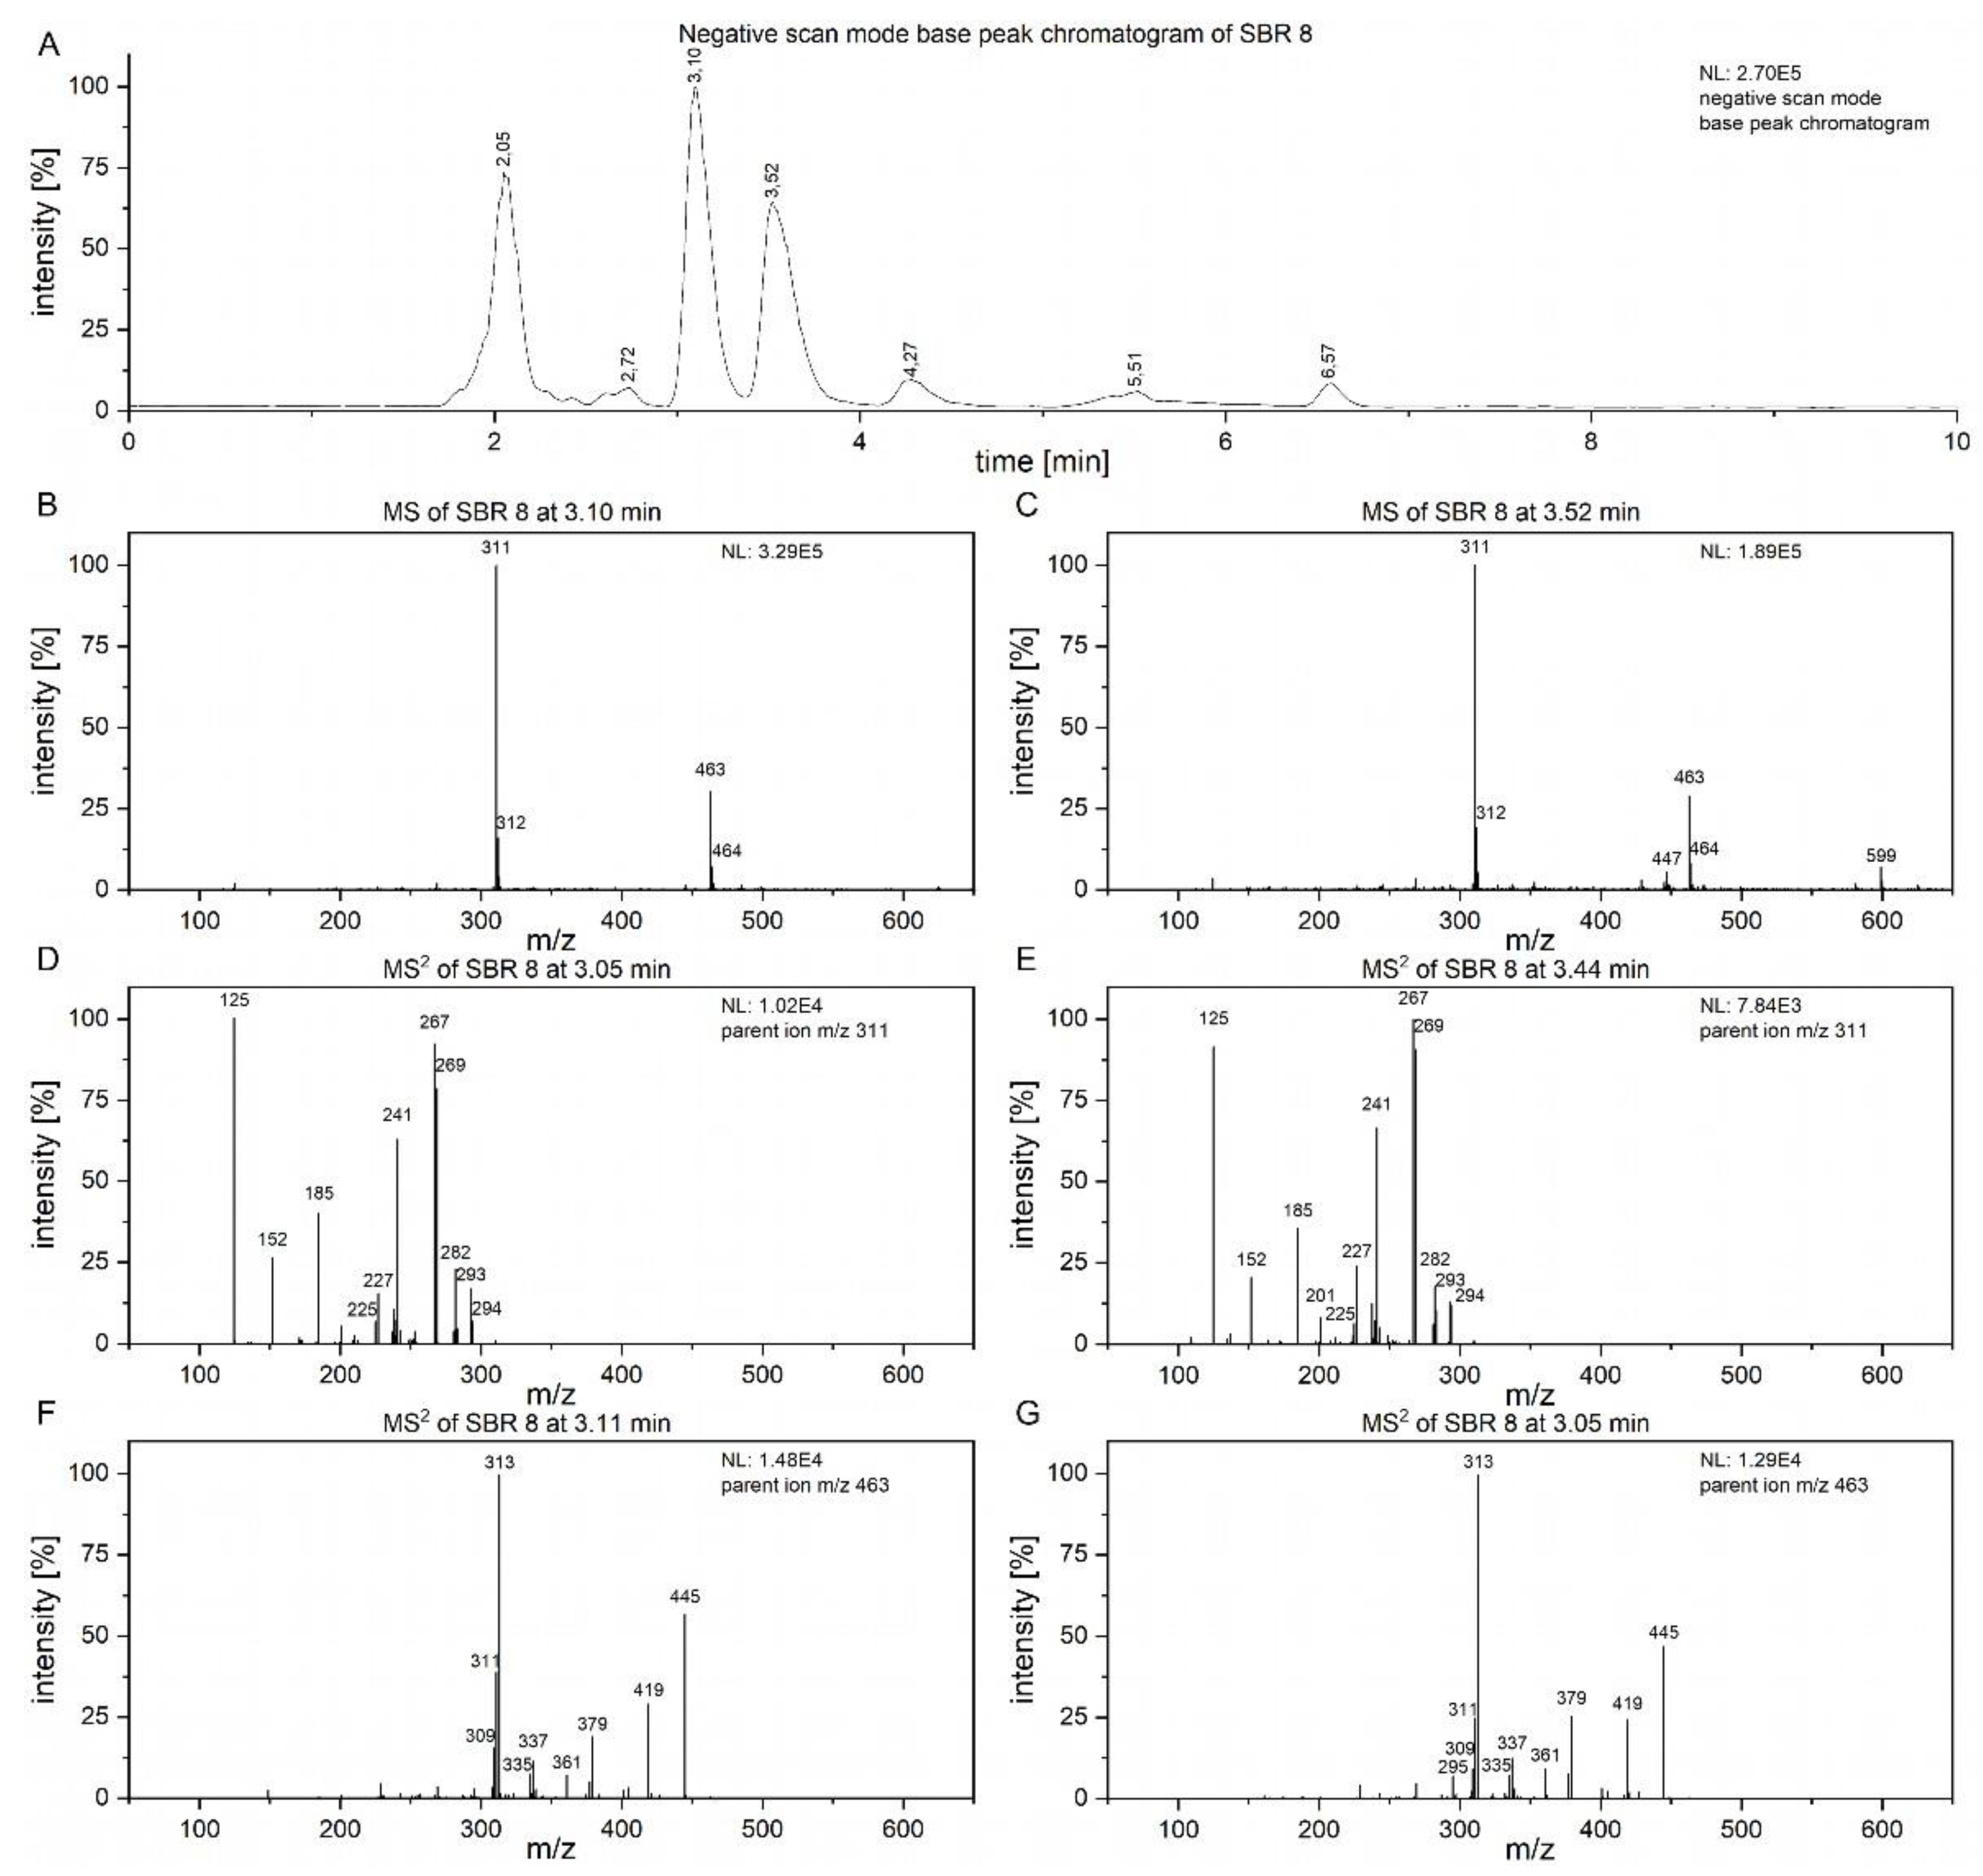
The spectra are nearly identical for both retention times, indicating that the substances represented by the peaks are structurally identical. Error! Reference source not found. F and G shows the spectra of the peaks at the same time with an m/z 463 parent ion. They are also nearly identical. Therefore, the peaks at 3.10 and 3.52 min must both contain two substances.
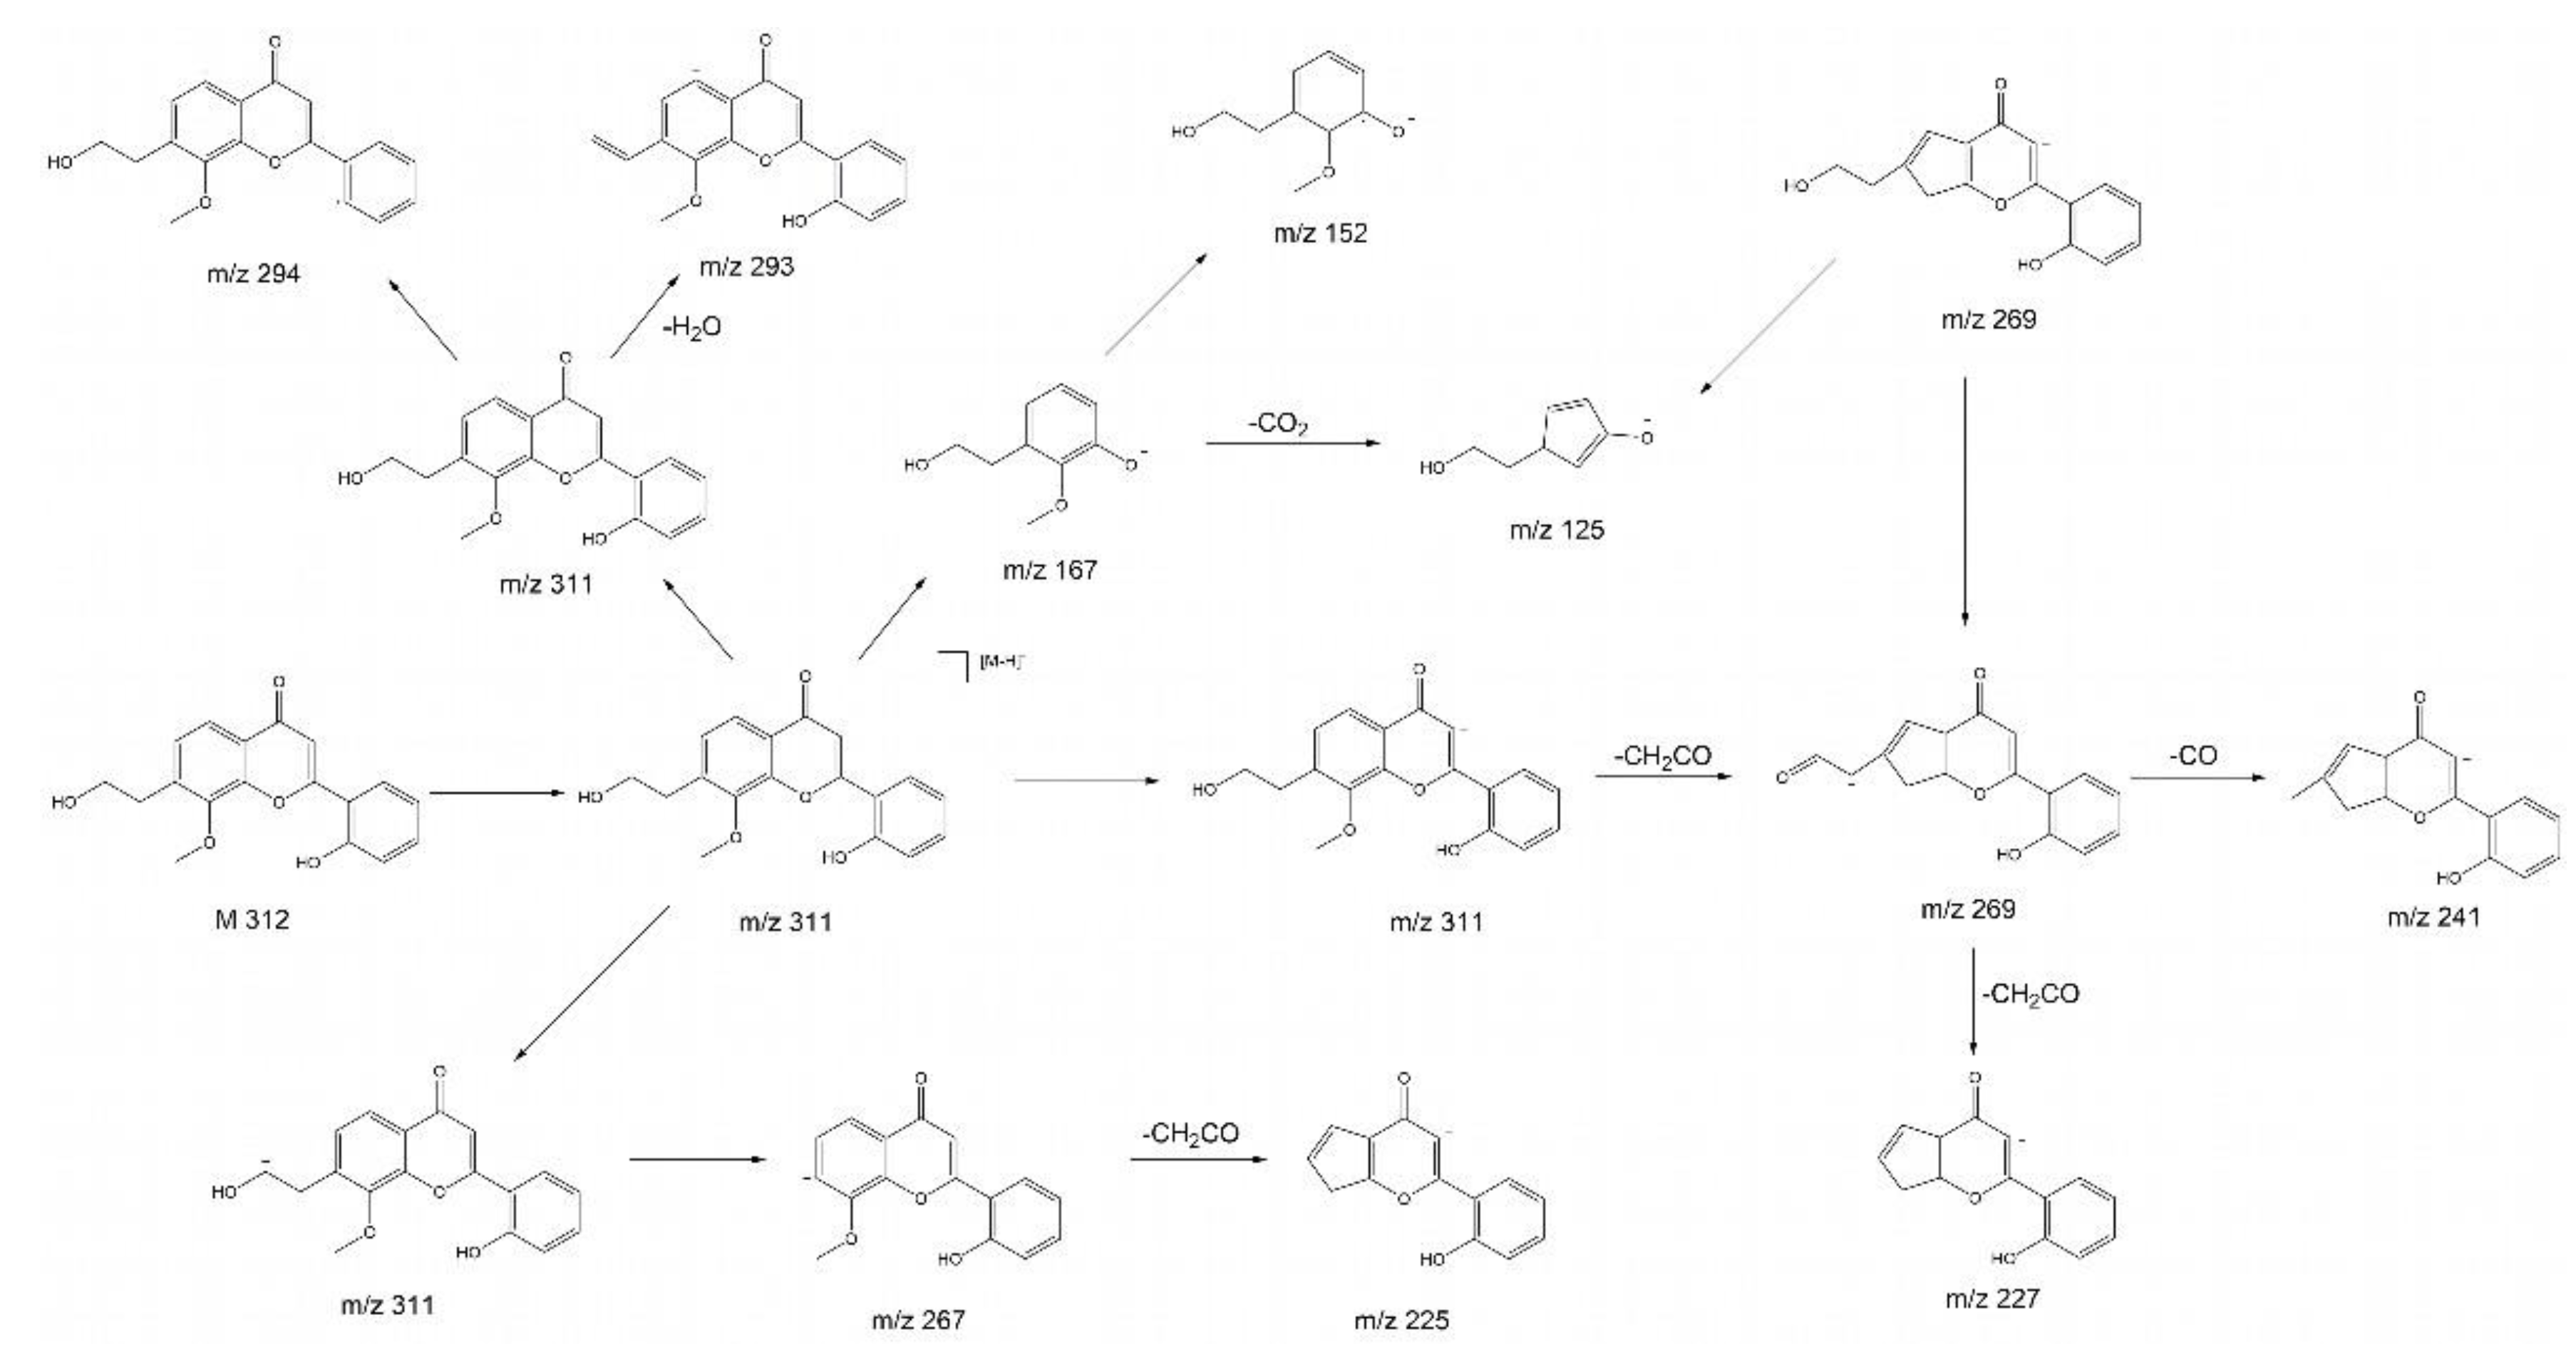
The product ion spectrum of parent ion at m/z 311 shows a particularly intensive fragment ion peak at m/z 267 and m/z 125, which is typical for 2’-hydroxyflavonols. [21] We propose that the substance with the molecular ion peak at m/z 311 belongs to 7-(3-hydroxypropyl)-8-methoxy-2’-hydroxyflavone. Despite not being a hydroxyflavonol, the substance has a very similar structure to a 2’-hydroxyflavonol. The proposed fragmentations 7-(3-hydroxypropyl)-8-methoxy-2’-hydroxyflavone is displayed in Error! Reference source not found. as an example of a substance which could yield the fragments observed in Error! Reference source not found. D and E. It is noteworthy that we see two peaks with slightly different retention times and nearly identical fragmentation patterns in Error! Reference source not found.. This indicates the presence of a structurally very similar substance with only a slight difference, e.g. in the methoxy group placement.
Figure 7.
Proposed fragmentations of a 7-(3-hydroxypropyl)-8-methoxy-2’-hydroxyflavone.
The anti-cancer and antioxidative properties of several 2’-hydroxyflavone derivatives has been previously established, which explains the results we achieved during our tests on cancer cells. Further, has been shown that 3,5,7 trimethodyflavone, a structurally similar substance, had a positive effect on normal human dermal fibroblasts, protecting cells against reactive oxygen species damage. [22] This might be correlated with positive proliferative effects of SBR 8 on hMSC (Error! Reference source not found. A).
The substance at m/z 463 was not identified. Since its retention time is similar to 7-(3-hydroxypropyl)-8-methoxy-2’-hydroxyflavone, it must have similar chemical properties. The compound with m/z 463 does not display a peak with m/z 301 (Error! Reference source not found. F and G), which would be attributed to the loss of a hexoside and is typical for quercetin derivatives such as spiraeoside or isoquercetin. [23] The fragment with m/z 300, which is commonly seen in flavonoids as well, was also not observed here. [24] Further, the fragment ion spectrum of the compound with m/z 463 does not yield a fragment ion with m/z 311, indicating that the substance with m/z 463 is not a 7-(3-hydroxypropyl)-8-methoxy-2’-hydroxyflavone derivative. The fragment ion with m/z 445 can be attributed to H2O loss and the fragment with m/z 419 is likely caused by CO2 loss.
In the chromatogram of fraction 4, the most intensive peaks are found at 1.93 and 2.24 min. However, the mass spectrum at 1.93 min shows a peak at m/z 341. We attributed it to sucrose, because we were able to isolate sucrose from SBR using column chromatography (NMR and LC/MS spectra can be found in SI). The peak at 2.24 min has an m/z at 377. This was further analyzed using MS2. It yielded a fragment ion at m/z 341, which is attributed to sucrose. We attribute the parent ion to an adduct of sucrose and chloride. [25] The rest of fraction 4 is similar to fraction 1. Since sucrose does not cause the MTS assay results, it is most likely that this rest of fraction 4, which is the same as the contents of fraction 1, contains the bioactive substances.
We also analyzed two peaks in the positive scan mode chromatograms via MS² (parent ions at m/z 365 and 448). The mass spectra can be viewed in the SI.
3. Materials and Methods
3.1. Chemicals
For extraction and separation via column chromatography, HPLC grade chemicals (methanol (MeOH), ethyl acetate (EtOAc)), purchased from Fisher Chemicals (Fisher Scientific GmbH, Germany), were used. Solvents for LC/MS analysis (LC/MS quality) were obtained from Fisher Chemicals and Honeywell. The silica gel (technical grade, pore size 60 Å, 230 – 400 mesh particle size, 40 – 63 pm particle size) used for column chromatography was purchased from Sigma-Aldrich (Sigma-Aldrich Chemie GmbH, Germany). DMSO with a purity of ≥99.0%, which was used as a solvent in cell tests, was purchased from VWR Chemicals (VWR International GmbH, Germany). MTS reagent used for assays was acquired from Promega (CellTiter 96® AQueous One Solution Cell Proliferation Assay, Promega GmbH, Germany).
3.2. Plant Material
Eight sea buckthorn root samples of “Habego” variety were obtained from the Research Institute for Agriculture and Fishery of Mecklenburg-Western Pomerania (Germany). There, cuttings from the previous year, obtained from the Baltic Sea tree farm in Kröpelin (Germany) planted on 04.04.2020 and grown in varying soils and under different special conditions. A list of these conditions is provided in the Supporting Information. Cultivation, harvesting and experimental research with the sea buckthorn variety “Habego” comply with relevant institutional, national, and international guidelines and legislation. All experiments comply with The International Union for Conservation of Nature (IUCN) Policy Statement and were not indexed to the IUCN red list index of threatened species. Voucher specimens are deposited in a public herbarium of the Department of Biological Sciences and Department of Botany and Botanical Garden Institute of Biological Sciences, University of Rostock, Rostock, Germany. The plants were identified by Dr. Frank Hippauf and reference specimens were deposited at the State Research Institute for Agriculture and Fishery of Mecklenburg-West Pomerania, Gülzow-Prüzen, Germany.
3.3. Plant Material Preparation
Root material was washed thoroughly using tap water and rinsed with ultra-pure water. Actinomycetes of the stem Frankia were removed. The roots were cut using gardening shears to reduce their size, dried via lyophilization (VaCo 2, Zirbus technology GmbH, Germany) and ground using a laboratory mill (IKA® Werke, Germany) with a maximum particle size of 1 mm.
3.4. Extraction
Plant powders were extracted via microwave extraction: 4.5 g plant powder was separated into 3 PFA vessels. To each tube, 13.5 ml MeOH were added. The powders were extracted 3 times using fresh MeOH. CEM MarsXpress™ was used, the conditions were set to 60 °C and 400 MW (5 min warming, 10 min constant heating, 5 min cooling). After each extraction step, the liquid phase was carefully decanted and filtered using a Millipore® system with a Durapore filter (pore size 0.22 µm). A 1 ml sample was taken for LC/MS measurements and MeOH was removed in vacuo. Dried extract was dissolved in 20 ml water and extracted with 10 ml EtOAc a total of 3 times. The phases were separated, yielding an EtOAc and an aqueous phase. Water was removed via freeze-drying (VaCo 2, Zirbus technology GmbH, Germany), ethyl acetate was removed via rotary evaporator.
3.5. Column Chromatography
Separation of 0.2 g of the aqueous phase of SBR 8 was performed on silica gel at an air pressure of 4 psi. As mobile phase, the following gradient of ethyl acetate and MeOH (respectively) was used: 100:50, 100:100. Acetic acid (1%) was added to each eluent.
Fractions were collected in test tubes and TLC was used to determine the fractions. A solution of anis aldehyde in ethanol (solution recipe in SI) was used to stain the spots. Individual fractions were combined in separate flasks and the solvent was removed in vacuo, yielding 7 fractions. Fractions were dissolved in DMSO and used for biomedical testing after a sample was taken for LC/MS analysis.
3.6. LC/MS and LC/MS2 Analysis
Extract analysis was performed using LC/MS. The system consisted of an UltiMate™ 3000 liquid chromatograph coupled with an LTQ XL™ mass spectrometer (both obtained from Thermo Fisher Scientific). The LC was supplied with a Kinetex® phenyl-hexyl (150 x 2.1 mm x 2.6 µm) column (Phenomenex®, Germany) and the eluent consisted of MeOH and water, each with an addition of 0.1 % formic acid. The column temperature was set to 35 °C and the injection volume was 5 µl.
3.6.1. Method A
An eluent gradient was applied for the analysis of methanolic extracts and their aqueous and EtOAc phases: 0–10 min: 40%, 10–30 min: 95%, 30-35 min: 80%, 35-40 min: 40% MeOH. Ionization was achieved using ESI in positive and negative scan modes at m/z 50 - 2000.
3.6.2. Method B and MS2 Measurements
Analysis of the aqueous phases of SBR was performed using an isocratic eluent containing 20% MeOH. MS² experiments were conducted with the aqueous phase of SBR 8 after separation via column chromatography. Ions with m/z 311, 377 and 463 (negative scan) and 365 and 448 (positive scan), respectively. For fragmentation, CID was performed with a normalized collision energy of 35%.
3.7. NMR Analysis
NMR measurements were performed on 300 MHz (Bruker AVANCE™ 300 III, Bruker Corporation, Billerica, USA) and 500 MHz (Bruker AVANCE™ 500 NEO, Bruker Corporation, Billerica, USA) devices. 2D NMR spectroscopy such as 1H,1H-COSY, 1H,13C-HSQC, and 1H,13C-HMBC was used to determine the placement of the signals.
3.8. Cell Material
Cell lines Cal-33 and FaDu, and human mesenchymal stem cells (hMSC) were used. Cal-33 were obtained from the German Collection of Microorganisms and Cell Cultures (Deutsche Sammlung von Mikroorganismen und Zellkulturen, DMSZ) and FaDu were obtained from the American Type Cell Collection (ATCC®) and maintained at 37 °C in a 5% CO2 atmosphere in a monolayer in Dulbecco’s modified Eagle’s medium (DMEM) plus Ultraglutamine (Lonza, Verviers, Belgium), with 10% fetal calf serum (PAN Biotech GmbH, Aidenbach, Germany) and 1% antibiotic-antimycotic solution (Gibco, Paisley, UK). Confluent cells were passaged via treatment with 0.05% trypsin - 0.02% EDTA. hMSCs were isolated from lipoaspirate samples collected from patients undergoing liposuction or lipofilling procedures at the Rostock University Hospital or Plastic Surgery Clinic in Rostock, Germany, with approval from the Ethics Committee at the University Medical Center Rostock No. A 2014-0092. Pure stem cells were kept in stem cell media constituted of 45% Iscove’s Modified Dulbecco's Medium, 45% Gibco® F-12 Nutrient Mixture, 10% NCS and supplemented with 0.1 ml Gibco™ Penicillin-Streptomycin (all from Thermo Fisher Scientific GmbH, Regensburg, Germany) and 10 µg basic fibroblast growth factor (recombinant human bFGF; Millipore Merck KGaA, Darmstadt, Germany) per 1 l of cell culture media.
3.9. MTS Assay
Cancer cells were seeded in a 96-well plate with DMEM supplemented with 10% fetal calf serum and 1% antibiotic-antimycotic solution and hMSC with Mesenchymal Stem Cell Growth Medium 2 (PromoCell, Germany). After 24 h incubation, the medium was changed to phenol-red-free DMEM (Gibco™, assay medium), after which the cells were incubated for another 24 h. Aqueous and EtOAc phases of the plant extracts were dissolved in DMSO and these solutions were dissolved in assay medium, yielding an extract concentration of 50 µg/ml. Cells were treated with the resulting solution and incubated for 24 h. The assay was performed using 10 µl MTS reagent per well. After 60 min incubation, the absorbance was measured at 492 nm using an Absorbance 96 plate reader (byonoy GmbH, Germany) and Absorbance 96 software (byonoy GmbH, Germany).
3.10. Flow Cytometry
Cal-33 and FaDu were seeded in 6-well plates and incubated for 24 h. Cells were washed with phosphate-buffered saline (PBS) solution and the medium was changed to assay medium. The cells were incubated for 24 h, washed with PBS, and treated with solutions of the aqueous phase of SBR 8 extract and its fractions 1 and 4 in DMSO, which were dissolved in assay medium to yield a concentration of 50 µg/ml. Cells were incubated for 24 h (Cal-33 and FaDu), 48 and 72 h (only FaDu). The supernatant was transferred to FACS tubes and cells were washed twice with PBS, which was also transferred to FACS tubes, and trypsinized with 0.05% trypsin-0.02% EDTA for 5 min. The cells were then transferred to FACS tubes using assay medium. The tubes were centrifuged (5 min, 2000 rpm) and medium was removed. Cells were fixed with ice-cold 70% ethanol and stored at -20 °C for 48 h. Propidium iodide (PI) staining was performed. Cells were centrifuged, washed with PBS and incubated with RNAse (1 mg/ml) for 30 min. Then, RNAse solution was removed. The cell pellet was resuspended in 500 µl PI solution (50 mg/ml). Cells were maintained for at least 48 h at 3–8 °C prior to analysis. Flow cytometric measurements were performed using a BD FACSCalibur cytometer (BD Biosciences, USA) and CellQuest Pro (BD Biosciences, USA). FlowJo software (BD Biosciences, USA) was used for analysis. A minimum of 10,000 ungated events were recorded. Cell cycle phases G1, G2, S and Sub G1 were calculated using FlowJo.
3.11. ECIS
Electric cell-substrate impedance (ECIS) measurements were conducted using ECIS® Z-Theta 96 Well Array Station with a 96W20idf PET well plate (Applied BioPhysics, Inc.). ECIS software (Applied BioPhysics, Inc.) was used to operate the device and analyze results. FaDu were seeded in the well plate and incubated with 200 µl DMEM until a constant impedance signal was reached (approximately 2 days). Then, 100 µl medium was removed from each well except for the cell-free wells and 100 µl of fresh medium was added, in which the aquepus phase of the SBR 8 extract was dissolved yielding a concentration of 50 µg/ml. As control, cells were also treated with DMEM, as well as DMEM with 2 µl DMSO. Impedance (Z), capacity (C) and resistance (R) were measured at 9 frequencies (250, 500, 1000, 2000, 4000, 8000, 16000, 32000 and 64000 Hz) over a period of 73 h. For the recovery experiment, the medium in the wells was removed completely and replaced by 200 µl of fresh medium. Measurements were carried out for an additional 48 h. Data were analyzed using ECIS software. A frequency analysis was performed and 16000 Hz was chosen to view impedance results at.
4. Conclusions
In our study we analyzed the effect of SBR on tumorigenic and non-tumorigenic cells using a metabolic activity assay, flow cytometry and ECIS. We observed a viability inhibition in FaDu and Cal-33 treated with the aqueous phase of SBR 8. On non-tumorigenic cells we did see an inhibition. On the contrary, SBR 8 showed a positive effect on hMSC viability. This indicates that the extracts might be powerful agents in combinatory chemotherapy, potentially taking over part of the cancer cell treatment, while not harming and possibly even protecting non tumorigenic cells. We separated the extract into fractions and were able to determine two fractions (fraction 1 and 4), which we were able to correlate with the bioactive effects using the metabolic activity assay. To validate these results, we performed flow cytometry (Cal33 and FaDu) and ECIS (only FaDu) experiments. The results indicate a cell cycle arrest in the G2 phase and a possible subsequent apoptosis with an onset after approximately 48 h treatment.
We were able to analyze the fractions using LC/MS². Those seemed to contain at least 2 substances which could be correlated with the observed bioactive effects. We propose that SBR 8 contains a 7-(3-hydroxypropyl)-8-methoxy-2’-hydroxyflavone, which we suspect to be at least partially responsible for the observed bioactivity.
Further studies of SBR 8 are crucial to identify further contained compounds, especially of fractions 1 and 4, as well as the effect of 3,5,7 trimethoxyflavone on cells has to be investigated. However, SBR extracts proved to be of interest for cancer chemotherapy.
Author Contributions
N.E. conceived the project. All authors contributed to the study conception and design. Material preparation, data collection and analysis were performed by A.G. The first draft of the manuscript was written by A.G. and all authors commented on previous versions of the manuscript. All authors read and approved the final manuscript.
Funding
This work was supported by the European Union (PePPP center of excellence MV: grant ESF/14-BM-A55-0048/16) and the Ph.D. Scholarship Program of the University of Rostock in Mecklenburg-Vorpommern. The LTQ XL LC-MS system was co-financed by the European Union (European Regional Development Fund GHS-17-0034 under the Operational Program Mecklenburg-Vorpommern 2014-2020 – Investments in growth and employment).
Institutional Review Board Statement and Informed Consent Statement
Lipoaspirate samples were collected from patients undergoing liposuction or lipofilling proce-dures at the Rostock University Hospital or Plastic Surgery Clinic in Rostock, Germany, with approval from the Ethics Committee at the University Medical Center Rostock No. A 2014-0092. Herewith all authors confirm that all methods were conducted in accordance with relevant guidelines and regulations. Further, informed consent was obtained from all subjects and/or their legal guardian(s) within this study.
Data Availability Statement
The data that support the findings of this study are available from the corresponding author, Nadja Engel, upon reasonable request.
Conflicts of Interest
The authors declare that they have no conflict of interests.
Abbreviations
The following abbreviations are used in this manuscript:
| LC | Liquid chromatography |
| MS | Mass spectrometry |
| ESI | Electrospray ionization |
| CID | Collision-induced dissociation |
| SBR | Sea buckthorn root |
| DMSO | Dimethyl sulfoxide |
| DMEM | Dulbecco’s modified Eagle’s medium |
| hMSC | Human mesenchymal stem cells |
| EDTA | Ethylenediaminetetraacetic acid |
| NCS | Newborn calf serum |
| ECIS | Electric cell-substrate impedance sensing |
| PBS | Phosphate buffered saline |
| Rpm | Rounds per minute |
| PI | Propidium iodide |
References
- Ferlay J, Ervik M, Lam F, Colombet M, Mery L, Piñeros M. Cancer Today. Available online: https://gco.iarc.fr/today (accessed on 11 September 2021).
- Brook, I. Late side effects of radiation treatment for head and neck cancer. Radiat. Oncol. J. 2020, 38, 84–92. [Google Scholar] [CrossRef] [PubMed]
- American Cancer Society. Chemotherapy Side Effects. (accessed on 21 December 2021).
- American Society of Clinical Oncology. Side Effects of Chemotherapy. Available online: https://www.cancer.net/navigating-cancer-care/how-cancer-treated/chemotherapy/side-effects-chemotherapy (accessed on 14 February 2022).
- Nobili, S.; Lippi, D.; Witort, E.; Donnini, M.; Bausi, L.; Mini, E.; Capaccioli, S. Natural compounds for cancer treatment and prevention. Pharmacol. Res. 2009, 59, 365–378. [Google Scholar] [CrossRef] [PubMed]
- Macmillan Cancer Support. Cancer information and support: Paclitaxel. Available online: https://www.macmillan.org.uk/cancer-information-and-support/treatments-and-drugs/paclitaxel (accessed on 14 February 2022).
- Padwad, Y.; Ganju, L.; Jain, M.; Chanda, S.; Karan, D.; Kumar Banerjee, P.; Chand Sawhney, R. Effect of leaf extract of Seabuckthorn on lipopolysaccharide induced inflammatory response in murine macrophages. Int. Immunopharmacol. 2006, 6, 46–52. [Google Scholar] [CrossRef] [PubMed]
- Ganju, L.; Padwad, Y.; Singh, R.; Karan, D.; Chanda, S.; Chopra, M.K.; Bhatnagar, P.; Kashyap, R.; Sawhney, R.C. Anti-inflammatory activity of Seabuckthorn (Hippophae rhamnoides) leaves. Int. Immunopharmacol. 2005, 5, 1675–1684. [Google Scholar] [CrossRef]
- Saggu, S.; Kumar, R. Modulatory effect of seabuckthorn leaf extract on oxidative stress parameters in rats during exposure to cold, hypoxia and restraint (C-H-R) stress and post stress recovery. J. Pharm. Pharmacol. 2007, 59, 1739–1745. [Google Scholar] [CrossRef]
- Geetha, S.; Ram, M.S.; Sharma, S.K.; Ilavazhagan, G.; Banerjee, P.K.; Sawhney, R.C. Cytoprotective and antioxidant activity of seabuckthorn (Hippophae rhamnoides L.) flavones against tert-butyl hydroperoxide-induced cytotoxicity in lymphocytes. J. Med. Food 2009, 12, 151–158. [Google Scholar] [CrossRef]
- Maheshwari, D.T.; Yogendra Kumar, M.S.; Verma, S.K.; Singh, V.K.; Singh, S.N. Antioxidant and hepatoprotective activities of phenolic rich fraction of Seabuckthorn (Hippophae rhamnoides L.) leaves. Food Chem. Toxicol. 2011, 49, 2422–2428. [Google Scholar] [CrossRef]
- Basu, M.; Prasad, R.; Jayamurthy, P.; Pal, K.; Arumughan, C.; Sawhney, R.C. Anti-atherogenic effects of seabuckthorn (Hippophaea rhamnoides) seed oil. Phytomedicine 2007, 14, 770–777. [Google Scholar] [CrossRef]
- Tang, B.; Bi, W.; Tian, M.; Row, K.H. Application of ionic liquid for extraction and separation of bioactive compounds from plants. J. Chromatogr. B Analyt. Technol. Biomed. Life Sci. 2012, 904, 1–21. [Google Scholar] [CrossRef]
- McDougall, G.J.; Ross, H.A.; Ikeji, M.; Stewart, D. Berry extracts exert different antiproliferative effects against cervical and colon cancer cells grown in vitro. J. Agric. Food Chem. 2008, 56, 3016–3023. [Google Scholar] [CrossRef]
- Grey, C.; Widén, C.; Adlercreutz, P.; Rumpunen, K.; Duan, R.-D. Antiproliferative effects of sea buckthorn (Hippophae rhamnoides L.) extracts on human colon and liver cancer cell lines. Food Chemistry 2010, 120, 1004–1010. [Google Scholar] [CrossRef]
- Oppermann, C.; Engel, N.; Ruth, W.; Nebe, B. LC-MS analysis of extracts from beech and sea buckthorn to correlate the phytoestrogen content and anti-cancer activity. Journal of Chemical and Pharmaceutical Research 2015, 175–185. [Google Scholar]
- Lee, S.A.; Jo, H.K.; Cho, S.H.; Ko, S.K. Comparison of the contents of phenolic compounds of sea buckthorn (Hippophae rhamnoides) cultivated in Korea and Mongolia. Korean Journal of Pharmacognosy 2010, 41, 308–312. [Google Scholar]
- Jastrząb, A.; Skrzydlewska, E. Composition and biomedical relevance of sea buckthorn. Acta Poloniae Pharmaceutica - Drug Research 2019, 76, 959–969. [Google Scholar] [CrossRef]
- Shiezadeh, F.; Mousavi, S.H.; Amiri, M.S.; Iranshahi, M.; Tayarani-Najaran, Z.; Karimi, G. Cytotoxic and Apoptotic Potential of Rheum turkestanicum Janisch Root Extract on Human Cancer and Normal Cells. Iran. J. Pharm. Res. 2013, 12, 811–819. [Google Scholar]
- Demidenko, Z.N.; Kalurupalle, S.; Hanko, C.; Lim, C.; Broude, E.; Blagosklonny, M.V. Mechanism of G1-like arrest by low concentrations of paclitaxel: next cell cycle p53-dependent arrest with sub G1 DNA content mediated by prolonged mitosis. Oncogene 2008, 27, 4402–4410. [Google Scholar] [CrossRef]
- McNab, H.; Ferreira, E.S.; Hulme, A.N.; Quye, A. Negative ion ESI–MS analysis of natural yellow dye flavonoids—An isotopic labelling study. International Journal of Mass Spectrometry 2009, 284, 57–65. [Google Scholar] [CrossRef]
- Lee, S.; Jang, T.; Kim, K.H.; Kang, K.S. Improvement of Damage in Human Dermal Fibroblasts by 3,5,7-Trimethoxyflavone from Black Ginger (Kaempferia parviflora). Antioxidants (Basel) 2022, 11. [Google Scholar] [CrossRef]
- Simon, C.; Dührkop, K.; Petras, D.; Roth, V.-N.; Böcker, S.; Dorrestein, P.C.; Gleixner, G. Mass Difference Matching Unfolds Hidden Molecular Structures of Dissolved Organic Matter. Environ. Sci. Technol. 2022, 56, 11027–11040. [Google Scholar] [CrossRef]
- He, J.; Feng, Y.; Ouyang, H.-Z.; Yu, B.; Chang, Y.-X.; Pan, G.-X.; Dong, G.-Y.; Wang, T.; Gao, X.-M. A sensitive LC-MS/MS method for simultaneous determination of six flavonoids in rat plasma: application to a pharmacokinetic study of total flavonoids from mulberry leaves. J. Pharm. Biomed. Anal. 2013, 84, 189–195. [Google Scholar] [CrossRef]
- Amoah, E.; Kulyk, D.S.; Callam, C.S.; Hadad, C.M.; Badu-Tawiah, A.K. Mass Spectrometry Approach for Differentiation of Positional Isomers of Saccharides: Toward Direct Analysis of Rare Sugars. Anal. Chem. 2023, 95, 5635–5642. [Google Scholar] [CrossRef]
Disclaimer/Publisher’s Note: The statements, opinions and data contained in all publications are solely those of the individual author(s) and contributor(s) and not of MDPI and/or the editor(s). MDPI and/or the editor(s) disclaim responsibility for any injury to people or property resulting from any ideas, methods, instructions or products referred to in the content. |
© 2025 by the authors. Licensee MDPI, Basel, Switzerland. This article is an open access article distributed under the terms and conditions of the Creative Commons Attribution (CC BY) license (http://creativecommons.org/licenses/by/4.0/).
Copyright: This open access article is published under a Creative Commons CC BY 4.0 license, which permit the free download, distribution, and reuse, provided that the author and preprint are cited in any reuse.


