
Submitted:
26 February 2025
Posted:
27 February 2025
Read the latest preprint version here
Abstract
Background/Objectives: Histopathological diagnosis of invasive carcinoma breast samples includes the scoring of mitotic activity. This is a tedious and time-consuming task with high interpathologist variability. Methods: As an assistance to pathologists, we developed a deep learning based pipeline for mitosis detection and mitotic scoring according to the Elston and Ellis grading system on Whole Slide Images (WSI) for the first time here described. Results: We present its performance on routine data through a clinical study which clearly demonstrates its value. When assisted by Artificial Intelligence (AI), pathologists show better accuracy and reproducibility on the mitotic score. Conclusions: To the best of our knowledge, this is the first study to demonstrate that AI can successfully assist pathologists for mitotic score determination in human breast WSI in routine practice.
Keywords:
Invasive breast carcinoma
; mitoses
; digital pathology
; WSI
; artificial intelligence
; deep learning mitotic score reproducibility
; clinical study
1. Introduction
Diffusion in daily pathological practice of slide digitization and AI-based solutions promises to facilitate routine practice, enabling faster, more accurate and reproducible diagnoses for better patient care. In case of breast pathology, numerous studies have successfully applied computer vision tools to analyse whole slide images (WSI) of breast carcinoma specimens. Some research studies focus on lesion detection [1,2,3] while others aim to identify specific biomarkers such as tumor-infiltrating lymphocytes [4,5] or microcalcifications [6]. Comprehensive lesion diagnosis often involves multiple complex and tedious tasks.
For instance, in cases of breast NST invasive carcinoma (IC), pathologists must identify the area with the highest mitotic density (known as hotspots) and count the cells undergoing division, termed mitoses, within this region.
Integrated into the Nottingham histoprognostic score [7], the mitotic score (MS) is derived from the mitotic count (MC) performed on the most mitotic area of IC, referred to as mitotic hotspots (MH) [8]. There is three mitotic scores (1, 2 and 3). This mitosis counting is a laborious and time-consuming task. Moreover, a study by Rakha et al. [9] demonstrated significant inter-observer variability in mitotic counts, with discrepancies depending on the count’s location. Mitoses are small and must be counted at high magnification (40x), making thorough tumor inspection challenging. Furthermore, identifying mitotic figures can be subjective, as they can be mistaken for cells undergoing degeneration, apoptosis, or necrosis. The introduction of AI tools in this field enhances reproducibility, speed, and ease of performing these tasks.
Automatic mitosis detection using AI-based tools could reduce variability, increase accuracy, and save time in pathologists’ daily routines. A recent study [10] suggested that AI would likely be routinely used for mitosis counting by 2030. In 2023, the French Society of Pathology (SFP) surveyed 165 French pathologists regarding the potential contributions of AI to the field: 56.4% identified mitotic activity assessment as the most challenging aspect of the Nottingham scoring system, while 84.2% indicated a need for diagnostic support solutions, including automated quantitative measurements like mitotic counting. Recent studies on mitosis detection in WSIs have shown significant advancements in accuracy and efficiency through deep learning models. Notable approaches include combining Faster R-CNN and YOLOv5, achieving an F1-score of 84% with a large annotated dataset and providing an end-to-end web-based platform for image analysis and diagnosis [11,12]. Another innovative method, ”Mitosis Detection, Fast and Slow” employs a two-stage framework for candidate segmentation and refinement, enhancing sensitivity and computational efficiency by initially processing downscaled images and refining them with deeper Convolutionnal Neural Networks (CNNs) [13]. Efforts to address domain shifts in WSIs through color augmentation and stain normalization have also been explored to improve model generalizability across different imaging conditions [13].
To date, no study has practically compared the use of an automatic mitosis detection solution by pathologists to pathologists couting mitosis alone. We developed an automatic mitotic detection pipeline within WSI that also locates relevant hotspots. A clinical study on routine practice WSI evaluate whether this tool assists pathologists in determining the mitotic score. To the best of our knowledge, this is the first study to demonstrate that AI could successfully aid pathologists in determining mitotic score in breast WSI.
2. Materials and Methods
2.1. Data Description
The data used to train and test our models originate from two sources of WSI : MIDOG 2021 [14] and Bicêtre Hospital. This double origin was chosen to increase the variability of mitotic patterns and slide quality.
MIDOG 2021 challenge released a multi-scanner mitotic dataset. It originates from 50 breast cancer WSIs, stained with routine hematoxylin-eosin (HE) dye, and scanned with one of following manufacturers Hamamatsu XR NanoZoomer 2.0, Hamamatsu S360 and Aperio ScanScope CS2. The training set contains 1721 mitotic figures and 2714 hard examples (non-mitotic figures). Only mitotic figures were used for our application.
Slides selected to build challenge datasets are generally believed to be of good quality: thin cuts and limited amount of artefacts. Routine WSI can be much different. To design a robust pipe, ready for laboratory use, a dataset was built upon daily practice hematoxylin-eosin-safran (HES) WSI in collaboration with the Bicêtre Hospital. Thirty-two WSI were scanned with P250 and P1000 3DHistech scanners at zoom x20 and digital magnification by 1.6. Labelling was performed by two experienced pathologists used to digital pathology along the following process : one pathologist annotates mitosis-like objects on the slides whatever they are normal, atypical or imposters and a joint review is then carried out to reach a consensus to remove imposters. The labelling process was performed using Cytomine software [15] and resulted in 1677 mitosis.
2.2. Pipeline Description
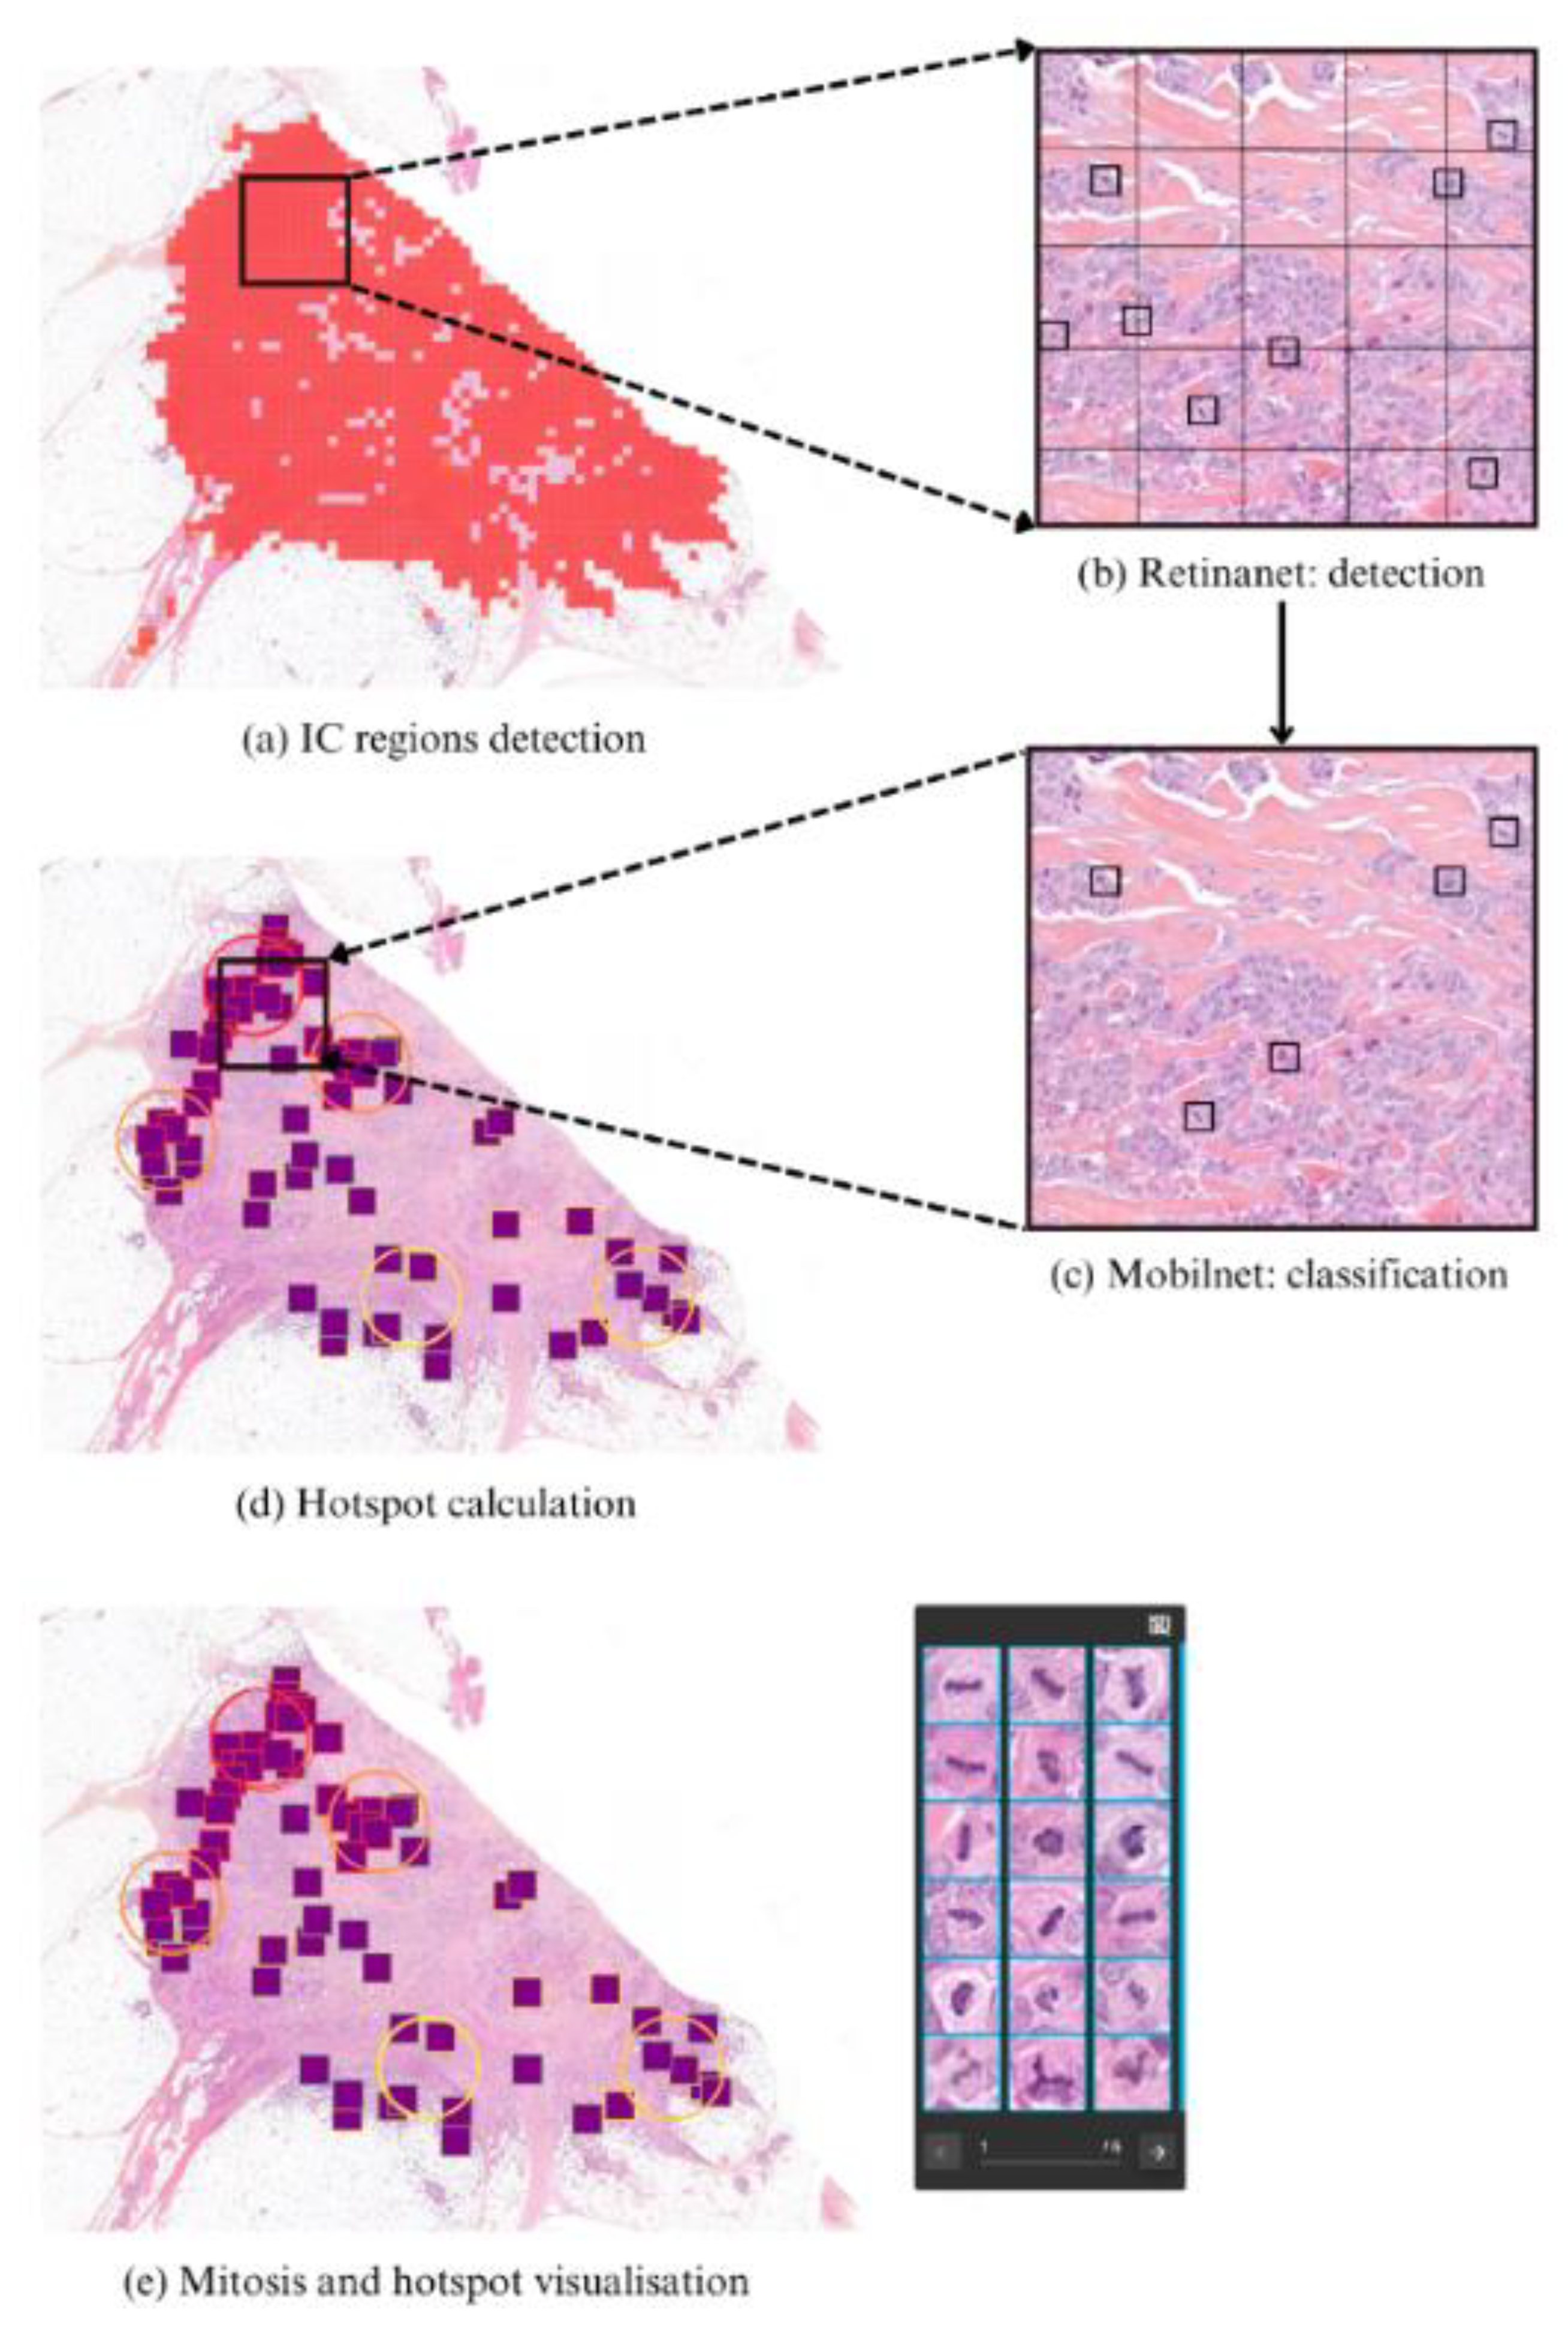
The detection pipeline is made of a two-stage process (Figure 1).
First a patch-based IC detector (described in [16]) is used to determine the area where the mitotic analysis should be conducted.
Then, cancerous patches are fed to a two-step mitosis localization stage: first a 50x50 pixels object detector, based on RetinaNet [17], locates mitosis-like objects. Then most probable objects go through a final classifier, based on MobileNetV2 [18], that assesses whether they are true mitosis or not. Objects with high enough classification confidence are finally considered as mitoses.
As a last step, hotspots regions are automatically located. Hotspots are regions with highest mitotic density from where pathologists should start the mitotic count. We set hotspots as circular regions with size , which was considered relevant by expert pathologists. For each patch p containing a mitosis, a hostpot score hp is computed as
where is a circle of size centered on the patch. This score is the combination of mitoses contained in a region and those in a surrounding region of . The parameter ϵ is selected based on empirical analysis to favor a hotpot with surrounding mitotic activity over one that contains the same number of mitosis but no mitosis nearby.
Both mitosis figures and top scored hotspots are finally shown to the pathologist as an aid for mitotic scoring on a surface.
Figure 1.
Overview of the detection pipeline. First, IC regions are detected (a) and parsed into 256x256 pixel patches at zoom x20. Within IC patches, mitosis localization is performed through a two-stage process. First, a Retinanet detector (b) locates mitosis-like objects. Then, each detected object is fed to a classifier (c) for further validation. Only objects with a classification confidence over a threshold are kept. Finally, mitotic regions with highest density (hotspots) are then automatically located (d). Results can finally be visualized in the in-house software Cleo (e).
2.3. Data and Training
2.3.1. Datasets
In the following we refer to as train slides and test slides the WSI from which train data and test data are extracted. We also refer to the detection train set and detection test set as the patch datasets used to train and test the detection networks. Same naming is applied to classification. As illustrated in Table 1 train slides contain every slide from MIDOG and a part of Bicêtre slides, while the test is performed on data from Bicêtre only.
Every false positive detected at this point is considered as a negative class instance in the classification train set. The same is done on test slides to get artifacts for the classification test set.
The labeling process is a tedious task and some mitotic patterns may have been forgotten by annotators. The set of generated artifacts thus contains true mitotic patterns, detected by the RetinaNet but considered as false positives since they were not annotated. To clean this artifact dataset, only objects with a detection confidence below a threshold are kept. This preserves the sanity of classification sets and proved to improve performance.
2.3.2. Data Augmentation
Data augmentation techniques, including color jitter, cutout, blur, and geometric transformations, were randomly applied for both detection and classification. They strongly enhanced models’ generalization abilities.
2.3.3. Training Configuration
The RetinaNet model is trained with a standard L1-loss for bounding box regression and a Focal loss [17] for instance classification. Optimization is performed through a stochastic gradient descent optimizer with piecewise constant decay learning-rate. The classifier has a MobileNetV2 [18] architecture, it is trained with a binary cross entropy loss and Adam [19] optimizer.
2.3.4. Detection Metrics
Test slides were processed by our algorithms. Those slides contain 153 mitosis split among 24862 IC patches. The detector achieves a recall of 56.2% with a precision of 12.6%. Upon incorporating the classifier, the detection metrics yield a recall of 43.8% and a precision of 27.6%.
2.4. Design of the Clinical Study
2.4.1. Patients and Tissue Selection
The study was performed on 50 slides randomly selected between February 2020 and June 2021 from the Pathology department of the Bicêtre Hospital, not seen during training nor testing. The set contains a balanced combination of biopsies and surgical specimens. Table 2 shows the patient and tumor characteristics of the 50 cases.
Biopsies underwent fixation in 4% neutral buffered formalin for a minimum of 6 hours, while surgical specimens were sampled following fixation in 4% buffered formalin for 24 to 48 hours. Subsequently, the specimens underwent dehydration and impregnation using a Sakura Tissue-Tek® VIP® machine in accordance with departmental protocol. Paraffin embedding procedures differed for surgical specimens and biopsies, with automated embedding performed on a Sakura Tissue-Tek® AutoTEC® and manual embedding on a Sakura Tissue-Tek® system, respectively. Sections, cut to a thickness of 3 µm using a Leica or Microm microtome, were mounted onto SuperFrost™ glass slides and dried at 60°C for 30 minutes before undergoing staining with Hematoxylin-Eosin-Safran on a Leica ST5020® automated system. Slides were then mounted using Pertex® mounting medium on a Leica CV5030® and dried for a minimum of 5 minutes in the machine.
Case scanning was conducted using two 3DHISTECH slide scanners, P1000 for surgical specimens and P250 for biopsies, each equipped with two Plan-Apochromat lenses (x20 and x40) and an Adimec QUARTZ Q-12A180 camera, providing a resolution of 4096 × 3072 pixels (pixel size: 5.5 μm × 5.5 μm) for digital magnification by 1.6.
All 50 cases were scanned in .mrxs format at a resolution of 0.24 μm/pixel using the x20 lens with a digital magnification factor of 1.6, following a protocol consistent with routine diagnostic practices within the department.
2.4.2. Study Design
Three expert pathologists familiar with digital pathology performed a mitotic count (MC) on every slide. These experts are referred to as expert annotators. Discordance, defined as disagreement in scoring between the experts, was observed in 17 out of 50 slides. For these slides, a consensus was reached through joint review. Their identification of mitosis was made in accordance with the definitions proposed by Ibrahim et al [20].
Those slides were then submitted to two junior pathologists, referred to as investigators, who performed the MC and evaluated the MS of each slide. This evaluation was conducted on a crossover scheme where half of the cases were read without the algorithm and the other half with the algorithm and then reversed after the wash-out period. For both investigators, cases read with and without the algorithm in the first and second readings were opposed in each of the two phases. Investigators were free to perform their MC in the area that they considered most appropriate, even when using the algorithm. Investigators performed their reading blind to each other and to the expert consensus.
The study workflow is illustrated in Figure 2.
2.4.3. Statistical Analysis
First, we studied the accuracy of the MS. It is defined as the proportion of WSIs for which the investigator attributed a correct MS (e.g the same as the ground truth) over the total number of WSI. This accuracy is measured in two configurations: when investigators are assisted by IA, and when they are not. Then we focussed on the analysis of the agreement between investigators both on the MS and the MC. The measure of the investigators agreement on the MS was assessed with the Cohen’s kappa reproducibility together with its confidence interval (CI) on one hand, and with the Intraclass Correlation Coefficient (ICC) on the other hand. The agreement on the slide regions where the MC is performed is defined as the proportion of slides where the counting zones chosen by each investigator intersect.
We aim to evaluate whether the observed variability in MC can be attributed to the practice of different pathologists conducting their assessments in varying regions of the slides [21], and whether our tool has the potential to reduce this gap. For the reproducibility of the MC, the recommendations of Koo and Li [22] from 2016 were considered for interpretation of agreement. For reproducibility of the MS, McHugh’s 2012 recommendations [23] were used for interpretation of agreement. Accuracies, kappas, ICC and confidence intervals were calculated using package on R software (version 4.0.4, cran, The R Foundation for Statistical Computing, http://cran.r-project.org) and R Studio (version 2022.02.2 Build 485 © 2009-2022 RStudio, PBC, http://www.rstudio.com).
3. Results
3.1. Study Outcomes
In this clinical study conducted on a crossover scheme without and then with the aid of our detection pipeline on WSI breast IC without any draw of ROI, MS accuracy increased from 62% to 76% and from 64% to 78% for investigators 1 and 2 respectively when using AI assistance (Figure 3).
Corresponding linear weighted kappa increased from 0.378 to 0.629 and from 0.457 to 0.726 for investigator 1 and 2 respectively (Figure 3a-3b, raw confusion matrices can be found in Supplementary Material 1 and 2).
Reproducibility on the MS, evaluated by measuring the weighted Cohen’s kappa (CK) between investigators, increased from 0.482 to 0.672 when using AI assistance. This is supported by the ICC evolution from 0.591 (CI: [0.375 - 0.746]) to 0.883 (CI: [0.803 - 0.932]) and their confidence intervals. (Figure 3c, raw confusion matrices can be found in Supplementary Material 3 and 4).
The agreement between investigators on these ”counting zones”, defined as the existence of an intersection between investigators counting zones, increased from 44% to 60% when using IA (Figure 3d). In 18% of cases, scores changed with the use of AI (8 and 10 for investigators 1 and 2, respectively).
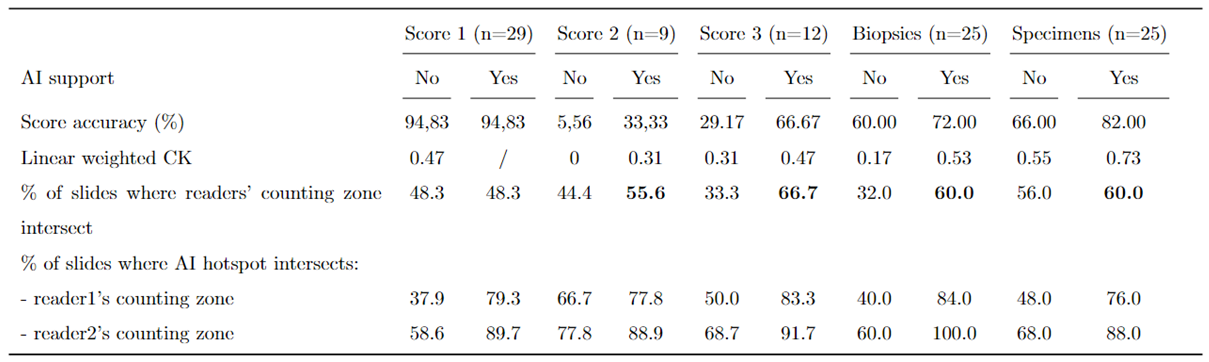
Metrics are computed for subgroups of slides that have the same ground truth MS (1, 2 or 3). Since tumor size differs between biopsies and specimens, results obtained for each type were also analyzed as shown in Table 3.
AI led to an improvement on accuracy (resp. kappa) from 5.56% to 33.3% (resp. from 0 to 0.31) for WSI with a MS of 2 and from 29.17% to 66.67% (resp. from 0.31 to 0.47) for WSI with a MS of 3. It did not change accuracy and kappa for WSI with MS of 1.
It also led to improvement on accuracy (resp. kappa) for both biopsies and specimens going from 60% to 72% (resp. 0.17 to 0.53) and 66% to 82% (resp. 0.55 to 0.73).
Over all subgroups, the biggest improvement for investigators counting zones’ intersection is found for WSI with MS of 3, going from 33.3% to 66.7%.
The agreement between investigators and IA, computed as the proportion of slides for which the investigator’s counting zone intersects an IA hotspot, increased from 46% to 80% for investigator 1 and from 62% to 90% for investigator 2. Figure 4 is an illustration of counting zone intersections, different situations were observed, both on biopsies as surgical WSI: help to find MH (Figure 4a), refining in MC even when a significant hotspot is found (Figure 4b).
4. Discussion
The clinical study here reported proves that the automatic mitosis detection pipeline developped and applied is a valuable support for pathologists in assessing mitotic scores. With AI assistance, pathologists achieve greater accuracy and reproducibility.
Numerous studies have focused on automatic mitosis detection. Several have applied standard computer vision techniques to detect or classify mitoses on WSIs. For instance, in the works of Irshad [24], F. Boray Tek [25], and Veta and al. [? ], nuclei are located using conventional image processing techniques such as active contour models or thresholding, and handcrafted features are used to determine whether they are mitoses. As Mathew and al. [26] stated, deep learning techniques gained prominence in the mid-2010s. Most studies employ deep networks for localization [5,27] or segmentation [28,29] to locate mitotic cells, followed by a classification model to remove false positives. Typically, these algorithms are calibrated and tested on public datasets such as CCMCT [30], MITOS [31], or MITOS-ATYPIA [32]. The MIDOG2021 [14] challenge also released a public dataset with mitoses labeled from WSI originating from various scanners. Although these studies report promising analytical performance, they do not demonstrate increased accuracy and reproducibility or pathologists using such software in routine practice on WSI without any prior intervention from the pathologist to propose regions of interest to analyse. Pantanowitz et al. [33] showed that pathologists were more accurate and efficient in quantifying mitotic figures in digital images of IC with AI assistance.
However, the count was performed on pre-extracted fields of invasive carcinoma, and the assistance provided by AI in finding relevant mitotic hotspots was not assessed, despite its crucial role in determining the mitotic score. A study by Veta and Van Diest [34] compared mitotic counting results with and without AI assistance by two pathologists using both WSI and light microscopy. It showed that WSI mitotic counts are more comparable to light microscopy counts when using AI. However, the pathologist had to interactively draw the area of interest (ROI) which was not automatically proposed. Balkenhol’s study [35] demonstrated a strong agreement between two pathologists in determining the mitotic score using AI-determined mitotic hotspots. However, the assessment was limited to a predefined 2 mm² hotspot area, not the entire slide as would be typical in routine practice. All these studies have three clear limitations. First, mitotic detection is performed on limited infiltrative carcinomatous patch regions, requiring pathologists to manually define the ROI. For efficient assistance, mitosis detection should be included in a WSI processing workflow that detects infiltrative carcinoma, locates mitoses within the infiltrative tumor, proposes hotspots, and facilitates mitotic counting within the selected hotspot. Second, public datasets are assumed to be composed of research-quality slides with clear mitotic figures, whereas routine data may be more challenging for mitotic detection. Finally, the assistance provided to pathologists by such tools has not been yet adequately evaluated.
Our algorithm’s performance demonstrates moderate recall and low precision, attributable to two factors. First, to address real-world scenarios and the inherent imbalance in WSI, we assessed our algorithm on a highly imbalanced dataset consisting of 153 mitotic patches and over 24,000 non-mitotic patches. This fundamental difference from the MIDOG test dataset results in lower raw metrics compared to the best results achieved in the MIDOG challenge using the same pipeline. Additionally, as mentioned in Section 3, the annotation process can be improved, as many objects identified as false positives are actually mitoses that were not labeled due to oversight. Although not every mitosis is detected and some false positives exist, the pipeline allows pathologists to quickly identify mitotic patterns and relevant hotspots. Accuracy in mitotic score is notably improved for both investigators when assisted by AI. For example, investigator 1’s accuracy increased from 62% without AI support to 76% with AI support (Figure 3a,b).
Measured Cohen’s kappa coefficients confirmed that score reproducibility between investigators and consensus is significantly higher with AI support, improving from low and minimal (k=0.378 and 0.457) to moderate (k=0.629 and k=0.726) for both investigators, according to McHugh’s 2012 recommendations. Notably, the levels of agreement achieved by investigators when assisted by AI were comparable to those between each pair of experts determining the consensus.
Table 3 shows that reproducibility depends on the slide score. Without AI, reproducibility is much higher for WSI with score 1 (kappa over 0.47 and accuracy over 94%) than for other scores. AI support significantly benefits WSI with a mitotic score of 2 and 3, leading to a 500% and 130% improvement in accuracy (kappa +0.31 and +0.16, respectively). The complexity of determining the mitotic score is closely tied to the level of mitotic activity. For slides with small tumors and few mitoses, the score may be straightforward to determine, but it becomes more complicated for intermediate and high-score cases.
Furthermore, results in Table 3 indicate that the accuracy of mitotic score assessment is generally higher for specimens compared to biopsies, regardless of AI support. However, AI improves accuracy for both sample types, increasing from 60% to 72% for biopsies and from 66% to 82% for specimens. On biopsies, the selection of hotspots is more limited, yielding higher reproducibility compared to surgical specimens where the search area is broader.
In this study, pathologists were provided with automatically located hotspots as possible starting points for their mitotic count but were free to choose other regions. Figure 3d shows that in the majority of cases, pathologists began their count in hotspots proposed by the algorithm (80% for investigator 1 and 90% for investigator 2).
Correspondingly, Figure 3c shows that agreement on counting zones between investigators increases with AI support (from 0.482 to 0.672), regardless of the mitotic score or WSI type. AI thus enhances reproducibility among pathologists. This finding is consistent with Balkenhol et al.’s study, which demonstrated strong agreement with a kappa coefficient of 0.814 (95% CI: 0.719 - 0.919) between two pathologists in determining mitotic scores. However, the kappa values are not directly comparable to our study as the assessment was limited to a predefined 2 mm² area rather than the entire slide.
Overall, these findings highlight the potential of AI support to improve accuracy and reliability in mitotic score assessment, especially for WSI with moderate to high mitotic scores.
A primary limitation of this study is the number of investigators. In the near future, a multicentric study with numerous participants will be conduct. Technically, we will work on model generalization, possibly using cycleGANs, as they have been shown to produce source-agnostic models [36]. Another limitation could be partially due to the quality of the data used to train and test the algorithms. Immunohistochemical pHH3 staining could be used to facilitate the learning to recognize mitoses on WSI by pathologists and so ease the labeling process [21]. Additionally, improving the algorithms using loss functions or frameworks better suited to noisy and imbalanced labels is a potential area for enhancement.
This study focuses on the mitotic count and score on WSI. International recommendations [8] agree with making this score on a glass slide or a WSI. However, several publications report variations between glass slides and WSI [37,38,39,40,41]. Since then, studies published by the Nottingham group proved that the identification of mitosis on glass slides and on WSI did not follow from another and that learning to recognize mitoses on WSI is a necessary step when transition to digital pathology. It would be interesting to extend the results of this study to glass slides to determine if similar differences are observed when using this AI tool. We could even assume that the use of AI on WSI reduces these variations and even more improves the reproducibility of the results obtained by pathologists.
Author Contributions
L.G. and S.P. provided labelled data to train algorithms; C.S. and N.P. developed the corresponding algorithms; C.S., L.G., S.P., M.S. and N.P performed study concept and design; L.G., M.D., S.P., M.L.T. and C.M. participated in the study, as investigators and experts; C.S and N.P. provided analysis and interpretation of data, and statistical analysis; C.S., N.P., R.P., S.S., A.G., M.S., L.G. and S.P. performed development of methodology and writing, review and revision of the paper; All authors read and approved the final paper.
Funding
“This research received no external funding”
Institutional Review Board Statement
“Not applicable”
Informed Consent Statement
“Informed consent was obtained from all subjects involved in the study.”
Data Availability Statement
The data presented in this study are available on request from the corresponding author.
Conflicts of Interest
“The authors declare no conflicts of interest.”
Abbreviations
The following abbreviations are used in this manuscript:
| WSI | Whole Slide Images |
| IC | Invasive Carcinoma |
| MS | Mitotic Score |
| MC | Mitotic Count |
| MH | Mitotic Hotspot |
| SFP | French Society of Pathology |
| CNN | Convolutionnal Neural Networks |
| HE | Hematoxylin Eosin |
| HES | Hematoxylin Eosin Safran |
| CI | Confidence Interval |
| ICC | Intraclass Correlation Coefficient |
| CK | Cohen’s Kappa |
Appendix A
Figure A1.
Cross comparisons for interobserver agreement for mitotic scores between investigator 1 and expert consensus with and without algorithm.
Figure A1.
Cross comparisons for interobserver agreement for mitotic scores between investigator 1 and expert consensus with and without algorithm.
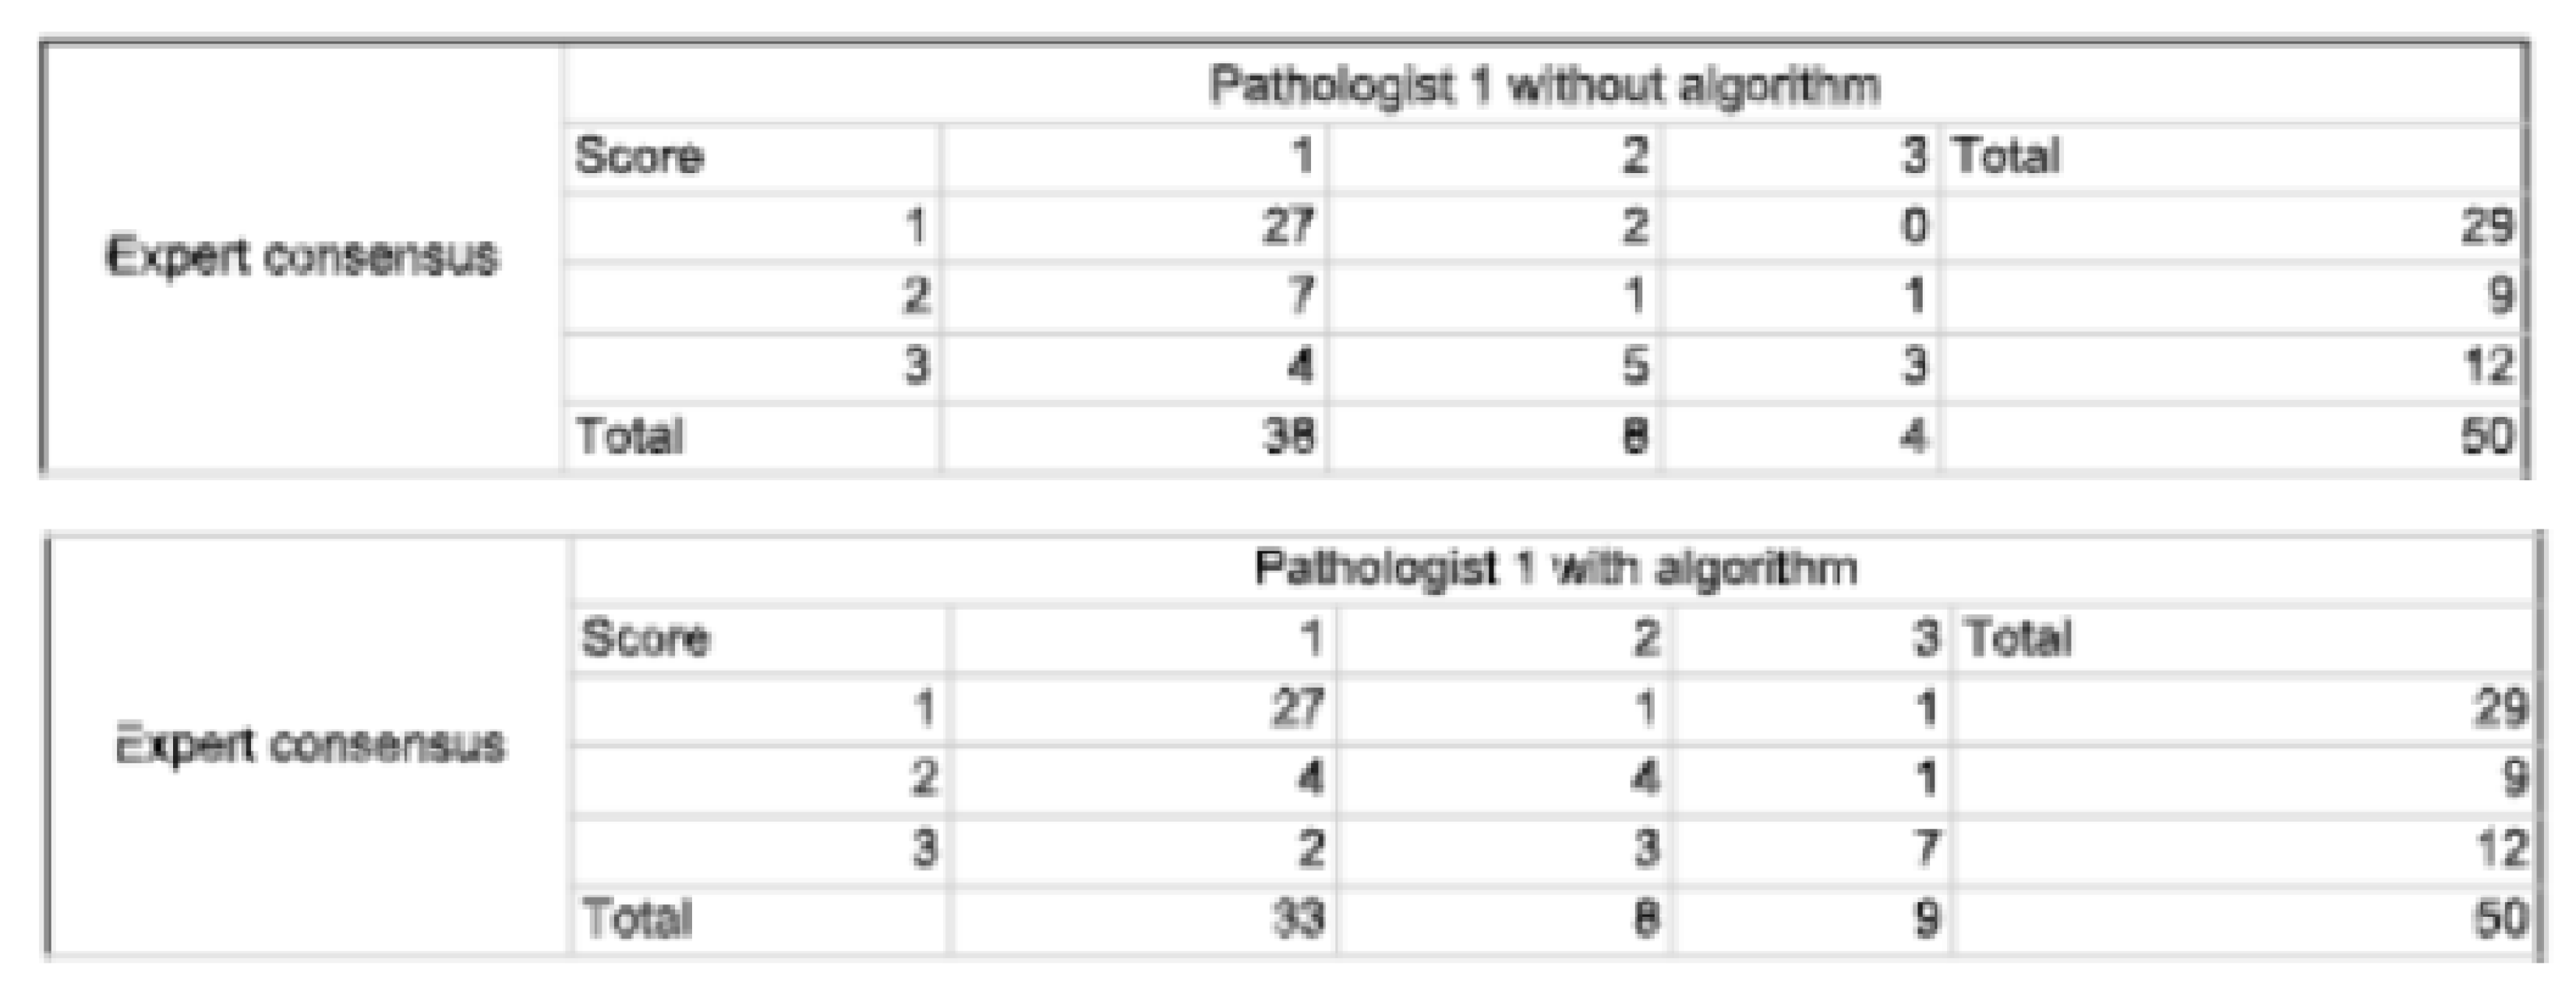
Figure A2.
Cross comparisons for interobserver agreement for mitotic scores between investigator 2 and expert consensus with and without algorithm.
Figure A2.
Cross comparisons for interobserver agreement for mitotic scores between investigator 2 and expert consensus with and without algorithm.
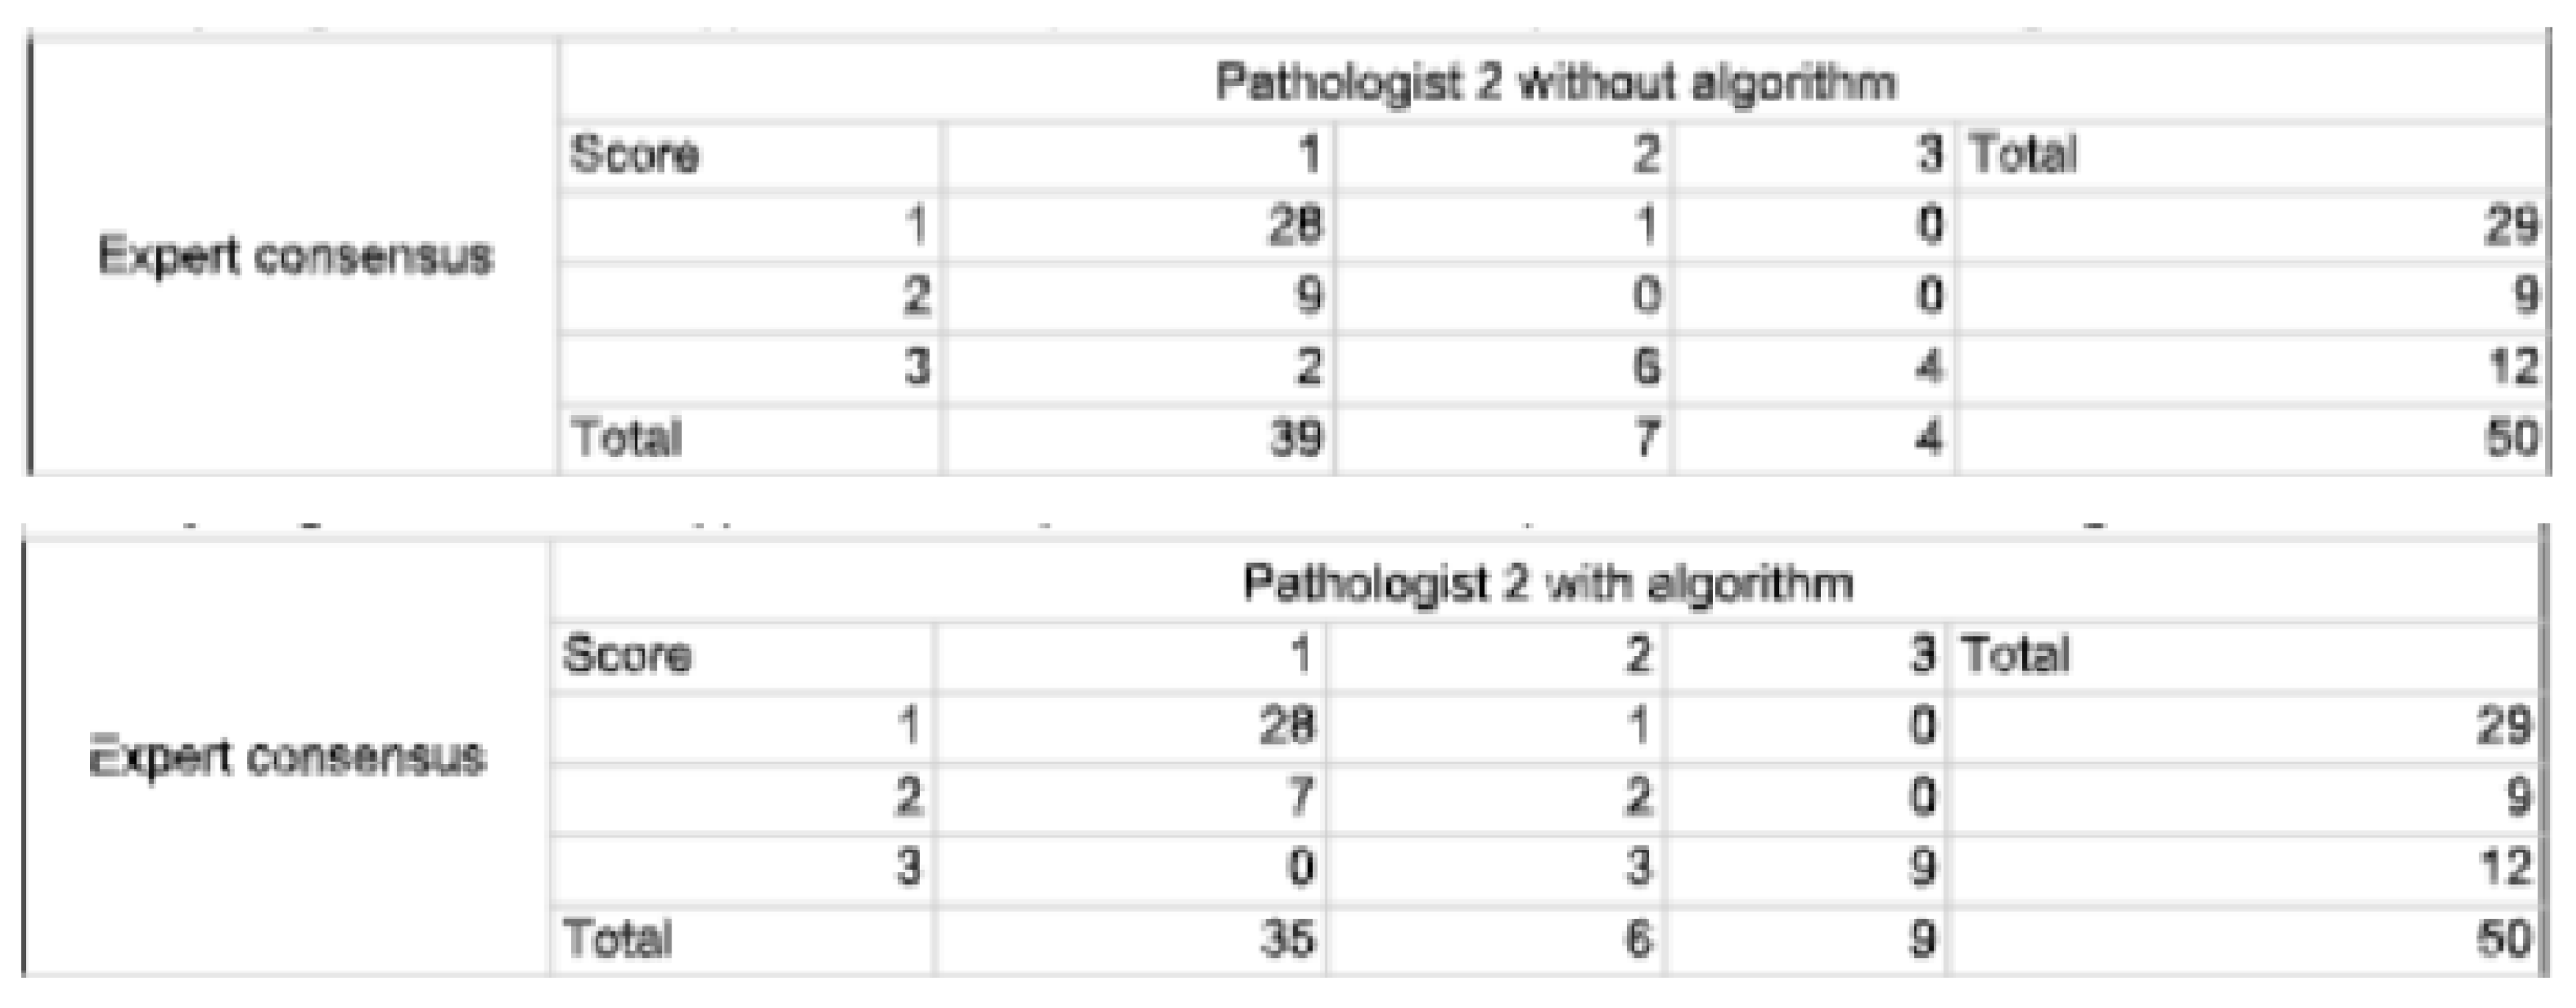
Figure A3.
Cross comparisons for interobserver agreement for mitotic scores between investigators 1 and 2 without algorithm.
Figure A3.
Cross comparisons for interobserver agreement for mitotic scores between investigators 1 and 2 without algorithm.
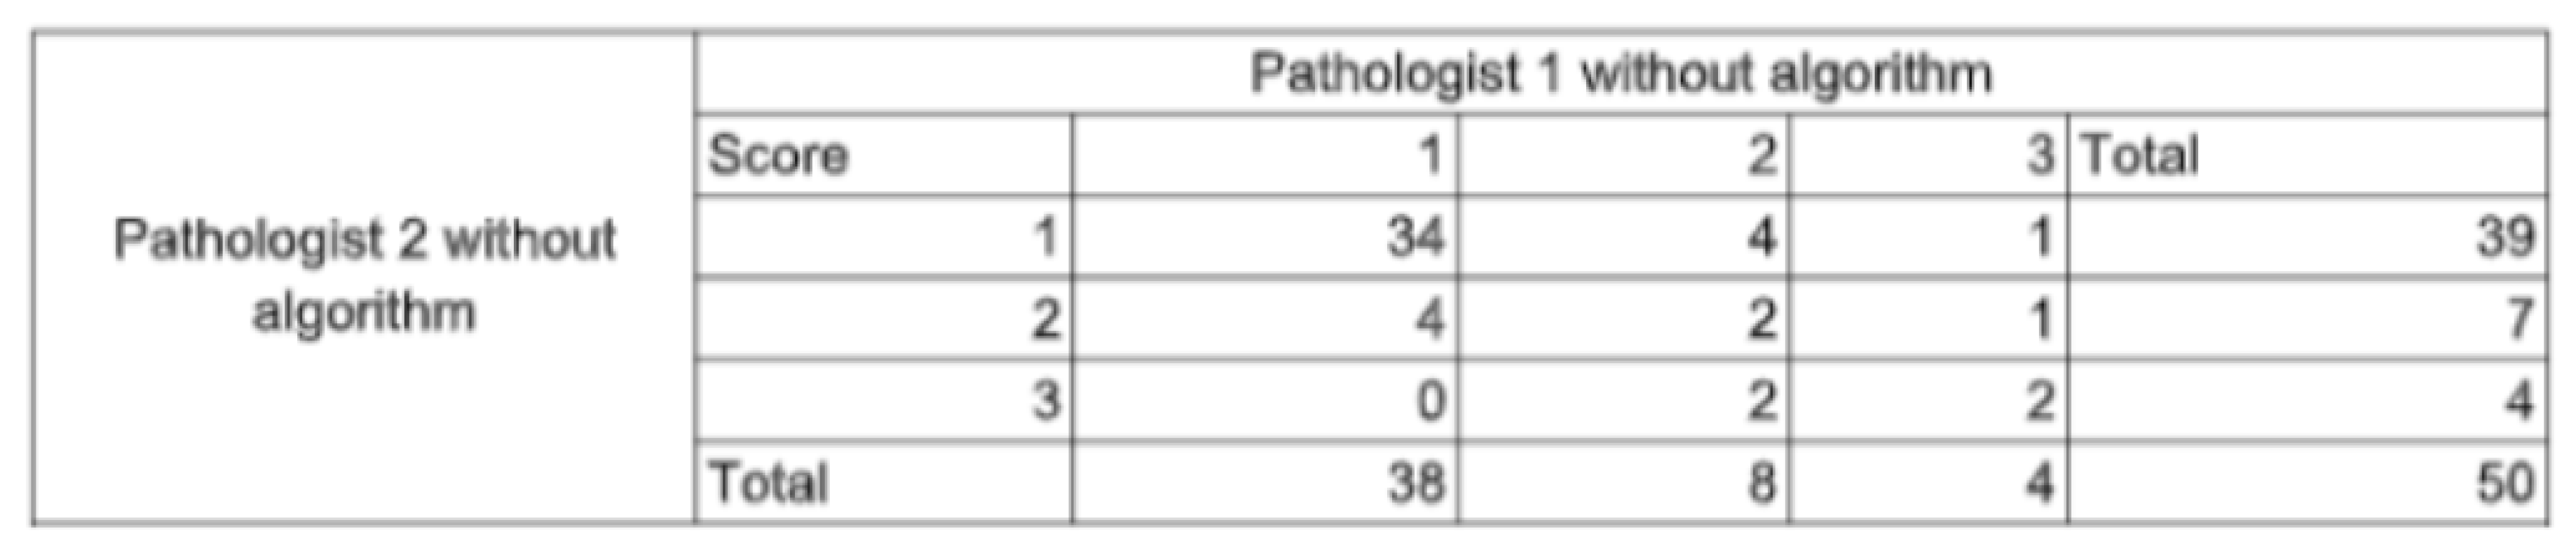
Figure A4.
Cross comparisons for interobserver agreement for mitotic scores between investigators 1 and 2 without algorithm.
Figure A4.
Cross comparisons for interobserver agreement for mitotic scores between investigators 1 and 2 without algorithm.
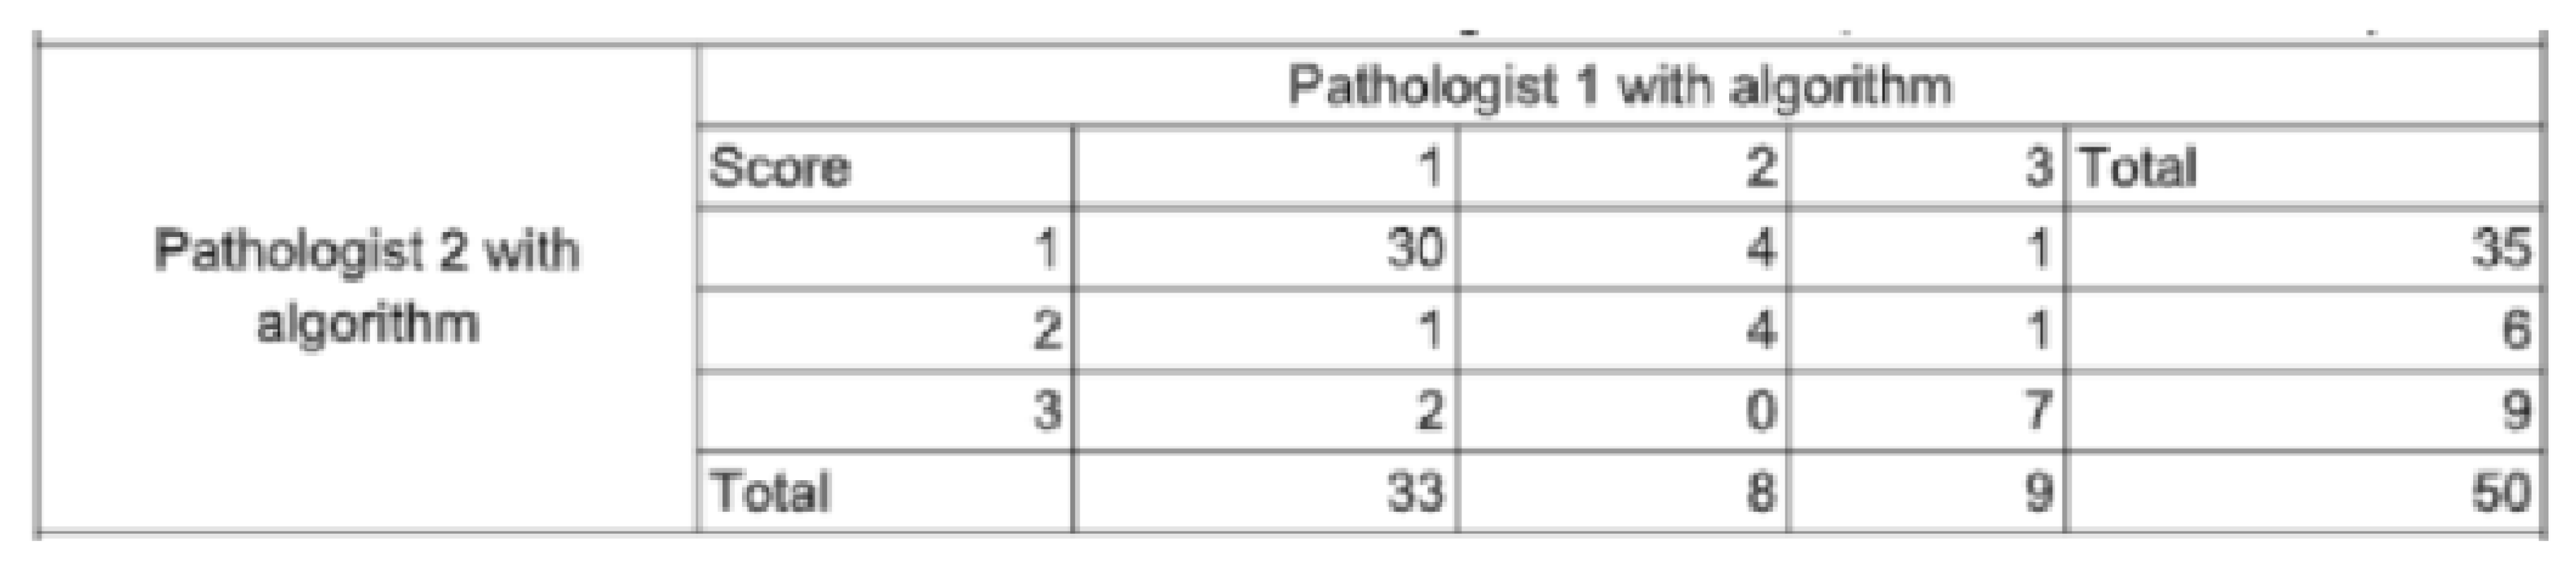
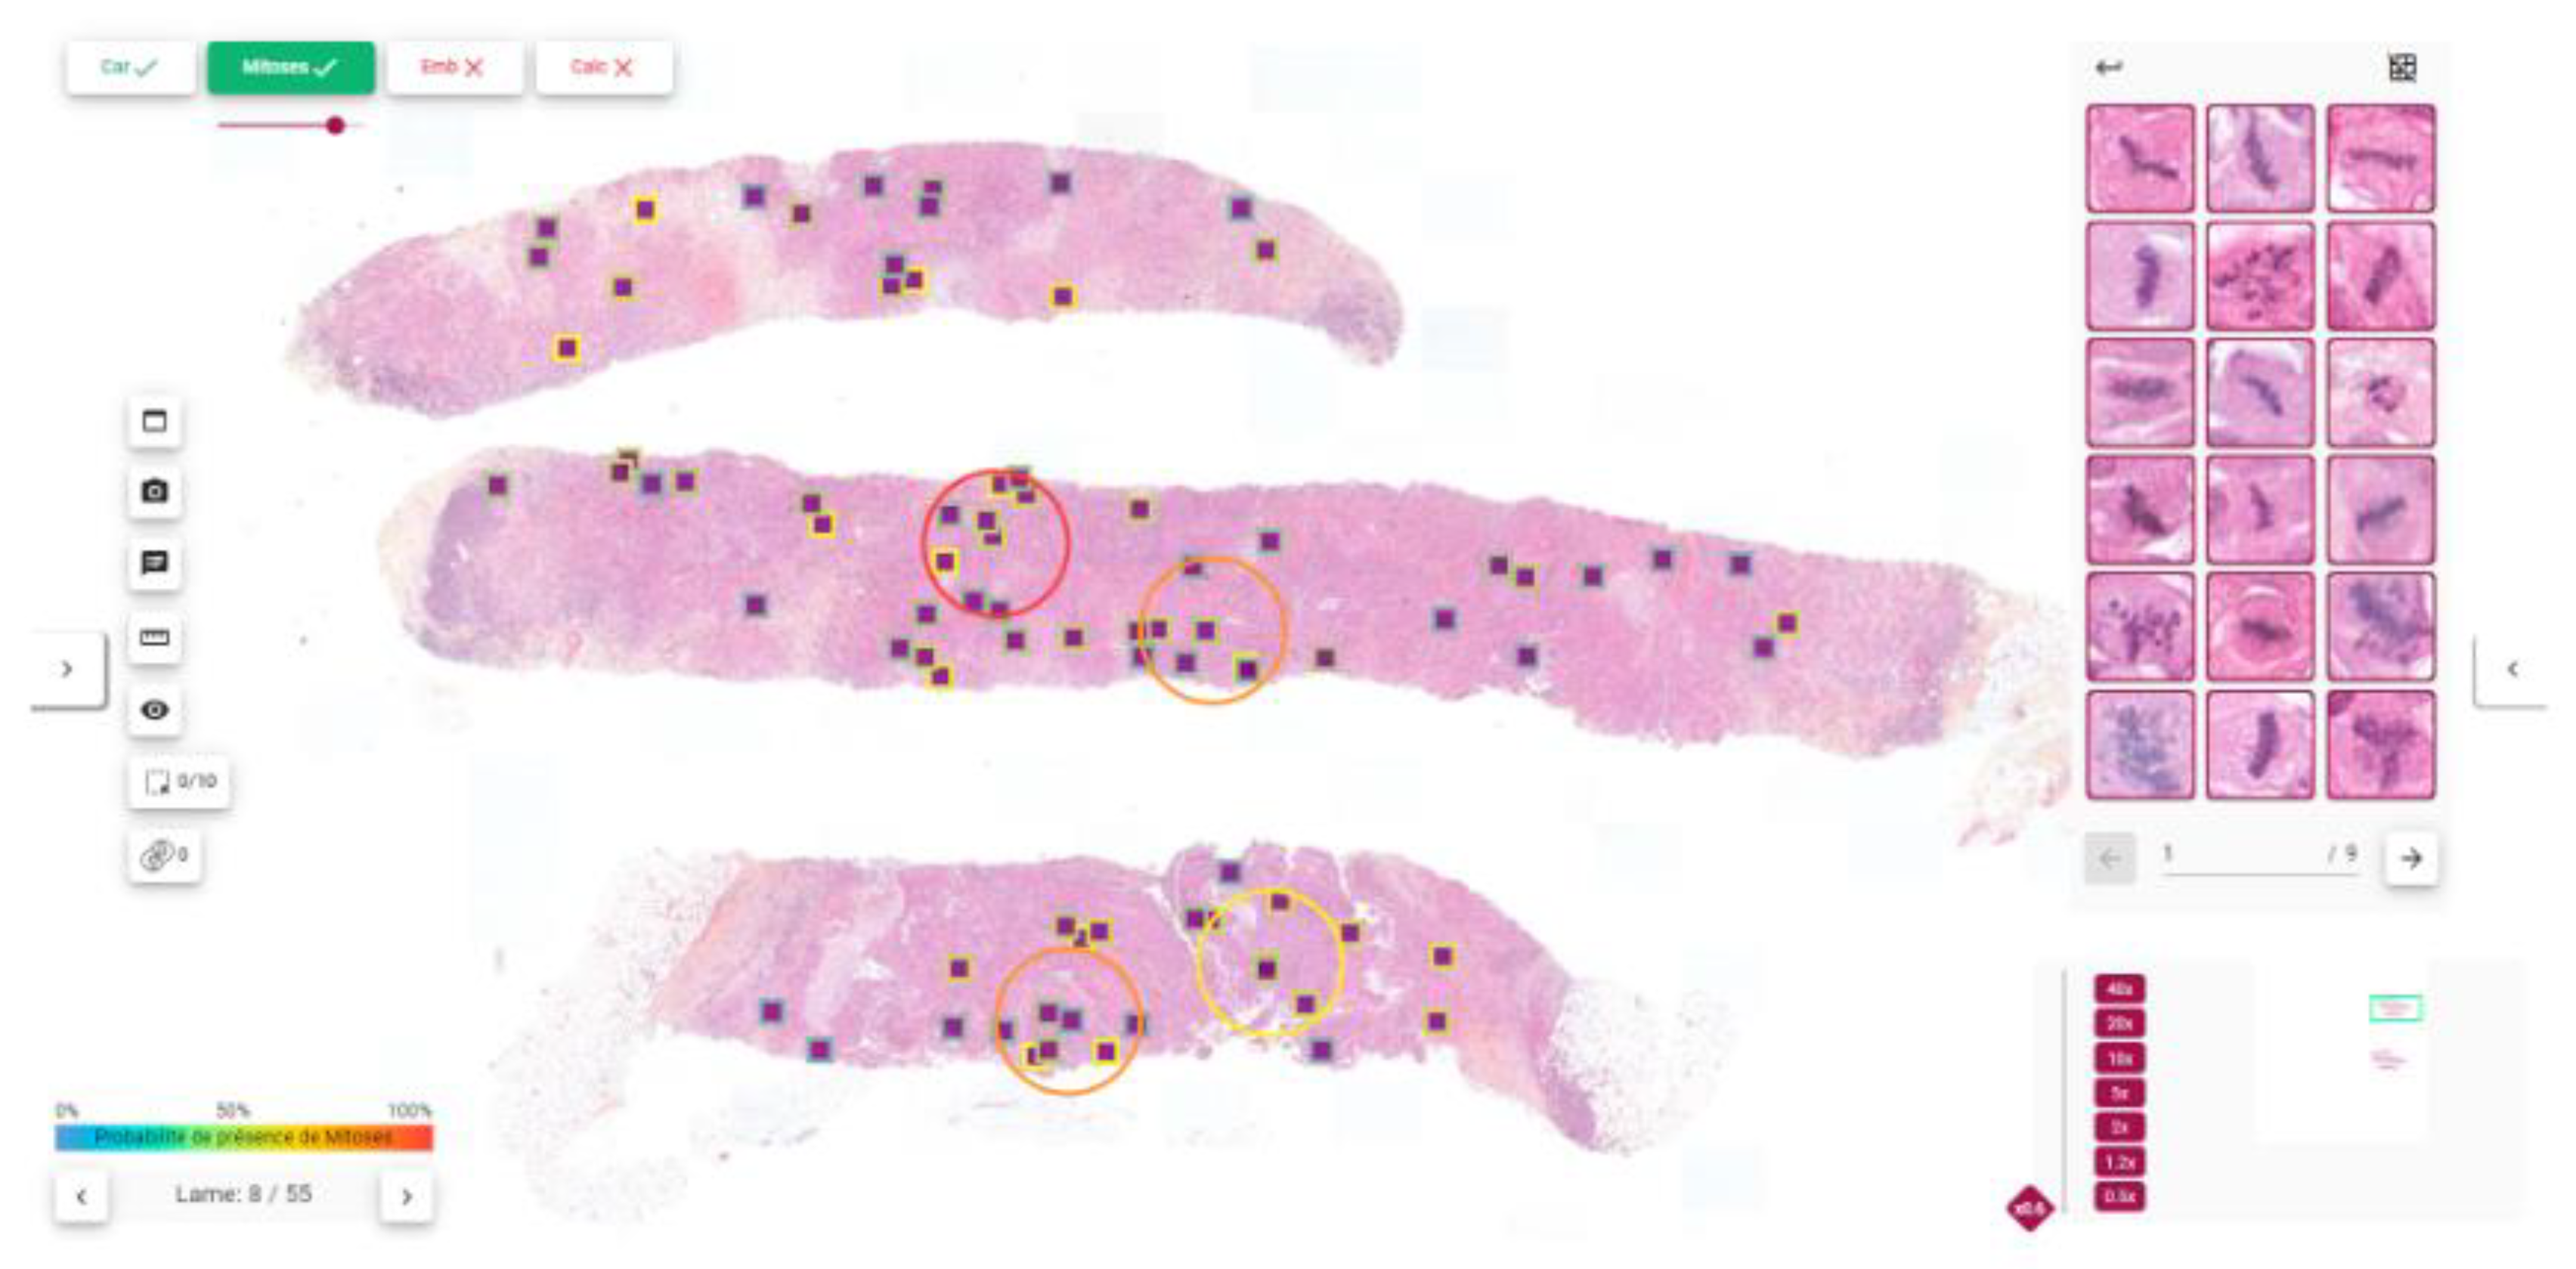
Figure A5.
Results displayed in the in-house interface. Mitosis appear as small purple squares with contour colored based on their classification confidence score. They can also be seen in the right panel for easy identification navigation between objects. Hotspots are displayed as colored circles, colors corresponding to their density score which lies between 0 and 100.
References
- Cruz-Roa, A. Basavanhally, F. Gonz´alez, H. Gilmore, M. Feldman, S. Ganesan, N. Shih, J. Tomaszewski, A. Madabhushi, Automatic detection of invasive ductal carcinoma in whole slide images with convolutional neural networks, in: M. N. Gurcan, A. Madabhushi (Eds.), SPIE Proceedings, SPIE, 2014. [CrossRef]
- Y. Celik, M. Talo, O. Yildirim, M. Karabatak, U. R. Acharya, Automated invasive ductal carcinoma detection based using deep transfer learning with whole-slide images, Pattern Recognition Letters 133 (2020) 232–239.
- S. S. S.-F. K.-J. J. A. C. B. Y. D. C. B. T. D. L. G. E. L. M. S. S. P. Rémy Peyret, Nicolas Pozin, Multicenter automatic detection of invasive carcinoma on breast whole slide images, PLOS (2023). [CrossRef]
- P. Sun, J. hua He, X. Chao, K. Chen, Y. Xu, Q. Huang, J. Yun, M. Li, R. Luo, J. Kuang, H. Wang, H. Li, H. Hui, S. Xu, A computational tumor infiltrating lymphocyte assessment method comparable with visual reporting guidelines for triple-negative breast cancer, EBioMedicine 70 (2021).
- J. Liang, C. Wang, Y. Cheng, Z. Wang, F. Wang, L. Huang, Z. Yu, Y. Wang, Detecting mitosis against domain shift using a fused detector and deep ensemble classification model for MIDOG challenge, CoRR abs/2108.13983 (2021). arXiv:2108.13983.
- M. Clavel, S. Sockeel, M. Sockeel, C. Miquel, J. Adam, E. Lanteri, N. Pozin, Automatic detection of microcalcifications in whole slide image - comparison of deep learning and standard computer vision approaches (2023). [CrossRef]
- W. Elston, I. O. Ellis, Pathological prognostic factors in breast cancer. i. the value of histological grade in breast cancer: experience from a large study with long-term follow-up. c. w. elston & i. o. ellis. 19 histopathology 1991; 19; 403–410, Histopathology 41 (3a) (2002) 151–151. [CrossRef]
- WHO Classification of Tumours Editorial Board, Breast Tumours, 5th Edition, Vol. 2 of WHO Classification of Tumours, World Health Organization, 2019.
- E. A. Rakha, R. Bennett, D. Coleman, S. E. Pinder, I. O. Ellis, Review of the national external quality assessment (eqa) scheme for breast pathology in the uk, Journal of Clinical Pathology 70 (2016) 51 – 57.
- A. B. J. V. d. L. L. P. J. K. L. J. Y. C. B. D. L. E. C. E. A. B. F. r. F. F. R. G. D. M. D. J. H. M. D. H. E. H. K. A. I. A. K. M. K. M. E. S. J. H. S. J. M. T. B. W. C. C.-S. V. S.-T. A. L. J. A.-F. J. S. M Alvaro Berb´ıs, David S McClintock, Computational pathology in 2030: a delphi study forecasting the role of ai in pathology within the next decade, EBioMedicine 88 (2023) 104427, open Access. [CrossRef]
- W. W. . H. L. X. T. C. Z. F. X. B. L. Y. J. X. L. W. X. Zhiqiang Li, Xiangkui Li, A novel dilated contextual attention module for breast cancer mitosis cell detection, Frontiers in Physiology 15 (2024) 1337554, section: Computational Physiology and Medicine. [CrossRef]
- R. Subramanian, R. D. Rubi, R. Tapadia, K. Karthik, M. F. Ahmed, A. Manudeep, Web based mitosis detection on breast cancer whole slide images using faster r-cnn and yolov5, International Journal of Advanced Computer Science and Applications 13 (12), web based Mitosis Detection on Breast Cancer Whole Slide Images using Faster R-CNN and YOLOv5 (2022).
- M. Jahanifar, A. Shephard, N. Zamanitajeddin, S. Graham, S. E. A. Raza, F. Minhas, N. Rajpoot, Mitosis detection, fast and slow: Robust and efficient detection of mitotic figures, Medical Image Analysis 94 (2024).
- M. Aubreville, Mitosis domain generalization in histopathology images — the MIDOG challenge, Medical Image Analysis 84 (2023) 102699. [CrossRef]
- Cytomine, https://cytomine.com/, accessed: 2023-03-13.
- R. Peyret, N. Pozin, S. Sockeel, S.-F. Kammerer-Jacquet, J. Adam, C. Bocciarelli, Y. Ditchi, C. Bontoux, T. Depoilly, L. Guichard, E. Lanteri, M. Sockeel, S. Pr´evot, Multicenter automatic detection of invasive carcinoma on breast whole slide images, PLOS Digit Health 2 (2) (2023) e0000091, published online 2023 Feb 28. [CrossRef]
- T.-Y. Lin, P. Goyal, R. Girshick, K. He, P. Doll´ar, Focal loss for dense object detection (2017). [CrossRef]
- A. G. Howard, M. Zhu, B. Chen, D. Kalenichenko, W. Wang, T. Weyand, M. Andreetto, H. Adam, Mobilenets: Efficient convolutional neural networks for mobile vision applications (2017). [CrossRef]
- P. Kingma, J. Ba, Adam: A method for stochastic optimization (2014). [CrossRef]
- Ibrahim, A. Lashen, M. Toss, R. Mihai, E. Rakha, Assessment of mitotic activity in breast cancer: revisited in the digital pathology era, Journal of Clinical Pathology 75 (6) (2022) 365–372, epub 2021 Sep 23.
- A. Bertram, M. Aubreville, T. A. Donovan, A. Bartel, F. Wilm, C. Marzahl, C.-A. Assenmacher, K. Becker, M. Bennett, S. Corner, B. Cossic, D. Denk, M. Dettwiler, B. G. Gonzalez, C. Gurtner, A.-K. Haverkamp, A. Heier, A. Lehmbecker, S. Merz, E. L. Noland, S. Plog, A. Schmidt, F. Sebastian, D. G. Sledge, R. C. Smedley, M. Tecilla, T. Thai-wong, A. Fuchs-Baumgartinger, D. J. Meuten, K. Breininger, M. Kiupel, A. Maier, R. Klopfleisch, Computer-assisted mitotic count using a deep learning–based algorithm improves interobserver reproducibility and accuracy, Veterinary Pathology 59 (2) (2022) 211–226, pMID: 34965805. [CrossRef]
- T. K. Koo, M. Y. Li, A guideline of selecting and reporting intraclass correlation coefficients for reliability research, Journal of Chiropractic Medicine 15 (2) (2016) 155–163, epub 2016 Mar 31. [CrossRef]
- M. L. McHugh, Interrater reliability: the kappa statistic, Biochemia Medica (Zagreb) 22 (3) (2012) 276–282, pMCID: PMC3900052. [CrossRef]
- et al., Automated mitosis detection in histopathology using morphological and multi-channel statistics features (2013). [CrossRef]
- F. B. Tek, Mitosis detection using generic features and an ensemble of cascade adaboosts, Journal of Pathology Informatics 4 (1) (2013. [CrossRef]
- T. Mathew, J. R. Kini, J. Rajan, Computational methods for automated mitosis detection in histopathology images: A review, Biocybernetics and Biomedical Engineering 41 (1) (2021) 64–82. [CrossRef]
- A. Ibrahim, A. Lashen, A. Katayama, R. Mihai, G. Ball, M. Toss, E. Rakha, Defining the area of mitoses counting in invasive breast cancer using whole slide image, Modern Pathology 35 (2021) 1–10. [CrossRef]
- S. Yang, F. Luo, J. Zhang, X. Wang, Sk-unet model with fourier domain for mitosis detection (2021). [CrossRef]
- G. Roy, J. Dedieu, C. Bertrand, A. Moshayedi, A. Mammadov, S. Petit, S. B. Hadj, R. H. J. Fick, Robust mitosis detection using a cascade mask-rcnn approach with domain-specific residual cycle-gan data augmentation (2021). [CrossRef]
- M. Aubreville, C. Bertram, C. Marzahl, A. Maier, R. Klopfleisch, A large-scale dataset for mitotic figure assessment on whole slide images of canine cutaneous mast cell tumor, Scientific Data 6 (2019) 1–9. [CrossRef]
- Mitosis detection in breast cancer histological images (mitos dataset), http://ludo17.free.fr/mitos2012/dataset.html, accessed : 2023 − 03 −13.
- Mitos atypia 14 contest, https://mitos-atypia-14.grand-challenge.org/Dataset/, accessed: 2023-03-13.
- L. X. Pantanowitz, D. J. Hartman, Y. Qi, E. Y. Cho, B. Suh, K. Paeng, R. Dhir, P. M. Michelow, S. Hazelhurst, S. Y. Song, S. Y. Cho, Accuracy and efficiency of an artificial intelligence tool when counting breast mitoses, Diagnostic Pathology 15 (2020).
- S. A. van Bergeijk, N. Stathonikos, N. D. ter Hoeve, M. W. Lafarge, T. Q. Nguyen, P. J. van Diest, M. Veta, Deep learning supported mitoses counting on whole slide images: A pilot study for validating breast cancer grading in the clinical workflow, Journal of Pathology Informatics 14 (2023) 100316. [CrossRef]
- M. C. A. Balkenhol, D. Tellez, W. Vreuls, P. C. Clahsen, H. Pinckaers, F. Ciompi, P. Bult, J. A. W. M. van der Laak, Deep learning assisted mitotic counting for breast cancer, Laboratory InvestigationPMID: 31222166 (2019). [CrossRef]
- N. Nerrienet, R. Peyret, M. Sockeel, S. Sockeel, Standardized cyclegan training for unsupervised stain adaptation in invasive carcinoma classification for breast histopathology (2023). [CrossRef]
- B. Williams, A. Hanby, R. Millican-Slater, E. Verghese, A. Nijhawan, I. Wilson, J. Besusparis, D. Clark, D. Snead, E. Rakha, D. Treanor, Digital pathology for primary diagnosis of screen-detected breast lesions - experimental data, validation and experience from four centres, Histopathology 76 (7) (2020) 968–975, epub 2020 May 12. [CrossRef]
- O. G. Shaker, L. H. Kamel, M. A. Morad, S. M. Shalaby, Reproducibility of mitosis counting in breast cancer between whole slide images and glass slides, Pathology - Research and Practice 216 (6) (2020) 152993. [CrossRef]
- A. Ibrahim, A. Lashen, M. Toss, R. Mihai, E. Rakha, Assessment of mitotic activity in breast cancer: revisited in the digital pathology era, Journal of Clinical Pathology 75 (6) (2022) 365–372, epub 2021 Sep 23. [CrossRef]
- P. S. Ginter, Y. J. Lee, A. Suresh, G. Acs, S. Yan, E. S. Reisenbichler, Mitotic count assessment on whole slide images of breast cancer: a comparative study with conventional light microscopy, American Journal of Surgical Pathology 45 (12) (2021) 1656–1664. [CrossRef]
- A. Rakha, M. S. Toss, D. Al-Khawaja, K. Mudaliar, J. R. Gosney, I. O. Ellis, Impact of whole slide imaging on mitotic count and grading of breast cancer: a multi-institutional concordance study, Journal of Clinical Pathology 71 (10) (2018) 895–901. [CrossRef]
Figure 2.
2a: process for consensus establishment. 2b: process for pathologist readings with and without AI support.
Figure 2.
2a: process for consensus establishment. 2b: process for pathologist readings with and without AI support.
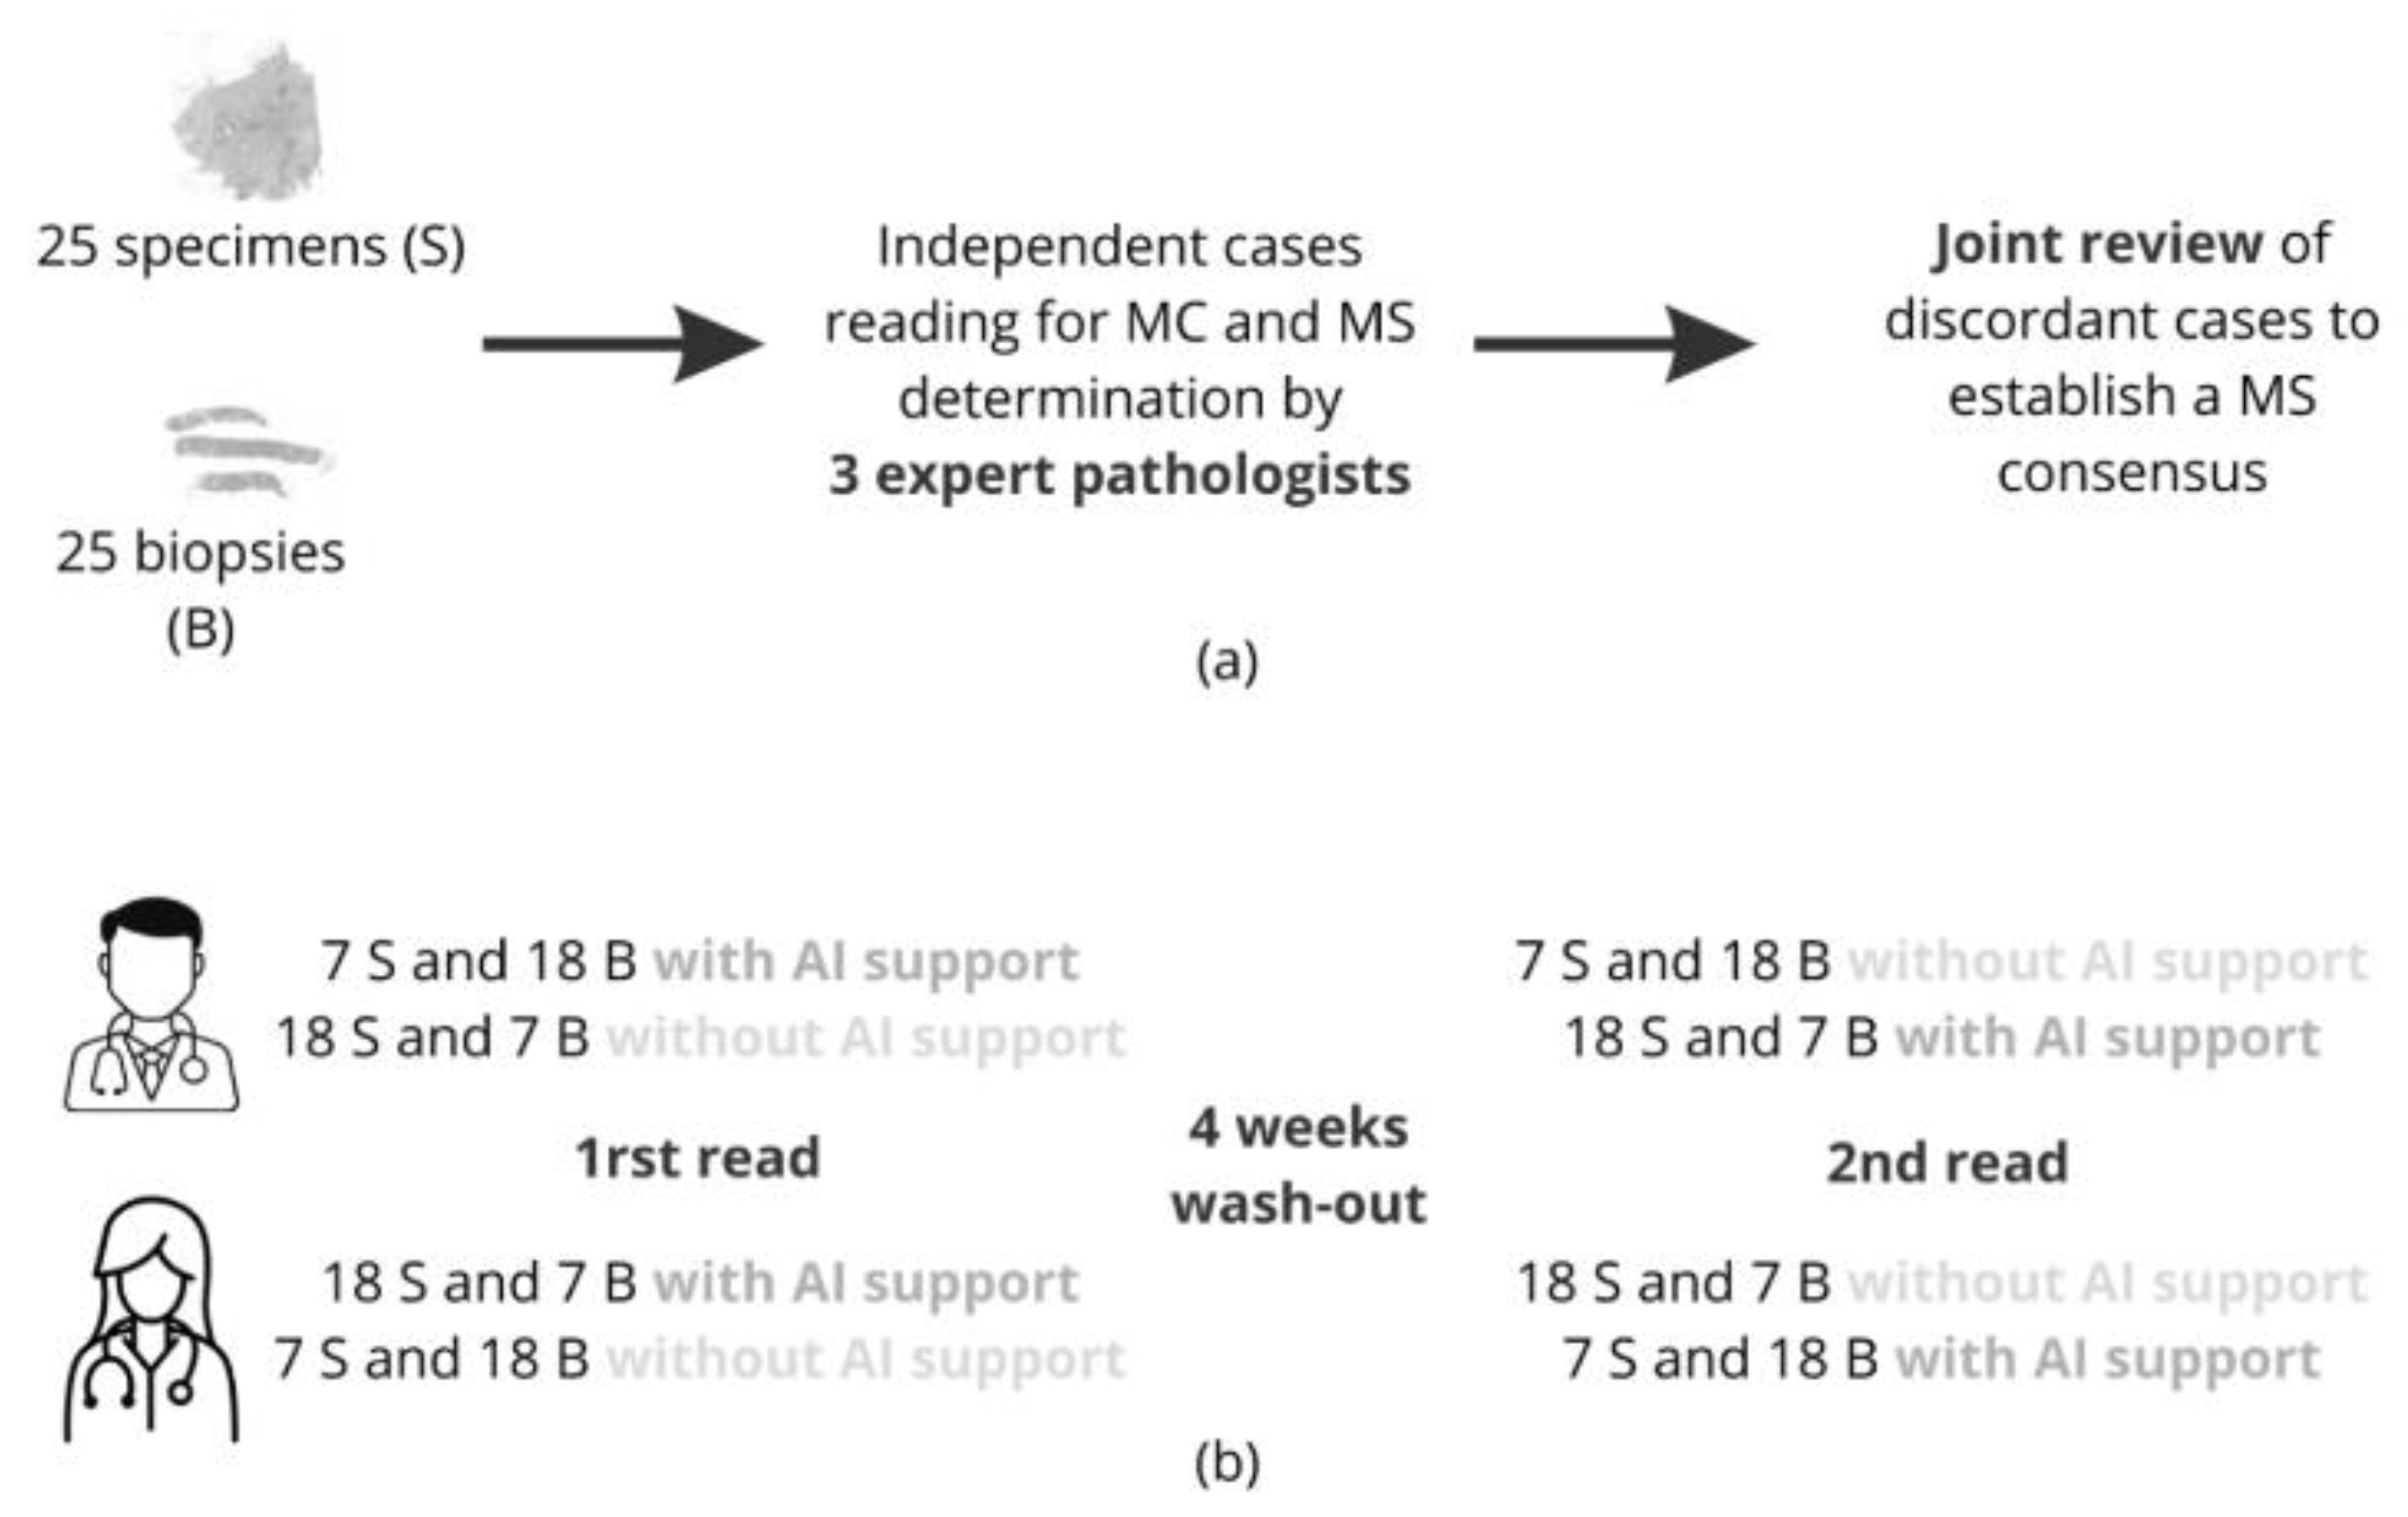
Figure 3.
3a mitotic score accuracy for each reader compared to the ground truth consensus, with and without AI support. 3b linear weighted Cohen’s Kappa values for each reader compared to consensus. 3c ICC and linear weighted Cohen’s Kappa values computed between readers, with and without AI support. 3d percentage of slides where both readers counting zones intersect (Reader1 ∩ Reader1), with and without AI and the percentage of slides where an AI hotspot intersects a reader’s counting zone, for both readers, with and without AI support (AI∩Reader1 and AI∩Reader2).
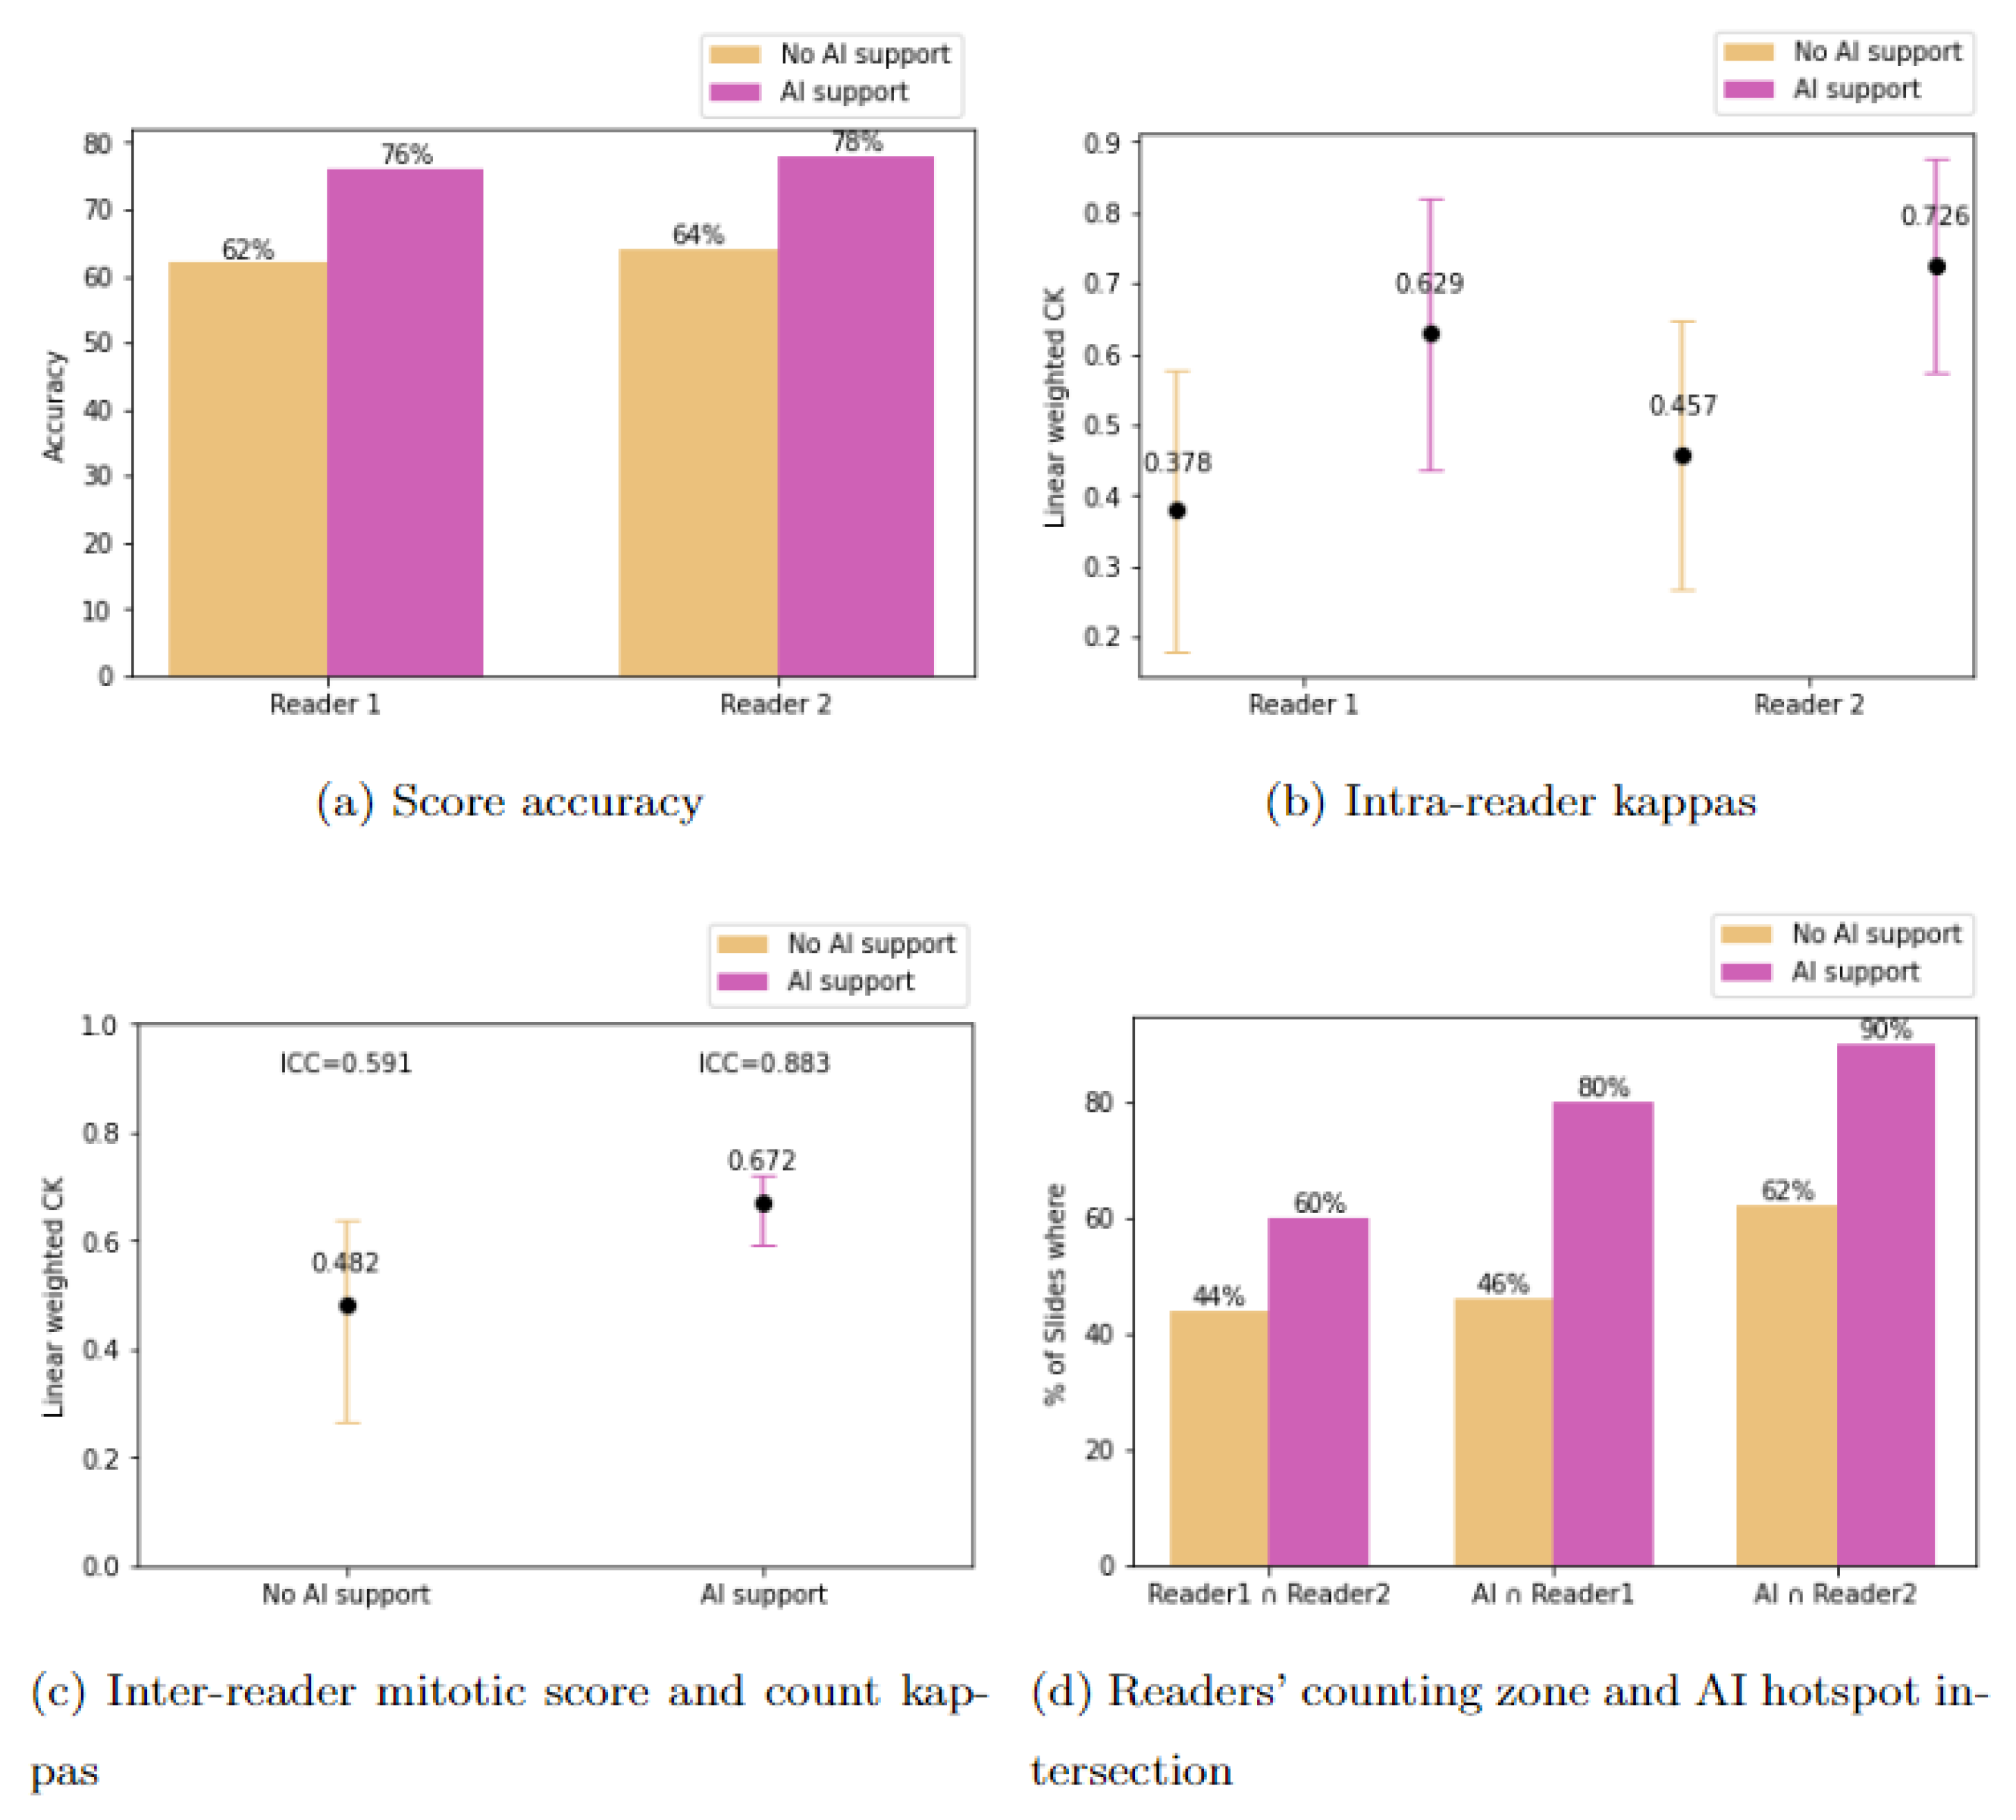
Figure 4.
Observed changes in MS and counting zones for both readers with and without AI. Surgical specimen (4a) and biopsy (4b) with consensus expert MS = 3. i (readers without AI support ) and ii (readers assisted by AI) ; AI hotspots in yellow, and counting zones and MS obtained defined by both readers in blue and red.
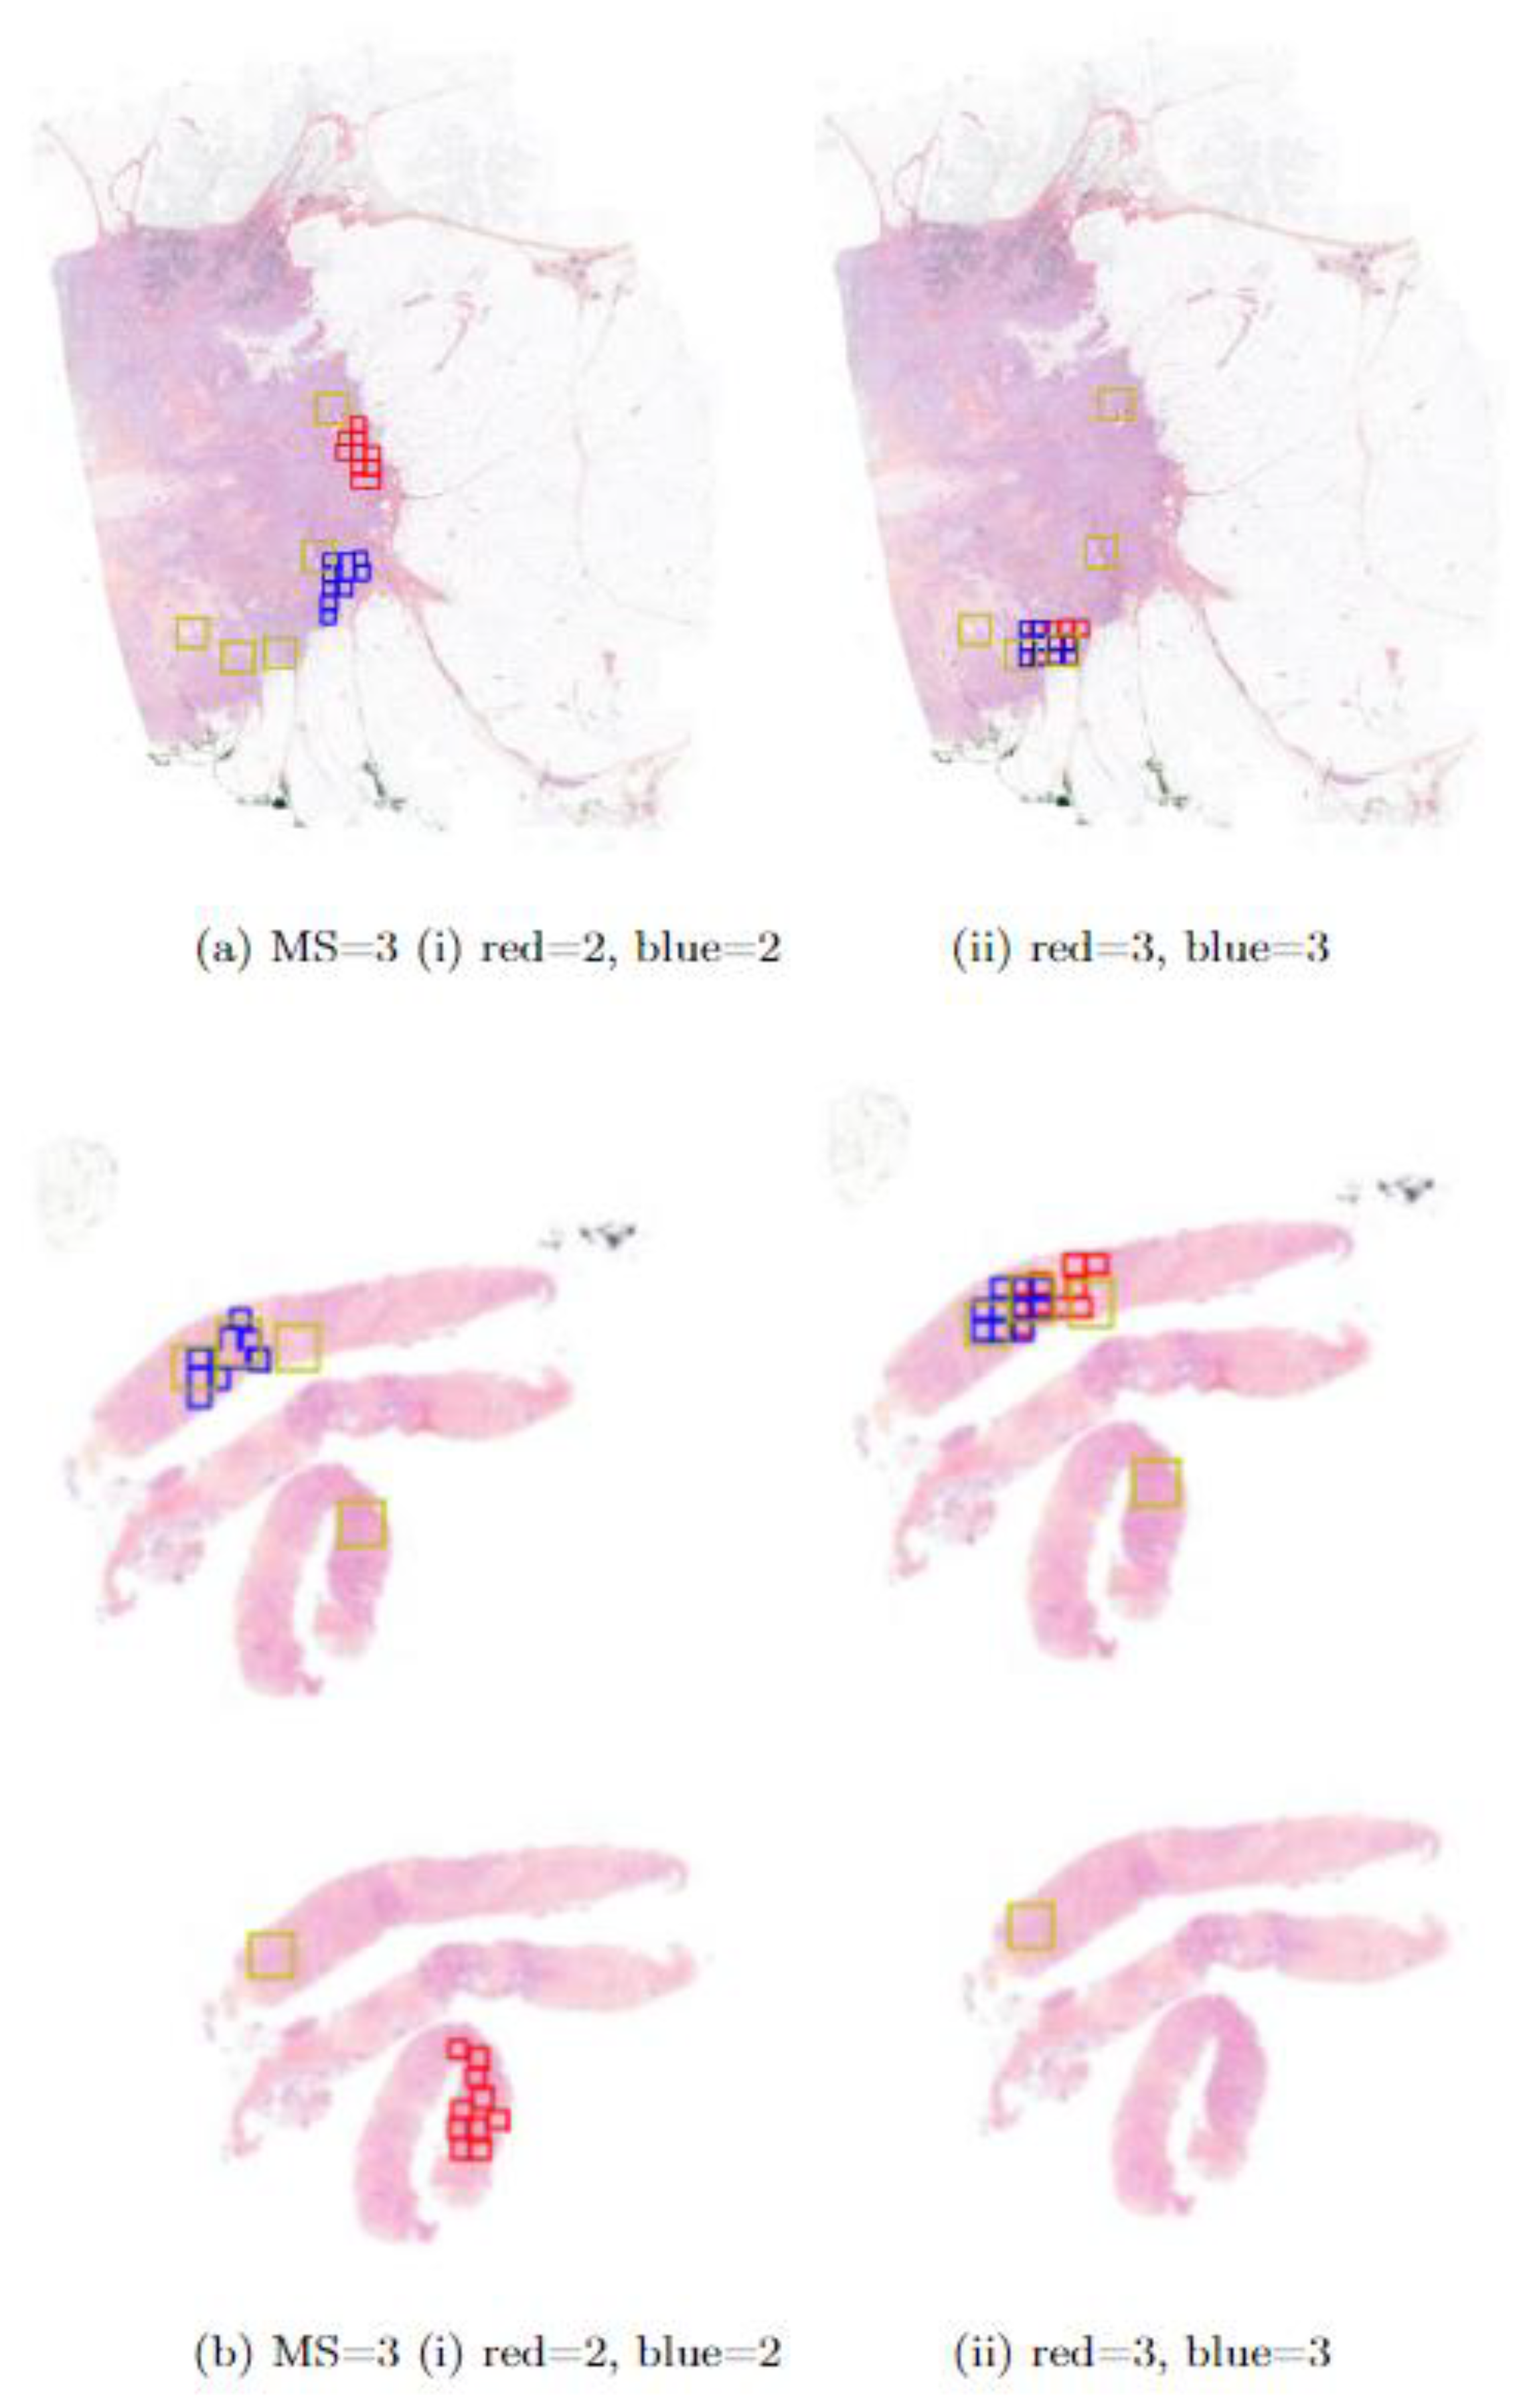

Table 1.
Slides and patches distribution across datasets and tasks.
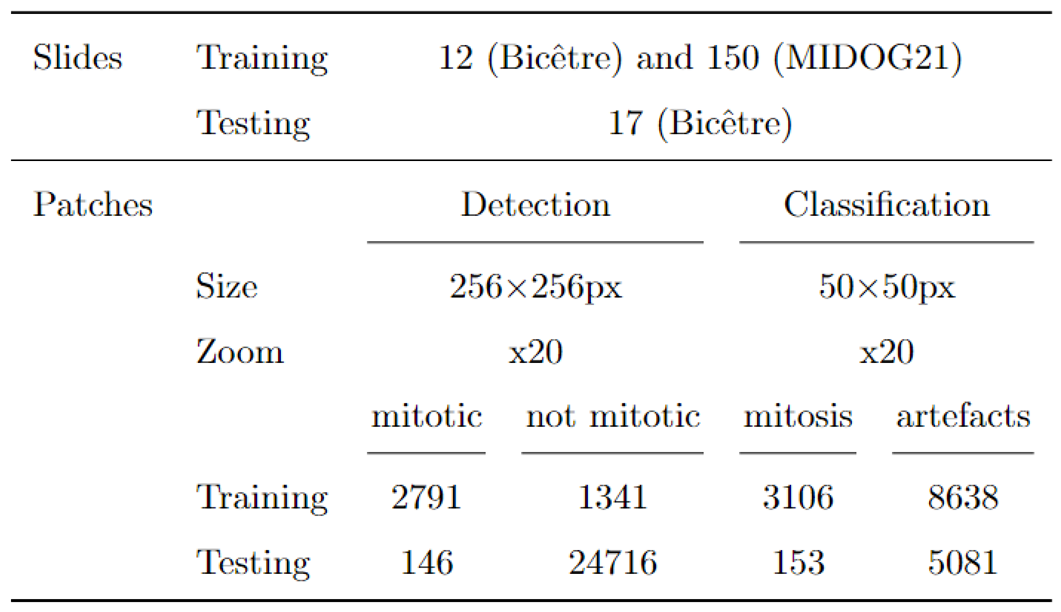
Table 2.
Patient and tumor characteristics of the cohort used in the study.
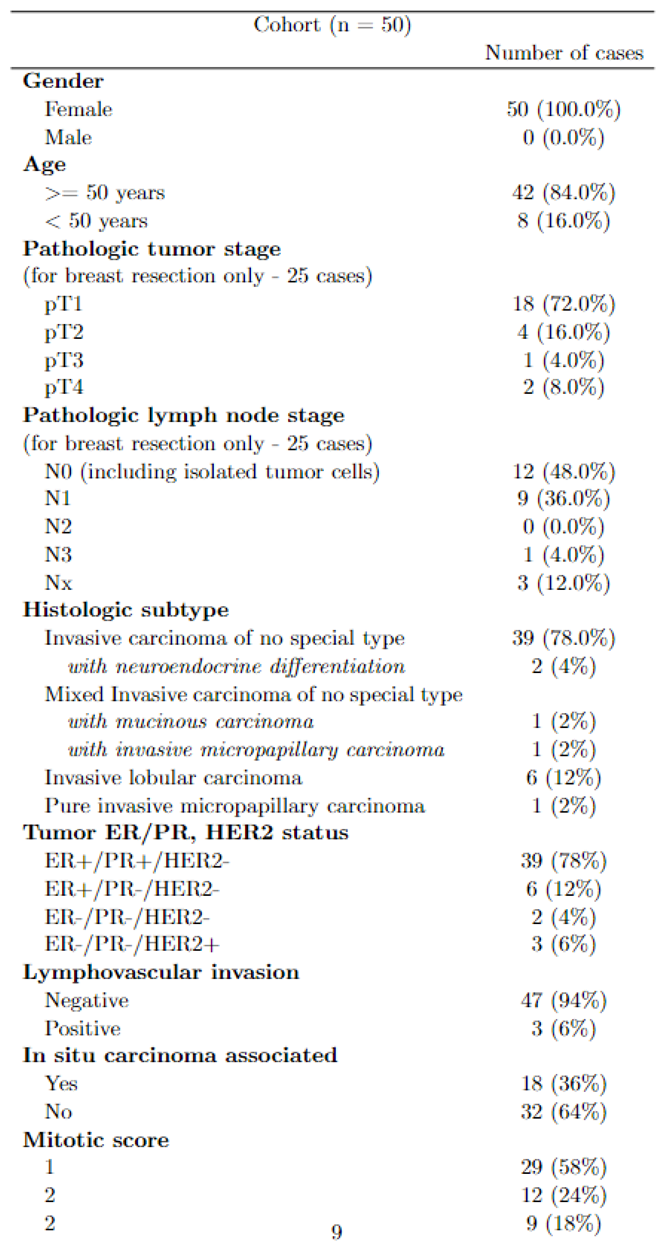
Table 3.
Metrics obtained at the subgroup level. Subgroups are defined by slide mitotic score and slide types - biopsies or specimens.
Table 3.
Metrics obtained at the subgroup level. Subgroups are defined by slide mitotic score and slide types - biopsies or specimens.
Disclaimer/Publisher’s Note: The statements, opinions and data contained in all publications are solely those of the individual author(s) and contributor(s) and not of MDPI and/or the editor(s). MDPI and/or the editor(s) disclaim responsibility for any injury to people or property resulting from any ideas, methods, instructions or products referred to in the content. |
© 2025 by the authors. Licensee MDPI, Basel, Switzerland. This article is an open access article distributed under the terms and conditions of the Creative Commons Attribution (CC BY) license (http://creativecommons.org/licenses/by/4.0/).
Copyright: This open access article is published under a Creative Commons CC BY 4.0 license, which permit the free download, distribution, and reuse, provided that the author and preprint are cited in any reuse.


