Submitted:
25 February 2025
Posted:
26 February 2025
You are already at the latest version
Abstract
According to the Angolan Ministry of Health, in 2023, 10.3 million cases of malaria were reported, an increase of 23% compared to 2022, however, with several deaths 10,089, against 12,480 in 2022, representing a percentage reduction of 19%. Background/Objectives: To investigate whether blood groups (ABO/Rh) can influence the response of biochemical markers in Plasmodium falciparum infection in patients admitted to some hospital units in Luanda/Angola. Methods: A longitudinal, prospective, and analytical study was carried out on 518 patients hospitalized for malaria in two hospital units in Luanda. Results: Of the 518 malaria patients included in the study, the ORh+ group represented (44.6%), followed by ARh+ (22.2%), BRh+ (22.0%), ABRh+ (6.9%), ORh- (2.7%), ARh- (1.0%) and BRh- (0.6%). Regarding sociodemographic data, there was no statistically significant relationship between age groups, area of residence, serum concentration of creatinine, urea, glucose, ALT, gamma GT, degree of parasitemia, antimalarial treatment, clinical condition, and clinical outcomes with blood groups (P < 0.05). However, there was a statistical relationship between gender, employment status, the blood concentration of direct bilirubin, total bilirubin, and AST with blood groups (P < 0.05). Conclusions: It was evident that the biochemical markers in the response to malaria infection can be influenced by the blood type of the individuals, especially direct bilirubin, total bilirubin, and AST, which showed a statistical relationship with the blood type of the patients studied.
Keywords:
Bloods Groups
; Biochemical Marker
; Plasmodium Infection
1. Introduction
According to the World Health Organization's 2022 World Malaria Report, Angola accounts for 3.4% of cases and 2.4% of deaths from malaria globally, being one of the five countries responsible for more than half of the global malaria burden in infections and deaths and in that 12,474 deaths (a reduction of 9% compared to 2021), with a 15% reduction in malaria deaths observed in the same period in the six provinces focused on the PMI (2,546 deaths were reported in 2022 against 2,987 in 2021) [1]. According to the Angolan Ministry of Health, in 2023, 10.3 million cases of malaria were reported, an increase of 23% compared to 2022, however, with several deaths 10,089, against 12,480 in 2022, representing a percentage reduction of 19% [2].
The indices of various biochemical and physiological markers can reflect the condition of complicated malaria, among which the most notable are the indices of glycemia, dyslipidemia, and elevated renal and hepatic functions, in addition to the lower antioxidant capacity that not only destroys the parasite but also induces endothelial damage [3]. Recent studies show that glycemic disturbances may result from disruption of glucose metabolism in malaria, leading to sequestration of intraerythrocytic stages of the parasites in the arteries of the liver in severe P. falciparum infection, in addition to involving inhibition of ATP-sensitive potassium channels, which modulate the permeability of the pancreatic beta cell membrane to potassium, which may result in a marked influx of calcium and release of insulin with reduced blood glucose levels[4,5,6].
Severe malaria infection has also been associated with increased urea and creatinine, and renal ischemia may be caused by the parasite being sequestered in the anal microvasculature bed and raising urea and creatinine levels[7,8,9].In Plasmodium infection, high levels of conjugated and unconjugated bilirubin may be present, and serum levels of albumin, globulin, and total protein may remain unchanged. However, there are reports that high serum bilirubin is the first indicator of liver involvement, and this phenomenon occurs three days after infection, followed by increased serum aspartate transaminase (AST) and alanine transaminase (ALT) activities[10].
For some years now, we have been studying the influence of ABO/Rh blood groups on the health of the Angolan population in diseases such as SARS-CoV-2, cardiovascular disease, HIV, leprosy, chronic kidney disease, patients with nephrotic syndrome and sickle cell anemia, hypertension, diabetes, and other diseases, and the results always end up surprising us, which shows that there is still much to be learned about blood groups, not only as important factors in blood transfusion but also in the health and disease process, as well as in the natural selection of Angolans[11,12,13,14,15,16].
Many studies have shown that the response by biochemical markers, in addition to being an indicator of the clinical and physiological state of the patients, can, therefore, favor or disfavor the response during infection by Plasmodium falciparum. However, there is a lack of studies that demonstrate whether blood groups (ABO/Rh) can influence the response of biochemical markers in malaria. Thus, the objective of this study was to investigate whether blood groups (ABO/Rh) can influence the response of biochemical markers in Plasmodium falciparum infection in patients admitted to some hospital units in Luanda/Angola.
2. Materials and Methods
Study Design and setting
A longitudinal, prospective, and analytical study was conducted on 518 patients hospitalized for malaria in two hospital units in Luanda (Hospital Josina Machel and Hospital Geral de Luanda) between January 2023 and December 2024. The research ethics committee involving human beings evaluated the study. It was subsequently reviewed and approved by the Institute of Health Sciences scientific council at Agostinho Neto University. (nº371/GD/ICISA/UAN/2023). It was subsequently submitted for approval by the management of the clinic of the Josina Machel Hospital (nº36/DPC/HJM/2023) and the Hospital Geral de Luanda (nº272/DPC/HGL/2023). All patients and/or responsible family members were invited to participate in the study and, after accepting, had to sign an informed consent form before providing blood samples. Of the 1200 patients treated in the project, only 518 patients met the inclusion criteria for writing this manuscript. Patients under 12 years of age, pregnant women, patients with cerebral malaria, patients with comorbidities such as diabetes, hypertension, cardiovascular disease, kidney disease, polycystic kidney, and HIV, and individuals over 70 years of age were excluded from this study.
Patient’s Enrolment Criteria and Sample Collection
Professionals made the diagnosis of malaria from the hospitals where the study was conducted. After this diagnosis, our research team performed rapid malaria antigen tests (SD-Bioline Malaria AG Pf/PAN) and subsequently confirmed the diagnosis using a microscopy technique for direct visualization of the parasite by thickening peripheral blood stained with Giemsa. Patients who presented parasitemia of less than or equal to 50 p/mm3 were classified as low parasitemia, patients who presented parasitemia between 51 and 1,000 p/mm3 were classified as moderate parasitemia, patients who presented parasitemia between 1,001 and 10,000 p/mm3 were classified as high parasitemia, while patients who presented parasitemia above 10,000 p/mm3 were classified as high parasitemia [8,18]. A blood sample was taken from the patients in test tubes containing EDTA (Ethylenediaminetetraacetic Acid) anticoagulant specific for ABO and Rh blood group phenotyping tests and blood group determination was performed using the microplate technique, which is an agglutination test between the patient's serum and Anti A, Anti B and Anti D reagents in each of the wells for phenotypic identification of blood groups (ABO and Rh). The samples were placed in three wells, and the subsequent well was associated with anti-A, anti-B, and anti-D reagents (Immucor, Portugal)[11,12,13,14,15].
The biochemical markers were analyzed using the Biobase (model BK-200, nº SHY2002220510382) Automatic Biochemical Analysis System, with Analysis Method End-point, Fixed-time, Rate(Kinetic), Turbidimetry (China). All test results were only considered clinically important when they showed variations well below or above 10% of the laboratory reference values established by the device. Thus, the lowest (Low) or highest (High) values for creatinine were considered using as reference values the average blood creatinine between 0.55-1.41 mg/dL, direct bilirubin ≤1.1 mg/dL, total bilirubin between 0.23-1.32 mg/dL, urea between 18.1-55.0 mg/dL, Glucose between 63.1-110.0 mg/dL, ALT between 18.7-36.3 U/L, AST 7.3-41.8 U/L and for Gamma GT between 4.6-66.0 U/L.
Statistical Analysis
Descriptive statistics were calculated using the statistical program SPSS v20.0 (IBM SPSS Statistics, USA), and the results presented in graphs were developed using Sigmaplot 12.0 (Systat Software, Inc.). The descriptive analysis was presented with frequencies and percentages. The normal distribution of data was presented as mean and standard deviation (SD). Absolute and relative frequencies were determined. The Chi-square (X2) test was used to assess the relationship between categorical variables. All reported p-values are two-tailed and deemed significant when p<0.05..
3. Results
Table 1 describes the sociodemographic data of the 518 malaria patients included in the study. Among the blood groups found, we found that the ORh+ group represented the majority of patients treated (44.6%), followed by individuals ARh+ (22.2%), BRh+ (22.0%), ABRh+ (6.9%), ORh- (2.7%), ARh- (1.0%) and BRh- (0.6%). In the evaluation of blood groups according to age groups, it was found that the majority of individuals found in the study (58.9%) were young people aged between 19 and 40 years, followed by adolescent individuals (25.5%) aged between 12 and 18 years. Except for the Brh- and ORh- groups, which had more than 30% of individuals over 40 years of age, all other groups had more than 80% of their population concentrated among adolescents and young individuals. Despite this, the statistical evaluation showed no relationship between age groups and blood groups (P=0.335).
As for gender, it was found that men represented 52.3% of the entire population studied; however, an interesting fact was that women represented more than 53% of the population with the blood groups ABRh+, ARh- and ARh+, while men represented more than 56% of individuals with the blood groups BRh-, BRh+, ORh- and ORh+. The statistical evaluation confirmed this data, showing that there is a statistically significant relationship between gender and blood group of the patients studied (P=0.041).
When assessing the patient's place of residence, considering their predisposition to infection with the disease, we found that the distribution by urban area (38.2%) and rural area (35.9%) was not very significant, except the BRh- -blood group, which showed a majority of individuals living in urban areas (66.6%), all other groups showed more than 60% of their population living between the peri-urban and rural areas. The statistical evaluation showed no relationship between the region of residence and the blood groups of the individuals studied (P = 0.142).
When assessing the patients' employment status (occupation), we found that the majority of patients were students (54.2%), and more than 50% of the individuals with the ABR+, ARh+, BRh+, ORh- and ORh+ blood groups were students, which seems to justify the fact that it was in this group that the majority of adolescents and young individuals were identified. It was found that only 11.8% of patients had a formal job, individuals with blood groups ABR+, ARh- and BRh- accounted for more than 20% of individuals with formal employment, while 42% of ORh+ patients were working informally. Although it may seem strange, the statistical analysis showed that there is a relationship between work conditions and blood groups (0.050), which raises future discussions regarding this data, especially about genetics/health/employment.
In the evaluation of the biochemical response of malaria patients according to blood type (Table 2), when assessing the creatinine concentration, we noticed that most of the patients studied had high blood creatinine levels (37.4%), followed by patients who had normal blood creatinine levels (37.3%), however, 60% or more of the ABRh+, ARh-, BRh+ and ORh+ individuals had creatinine levels either below or above normal values, only individuals in the BRh- and ORh- groups (57% or more) had creatinine levels within the laboratory reference values. More than 34% of the individuals in the ARh+, ARh+, BRh+, and ORh+ groups had high blood creatinine levels (above 1.42 mg/dL). The statistical evaluation showed no relationship between blood creatinine levels and blood groups (P= 0.141).
In the evaluation of the response by blood concentration of direct bilirubin, we noticed that the majority of patients (59.1%) presented high levels of direct bilirubin in the blood (above 1.2 mg/dL), more than 55% of the individuals in the ABRh+, ARh+, Brh+, and ORh+ groups, presented high blood concentrations of direct bilirubin. However, more than 66% of the individuals in the ARh-, BRh- and ORh- types of blood groups presented normal blood concentrations of direct birubin. The statistical evaluation shows that there is a statistically significant relationship between the blood concentrations of direct bilirubin and the blood groups (P=0.024).
When evaluating the blood concentration of total bilirubin in response to Plasmodium falciparum infection, we found that most patients (44.6%) had high levels of total bilirubin in the blood (above 1.33 mg/dL), followed by patients (30.7%) who had normal total bilirubin values. Only 50% of the ABRh+ and ORh- individuals had normal total bilirubin values, 40% or more individuals in the ARh+, BRh+, and ORh+ groups had total bilirubin values above normal values, while 80% of the ARh- individuals had bilirubin values below normal. The statistical evaluation showed that there was a statistically significant relationship between the blood concentrations of total bilirubin and the blood groups (P=0.004).
In the evaluation of urea, it was found that most patients (42.0%) presented normal urea values (18.1-66.0 mg/dL), followed by individuals with urea values higher than the reference values (40.1%). It was observed that 60% of the ARh- individuals presented high urea concentrations in the blood, while 50% of individuals with Rh-and ORh- blood groups had normal blood urea values. The percentage of individuals with normal urea was lower in the other blood groups, however, 50% of the BRh- individuals presented urea values below the reference values. The statistical calculation showed that there was no significant relationship between the urea serum concentration and the blood type of the individuals studied (P=0.639).
When assessing serum glucose in response to malarial infection, it was observed that most of the malaria patients studied (60%) had normal serum glucose levels. When assessing blood groups, it was observed that all individuals (100%) ARh- and Brh- had normal serum glucose levels, and 58% or more of the ABRh+, ARh+, BRh+, and ORh+ individuals had normal glucose levels. Low glucose levels were observed especially in ORh- individuals (42.9%), with high glucose levels observed in ABRh+, BRh+, ARh+, and ORh+ individuals, where more than 21% of the individuals in these groups had high serum glucose levels. The statistical evaluation showed that there was no statistical relationship between serum glucose concentration and the blood type of the patients (P = 0.115).
In the evaluation of ALT (TGP) as a biochemical marker influenced by blood groups, we found that most of the patients studied presented ALT at values below the reference values (≤18.6 U/L), all (100%) of the ARh- and BRh- individuals presented below the reference values, in the ARh+, BRh+, and ORh+ individuals with low ALT, represented more than 53%. ALT with values above the reference values was observed in 32% or more individuals of the ABRh+, ARh+, BRh+, ORh-, and ORh+ blood groups. None of the blood groups studied presented at least 20% of individuals with ALT at normal values (18.7-36.3 U/L). Despite this, the statistical evaluation showed no relationship between the serum concentration of ALT and the blood type of the individuals infected with malaria (P= 0.152).
When evaluating AST (TGO) in the biochemical response to Plasmodium falciparum infection, we found that most patients (63.3%) had AST above the reference values (≥41.9 U/L), in all blood groups, ABRh+, ARh+, BRh+, ORh- and ORh+ patients, where the percentage of individuals with high AST was higher than 53%. The AST concentration was higher than 40% in individuals in the ARh- and BRh- blood groups, and only 40% of patients in the ABRh+ blood group had low AST values. The statistical evaluation showed that there was a statistically significant relationship between blood AST concentrations and blood groups (P=0.022).
In the evaluation of Gamma GT, under the influence of blood groups, it was shown that the majority of the patients studied (72.4%) had normal serum Gamma GT concentrations (4.6-66.0 U/L). In all blood groups, the percentage of individuals with normal Gamma GT was greater than 68%; however, in individuals ABRh+, ARh-, ARh+, BRh+, ORh- and ORh+, more than 20% of their patients had Gamma GT above normal values. Statistical analysis showed that there was no statistically significant relationship between blood groups and blood Gamma GT concentration (P=0.571).
When we sought to evaluate the mean of the biochemical markers creatinine, direct bilirubin and total bilirubin (Figure 1.A) in individuals of the same blood group, we found that when evaluating the mean (with its standard deviation) of creatinine among individuals of the different blood groups, the general mean of creatinine in the patients studied was 4.48 ± 16.36 mg/dL, the only individuals who presented a mean of creatinine between the reference values (between 0.55-1.41 mg/dL) were patients of the BRh- blood group (0.64 ± 0.47 mg/dL), all the other blood groups presented creatinine values higher than the reference values and the highest mean of creatinine were observed in ARh- individuals (13.13 ± 11.62 mg/dL), followed by individuals of the groups BRh+(5.51±25.55 mg/dL) and ORh+(4.82±15.90 mg/dL) and ARh+(3.72±11.6 mg/dL).
In the evaluation of direct bilirubin, we noticed that only the general mean of direct bilirubin in the patients studied was 5.62 ± 12.13 mg/dL, individuals of the ARh- blood group were the only patients who presented Direct Bilirubin values (0.50 ± 0.53 mg/dL) between the reference values (≤ 1.1 mg/dL), the other groups presented direct bilirubin values much higher than normal values, especially among individuals of the BRh + blood group (6.98 ± 11.57 mg/dL), BRh- (6.82 ± 11.32 mg/dL) and ARh + (6.82 ± 19.68 mg/dL).
When evaluating the mean total bilirubin in the individuals included in the study, it was found that the mean total bilirubin in this population was 3.03 ± 6.20 mg/dL, where only individuals ARh- (0.35 ± 0.34 mg/dL), BRh- (1.32 ± 1.88 mg/dL) and ORh- (1.34 ± 3.17 mg/dL) presented total bilirubin values close to or between the reference values (between 0.23-1.32 mg/dL), all other groups presented higher total bilirubin values, especially individuals ARh + (3.47 ± 6.80 mg/dL), BRh + (3.37 ± 5.37 mg/dL) and ORh + (2.97 ± 6.81 mg/dL).
In the evaluation of the mean urea as a biochemical marker influenced by blood groups in Plasmodium falciparum infection response, we found that the general mean urea in patients with malaria included in the study was 81.80±95.98 mg/dL, and only blood group that presented mean urea within the laboratory reference values (between 18.1-55.0 mg/dL) were patients in the BRh- group (37.09±21.77 mg/dL). In all other groups, mean blood urea values were much higher than normal, especially in patients in the ARh- (155.04±119.05 mg/dL) and ARh+ (103.72±128.60 mg/dL) blood groups.
When assessing serum glucose in patients with malaria, we found that the patients had an average blood glucose level of 100.23±60.03 mg/dL. The average of most individuals by blood group studied presented average serum glucose values within the reference values (between 63.1-110.0 mg/dL), with the exception of patients in the ABRh+ group who had an average blood glucose level slightly higher than normal values (118.27±127.83 mg/dL).
In the evaluation of the mean ALT (TGO), we found that the general mean ALT in patients with malaria was 42.77 ± 62.49 U/L, except patients with the BRh+ blood group who presented ALT values (34.23 ± 33.23 U/L) within the reference values (26.2-36.3 U/L), some blood groups presented ALT values well below normal values, especially the ARh- (13.64 ± 3.50 U/L), BRh- (14.60 ± 10.51 U/L) blood groups or values above normal values as was the case of patients with the ORh- (61.92 ± 102.41 U/L), ARh+ (47.73 ± 82.64 U/L), ABRh+ (44.42 ± 54.56 U/L) and ORh+(44.08±60.81 U/L).
The mean AST value observed in patients with malaria was approximately 99.58±198.32 U/L, where only patients of the ARh- blood group presented mean AST values(23.16±27.22 U/L) within the laboratory reference values (7.3-41.8 U/L), all other groups of patients presented mean AST values above the values considered normal, the most expressive AST values were observed in individuals of the ABRh+ (105.67±132.72 U/L), ARh+(116.68±341.98 U/L) and ORh+(96.82±145.17 U/L) and BRh+(94.40±111.02 U/L) blood groups.
In the Gamma GT assessment, we observed that the patients monitored had a mean Gamma GT value of 58.60±91.12 U/L), the majority of individuals with blood groups studied presented Gamma GT values within the reference values (between 4.6-66.0 U/L), the only exception was observed in individuals with ABRh+ blood groups who presented a mean Gamma GT value higher than normal (78.90±149.16 U/L).
When assessing the clinical condition of patients, which may be influenced by blood types (Table 3), we found that 40.5% of patients had high parasitemia (> 10,000 p/mm3). This condition was observed in almost all blood groups studied, where more than 40% of patients from all blood groups had high parasitemia, where 66.7% of individuals from the BRh- group had high parasitemia, the only exception being in the BRh+ blood group (33.0%). The statistical evaluation showed no relationship between the parasite load and blood groups (P=0.449).
In the assessment of the clinical condition, it was found that most individuals studied had a moderate clinical picture. However, more than 28% of individuals from all blood groups studied had severe cases of the disease, the only exception being observed in the ARh- group, where all individuals had a moderate case of malaria. More than 80% of the individuals studied, regardless of blood group, presented a moderate to severe clinical condition. Statistical analysis did not show any relationship between the patient's clinical condition and blood groups (P=0.763).
Regarding the most indicated hospital treatment, we found that the majority of patients studied were treated with Artesunate (66.8%) of the individuals studied, this treatment was indicated in more than 60% of patients in the ABR+, ARh+, BRh-, BRh+, ORh- and ORh+ groups, however, the strange thing was that it was observed that 60% of ARh- patients were treated with Coartem and 33% of BRh- patients were treated with Arthemeter. The statistical analysis did not show any statistically significant relationship between the antimalarial treatment and the blood groups of the patients studied (P= 0.134).
In the evaluation of clinical outcomes, we found that 81.9% of the patients studied were discharged from the hospital. This rate was also reflected in the blood groups, since in individuals ABRh+, ARh-, ARh+, BRh-, BRh+, ORh+, and ORh+, the hospital discharge rate was between 77 and 100%, especially in Rh- individuals, except for ORh-. The ORh-blood group had the highest mortality rate (14.3%), followed by ORh+ (6.5%), BRh+ (6.1%), ABRh+ (2.8%) and ABRh+ (2.6%). Individuals who had the highest rate of hospital stay (more than 7 days) were from the ABRh+ (19.4%), BRh+ (16.7%), and ARh+ (13.9%) blood groups. However, the statistical evaluation did not show a statistically significant relationship between clinical outcomes and blood groups (P= 0.479).
4. Discussion
The study showed a distribution of blood groups where the ORh+ blood group was more representative, followed by ARh+ and BRh+ individuals and the Rh+- and ABRh+ blood groups in smaller percentages, similar data (Table 1), had already been found in previous studies, carried out by some of our research in Angola, where in patients with malaria ABRh+ (6.6%), ARh- (2.0%), ARh+ (24.7%), were BRh+ (21.2%), ORh- (2.5%) and ORh+ (42.9%), in patients with Leprosy, ORh+ (51.9%), BRh+ (27.4%), ARh+ (18.7%), ABRh+ (1.0%) and BRh- (1.0%), in patients with diabetes where patients ORh+ (44%), ARh+ (27%), BRh+ (23%) and ORh- (2%) and in individuals with HIV where patients ORh+ (46.9%), BRh+ (25.4%) and ARh+ (23.1%) and ABRh+ (4.6), without the presence of Rh-[12,13,18,19].
Results in the present study, although presenting data regarding age and place of residence, showed a relationship between gender and occupational status with blood groups (Table 1), especially because women were mostly ABR+, ARh- and ARh+ while men were from other groups, at the same time that Rh+ individuals were mostly those who have informal employment, which raises different perceptions and reflections about these results. In a previous study to evaluate the hepatic profile of patients with malaria, we found sociodemographic data close to the current data, where of the 199 participants included in the study, individuals aged between 20 and 30 years predominated (45.2%, 90/199), female gender (61.8%, 123/199), patients from urbanized areas (53.8%, 107/199), secondary educational level (43.2%, 86/199) and employed (75.4%, 150/199)[20]. Another study carried out in Kenya found that individuals with blood group B+ are more likely to have high parasitemia compared to those with blood group O+ (OR = 4.47, CI = 1.53–13.05, p = 0.006)(18) )[21].
The results of the present study demonstrated that there is a variation in serum creatinine values (Table 2), where the highest mean creatinine values were observed in individuals in the ARh- group and the lowest mean values in individuals in the BRh- groups (Figure 1.A), which leads us to agree with previous studies that state that at low serum creatinine levels, the mathematical relationship between creatinine and eGFR is exponential, where a small change in a low creatinine level has a substantial impact on eGFR. However, the same small change in a patient with a high creatinine level will have a minimal impact on the calculated eGFR [22].
Previous studies by some of our team members have shown that blood urea nitrogen and creatinine were negatively correlated, while GFR was positively correlated with red blood cell count, Hb concentration, and hematocrit in P. falciparum-infected patients who developed AKI, suggesting that AKI correlates with the severity of anemia in P. falciparum malaria[7]. In other studies where patients were followed and monitored by serum creatinine (SCr) and blood urea nitrogen (SUr) measurements for a period between 2 and 4 days, patients were grouped according to renal damage (with AKI and without AKI), and the results revealed an increase in the mean SCr values in patients with AKI compared to patients without AKI, interestingly, an increase in the mean SCr values was also observed in patients without AKI, where vital signs indicated a condition of renal damage, which could be an excellent aid to health professionals in the evaluation and decision-making in the treatment of patients with malaria [7,23].
The study showed that the concentration of direct and total bilirubin is influenced by blood type (Table 2), with some blood groups producing more bilirubin than others (Figure 1.A). Data from a previous study found that the bilirubin level was elevated >2.5 × ULN in 12.4% of all cases with LFT measurements; this elevation of bilirubin was moderate in most cases, although malarial liver disease was found in 2.4% of all cases of severe or very severe patients with a maximum value of 20.5 × ULN; however, all cases with elevated bilirubin peaked before day 3 of hospitalization [24].
One study showed that using the criteria of bilirubin > 50 µmol/L with parasitemia ≥ 100,000/µL, the odds of developing severe malarial anemia were higher among patients with blood groups A (OR = 10.0 95% CI: 6.5–19.8, p < 0.0001) and B (OR = 2.6, 95% CI: 1.1–6.0, p = 0.0232), compared with blood group O[25]. A previous study observed that the liver function of patients with malaria was affected because they found a statistically significant association in the production of biochemical markers such as aspartate transaminase (AST), total bilirubin (BLR.T), and direct bilirubin (BLR.D) levels in malaria cases compared to non-malarial controls (p < 0.05, p < 0.0001 and p < 0.05, respectively)[26].
Although the present study showed that there were slight differences between the blood groups that presented mean urea within the laboratory reference values (Table 2) and the mean blood urea value in different groups (Figure 2.B), there was no statistical relationship between blood groups and urea concentration. A previous study developed by some of the members of our team in patients with malaria in Angola had already found that patients with hyperuremia presented high (37.0 to 58.5 mg/dL) and medium (49.3 to 79.0 mg/dL) parasitemia, as well as patients treated with Artemether presented medium urea (less than 50.0 mg/dL) and Artesunate (between 70.4 and 77.8 mg/dL), as well as patients who were discharged (44.8 to 51.7 mg/dL), those who remained hospitalized (49.1 to 51.5 mg/dL) and who died (74.1 to 73.6 mg/dL), demonstrating that uremic changes can be influenced by the parasitemic condition, antimalarial treatment and the clinical outcomes of patients with malaria [27]. Another previous study observed data different from ours since in that study the mean limit of the urea level of the patients was within the specified normal limits of 2.0 mmol/L - 8.0 mmol/L, except for the malaria-negative patients, whose upper limit of their mean distribution was above 8.0 mmol/L (i.e., 7.57 mmol/L + 2.36 mmol/L = 9.93 mmol/L), where the dispersion of the urea data obtained from the patients was observed within the normal limits[28].
In the present study, many patients with hyper or hypoglycemia were not observed (Table 3), where only patients in the ABR+ group presented an average serum glucose level higher than the reference values (Figure 2.B). This differs from a study from Congo Brazavil that identified a total of 105/158 (66.46%) children who had at least one episode of glycemic disturbance on admission and during 3 days of glycemia monitoring, where 83 (52.53%) had moderate hyperglycemia, 28 (17.72%) severe hyperglycemia, 24 (15.19%) moderate hypoglycemia and 4 (2.53%) severe hypoglycemia and 60 (57.14%) of the 105 children had glycemic abnormalities after admission, in this study the factors associated with lethality were age < 5 years [OR = 6.77 (1.43 - 32.02), p = 0.006] and hypoglycemia (moderate and severe) on admission [OR = 17, (4.53 - 65.71), p = 0.0001](16) [29,32]. Another study concluded that hyperglycemia, hypoglycemia, hyperlactemia, and hyperinsulinemia are facets of the syndrome in the dispute for supremacy in malaria, which other forms of malaria treatment tend to promote[29].
Although in the present study ALT levels were shown to be related to blood type and AST and gamma GT were not (Table 2), it was noticeable that the mean concentrations of these metabolites were different in each blood group (Figure 3C), this reinforces the data from a study that found that an elevated ALT level >3 × ULN was identified in 15.1% of all cases with LFT measurements, where peak ALT elevations were observed in moderate (58%), severe (31%) and very severe (10%) patients and the peak ALT elevation was identified at 25.8 × ULN and occurred on day 4 of hospitalization[24]. Elevation of aspartate transaminase was identified at similar rates to ALT elevation, although the temporal distribution of peak AST elevation appears to favor a slightly earlier onset and possibly resolve largely within the follow-up period [24,30]. A Sudanese study showed that patients infected with malaria have a significant elevation of total bilirubin, direct bilirubin, indirect bilirubin, alanine aminotransferase (ALT), aspartate aminotransferase (AST), and lactate dehydrogenase (LDH) and a significant decrease in albumin levels. However, there is no significant difference in total protein levels between patients with and without malaria [31]. Another study in Ghana identified that the AST/ALT ratio decreased significantly (P < 0.0001) when falciparum parasitemia was greater than or equal to 10,000 parasites/μL. However, the hepatic markers AST, ALT, ALP, GGT, TBIL, and DBIL increased significantly (P < 0.0001) in serum when falciparum parasitemia was greater than or equal to 10,000 parasites/μL [30]. A study by our team identified that despite the low frequency, group AB presented high mean values of AST and gamma GT; high ALT values were observed in the B group, while high bilirubin values were observed in the O group. However, the differences in mean values of gamma GT depending on the blood groups were statistically significant (p=0.006), although no statistical significance was observed (p>0.05), all high values of ALT (48.5 ± 122), AST (85.9 ± 117), gamma GT (74.9 ± 126) and bilirubin (245 ± 3307) were found in patients with positive Rh factor [20].
The data from the present study (Table 2) differ slightly since, in the previous study, it was observed that most patients had low parasitemia upon hospital admission (less than 51 parasites/mm3), and high parasitemia was observed mainly in individuals in the ABRh (+), BRh (+) and ORh (+) groups. Most patients had a clinical picture considered moderate (53.5%, n = 106/198), especially 46.5% of ABRh(+) patients had a severe clinical picture. However, no statistical relationship was observed between age group, sex, parasitemia, clinical picture, and blood groups (p<0.05) [5], and this time gender and employment status were related to blood groups. In the Kenya study, age groups were also associated with parasitemia levels (p = 0.0006), and children over 5 years of age had low parasite densities [21].
5. Conclusions
It can be concluded that Angolan men and women hospitalized for malaria, where the working conditions are possibly affected by the health/disease condition, the population is mostly young, and the Rh-blood groups are very small in number, even in individuals with blood group O who constitute the majority among the population of Angola. It was evident that the biochemical markers in the response to malaria infection can be influenced by the blood type of the individuals, especially direct bilirubin, total bilirubin, and AST, which showed a statistical relationship with the blood type of the patients studied. Our focus now is to understand how the response by extracellular vesicles can be influenced by blood type and how they favor or disfavor the susceptibility and severity of infection by Plasmodium falciparum.
Author Contributions
ENMS. Data curation: ENMS, TSL, FBRA. Formal analysis: ENMS. Investigation: ENMS, TAL. Project administration: ENMS, FBRA. Supervision: ENMS, FBRA. Validation: ENMS, TAL, FBRA. Writing – original draft: ENMS. Writing – review & editing: ENMS, FBRA. All authors have seen and approved the submitted version of this manuscript.
Funding
This project was funded by the European Union and the African Union through the 2022 ARISE-PP-13 Project, which is coordinated by the African Academy of Sciences. This project was co-financed by the Science and Technology Development Project (PDCT) of the Ministry of Higher Education, Science, Technology and Innovation of Angola through financial support for research and the design of a Post-doctoral scholarship for the principal investigator.
Informed Consent Statement
All patients and/or responsible family members were invited to participate in the study and, after accepting, had to sign an informed consent form before providing blood samples.
Data Availability Statement
We encourage all authors of articles published in MDPI journals to share their research data. In this section, please provide details regarding where data supporting reported results can be found, including links to publicly archived datasets analyzed or generated during the study. Where no new data were created, or where data is unavailable due to privacy or ethical restrictions, a statement is still required. Suggested Data Availability Statements are available in section “MDPI Research Data Policies” at https://www.mdpi.com/ethics.
Acknowledgments
The authors would like to thank the patients for their participation, the management, and the workers from the Josina Machel Hospital and Hospital General de Luanda for institutional support. We thank all the laboratory technicians and students who participated in the data collection for this study.
Conflicts of Interest
The authors declare no conflicts of interest.” “The funders had no role in the design of the study; in the collection, analyses, or interpretation of data; in the writing of the manuscript; or in the decision to publish the results”.
Abbreviations
The following abbreviations are used in this manuscript:
| ALT | Alanine Aminotransferase |
| AST | Aspartate Transferase |
| GAMA GT | Gamma Glutamyl Transferase |
| CREAT | Creatinine |
| GLUC | Glucose |
| BLR.T | Total Bilirubin |
| BLR.D | Direct Bilirubin |
References
- U.S. Presidents. Malaria Initiative Angola Malaria Operational Plan FY 2024. Retrieved from www.pmi.gov. Accessed 01/23/2025.
- Jornal Correio da Manhã. Angola registou aumento de casos e diminuição de mortes por malária em 2023. 2024. 01/23/2025. Available at: https://www.cmjornal.pt/mundo/detalhe/angola-registou-aumento-de-casos-e-diminuicao-de-mortes-por-malaria-em-2023.
- El Saftawy, E., Farag, M. F., Gebreil, H. H., Abdelfatah, M., Aboulhoda, B. E., Alghamdi, M., Albadawi, E. A., & Abd Elkhalek, M. A. (2024). Malaria: biochemical, physiological, diagnostic, and therapeutic updates. PeerJ, 12, e17084. [CrossRef]
- Sengupta, A., Ghosh, S., Sharma, S., & Sonawat, H. M. (2020). Early Perturbations in Glucose Utilization in Malaria-Infected Murine Erythrocytes, Liver and Brain Observed by Metabolomics. Metabolites, 10(7), 277. [CrossRef]
- Tian, Y., Zheng, Z., Wang, X., Liu, S., Gu, L., Mu, J., Zheng, X., Li, Y., & Shen, S. (2022). Establishment and evaluation of glucose-modified nanocomposite liposomes for the treatment of cerebral malaria. Journal of Nanobiotechnology, 20(1), 318. [CrossRef]
- Onyesom, I., & Agho, J. E. (2011). Changes in serum glucose and triacylglycerol levels induced by the co-administration of two different types of antimalarial drugs among some Plasmodium falciparum malarial patients in the Edo-delta Region of Nigeria. 78-93.
- Wu, Q., Sacomboio, E., Valente de Souza, L., Martins, R., Kitoko, J., Cardoso, S., Ademolue, T. W., Paixão, T., Lehtimäki, J., Figueiredo, A., Norden, C., Tharaux, P. L., Weiss, G., Wang, F., Ramos, S., & Soares, M. P. (2023). Renal control of life-threatening malarial anemia. Cell reports, 42(2), 112057. [CrossRef]
- Sacomboio ENM, Sebastião CS, Tchivango AT, Pecoits-Filho R, Calice-Silva V. Does parasitemia level increase the risk of acute kidney injury in patients with malaria? Results from an observational study in Angola. Scientific African. 2020;7: e00232. [CrossRef]
- Enechi OC, Okagu IU, Amah CC, Ononiwu PC, Igwe JF, Onyekaozulu CR. Flavonoid-rich extract of Buchholzia coriacea Engl. Seeds Reverse Plasmodium berghei-modified hematological and biochemical status in mice. Scientific African. 2021;12 :e00748. [CrossRef]
- Bhattacharjee D, Mukherjee K, Sarkar R, Chakraborti G, Das O. (2021). Abnormalities of liver function test in acute malaria with hepatic involvement: a case-control study in Eastern India. Medical Journal of Dr. D.Y. Patil University. 14(1):21–25. [CrossRef]
- Sebastião CS, Sacomboio E, Francisco NM, Cassinela EK, Mateus A, David Z, Pimentel V, Paixão J, & Morais J. (2023). Blood pressure pattern among blood donors exposed to SARS-CoV-2 in Luanda, Angola: A retrospective study. Health Science Reports, 6(8), e1498. [CrossRef]
- Sacomboio ENM, Agostinho EMF, Tchivango AT, Cassinela EK, Rocha Silveira SD, da Costa M, et al. (2022) Sociodemographic Clinicaland Blood Group (ABO/Rh) Profile of Angolan Individuals with HIV. J Clin Cell Immunol.13:675. [CrossRef]
- Sacomboio ENM, Muhongo TO, Tchivango AT, Cassinela EK, Silveira SR, et al., (2023) Blood Groups (ABO/Rh) and Sociodemographic and Clinical Profile Among Patients with Leprosy in Angola. Infect Dis Diag Treat 7: 247. [CrossRef]
- Sacomboio ENM. ABO/Rh Blood Groups and Chronic Diseases in Angolan Patients. Am J Biomed Sci & Res. 2021 - 13(1). AJBSR.MS.ID.001834. [CrossRef]
- Sacomboio ENM, Sassoke JL, Hungulo OFS, Ekundi-Valentim E, Cassinela EK, et al. (2021) Frequency of ABO/Rh Blood Groups and Social Condition of Hypertensive Patients in Luanda. J Blood Disord Med 4(1). [CrossRef]
- Sacomboio ENM, Neto CR, Hungulo OFS, Valentim EE (2021) Blood Group (ABO/Rh) and Clinical Conditions Common in Children with Nephrotic Syndrome and Sickle Cell Anemia in Angola. J Blood Disord Med 4(1). [CrossRef]
- Sacomboio ENM, Campos LH, Daniel FN, Ekundi-Valentin E. Can vital signs indicate acute kidney injury in patients with malaria? Results of an observational study in Angola.Scientific African, 14 (2021), Article e01021. [CrossRef]
- Sacomboio, E. N. M., Zua, S. D., Tchivango, A. T., Pululu, A. D., Caumba, A. C. D., Paciência, A. B. M., Sati, D. V., Agostinho, S. G., Agostinho, Y. S., Mazanga, F. G., Ntambo, N. B., Sebastião, C. S., Paixão, J. P., & Morais, J. (2024). Blood count changes in malaria patients according to blood groups (ABO/Rh) and sickle cell trait. Malaria journal, 23(1), 126. [CrossRef]
- Sacomboio, E. N. M., Pululo, S. A., Sebastião, C. S., Tchivango, A. T., Silveira, S. D. R, et al. (2024). Frequency of Abo/Rh Blood Groups Among Patients with Diabetes Mellitus in Luanda, Angola. Int J Diabetes Metab Disord, 9(1), 01-08. [CrossRef]
- Sebastião, C.; Cassinela, E.; Manuel, V.; Matary, W.; Nkuku, M.; Piedade, I.; Filipe, C.; Cristóvão, L.; Sacomboio, E. Dynamics of Liver Function among Patients with Malaria in Luanda, Angola: A Cross-Sectional Study. Preprints 2024, 2024080224. [CrossRef]
- Yeda, R., Okudo, C., Owiti, E. et al. The burden of malaria infection among individuals of varied blood groups in Kenya. Malar J 21, 251 (2022). [CrossRef]
- Delanaye P, Cavalier E, Cristol JP, Delanghe JR. Calibration and precision of serum creatinine and plasma cystatin C measurement: impact on the estimation of glomerular filtration rate. J Nephrol. 2014;27(5):467–475. [CrossRef]
- Sacomboio ENM, Campos LH, Daniel FN, Ekundi-Valentin E. Can vital signs indicate acute kidney injury in patients with malaria? Results of an observational study in Angola.Scientific African, 14 (2021), Article e01021. [CrossRef]
- Woodford, J., Shanks, G. D., Griffin, P., Chalon, S., & McCarthy, J. S. (2018). The Dynamics of Liver Function Test Abnormalities after Malaria Infection: A Retrospective Observational Study. The American journal of tropical medicine and hygiene, 98(4), 1113–1119. [CrossRef]
- Aninagyei, E., Agbenowoshie, P.S., Akpalu, P.M. et al. ABO and Rhesus blood group variability and their associations with clinical malaria presentations. Malar J 23, 257 (2024). [CrossRef]
- Das, S., Rajkumari, N., & Chinnakali, P. (2019). A comparative study assessing the effect of hematological and biochemical parameters on the pathogenesis of malaria. Journal of Parasitic Diseases: official organ of the Indian Society for Parasitology, 43(4), 633–637. [CrossRef]
- Doqui-Zua SS, Filho-Sacomboio FC, Ekundi-Valentim E. & Sacomboio ENM.(2020). Social and clinical factors affecting the uremic condition of Angolan patients with malaria. Int. J. do Adv. Res. 8. 986-998.2320-5407. [CrossRef]
- Ndako J, Olisa J, Ozoadibe O, Victor D, Fajobi V, Akinwumi J. (2020). Evaluation of the association between malaria infection and electrolyte variation in patients: Use of Pearson correlation analytical technique. Informatics in Medicine Unlocked. 21. [CrossRef]
- Alfred Mavondo, G., Mavondo, J., Peresuh, W., Dlodlo, M., & Moyo, O. (2019). Malaria Pathophysiology as a Syndrome: Focus on Glucose Homeostasis in Severe Malaria and Phytotherapeutics Management of the Disease. IntechOpen. [CrossRef]
- Ehiem, R. C., Nanse, F. A. K., Adu-Frimpong, M., & Mills-Robertson, F. C. (2021). Parasitaemia estimation and prediction of hepatocellular dysfunction among Ghanaian children with acute malaria using hemoglobin levels. Heliyon, 7(7), e07445. [CrossRef]
- Abdrabo, A.A. (2019). Evaluation of Liver Function Tests among Sudanese Malaria Patients. Sudan Medical Laboratory Journal. [CrossRef]
- Gildas, O., Gaston, E., Laetitia, L., Vassili, M., Judicaël, K., Yoleine, P., Nelly, P., Cyriaque, N., Engombo, M. and Marius, M. (2017) Blood Glucose Concentration Abnormalities in Children with Severe Malaria: Risk Factors and Outcome. Open Journal of Pediatrics, 7, 222-235. [CrossRef]
Disclaimer/Publisher’s Note: The statements,opinions and data contained in all publications are solely those of the individual author(s) and contributor(s) and not of MDPI and/or the editor(s). MDPI and/or the editor(s) disclaim responsibility for any injury to people or property resulting from any ideas,methods,instructions or products referred to in the content. |
Figure 1.
A- Mean ± SD concentration of creatinine, direct bilirubin, and total bilirubin in blood groups (ABO/Rh).
Figure 1.
A- Mean ± SD concentration of creatinine, direct bilirubin, and total bilirubin in blood groups (ABO/Rh).
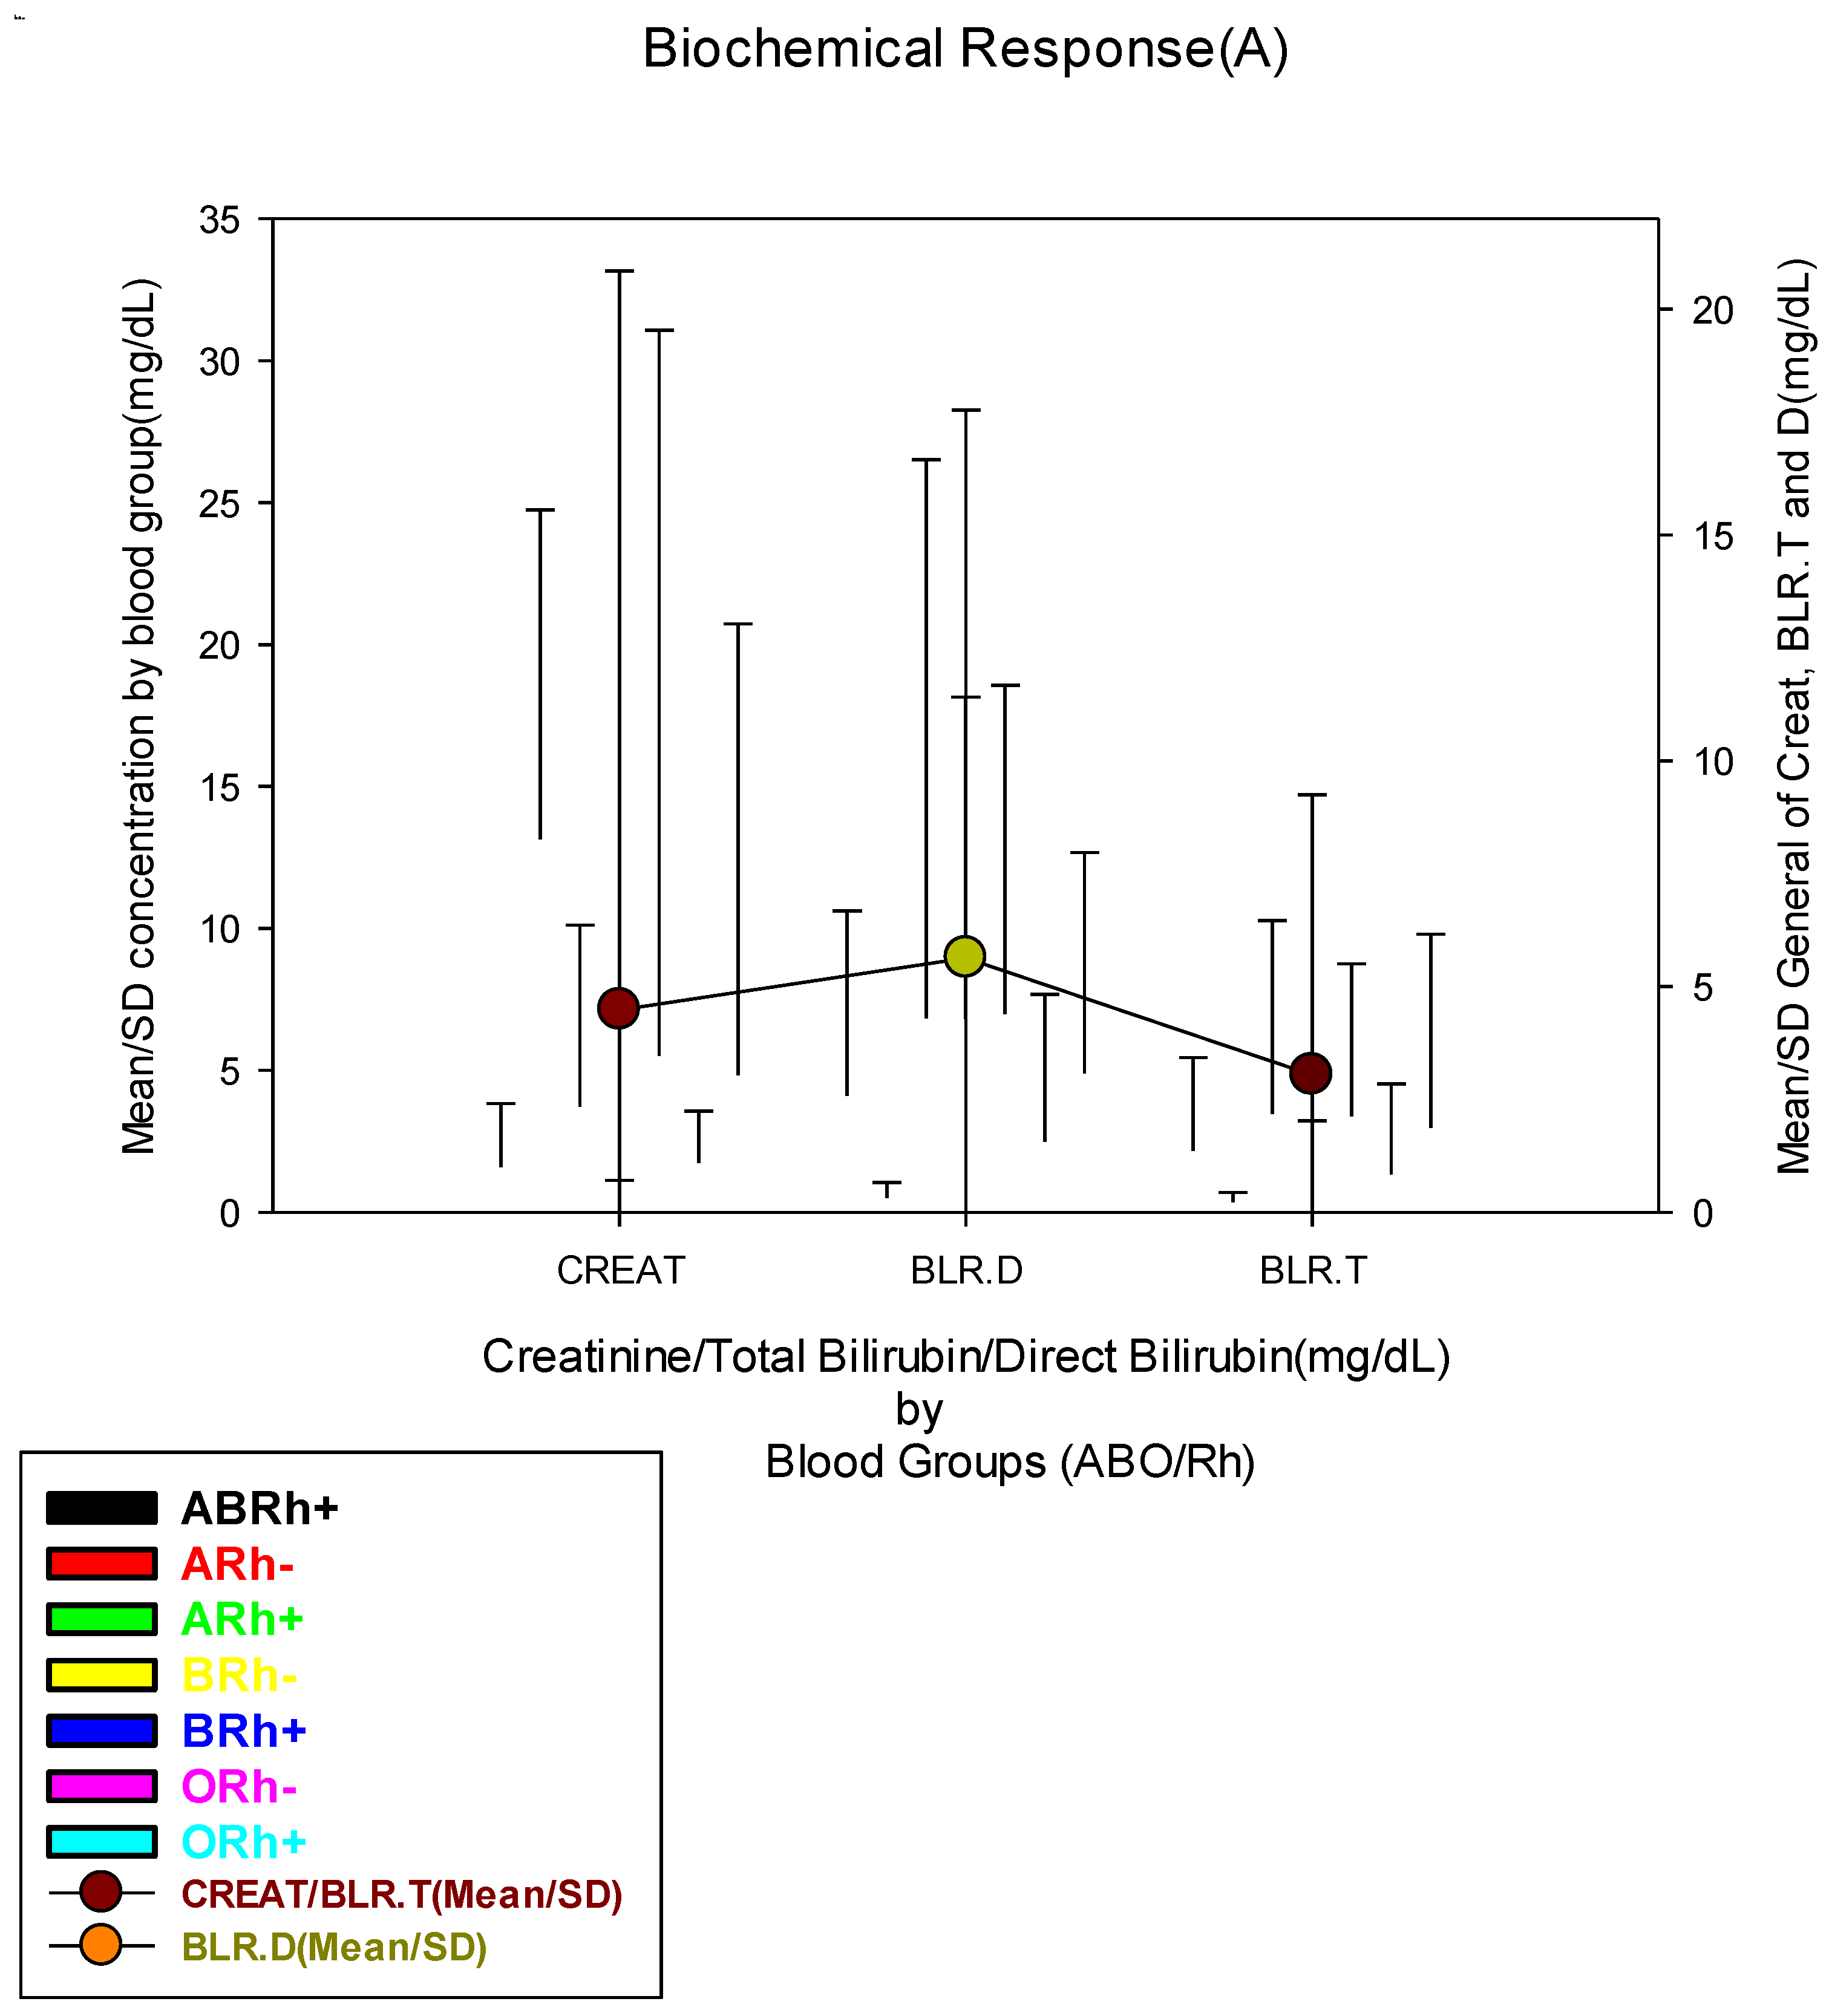
Figure 2.
B- Mean ± SD concentration of urea and glucose in blood groups (ABO/Rh).
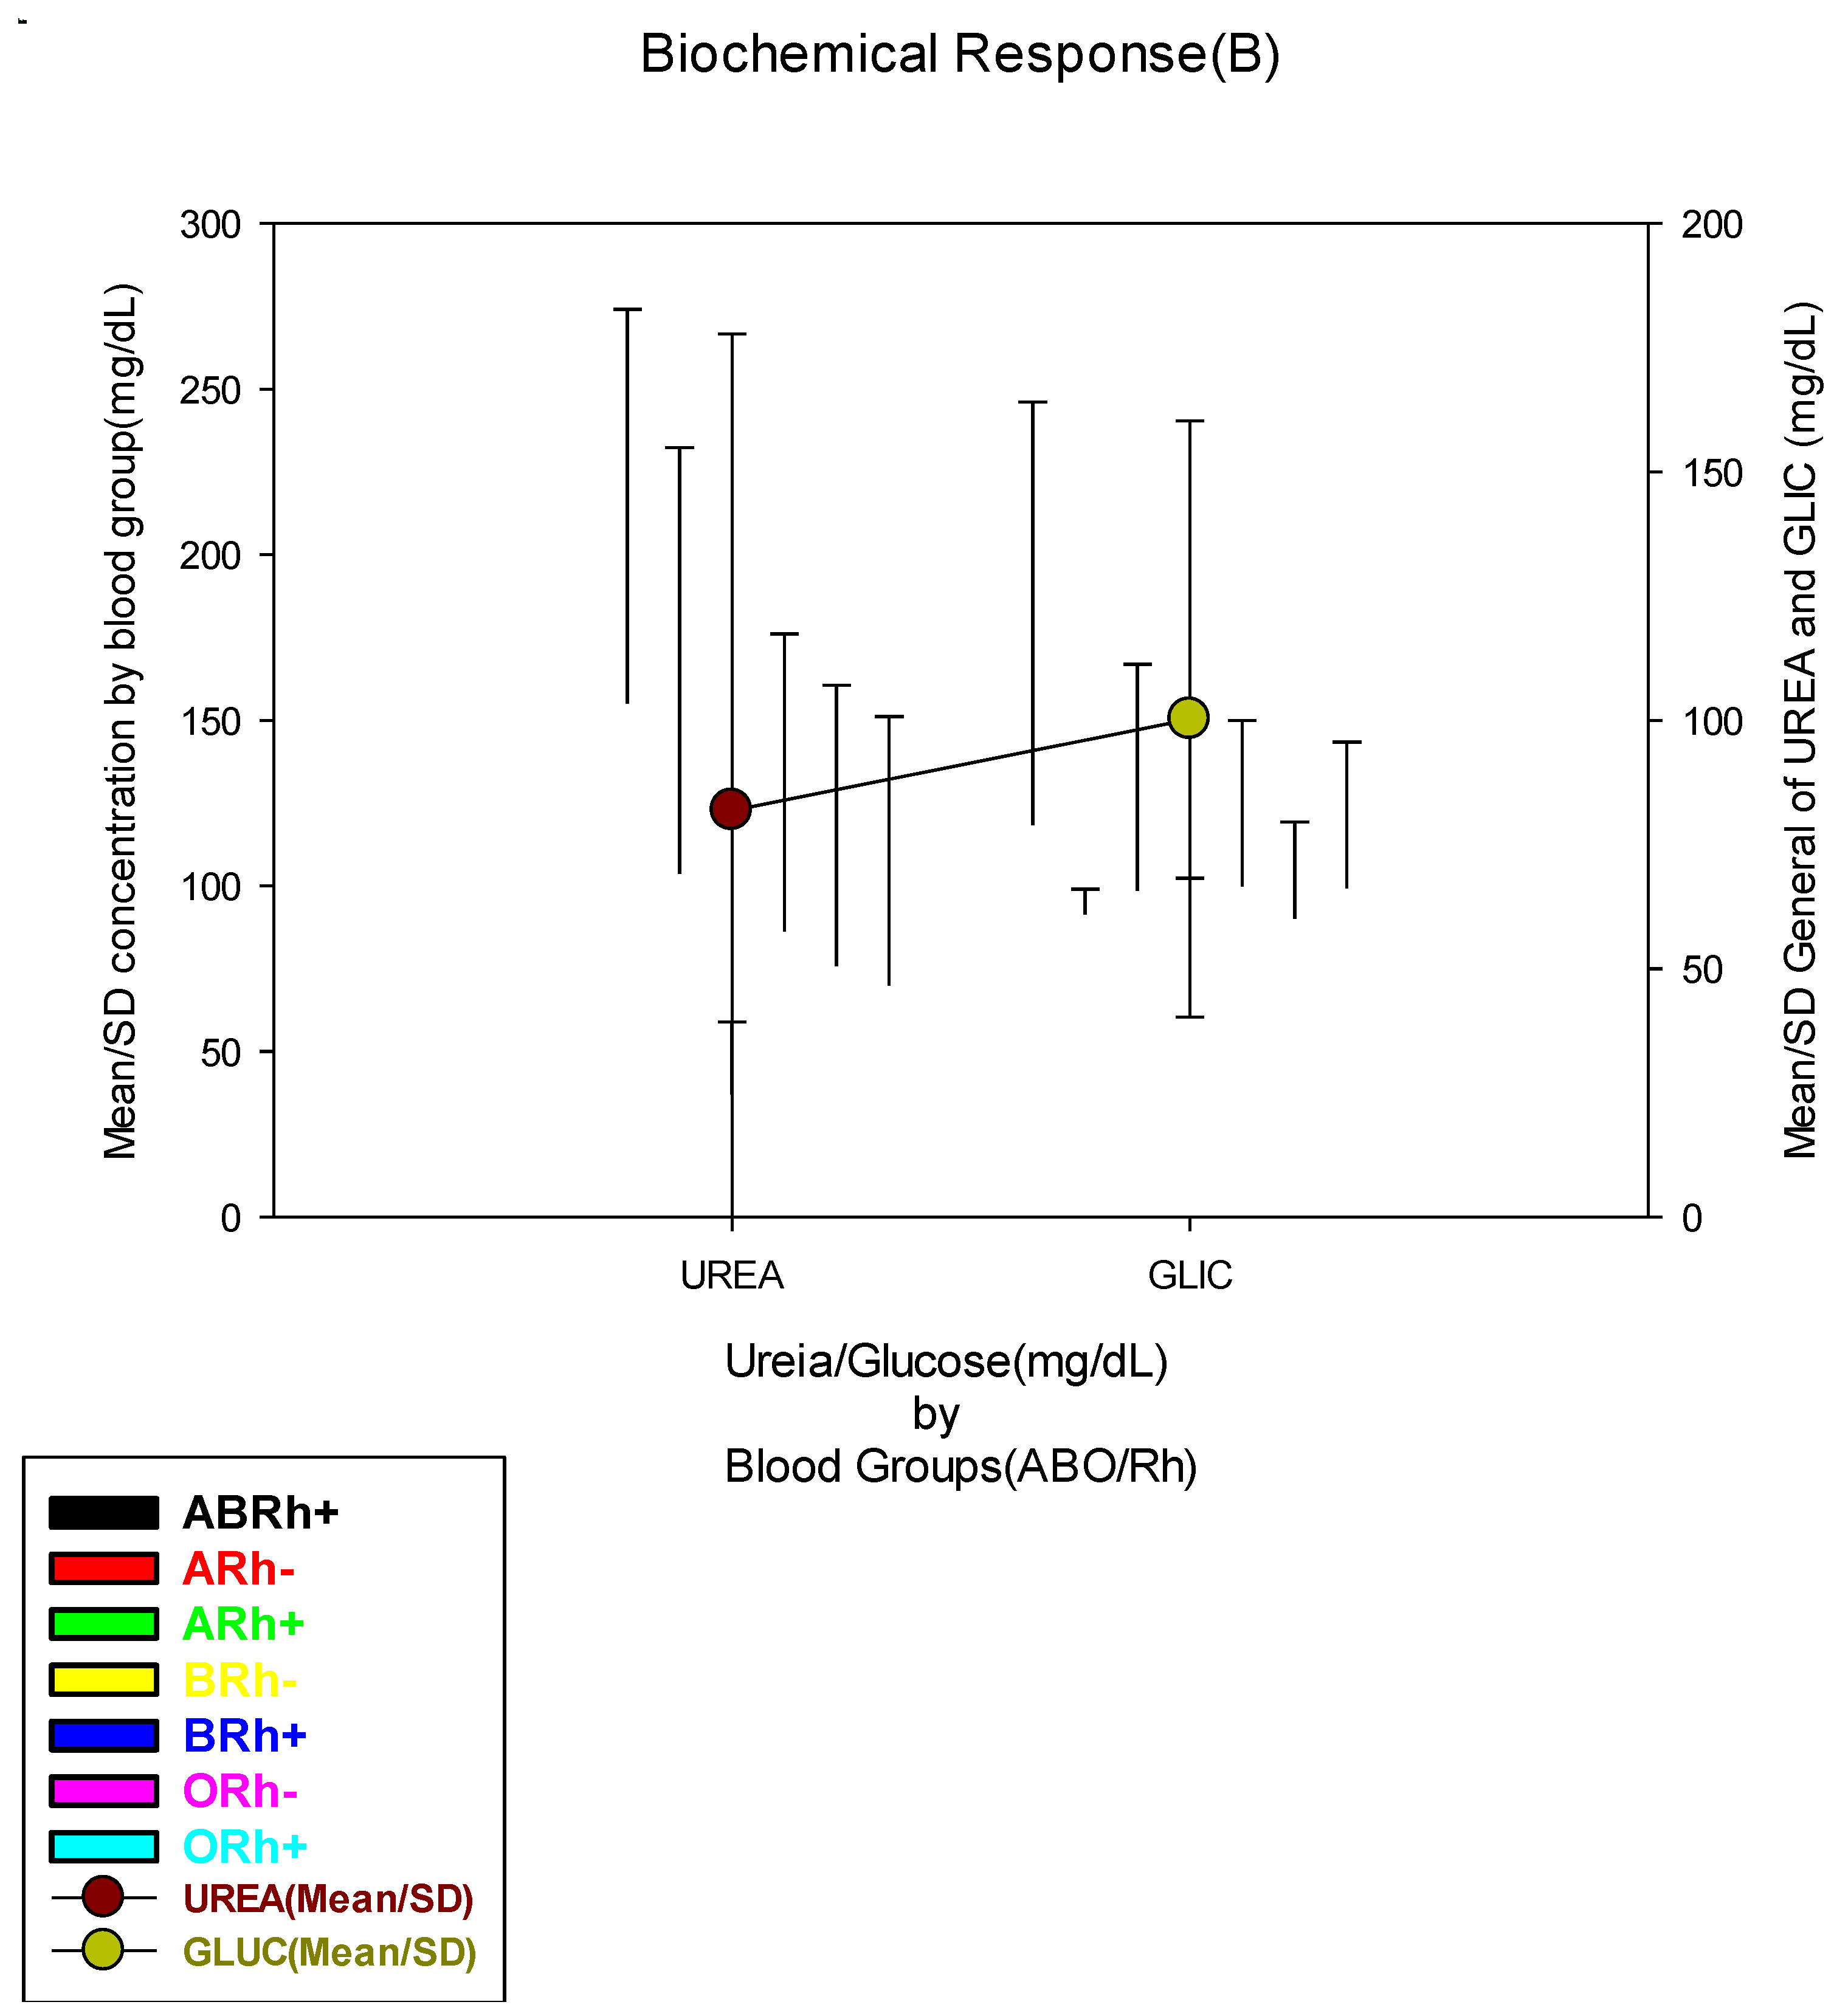
Figure 3.
C- Mean ± SD concentration of ALT(TGP), AST(TGO), and Gama GT in blood groups (ABO/Rh).
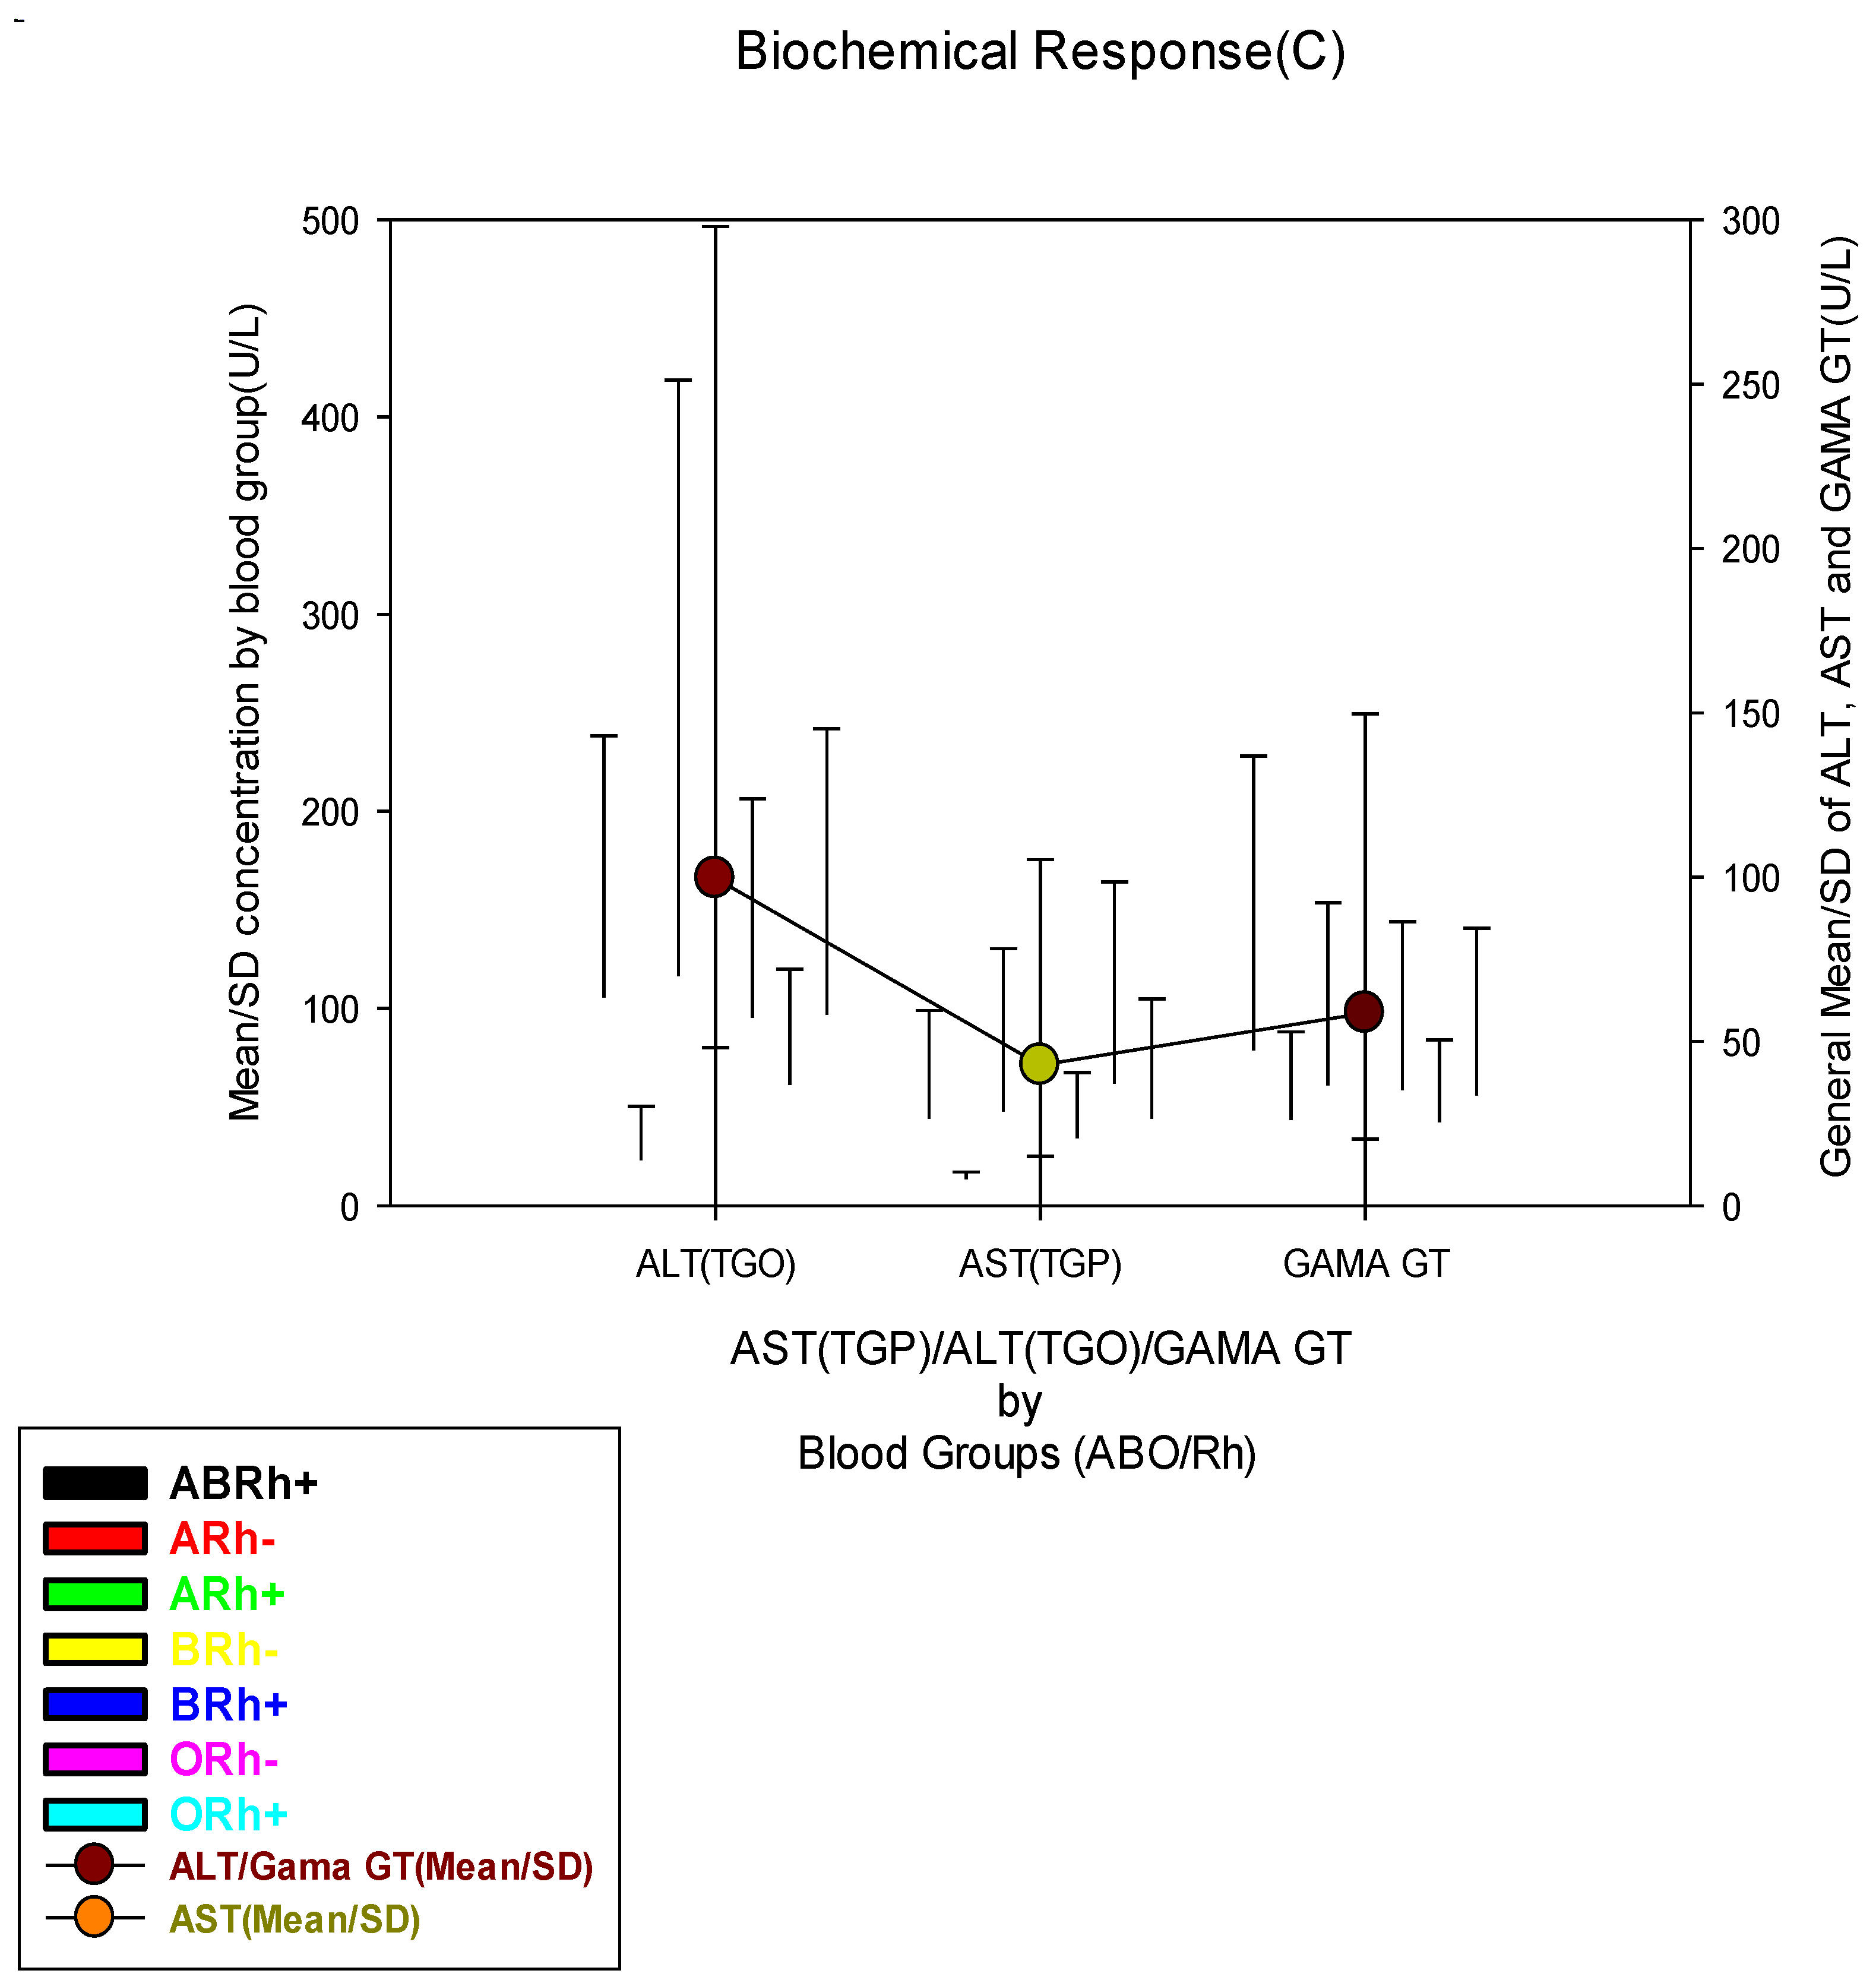

Table 1.
Sociodemographic data and blood groups (ABO/Rh).
| Sociodemographic data | Total | Bloods Groups(ABO/Rh) | X2 | ||||||
| N(%) | ABRh+ | ARh- | ARh+ | BRh- | BRh+ | ORh- | ORh+ | p-value | |
| 518(100) | 36(6.9) | 5(1.0) | 115(22.2) | 3(0.6) | 114(22.0) | 14(2.7) | 231(44.6) | ||
| Age Groups | |||||||||
| Teenegers | 132(25.5) | 9(25.0) | 1(20.0) | 34(29.6) | 1(33.3) | 26(22.8) | 3(21.4) | 58(25.1) |
0.335 |
| Yougs | 305(58.9) | 22(61.1) | 4(80.0) | 63(54.8) | 1(33.3) | 76(66.7) | 6(42.9) | 133(57.6) | |
| Adults | 58(11.2) | 2(5.6) | 0(0.0) | 14(12.2) | 0(0.0) | 9(7.9) | 4(28.6) | 29(12.6) | |
| Elderly | 23(4.4) | 3(8.3) | 0(0.0) | 4(3.5) | 1(33.3) | 3(2.6) | 1(7.1) | 11(4.8) | |
| Gender | |||||||||
| Female | 247(47.7) | 26(72.2) | 3(60.0) | 61(53.0) | 1(33.3) | 50(43.9) | 6(42.9) | 100(43.3) | 0.041* |
| Male | 271(52.3) | 10(27.8) | 2(40.0) | 54(47.0) | 2(66.7) | 64(56.1) | 8(57.1) | 131(56.7) | |
| Residence Zone | |||||||||
| Urban | 198(38.2) | 13(36.1) | 1(20.0) | 42(36.5) | 2(66.7) | 48(42.1) | 1(7.1) | 91(39.4) |
0.142 |
| Peri-urban | 134(25.9) | 8(22.2) | 1(20.0) | 22(19.1) | 0(0.0) | 30(26.3) | 5(35.7) | 68(29.4) | |
| Rural | 186(35.9) | 15(41.7) | 3(60.0) | 51(44.3) | 1(33.3) | 36(31.6) | 8(57.1) | 72(31.2) | |
| Working Condition | |||||||||
| Formal Worker | 61(11.8) | 8(22.2) | 1(20.0) | 14(12.2) | 1(33.3) | 9(7.9) | 0(0.0) | 28(12.1) |
0.050* |
| Informal Worker | 146(28.2) | 5(13.9) | 0(0.0) | 33(28.7) | 1(33.3) | 33(28.9) | 6(42.9) | 68(29.4) | |
| Unemployed | 30(5.8) | 3(8.3) | 2(40.0) | 6(5.2) | 0(0.0) | 10(8.8) | 1(7.1) | 8(3.5) | |
| Student | 281(54.2) | 20(55.6) | 2(40.0) | 62(53.9) | 1(33.3) | 62(54.4) | 7(50.0) | 127(55.0) | |
Table 2.
Biochemical markers of blood groups (ABO/Rh).
| Biochemical Response | Total | Bloods Groups(ABO/Rh) | X2 | ||||||
| N(%) | ABRh+ | ARh- | ARh+ | BRh- | BRh+ | ORh- | ORh+ |
p-value |
|
| 518(100) | 36(6.9) | 5(1.0) | 115(22.2) | 3(0.6) | 114(22.0) | 14(2.7) | 231(44.6) | ||
| Blood Creatinine Concentration (mg/dL) | |||||||||
| Low(≤0.54 mg/dL) | 145(28.0) | 15(41.7) | 1(20.0) | 20(17.4) | 1(33.3) | 35(30.7) | 2(14.3) | 71(30.7) |
0.141 |
| Normal(0.55-1.41 mg/dL) | 193(37.3) | 11(30.6) | 1(20.0) | 51(44.3) | 2(66.7) | 39(34.2) | 8(57.1) | 81(35.1) | |
| High(≥1.42 mg/dL) | 180(34.7) | 10(27.8) | 3(60.0) | 44(38.3) | 0(0.0) | 40(35.1) | 4(28.6) | 79(34.2) | |
| Blood Direct Bilirubin Concentration (mg/dL) | |||||||||
| Normal(≤1.1 mg/dL) | 212(40.9) | 14(38.9) | 4(80.0) | 51(44.3) | 2(66.7) | 41(36.0) | 11(78.6) | 89(38.5) |
0.024* |
| High(≥1.2 mg/dL) | 306(59.1) | 22(61.1) | 1(20.0) | 64(55.7) | 1(33.3) | 73(64.0) | 3(21.4) | 142(61.5) | |
| Blood Total Bilirubin (mg/dL) | |||||||||
| Low(≤0.22 mg/dL) | 128(24.7) | 6(16.7) | 4(80.0) | 23(20.0) | 1(33.3) | 25(21.9) | 5(35.7) | 64(27.7) |
0.004** |
| Normal(0.23-1.32 mg/dL) | 159(30.7) | 18(50.0) | 1(20.0) | 42(36.5) | 1(33.3) | 27(23.7) | 7(50.0) | 63(27.3) | |
| High(≥1.33 mg/dL) | 231(44.6) | 12(33.3) | 0(0.0) | 50(43.5) | 1(33.3) | 62(54.4) | 2(14.3) | 104(45.0) | |
| Blood Urea Concentration (mg/dL) | |||||||||
| Low(≤18.0 mg/dL) | 92(17.9) | 9(25.0) | 0(0.0) | 18(15.7) | 1(50.0) | 14(12.5) | 2(14.3) | 48(20.9) |
0.639 |
| Normal(18.1-55.0 mg/dL) | 216(42.0) | 13(36.1) | 2(40.0) | 47(40.9) | 1(50.0) | 53(47.3) | 7(50.0) | 93(40.4) | |
| High(≥55.1 mg/dL) | 206(40.1) | 14(38.9) | 3(60.0) | 50(43.5) | 0(0.0) | 45(40.2) | 5(35.7) | 89(38.7) | |
| Blood Glucose Concentration (mg/dL) | |||||||||
| Low(≤63.0 mg/dL) | 75(14.5) | 4(11.1) | 0(0.0) | 20(17.4) | 0(0.0) | 13(11.4) | 6(42.9) | 32(13.9) |
0.115 |
| Normal(63.1-110.0 mg/dL) | 313(60.4) | 21(58.3) | 5(100.0) | 69(60.0) | 3(100.0) | 74(64.9) | 5(35.7) | 136(58.9) | |
| High(≥110.1 mg/dL) | 130(25.1) | 11(30.6) | 0(0.0) | 26(22.6) | 0(0.0) | 27(23.7) | 3(21.4) | 63(27.3) | |
| Blood ALT Concentration (U/L) | |||||||||
| Low(≤18.6 U/L) | 284(54.8) | 17(47.2) | 5(100.0) | 64(55.7) | 3(100.0) | 62(54.4) | 9(64.3) | 124(53.7) |
0.152 |
| Normal(18.7-36.3 U/L) | 38(7.3) | 3(8.3) | 0(0.0) | 5(4.3) | 0(0.0) | 15(13.2) | 0(0.0) | 15(6.5) | |
| High(≥36.4 U/L) | 196(37.8) | 16(44.4) | 0(0.0) | 46(40.0) | 0(0.0) | 37(32.5) | 5(35.7) | 92(39.8) | |
| Blood AST Concentration (U/L) | |||||||||
| Low(≤7.2 U/L) | 27(5.2) | 3(8.3) | 2(40.0) | 6(5.2) | 0(0.0) | 6(5.3) | 2(14.3) | 8(3.5) |
0.022* |
| Normal(7.3-41.8 U/L) | 163(31.5) | 14(38.9) | 2(40.0) | 37(32.2) | 2(66.7) | 28(24.6) | 3(21.4) | 77(33.3) | |
| High(≥41.9 U/L) | 328(63.3) | 19(52.8) | 1(20.0) | 72(62.6) | 1(33.3) | 80(70.2) | 9(64.3) | 146(63.2) | |
| Blood Gama GT Concentration (U/L) | |||||||||
| Low(≤4.5 U/L) | 11(2.1) | 0(0.0) | 0(0.0) | 3(2.6) | 0(0.0) | 4(3.5) | 0(0.0) | 4(1.7) | 0.571 |
| Normal(4.6-66.0 U/L) | 375(72.4) | 21(58.3) | 4(80.0) | 79(68.7) | 3(100.0) | 86(75.4) | 11(78.6) | 171(74.0) | |
| High(≥66.1 U/L) | 132(25.5) | 15(41.7) | 1(20.0) | 33(28.7) | 0(0.0) | 24(21.1) | 3(21.4) | 56(24.2) | |
Table 3.
Clinical condition and blood groups (ABO/Rh).
| Clinical data | Total | Bloods Groups(ABO/Rh) | X2 | |||||||
| N(%) | ABRh+ | ARh- | ARh+ | BRh- | BRh+ | ORh- | ORh+ |
p-value |
||
| 518(100) | 36(6.9) | 5(1.0) | 115(22.2) | 3(0.6) | 114(22.0) | 14(2.7) | 231(44.6) | |||
| Parasitemic Level | ||||||||||
| Low(≤50p/mm3) | 157(30.3) | 7(19.4) | 2(40.0) | 44(38.3) | 1(33.3) | 37(32.5) | 5(35.7) | 61(26.4) |
0.449 |
|
| Moderate(51-1000 p/mm3) | 135(26.1) | 13(36.1) | 1(20.0) | 29(25.2) | 0(0.0) | 20(17.5) | 3(21.4) | 69(29.9) | ||
| High(1001-10.000 p/mm3) | 210(40.5) | 15(41.7) | 2(40.0) | 38(33.0) | 2(66.7) | 51(44.7) | 6(42.9) | 96(41.6) | ||
| Hyper(≥10.001 p/mm3) | 16(3.1) | 1(2.8) | 0(0.0) | 4(3.5) | 0(0.0) | 6(5.3) | 0(0.0) | 5(2.2) | ||
| Clinical Condition | ||||||||||
| Light | 71(13.7) | 6(16.7) | 0(0.0) | 16(13.9) | 0(0.0) | 15(13.2) | 2(14.3) | 32(13.9) |
0.763 |
|
| Moderate | 283(54.6) | 18(50.0) | 5(100.0) | 61(53.0) | 2(66.7) | 56(49.1) | 8(57.1) | 133(57.6) | ||
| Severe | 164(31.7) | 12(33.3) | 0(0.0) | 38(33.0) | 1(33.3) | 43(37.7) | 4(28.6) | 66(28.6) | ||
| Antimalarial treatments | ||||||||||
| Artesunate | 346(66.8) | 26(72.2) | 2(40.0) | 82(71.3) | 2(66.7) | 80(70.2) | 10(71.4) | 144(62.3) |
0.134 |
|
| Arthemeter | 70(13.5) | 6(16.7) | 0(0.0) | 14(12.2) | 1(33.3) | 17(14.9) | 3(21.4) | 29(12.6) | ||
| Coartem | 102(19.7) | 4(11.1) | 3(60.0) | 19(16.5) | 0(0.0) | 17(14.9) | 1(7.1) | 58(25.1) | ||
| Outcomes | ||||||||||
| Discharged | 424(81.9) | 28(77.8) | 5(100.0) | 96(83.5) | 3(100.0) | 88(77.2) | 11(78.6) | 193(83.5) |
0.479 |
|
| Long Hospitalization | 66(12.7) | 7(19.4) | 0(0.0) | 16(13.9) | 0(0.0) | 19(16.7) | 1(7.1) | 23(10.0) | ||
| Dead | 28(5.4) | 1(2.8) | 0(0.0) | 3(2.6) | 0(0.0) | 7(6.1) | 2(14.3) | 15(6.5) | ||
Disclaimer/Publisher’s Note: The statements, opinions and data contained in all publications are solely those of the individual author(s) and contributor(s) and not of MDPI and/or the editor(s). MDPI and/or the editor(s) disclaim responsibility for any injury to people or property resulting from any ideas, methods, instructions or products referred to in the content. |
© 2025 by the authors. Licensee MDPI, Basel, Switzerland. This article is an open access article distributed under the terms and conditions of the Creative Commons Attribution (CC BY) license (http://creativecommons.org/licenses/by/4.0/).
Copyright: This open access article is published under a Creative Commons CC BY 4.0 license, which permit the free download, distribution, and reuse, provided that the author and preprint are cited in any reuse.


