Introduction
Freshwater scarcity and desertification are one of the global problems of mankind, which is worsening with the growth of the world population, economic development and climate change. According to the New UNICEF-WHO Report (2023), already about 2.2 billion people do not have access to clean drinking water at home and 3.4 billion people live without basic sanitation. Global population growth by 2050 could increase water demand by 55% and 40% of the world's population will face acute water shortages.
The annual rainfall is about 5.05×10¹⁴ m3 of which 1.07×10¹⁴ m3 falls on land (Chowdhury, 2005). There is an average of 715 mm of precipitation per unit area, and about 13,200 m3 (36 m3 per day) of water per inhabitant per year. This is tens of times greater than the demand, but the highly heterogeneous distribution of precipitation across the globe means that some regions are systematically prone to floods and flooding, while other regions with “absolute water scarcity” (Masson-Delmotte et al., 2018) are experiencing gradual desertification of fertile land.
At latitudes 20º north and south of the equator, almost 50% of precipitation falls, and in some places annual precipitation exceeds 13,000 mm. At the same time, the latitudes from 20º to 35º in the northern and southern hemisphere have the largest deserts, where annual precipitation is 100 mm or less. The world's deserts, excluding Antarctica and the Arctic, cover 21 million km², which is 14% of the land area (Wikipedia), including 36% of Africa, almost all of the Middle East, much of Central Asia, Australia, and North and South America. Global climate warming (Trenberth et al., 2007) is degrading and turning into deserts an average of 6 million hectares of fertile land each year, and reducing the productivity of over 20 million hectares. Since 1900, the 4800 km wide Sahara Desert has moved southward by 250 km. As a result, 150 million hectares have been desertified, from which 6 million inhabitants have been forced to emigrate (Cook and Edward, 2015). The Gobi, Libyan, Syrian, Kalahari, Karakum and other deserts are also expanding. The annual economic damage from desertification amounts to tens of billions of dollars (UNESCO, 2017).
A sad example of water scarcity is the drying up of the Aral Sea with desertification and salinization of vast areas of Central Asia (Aladin et al., 1995). This was caused by the diversion for irrigation of most of the runoff from the Syr-Darya and Amu-Darya rivers that flowed into the sea. Twelve lakes with an area of 1000 to 20,000 km2 decreased in area several times or dried up completely: Lake Chad in Cameroon, Qinghai, Lonur, Poyang and Ebinur in China, Urmia and Hamun in Iran, the Great Salt Lake and Tulare in the USA, Chapala in Mexico, and Poopo in Bolivia (Downing et al., 2006). The drying up of these and hundreds of smaller lakes has led to desertification and salinization of vast areas. The causes of lake shrinkage are excessive water withdrawals for irrigation and urban feeding, while the causes of desertification are drought, overgrazing, deforestation, overpopulation, intensive agriculture and climate change.
The process of desertification is also observed in the south of the Russian Federation (Petrov et al., 1999). In the Black Lands of Kalmykia and Kizlyar pastures of Dagestan, in the last 200 years about 3.5 million ha of pastures with stable grass cover have turned into anthropogenic desert with moving sands, and more than 7 million ha have been degraded due to overgrazing and plowing of steppes under conditions of hot climate and precipitation deficit (Dedova et al., 2020). There is also land degradation in some areas of Volgograd, Rostov, Astrakhan, Saratov and Novosibirsk regions, Stavropol Krai, Republics of Tatarstan, Khakassia and Buryatia. According to the Russian Academy of Sciences, 65% of arable land, 28% of hayfields and 50% of pastures in Russia are exposed to erosion, periodic droughts, dry winds and dust storms (Kulik et al., 2018). The threat of their desertification forced the Ministry of Agriculture of the Russian Federation together with the Ministry of Natural Resources and the Russian Academy of Sciences to establish in 2019. “Center to Combat Desertification of Territories”.
In 2019, the UN's “Intergovernmental Panel on Biodiversity and Ecosystem Services” (IPBES of UN) concluded, based on a large-scale study, that “about 75% of the planet's land is significantly degraded and this threatens the security of 3.2 billion people. If this trend continues, more than 90% of land could be unusable by 2050”. This means that desertification is a worldwide problem that could lead to a global economic crisis, famine and population migration.
The traditional sources of fresh water are rivers, lakes, springs, rain, snow and easily accessible groundwater. But their resources are insufficient for domestic needs and the growing demands of agriculture and industry. This is forcing freshwater shortages to be met at an increasing rate by non-traditional sources, including groundwater mining, offshore groundwater extraction, treatment and reuse of municipal wastewater, drainage irrigation and ship ballast water, and finally seawater desalination (Konikow and Kendy, 2005; Jones et al., 2019; Qadir et al., 2022). Despite the abundance of traditional and non-traditional water sources and management solutions to comply with water conservation (Danilov-Danelyan, 2019), desertification of territories and expansion of the boundaries of almost all existing deserts continues. Therefore, the search for new sources of fresh water is of high relevance.
The earth's atmosphere contains about 1.3–1013 m3 of moisture, of which 98% is water vapor and 2% is clouds (Beysens and Milimouk, 2000). This is 5-6 times more than all of the planet's rivers contain (Downing et al., 2006). At the same time, atmospheric moisture is an inexhaustible source, as it is continuously renewed with a periodicity of 40-45 days due to the hydrological cycle of condensation of water пара выпадение oсадкoв испарение from the surface of oceans, seas, soil and plants (Graham et al., 2010). Therefore, one of the promising sources of freshwater recharge is the precipitation of part of the atmospheric moisture by artificially increasing precipitation and collecting water from fogs.
The purpose of this paper is to review theoretical and experimental studies of the possibility of creating artificial clouds and rainfall using some new approaches. For this purpose, based on the analysis of the results of previous authors, three different physical principles of creating artificial upward flows and clouds are proposed and tested in the field conditions and a promising variant of developing one of these principles is proposed. The paper contains an introduction, 6 sections and a conclusion. The introduction discusses the relevance of the problem of fresh water scarcity. The first section is devoted to a brief analysis of previously proposed methods and technical means of creating artificial clouds, the second, third and fourth sections are devoted to the theoretical and experimental study of three different physical principles of creating artificial clouds, the fifth section is devoted to the development and discussion of the elements of the most promising method of creating artificial rain. The main conclusions are summarized in the conclusion.
1. Previously Proposed Methods for Creating Artificial Clouds and Precipitation
One of the ways to replenish freshwater supplies is the application of artificial precipitation enhancement (APE) methods, which are used in more than 50 countries (Flossmann et al., 2019; Korneev et al., 2019; Abshaev, Flossmann et al., 2022). Traditional PPI methods involve enhancing the precipitation efficiency of natural clouds by seeding them with crystallization and condensation nuclei using aircraft, rocket, artillery, and ground-based generators. However, in arid regions, the capability of these methods is very limited due to the limited cloud days and cloud resources. For example, under UAE conditions, with an annual norm of 80 mm, aerial cloud seeding can increase rainfall by only 5 mm (Al Hosari et al., 2021, Wehbe et al., 2023).
The question arises whether there is no possibility of increasing the number of days with clouds and increasing the potential for inducing artificial rains, for example, due to situations in which, for example, the development of convective clouds is restrained by the surface layer of inversion or the initial momentum of convection is insufficient. A positive answer to this question is provided by the observed formation of convective clouds in nature over forest and other large natural and artificial fires, active volcanoes, sun-warmed mountain tops, nuclear power plants, thermal power plants, and “heat islands” over megacities. These clouds, called “Pyro Clouds” and “Industry Clouds”, are often accompanied by thunderstorms and heavy rainfall even on days when convective clouds are not forecast to develop (From et al., 2003; From et al., 2005, Rosenfeld et al., 2007).
Attempts to create such clouds and precipitation have been made since ancient times. Their physical basis is the stimulation of thermal convection by heating localized areas of the surface atmosphere with the help of various heat sources. The oldest method of inducing rain during a drought involved the creation of artificial fires in the prairies and savannahs of South America and Equatorial Africa (Espy, 1850).
In the 1960s and 1970s, there were vigorous attempts to create artificial clouds using meteotrons, which are thermal sources of warming the surface air by heat generated by burning petroleum products. These include:
- ➢
Flare meteotrons tested in France and Cuba (Dessens and Dessens, 1964; Dessens, 1965), which contained 100 or more jet burners placed on an area of 33 m radius. They consumed about 60 and 105 tons/hour of gas oil and had capacities of 700 and 1000 MW. Incomplete combustion of the fuel resulted in heavy soot pollution, but could also warm the jet by absorbing solar radiation.
- ➢
Flamethrower meteotron of the Institute of Geology and Geophysics of the Siberian Branch of the Russian Academy of Sciences, described in (Vulfson and Levin, 1987), which had 60 jet flamethrowers placed on the perimeter of an octagon with a side of 53 meters. It developed a power of 5-6 GW and consumed about 430 tons/hour of diesel fuel. Rising streams containing black smoke rose to heights of up to 3 km in some of the 8 experiments.
- ➢
Meteotrons of the Chelyabinsk Polytechnic Institute (8 variants), were designed to ventilate coal mines, create clouds and disperse fog. They contained from 10 to 100 centrifugal nozzles with diesel fuel consumption from 7 to 30 tons/hour, and developed power from 80 to 400 MW (Kuznetsov and Konopasov, 2014, 2015). Fine atomization of diesel fuel in combination with different nozzle placement options ensured complete combustion of fuel and smokeless jet.
- ➢
Meteotrons of the Institute of Applied Geophysics of the USSR Hydromet with 4 and 10 jet engines, designed to investigate the possibility of creating artificial clouds and precipitation, had capacities of 200 and 500 MW, and the “Super Meteotron”, built on the shore of the high-mountainous Lake Sevan to replenish the water level in it, contained 6 engines with a total capacity of 500 MW (Vulfson and Levin, 1987). On the basis of theoretical modeling of jet rise, it was shown (Vulfson and Levin, 1987, Kachurin, 1990) that at a meteotron power of about 103 MW, the upward jet could reach a height of 600-1000 meters. In some experiments, under favorable conditions, the formation of small convective clouds or intensification of existing clouds was noted.
- ➢
A device for initiating an annular vortex of air using 50-60 aircraft engines arranged in a ring with a radius of 800 m and numerous seawater atomizers inside and outside this ring (USA Patent No. 2740663, Pomykala, 1951).
Proposals to stimulate the development of artificial clouds and precipitation by heating the surface air layer with solar meteotrons are also known:
- -
The simplest solar meteotron is a patch of ground surface covered with asphalt, black cloth, or vegetation that absorbs solar radiation well and can create “heat islands” (Fuchs, 2007; Duffie and Beckman, 2013; Branch et al., 2020).
- -
Elevated above the ground blackened screen surrounded by a system of rotating mirrors focusing solar energy onto the screen (Patent RU No. 20712242, Oranovsky, 1994).
- -
A method of changing the albedo of the underlying surface by means of green plantings or covering with solar panels (Brenig et al., 2008, Wulfmeyer et al., 2011). Brenig et al. find that the air above a surface with low albedo, is heated more by sunlight, rises upwards and leads to a rise in sea breeze. This promotes cloud development and increased rainfall on the leeward side 25-30 km inland.
None of these methods is not applied in practice and all of them are still the subject of research and separate experiments, as the ancient method of burning prairie vegetation and shrouds is not acceptable due to the inadmissibility of burning bioresources and harm to flora and fauna, flare and flamethrower meteotrons have proved to be ineffective, small solar meteotrons are not effective, and large ones are not created, also the device with 50-60 aircraft engines and hundreds of water sprayers is not realized.
Within the framework of project No. APP-REP-2017-02120, we investigated the possibilities of stimulating convection and creating artificial clouds based on the following three updated approaches:
heating of localized regions of the surface atmosphere from solar radiation by creating an artificial aerosol layer consisting of finely dispersed aerosol that effectively absorbs solar radiation;
heating a vertical column of air from solar radiation by means of a multi-tiered Heliator device having a garland of black fabric cones lifted by helium-inflated balloons;
creation of artificial upward flow by means of vertically directed high-temperature jet stream saturated with hygroscopic aerosol with the purpose of energetic feeding of the jet stream by heat of water vapor condensation.
2. Aerosol Layer as a Solar Meteotron
This method involves the creation of artificial clouds, similar to Pyro-Clouds formed in nature over large forest and other large fires (From et al., 2003, 2005; Fuchs, 2005; Lindsey and Fromm, 2008) and Industry-Clouds formed over heat islands arising over megacities (Changnon, 1972; Khemani and Ramana Murty, 1973; Arizona Board of Regents, 2006, Goddard Space Center, 2002), nuclear and thermal power plants (Mattes, 2005). For this purpose, it is proposed to create an artificial aerosol layer that absorbs solar radiation well, warms the surface air, initiates thermal convection and convective cloud formation (Patent RU No. 2732710, Abshaev et al., 2020, 2023b). Creating such a solar meteotron is much easier and cheaper than covering with asphalt or black cloth areas commensurate with large forest fires, volcano craters, or urban heat islands over which Pyro Clouds are formed.
To verify the performance of this method, the following tasks were accomplished: selection of the optimal aerosol dispersity, design, fabrication and testing of smoke compositions generating an aerosol that effectively absorbs solar radiation, settles slowly and has hygroscopic properties; modeling of the aerosol diffusion process from discrete and continuous sources due to turbulent diffusion and wind transport; design and fabrication of smoke bombs and field experiments to create an aerosol layer.
2.1. Chosen of the Aerosol Dispersity
Chosen of the aerosol dispersity was so that the absorption maximum was in the wavelength band from 0.3 to 0.9 μm, where the main solar radiation flux is concentrated. Calculations of the absorption coefficient of solar radiation in the aerosol layer were carried out on the basis of the theory of electromagnetic wave scattering using the formula:
where
r is the radius of aerosol particles; λ is the wavelength;
n(
r) is the size distribution function of aerosol particles;
σa(λ,m,r) is the absorption cross section of aerosol particles calculated by exact diffraction formulas (Mie, 1908);
m =
n-
iκ, is the complex refractive index of the particle substance, where n is the refractive index and
κ is the absorption index;
n = 0.047λ+1.4317;
κ = -0.008λ+0.756.
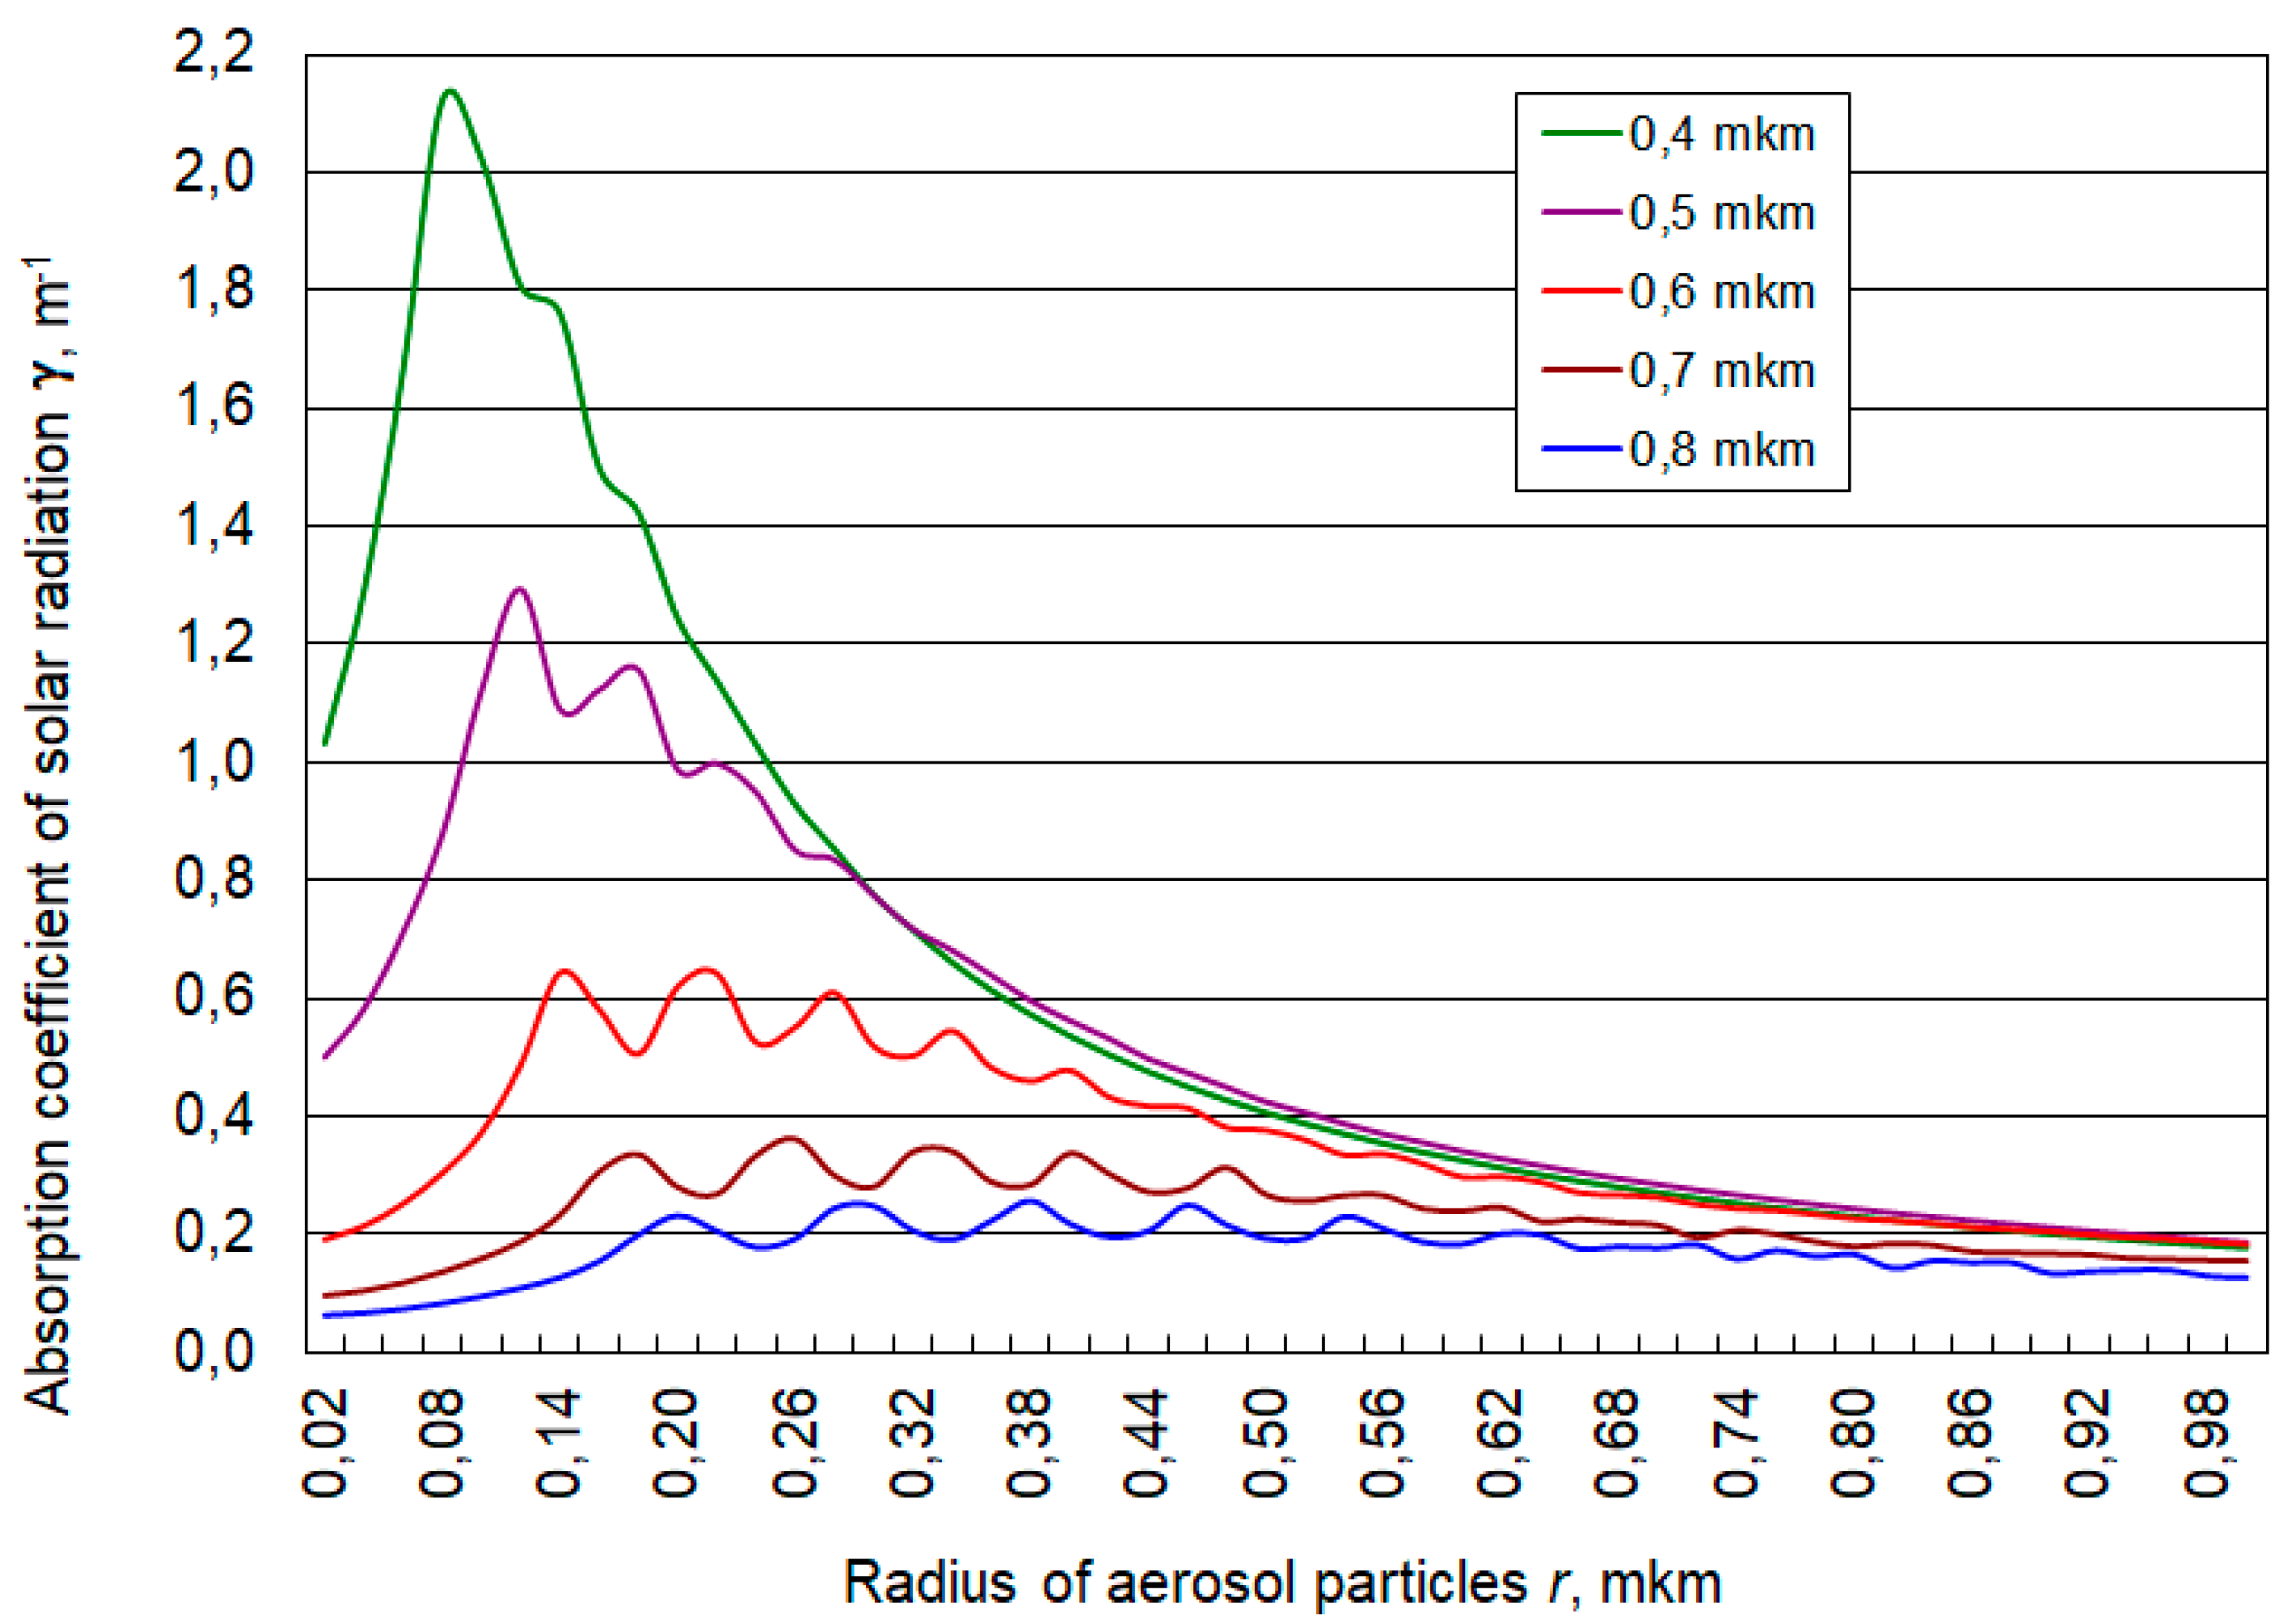
Figure 1.
Absorption coefficient of solar radiation (γ, m-1) at dose of aerosol composition 0,25 g/m2 depending on the radius of aerosol r.
Figure 1.
Absorption coefficient of solar radiation (γ, m-1) at dose of aerosol composition 0,25 g/m2 depending on the radius of aerosol r.
Calculations have shown that the value γ(λ,m,r) in the wavelength range 0.4 < λ < 0.8 µm has a maximum at aerosol radius from 0.05 < r < 0.2 µm, having also negligibly small gravitational settling velocity. At aerosol dispersity r = 0.1 μm with 1 gram of smoke composition, about N ≈ 1.2×10¹⁴ particles having a density of 2 g/cm3 come out. It follows from figure 1 that at the dosage of the smoke composition about 0.25 g/m2, or the number of particles per unit area NAS≥ 3×10¹³ m-2, almost complete absorption of solar radiation in the visible wavelength range is provided.
2.2. The Study of Aerosol Propagation
The study of aerosol propagation due to turbulent diffusion and wind transport was carried out on the basis of numerical solution of Eq:
where
is the volumetric concentration of aerosol particles;
u and
w are horizontal and vertical wind speeds;
is the aerosol gravitational settling velocity;
- sedimentation velocity of a particle of radius
r;
ρ and
- density of aerosol particle and air, respectively;
η - dynamic viscosity of air;
DT - turbulent diffusion coefficient.
For the numerical solution of equation (2.2), the origin of coordinates is placed at the point of aerosol emission, the X-axis is directed along the wind direction, and the Z-axis is vertically upward. The condition of complete absorption of aerosol particles is set at the ground surface, and the condition of complete reflection is set at the upper boundary, leading to the accumulation of impurity in this layer.
At the initial time instant, the aerosol particle concentration distribution for an instantaneous point source is given in the form:
where
N01 is the number of instantaneously generated particles; - the mean square of the initial distances between particles, determined by the initial size of the aerosol cloud; - the point of aerosol introduction.
In the case of a continuous point source, the particle number replenishment is given in the form:
where
N02 is the number of particles produced by the source per unit time.
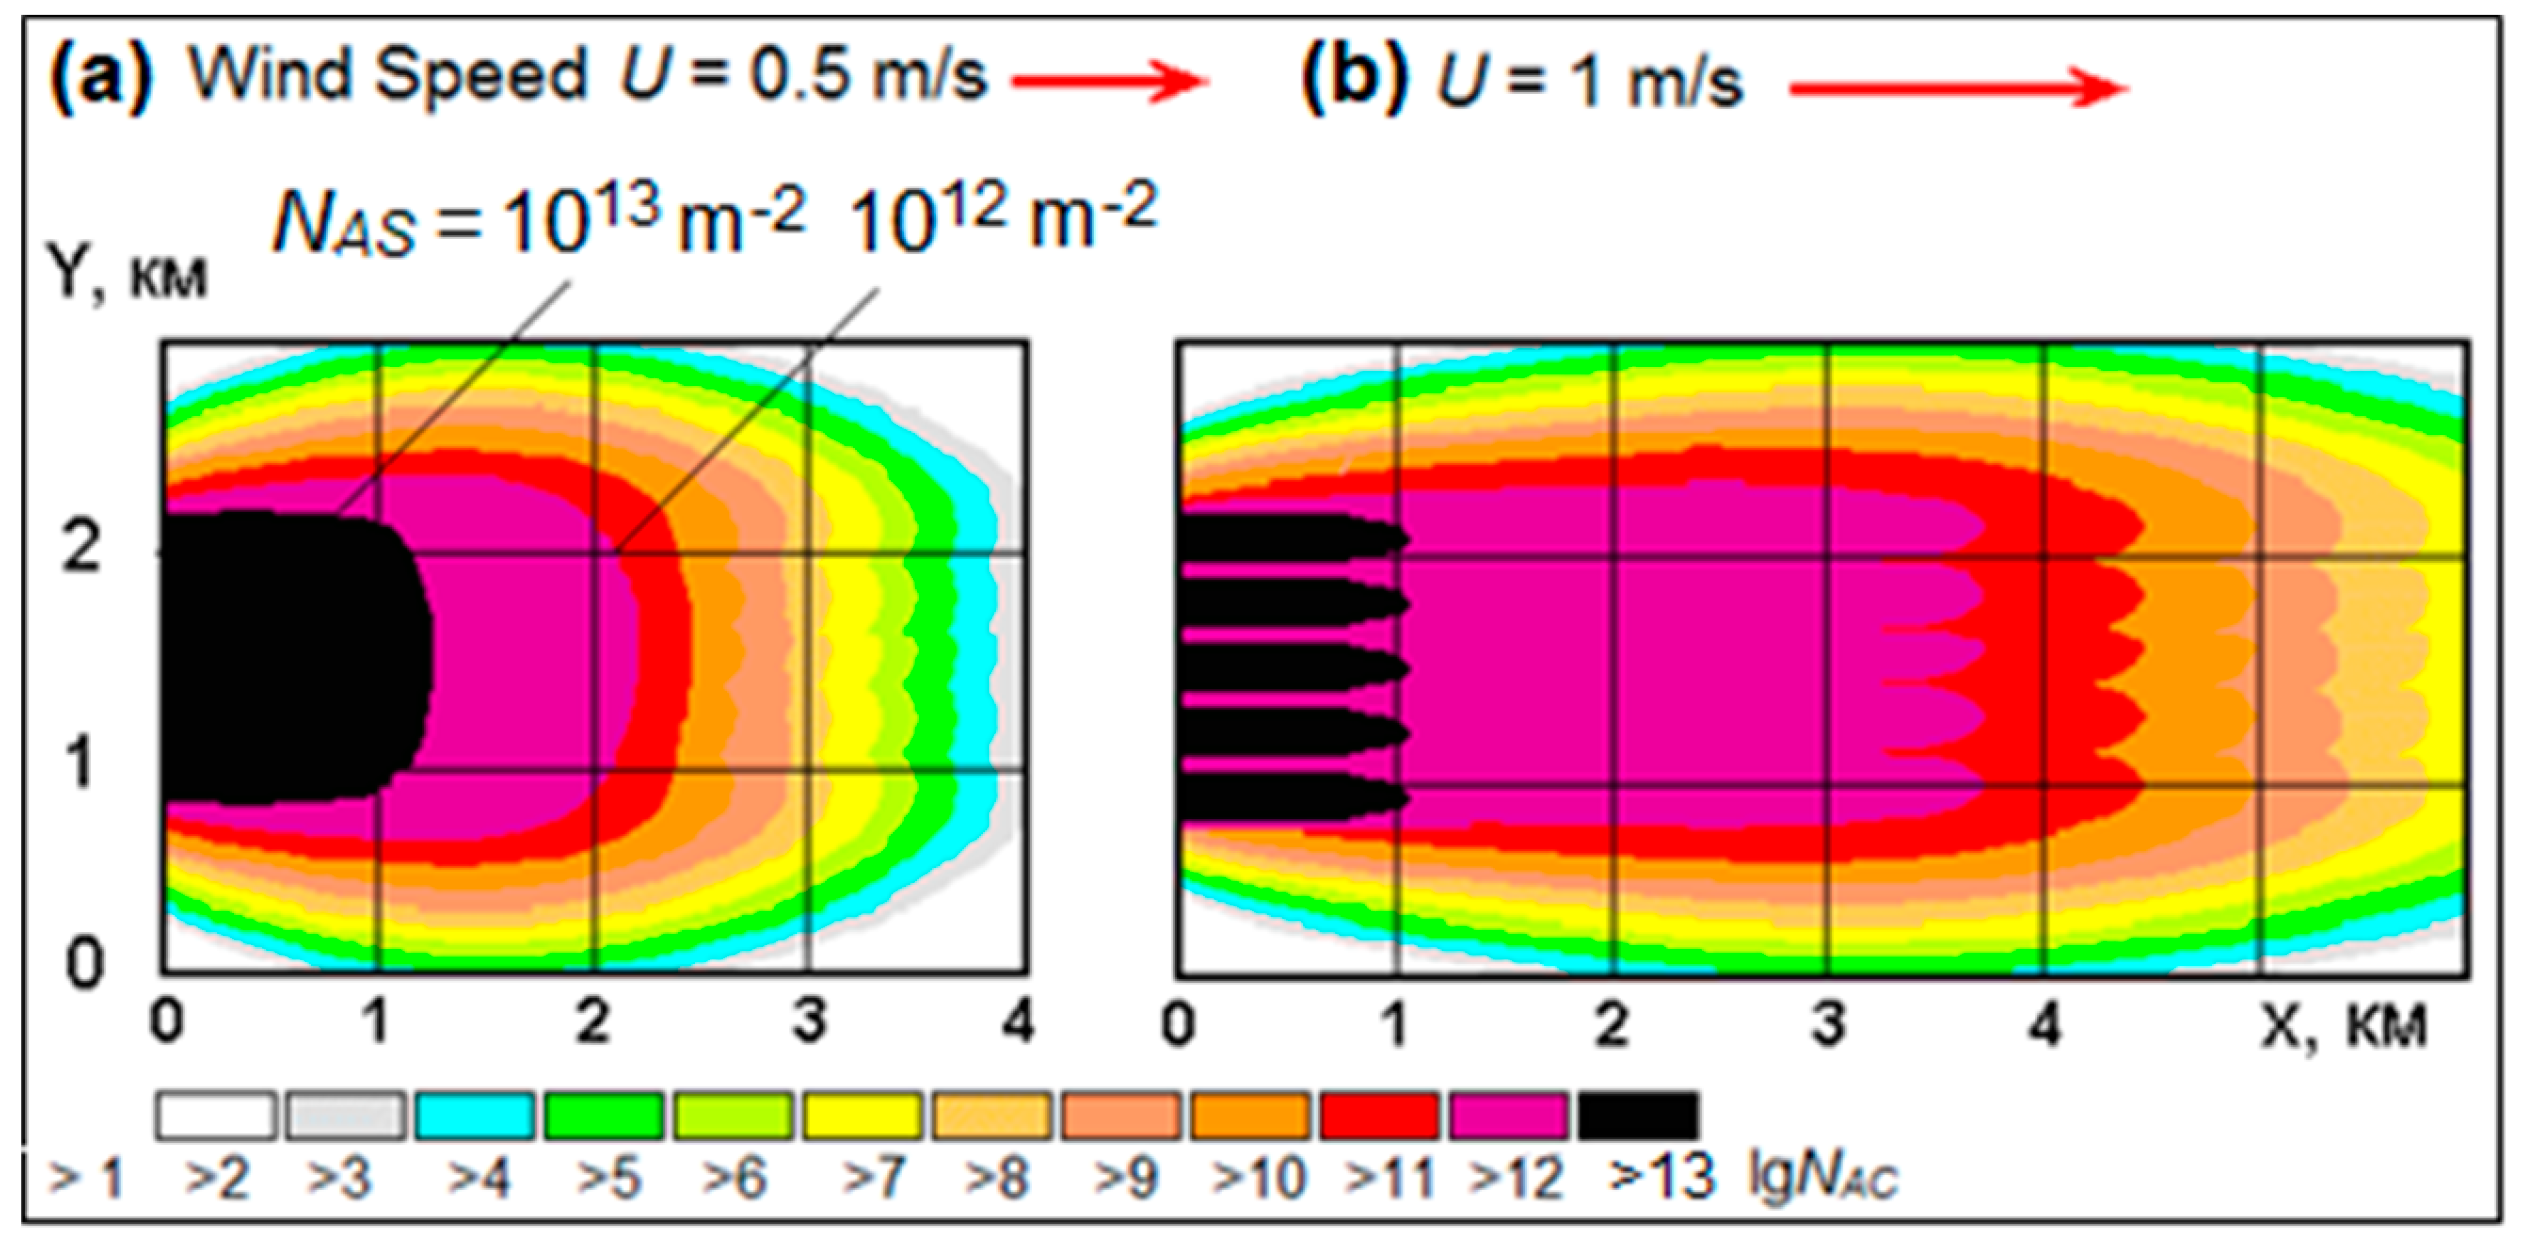
According to such modeling data, five continuous sources spaced 200 m apart across the wind direction, burning 100 kg of smoke composition for 1 hour each, can produce a continuous aerosol layer with a particle number in the vertical column NAS > 1013 m-2 over an area of about 1.5 km2 at a wind speed of 0.5 m/s and over 3 km2 at a wind speed of 1 m/s.
Figure 2.
Area distribution of the number of aerosols in a vertical column created after 1 hour of continuous operation of 5 sources located 200 m apart across the wind direction at a total aerosol composition flow rate of 500 kg: (a) at wind speed U = 0.5 m/s; (b) at wind speed U = 1 m/s.
Figure 2.
Area distribution of the number of aerosols in a vertical column created after 1 hour of continuous operation of 5 sources located 200 m apart across the wind direction at a total aerosol composition flow rate of 500 kg: (a) at wind speed U = 0.5 m/s; (b) at wind speed U = 1 m/s.
2.3. The Amount of Solar Radiation Energy Absorbed by the Aerosol Layer
The amount of solar radiation energy absorbed by the aerosol layer, which leads to the formation of a heat island, was estimated using the formula:
where
P(λ) is the spectral radiation density of the Sun; λ is the wavelength; Δλ is the width of the absorption band of the aerosol layer; γ is the absorption coefficient of solar radiation;
S is the area of the aerosol layer;
θ is the angular position of the Sun; A is the albedo of the landscape surrounding the aerosol layer; t is the duration of the aerosol layer.
Assuming that at the surface of the earth
P(λ) = 1 W/(м
2⋅nm), Δλ = 600 nm; γ = 0.9 m
-1; aerosol layer area
S = 2×10
6 m
2;
θ = 70
o; albedo of the environment (e.g., for a desert) A = 0.35;
t = 0.1 hour, we obtain that the amount of heat absorbed by the aerosol layer is
Q = 6.6×10
4 kWh = 2.4×10
8 kJ. This heat goes to heat the air in the aerosol layer and can cause its temperature to rise above its surroundings by ΔT equal to:
where
cp = 1.005 kJ/(kg
oC) is the heat capacity of air at constant pressure, and
Ma is the mass of heated air; h is the thickness of the aerosol layer;
is the air density.
At S = 2×10⁶ m2, h = 30 m, air density at the height of the experiments (1000 m above sea level) = 1.11 kg/m3 the mass of heated air will be Ma = 6.7×10⁷ kg. In 6 minutes after creation of the aerosol layer, the air temperature excess in it can reach ΔT = 3.6 oC. Such an excess of air temperature in the aerosol layer relative to the surroundings will inevitably lead to forced rise of heated air and development of convection. Continuous operation of the aerosol source can lead to the increase in time of the area and volume of the upward flow up to the volume comparable to that of Cu Cong even without taking into account the involvement of ambient air.
2.4. Numerical Modeling of Convection Stimulated by an Aerosol Layer
Numerical modeling of convection stimulated by an aerosol layer was carried out jointly with the TESIS engineering company based on the solution of the system of Navier-Stokes equations within the framework of the FlowVision 3-D hydrodynamic model (Abshaev, Aksenov et al., 2022, 2022a).
Figure 3 shows the simulation results of upward flow velocity fields that can initiate aerosol layers in a windless atmosphere having areas of
S1 = 10
4,
S2 = 10
5,
S3 = 10
6, and
S4 = 10
7 m
2, respectively. As would be expected, the lift height and volume of the initiated upward flow increase as the area of the aerosol layer increases. An aerosol layer with an area of 5-10 km
2 has a high probability of initiating thermal convection and the development of artificial convective clouds in a windless atmosphere and at low wind speeds. This probability may decrease sharply with increasing wind speed and wind shear, as can be seen in
Figure 4b.
2.5. Aerosol Compositions and Checkers
For practical realization of the aerosol method together with the Tupolev Kazan Aviation Institute (Prof. Timofeev N.E. et al.) 6 variants of smoke compositions generating aerosol of optimal size for absorption of solar radiation were developed and manufactured in the Cheboksary Production Association named Chapaev (Dr. Reznikov M.S., Emelianov V.I. et al.). To test these compositions, squibs of 26 mm caliber and 10 g mass of smoke composition were manufactured. Laboratory tests of these squibs were carried out in cloud chambers of the Scientific-Production Association “Typhoon” (Dr. Ivanov V.N., Dr. Shilin A.G. et al.) by combustion in a horizontal wind tunnel at a blowing speed of 2 m/s, with sampling and measurement of the particle spectrum in a 12 m
3 cloud chamber. The aerosol spectra of the four compositions obtained with “Laser Aerosol Spectrometer 3340” and “Electrostatic Classifiers TSI 3080” analyzers are presented in
Figure 4a.
Figure 4.
Aerosol compositions and checkers: (a) aerosol spectrum generated by smoke compositions I, II, IV, and V; (b) - temperature field of aerosol plumes generated by continuous aerosol source for 20 min from 3-D modeling data at wind speed U = 1 +0. 05H (m/s) and values of vertical temperature gradient in the atmosphere γ = 6.5, 8.0 and 9.5 oC/km; (c) - ADSH-1 aerosol checker with injector (red color); (d) - photo of aerosol plume on field tests.
On the basis of tests of optical properties of generated aerosols, 2 most effective compositions creating aerosol with a median diameter of 0.21 and 0.22 microns were selected and 10 pieces of aerosol smoke bombs ADSH-1 and ADSH-2 were manufactured each. These bombs had a metal case in the form of a cylinder with a diameter of 210 mm, height of 741 mm (figure 4c) and a remote electric ignition device. The mass of the smoke composition in each checker was 25-30 kg. The aerosol yield from one gram of the I and II versions of the smoke composition was 4.6×10¹³ and 5.6×10¹³. Consequently, one checker generated about 2.5×10¹⁸ aerosol particles.
2.6. Field Tests of Aerosol Checkers
Field tests of aerosol checkers were conducted at the Chapaev experimental polygon from October 02 to November 12, 2019 under rather harsh conditions when the gusty wind speed reached 3-7 m/s. Aerosol clouds in these conditions rose to a height of several hundred meters and were pulled downwind (figure 4d). The burning time of the checkers was about 9.3 minutes, the area of the aerosol layer created by one checker was about 3000-4000 m2, the dissipation time of the aerosol cloud after the end of the checker burning was 3-5 minutes.
The aerosol practically did not settle due to small size, but under the action of gusty wind its concentration quickly decreased and the smoke plume became invisible. Based on these results of field tests, it follows that to create an aerosol layer with the required optical density over an area of 5 km2 and to maintain the concentration of particles about NAS ≥ 3×10¹³ m-2 for 30 minutes requires about 400 checkers of ADSH-1 or ADSH-2 type with a total mass of aerosol composition of 10 tons. Under more gentle atmospheric conditions (with wind speeds of 1-2 m/s and no wind gusts), this consumption can be reduced by a factor of two or more.
In order to reduce this consumption, two more variants of the aerosol composition were developed and 2 checkers were manufactured, which generate a finer aerosol with a modal diameter of 0.03 µm and a yield from 1 gram of composition of about 4.4×10¹⁵ particles (at least 1020 particles from one checker). To create the required optical density, the aerosol concentration of this size per unit area must be at least NAS ≥ 6×10¹³ m-2. Thus, to create a 30-minute aerosol layer on the area of 5 km2 about 70 a checkers will be required.
Instead of smoke checkers aerosol generators of TDA-2K type can be used, which can work 2-3 hours on one refueling and create an aerosol layer over large areas. In any case, to stimulate convection and development of artificial clouds it is necessary to create an aerosol layer with sizes comparable to the sizes of large fires and heat islands over megacities, over which Pyro and Industry clouds are formed. And this requires large expenditures of smoke compositions. Therefore, for the purposes of ecological safety this method can be used only in sparsely populated desert regions.
The estimates presented here may be useful for understanding the effects of burning oil puddles, aerosol emissions from volcanoes and the conditions of Pyro and Industry clouds formation.
3. Multitier Garland of Black Screens
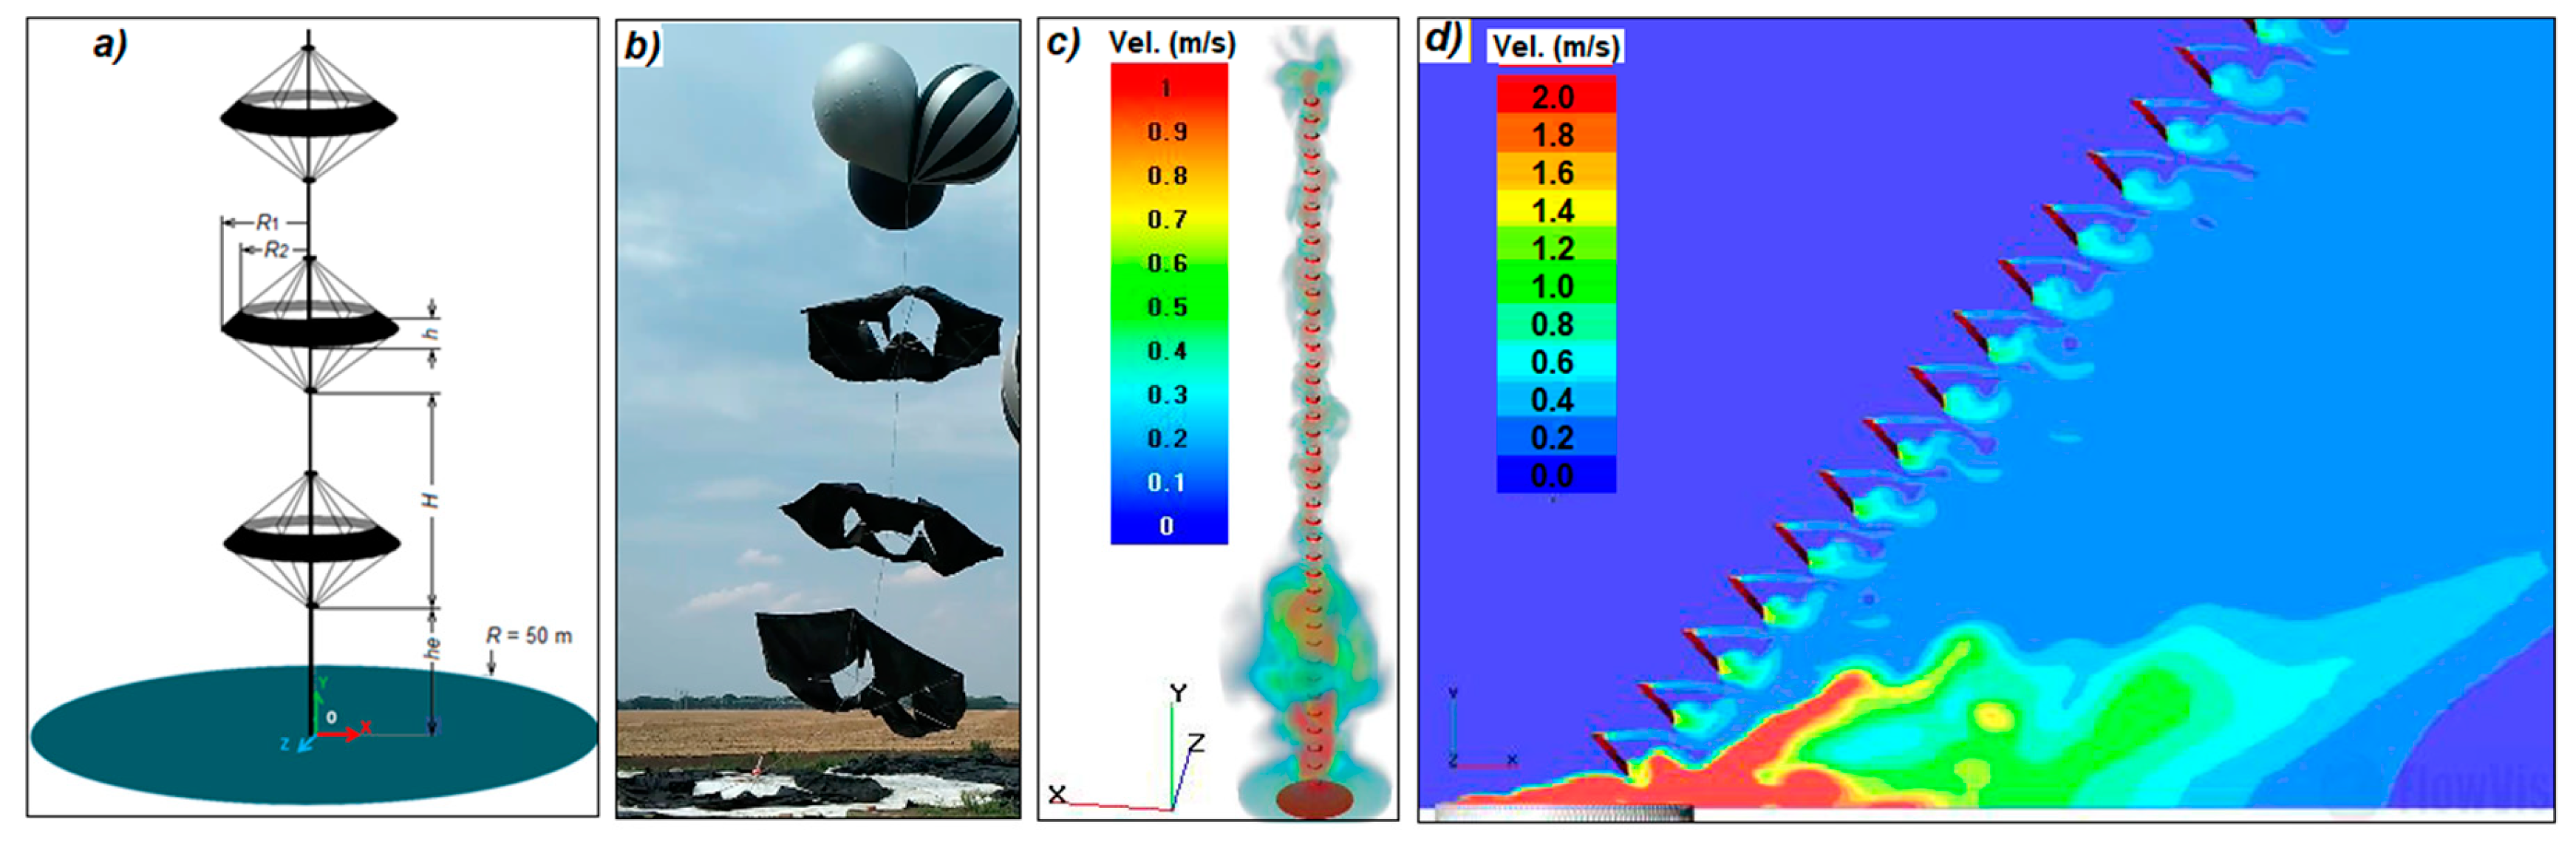
This method involves the Heliator-2 device, which is a 30-40 tiers garland of black screens of toroidal shape with a diameter of 15 m, lifted by a helium-filled balloon (figure 5a).
It was assumed that each black screen would be heated by the Sun, warming the adjacent air and initiating an updraft reaching the next tier. Repeating this process on all tiers could result in the formation of an updraft jet reaching the height of the condensation level and the formation of an artificial cloud (figure 5c). In order to enhance the effect, the Heliator-2 device should be raised above an aerosol layer or a blackened circle that absorbs solar radiation, and spark ionizers should be installed on each tier so that the ions formed contribute to the condensation of water vapor (Pavlyuchenko, 2019). Field tests of the prototype Heliator-2 device, showed that the high sailing of the screens does not allow to lift the garland having more than 4-5 tiers even in low wind (figure 5b).
Theoretical modeling on a supercomputer in CFD-simulators ANSYS and FlowVision showed that adiabatic cooling and wind drift complicates the overcoming of heated air by the height difference between the tiers and the formation of a continuous updraft jet, and at wind speeds greater than 1 m/s wind drift excludes the addition of upward flows created by each tier (
Figure 5d).
Thus, experimental and theoretical studies have shown that this principle of creating artificial clouds is not promising.
4. Jet Method
4.1. Physical Basis of the Method
This method involves the creation of artificial clouds using a vertically directed jet stream from an aircraft engine, fueled by the heat of condensation of water vapor on three types of hygroscopic aerosols introduced into the stream. Its fundamental difference from the previously proposed meteotrons (Vulfson and Levin, 1987) is that the jet is saturated with three types of hygroscopic aerosol at the start in order to energetically feed the jet with the heat of water vapor condensation on these aerosols (Patent RU No. 2738479, Abshaev et al., 2020.
To improve this recharge, hygroscopic substances with different hygroscopic points are used. The first of them CaCl2 is a very strongly hygroscopic substance with hygroscopic point RH1 < 6%, the second (NH2)2CO is a strongly hygroscopic substance with hygroscopic point RH2 = 66.5%, and the third NaCl is a hygroscopic substance with hygroscopic point RH3 = 78% (Tereshchenko, A.G., 2015). All three types of aerosols were introduced into the jet by spraying concentrated aqueous solutions using a system of nozzles placed along the contour of the jet or powerful fogging guns spraying from 0.6 to 1.0 L of solution per minute. Solutions of all substances were sprayed to droplets of about 15 μm diameter so that their evaporation formed aerosols of 10 ± 3 μm diameter at a concentration of about (4-5)×1011 particles of each type per second. It was assumed (Abshaev et al., 2022b) that these three types of aerosols would provide intensive condensation of water vapor, release of condensation heat, and enhancement of the upward flow velocity and height of its ascent at air humidity from 6% to 78% throughout the sub cloud layer to the level of natural cloud formation.
In addition to the above three substances, NaCl/TiO2 nano-powder, which can condense many times more water vapor than the listed aerosol types, was also used in the field experiments (Liang et al., 2019; Tai et al., 2017).
4.2. Estimating the Heat of Condensation
Hygroscopic aerosol provides condensation of water vapor at densities lower than the saturating density, thereby lowering the height of artificial cloud formation. It was shown in (Abshaev et al., 2022b) that the maximum amount of water vapor mw that can be condensed by an aerosol particle of mass ma can be estimated using the formula:
where
κ is the ratio of the mass of condensed water to the mass of dissolved matter in the saturated solution;
CC = ES/E is the ratio of the water vapor pressure over a drop of saturated solution ES to the pressure over a flat surface of distilled water
E;
CS = Δ
ES/E∞ is the ratio of the difference between the indicated pressures Δ
ES to the vapor pressure in the environment
E∞. The values of
κ,
CC, and
CS are given in reference books (Tverskoy, 1962, etc.).
Table 1 shows the amount of each type of solute introduced into the jet stream every second during the experiments, the number of aerosol particles
N formed, the particle condensation growth coefficient
k1, the mass of water condensed on one particle mw, the mass of water condensed on all particles
Mw, and the maximum amount of latent heat of condensation
PC that could be released.
When the experimental setup is operated using three substances (NaCl, CaCl2 and (NH2)2CO) in the quantities shown in the first three rows of
Table 1, at an air humidity of RH > 80%, 4.23 kg of water vapor can condense every second with a condensation heat release equal to:
This is equivalent to making the jet power of a D-30 aircraft engine equal to 69 MW increase by almost 14%. Introducing 476 g/s of NaCl/TiO2 aerosol into the jet stream at an air humidity RH > 66.2% can result in condensation of 4.46 kg/s of water and release of condensation heat of about 10.08 MJ/s. This amount of heat can appreciably increase the energy of the jet, especially at the stage when its temperature equalizes with the ambient air temperature and it loses buoyancy.
4.3. Numerical Modeling of Jet Motion in the Atmosphere
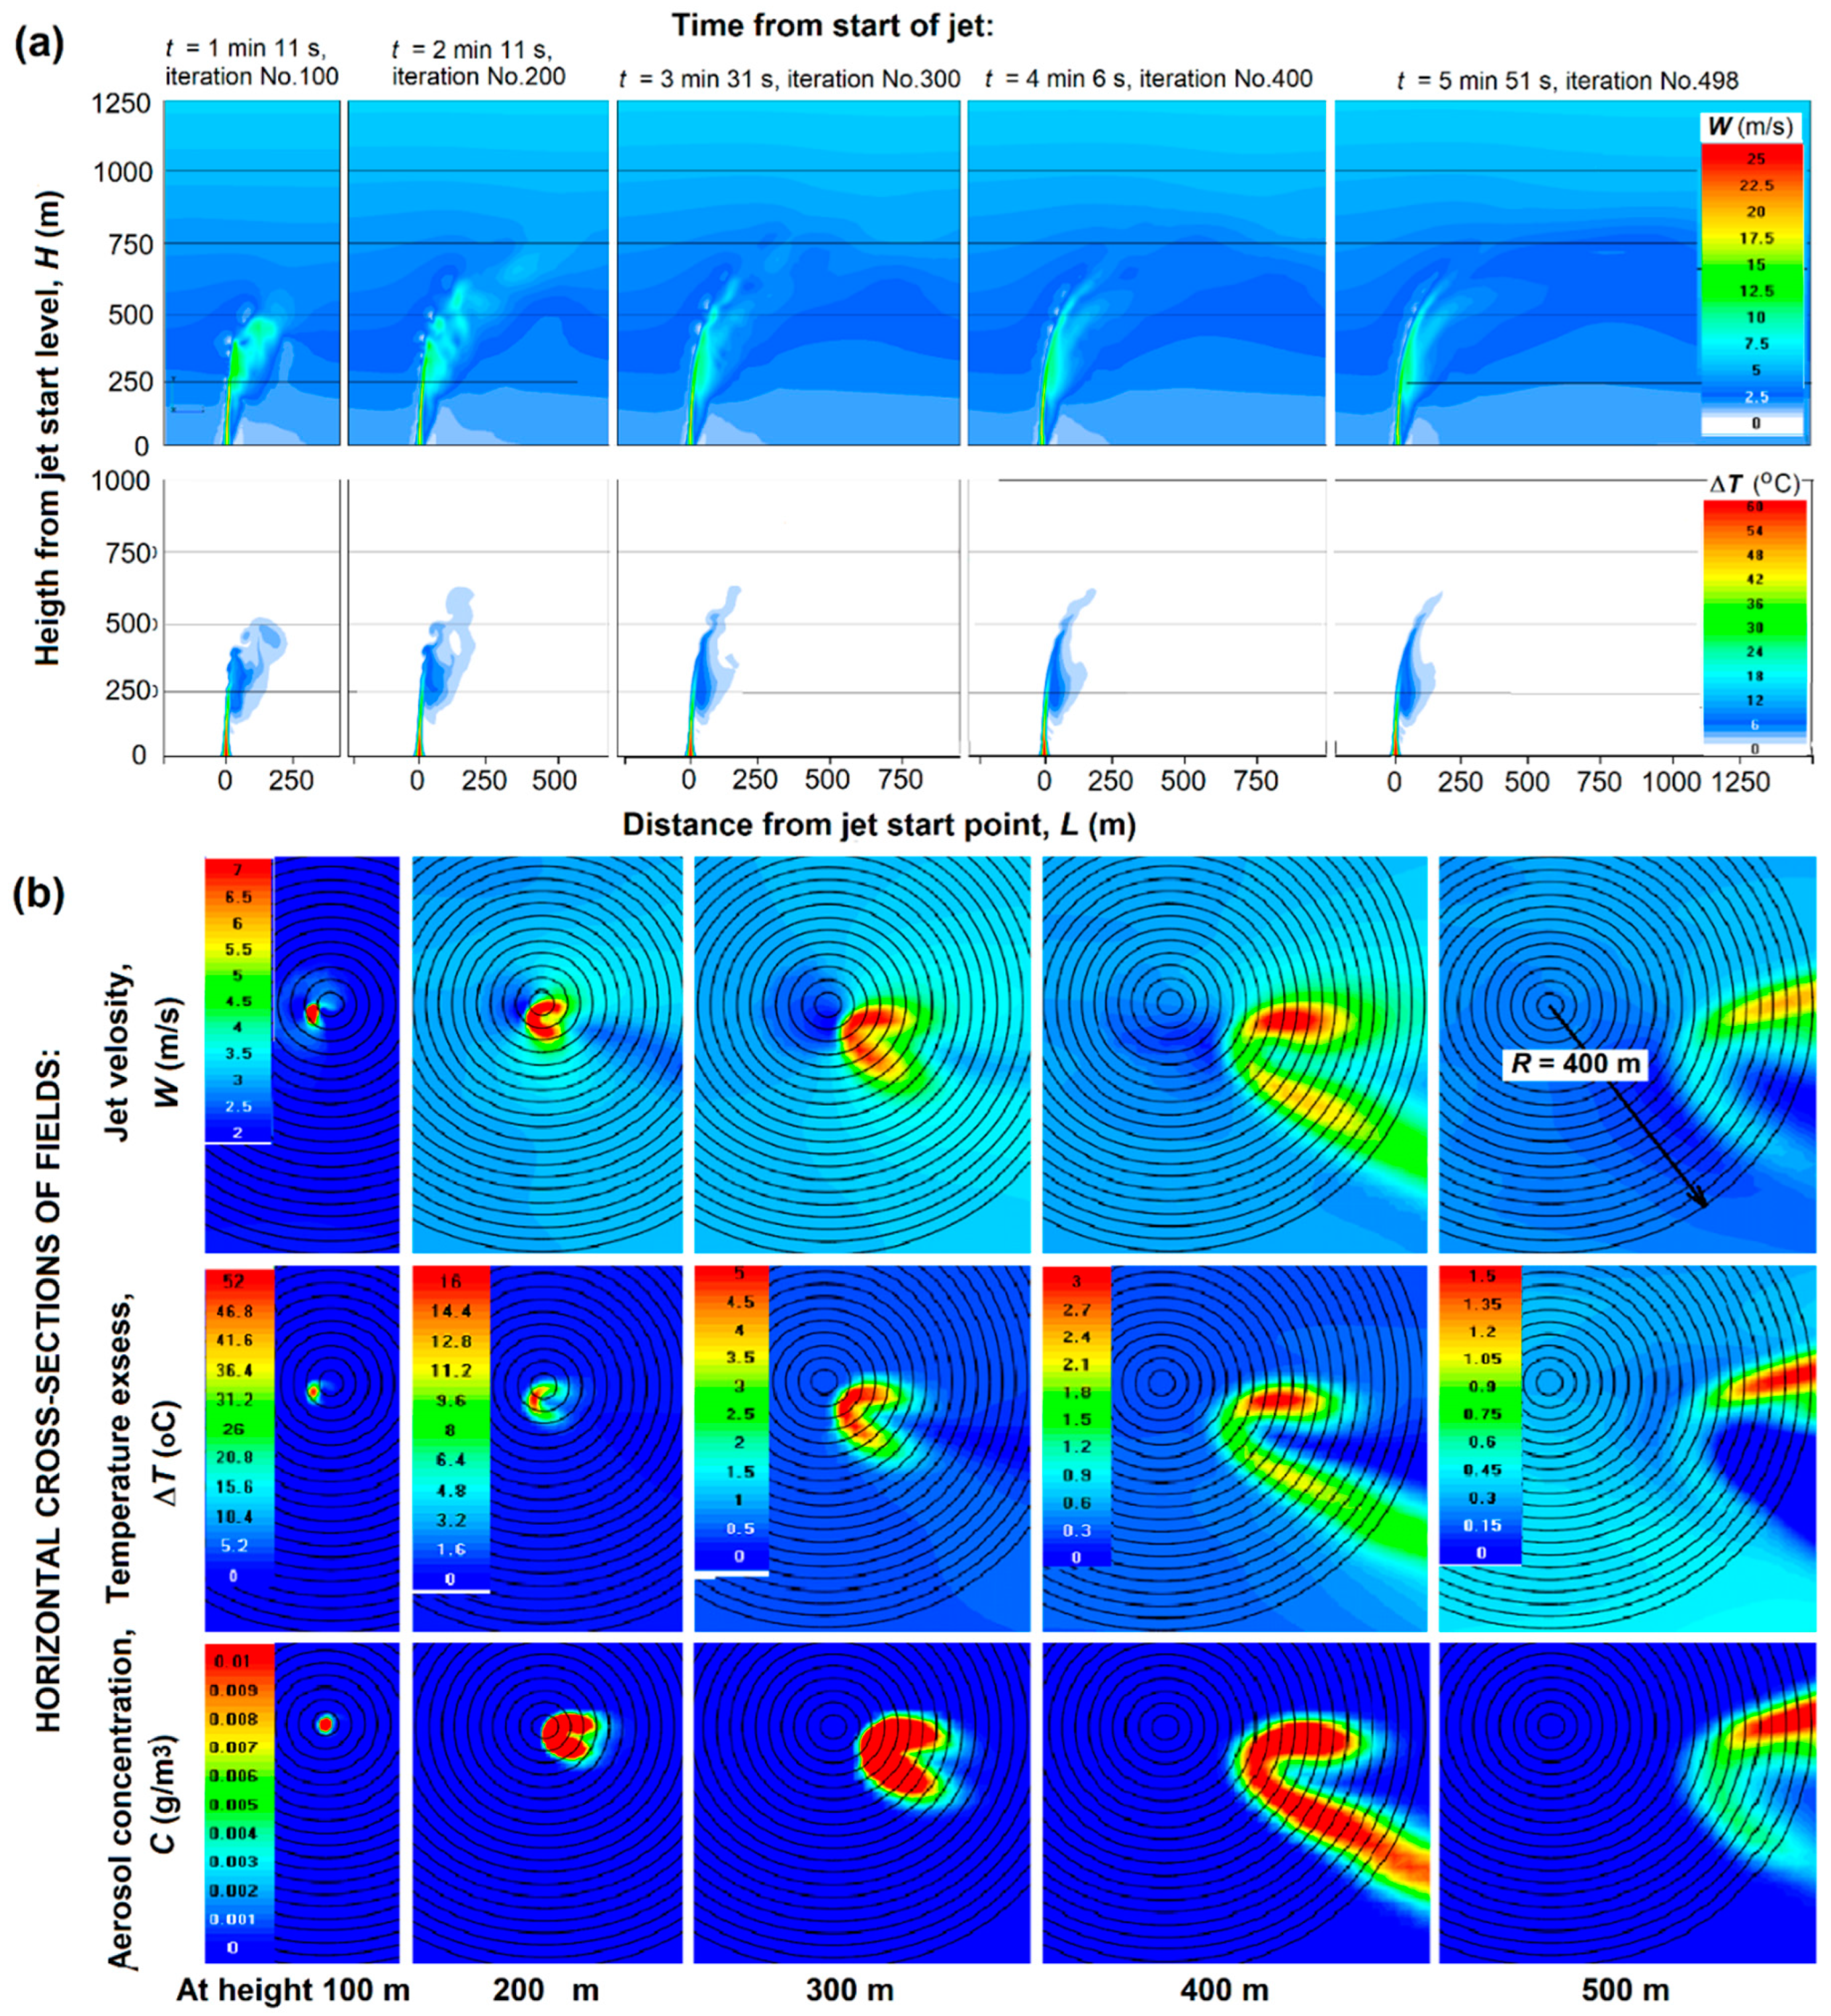
To investigate the possibility of creating artificial clouds and precipitation by means of a vertically directed jet saturated with hygroscopic aerosol, 3-D modeling of the jet motion in the atmosphere with and without feeding by water vapor condensation heat was carried out. On the basis of the FlowVision software package (FlowVision CFD), a geometric 3D model was created in which the computational domain was divided into two parts: the lower part, where the high-speed jet exits the nozzle, and the second part, where the jet moves in the free atmosphere [Abshaev, Aksenov et al., 2022a]. This separation is necessary for a more correct calculation of the turbulent jet motion having an initial near-sonic velocity (M > 0.3), taking into account the compressibility of the gas and the need for a high resolution of the computational grid of the jet velocity and temperature fields. The calculations in the second part were carried out using the large-scale atmospheric flow model FlowVision, where the system of thermal convection equations in the Boussinesq approximation, including the Navier-Stokes, heat conduction and incompressibility equations, was numerically solved using the incompressible formulation. The description of the model, the system of equations and the solution method is given in (Abshaev and Aksenov et al., 2022b). The height of the entire computational domain, including the initial and subsequent section, is 2-6 km, the length of the computational domain along the main wind direction is 6 km. Each computational case is solved in a full 3D representation, as it is necessary due to the presence of dependence of the velocity vector direction on height. Numerical experiments to calculate the structure of the jet velocity and temperature fields and the concentration of aerosol injected into the jet revealed the following patterns:
- -
The motion of a high-temperature jet in the real atmosphere has a complex turbulent character due to its high initial velocity. The vertical velocity and temperature fields of the jet, as well as the aerosol concentration, are highly inhomogeneous and pulsate around the jet axis even in a windless atmosphere (see
Figure 6b).
- -
As the jet rises, it expands, loses superheat and loses its rate of ascent. The jet temperature drops faster than its velocity, so the top of the jet continues to rise by inertia until its temperature becomes equal or even lower than the ambient air temperature by 1.0-1.2 °C. Atomization of aqueous solutions of hygroscopic substances leads to a more rapid expansion of the jet, lowering its speed and temperature.
- -
Even a weak wind, increasing with height, leads to deformation of the jet, tilts and carries the top of the jet to leeward for hundreds of meters (
Figure 6a). In the horizontal cross section, the jet takes the shape of an arc (figure 6b) encompassing a region of maximum upwelling that lags behind the surrounding airflow, similar to the lagging of the leading flow of the upwelling region and the powerful radar echo of convective storms (Abshaev et al., 2014). Even a weak wind with a velocity of
U = 1+0.005
H reduces the jet lift height by almost half, which significantly limits the ability to create artificial clouds. This is one of the reasons for the modest results obtained in experiments with meteotrons by Dessens and Wolfson and Levin.
- -
The jet lift height increases as the vertical temperature gradient increases. Increasing from 6.5 to 9.5 oC/km increases the jet lift height by 60% (by 500-700 m) even with significant wind deformation of the jet.
- -
Increasing air humidity also increases the jet lift height due to the fact that moist air is lighter than dry air.
- -
Fueling the jet with condensation heat markedly increases its lift height in the atmosphere. This can increase the potential to overcome inversion layers, reach the level of natural condensation and trigger the cloud formation mechanism.
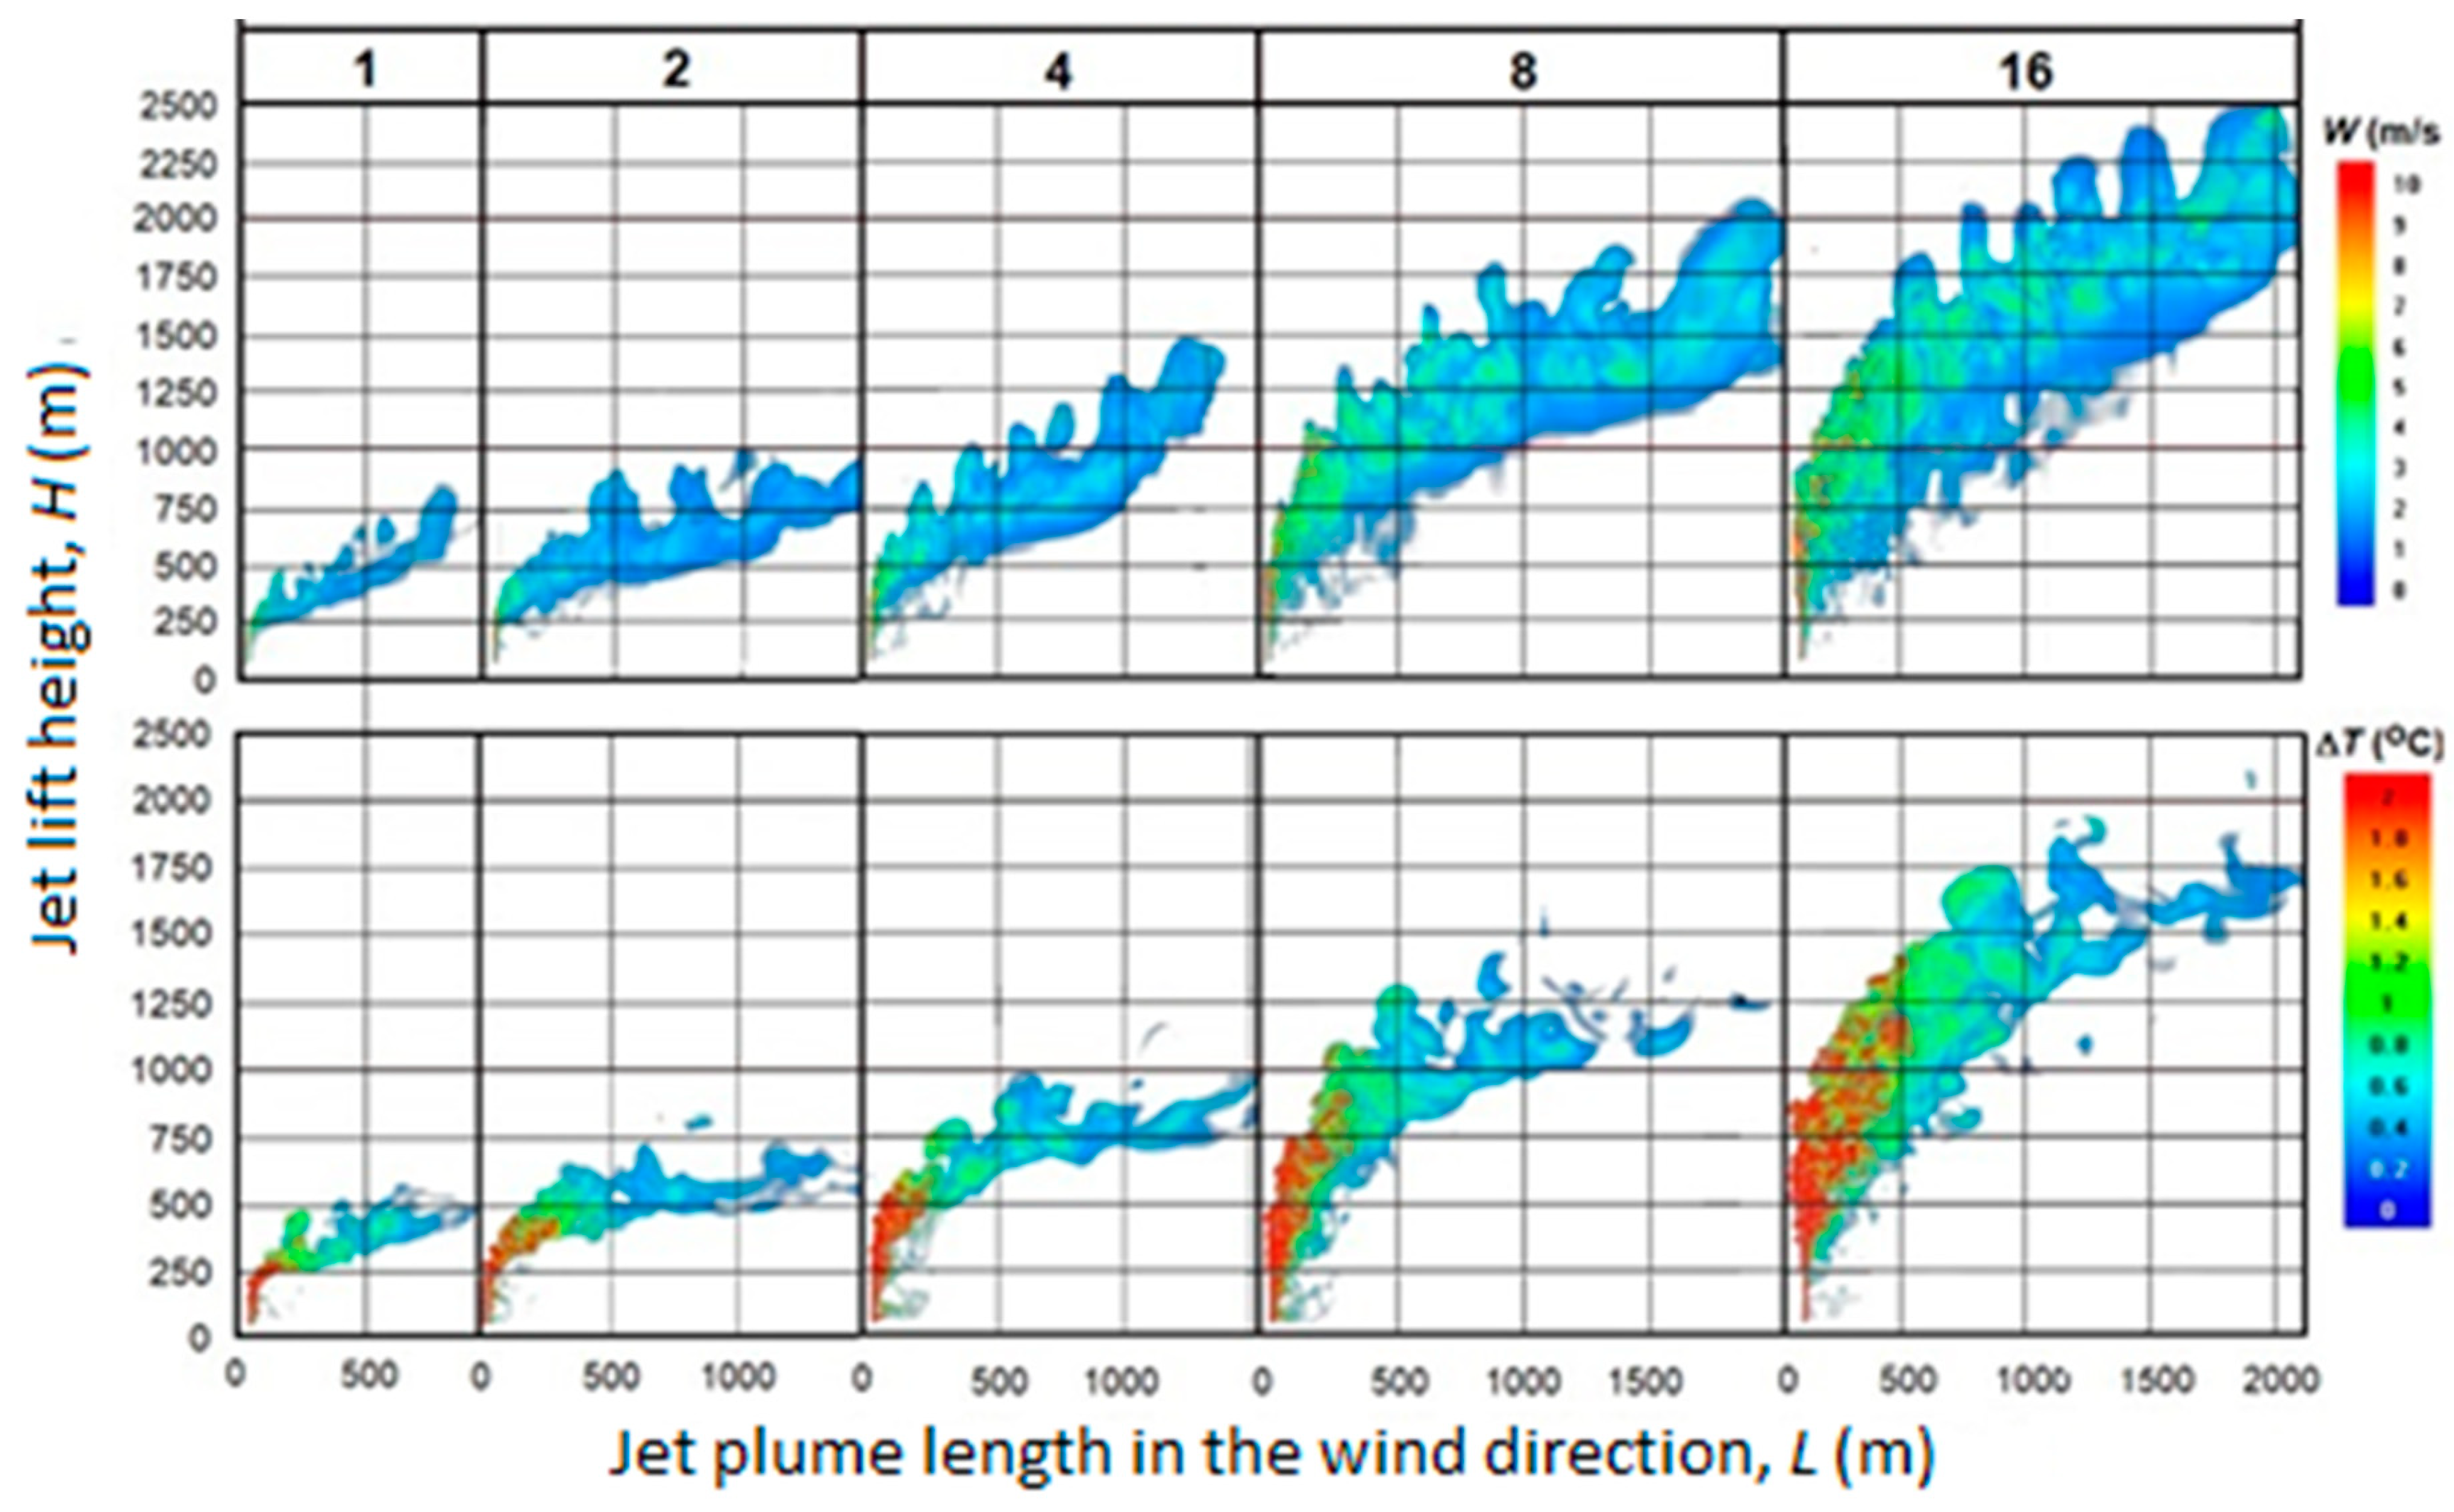
Figure 7 shows that increasing the
PC boost energy by a factor of 2 and 4 increases the jet lift by 6% and 14%, respectively. In a windless atmosphere, the energized jet reaches high altitudes already at γ = 6.5 ºC/km, and at γ = 7.5 ºC/km it can reach the height of the condensation level (1200 m) and initiate cloud formation.
4.4. Experimental Complex
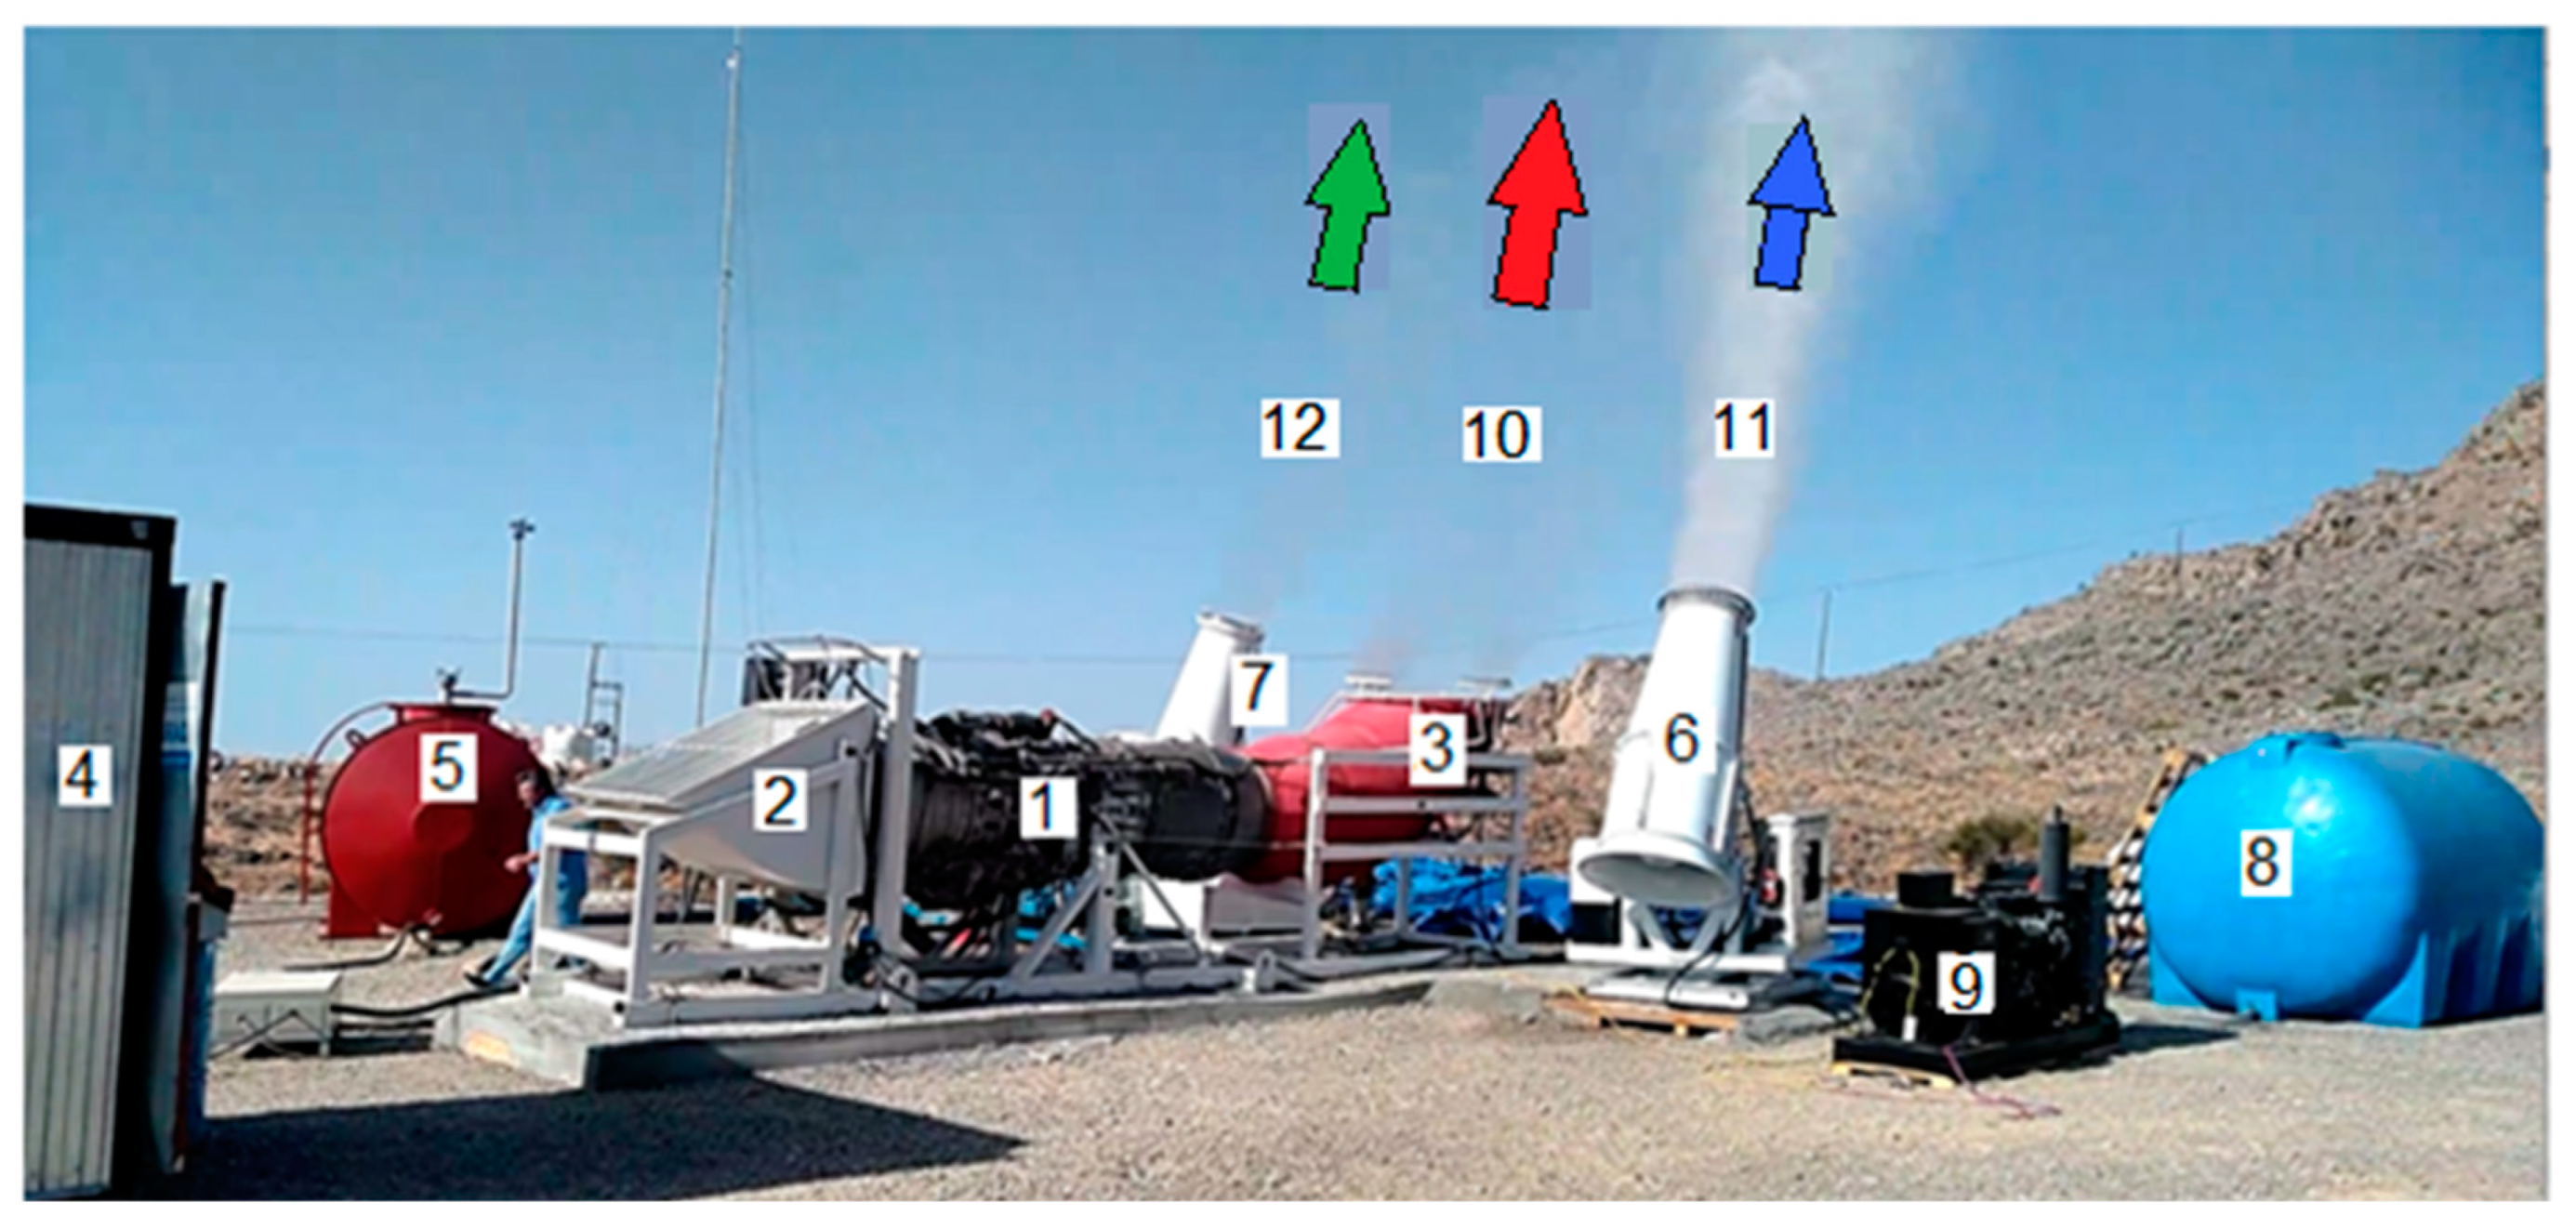
The experimental complex (
Figure 8) included:
- -
D-30 III series aircraft jet engine with air intake, upward jet turning device, fuel system, starting and control system;
- -
type I aqueous solution atomization system consisting of a solution tank and 80 nozzles mounted at the outlet of the jet turning device around the perimeter;
- -
two aerodynamic fogging guns JY-60 and WP-60 for spraying of aerosols of the second and third types with 20 kW fans, power supply and control systems, tanks for solutions of hygroscopic substances;
- -
system for preparation and storage of aqueous solutions of three hygroscopic substances;
- -
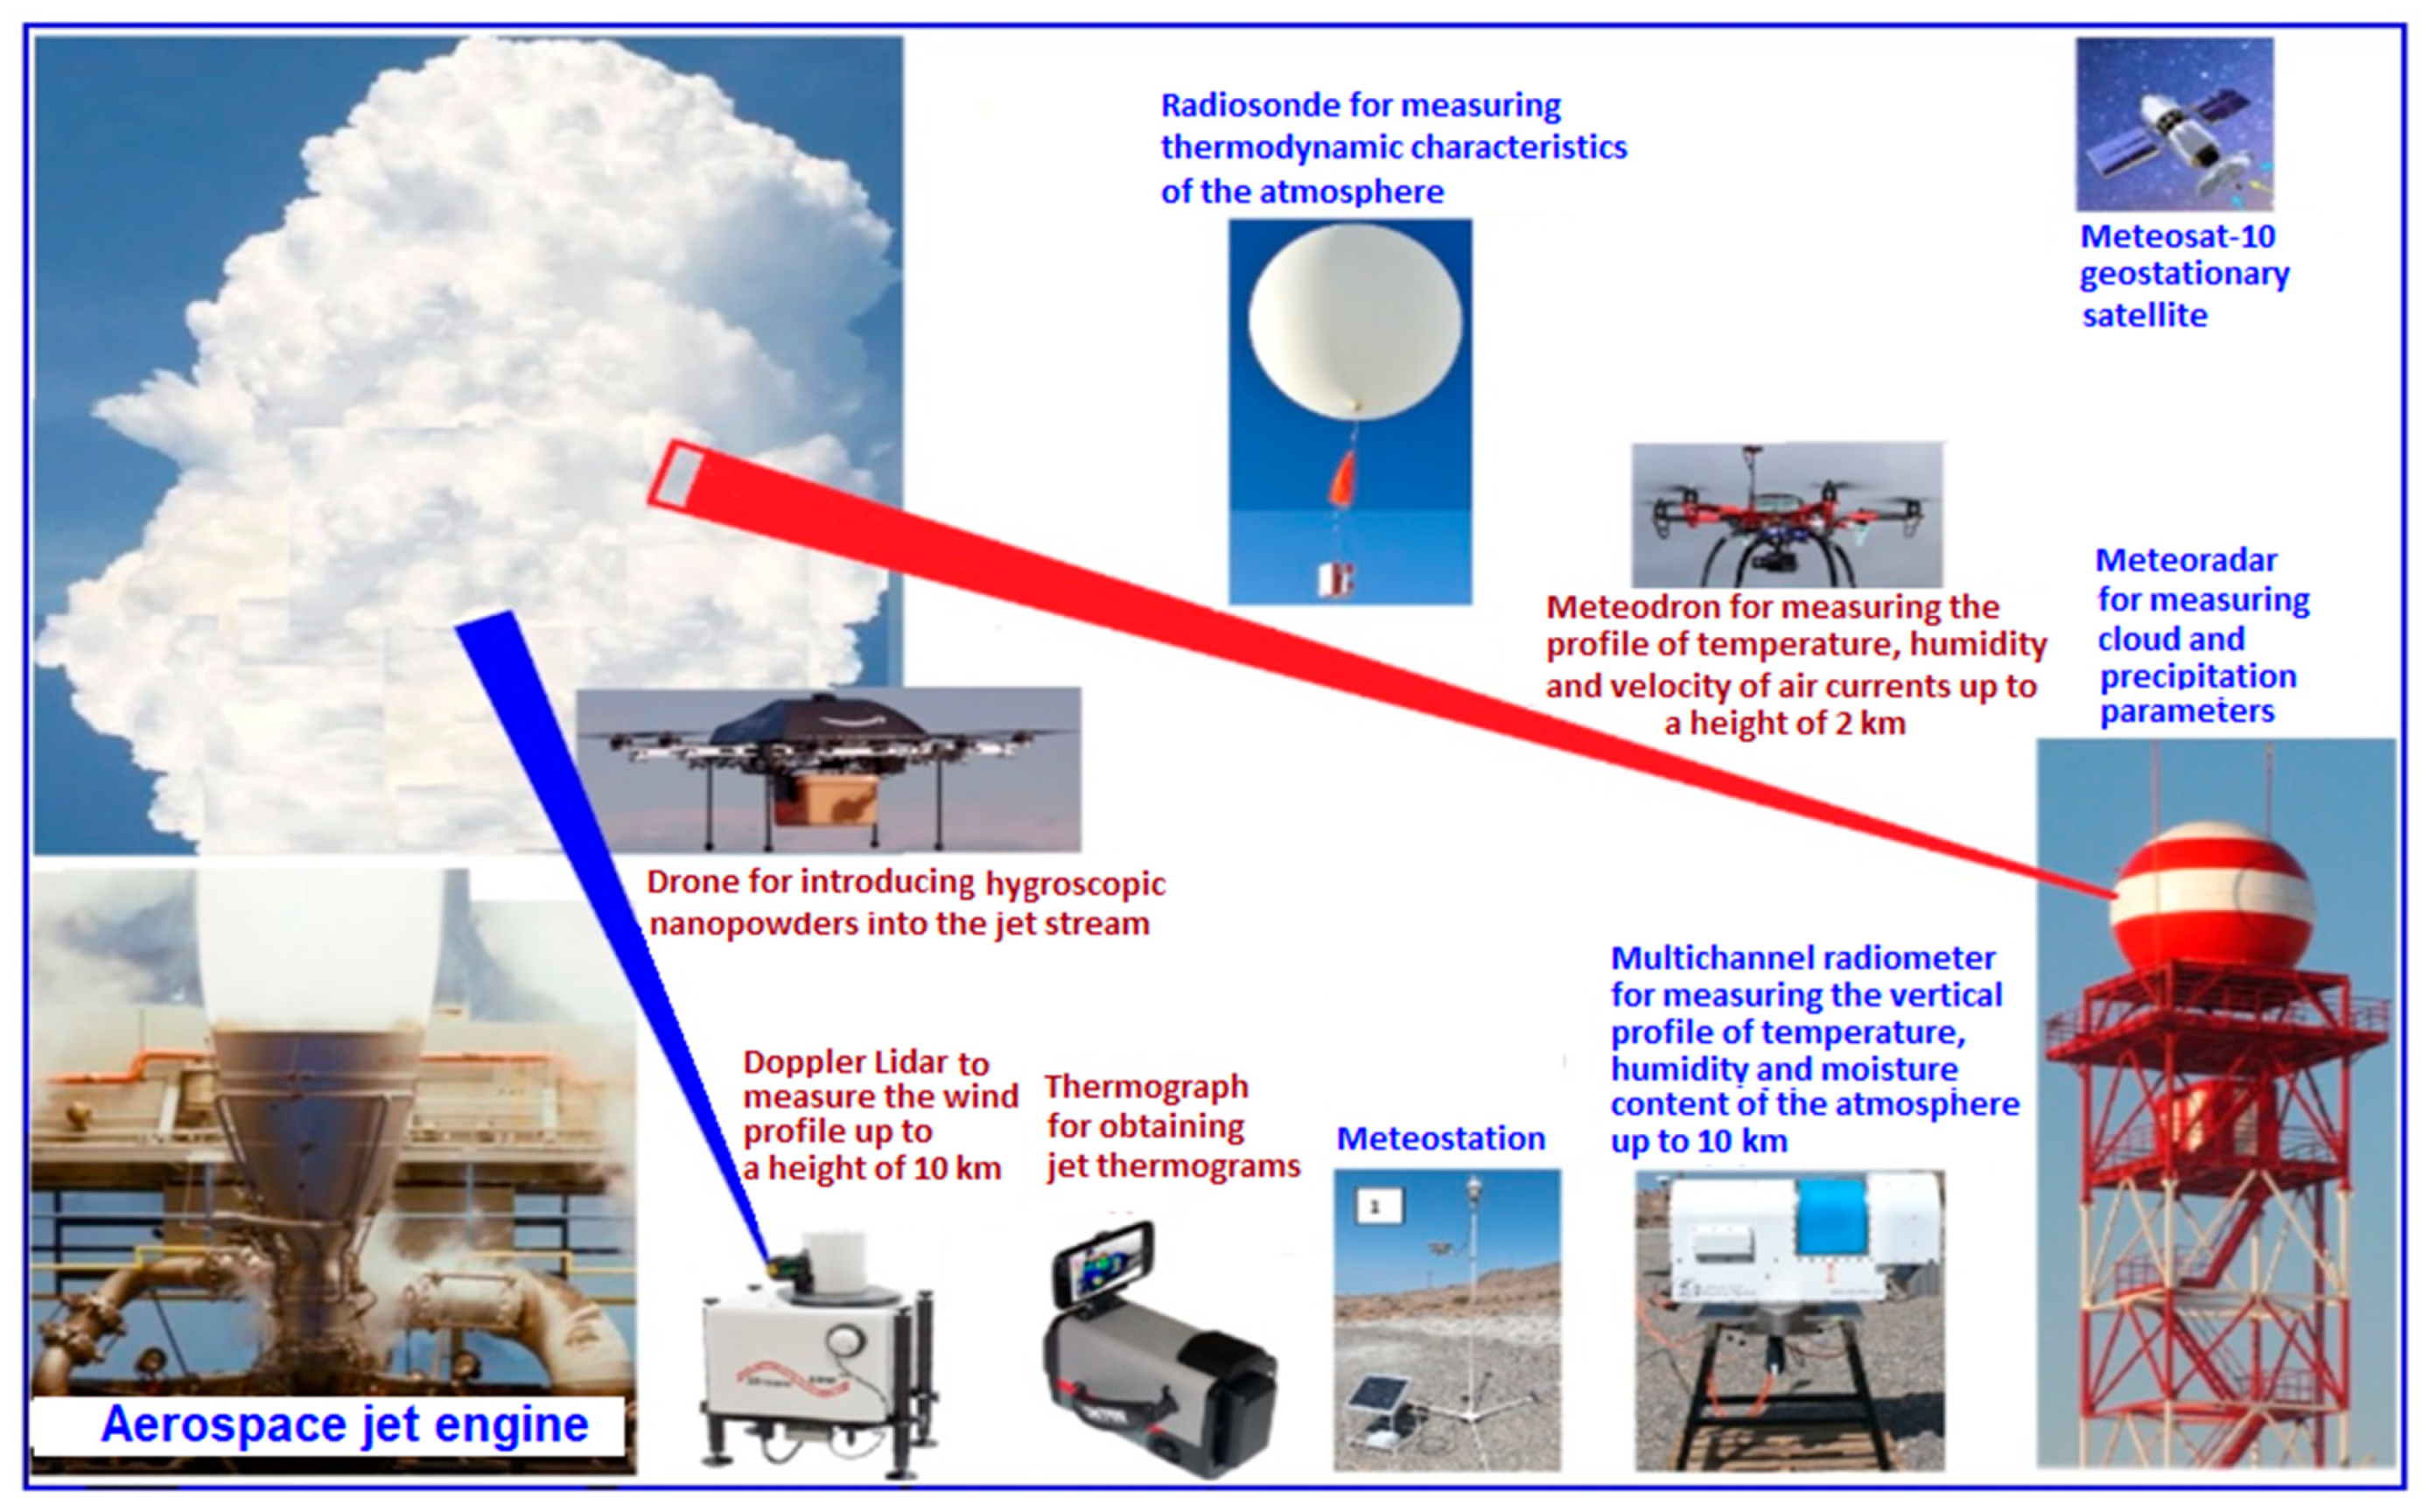
scientific equipment for monitoring the results of field experiments, which included (see figure 14): an automatic weather station WXT-536 for measuring pressure, temperature, air humidity, wind direction and speed, intensity and amount of precipitation at the position; a Halo-Photonics Streamline XR laser meter for measuring the vertical profile of wind direction and speed; a HATPRO RPG multichannel microwave radiometer for measuring the vertical profile of air temperature and humidity; an IRTIS-2000C thermograph for obtaining the thermal structure of the jet; and a meteorological radar of the NSM. The readings of these instruments were complemented by data from the Abu Dhabi airport atmospheric radiosonde, the Meteosat-10 satellite and the NCM meteorological radars.
The jet of the D-30 engine and the gas-drop streams of the JY-60 and WP-60 air guns were directed so that they merged into a single upward flow at a height of about 20-30 m. The initial parameters of this common jet were as follows: the initial jet temperature was about 300 ◦C and the flow rate was about 300 ◦C. The initial parameters of this common jet, taking into account losses in the turning device and on solution evaporation, were as follows: initial jet temperature about 300 ◦C, flow velocity about 300 m/s, combustion products flow rate about 200 kg/s, initial jet diameter 1.2 m, jet inclination angle to the horizon 75o.
4.5. Field Experiments and Their Results
In the first field campaign, the experimental complex was mounted on Mount Jebel Jais at an altitude of 1600 m from February 17 to March 12, 2021. Until the end of March (and according to the forecast and beyond), despite the readiness to conduct experiments, atmospheric conditions were unfavorable for the creation of artificial clouds. Low air humidity in the surface layer (11-25%), presence of surface layers of inversion, surface wind speed of 2-5 m/s were noted. Only in the layers above 3.5-4.0 km, the height of which the jet did not reach, sometimes humidity of about 50-60% was noted.
Despite unfavorable atmospheric conditions, 4 trial experiments on creation of artificial upward flows in a cloudless sky were carried out. The purpose of these experiments was to check the performance of the experimental complex and to study the peculiarities of the jet feeding by condensation heat. The experiments were conducted on March 15, 17, 23 and 24 from 14:30 to 15:45 local time (during the period of maximum natural convection). The duration of the experiments (in terms of jet engine operation time) was (9-15 min). On March 15, light layered puffy-puffy clouds were visible on the horizon, and on other days there was a clear cloudless sky.
4.5.1. Results of Trial Experiments
In none of the experiments was it possible to create an artificial convective cloud. In all experiments, only aerosol jets and translucent aerosol clouds were observed against a clear sky background (
Figure 9c,d), which represent the air-drop flow produced by a JY-60 fog gun spraying CaCl
2 solution. Droplets of CaCl
2 solution, vaporize in the hot jet, but after the jet cools down somewhat, droplets are again formed on the CaCl
2 aerosol due to the low hygroscopic point (RH1 = 6%). In contrast, air-drop streams with droplets of (NH
2)
2CO and NaCl solutions became visually invisible after evaporation in the hot jet, because for the re-formation of droplets on aerosols of these substances in the atmosphere, the air humidity was below their hygroscopic points.
The temperature of the jet at the edge of the engine nozzle according to thermocouple measurements reached 275 - 300 °C depending on the D-30 engine speed. It was not possible to measure the temperature and velocity in the center of the jet. The initial jet velocity at the jet edge at the beginning is about 300 m/s. According to the jet flow theory (Abramovich, 1984), this means that the maximum jet velocity at the axis could reach 400 - 450 m/s.
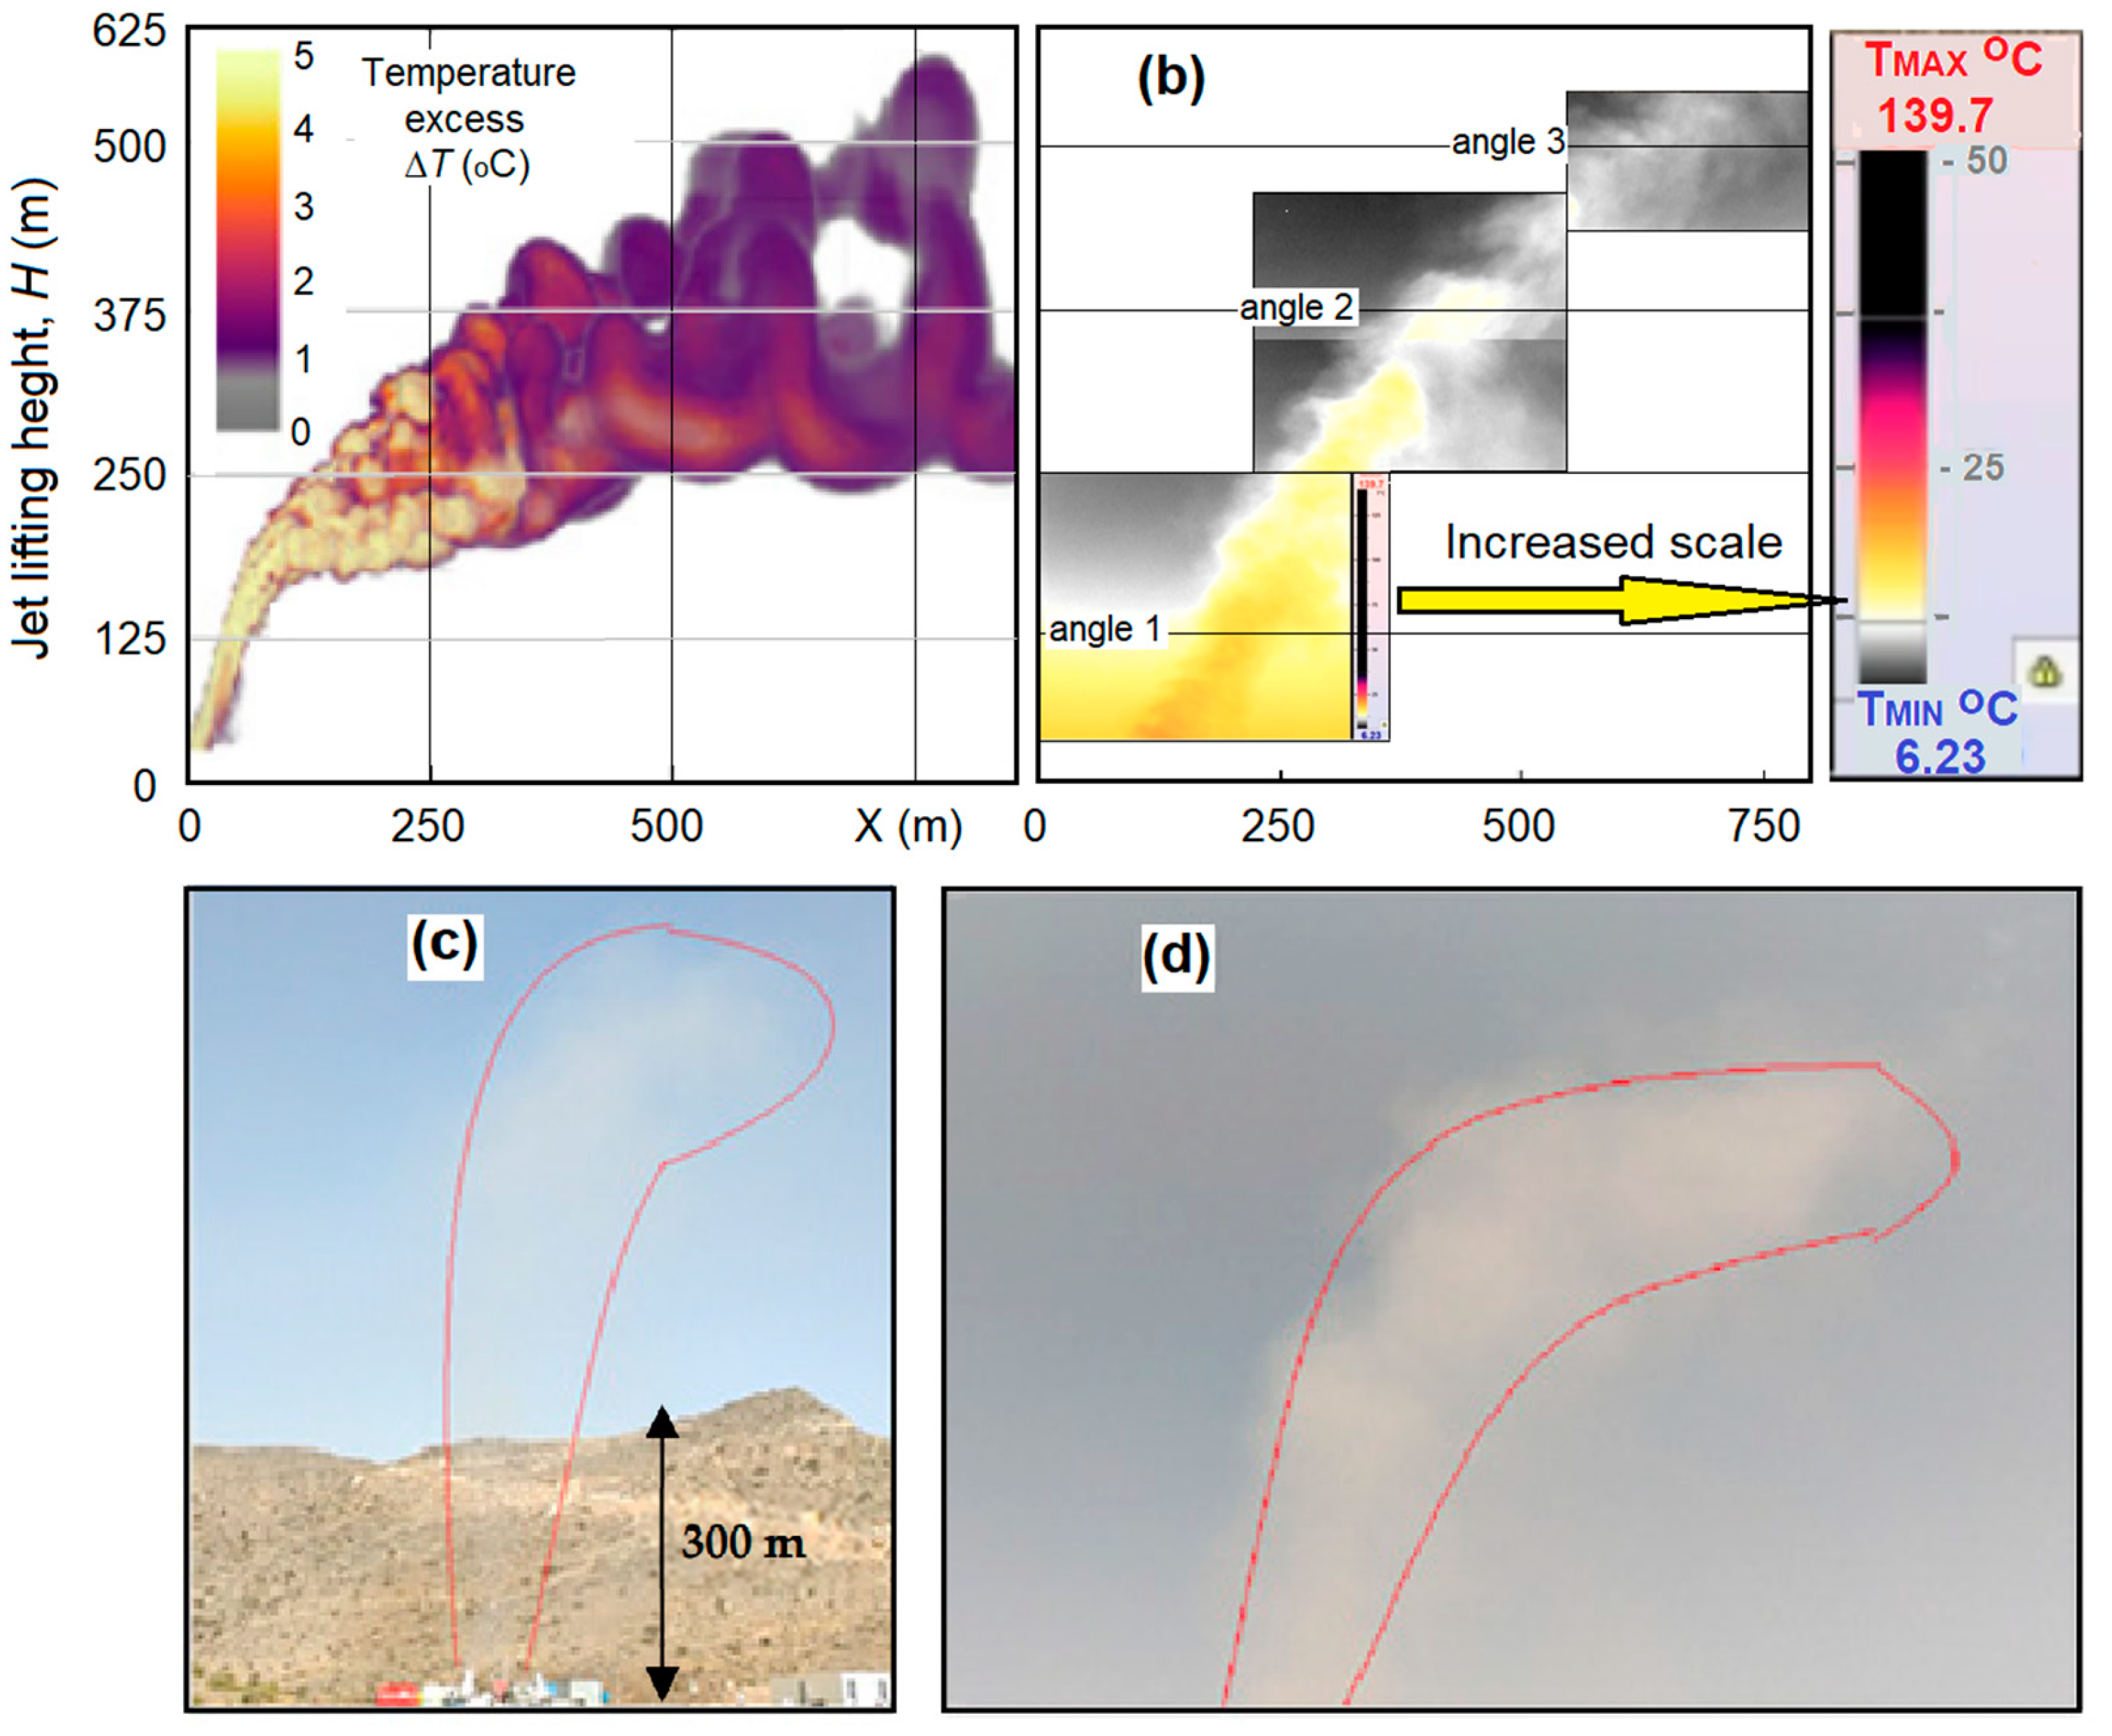
The height of the rising jet according to the IRTIS-2000S thermograph data reached an average of 600 m and a maximum of 1100 m above the launch level (see
Figure 9). The upward flow velocity at a height of 400 m according to the meteotron data reached 3 m/s.
The average background aerosol concentration during the day at 1.8 m height in the size ranges of 0.3; 0.5; 1.0; 2.5; 5.0 and 10 μm was 3255, 1156, 303, 67, 17 and 12 m-3, respectively. According to the photoelectric pyranometer RK200-03, the solar energy flux on the flat surface was 0.85-1.0 kW/m2. The noise level of the machine's jet engine reached 132 dB SPL according to the MEGEAN 92131 noise meter, and 135 dB at maximum engine speed.
4.5.2. Results of Experiments in the Second Field Campaign
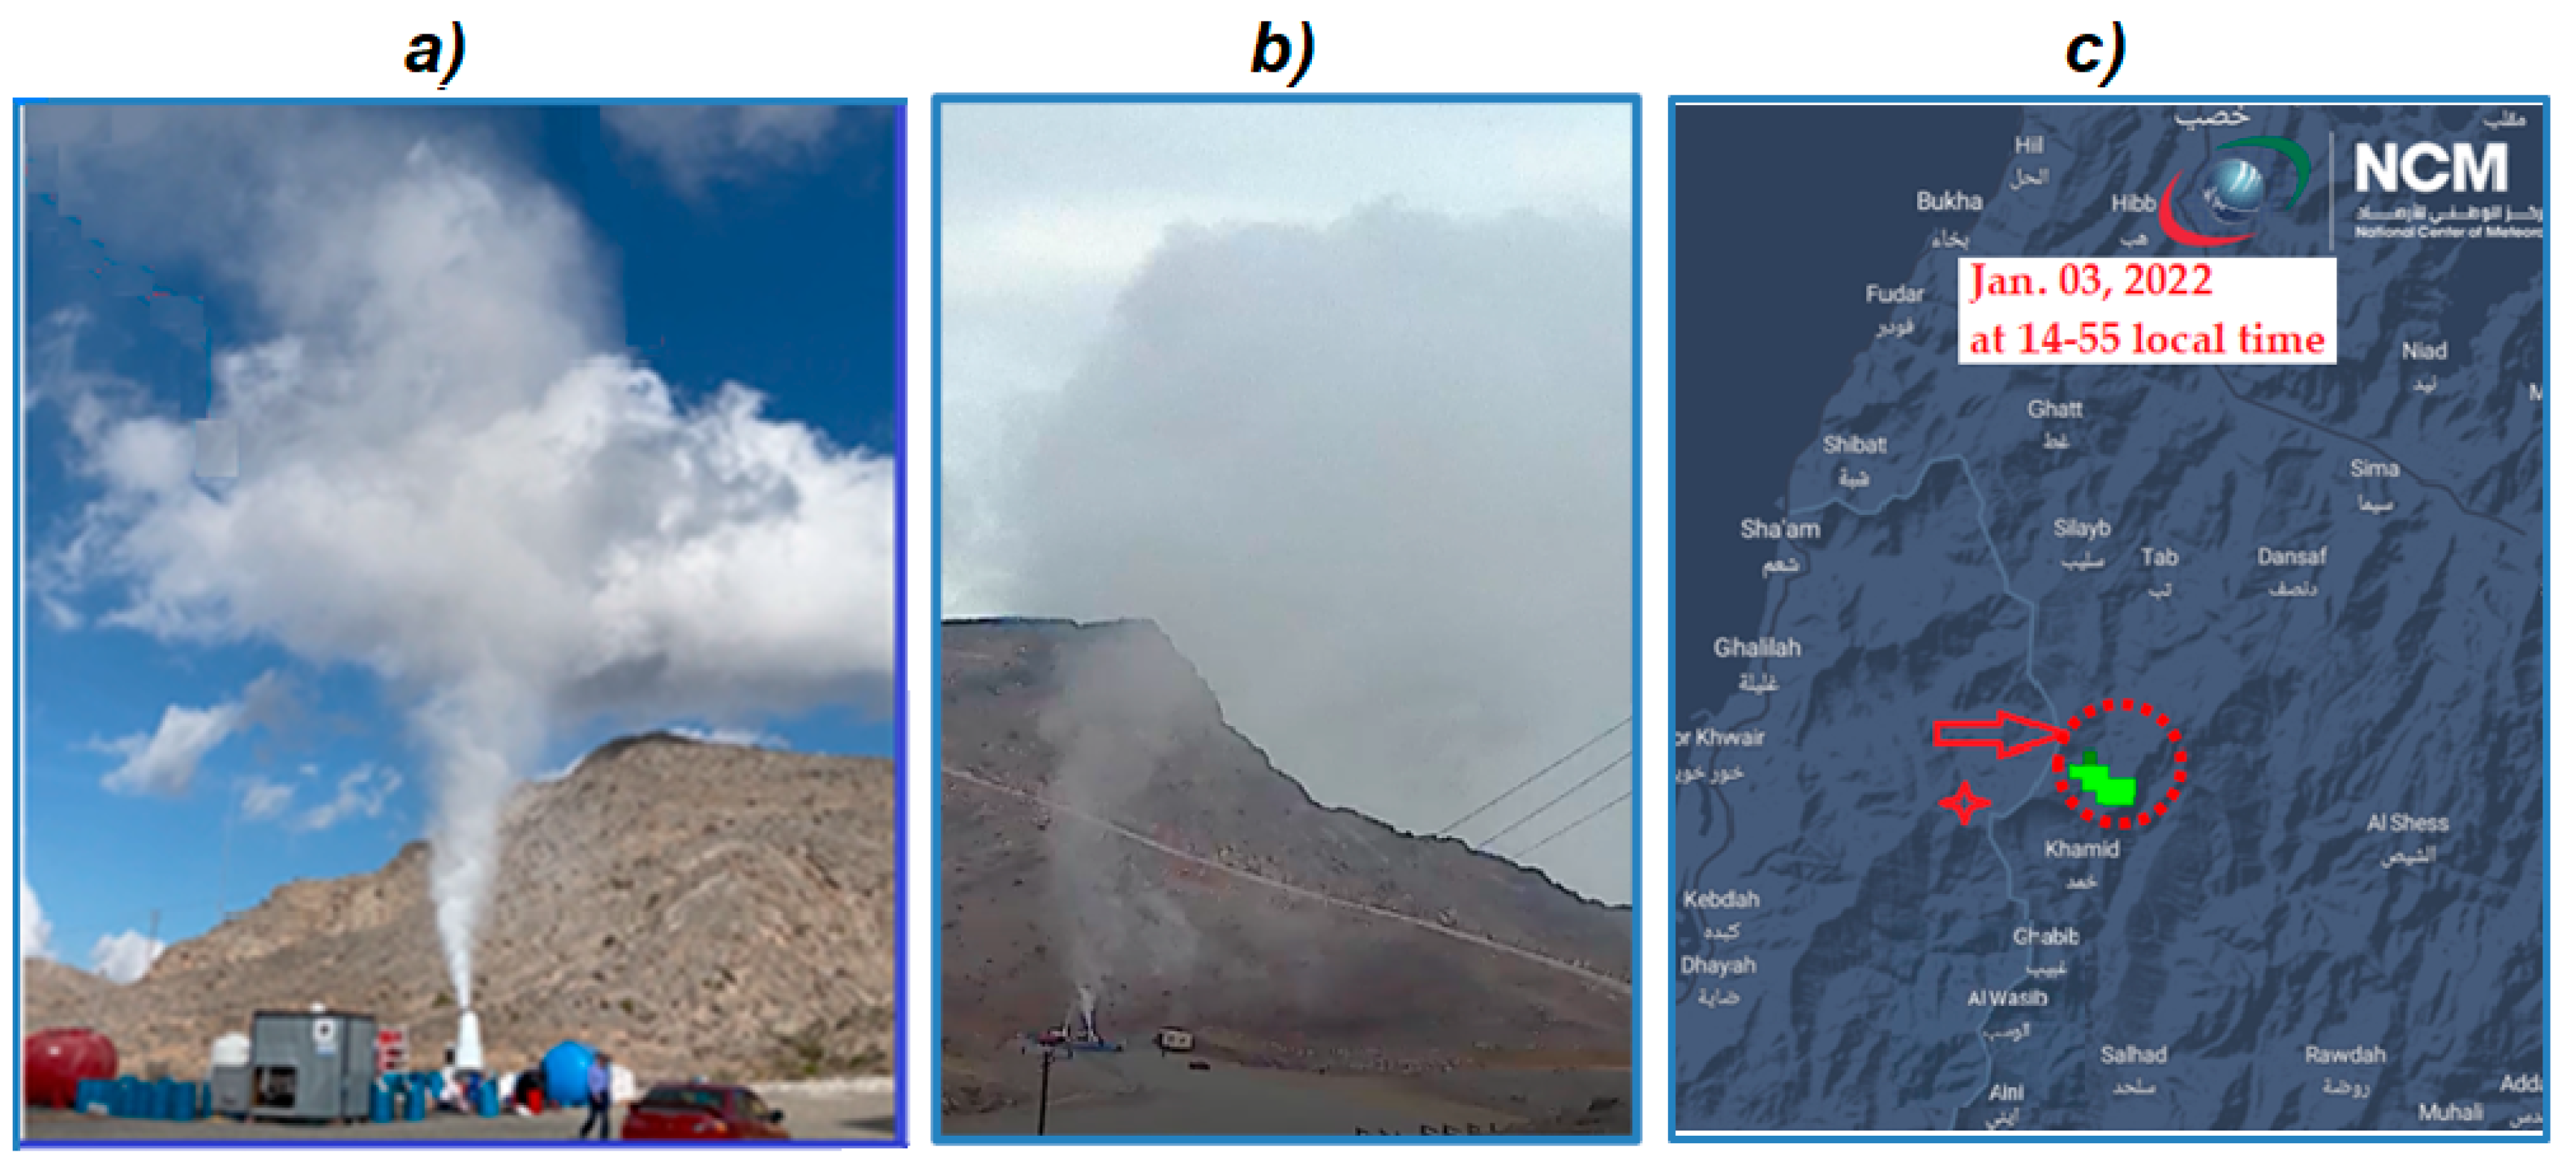
Atmospheric conditions during this field campaign were more favorable for the artificial cloud experiments. Between December 30, 2021 and January 5, 2022, large-scale cloud processes and precipitation were observed, especially intense over the sea surface in the west and east of the UAE Peninsula. The only factor complicating the selection of favorable conditions for the experiments was the increased wind speeds. Fifteen experiments were conducted in this campaign, including 13 experiments conducted at Mount Jebel Jais (25, 26, 29, 30, and 31 December 2021, 3, 4, 5, and 7 January 2022) and two experiments conducted on January 15 in the desert at the National Center of Meteorology UAE field base. Saturated solutions of three hygroscopic substances CaCl2, NaCl and (NH2)2CO were injected into the upward flow created by the jet stream, and on 5 occasions 20 kg of NaCl/TiO2 nano-powder and 50 kg of CaCl2 powder each were injected (see Table 3 in (Abshaev et al., 2023c). These 15 experiments were conducted under the following atmospheric conditions:
6 experiments under a cloudless sky;
2 experiments while passing over a cumulus cloud position;
2 experiments when a layered cumulus cloud passed over the position;
3 experiments in the presence of second-tier layered cumulus and layered clouds (at altitudes above 3000 m) over the position and its surroundings;
2 experiments in the presence of layered cumulus clouds near the position level.
According to the results of instrumental control, the following effects were observed:
- -
in 6 cases - formation of light almost transparent cloud in clear sky;
- -
in 3 cases - compaction of layered clouds into which a jet saturated with hygroscopic aerosols was injected;
- -
in 3 cases - appearance of the precipitation radio echo spot (
Figure 10c) on the leeward side 15-20 minutes after the start of the experimental complex. This is probably connected with the impact of the jet directly on clouds of Cu Hum (2 cases) and St (1 case) types;
- -
in 2 cases - convergence of small clouds of Cu Hum type in the direction of the jet.
- -
in 1 case no effects were detected.
In no experiment was it possible to create deep convection with the development of an artificial convective cloud in clear skies. Enhancement of natural Cu Hum clouds and stimulation of local precipitation from layered cumulus clouds passing over the jet, are of no serious practical significance. These results are significantly lower than those expected on the basis of theoretical modeling for the case of a jet with a boost, but they are in good agreement with the data of calculations for a jet without a boost (Abshaev, Aksenov et al., 2022a, 2022b).
The analysis showed that the reasons for such modest results are that the expected enhancement of the jet energetics due to the heat feeding of water vapor condensation on the three types of hygroscopic aerosols introduced into the jet was too small due to the absence of condensation on (NH
2)
2CO), NaCl, and NaCl/TiO
2 aerosols because of the low humidity of the surface air (RH < 65%), and the amount of water condensed on CaCl
2 aerosol according to
Table 1 is small. First, the condensation process of water vapor on the hygroscopic aerosols introduced into the jet is not so fast (Drofa et al., 2010) to provide an energy makeup of the condensation heat during the jet ascent. Without such a boost, the power of the used D-30 aircraft jet engine was not sufficient to initiate deep convection and create clouds producing heavy rainfall.
According to the data of modeling of jet motion in the atmosphere (Abshaev and Aksenov et al., 2022a), it follows that even with a weak wind (
U=1+0.005
H m/s) and vertical temperature gradient γ = 8.5
oC/km the D-30 engine jet cannot reach the level of cloud formation without a boost (see the left part of
Figure 11). Increasing the engine power by 2, 4, 8 and 16 times leads to a significant increase in the volume of the jet and its height of ascent (up to 2500 m).
This means that with sufficient engine power the jet can overcome inversion layers, destructive effect of wind, reach the level of condensation and lead to the formation of convective cloud, which under favorable atmospheric conditions (increased humidity and the presence of potential energy of atmospheric instability) can develop and lead to the formation of cumulus-rain clouds.
5. Method for the creation of powerful convective clouds and rain showers
5.1. The Purpose
The purpose of this method is to create an artificial Cb-cloud by introducing into the surface atmosphere directed to the zenith a super-powerful jet of water vapor having an initial temperature of about 2700-3000 oC, an initial velocity of about 4000 m/s, a flow rate of about 1000 kg/s and more, and to accelerate the formation of clouds and precipitation, at least 1012 particles/s of hygroscopic aerosol with a diameter of about 5 microns are introduced into the jet of water vapor (Patent RU No. 2803352, Abshaev et al, 2022). Atomization of hygroscopic aerosol is carried out at a height where the temperature of the water vapor jet is lower than the dissociation (melting) temperature of the aerosol substance. Saturation of the upward flow with hygroscopic nano-aerosol promotes acceleration of water vapor condensation and formation of heavy rain. To implement the method, a device containing an aerospace jet engine with an upwardly directed nozzle and an unmanned aerial vehicle is proposed to provide atomization of hygroscopic nano-aerosol in the jet stream.
5.2. The Physical Basis
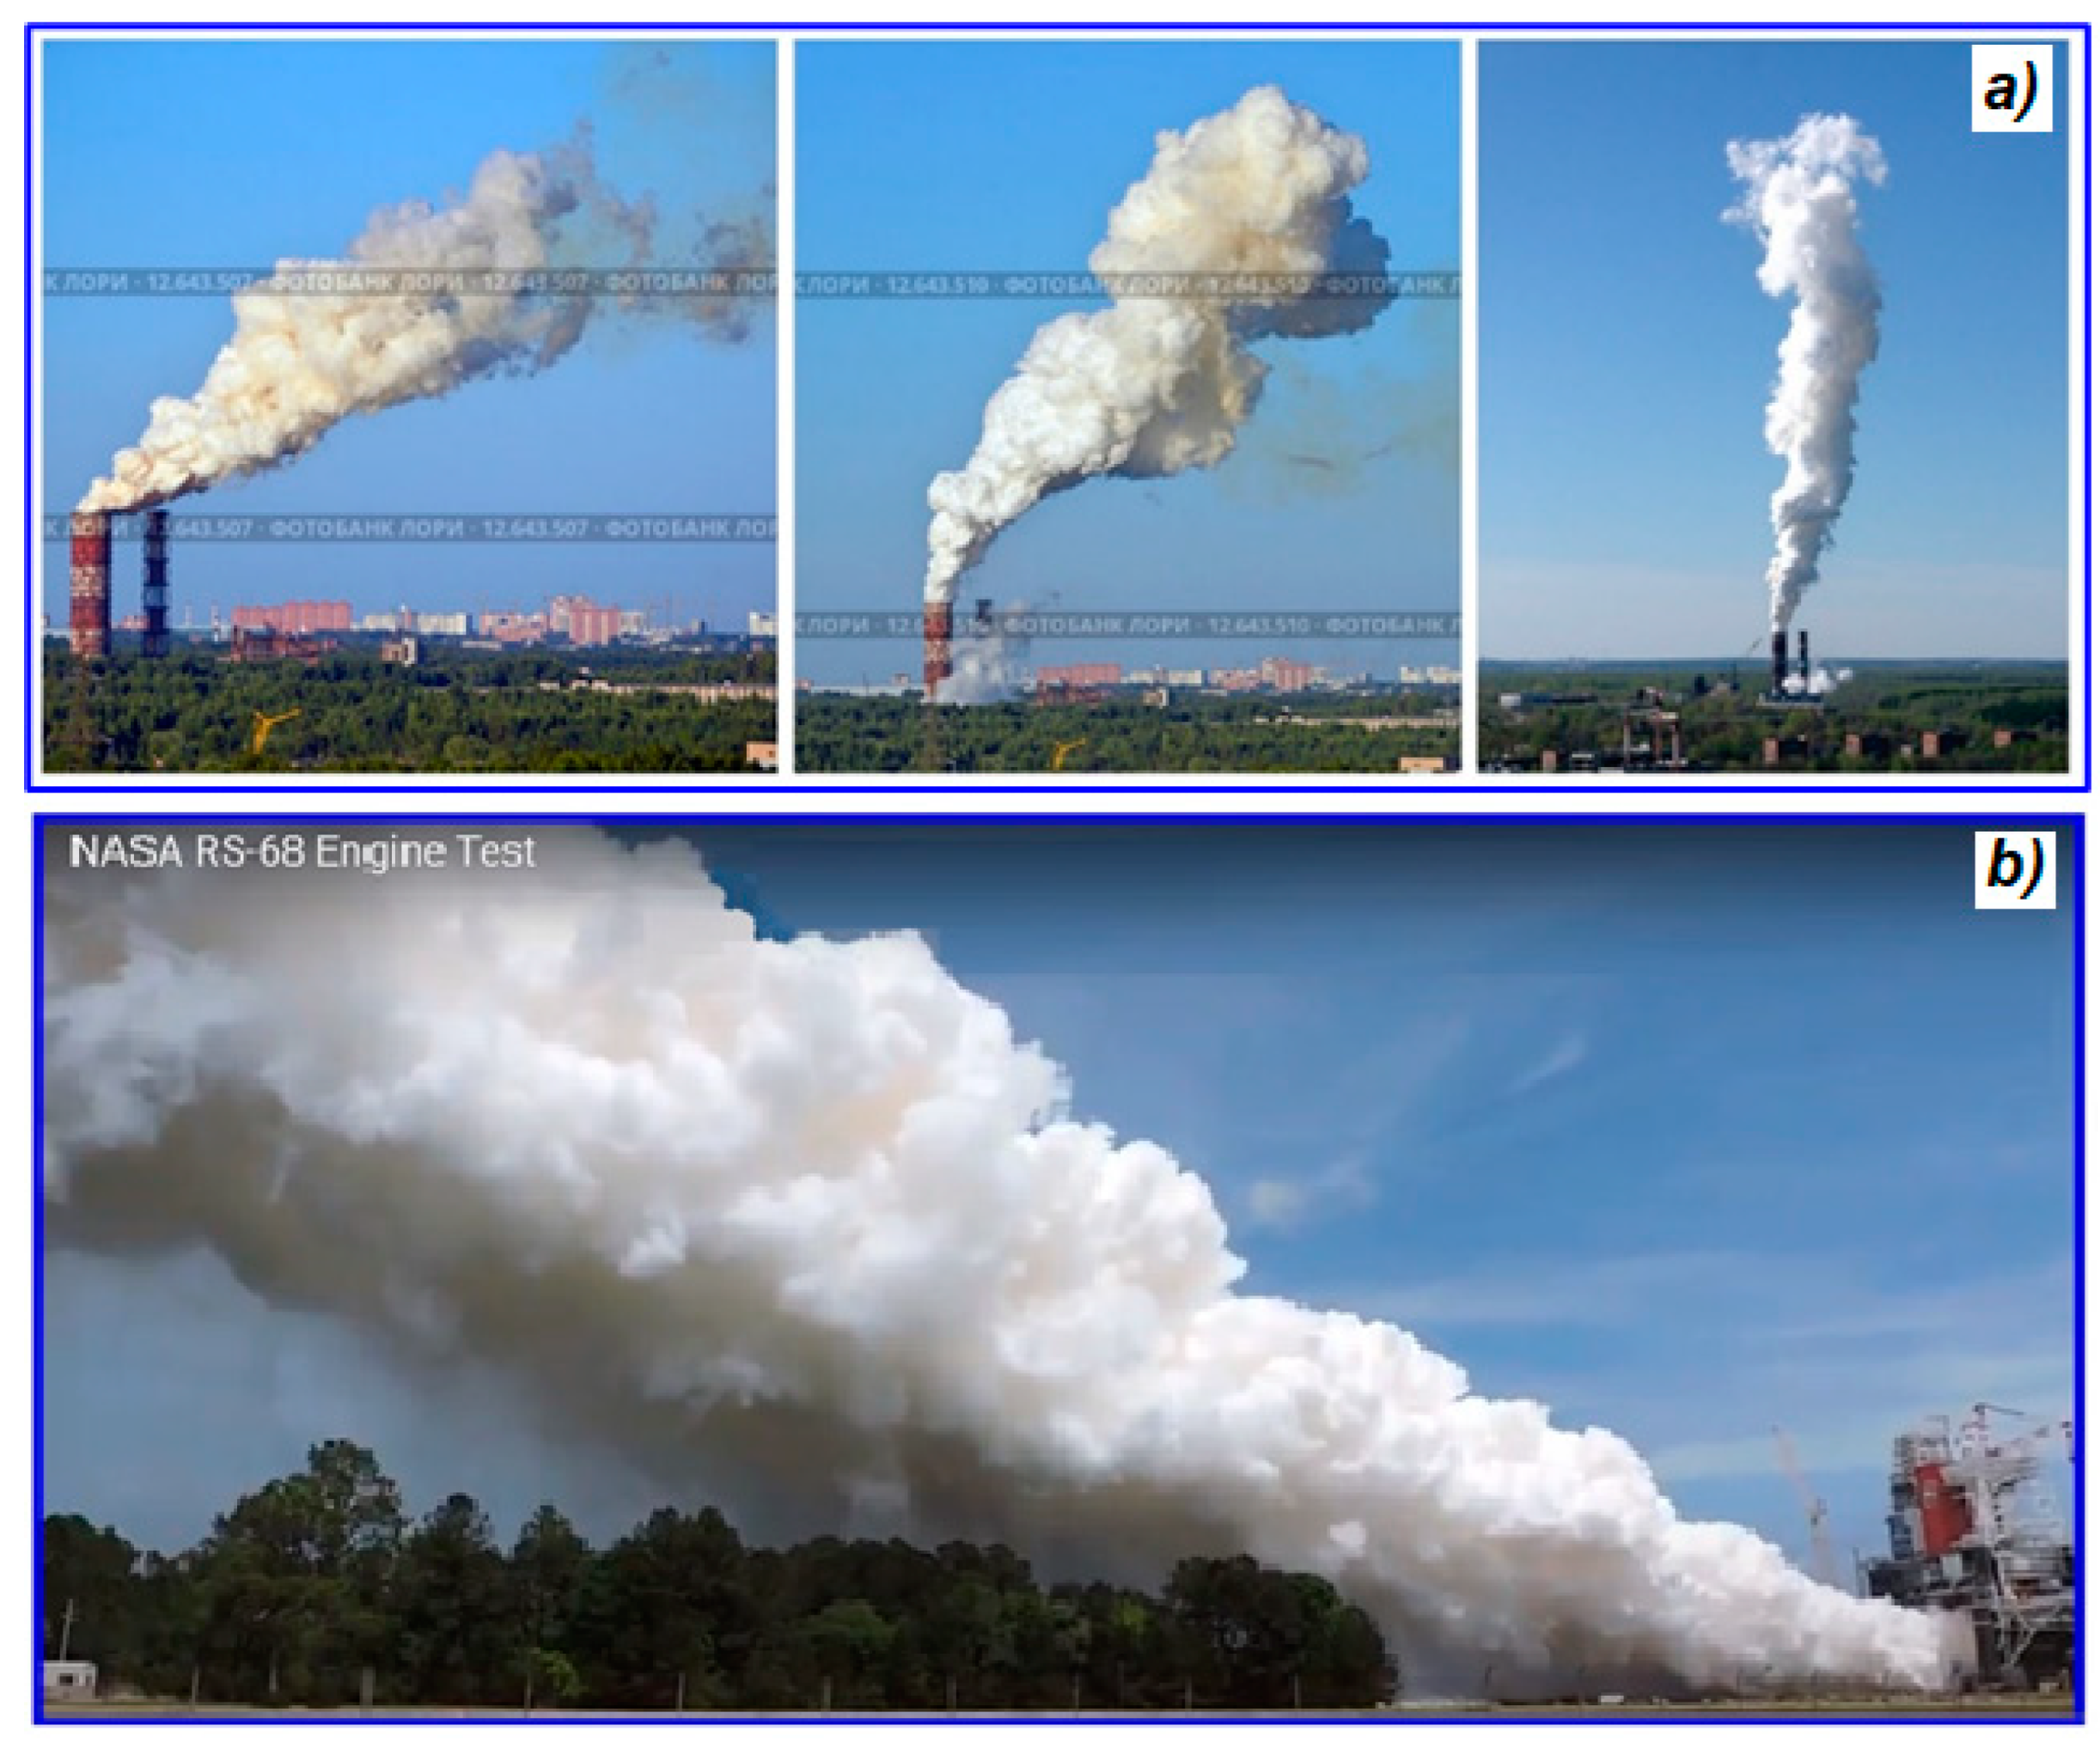
The physical basis of the proposed method of inducing artificial rainstorms consists in the forced creation of a powerful upward flow saturated with hygroscopic aerosol, which rising in the atmosphere leads to the formation of an artificial convective cloud similar to those formed during bench tests of aerospace engines (see figure 12), despite measures to dampen the energy of their jet stream. Such tests are carried out on complex large-scale test stands that include, for the safety of the exhaust gases for the surrounding urban environment:
- -
reducing the velocity of the reactive jet by changing the diameter of the pipes through which the jet flows, including the confuser, cylindrical pipe and diffuser;
- -
reducing the temperature of the jet stream by mixing it with nitrogen and atmospheric air blowing on the engine;
- -
reducing the temperature of the jet by injecting large amounts of water into the jet at the inlet of the confuser and at the inlet of the diffuser;
- -
jet velocity reduction due to jet rotation in the gas dynamic tube and gas dynamic unit;
- -
reduction of jet kinetic energy by abrupt expansion in a hydrodynamic carrier;
- -
reduction of kinetic energy of the jet in a vertical diffuser tube with a height of about 80 m and a diameter of 15 m.
After all these manipulations, the jet, which had supersonic velocity and very high temperature, is ejected into the atmosphere with a multiply reduced velocity and temperature. But even this is sufficient for the formation of powerful convective clouds with a height of several kilometers (
Figure 12). In 15-25 minutes after engine operation termination, these clouds usually dissipate, giving small precipitation, and under favorable atmospheric conditions can grow into powerful cumulus-rain clouds.
5.3. Device for Inducing Artificial Rain
To induce artificial heavy rain, it is proposed to use a device containing an aerospace jet engine, tanks for liquid fuel and liquid oxygen, an unmanned aerial vehicle with a sprayer of hygroscopic nano-powder and a set of instruments for measuring the parameters of the atmosphere, jet stream and artificial rainfall. The most acceptable for these purposes is a liquid oxygen-hydrogen engine of RD-0120 type and its analogs, whose exhaust mainly contains cloud-forming water vapor. Also acceptable are three-component oxygen-kerosene-hydrogen engines such as RD-0750, RD-704, or oxygen-methane engines such as RD-0169 and their analogs. More powerful engines like RD-170, RD-171 can be very efficient for creating artificial clouds, but they have high fuel and oxidizer consumption.
To conduct demonstration experiments to verify the effectiveness of the proposed method it is envisaged to use oxygen-kerosene engine NK-33 due to the fact that the developer and manufacturer of the engine Public Joint Stock Company “Engine Building Corporation Kuznetsov” agrees to participate in the project. NK-33 engines and its analogues (NK33/AJ26, NK43, AJ26-58, AJ26-62, etc.) have a thrust of 154 tons, an operating time of up to 365 seconds, a length of 3705 mm, a nozzle diameter of 1490.5 mm, a dry mass of 1240 kg, the possibility of multiple use and high reliability of operation of 0.9994 (Danilchenko, 2018).
In contrast to its direct purpose, the NK-33 engine is mounted on a solid fixed support with the nozzle upwards, so that a jet of jet gases with an initial temperature of about 1700 oC, a velocity of 3000 m/s and a mass flux of more than 2200 kg/s creates an extensive upward flow and initiates the formation of a powerful convective cloud. The operation time of the engine should be about 150-300 seconds to create an initial convective cloud with a volume of at least 106 m3. Under favorable conditions (high air humidity, weak wind), such a cloud can develop due to the release of water vapor condensation heat and the potential energy of convective atmospheric instability (CAPE). The introduction of a hygroscopic aerosol, such as NaCl/TiO2 nano-aerosol (Haoran et al., 2019), with a diameter of about 5 μm at a dosage of about 1012 particles/sec (about 0.1-0.2 kg/sec) into the jet stream can lead to a lowering of the condensation level and acceleration of the water vapor condensation process and, ultimately, to the formation of heavy rain (Belyaeva et al., 2013).
Aerosol application is carried out by spraying nano-powders from an unmanned aerial vehicle used for spraying fields, hovering in the center of the jet at an altitude of 400-500 m, where the temperature of the jet according to the on-board sensor will become lower than the dissociation threshold of the aerosol substance. Aerosol can also be introduced by spraying an aqueous solution of hygroscopic substance into drops of 10-15 microns in diameter, which instantly vaporize to form an aerosol of 5-10 microns in diameter.
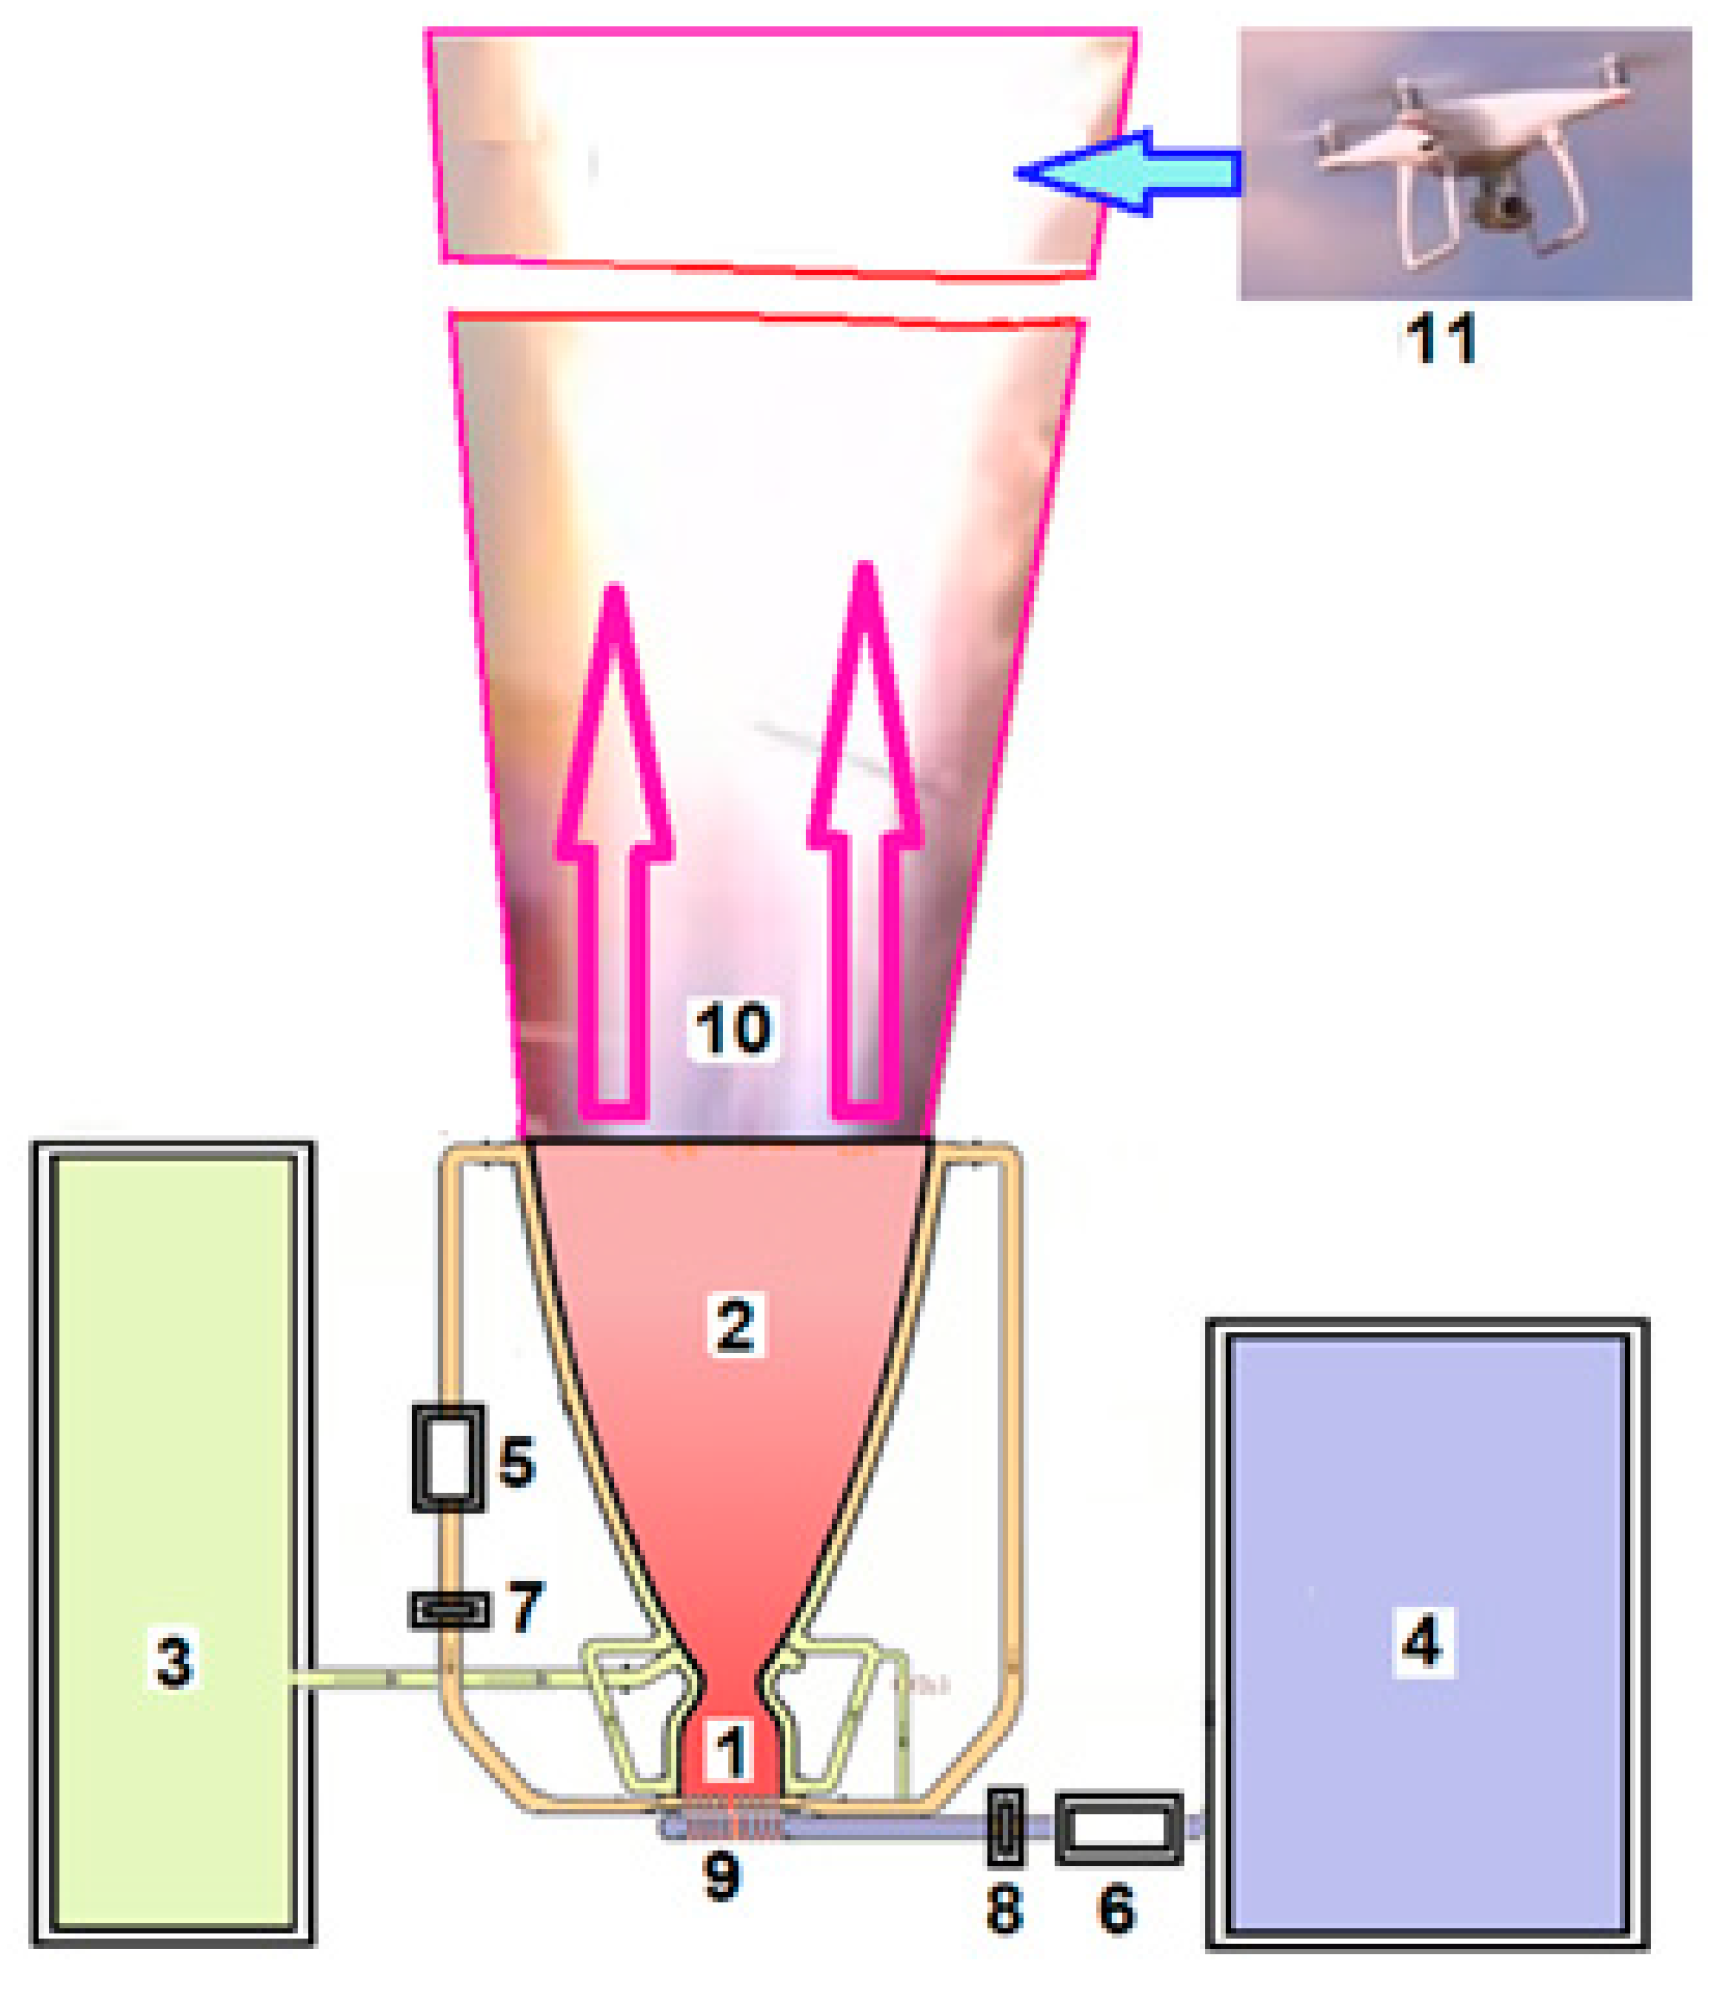
Figure 13 shows a simplified scheme of a device for inducing artificial heavy rainfall, which contains a combustion chamber (1), a nozzle directed to the zenith (2), tanks for kerosene and liquid oxygen (3) and (4), high-pressure booster turbopumps (5 and 6) that supply kerosene and liquid oxygen to the combustion chamber through valves (7 and 8), an ignition device (9), and a drone (11) that introduces hygroscopic aerosol into the jet stream (10) at an altitude of 400-500 m.
Table 2.
Parameters of the updraft jet created by the NK-33 engine.
Table 2.
Parameters of the updraft jet created by the NK-33 engine.
| No. |
Parameter |
Designation |
Unit of measurement |
Value |
| 1 |
Initial jet temperature |
To |
oС |
1700 |
| 2 |
Initial velocity of jet gases |
Wo |
m/s |
3000 |
| 3 |
Initial mass flow of jet gases |
mo |
kg/s |
2200 |
| 4 |
Initial jet diameter at nozzle outlet |
do |
M |
1,49 |
| 5 |
Pressure in the jet at the nozzle outlet |
po
|
kg/cm2
|
0,4 |
| 6 |
Jet power |
Po |
MW |
5000 |
| 7 |
Volume flow rate of gases at nozzle outlet |
vo |
m3/s |
5500 |
The Device also includes a set of meteorological instruments (
Figure 14) for measuring the parameters of the atmosphere, jet stream and artificial rain, based on the data of which the decision is made to conduct rain inducing operations and assess their effectiveness.
5.4. On Optimization of Jet Stream Parameters
The proposed Device is created on the basis of available industrial samples of aerospace engines, unmanned aviation and measuring equipment. However, for large-scale application and cheapening it is envisaged to develop a simplified version of the engine, in which it is envisaged to exclude the design elements necessary for its application on carrier rockets. In addition, it is planned to modify the nozzle design so as to provide vortex rotation and wide-angle flow of jet gases. Wide-angle flow of gases will result in lower initial jet velocity, multiple reductions in air resistance, and reduction of large near-field jet energy losses. This, together with the vortex rotation, can significantly increase the jet lift height.
Air resistance to the lift of a vertically directed jet (
F) is proportional to the mass (
m) to the square of the jet velocity (
W):
A large initial velocity of an aerospace engine jet (W
0 = 3000 m⋅s
-1) will result in large losses of its energy. These losses can be reduced by expanding the jet. To estimate the required degree of jet expansion, we will use the fact that, according to the equation of continuity and the law of conservation of jet mass, the mass of jet gases passing through any cross-section of the jet in 1 s remains constant (i.e.,
ρSW = const). Considering that at some height
H above the standard and modified nozzle, the density of the jet gases becomes equal to that of the ambient air, in the absence of ambient air involvement, we have:
SW = const. Hence, due to the constancy of the gas flow rate, we obtain:
The results of estimations according to formulas (6.1) and (6.2) are presented in
Figure 15, from which it follows that at the jet widening from the standard angle
θ0 ≈ 2 degrees to
θ = 25 degrees already at the height
H = 10 m the initial jet velocity
W0 decreases by a factor of 10 (see
Figure 15a), and the air resistance
F correspondingly decreases by a factor of 100. At the same jet broadening to
θ = 25 degrees at a height of
H = 100 m, the initial jet velocity
W0 decreases by a factor of 1000 (see
Figure 15b). At this jet velocity (about 3 m/s), the air resistance
F becomes minimal. The cross-sectional area of the jet increases almost 100 times, reaching the value
S = 1300 m
2, which approaches the size of atmospheric convective bubbles. It should be noted that the convective clouds shown in
Figure 12 are formed after the expansion of the jet in the diffuser of the test stand.
5.5. Selection of Position and Favorable Atmospheric Condition
It is obvious that artificial heavy rainfall of significant intensity and scale can be created only in places and days with favorable atmospheric conditions. Natural convective clouds with showers are formed in meso-areas of favorable combinations of pressure, air temperature and humidity, wind speed and direction. Such favorable combinations are rare in arid and desert regions. Application of the proposed method and Device provides for expanding the scope of meteorological conditions of natural formation of heavy rainfall by affecting the atmosphere with a short-term but energetically powerful pulse capable of triggering the action of its own potential energy of atmospheric instability.
Selection of a favorable position: It is expedient to locate the Rainmaker on the seashore on the windward flank of the coastal elevation, so that, firstly, to initiate the upward flow from the surface layer of the atmosphere, which has the maximum water vapor content, and, secondly, the breeze and orographic circulation can contribute to the development of artificial convection initiated by a powerful jet stream. It is also expedient to locate the Device in mountains, in the headwaters of the catchment area of large rivers flowing towards arid areas and feeding drying lakes such as the Aral in Central Asia, Urmia and Hamun in Iran and others. This will allow utilization of existing water collection and distribution systems.
The devices should be located no closer than 1000 m from populated areas so that the noise impact of the engine does not exceed the permissible sanitary level. At a safe distance from the engine stand, fuel and liquid oxygen tanks, a complex of equipment for measuring atmospheric parameters, artificial upward flows, clouds and precipitation, and a site for take-off and landing of a meteo-drone and aerosol spraying drone are placed.
Selection of days with favorable conditions: Theoretical and experimental studies of the motion in the atmosphere of a vertically directed jet stream (Abshaev, Aksenov et al., 2022b), as well as the influence of parameters of the surface layer of the atmosphere on the development of cloud convection (Abshaev, Zakinyan at al., 2019, 2020 and 2022) have shown that favorable conditions for the creation of artificial rainfall are:
surface wind speed (Uo) not more than 2 m/s, and in the layer up to 1000 m not more than 6-8 m/s;
surface air humidity RH > 70%;
thickness of surface air temperature and humidity inversion layers h < 500 m;
potential energy of instability CAPE > 200 J/kg.
The criteria for selecting days with favorable conditions are presented in
Figure 15.
Favorable synoptic situations are considered to be the presence of the area of low pressure and convergence with the cold inflow at the heights, and also the intrusion of cold fronts contributing to the orderly ascent of warm air along the cold boundary.
The favorable time of day is the period of maximum atmospheric heating from 1500 to 1700 local time. This is due to the fact that the maximum solar radiation is observed at 12 o'clock, the maximum soil temperature comes in 1.5 - 2 hours, and the maximum surface air temperature is about 15 hours.
The duration of the Device operation can be from 150 to 300 seconds depending on the time of appearance of a powerful developing convective cloud. The intensity of cloud and precipitation formation increases with increasing duration of jet engine operation. However, the high fuel and oxidizer costs require a reasonable approach to determining the optimal duration of its operation.
5.6. Assessment of the Expected Effectiveness of the Method
An objective assessment of the effectiveness of the proposed method can be made on the basis of a series of full-size well controlled field experiments. But it is reasonable to assume that the proposed precipitation enhancement method may be more effective than the applied aerial, rocket and ground-based methods of seeding existing clouds, which are scarce in desert regions. The proposed method can be used both to enhance existing clouds and to create artificial clouds on days when the formation of natural clouds is constrained by the presence of inversion layers, insufficient CAPE instability energy, and others. The selection of favorable atmospheric conditions, favorable position and time of day, and an engine of sufficient power increases the probability of creating artificial clouds and precipitation.
The proposed method also has advantages over commonly used technologies for seawater desalination, underground groundwater extraction, and underground seawater extraction, including:
hundreds of times lower capital costs for infrastructure construction;
ease and speed of infrastructure construction even in desert regions;
reduction of water production costs by 2-3 times.
According to Internet data, the cost of building desalination plants with a daily capacity of 5×10⁵ to 1×10⁶ m3 in Saudi Arabia, UAE and Australia was $1.5-2.0 billion. Construction of even 20 pcs. of the proposed Rainmakers, for example, along the entire northwest coast of the UAE would require about $80 million. The infrastructure for such a system can be built in 1.5-2 years, while the construction of a 4.1×10⁵ m3/day Victorian Desalination Plant for Melbourne's water supply cost $2.7 billion and took 3 years to build after a lengthy design.
The annual cost of operating the 20 proposed Devices, assuming about 25-30 stormwater generation operations at each, would be about $90 million, of which about 60% would be spent on liquid oxygen and fuel (kerosene, hydrogen, or propane). As a result of 500-600 operations per year, about 5×10⁸ m3 of fresh water can be obtained, considering that one heavy rainfall gives on average about 106 m3 of rainwater (Abshaev et al., 2009 and 2014). At the same time, the cost of water, taking into account capital costs for construction and operation will be about 0.34 $/m3, and taking into account only operational costs 0.18 $/m3.
The cost of seawater desalination, treatment and reuse of municipal wastewater, irrigation and ballast water according to (Jones et al., 2019; Qadir and Smakhtin, 2022) is about 4-7 times more expensive than the proposed technology and 3-5 times more expensive than traditional water supply from rivers and lakes (see
Table 4). The cost per cubic meter of water of the most advanced desalination plant Rabig-3 in Saudi Arabia is 0.53
$/m
3.
It should be noted that the advantage of desalination plants is the possibility of daily production of fresh water, while artificial heavy rainfall can be induced only on days with favorable atmospheric conditions. But the important advantages of the proposed method are lower cost of water, hundreds of times lower capital construction costs, and the possibility of quickly establishing a network of facilities that can cover large areas of deserts. Due to this, the proposed method can be an additional source of water, which is advantageous to apply in desert regions, including for groundwater recharge.
Potential consumers can be countries of Africa, Asia, North and South America, Australia. Taking into account these prospects, it is planned to produce an experimental sample of the proposed Device, to conduct demonstration experiments, to develop a simplified industrial sample of the Device and to conduct further research on the development of the scientific base and assessment of the consequences of the method application.
Conclusions
In result of theoretical and experimental studies of the possibility of creating artificial clouds and rain based on three different physical approaches, the following has been established.
1. A solar meteotron, which is an artificial aerosol layer created in the surface layer of the atmosphere using special pyrotechnic smoke bombs generating aerosol with a diameter of about 200 nm, well absorbing solar radiation in the visible wavelength range, can initiate thermal convection and the development of convective clouds of Pyro Clouds type at low surface wind speeds, vertical temperature gradient of more than 8 oC/km and increased air humidity. Experiments with the developed smoke bombs have shown that this is possible when the aerosol layer area is about 5-10 km2 and the concentration of aerosol particles is not less than 2.5×10¹³ m-2. Such concentration should be maintained for about 30 minutes or more. One operation to create an artificial cloud requires the consumption of aerosol composition in the amount from several tons to 20 tons, depending on the dispersibility of the aerosol and wind characteristics. Therefore, the application of this method is very expensive and is only acceptable away from residential areas due to atmospheric pollution.
2. The method of creating a jet of upward flow by means of a 30-40-tiered garland of black toroidal-shaped screens lifted on a balloon has no prospects for the following reasons. Even if the area of each screen is about 200 m2, the amount of absorbed solar radiation is so small that the upward flow pulse initiated by each tier does not reach the next tier due to wind drift and adiabatic cooling. This precludes the creation of a single upward flux by adding the pulses generated by all tiers. In addition, trial experiments have shown that the large sailing of the screens excludes the lifting of the garland consisting of more than 4-5 tiers even at wind speeds of 1-2 m/s.
3. Field experiments on the creation of artificial clouds using a vertically directed jet fueled by the heat of water vapor condensation on three types of hygroscopic aerosols having different hygroscopic points showed the possibility of creating under some atmospheric condition’s small artificial clouds and precipitation of no practical significance. The reason for these modest results is that the air humidity on the days with the experiments was lower than the hygroscopic point of the two types of aerosols (NaCl and (NH2)2CO) introduced into the jet at the start. Secondly, the condensation of water vapor on these types of aerosols was not so fast. Therefore, the jet did not receive the energy boost from condensation heat that we expected, and the power of the aircraft engine used was not sufficient to overcome the inversion layers and the destructive effect of the wind and create more powerful clouds.
4. Numerical modeling of jet motion in the real atmosphere based on the FlowVision 3-D hydrodynamic model has shown that even a weak wind increasing with altitude carries away the jet of an aircraft engine and it does not always reach the height of the condensation level.
Therefore, to create Cb-clouds it is proposed to use a many times more powerful aerospace engine, which is mounted on a fixed support with the nozzle upwards, so that the high-temperature jet creates a powerful updraft flow, initiating the formation of an artificial convective cloud, which is often formed during bench tests of such engines. Under favorable conditions (high air humidity, weak wind), such a cloud can develop due to the latent energy of atmospheric instability. Introduction of hygroscopic aerosol, for example, NaCl/TiO
2 nano-aerosol with a diameter of about 5 microns at a concentration of at least 10
12 particles/second into the jet stream can lead to acceleration of the process of heavy rain formation. Details of realization of this method, composition of the device and conditions of its application are described in
Section 5.4.
Author Contributions
Both authors jointly carried out theoretical and experimental studies on the implementation of the described methods. MT developed the physical principles and concepts, interpreted the results of the field experiments, and prepared the manuscript. AM provided project management, collection and processing of instrumental data, validation of results and preparation of the final manuscript.
Funding
This work was supported by the National Center of Meteorology, Abu Dhabi, UAE under the UAE Research Program for Rain Enhancement Science (grant No APP-REP-2017-02120).
Data availability statement
The main results of the study are included in the article. Additional materials are available upon request.
Acknowledgments
The authors express their gratitude to the group of specialists of TESIS Engineering Company represented by Dr. Aksenov A.A., Fisher J.V. and Shchelyaev A.E. for participation in the project in terms of theoretical modeling at all stages of the project, as well as to the group of scientists of the North Caucasus State University represented by Professor Zakinyan R.G. and Associate Professor Zakinyan A.R. in terms of modeling the possibility of initiating artificial convection and favorable atmospheric conditions.
Conflicts of Interest
The authors declare no conflict of interest.
References
- Abramovich, G.N. The Theory of Turbulent Jets; Scientific Press: Moscow, 1984; 715p. [Google Scholar]
- Abshaev, M.T.; Abshaev, A.M.; Aksenov, A.A. Simulation of large-scale convective atmospheric flows in FlowVision CFD; Parallel Computing Technologies: Dubna, 2022. (in Russian) [Google Scholar]
- Abshaev, M.T.; Abshaev, A.M.; Aksenov, A.A.; Fisher, I.V.; Shchelyaev, A.E.; Al Mandous, A.; Wehbe, Y.; El-Khazali, R. CFD simulation of updrafts initiated by a vertically directed jet fed by the heat of water vapor condensation. Sci. Reports 2022, 12, 9356. [Google Scholar] [CrossRef] [PubMed]
- Abshaev, M.T.; Abshaev, A.M.; Aksenov, A.A.; Fisher, J.V.; Shchelyaev, A.E.; Al Mandous, A. Study of the Possibility of Stimulating Cloud Convection by Solar Radiation Energy Absorbed in an Artificial Aerosol Layer. Atmosphere 2023, 14, 86. [Google Scholar] [CrossRef]
- Abshaev, M.T.; Abshaev, A.M.; Aksenov, A.A.; Fisher, J.V.; Shchelyaev, A.E.; Al Mandous, A. Results of Field Experiments for the Creation of Artificial Updrafts and Clouds. Atmosphere 2023, 14, 136. [Google Scholar] [CrossRef]
- Abshaev, A.M.; Abshaev, M.T.; Barekova, M.V.; Malkarova, A.M. Manual on Hail Suppression; Nalchik, Printing House, 2014; 506p. [Google Scholar]
- Abshaev, M.T.; Abshaev, A.M.; Malkarova, A.M.; Mizieva, J.Y. Radar estimation of water content in Cb clouds. Izv. Atmos. Ocean. Phys. 2009, 45, 731–736. [Google Scholar] [CrossRef]
- Abshaev, M.T.; Abshaev, A.M.; Zakinyan, R.G.; Zakinyan, A.R.; Wehbe, Y.; Yousef, L.; Farrah, S.; Al Mandous, A. Investigating the feasibility of artificial convective cloud creation. Atm. Research 2020, 243, 104998. [Google Scholar] [CrossRef]
- Abshaev, A.M.; Flossmann, A.; Siems, S.T.; Prabhakaran, T.; Yao, Z.; Tessendorf, S. Rain Enhancement Through Cloud Seeding. In the book “Unconventional Water Resources”. Editors Manzoor Qadir at all; Springer, 2022. [Google Scholar] [CrossRef]
- Abshaev, M.T.; Zakinyan, R.G.; Abshaev, A.M.; Al-Owaidi, Q.S.K.; Zakinyan, A.R.; Wehbe, Y.; Yousef, L.; Farrah, S.; Al Mandous, A. Influence of Atmosphere Near Surface Layer Properties on Development of Cloud Convection. Atmosphere 2019, 10, 131. [Google Scholar] [CrossRef]
- Abshaev, M.T.; Zakinyan, R.G.; Abshaev, A.M.; Zakinyan, A.R.; Ryzhkov, R.R.; Wehbe, Y.; Al Mandous, A. Atmospheric conditions favorable for the creation of artificial clouds by a jet saturated with hygroscopic aerosol. Atm. Research 2022, 106323. [Google Scholar] [CrossRef]
- Aladin, N.V.; Plotnikov, I.S. Drying up of the Aral Sea and possible ways of rehabilitation and conservation of its northern part. Proc. of the Zoological Institute of Russian Academy of Sci. 1995, 262, 3–16. [Google Scholar]
- Al Hosari, T.; Abdulla Al Mandous Wehbe, Y.; Shalaby, A.; Al Shamsi, N.; Al Naqbi, H.; Al Yazeedi, O.; Al Mazroui, A.; Farrah, S. The UAE cloud seeding program: A statistical and physical evaluation. Atmosphere 2021, 12, 1013. [Google Scholar] [CrossRef]
- Atkinson, B.W. The Mechanical Effect of an Urban Area on Convective Precipitation. Occasional Paper 3; Dept. of Geography, Queen Mary College, Univ. of London, 1975; 27p. [Google Scholar]
- Arizona Board of Regents Urban Climate – Climate Study, U.H.I. Arizona State University Archived from the original on 2007-11-23. Retrieved 2007-08-02. 2007; -02. [Google Scholar]
- Belyaeva, M.V.; Drofa, A.S.; Ivanov, V.N. Efficiency of stimulating precipitation from convective clouds using salt powders. Izv. Atmos. Ocean. Phys. 2013, 49, 154–161. [Google Scholar] [CrossRef]
- Benech, B. Experimental study of an artificial convective plume initiated from the ground. J. Appl. Meteorology 1976, 15, 127–137. [Google Scholar] [CrossRef]
- Beysens, D.; Milimouk, I. The Case for Alternative Fresh Water Sources; Retrieved 10 September 2010; International Organization for Dew Utilization, 10 September 2000. [Google Scholar]
- Branch, O.; Behrendt, A.; Gong, Z.; Schwitalla, T.; Wulfmeyer, V. Convection Initiation over the Eastern Arabian Peninsula. Meteorologische Zeitschrift 2020, 29, 67–77. [Google Scholar] [CrossRef]
- Brenig, L.; Zaady, E.; Vigo-Agular, J.; Karnieli, A.; Fovell, R.; Arbel Sh Al Baz, I.; Offer, Z.Y. Cloud formation and rainfalls induced by artificial solar setting: a weather engineering project for fighting aridity. In: Geographical Forum – Geographical Studies and Environment Protection Research 2008, 7, 67–82. [Google Scholar]
- Changnon, S.A. Urban effects on thunderstorm and hailstorm frequencies; Proc. of 2nd Conf. on Biometeorology: Philadelphia, 1972; pp. 177–184. [Google Scholar]
- Chowdhury's Guide to Planet Earth. The Water Cycle. West Ed. Archived from the original on 2011-12-26. 2005; Retrieved 2006-10-24.
- Cook, K.H.; Vizy, E.K. K. Detection and Analysis of an Amplified Warming of the Sahara Desert. Journal of Climate 2015, 28, 6560. [Google Scholar] [CrossRef]
- Danilchenko, V.P. History of development of Russian liquid-propellant rocket-space engines PJSC “Kuznetsov”; Publishing House “Stolichnaya Encyclopedia”: Moscow, 2018; Volume 5, pp. 124–130. [Google Scholar]
- Danilov-Danelyan, V.I. Water Resources of Russia: State, Utilization, Protection, Management, Problems. Economics, Taxes, Pravo. 2019, 12, 18–31. [Google Scholar] [CrossRef]
- Dedova, E.B.; Goldvarg, B.A.; Tsagan-Mandzhiev, N.L. Degradation of lands of the Republic of Kalmykia: problems and ways of their restoration. Arid Ecosystems, 2020, 26, 63–71. [Google Scholar]
- Dessens, H. Pourrons-nous Modifier les Climats? Broch´e 95; 1965. [Google Scholar]
- Dessens, H.; Dessens, J. Exp´eriences avec le meteotronean Centre de Recherches Atmosph´eriques. J. Rech. Atmosph. 1964, 1, 158–162. [Google Scholar]
- Downing, J.A.; Prairie, Y.T.; Cole, J.J.; Duarte, C.M.; Tranvik, L.J.; Striegl, R.G.; McDowell, W.H.; Kortelainen, P.; Caraco, N.F. The global abundance and size distribution of lakes, ponds, and impoundments. Limnology and Oceanography, 2006, 51, 2388–2397. [Google Scholar] [CrossRef]
- Drofa, A.S.; Ivanov, V.N.; Rosenfeld, D.; Shilin, A.G. Studying an effect of salt powder seeding used for precipitation enhancement from convective clouds. Atmosph. Chem. Phys. 2010, 10, 8011–8023. [Google Scholar] [CrossRef]
- Duffie, J.A.; Beckman, W.A. Solar Engineering of Thermal Processes. Fourth Edition; Printed in the United States of America; 2013; 910p, ISBN 978-0-470-87366. [Google Scholar]
- Espy, J.P. Second and Third Reports on Meteorology to the Secretary of Navy, Washington, 31st Cong., 1st sess. S. Ex. Doc. 30. 1851. [Google Scholar]
- Flossmann, A.; Manton, M.; Abshaev, A.; Bruintjes, R.; Murakami, M.; Prabhaharan, T.; Yao, Z. Review of advances in precipitation enhancement research. Bull. Am. Meteorol. Soc. 2019, 100, 1465–1480. [Google Scholar] [CrossRef]
- FlowVision. User’s Guide 3.12.02. Company TESIS. Available online: https://flowvision.ru/webhelp/fvru_31201.
- Fromm, M.D.; Servranckx, R. Transport of forest fire smoke above the tropopause by supercell convection. Geophys. Res. Lett. 2003, 30, 1542. [Google Scholar] [CrossRef]
- Fromm, M.D.; R Bevilacqua, R. Servranckx, J. Rosen, J. Thayer, J. Herman, and D. Larko,. Pyro-cumulonimbus injection of smoke to the stratosphere: Observations and impact of a super blowup in northwestern Canada on 3-4 August 1998. J. Geophys. Res. 2005, 110, D08205. [Google Scholar] [CrossRef]
- Fuchs, D. Spain goes hi-tech to beat drought. The Guardian; Retrieved 2007-08-02; 2005. [Google Scholar]
-
Goddard Space Flight Center. NASA Satellite Confirms Urban Heat Islands Increase Rainfall Around Cities; National Aeronautics and Space Administration. 2002. Archived from the original on June 12; 12 June 2008.
- Graham, S.; Parkinson, C.; Chahine, M.; The water cycle. NASA Earth Observatory. 2010. Available online: https://earthobservatory. nasa.gov/features/Water (accessed on 21 April 2020).
- Haoran, L.; Abshaev, M.T.; Abshaev, A.M.; Huchunaev, B.M.; Griffiths, S.; Zou, L. Water vapor harvesting nanostructures through bioinspired gradient-driven mechanism. Chem. Phys. Lett. 2019, 728, 167–173. [Google Scholar] [CrossRef]
- Jones, E.; Qadir, M.; Van Vliet, M.T.H.; Smakhtin, V.; Kang, S. The state of desalination and brine production: A global outlook. Science of The Total Environment 2019, 657, 1343–1356. [Google Scholar] [CrossRef] [PubMed]
- Kachurin, L.G. Physical bases of atmospheric processes modification; Hydrometizdat: Leningrad, 1990; p. 463. [Google Scholar]
- Khemani, L.T.; Ramana-Murty, B.V. Rainfall Variations in an Urban Industrial Region. J. Appl. Met. 1973, 12, 187–194. [Google Scholar] [CrossRef]
- Konikow, L.F.; Kendy, E. Groundwater depletion: A global problem. Hydrogeology Journal 2005, 13, 317–320. [Google Scholar] [CrossRef]
- Korneev, V.P.; Shchukin, G.G.; Kim, N.S.; Koloskov, B.P.; et al. Artificial regulation of atmospheric precipitation and fog dispersion. Moscow 2019, 297. [Google Scholar]
- Kulik, K.N.; Kryuckov, S.N.; Malanina, Z.I.; Semenyutina, A.V. The strategy of protective forestation development in Russian Federation for a period till 2025 year, remade and supplemented // Federal Scientific Center of Agroecology of the Russian Academy of Sciences. Volgograd 2018, 36. [Google Scholar]
- Kuznetsov, A.A.; Konopasov, N.G. The Meteotron. Book No 2. Experiments. Observations. Assessments. Registrations; Publishing House of Vladimir State University: Vladimir, 2015; 232 p. [Google Scholar]
- Liang, H.; Abshaev, M.T.; Abshaev, A.M.; Huchunaev, B.M.; Griffiths, S.; Zou, L. Water vapor harvesting nanostructures through bioinspired gradient-driven mechanism. Chemical Physics Letters 2019, 728, 167–173. [Google Scholar] [CrossRef]
- Lindsey, D.T.; Fromm, M. Evidence of the cloud lifetime effect from wildfire-induced thunderstorms. Geophys. Res. Lett. 2008, 35, L22809. [Google Scholar] [CrossRef]
- Mattes, F.C. Nuclear power and climate change. Heinrich Böll Foundation, PO Box 2472; Saxonwold, 2132: South Africa, 2005; p. 53. [Google Scholar]
- Masson-Delmotte, М.; Zhai, P.; Partner, H.O. Global warming of 1.5 ◦C. Intergovernmental Panel on Climate Change; 2018. [Google Scholar]
- Mie, G. Beitrage zur optic truber medien speziel kolloidaler metalosungen. Ann. Phys. 2008, 1908, 377–422. [Google Scholar] [CrossRef]
- New UNICEF-WHO Report, 6 July 2023.
- Oranovsky, V.V. Atmospheric precipitation induction method. Patent RU 2071243 1994. Available online: https://patents.google.com/patent/RU2071243C1/ru.
- Method and Apparatus for making Artificial Rain.Patent USA № 2740663. 24 December 1951.
- Abshaev, M.T.; Abshaev, A.M.; Al Mandous, A. Method of creating artificial clouds and precipitation. Patent RU No. 2732710 2019. Available online: https://patents.google.com/patent/RU2732710C1/ru.
- Abshaev, A.M.; Abshaev, M.T.; Al Mandous, A. Method and device for creation of artificial clouds and precipitation. Patent RU No. 2738479 2020. Available online: https://patents.google.com/patent/RU2738479C1/ru.
- Abshaev, M.T.; Abshaev, A.M.; Al Mandous, A. Method of creation of artificial clouds and precipitation. Patent RU No. 2803352 2022. Available online: https://patents.google.com/patent/RU2803352C1/ru.
- Petrov, V.I.; Pavlovsky, V.S.; Kulik, K.N.; Voronina, V.P.; Skurko, V.E. Atlas of desertification of agricultural lands of the Russian Caspian Sea; VNIALMI: Volgograd, 1999; 37p. [Google Scholar]
- Pavlyuchenko, V.P. Generation of Artificial Updrafts in the Atmosphere by a Multilevel Facility. Bulletin of the Lebedev Physics Institute 2019, 46, 165–169. [Google Scholar] [CrossRef]
- Qadir, M.; Smakhtin, V.; Koo-Oshima, S.; Edeltraud, G. Unconventional Water Resources; Springer Nature AG: Switzerland, 2022; 309p, ISBN 978-3-030-90145-5. [Google Scholar] [CrossRef]
- Rosenfeld, D.; Fromm, M.; Trentmann, J.; Luderer, G.; Andrea, M.O. The Chisholm firestorm: Observed microstructure, precipitation and lightning activity of a Pyro-Cb. Atmos. Chem. Phys. 2007, 7, 645–659. [Google Scholar]
- Tai, Y.; Liang, H.; El Hadri, N.; Abshaev, A.; Huchunaev, B.; Griffiths, S.; Jouaid, M.; Zou, L. Core/Shell Microstructure Induced Synergistic Effect for Efficient Water-Droplet Formation and Cloud-Seeding Application. ACS Nano 2017. [Google Scholar] [CrossRef]
- Tereshchenko, A.G. Deliquescence: Hygroscopicity of Water-Soluble Crystalline Solids. J Pharm Sci. 2015, 104, 3639–3652. [Google Scholar] [CrossRef]
- Tverskoy, P.N. Course of meteorology; Hydrometizdat: Leningrad, 1962. [Google Scholar]
- Trenberth, K.E.; Philip, D.; Jones, P.D. Chap 3, Observations: Atmospheric Surface and Climate Change, Executive Summary; 2007; p. 237. [Google Scholar]
- UNESCO and World Water Assessment Programme (WWAP). The United Nations World Water Development Report 2017: Wastewater, The Untapped Resource; UNESCO: Paris, 2017. [Google Scholar]
- Vulfson, N.I.; Levin, L.M. ;Meteotron as the means of influence on the atmosphere. M.: Gidrometeoizdat; 1987; 129p. [Google Scholar]
- Wehbe, Y.; Griffiths, G.; Al Mazroui, A.; Al Yazeedi, O. Rethinking water security in a warming climate: rainfall enhancement as an innovative augmentation technique. NPJ Clim Atmos Sci 2023, 6, 171. [Google Scholar] [CrossRef]
- Wikipedia. Top ten largest (non-polar) deserts. Archived from original on 2021-01-26.
- Wood, B.K. Propulsion for the 21ST Century - RS-68. American Institute of Aeronautics and Astronautics Copyright (c) 2002 by The Boeing Company; with permission; Published by the American Institute of Aeronautics and Astronautics, Inc., 2002. [Google Scholar]
- Wulfmeyer, V.; Behrendt, A.; Kottmeier, C.; Corsmeier, U.; Barthlott, C.; Craig, G.C.; Hagen, M. The Convective and Orographically-induced Precipitation Study (COPS): The scientific strategy, the field phase, and research highlights. Q. J. R. Meteorol. Soc. 2011, 137, 3–30. [Google Scholar] [CrossRef]
Figure 3.
Rise height and velocity of the updraft caused by the action of an artificial aerosol layer having an area of 104, 105, 106, and 107 м2.
Figure 3.
Rise height and velocity of the updraft caused by the action of an artificial aerosol layer having an area of 104, 105, 106, and 107 м2.
Figure 5.
Multitier device Heliator-2: (a) Design of Heliator-2; (b) Experimental prototype of Heliator-2 in real atmosphere; (c) Simulated updrafts velocity in a windless atmosphere; (d) Tilting of thermal bubbles generated by Heliator-2 in a windy atmosphere. It can be seen that the wind tilts the garland of screens and blows down the updrafts stimulated by each tier excluding the summation of the effects of a multi-tiered system.
Figure 6.
Vertical and horizontal sections calculated using FlowVision model, three-dimensional structure of the jet in a windy atmosphere: (a) - vertical cross-sections of jet velocity and temperature excess fields on 1, 2, 3, 4 and 5 minutes after start; (b) - horizontal cross-sections of the jet velocity, temperature excess, and aerosol concentration fields at altitudes of 100, 200, 300, 400 and 500 m. Atmospheric conditions: vertical wind speed profile U(H) = 1 + 0,004H, vertical temperature gradient g = 7.5 °C/km, air humidity RH = 45%.
Figure 7.
(a) and (b) - vertical cross-sections of the calculated fields of updraft velocity (W) and temperature excess (ΔT) of the jet; (c) and (d) - vertical profiles of the maximum values of W and ΔT on the axis of the jet, which is fed by water vapor condensation heat equal to PC = 9.8 MW/с, 2PC and 4PC. Atmospheric conditions: wind speed U = 0; vertical temperature gradients γ = 7.5 oC/km, relative humidity RH = 75%.
Figure 8.
Our experimental complex on tests in the UAE on the Jebel Jais mountain: 1 - turbojet engine D-30 III series; 2 - air intake; 3 - diverter serving to turn the jet upwards; 4 - cabinet with control system of D-30 engine; 5 - tank for aviation kerosene; 6 and 7 - JY-60 and WP-60 aerodynamic cannons for spraying aqueous solutions of hygroscopic substances; 8 - tank for aqueous solution of NaCl; 9 - diesel generator 3x380 50 kW, powering the cannon JY-60; 10 - upward flow created by the engine D-30 (almost transparent); 11 and 12 – gas-droplet streams created by cannons JY-60 and WP-60.
Figure 9.
Comparison of the simulated and observed jet characteristics, initiated during a trial field experiment on Jebel Jais Mountain of UAE on March 17, 2021: (a) – jet shape calculated in FlowVision; (b) thermal images of the jet obtained with an IRTIS-2000C infrared scanning thermograph at 3 viewing angles; (c) – photograph of the jet in the atmosphere; (d) photograph of the upper half of the jet.
Figure 10.
Artificial clouds and precipitation created by the vertically directed jet of the aircraft turbojet engine D-30 III series: a) cumulus cloud on the background of clear sky 28.12.2021; b) cumulus cloud on the background of layered cloudiness 31.12.2021; c) radio echo zone of artificial precipitation caused by 03.01.2022 (highlighted in green).
Figure 11.
Vertical cross-sections of the calculated updraft velocity fields (W, m/s) and excess of jet temperature (ΔT, oC) that can be created in the atmosphere by jet engines that have 1, 2, 4, 8, and 16 times the power of the D-30 engine. Atmospheric conditions: vertical wind speed profile U=1+0,005H (m/s), temperature γ = 8,5 oC/km; humidity f = 70%.
Figure 12.
Artificial clouds formed by breakthrough gases during testing of aerospace rocket engines: (a) - Moscow Region, Khimki, NPO Energia (Internet resource). (b) - Artificial cloud with a little rain formed during the test of the engine of the super-heavy RS-68 carrier rocket (Wood, 2002) at NASA's Mississippi Space Center. (
https://youtu.be/aXLZAfYgbM4 [
31].
Figure 13.
Simplified scheme of the device for inducing artificial rainstorms: 1 - combustion chamber; 2 - jet gas flow nozzle; 3 and 4 - tanks for kerosene and liquid oxygen; 5 and 6 - high-pressure turbo-pump units for fuel and oxygen supply; 7 and 8 - pneumatic valves for fuel and oxygen shut-off; 9 - ignition device; 10 - high-temperature high-speed water vapor jet; 11 - drone for introducing hygroscopic aerosol into the water vapor jet.
Figure 14.
Complex instrumentation for measuring atmospheric parameters, characteristics of artificial upwelling flows, clouds and precipitation.
Figure 14.
Complex instrumentation for measuring atmospheric parameters, characteristics of artificial upwelling flows, clouds and precipitation.
Figure 15.
Calculated values of jet velocity W, area S and relative air resistance force to jet motion F0/F as a function of jet angular width ɵ (degree): (a) at a height H = 10 m; (b) at a height H = 100 m.
Figure 15.
Calculated values of jet velocity W, area S and relative air resistance force to jet motion F0/F as a function of jet angular width ɵ (degree): (a) at a height H = 10 m; (b) at a height H = 100 m.
Figure 15.
Criteria for selecting days with favorable atmospheric conditions for the creation of artificial heavy rainfall.
Figure 15.
Criteria for selecting days with favorable atmospheric conditions for the creation of artificial heavy rainfall.
Table 1.
Flow rate of hygroscopic substances introduced into the jet during in-situ experiments, expected amount of water vapor and released heat of condensation.
Table 1.
Flow rate of hygroscopic substances introduced into the jet during in-situ experiments, expected amount of water vapor and released heat of condensation.
| Hygroscopic Substance |
Substance mass flow rate M (g/s) |
Aerosol
flow rate
N (Pcs./s |
Growth
factor
k1 = md/ma
|
Water vapor mass condensed on one particle, mw = k1×ma (g) |
Total mass of condensed water vapor Mw (kg/s) |
Latent
heat of condensation PC (MW/s) |
| NaCl |
215 |
1.90×10¹¹
|
5.86 |
6.62×10⁻⁹
|
1.26 |
2.85 |
| CaCl2
|
538 |
4.78×10¹¹
|
1.67 |
1.87×10⁻⁹
|
0.90 |
2.03 |
| (NH2)2CO |
672 |
5.32×10¹¹
|
3.08 |
2.15×10⁻⁹
|
2.07 |
4.75 |
| *NaCl/TiO2 |
230 |
1.62×10¹²
|
19.4 |
2.74×10⁻⁹
|
4.46 |
10.08 |
| **CaCl2 |
476 |
3.38×10⁹
|
1.67 |
2.35×10⁻⁷
|
0,79 |
1.79 |
Table 4.
Cost of water produced by different methods (excluding capital costs).
Table 4.
Cost of water produced by different methods (excluding capital costs).
| Alternative water supply |
Cost of water $/m3
|
Energy consumption (kWh/m3) |
| limits |
average |
| Conventional surface water treatment |
0,2 – 0,4 |
0,3 |
0,2 - 0,4 |
| Water reclamation |
0,3 – 0,6 |
0,45 |
0,5 - 1,0 |
| Non-potable reuse |
0,5 – 0,8 |
0,65 |
1,5 - 2,0 |
| Direct potable reuse |
0,7 – 1,2 |
0,95 |
1,7 - 2,4 |
| Brackish water desalination |
0,4 – 1,5 |
0,95 |
1,0 - 1,5 |
| Seawater desalination (reverse osmosis) |
0,5 - 2,5 |
1,5 |
2,5 - 4,0 |
| Water collection from fogs |
1,4 - 16,6 |
2,5 |
- |
| Application of the proposed Device |
0,15 – 0,20 |
0,18 |
0,005 |
|
Disclaimer/Publisher’s Note: The statements, opinions and data contained in all publications are solely those of the individual author(s) and contributor(s) and not of MDPI and/or the editor(s). MDPI and/or the editor(s) disclaim responsibility for any injury to people or property resulting from any ideas, methods, instructions or products referred to in the content. |
© 2025 by the authors. Licensee MDPI, Basel, Switzerland. This article is an open access article distributed under the terms and conditions of the Creative Commons Attribution (CC BY) license (http://creativecommons.org/licenses/by/4.0/).