Submitted:
24 February 2025
Posted:
25 February 2025
You are already at the latest version
Abstract
The experiment was conducted in West Hararghe Zone, Ethiopia. The trial was conducted at mid to lowland agroecologies for two years to evaluate cowpea genotypes' agronomic performance and nutritional quality under different environments. Ten genotypes and two standard checks were used as experimental treatments in RCBD with three replications. All agronomic and yield parameters showed statistically significant (p<0.05) variation among genotypes but did not show significant (P>0.05) differences among the genotypes in Ash, CP, NDF, ADF, ADL, and in vitro dry matter digestibility. The overall mean of 50% flowering days of three locations ranged from 40.14 to 73.67 and the mean of days to maturity ranged from 107.75 to 129.3 and the shortest days to maturity recorded for kenketi variety at all locations over the years. The highest dry matter yield was recorded from genotype ILRI#25368 and the lowest from kenketi variety and the highest grain yield was recorded from genotype ILRI#11988 (24.30 quintal/ha) followed by ILRI#25368 (23.36 quintal/ha) whereas the lowest grain yield recorded from genotype ILRI#9341 (14.05quintal/ha). The most disease-susceptible genotype was ILRI#11988 (2.44) and the most disease-tolerant genotype was ILRI#25367 (1.22) followed by 25368 (1.39). The most pests-affected genotypes/variety was Kenketi (2.78) and the most pests (aphids) tolerant genotype was ILRI#9359 (1.11). Further, research should be conducted on production performance under farmer’s conditions, awareness of its importance and stage of utilization, and conservation techniques of these genotypes should be conducted for wider cultivation in the area.
Keywords:
Cowpea
; Dry Matter Yield
; Genotypes
; West Hararghe
1. Introduction
Cowpea (Vigna unguiculata (L.) Walp) is one of the most ancient human food sources and has probably been used as a crop plant since Neolithic times. It is grown in the arid and semi-arid regions of the world including Asia, Africa, Southern Europe and Central and South America (Adams et al., 2018). Cowpea is important for food security and the livelihoods of millions of smallholder farmers who rely on it for economic and nutritional well-being (Bolarinwa, 2022). The World production of the crop is estimated at over 8.9 million MT per year on about 14.4 million hectares (FAOSTAT 2020). Over 95% of the global production is in Africa, especially in the SSA, with Nigeria being the world’s largest producer and consumer, followed by the Niger Republic, and Burkina Faso. About 6.5 million metric tons of cowpea was reported produced annually on about 14.5 million hectares worldwide Boukar et al. (2018) with an annual grain production of about 5.59 million tons. Of these, 94% of grain production is found in Africa which Nigeria is a leading county (FAO 2014). Vavilov (1951) indicated that Ethiopia is a secondary center of diversity for cowpea though limited information regarding the genetic resource. Beshir et al. (2019) also reported that even though Ethiopia is a center of diversity for cowpea production and productivity, previous studies in Africa and elsewhere ignore to mention about Ethiopia. Alemu et al. (2016) state that cowpea is a principal and multipurpose food legume in many African countries including Ethiopia where tender leaves, fresh pods and grains are consumed. It is the second most important food grain legume crop in tropical Africa, next to the common bean (Fantaye and Hintsa, 2017). Cowpea is grown by poor farmers in marginal and drought prone areas of Ethiopia (Tesfaye et al., 2019). Cow pea is providing feed, forage, hay and silage for livestock, green manure and cover crop for maintaining the productivity of soils (Zewdu et al., 2021). Snapp et al. (2018) also reported that cowpea is complementary balanced diet when combined with cereals because they have high contents of essential amino acids like lysine and tryptophan, micronutrients (Fe and Zn), macronutrients like Mg, Ca, and other important B-group vitamins.
In Ethiopia, cowpea is grown in most of the lowlands of the North, the South, Gambella and the Eastern parts of Ethiopia (Kassaye et al., 2013) In Southern Ethiopia, cowpea young leaves, pods and seeds are used for human consumption and animal feed (Sisay, 2015). In addition, it generates income, medicinal purpose, enhances food security and provides a natural ground cover (Sisay et al., 2019). Walelign et al. (2021) stated that farmers produced cowpea for household consumption as food and income generation. Its production is practiced under varying cropping systems including sole cropping, intercropping and mixed cropping system (Zewdu et al., 2021).
The cultivation of high quality forages with a high yielding ability, adaptable to biotic and abiotic environmental. However, the performance of forage species vary across locations due to differences in soil types, temperature and amount and distribution of rainfall. Testing the adaptability and yield potential of different forage crops across various agro-ecologies is very important to identify the best-bet genotypes for utilization. Accordingly, there is a need to evaluate cowpea genotypes for basic quantitative traits to address the feed demand of mixed farming systems of the study area. Therefore the objectives of this study was to developing improved high yielding varieties in major agronomic traits and nutritional quality and most stable cowpea grown under different locations of West Hararghe, Ethiopia.
2. Materials and Methods
2.1. Description of the Study Area
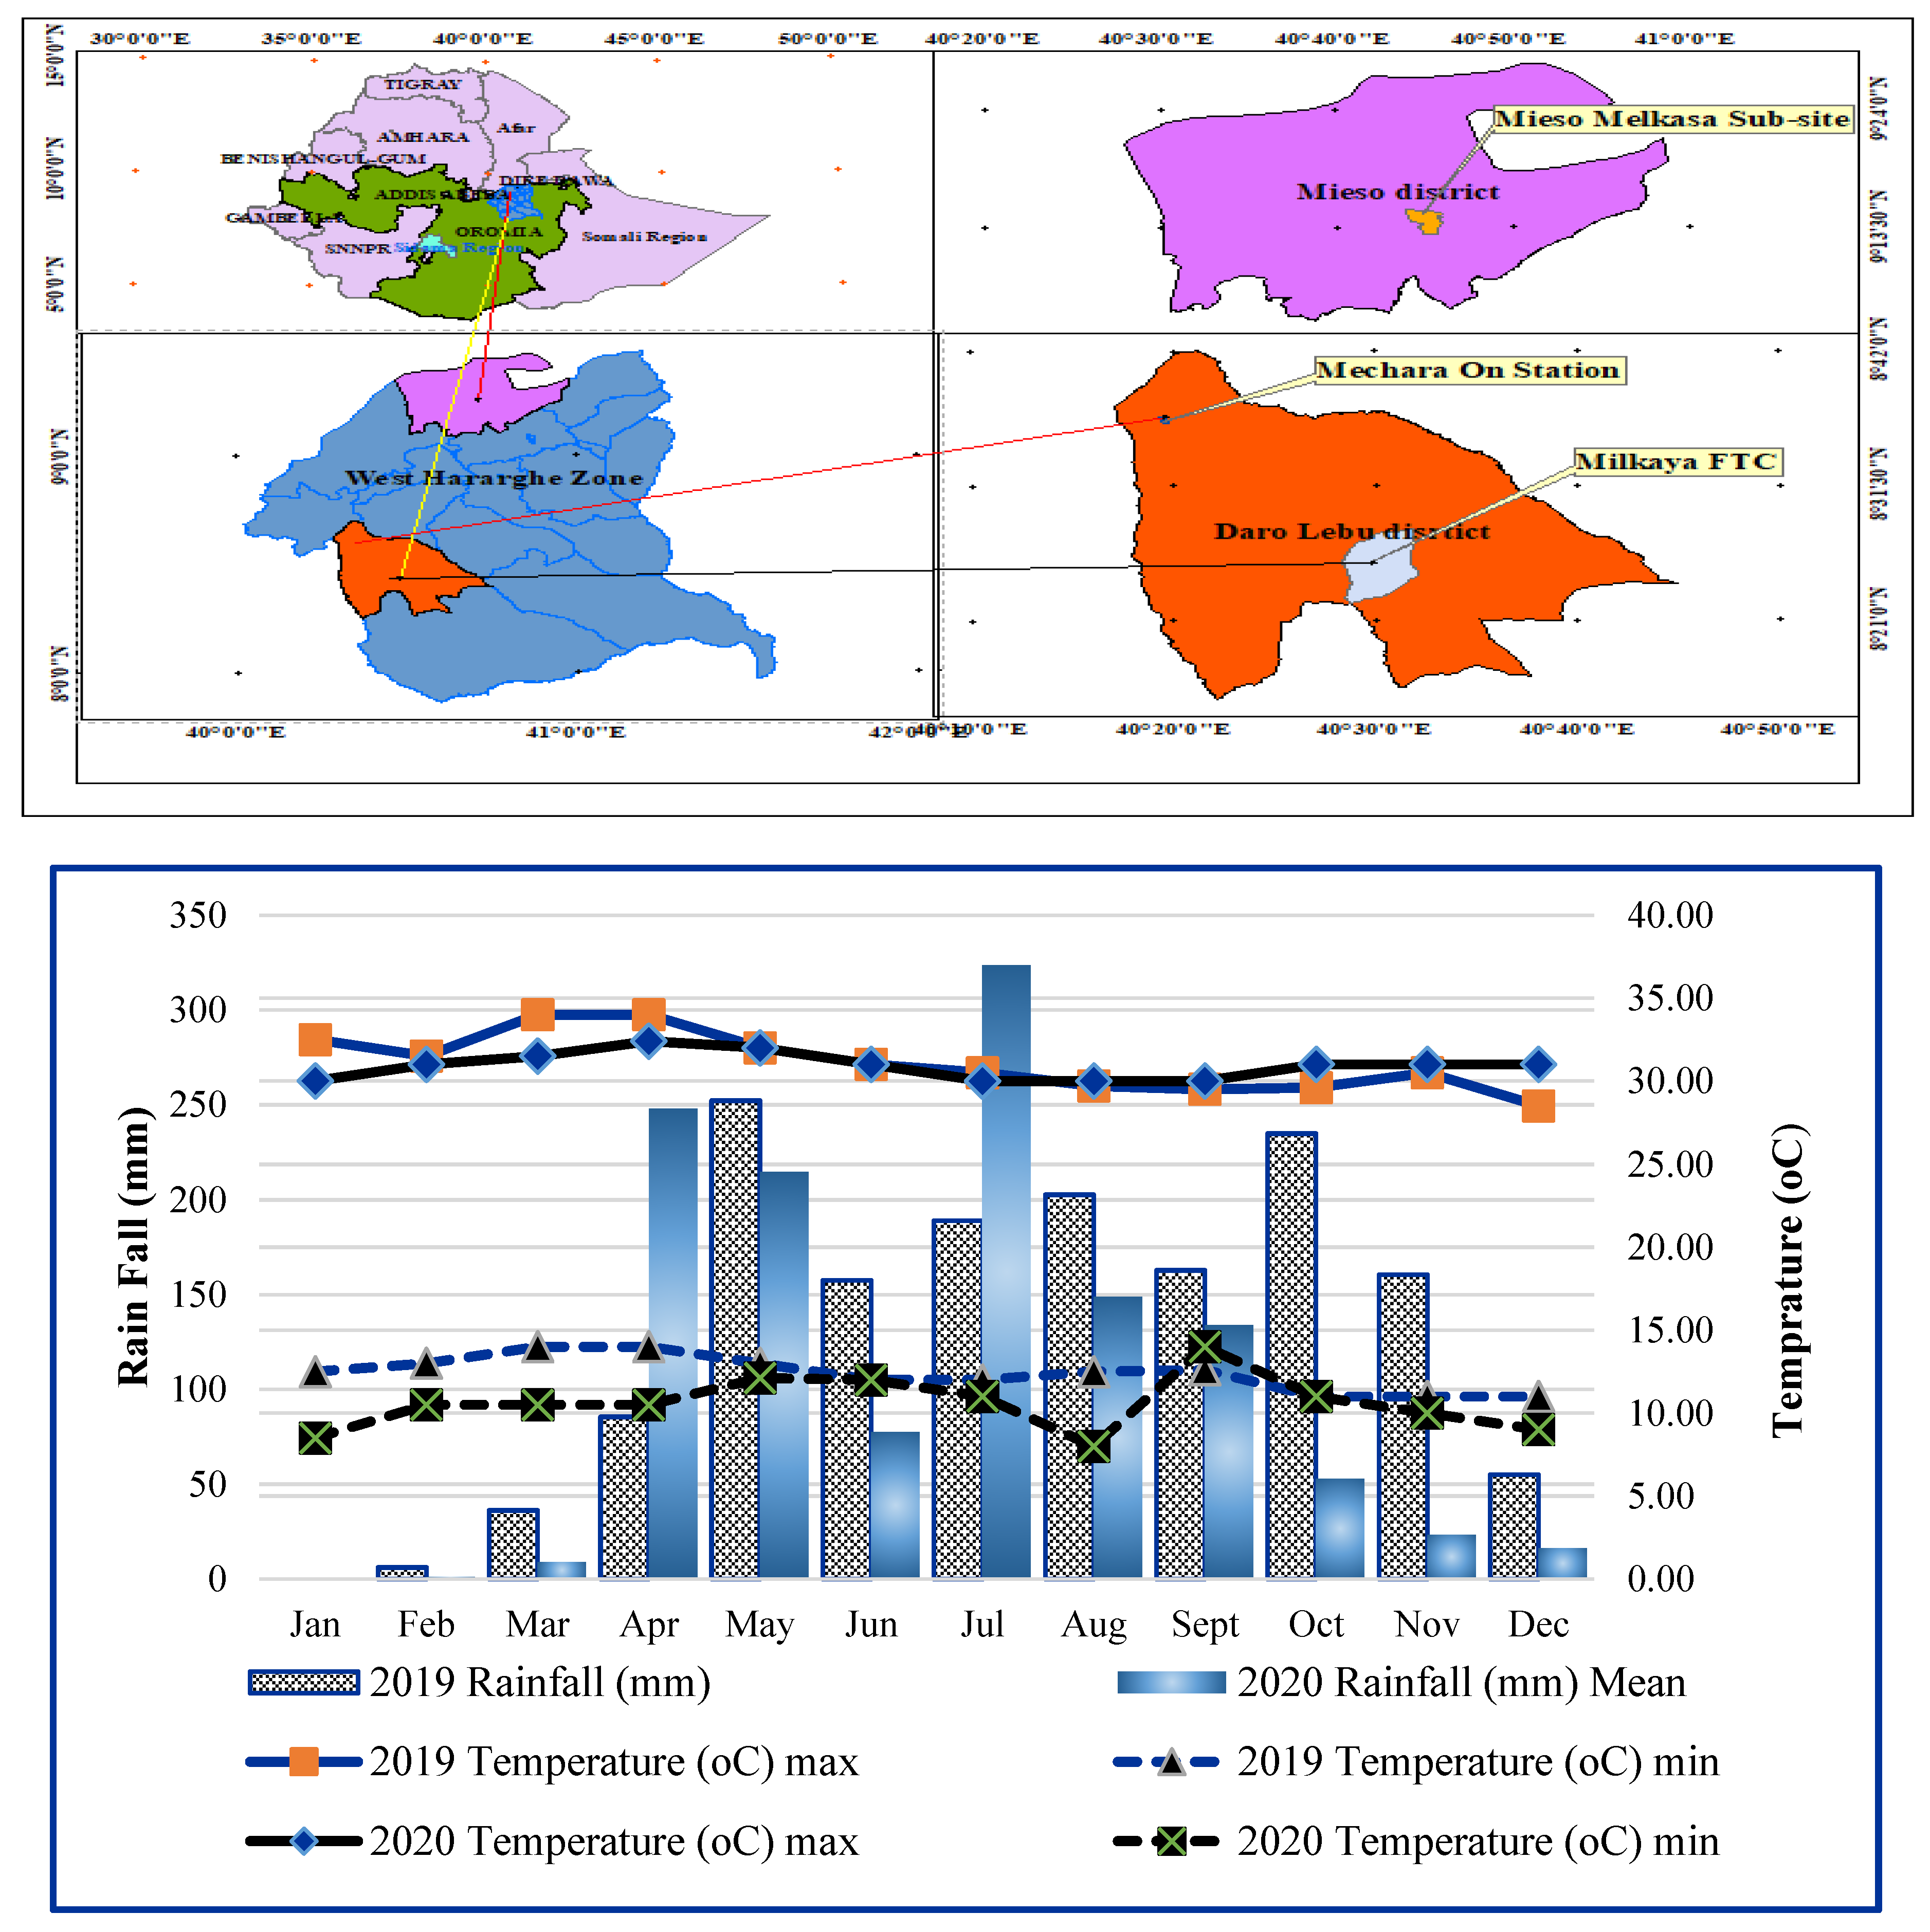
The study was conducted in West Hararghe zone mid to lowland parts which Daro Lebu and Miesso districts. Daro Lebu district is classified under midland agro ecology. The district got bimodal rain fall with annual mean of 1120 mm and annual mean temperature of 21 °C (Wasihun, 2022). The predominant agricultural activity is mixed livestock-crop production system. The major livestock classes of the district are cattle, goat, poultry, sheep and camels. Elephant grass, sorghum straw and maize stover is the major livestock feeds. In terms of crops that growths in study district are maize, sorghum, haricot bean, teff. Different fruits and vegetables like mango, banana, lemon, oranges potato, tomato and avocado are very the common one.
Mieso district is classified under low land agro ecology. The altitude ranges from 900 to 2475 m.a.s.l (Ethio DEM, 2017). The mean annual temperature is 23 0C, while annual mean rainfall is 761 mm (Wasihun, 2022). The district mainly known by livestock raring since it is categorized under pastoralist area. The major livestock classes are cattle, goat, camel, poultry, sheep and donkey. Sorghum stover, free grazing and supply some concentrates are the major livestock feeds. The district also produces crops like sorghum, maize and haricot bean and sesame.
Figure 1.
Map of the study area. Source of the map: Ethio-GIS shape file, 2021. Figure 1a. Mean monthly rainfall and maximum and minimum temperatures at Mechara on station.
Figure 1.
Map of the study area. Source of the map: Ethio-GIS shape file, 2021. Figure 1a. Mean monthly rainfall and maximum and minimum temperatures at Mechara on station.
2.2. Source of Genotypes
The experiment was conducted with ten genotypes of cowpea included ILRI#11692, ILRI#9341, ILRI#25368, ILRI#11971, ILRI#9359, ILRI#11977, ILRI#12735, ILRI#12737, ILRI-#25367, ILRI#11988 and two standard checks (kenketi and white wonder) varieties. Thus genotypes were collected from International Livestock Research Institute (ILRI). From Daro Lebu district, Mechara Agricultural research Center on station and Milkaye FTC, whereas from Mieso district, Melkasa Agricultural Research Center Mieso sub- site were used for two years. Thus genotypes were sown at first week of July with the space between block, plot and rows 1m, 1m, and 0.30m respectively. The seed rate used was 30kg/ha with five rows per plot. A blanket basal fertilize was uniformly applied to all plots in the form of NPSB and UREA at the rate of 100 kg/ha and 50kg/ha at the time of sowing respectively. All other crop management practices were done uniformly to all plots as required.
2.3. Experimental Design and Layout Setup
A randomized complete block design (RCBD) with three replications was used at all locations for both years. The materials were sown at first week of July with the plot size of 2*1.8m = 3.6 m2; with six rows and the space between block, plot and rows where 1m, 1m and 0.3m respectively. A blanket basal fertilize was uniformly applied to all plots in the form of NPSB and UREA at the rate of 100 kg/ha and 50kg/ha at the time of sowing respectively. Sowing was done through row spacing 10cm between plant with the seed rate of 30kg/ha. All agronomic practices were done uniformly as the requirement of cowpea
2.4. Data Collection
2.4.1. Days 50% Flowering and Maturity Day
The data for 50% flowering and maturity day was recorded for each plot independently at the stage of 50% flowering and plant physiological mature respectively. Days of the 50% flowering was estimated as the different between emergency days to 50% flowering date and day of maturity was estimated plant physiological maturity day minus the emergency date.
2.4.2. Plant Height (cm)
Plant height was recorded from the ground of the main plant (not branch) to the tip of the plant. The height was recorded by taking 10 plants randomly on the days of the 100% flowering from the base of the stem (at the soil surface) to the top of the canopy, or the highest part of the plant sum up the value of and divided by 10 to estimate mean plant height
2.4.3. Biomass Yield (t/ha)
The sample from each plot was collected using sample size of 0.5 m × 0.5 m at the stage of 10% flowering stage and weighted by sensitive balance to get fresh biomass yield. Then 220 gm of sample was weighted and sun dried for 3 days. The sun dried weighed fresh subsample (FWss) was oven dried at 60 OC for 72hrs and reweighed (DWss) to get an estimate of dry matter production. Then the dry matter yield (tone/ha) was calculated as (10 x TotFW x (DWss / HA x FWss)) (Tarawali et al., 1995)
Where: TotFW = total fresh weight from plot in kg
DWss = dry weight of the sample in grams
FWss = fresh weight of the sample in grams.
HA = Harvest area meter square and
10 = is a constant for conversion of yields in kg m2 to tone/ha
2.4.4. Leaf-to-Stem Ratio
The average result of leaf to stem ratio was taken when the plant was 10% flowered the same date with data collection for herbage yield determination. 100gm of sample weighted and leaf was separated from stem by hand. The individual separated leaf and stem was weighted independently and leaf weight was divided by stem weight to calculate leaf to stem ratio
2.4.5. Plot Cover and Plant Stands Vigor
The data of plot cover was recorded based on plant plot coverage in percentage. The plant which covers fully the plot got 100% plot cover value. Generally, the best genotypes got highest value relatively to the others. Plant stand vigor recorded on the scale of (1 – 5) that 1 = best, 2 = very good, 3 = good, 4 = fair and 5 = poor plot cover.
2.4.6. Seed Yield (Quintal/ha)
Seed (grain) yield was harvested at 100% plant maturity date. After the whole plot was harvested, sun dry was carried out on the respective plot for 5 day. Then, the whole plot was threshed individually and purified by wind. The total seed yield weight from each plot at adjusted 12.5% moisture content and transformed to hectares and presented in quintals.
2.4.7. Diseases and Insects Incidence
Diseases and insect data collection where continuously collected throughout the experimental trial period both two years. Disease severity was recorded on the scale followed by CIMMYT methods using 1-5 scoring scale. 1 = Very slight to Slight infection, 2 = Light infection, 3 = Moderate infection, 4 = Heavy infection, 5 = Very heavy infections (Jakhar et al., 2017).
2.5. Statistical Analysis
In the combined analysis of variance, the location was considered a random variable, and genotypes were considered a fixed variable. Data analysis was performed using the statistical software version 9.0. The genotypes were tested using the analysis of variance (ANOVA) procedure of the SAS general linear model (GLM) to compare treatment means (SAS, 2002). The least significant difference (LSD) at a 5% significance level was used for the comparison of means. The data were analyzed with the model:
Yijk = µ + Gi + Ej + (GE)ij + Bk(j) + e ijk;
Where, Yijk = measured response of genotype i in block k of environment j; µ = grand mean; Ti = effect of genotype i; Ej = effect of environment j; GEij= genotype and environment interaction; Bk (j) = effect of block k in environment j; e ijk = random error effect of genotype i in block k of environment j
3. Results and Discussions
3.1. Analysis of Variance
The results of the analysis of variance indicated that a significant (p<0.05) variation between cowpea genotypes on 50% flowering date, maturity date, plant height, seed yield, seed per pod and pod per plant but did not showed significance (p>0.05) differences for leaf steam ration, plot cover, diseases, pest, dry matter and branch per plant (Table 1). The interaction effect of genotypes, locations and years showed a significant (p<0.001) variation for all tested parameters except leaf steam ratio. The effect of year also showed a significance (p<0.001) differences for all tested parameters expect diseases and branch per plant. Locations also have significant (p<0.001) effect on all parameters except leaf steam ration. Genotypes interaction with location showed significance (p<0.05) variation for maturity date, plant height, pest and pod per plant but did not showed significance variation for the rest parameters.
3.2. Dry Matter Yield and Green Fodder Herbage
Dry matter (DM) yield of different cowpea genotypes were presented in (Table 2). Significant (P<0.001) difference in DM yield among the genotypes was observed at on station both first and second years while there were no statistical (P>0.05) variation at the rest two locations both years. The highest DM yield was recorded from genotype ILRI#25368 both first and second years at on station (18.32 and 8.84 t/ha) respectively while the lowest recorded from kenketi variety both years. At the rest two locations (Milkaye FTC and Mieso site) all genotypes produced similar dry matter yields. The mean DM yield of the present result ranged from 5.12 to 9.23 t/ha for three locations with two years higher than the findings of Ayana et al (2013) ranged from 2.78 t ha-1 and 7.67 t/ha and Bilatu et al (2012) ranged from 2.33 t/ha and 7.13 t/ha but lower than the findings of Rao and Shahid (2011) and Solomon and Kibrom, (2014) 18.1 t/ha and 8.68t/ha respectively for different cowpea genotypes. Genotype ILRI#25368 was the most superior than the other genotypes and standard checks (kenketi and white Wonder) and less moisture is present in the genotype and will, therefore, reduce the rate at which the grass deteriorate when stored.
Fresh biomass yield of different cowpea genotypes were presented in (Table 2). There was a significant (P<0.05) difference in fresh biomass yield among the genotypes. The highest fresh biomass yield (81.07 and 39.3 t/ha) was recorded from genotype ILRI#25368 first and second year at on station, ILRI#9359 genotype produced the highest fresh biomass yield first and second year (54.07 and 62.8 t/ha) respectively at Milkaye FTC while ILRI#25367 genotype produced the highest fresh biomass yield first and second year (52.7 and 35.6 t/ha) respectively at Mieso site. Kenketi variety produced the lowest fresh biomass yield at all locations and over years. Different genotypes responded different fresh biomass yield at all locations might be genetically variation of the genotypes for different biotic and abiotic factors. The mean fresh biomass yield of the present result ranged from 25.8 to 49.17t/ha for three locations with two years higher than the findings Tekle, (2014) ranged from 11.5 to 23.41t/ha, Iqbal et al (2024) ranged from 7.01 t ha-1 and 11.94 t/ha but similar with the findings of Hasan et al. (2010) ranged from 33.88 to 42.88 t/ha.
3.3. Grain Yield and Thousand Seed Weight
Significance variation (p<0.05) were observed among the genotypes in grain yield and thousand seed weight across all the experimental years and locations (Table 3). The highest grain yield was recorded from genotype ILRI#11988 and ILRI#25368 at on station (27.52 and 22.21 quintal/ha), from genotype ILRI#11988 and White wonder variety at Milkaye FTC (24.67 and 37 quintal/ha) and from genotype ILRI#9359 and ILRI#25367 at Mieso site (34.14 and 21.83 quintal/ha) first and second year the experimental duration respectively. The lowest grain yield was recorded from genotype ILRI#9341 followed by kenketi variety (Table 4). The mean grain yield of the present finding is ranged from 12.73 to 28.31 quintal/ha across the locations and years that were higher than the reports of Ayana et al (2013) that cowpea seed yield ranged 3.71 to 11.4 quintal/ha in Ethiopia, (Erana and Zelalem , 2020) from 2.75 to 17.9 quintal/ha, Zewdu et al. (2021) from 6.32 to 15.25 quintal/ha, Tekle, (2014) from from 5.87 qt/ha to 12.94 qt/ha but agree with the findings of Bilatu et al (2012) from 17.2 to 34.7 quintal/ha and (Solomon and Kibrom, 2014) which was 19.0 to 33.2 quintal/ha. From the present findings, the study area is the most potential productive in cowpea and therefore, it is recommended that livestock producers and dairy farm investors could produce and use cowpea for feeds.
There was a significance (p<0.05) variation among the genotypes in terms of hundred seed weight. The highest hundred seed weight was recorded from ILRI#9341 which ranged from 16.23 to 17.3gm whereas the lowest weight was recorded from ILRI#12735 ranged from 10.07 to 11.47 gm. The mean hundred seed weight of different cowpea genotypes used for the present study is ranged from 11.37 to 13.97gm which is similar with the findings of Tesfaye et al. (2019) reported that hundred seed weight for different cluster of cowpea ranged from 12.57 to20.28 gm and higher than the reports of (PGFC, 2011) hundred seed weighs ranges from 5 to 30 gm and Nwofia et al. (2012 reported from 8.19 to 15.69gm.
3.4. Days to 50% Flowering and Maturity
Days to 50% flowering and days to maturity of different genotypes of cowpea were presented in Table 4. There was a significant (P<0.05) difference in days to 50% flowering and days to maturity among the genotypes. The longest days to 50% flowering were recorded for ILRI#25367genotype ranged from 75.33 to 85.65 days at on station, from 62.0 to 75.33 at Milkaye FTC and from 50.33 to 68.33 at Mieso site whereas the shortest days to 50% flowering was recorded from kenketi variety at all experimental sites and over years. The overall mean of 50% flowering days of three locations ranged from 40.14 to 73.67 days. The present result was higher than the finding of Solomon and Kibrom, (2014) 48.4 days and Zewdu et al. (2021) from 46 to 62.67 days. This is may be due to agro-ecological difference. The mean of days to maturity ranged from 107.75 to 114.1days at on station, from 107.0 to 125.1 at Milkaye FTC and from 114.4 to 129.3 at Mieso site. The longest day to mature was recorded for genotype ILRI#25368 varies from 113.7 to 133.67 at on station and at Milkaye FTC varies from 113 to 132.3 days and for genotype ILRI#9359 ranged from 120 to 133 days at Mieso site whereas the shortest days to maturity was recorded from kenketi variety and genotype ILRI#11971 at all locations for three years. The maturity date obtained from the present result is longer than the findings of Zewdu et al. (2021) which range from 78.3 to 95.67 days. (PGFC, 2011) reported that cowpeas vary in growth habit from erect or semi-erect types with short (<100 days) maturity date and grown mostly for grain, to longer (>120 days) duration in semi-erect to trailing plants which are normally grown primarily for forage.
3.5. Number of Pod per Plant and Number of Seed per Pod
Number of pod per plant and seed per pod was presented in (Table 5). Significant (p< 0.05) variation was recorded for pod per plant at Milkaye FTC both years while second and first year at on station and Mieso site respectively. The mean of pod per plant ranged from 8.78 to 9.72 at on station, from 9.17 to 12.75 at Milkaye FTC while from 10.55 to 13.47 at Mieso research site and the mean range of pod per plant ranged from 8.87 to 13.47 over the three locations of two years. On the other, number of seed per pod showed significance (P<0.05) difference at all locations. At on station, the mean is ranged from 11.94 to 12.34, at Milkaye FTC ranged from 11.74 to 11.96 and at Mieso, it was ranged from 12.96 to 13.47. The overall mean of seed per pod is ranged from 11.74 to 13.47 across three locations similar ranges with finding Nwofia et al. (2012) reported cowpea seed per pod ranged from 11.38 to 16.57
3.6. Disease and Pest
The disease severity was the most important criteria during the data collection. Statistical variation (P<0.05) was observed among the genotypes. Among the tested genotypes ILRI#11988 followed by kenketi variety were more susceptible than the others whereas the most tolerant genotypes was ILRI#25367 followed by ILRI#25368 (Table 6). Fungal, bacterial and viral diseases affect different parts of cowpea at different stages of growth. In this study, the disease observed on the crop was leaf spot (Xanthomonas axonopodis Pv.vignicola) similar findings with Solomon and Kibrom, (2014). Insect pests are highly challenged in cowpea production every stage of its growth. The study result was indicated statistically (p<0.05) variation among the genotypes in terms of pest incidence. The most affected genotypes/variety were kenketi (2.0 to 3.33) scales at different locations followed by genotype ILRI#11977 (2.0 to 2.33) whereas the most pest (aphids) tolerant was recorded from ILRI#9359 (0.67 to 1.33) followed by ILRI#12735 (1.0 to 1.67). The common pest observed during the experimental period was aphid (Aphis craccivora) which occurred during early maturing on flag shoots and immature green pods.
3.7. Chemical Composition
The combined analysis of the variance for chemical compositions of cowpea genotypes were presented in (Table 4). There were no significant differences (P>0.05) among cow pea genotypes in Ash, CP, NDF, ADF, ADL, dry matter percentage (DM %) and in vitro dry matter digestibility (IVDMD). The crude protein content of cow pea genotypes varied from 17.54 to 18.47% with a mean of 17.99 % which is comparable with the finding of Solomon and Kibrom, (2014) from 17.7 to 18.6% with a mean of 18.1%. In vitro dry matter digestibility was higher for genotype ILRI#11988 (60.92%) followed by ILRI#25367 (60. 77 %) and 12735 (60.71 %). The lowest In vitro dry matter digestibility was recorded from genotype 11692 (59.91 %) followed by genotype ILRI#12737 (60.12 %). Absence of difference in terms of %NDF, %ADF and %ADL of among different genotypes of cowpea demonstrating that the constitution of the walls of the tissues are similar across the genotypes. The highest NDF was recorded from genotype ILRI#12737 (47.2%) and the lowest was recorded from genotype ILRI#12735 (44.46%) with a mean of 45.71% lower than values reported by Solomon and Kibrom, (2014) who reported 58.1 % on average.

Table 7.
Combined result nutritional quality of intermediate mature cowpea genotypes.
| Genotype | %DM | Ash | CP | NDF | ADF | ADL | IVDMD |
| ILRI#11988 | 92.67 | 12.88 | 17.54 | 45.49 | 36.3 | 8.82 | 60.92 |
| ILRI#25367 | 92.69 | 13.22 | 18.16 | 45.36 | 36.77 | 6.97 | 60.77 |
| ILRI#11692 | 92.64 | 13.69 | 18.22 | 45.81 | 37.68 | 6.95 | 59.91 |
| ILRI#9341 | 92.79 | 12.54 | 18.02 | 45.32 | 35.22 | 6.64 | 61.67 |
| ILRI#25368 | 92.87 | 12.25 | 18.62 | 44.07 | 35.65 | 7.02 | 61.67 |
| ILRI#11971 | 92.75 | 13.17 | 18.22 | 45.63 | 37.19 | 6.98 | 60.60 |
| ILRI#9359 | 92.94 | 12.82 | 17.54 | 45.68 | 36.7 | 7.01 | 60.31 |
| ILRI#11977 | 92.88 | 12.96 | 17.69 | 46.03 | 36.95 | 6.89 | 61.28 |
| ILRI#12735 | 92.70 | 13.46 | 18.47 | 44.46 | 35.51 | 6.68 | 60.71 |
| ILRI#12737 | 92.91 | 13.40 | 17.93 | 47.2 | 38.73 | 7.08 | 60.12 |
| WW | 92.73 | 13.39 | 18.31 | 45.09 | 36.82 | 7.03 | 60.17 |
| KK | 92.67 | 13.48 | 18.21 | 45.4 | 37.02 | 6.83 | 60.16 |
| Mean | 92.77 | 13.11 | 5.13 | 45.71 | 36.88 | 6.91 | 60.61 |
| CV% | 0.18 | 7.95 | 5.15 | 4.05 | 5.86 | 4.82 | 2.58 |
| LSD (5%) | 0.29 | 1.76 | 1.57 | 3.14 | 3.66 | 0.56 | 2.65 |
| PV | NS | NS | NS | NS | NS | NS | NS |
KK= Kenket and WW = White Wonder) = standard checks.
4. Conclusions and Recommendation
The wide variation in yield and Agronomic traits seen across the genotypes investigated suggests the possibility of selecting higher and better-adapted genotypes for fodder uses. Across locations, ILRI#25368 provided the highest forage dry matter and seed combined seed yield but both all genotypes statistically dues not showed nutritional quality differences. Even though the tested genotypes did not showed statistical differences for all of the studied fiber properties, genotype ILRI#25368 numerically produced higher crude protein and in-vitro dry matter digestibility and lower NDF and ADF, ADL and total ash contents. In general, genotype ILRI#25368 is suggested for cultivation and usage as a supplement to ruminants fed on low-quality feeds due to its greater forage DM, crude protein, and grain yield and relatively better CP and IVDMD. Future studies should focus on assessing the performance of animals fed this genotype’s forage and researches that focus solution to pest infestation to reduce post-harvest grain yield losses in cowpea production
Author Contributions
Tamrat Dinkale is working from proposal development, data collection, result analyses and manuscript full write up. He is the responsible person to correct every comment and suggestion throughout manuscript edition. Muleta Debela and Birmaduma Gadisa were contributed during data collection, manuscript edition and contributed to the improvement and finalization. .
Funding
The Oromia Agricultural Research Institute, Mechara Agricultural Research Center coordinates this research as part of its regular research activities; as a result, this research work does not receive any outside funding.
Data Availability Statement
The Data used to support the results of this work is available from the corresponding author upon request at any time.
Acknowledgments
The authors give great thanks to animal feed research team members who helped with data collection, data manipulation, data processing and helps for publishing of this article. The authors would also like to gives great thanks to the Oromia Agricultural Research Institute, Mechara Agricultural Research Center for financial funding and logistic facilitation.
Disclosure statement
No potential conflicts of interest were reported by the authors.
References
- Adam, F.M.; Lawan, H.K.; Badau, M.H.; Chibuzo, E.C. Proximate composition, antinutrient factors and functional properties of complementary food formulations as affected by sorghum processing methods, addition of cowpea and carrot. International Journal of Food Science and Nutrition 2018, 3, 145–154. [Google Scholar]
- Agbicodo, E.M.; Fatokun, C.A.; Muranaka, S.; Visser, R.G. Breeding drought tolerant cowpea: Constraints, accomplishments, and future prospects. Euphytica 2009, 167, 353–370. [Google Scholar]
- Alemu, M.; Asfaw, Z.; Woldu, Z.; Fenta, B.A.; Medvecky, B. Cowpea (Vigna unguiculata (L.) Walp.)(Fabaceae) landrace diversity in northern Ethiopia. International Journal of Biodiversity and Conservation 2016, 8, 297–309. [Google Scholar]
- Ayana, E.; Estefanos, T.; Ashenafi, M.; Abubeker, H. Advanced evaluation of cowpea (Vigna unguiculata) accessions for fodder production in the central rift valley of Ethiopia. Journal of Agricultural Extension and Rural Development 2013, 5, 55–61. [Google Scholar]
- Belay, F.; Meresa, H. Performance evaluation of sorghum [Sorghum bicolor (L.) Moench] hybrids in the moisture stress conditions of Abergelle District, Northern Ethiopia. Journal of Cereals and Oilseeds 2017, 8, 26–32. [Google Scholar]
- Beshir, B.; Amsalu, B.; Dagmawit, T.; Selamawit, K.; Teamir, M.; Bezawit, Y. Cowpea production, marketing and utilization in Ethiopia. 2019.
- Agza, B.; Kasa, B.; Zewdu, S.; Aklilu, E.; Alemu, F. Animal feed potential and adaptability of some cowpea (Vigna unguiculata) varieties in North West lowlands of Ethiopia. Journal of Agricultural Research 2012, 1, 478–483. [Google Scholar]
- Bolarinwa, K.A.; Ogunkanmi, L.A.; Ogundipe, O.T.; Agboola, O.O.; Amusa, O.D. An investigation of cowpea production constraints and preferences among small holder farmers in Nigeria. GeoJournal 2022, 1–13. [Google Scholar]
- Boukar, O.; Belko, N.; Chamarthi, S.; Togola, A.; Batieno, J.; Owusu, E.; Haruna, M.; Diallo, S.; Umar, M.L.; Olufajo, O.; Fatokun, C. Cowpea (Vigna unguiculata): Genetics, Genomics and Breeding. Plant Breeding 2018, 138, 415–424. [Google Scholar] [CrossRef]
- Danis, A.; Gbaguidi, A.; Loko, L.; Danis, M.; Sanni, A. Diversity and agronomic performances of the cowpea (Vigna unguiculata Walp.) landraces in Southern Benin. International journal of Agronomy and Plant Production 2013, 4, 936–949. [Google Scholar]
- Kebede, E.; Bekeko, Z. Expounding the production and importance of cowpea (Vigna unguiculata (L.) Walp.) in Ethiopia. Cogent Food & Agriculture 2020, 6, 1769805. [Google Scholar]
- FAO. FAOSTAT. 2014. Available online: http://faostat3.fao.org/download/Q/QC/E 1/04/2014.
- FAOSTAT. FAOSTAT. FAO. 2020. Available online: http://www.fao.org/faostat/en/#data/QC/visualize (accessed on 5 October 2018).
- Hasan, M.R.; Akbar, M.A.; Khandaker, Z.H.; Rahman, M.M. Effect of nitrogen fertilizer on yield contributing character, biomass yield and nutritive value of cowpea forage. Bangladesh Journal of Animal Science 2010, 39, 83–88. [Google Scholar] [CrossRef]
- Iqbal, A.; Abbas, R.N.; Al Zoubi, O.M.; Alasasfa, M.A.; Rahim, N.; Tarikuzzaman, M.; Iqbal, M.A. Harnessing the Mineral Fertilization Regimes for Bolstering Biomass Productivity and Nutritional Quality of Cowpea [Vigna unguiculata (L.) Walp]. Journal of Ecological Engineering 2024, 25, 340–351. [Google Scholar] [CrossRef]
- Jakhar, D.S.; Singh, R.; Kumar, S.; Singh, P.; Ojha, V. Turcicum leaf blight: A ubiquitous foliar disease of maize (Zea mays L.). International Journal of Current Microbiology and Applied Sciences 2017, 6, 825–831. [Google Scholar] [CrossRef]
- Negash, K.; Tumsa, K.; Gebeyehu, S.; Amsalu, B. Multi- Environment Evaluation of Early Maturing Cowpea (Viginia Unguiculata L.) Varieties in the Drought Prone Areas of Ethiopia. Ethiop. J. Crop Sci. 2013, 3, 77–92. [Google Scholar]
- Nwofia, G.E. Yield and yield components in vegetable cowpea on an ultisol. African Journal of Agricultural Research 2012, 7, 4097–4103. [Google Scholar] [CrossRef]
- PGFC, 2011 (Production guidelines for Cowpeas) Agriculture, Forestry and Fisheries Republic of south Africa. https://www.arc.agric.za/arcgci/Fact%20Sheets%20Library/Cowpea%20-%20Production%20guidelines%20for%20cowpea.pdf.
- Rao, N.K.; Shahid, M. Potential of cowpea [Vigna unguiculata (L.) Walp.] and guar [Cyamopsis tetragonoloba (L.) Taub.] as alternative forage legumes for the United Arab Emirates. Emir. J. Food Agric. 2011, 23, 147–156. [Google Scholar]
- SAS (Statistical Analysis System). (2002). Sas/stat 9.1 ®. SAS Institute, Inc.
- Sisay, A. Cowpea (Vigna unguiculata (L.) Walp.) (Fabaceae) Landrace Diversity in Sourthern Ethiopia. MSc Thesis, Addis Ababa University, Ethiopia, 2015; p. 66. [Google Scholar]
- Alemu, S.; Alemu, M.; Asfaw, Z.; Woldu, Z.; Amsalu Fenta, B. Cowpea (Vigna unguiculata (L.) Walp.; Fabaceae) landrace (local farmers varieties) diversity and ethnobotany in Southwestern and Eastern parts of Ethiopia. African Journal of Agricultural Research 2019, 14, 1029–1041. [Google Scholar]
- Snapp, S.S.; Grabowski, P.; Chikowo, R.; Smith, A.; Anders, E.; Sirrine, D.; Bekunda, M. Maize yield and profitability tradeoffs with social, human and environmental performance: Is sustainable intensification feasible? Agricultural systems 2018, 162, 77–88. [Google Scholar] [CrossRef]
- Snapp, S.; Rahmanian, M.; Batello, C.; Calles, T. Pulse crops for sustainable farms in sub Saharan Africa; Food and Agriculture Organization of the United Nations (FAO): Roma, 2018. [Google Scholar]
- Gebreyowhans, S.; Gebremeskel, K. Forage production potential and nutritive value of cowpea (Vigna unguiculata) genotypes in the northern lowlands of Ethiopia. Journal of Agricultural Research and Development 2014, 5, 066–071. [Google Scholar]
- Tarawali, S.A.; Tarawali, G.; Lirbi, A.; Hanson, J. Method for the evaluation of Forage legumes, Grasses and Fodder Trees for Feed Use as Livestock Feed; International Livestock research Institute: Nairobi, Kenya, 1995. [Google Scholar]
- Yoseph, T. Performance evaluation of cowpea (Vigna unguiculata L.) varieties under moisture conservation practices for yield and yield components at Alduba, Southern Ethiopia. Journal of Natural Sciences Research 2014, 4, 7–11. [Google Scholar]
- Walle, T.; Mekbib, F.; Amsalu, B.; Gedil, M. Genetic diversity of Ethiopian cowpea [Vigna unguiculata (L) Walp] genotypes using multivariate analyses. Ethiopian Journal of Agricultural Sciences 2019, 29, 89–104. [Google Scholar]
- Vavilov, N.I. The origin, variation, immunity and breeding of cultivated plants. 1951, 72, 482.
- Walelign Worku, Hussein Mohammed and Elias Urage (2021). Production Constraints, Farmers Preferred-traits and Farming System of Cowpea in the Southern Ethiopia.
- Wasihun Gizaw, 2022. Historical Rainfall Amount and Temperature Variability and Trend in West Harerhge Zone, East Ethiopia. Mechara Agricultural Research Center unpublished.
- Zewdu Asrat, Temesgen Begna and Abdulfeta Tariku (2021). Evaluation of Yield and Yield Related Performance of Cowpea [Vigna unguiculata (L.) Walp] Varieties at West Hararghe Zone, Eastern Ethiopia.
Table 1.
Combined Analysis Mean Sum Square of ANOVA for agronomic parameters.
| Genotypes | Rep | year | loc | geno*loc | geno*year | geno*year*loc | |
| DF | 4 | 3 | 1 | 2 | 8 | 4 | 10 |
| 50%FD | 30.57*** | 7.05* | 667.41*** | 205.51*** | 3.79NS | 12.22** | 56.73*** |
| MD | 47.59*** | 8.93NS | 3499.20*** | 11801.63*** | 13.35* | 38.47*** | 930.89*** |
| LSR | 13.28NS | 3.89NS | 506.35*** | 33.71NS | 15.46NS | 18.11NS | 39.11NS |
| PC | 40.35NS | 53.73NS | 6424.03*** | 6544.53*** | 54.63NS | 107.43NS | 504.33*** |
| PH | 454.76*** | 11.41NS | 294.84*** | 5106.19*** | 107.73*** | 32.96NS | 211.67*** |
| DI | 0.35NS | 0.07NS | 0.03NS | 1.58** | 0.38NS | 0.22NS | 2.58*** |
| Pest | 0.050NS | 0.04NS | 0.13* | 0.13** | 0.050* | 0.050NS | 0.07** |
| Gyldq | 29.18* | 55.50NS | 7663.37*** | 3985.29*** | 37.16NS | 16.26NS | 1455.88*** |
| DMYtha | 0.34NS | 1.03* | 16.48*** | 31.84** | 0.48NS | 0.38NS | 4.15*** |
| BPP | 20.47NS | 85.64NS | 86.36NS | 235.81*** | 18.41NS | 26.57NS | 88.22** |
| PPP | 285.97** | 44.32NS | 39737.88**** | 18757.79*** | 238.69*** | 200.76* | 3684.46*** |
| SPP | 0.59* | 1.31*** | 11.41*** | 1.94*** | 0.23NS | 0.18NS | 0.67** |
50FD = 50% flowering date, MD = Maturity date, PC = Plot Cover, SV = stand vigor, Log = Lodging%, HL = head length, DMYtha = dry matter yield tone per hectare, PH = plant height; SYQtha = Seed yield quintal per hectare, geno = genotypes, loc. = location.
Table 2.
Location by year combined analysis of dry biomass and green herbage yield cowpea genotypes.
Table 2.
Location by year combined analysis of dry biomass and green herbage yield cowpea genotypes.
| Genotype | Dry matter yield (t/ha) | Green Herbage yield (t/ha) | ||||||||||
| On station | Milkaye FTC | Miesso | On station | Milkaye FTC | Miesso | |||||||
| 2019 | 2020 | 2019 | 2020 | 2019 | 2020 | 2019 | 2020 | 2019 | 2020 | 2019 | 2020 | |
| ILRI#11988 | 4.01 | 4.59 | 7.16 | 7.65 | 7.41 | 4.7 | 21.74 | 24.4 | 29 | 37.4 | 29.35 | 23.4 |
| ILRI#25367 | 8.71 | 4.51 | 7.51 | 9.02 | 8.3 | 6.62 | 44.93 | 23.1 | 43.67 | 46.6 | 52.7 | 35.6 |
| ILRI#11692 | 5.64 | 4.14 | 8.68 | 10.16 | 7.51 | 4.6 | 37.2 | 23.5 | 25.67 | 54.0 | 41.88 | 24.53 |
| ILRI#9341 | 7.01 | 4.32 | 8.00 | 11.06 | 9.09 | 6.81 | 37.8 | 21.7 | 45.67 | 54.7 | 48.82 | 34.87 |
| ILRI#25368 | 18.32 | 8.84 | 8.16 | 8.41 | 7.81 | 6.55 | 81.07 | 39.3 | 40.27 | 44.7 | 49.04 | 35.47 |
| ILRI#11971 | 5.98 | 3.51 | 8.04 | 9.59 | 6.65 | 4.71 | 32.41 | 19.1 | 33.53 | 50.3 | 32.83 | 21.8 |
| ILRI#9359 | 9.71 | 7.44 | 9.7 | 10.28 | 7.87 | 6.45 | 55.13 | 35.9 | 54.07 | 62.8 | 44.1 | 33.67 |
| ILRI#11977 | 4.8 | 3.36 | 7.56 | 9.9 | 8.23 | 5.81 | 31.54 | 17.5 | 36.53 | 47.8 | 42.23 | 26.92 |
| ILRI#12735 | 5.83 | 5.2 | 6.32 | 8.4 | 5.31 | 5.55 | 33.97 | 27.0 | 32.16 | 49.9 | 22.23 | 25.8 |
| ILRI#12737 | 6.54 | 5.16 | 6.92 | 8.6 | 7.07 | 5.52 | 38.97 | 28.0 | 41.87 | 49.8 | 40.53 | 26.47 |
| WW | 11.34 | 7.29 | 8.93 | 11.44 | 7.76 | 6.44 | 58.53 | 33.6 | 47.67 | 57.3 | 46.5 | 32.53 |
| KK | 4.05 | 3.11 | 5.57 | 6.27 | 6.87 | 5.4 | 21.55 | 16.6 | 25.47 | 34.5 | 30.64 | 26.13 |
| Mean | 7.66 | 5.12 | 7.71 | 9.23 | 7.49 | 5.77 | 41.24 | 25.8 | 37.98 | 49.17 | 40.12 | 28.93 |
| CV% | 29.1 | 26.9 | 31.4 | 36.24 | 23.2 | 25.91 | 27.69 | 28 | 29.42 | 33.43 | 20.26 | 27.8 |
| LSD (5%) | 3.77 | 2.34 | 4.1 | 5.67 | 2.94 | 2.59 | 19.33 | 12.3 | 18.92 | 27.84 | 7.76 | 13.62 |
| PV | *** | *** | NS | NS | NS | NS | *** | * | * | * | * | * |
* = significant (P<0.05), ** = very significant (P<0.01), =*** highly significant (P<0.001) , NS = Non significance, KK = Kenket and WW = White Wonder) = standard checks, FTC = Farmer training center.
Table 3.
Location by year combined analysis of grain yield and 100SW of cowpea genotypes.
| Genotype | Grain seed yield (quintal/ha) | 100 seed weight (gm) | |||||||
| On station | Milkaye FTC | Miesso | On station | Milkaye FTC | Miesso | ||||
| 2019 | 2020 | 2019 | 2020 | 2019 | 2020 | 2020 | 2020 | 2020 | |
| ILRI#11988 | 27.52 | 20.84 | 24.67 | 29.49 | 28.1 | 15.18 | 12.73 | 9.4 | 11.73 |
| ILRI#25367 | 11.57 | 22.96 | 7.24 | 19.39 | 23.48 | 21.83 | 13.4 | 14.34 | 11.93 |
| ILRI#11692 | 14.57 | 9.47 | 11.57 | 26.37 | 29.52 | 16.96 | 13.73 | 11.67 | 11.87 |
| ILRI#9341 | 12.81 | 5.07 | 6.0 | 20.24 | 24.19 | 15.99 | 17.3 | 16.23 | 16.53 |
| ILRI#25368 | 19.85 | 22.21 | 18.33 | 28.85 | 29.5 | 20.91 | 12.1 | 11.2 | 10.13 |
| ILRI#11971 | 25.86 | 9.48 | 19.43 | 23.76 | 30.91 | 15.33 | 13.77 | 11.93 | 12.8 |
| ILRI#9359 | 14.33 | 10.97 | 9.33 | 28.96 | 34.14 | 15.17 | 12.9 | 10.77 | 11.13 |
| ILRI#11977 | 26.19 | 13.43 | 14.76 | 25.38 | 32.1 | 19.31 | 13.97 | 11.87 | 11.37 |
| ILRI#12735 | 21.38 | 10.33 | 18.1 | 29.15 | 27.1 | 15.92 | 11.47 | 10.07 | 10.13 |
| ILRI#12737 | 23.62 | 10.21 | 13.05 | 21.50 | 28.38 | 12.81 | 14.93 | 13.17 | 13.6 |
| WW | 19.05 | 9.06 | 15.48 | 37.0 | 30.0 | 19.89 | 13.0 | 9.93 | 10.0 |
| KK | 25.91 | 8.7 | 16.38 | 21.01 | 22.27 | 11.36 | 14.2 | 12.13 | 12.4 |
| Mean | 20.22 | 12.73 | 14.53 | 25.93 | 28.31 | 16.72 | 13.71 | 11.89 | 11.97 |
| CV% | 28.78 | 70.2 | 48.98 | 22.34 | 23.15 | 18.05 | 4.52 | 9.73 | 8.02 |
| LSD (5%) | 9.45 | 14.61 | 11.36 | 9.59 | 10.97 | 5.06 | 1.05 | 1.96 | 1.63 |
| P Value | ** | NS | NS | * | NS | ** | *** | *** | *** |
* = significant (P<0.05), ** = very significant (P<0.01), =*** highly significant (P<0.001), NS = Non significance, KK = Kenket and WW = White Wonder) = standard checks, FTC = Farmer training center.
Table 4.
Location by year analysis of Date of 50% flowering and maturity of Cowpea genotypes.
| Genotype | Date of 50% Flowering | Date of Maturity | ||||||||||
| On station | Milkaye FTC | Miesso | On station | Milkaye FTC | Miesso | |||||||
| 2019 | 2020 | 2019 | 2020 | 2019 | 2020 | 2019 | 2020 | 2019 | 2020 | 2019 | 2020 | |
| ILRI#11988 | 57.67 | 45.67 | 47.0 | 62.0 | 52.0 | 47.0 | 87 | 109.3 | 118 | 106 | 136.3 | 119.0 |
| ILRI#25367 | 85.67 | 75.33 | 75.33 | 62.0 | 68.33 | 50.33 | 117.33 | 109.3 | 130.7 | 109.3 | 126.7 | 118.7 |
| ILRI#11692 | 66.33 | 54.33 | 71.0 | 62.0 | 58.33 | 48.0 | 123.67 | 117.7 | 128.3 | 106 | 129.7 | 120.0 |
| ILRI#9341 | 80.33 | 68.33 | 70.67 | 62.0 | 63.67 | 48.33 | 119.33 | 117.7 | 124.7 | 106 | 128 | 120.0 |
| ILRI#25368 | 79.0 | 67.0 | 72.67 | 69.0 | 71.0 | 49.0 | 133.67 | 113.7 | 132.3 | 113 | 114.7 | 116.7 |
| ILRI#11971 | 66.33 | 54.33 | 56.33 | 60.33 | 58.67 | 47.67 | 110.33 | 117.3 | 115.7 | 104.3 | 124.7 | 108.0 |
| ILRI#9359 | 84.0 | 62 | 69.33 | 67.0 | 60.0 | 49.33 | 133 | 118.7 | 132.3 | 111 | 133 | 120.0 |
| ILRI#11977 | 69.33 | 57.33 | 65.33 | 58.67 | 59.0 | 47.33 | 110.33 | 117.0 | 132.3 | 102.7 | 129.7 | 110.0 |
| ILRI#12735 | 74.33 | 62.33 | 55 | 58.67 | 44.67 | 47.33 | 80.33 | 110.7 | 118.7 | 106 | 131.3 | 108.3 |
| ILRI#12737 | 80.0 | 68.0 | 72.67 | 64.0 | 56.33 | 46.67 | 83.67 | 114.3 | 128 | 108 | 136.3 | 116.3 |
| WW | 86.33 | 64.33 | 67 | 55.33 | 56.33 | 47.67 | 110.67 | 117 | 122 | 106 | 138 | 115.7 |
| KK | 54.67 | 42.67 | 46.33 | 58.67 | 47.33 | 46.33 | 83.67 | 106.0 | 117 | 106 | 123 | 99.7 |
| Mean | 73.67 | 40.14 | 64.06 | 61.64 | 57.97 | 47.92 | 107.75 | 114.1 | 125.1 | 107.0 | 129.3 | 114.4 |
| CV% | 10.34 | 17.47 | 60.30 | 6.16 | 7.02 | 3.13 | 11.28 | 5.69 | 5.78 | 3.71 | 6.87 | 1.68 |
| LSD(5%) | 12.9 | 17.79 | 1.79 | 6.43 | 6.9 | 2.54 | 20.59 | 10.99 | 12.24 | 6.72 | 15.03 | 3.25 |
| PV | ** | * | Ns | * | *** | NS | *** | NS | * | ** | Ns | *** |
* = significant (P<0.05), ** = very significant (P<0.01), =*** highly significant (P<0.001)., NS = Non significance, KK = Kenket and WW = White Wonder) = standard checks, FTC = Farmer training center
Table 5.
Location by year analysis pod per plant and seed per pod.
| Genotype | Number of pod per plant | Number of seed per plant | ||||||||||
| On station | Milkaye FTC | Miesso | On station | Milkaye FTC | Miesso | |||||||
| 2019 | 2020 | 2019 | 2020 | 2019 | 2020 | 2019 | 2020 | 2019 | 2020 | 2019 | 2020 | |
| ILRI#11988 | 11.73 | 7.4 | 11.17 | 9.73 | 12.77 | 9.4 | 12.33 | 11.47 | 9.9 | 11.6 | 12.2 | 12.07 |
| ILRI#25367 | 6.0 | 13.73 | 7.08 | 7.93 | 13.93 | 12.53 | 12 | 12.4 | 12.4 | 10.5 | 11.93 | 13.87 |
| ILRI#11692 | 11.27 | 7.23 | 9.17 | 22.67 | 13.67 | 11.93 | 11.2 | 11.87 | 10.87 | 10.5 | 11.2 | 13.93 |
| ILRI#9341 | 7.4 | 12.77 | 4.67 | 7.87 | 13.97 | 10.27 | 12.93 | 11.87 | 9.2 | 11.5 | 15.47 | 14.4 |
| ILRI#25368 | 10.33 | 13.77 | 6.0 | 10.27 | 13.4 | 12.53 | 11.4 | 12.4 | 12.13 | 12.87 | 14.0 | 13.8 |
| ILRI#11971 | 9.47 | 7.45 | 9.4 | 13.87 | 13.27 | 8.2 | 13.2 | 11.8 | 11.6 | 14.73 | 12.43 | 12.53 |
| ILRI#9359 | 8.33 | 8.87 | 11.42 | 17.4 | 14.64 | 9.47 | 13.4 | 12.53 | 13.53 | 12.2 | 14.53 | 13.27 |
| ILRI#11977 | 8.8 | 6.33 | 11.33 | 12.4 | 13.37 | 12.33 | 12.13 | 11.8 | 12.4 | 11.3 | 13.4 | 12.53 |
| ILRI#12735 | 12.87 | 5.6 | 8.75 | 12.3 | 9.6 | 11.67 | 10.6 | 10.53 | 10.67 | 11.8 | 10.8 | 11.27 |
| ILRI#12737 | 9.0 | 7.73 | 10.25 | 14.4 | 15.27 | 10.73 | 13.67 | 11.47 | 12.8 | 11.3 | 10.67 | 11.13 |
| WW | 9.47 | 9.0 | 9.83 | 9.92 | 17.13 | 9.73 | 11.73 | 12.2 | 10.67 | 11.67 | 12.93 | 13.93 |
| KK | 11.93 | 5.4 | 10.92 | 14.4 | 10.93 | 7.8 | 14.86 | 12.93 | 14.67 | 13.53 | 14.8 | 12.8 |
| Mean | 9.72 | 8.78 | 9.17 | 12.75 | 13.47 | 10.55 | 12.34 | 11.94 | 11.74 | 11.96 | 13.47 | 12.96 |
| CV% | 25.06 | 27.88 | 39.88 | 25.16 | 19.39 | 21.48 | 10.56 | 11.38 | 13.42 | 15.62 | 12.87 | 13.59 |
| LSD (5%) | 4.12 | 4.15 | 4.82 | 5.43 | 4.42 | 3.84 | 2.2 | 2.3 | 2.67 | 3.16 | 8.63 | 2.98 |
| PV | Ns | ** | ** | *** | * | NS | * | * | * | * | *** | * |
* = significant (P<0.05), ** = very significant (P<0.01), =*** highly significant (P<0.001)., NS = Non significance, KK = Kenket and WW = White Wonder) = standard checks, FTC = Farmer training center
Table 6.
Location by year analysis of Diseases incidence and Insect Occurrence of cowpea genotypes.
| Genotype | Diseases incidence | Insect Occurrence | ||||||||||
| On station | Milkaye FTC | Miesso | On station | Milkaye FTC | Miesso | |||||||
| 2019 | 2020 | 2019 | 2020 | 2019 | 2020 | 2019 | 2020 | 2019 | 2020 | 2019 | 2020 | |
| ILRI#11988 | 3.0 | 1.67 | 2.33 | 2.33 | 3.67 | 1.67 | 1.33 | 1.33 | 2.67 | 2.67 | 1.67 | 1.67 |
| ILRI#25367 | 0.0 | 3.0 | 1.67 | 1.0 | 0.67 | 1.0 | 1.67 | 2.67 | 1.0 | 1.0 | 1.33 | 1.0 |
| ILRI#11692 | 2.0 | 2.33 | 1.67 | 0.67 | 2.0 | 1.67 | 2.67 | 2.67 | 1.33 | 1.33 | 1.67 | 1.67 |
| ILRI#9341 | 1.33 | 1.33 | 2.0 | 2.0 | 0.33 | 2.0 | 1.33 | 2.0 | 2.0 | 2.0 | 1.0 | 1.67 |
| ILRI#25368 | 1.0 | 1.67 | 2.0 | 1.33 | 1.0 | 1.33 | 2.33 | 1.0 | 2.0 | 2.0 | 1.33 | 2.0 |
| ILRI#11971 | 2.0 | 2.0 | 3.0 | 1.67 | 2.33 | 2.0 | 2.33 | 2.33 | 2.0 | 2.0 | 2.0 | 2.0 |
| ILRI#9359 | 1.33 | 1.67 | 3.0 | 0.33 | 1.0 | 1.33 | 1.33 | 1.33 | 0.67 | 0.67 | 1.33 | 1.33 |
| ILRI#11977 | 2.0 | 2.0 | 2.33 | 1.67 | 1.0 | 1.33 | 2.33 | 2.33 | 2.33 | 2.33 | 2.0 | 2.0 |
| ILRI#12735 | 1.33 | 2.0 | 3.0 | 0.67 | 3.33 | 2.0 | 1.67 | 1.33 | 1.0 | 1.0 | 1.67 | 1.67 |
| ILRI#12737 | 2.33 | 1.67 | 0.33 | 1.33 | 2.0 | 1.33 | 1.33 | 1.33 | 1.67 | 1.67 | 2.0 | 2.0 |
| WW | 1.0 | 2.0 | 1.33 | 1.33 | 2.0 | 1.33 | 2.0 | 2.0 | 1.33 | 1.33 | 1.0 | 1.0 |
| KK | 2.67 | 3.0 | 2.0 | 2.0 | 2.33 | 2.0 | 3.33 | 3.33 | 3.0 | 3.0 | 2.0 | 2.0 |
| Mean | 1.67 | 2.03 | 2.06 | 1.36 | 1.81 | 1.58 | 1.97 | 1.97 | 1.75 | 1.75 | 1.58 | 1.67 |
| CV % | 45.52 | 44.1 | 45.54 | 26.31 | 51.39 | 27.49 | 33.80 | 13.39 | 39.48 | 28.75 | 31.58 | 28.12 |
| LSD (5%) | 1.28 | 1.55 | 1.59 | 1.3 | 1.57 | 0.74 | 1.13 | 1.32 | 1.17 | 1.17 | 0.85 | 0.79 |
| PV | ** | * | * | ** | ** | * | ** | * | ** | ** | * | * |
* = significant (P<0.05), ** = very significant (P<0.01), =*** highly significant (P<0.001), NS = Non significance, KK = Kenket and WW = White Wonder) = standard checks, FTC = Farmer training center.
Disclaimer/Publisher’s Note: The statements, opinions and data contained in all publications are solely those of the individual author(s) and contributor(s) and not of MDPI and/or the editor(s). MDPI and/or the editor(s) disclaim responsibility for any injury to people or property resulting from any ideas, methods, instructions or products referred to in the content. |
© 2025 by the authors. Licensee MDPI, Basel, Switzerland. This article is an open access article distributed under the terms and conditions of the Creative Commons Attribution (CC BY) license (http://creativecommons.org/licenses/by/4.0/).
Copyright: This open access article is published under a Creative Commons CC BY 4.0 license, which permit the free download, distribution, and reuse, provided that the author and preprint are cited in any reuse.


