Preprint
Article

This version is not peer-reviewed.

Open Government Data Topic Modelling and Taxonomy Development

A peer-reviewed article of this preprint also exists.

Submitted:

24 February 2025

Posted:

25 February 2025

You are already at the latest version

Abstract

The expectations for the (re)use of Open Government Data (OGD) are high. However, measuring its impact remains challenging, as its effects are not solely economic, but also long-term and spread across multiple domains. To accurately assess these impacts, we must first understand where they occur. This research presents a structured approach to developing a taxonomy for Open Government Data (OGD) impact areas using machine learning-driven topic modeling and iterative taxonomy refinement. By analyzing a dataset of 697 OGD use cases, we employed various machine learning techniques—including Latent Dirichlet Allocation (LDA), Non-negative Matrix Factorization (NMF), and Hierarchical Dirichlet Process (HDP) - to extract thematic categories and construct a structured taxonomy. The final taxonomy comprises seven high-level dimensions: Society, Health, Infrastructure, Education, Innovation, Governance, and Environment, each with specific subdomains and characteristics. Our findings reveal that OGD’s impact extends beyond governance and transparency, influencing sectors such as education, sustainability, and public services. Compared to previous research that rely on predefined classifications or manual taxonomies, our approach provides a scalable and data-driven methodology for categorizing OGD impact areas. However, the study has certain limitations, including a relatively small dataset, brief use cases, and the inherent subjectivity of taxonomic classification, which requires further validation by domain experts. This research contributes to the systematic assessment of OGD initiatives and provides a foundational framework for policymakers and researchers aiming to maximize the benefits of open data.

Keywords: 
;  ;  ;  

1. Introduction

1.1. Background and Motivation

Open Government Data (OGD) constitutes a vital source of publicly released data originating from the government sector. The primary goals of OGD are to foster transparency, enhance accountability, and create added value [1]. In recent years, the production and analysis of data by public sector organizations have expanded considerably, resulting in increased research attention on OGD [2,3,4,5,6]. As government-generated data continues to grow, efforts to make it accessible to the public remain a priority. Initially, the emphasis was on promoting transparency in governance [7]. However, since 2010, expectations surrounding open data have evolved significantly [8,9]. Today, OGD is valued not just for its role in transparency but also for its potential to drive innovation [10], foster a data-driven economy [11], and contribute to societal goals. Achieving these objectives hinges on the release of high-impact data to the public—a priority highlighted by Ubaldi [5].
Despite its transformative potential, our understanding of the precise impacts of OGD remains limited, largely due to the scarcity of systematic and comprehensive studies in this field [12,13,14,15,16,17,18]. The Open Data Maturity Report [19] offers insights into how OGD generates impact across four domains such as governance, society, the economy, and the environment. The report illustrates that OGD can either be consumed in its raw form or processed further to create enriched datasets, innovative solutions, and value chains. However, generating impact depends on reusers finding practical applications for the data and implementing processes to transform it into actionable outcomes. Today, measuring or even identifying the impact of OGD remains a formidable challenge due to its diverse applications and the complexities involved in defining universal metrics. Additionally, the benefits of OGD are often indirect, further complicating efforts to quantify its impact [20]. The Open Data Maturity Report [19] assesses OGD impact using surveys with over 150 queries across areas like policy, impact, data portals, and quality. While such surveys provide valuable insights, they may reflect subjective perception of the respondents and are constrained by limited government resources, including funding and staffing for open data initiatives, which often compete with other high-priority projects [14]. Another resource that the EU mandates Member States to submit annually are case studies or use cases on OGD use, which offer a promising avenue for deriving actionable insights. Young and Verhulst [21] emphasize the importance of leveraging OGD use cases to understand its applications and benefits. Submissions on the Data Europa portal [22], supervised by the Publications Office of the European Union, serve as an invaluable dataset for examining the real-world impact of OGD and present an opportunity to deepen our understanding of its transformative potential. However, before classifying OGD impact areas, it is crucial to recognize that classification, as an established data mining problem, often requires preprocessing steps to make raw data suitable for training classifiers [23]. Experimental results on benchmark datasets demonstrate that integrating a taxonomy significantly improves classification accuracy while maintaining manageable computational effort, highlighting the importance of taxonomy in effectively categorizing OGD impact areas.
A key element in understanding and measuring the impact of OGD is therefore the development of a taxonomy of impact areas, akin to the approaches already utilized for mapping OGD research areas [24,25] and creating OGD solutions [26] such as interactive maps and dashboards. A taxonomy provides a structured framework for categorizing the diverse domains where OGD creates value and facilitates systematic analysis of OGD. Furthermore, a taxonomy enables the development of domain-specific metrics, guiding policymakers and researchers in designing targeted interventions to maximize OGD's benefits [27].
To address the challenges of understanding the impact of OGD, this study aims to systematically classify and assess the impact areas of OGD initiatives. Specifically, we seek to answer the following research question:
How can open government data impact areas be systematically classified using machine learning techniques and taxonomy development?
To achieve this, we employ a combination of topic modeling and taxonomy development methodologies to create a structured framework that organizes and categorizes OGD impact areas.

2. Literature Review

Our work is related to three main research pillars in OGD impact assessment: (1) benchmarking open government data, (2) OGD impact evaluation benchmarks, and (3) impact assessment with machine learning.

2.1. Benchmarking Open Government Data

In the context of OGD impact research, most efforts gravitated to benchmarking OGD practices, which involves systematically evaluating and comparing OGD initiatives, programs, or systems against established standards, metrics, or best practices. This includes identifying key indicators, collecting data, and analyzing how different governments, organizations, or regions perform relative to these benchmarks. As discovered by Hao-En [28], data quality and usage/usage patterns are the most frequently discussed topics in academic research. Zuiderwijk et al. [29] expands on this by highlighting the variety of metrics and methodologies used to benchmark OGD progress. Their research reveals that different benchmarks prioritize different aspects of OGD: some focus exclusively on data publication, such as the Open Data Index [30], Open Data Economy [31] and Open Data Inventory Network (ODIN) [32], while others examine both data publication and usage, or the potential value that could be created from the data, like the Open Data Readiness Assessment (ODRA)[33], Open Data Barometer [34], and Open Data Maturity [35] benchmarks. Zuiderwijk et al. [29] identified a significant challenge in the benchmarking process as many benchmarks fail to measure the actual impact of OGD, particularly in terms of citizen participation and the real-world collaborations between data providers and users. Furthermore, authors point out that although several newer benchmarks, such as the WJP Index and EIU, claim to assess the impact of OGD, they often do so from a theoretical perspective, assuming that impact is possible under certain conditions, rather than measuring actual outcomes. Research by Zuiderwijk et al. [29] underscores the multifaceted nature of OGD and the complexity of accurately assessing its progress and suggests that a comprehensive evaluation of OGD requires combining multiple benchmarks, each focusing on different facets, to gain a fuller understanding of open data’s impact and effectiveness. As additionally discovered by Hao-En [28] and Farhadloo et al. [36], there is a lack of benchmarking efforts specifically targeting the social and economic impacts of OGD, indicating a gap in current research.
Where impact has been observed, different and non-consolidated sources of data or methodologies have been used, neither of them followed a consolidated impact classification scheme or taxonomy. Instead, research papers usually followed impact areas defined by evaluation projects that were used as the foundation of their research [37] or extracted impact areas based on small and country specific dataset [38]. Zeleti’s [38] findings also suggest that impact categories can guide practitioners and governments in reviewing and evaluating open data initiatives. By considering both the demand and supply sides of open data, these categories help expand the focus beyond individual projects and specific user communities. The study acknowledges that while the four impact categories offer a framework for analysis, there are likely additional impact areas that were not explored due to insufficient evidence.

2.2. OGD Impact Evaluation Benchmarks

In recent years, several key global evaluation projects have been conducted to assess the impact of OGD initiatives across different levels, from municipalities to entire countries. These evaluation projects aim to measure the transparency, usability, and real-world impact of OGD, as well as its role in promoting governance, economic development, and social inclusion. Among the most significant evaluation frameworks are the Global Open Data Index [30], Open Data Barometer [34], European Open Data Maturity Report [35], Open Useful Reusable Government Data [39] and Open Data Inventory [32]. These evaluations have become one of the essential tools in understanding the maturity of open data practices across the globe.
The Global Open Data Index (GODI)[30], conducted by the Open Knowledge Foundation, focuses solely on the publication of open data by national governments. It assesses how governments make data available across six categories: Finance and Economy, Politics and Election, Spatial Data, Law, Environment, and National Statistics. However, it does not evaluate the use or impact of the data, concentrating primarily on its availability. In contrast, the Open Data Barometer (ODB) [34], conducted by the World Wide Web Foundation, takes a more comprehensive approach by including three main indexes: Readiness, Implementation, and Impacts. The ODB evaluates the political, economic, and social impacts of open data through expert surveys, which assess factors like government transparency, economic growth, and social inclusion. It uses sources from online media, academic publications, and expert input to estimate the extent of these impacts.
The European Open Data Maturity Report [35], by the Publications Office of the European Union, evaluates the openness and quality of government data across European countries. Its goal is to identify best practices and provide guidance to enhance the open data landscape in Europe. Meanwhile, the Open Useful Reusable Government Data (OURdata) [39] evaluation, led by the Organisation for Economic Co-operation and Development (OECD), focuses on the accessibility and reusability of open government data. It emphasizes fostering innovation and creating economic value by promoting the reuse of open data. Similarly, the Open Data Inventory (ODIN) [32], conducted by Open Data Watch, focuses on evaluating official statistics and the practices of national statistical offices, with a strong emphasis on improving governance and economic development.
Despite their differences, these evaluations collectively provide important insights into the political, economic, and social impacts of open data. The ODB, for example, identifies the political impact of open data in terms of government efficiency, accountability, and transparency. In the economic domain, evaluations like ODB and OURdata show that open data can drive innovation, support entrepreneurship, and contribute to economic growth. Socially, these evaluations also highlight the role of OGD in fostering environmental sustainability and social inclusion, particularly in marginalized communities.
Despite their contributions, these evaluations have limitations. For instance, GODI focuses exclusively on data publication and does not account for the broader impacts of open data on society or governance. Similarly, ODB's reliance on expert surveys and secondary sources may not fully capture the nuances of OGD’s real-world effects.

2.3. Impact Assessment – Methods Used

Recognizing the significance of OGD impact areas, particularly within major European organizations, particularly Publications Office of the European Union with ODM, we have identified an opportunity to automatically detect the areas of OGD from textual documents through text mining techniques. This process can empower governments to develop targeted and higher-quality datasets. In this context Artificial intelligence (AI) methods are highly valuable and represent a field of active research and rapid advancement [40]. Within the field of AI and Machine Learning (ML), text mining stands out, referring to the extraction of valuable and meaningful information from unstructured text [41]. This research focuses on Natural Language Processing (NLP) methods, a subset of text mining [42], with specific emphasis on keyword extraction and topic modeling.
While text mining is a common practice in literature, its application to identify OGD impact areas is relatively rare. One relevant application of NLP in this context is the work of [43], where the authors conducted topic modeling using Latent Dirichlet Allocation (LDA) to uncover research areas related to OGD and Freedom of Information (FOI). The study employed a corpus comprising journal articles, conference proceedings, and book chapters. The authors categorized the topics into four major groups: Transparency Collaboration/Participation, Technology, Economic/Social/Innovation, and Citizen Engagement. Their findings indicated a predominant focus on technology and related topics, as well as issues related to citizen engagement while only a scarce amount of research has employed the selected methodology to discern the impact of OGD in the existing literature. Tinati et al. [44] examined the impact of open data on the United Kingdom government through 22 semi-structured interviews with various stakeholders, owing to the scarcity of quantitative and qualitative data sources. Meng [45] assessed the relationship between civil society and the social impact of open data in eight Latin American countries using the Most Similar Systems method and fuzzy logic, relying on survey data. Jetzek et al. [46] measured the social and economic impact of OGD using the Partial Least Squares (PLS) method, incorporating various indicators and indexes. Their model was subsequently expanded by Jetzek et al. [47] to introduce contextual factors for sustainable value generation. Bilkova et al. [48] further extended the model to encompass additional enabling factors, along with an expanded sample size and attributes supported by the literature review from Machova & Lnenicka [49]. Their structural equation modeling (SEM) model incorporated various impact areas, including economic, educational, environmental, health, politics and legislation, social, trade, and business.
The previous research efforts in (OGD impact area assessment have provided valuable insights into various dimensions of OGD, yet they fall short in contributing to a comprehensive recognition and measurement of impact areas. While studies have explored the broader impacts of OGD, particularly in terms of transparency, citizen engagement, and economic or social benefits, they have not consistently incorporated methodologies that systematically assess and track these impacts across different OGD initiatives. A key limitation in the existing literature is the focus on isolated impact categories without a cohesive framework for capturing the full spectrum of impacts in a structured and measurable way. Existing studies, while contributing significantly to understanding OGD’s potential, have not fully addressed the need for a more systematic, scalable, and automated approach to recognizing and measuring the impact of OGD across various domains. Their reliance on limited sample sizes, qualitative methods, or context-specific data means they do not provide a comprehensive, universally applicable framework that can be used by governments to assess the true impact of OGD initiatives. Furthermore, the inability of these studies to integrate real-time data and contextual shifts within the open data ecosystem prevents them from being dynamic enough to reflect ongoing developments in open data practices.
In conclusion, while previous research has made significant contributions to understanding certain aspects of OGD impact, it has not yet provided an integrated, systematic, and scalable approach to identifying and measuring these impacts comprehensively. The existing studies, which mainly rely on qualitative methods or sector-specific models, fail to establish a universally applicable framework that can be used by governments to assess the broader and long-term effects of OGD initiatives. Furthermore, their focus on limited sample sizes, geographic contexts, or non-dynamic datasets leaves a gap in real-time impact evaluation.
The application of text mining techniques, particularly NLP, presents a promising solution to address these challenges. By leveraging AI and Machine Learning, governments can automate the analysis of textual documents to identify and evaluate OGD impact areas on a broader scale. This method offers the potential to create a more scalable, dynamic, and real-time approach to assessing OGD’s impact. To fully capitalize on this opportunity, there is a need for the development of a comprehensive taxonomy of OGD impact areas. Such a taxonomy would provide a standardized framework for categorizing and defining the various dimensions of OGD impact, allowing for more accurate, consistent, and universally applicable assessments. It would also facilitate comparative analyses and support targeted interventions to maximize the benefits of OGD initiatives across different regions and contexts. The goal of this research is, therefore, to develop such a taxonomy, which will enhance the overall evaluation and measurement of OGD’s impact and contribute to more informed policymaking and better data-driven decisions.

3. Materials and Methods

The research methodology employed in this study is rooted in Design Science Research (DSR), as described by Hevner et al. [50]. DSR is a well-established framework that focuses on the creation and evaluation of artifacts, such as models, methods, and taxonomies, to address real-world problems. The DSR framework consists of the relevancy, rigor and design cycle. While the relevancy and rigor cycle refer to problem identification, existing knowledge review and research gap identification covered in introduction, the design cycle provides the framework for artefact development and evaluation. Our research is focused on development of a taxonomy for open government data topics – the artefact, which is guided by the principles of the CRoss-Industry Standard Process for Data Mining (CRISP-DM). CRISP-DM is a six-phase methodology designed to offer a systematic and flexible approach to data mining projects and is, as outlined by Azevedo & Santos [51], widely adopted., Its comprehensive structure ensures the applicability of its methods across industries, providing a clear pathway for extracting meaningful insights from diverse data sets.
For this study, we applied the CRISP-DM framework to analyze 697 unstructured OGD use cases, sourced from the European Data Portal [22]. The one page use case documents, ranging from 431 to 1353 words, typically begin with a header that displays the title of the use case, often accompanied by relevant logos or branding elements. This section is followed by an executive summary or abstract that provides an overview of the document's purpose, context, and main outcomes. Next section then describes the challenges or needs that prompted the initiative and link the project to broader strategic goals or policies. Final sections define the objectives and a delineation of the project’s boundaries.
Given the unstructured nature of the data, our first step was to preprocess the text, ensuring it was suitable for machine learning analysis. This preprocessing involved several key tasks, including data extraction, cleaning, and normalization, as outlined in the following section. Following the data preprocessing phase, we employed topic modeling techniques to uncover the thematic structure within use case documents. Specifically, we utilized five distinct machine learning methods for topic modeling, each offering unique advantages in identifying latent patterns within the text. These methods allowed us to capture the diversity of topics and group them into coherent themes.
It is important to note that while our approach utilizes the CRISP-DM framework to systematically extract topics from unstructured data, the development of the taxonomy itself is not a direct outcome of CRISP-DM. Considering that the primary artifact of this study is the taxonomy, the design cycle also includes a specific methodology dedicated to taxonomy development by Nickerson et al. [52]. In this context, based on the insights derived from the topic modeling analysis, we iteratively developed and refined a comprehensive taxonomy of OGD topics, which serves as an organized classification system, foundational for understanding the impact areas within the OGD domain and supports further machine learning-driven analysis of OGD use cases.
The entire CRISP-DM framework process, results, and the detailed methodology and construction of the taxonomy are further explained in sections that follow.

3.1. Data Extraction and Pre-Processing

Unstructured text constitutes a prevalent form of data and, indeed, may constitute a substantial portion of the information accessible to a given research or data mining project [53]. When extracting data from unstructured documents, it was imperative to ensure the versatility of our code to handle various document formats beyond PDFs and this is why we utilized the Textract package [54], which provides a single interface for extracting content from any type of file, without any irrelevant markup.
After data extraction, a preprocessing pipeline was also developed and executed. This involved converting the entire corpus to lowercase, lemmatization, removal of stop words, and elimination of noise. Stop words were obtained from the Natural Language Toolkit (NLTK) library [55] and a customized noise removal function was applied. This function systematically processed incoming documents, eliminating special characters, punctuation, numerical values, URLs, email addresses, and redundant white spaces through regular expressions. Finally, a process of text normalization was implemented, comprising sentence tokenization, word frequency calculation using NLTK library, identification of near-identical words, and the removal of redundant words from the text.

3.2. Topic Modelling

Topic modeling, a statistical modeling approach, leverages unsupervised Machine Learning to discern clusters or groups of comparable words within a text corpus. This method in text mining utilizes semantic structures within the text to comprehend un-structured data without the need for predefined tags or training data [56].
In this study, five distinct machine learning methods for topic modeling were employed, ranging from modern and sophisticated approaches like OpenAI's Chat GPT to more established and simpler methods such as Latent Dirichlet Analysis (LDA). Detailed descriptions and parameterizations for each method are presented in the following sections.

3.2.1. Generative Pre-Trained Transformer

We first applied topic modeling using the OpenAI Generative Pre-Trained Transformer (GPT) model [57]. These models demonstrate the ability to produce coherent and contextually relevant responses when presented with a prompt or input text [58]. GPT’s extensive pre-training on large text datasets enables it to understand complex language patterns and generate accurate responses, even in ambiguous contexts [59]. The GPT model is based on a transformer architecture that includes an encoder, decoder, feed-forward network, and cross-attention layer [60]. The encoder consists of multi-headed self-attention layers that process the input sequence, passing information between layers through interconnected blocks [61]. The decoder also uses multi-headed self-attention layers, focusing on generating the output sequence. Attention, first proposed by Bahdanau et al. [62], involves computing a context vector for each decoder step, which captures the most relevant information from all encoder states using a weighted average. The contribution of each encoder state is based on its alignment score, which measures its relevance to the previous decoder state. Self-attention applies this mechanism to every position in the input sequence, generating three vectors: query, key, and value; at each position. Using the query vector, the attention mechanism transforms the input sequence into a new sequence, with each element incorporating both the original input and its contextual relationship with other positions. These computations are performed across the entire sequence by grouping the queries, keys, and values into matrices [60]:
A t t e n t i o n Q ,   K ,   V = s o f t m a x Q K T d k V ,
GPT’s transformer architecture also includes a feed-forward neural network (FFNN) that processes both input and output sequences. This network consists of several layers of interconnected neurons that allow information to flow through the model. At its core, the feed-forward network takes input values, multiplies them by corresponding weights, adds a bias term, and applies an activation function to produce the output. Additionally, a cross-attention layer connects the encoder and decoder. After the FFNN processes the input, the decoder’s multi-head attention block applies the same tokenization, word embedding, and attention mechanisms to generate attention vectors, which map the relationship between the source and target text. This information is then processed through another feed-forward layer to produce the final output.
We utilized the text-davinci-003 and gpt-3.5-turbo variants of GPT-3.5 model and during experimentation, we explored different temperature settings, which define how creative (higher value) or deterministic (lower value) the answer is. We specifically tested values of 0.2 and 0.7, in accordance with the recommendations provided in the OpenAI documentation [63]. The prompt, which is required for both variants we used was: “What domain is this text about in five keywords:“.

3.2.2. Non-Negative Matrix Factorization

Non-negative matrix factorization (NMF) is a technique used to factorize a non-negative matrix X into two non-negative matrices, W and H, with the aim of approximating X by their product [64]. As per Lee & Seung [64], NMF is also a recognized mathematical method for dimensionality reduction.
X W H ,
NMF has been widely recognized as a powerful tool for topic modeling. Studies by Carbonetto [65] and Purpura [66] have demonstrated its potential in enhancing topic model performance, while Lee & Seung [64] originally proposed NMF as a method for uncovering latent structures, including its application to topic modeling.
In the code we created, we performed topic modeling using a Term Frequency-Inverse Document Frequency (TF-IDF) vectorizer, which converts a set of documents into a matrix of TF-IDF features. Non-negative matrix factorization was then applied to extract topics, with the number of topics set to 1 and the number of words per topic limited to 5.

3.2.3. Latent Dirichlet Allocation

Latent Dirichlet Allocation (LDA) is a generative probabilistic model commonly used in natural language processing to uncover latent topics within a collection of documents. Developed by Blei et al. [67], LDA provides a framework for understanding the thematic structure of large text datasets. LDA assumes that each document is represented as a probability distribution over latent topics, with a shared Dirichlet prior for all documents. Similarly, each topic is modeled as a probability distribution over words, also governed by a Dirichlet prior.
As described by Blei et al. [67], for a corpus D of M documents, each with Nd words (d ∈ {1, ..., M}), LDA's generative process involves the following steps:
  • Choosing a multinomial distribution ϕt for topic t(t ∈ {1, ..., T }) from a Dirichlet distribution with parameter β;
  • Choosing a multinomial distribution θd for document d(d ∈ {1, …, M}) from a Dirichlet distribution with parameter α;
  • For a word wn (n ∈ {1, …, Nd}) in document d, select a topic zn from θd and select a word wn from ϕzn.
In this generative process, words in documents are observed variables, while other variables (such as ϕ and θ) and hyperparameters (α and β) are latent. The probability of the observed data D is computed for a corpus as follows:
p D α , β =   d = 1 M p ( θ d | α )   n = 1 N d z d n p z d n | θ d p w d n | z d n ,   β   d θ d ,
Several studies have highlighted LDA's effectiveness in topic modeling. Ostrowski [68] demonstrated its utility in identifying sub-topics and classifying Twitter data. Christy et al. [69] proposed a hybrid model using LDA for feature extraction and selection, improving document clustering accuracy. Muchene et al. [70] employed a two-stage approach, combining LDA for per-document topic probabilities with hierarchical clustering for final topic clusters in scientific publications.
In our code, we tokenized individual documents, created a dictionary of tokenized words, and generated a bag-of-words representation. An LDA model was then instantiated with a predetermined number of topics, set to 1 in our instance, with the number of words per topic limited to 5.

3.2.4. Hierarchical Dirichlet Process

The Hierarchical Dirichlet Process (HDP), proposed by Teh et al. [71], is an extension of the Dirichlet Process that provides a flexible framework for hierarchical Bayesian modeling. Unlike models that require the number of topics or clusters to be set in advance, HDP adapts to the data and automatically determines the number of topics. In HDP, random probability measures Gj are assigned to each group, and these are derived from a global random probability measure G0, which is sampled from a Dirichlet process with concentration parameter γ and base probability measure H:
G 0   | γ , H ~ D P ( γ , H ) ,
Each Gj is then conditionally independent given G0 and follows another Dirichlet process with concentration parameter α0:
G j   | α 0 , G 0 ~ D P ( α 0 , G 0 ) ,
The hyperparameters include the baseline measure H and the concentration parameters γ and α0​. H acts as a prior for the parameters θji ​, while the variability around G0 is controlled by γ, and the deviations of Gj from G0 are governed by α0​. In some cases, different concentration parameters αj​ can be used for different groups to account for varying levels of variability. HDP is typically used as a prior distribution for grouped data, with each observation xji corresponding to a parameter θj2​, sampled from Gj​:
θ j i   | G j ~ G j x j i   |   θ j i   ~   F θ j i ,
HDP is preferred over LDA for several reasons. First, HDP can automatically infer the number of topics, addressing a major limitation of LDA [72] Second, HDP is more flexible and can incorporate supervision [72,73]. Lastly, HDP’s nonparametric nature and ability to handle an unknown number of mixture components make it ideal for online data clustering [74].
In our code, we implemented HDP for topic modeling by tokenizing documents and generating a dictionary from the tokenized words. A bag-of-words representation was created, and an HDP model was built using this representation. The number of topics and words per topic can be specified, in our case we again defined these values to 1 and 5.

3.2.5. Latent Semantic Analysis

Latent Semantic Analysis (LSA), introduced by Deerwester et al. [75], is a technique used in natural language processing and information retrieval to uncover the underlying structure and meaning in large text corpora. LSA represents words and documents in a high-dimensional space that captures latent semantic relationships. The key method used in LSA is Singular Value Decomposition (SVD), which is applied to a term-document matrix A, where aij represents the frequency of term i in document j.
SVD decomposes matrix A into three matrices U, Σ and VT where:
  • U containing the left singular vectors,
  • Σ a diagonal matrix with singular values, and
  • VT the transpose of the matrix with the right singular vectors.
Next, dimensionality reduction is performed by retaining only the top k singular values and their corresponding vectors to obtain reduced matrices Uk, Σk, and VkT. The reduced matrices represent terms and documents in a lower-dimensional semantic space where each document is represented as a vector in this semantic space (VkT), capturing the latent topics.
Dimensionality reduction is then performed by retaining only the top k singular values and their corresponding vectors, producing reduced matrices Uk, Σk, and VkT. This process results in a lower-dimensional representation of terms and documents, where documents are expressed as vectors in this semantic space, capturing the latent topics:
A k ~ U k Σ k V k T ,
LSA has been widely used for topic modeling in various studies. Valdez et al. [76] demonstrated its effectiveness in identifying thematic patterns in large text collections. Gupta et al. [77] emphasized its role in revealing hidden patterns in big datasets, while Alghamdi & Alfalqi [78] provided a comprehensive review of different topic modeling methods, including LSA.
In our code we implemented LSA on a collection of documents by first creating a Term Frequency-Inverse Document Frequency (TF-IDF) matrix. We tokenized each document, extracted article titles, and applied Truncated Singular Value Decomposition (SVD) to reduce the dimensionality of the TF-IDF matrix. Top 5 terms for each topic were extracted once more.

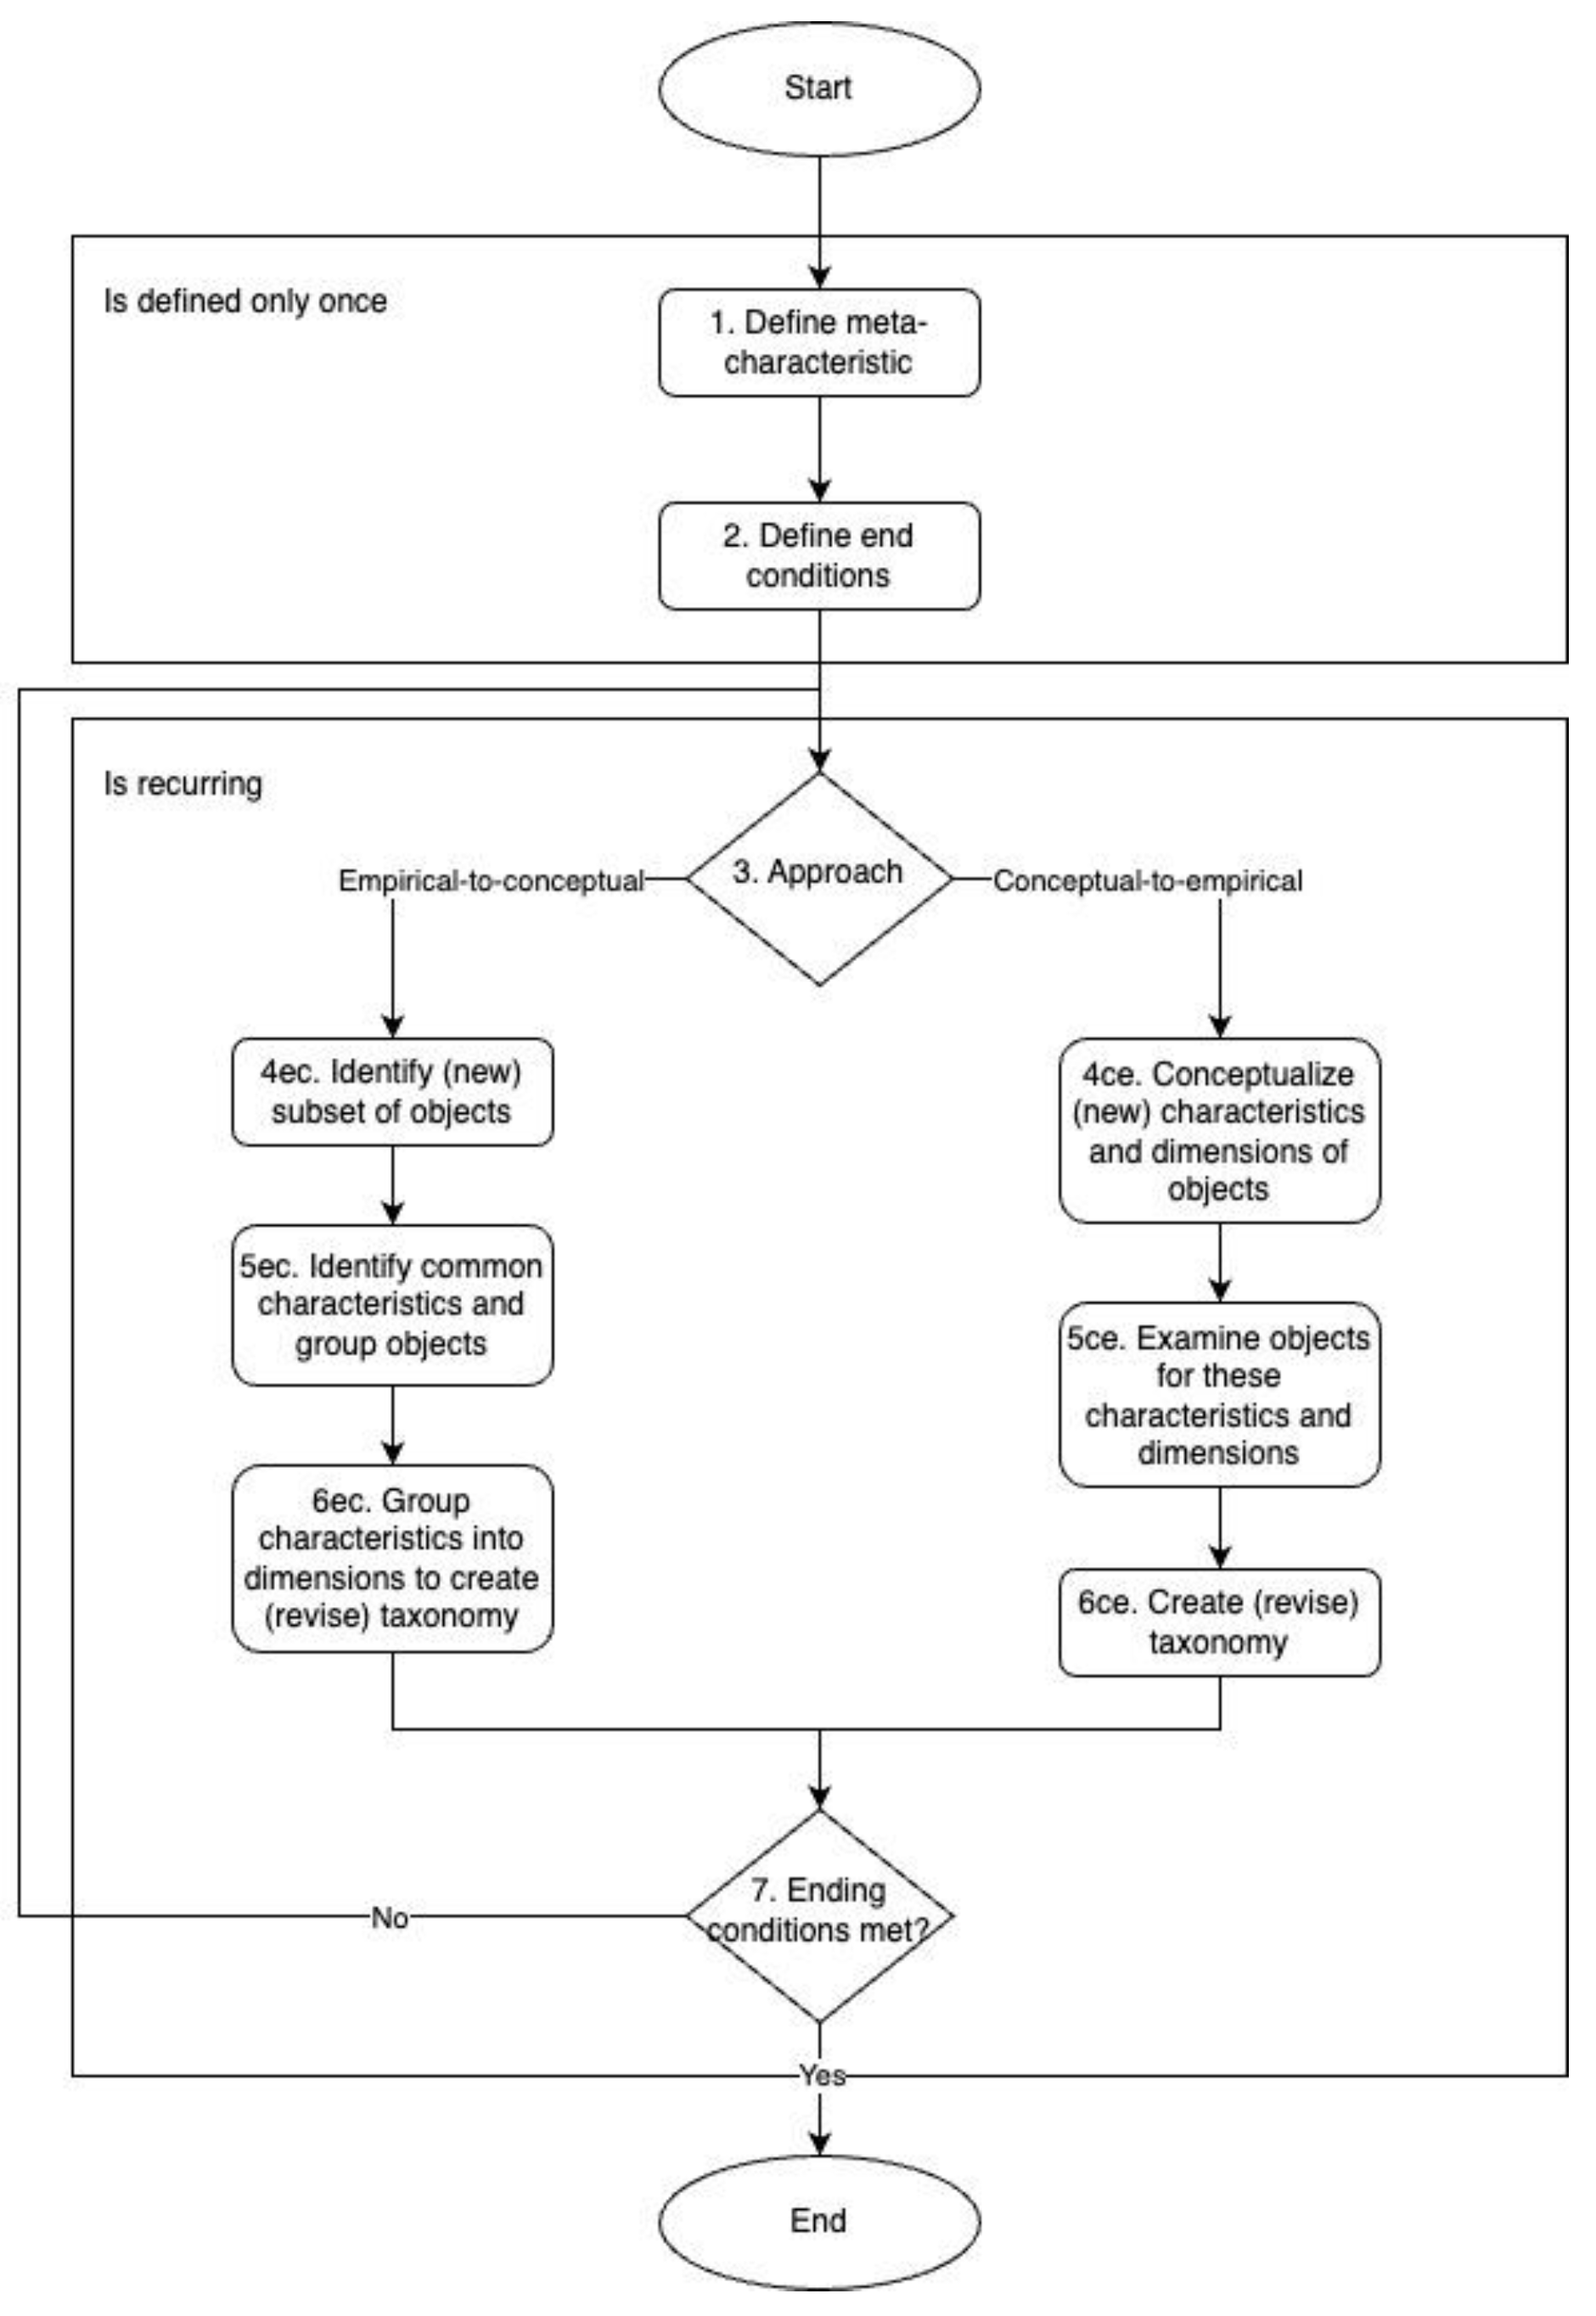
3.3. Taxonomy Development

Taxonomies provide a systematic way to classify and organize complex data into meaningful categories, enabling stakeholders to identify key areas of focus and assess the effectiveness of observed topic [79,80]. This is particularly critical for government and European Commission officials, who could benefit from efficient resource allocation and prioritization of impact areas with the purpose of maximizing the societal and economic benefits of open data. As per Nickerson et al. [52], taxonomy in mathematical representation consists of n dimensions Di (where i = 1, …, n), each comprising ki (with ki >= 2) mutually exclusive and collectively exhaustive characteristics Cij (where j = 1, …, ki). This structure ensures that each object being analyzed is associated with only one characteristic Cij for each dimension Di. In other words, we can express the taxonomy as:
T = { D i ,   i = 1 , , n   |   D i = { C i j ,   j = 1 , , k i ; k 1 2 } }
In this context, the taxonomy development process proposed by Nickerson et al. [52] offers a rigorous methodological approach to constructing a well-defined classification system. Nickerson et al. [52] method combines both empirical and conceptual approaches, ensuring that the taxonomy is grounded in real-world data while also aligning with theoretical frameworks. This iterative process allows for continuous refinement of categories based on empirical evidence and expert input, making it particularly suitable for the dynamic and evolving nature of OGD impact areas.
In the following sections, we will outline the steps taken in the taxonomy development process, including the identification of meta-characteristics, ending conditions and the iterative classification of impact areas. This structured approach ensures that the taxonomy is not only comprehensive but also adaptable to future developments in the field of open government data.

3.3.1. Meta-Characteristic

Following Nickerson et al. [52] approach we first had to define a meta-characteristic, which is a foundational concept in taxonomy development and serves as the primary guiding principle. It defines the scope and focus of the taxonomy, ensuring that the dimensions and characteristics are consistent and aligned with the overall purpose of the classification system. It is essentially the key attribute or perspective that all other dimensions and characteristics of the taxonomy will be based on.
Selecting an appropriate meta-characteristic is one of the most important steps in taxonomy development, as it influences the entire structure. According to Nickerson et al. [52], there are a few key considerations to consider when choosing the meta-characteristic:
  • Purpose of the taxonomy: The meta-characteristic should align with the objective of the taxonomy and must reflect the core purpose or objective of the taxonomy.
  • Audience and use cases: The meta-characteristic should be relevant to the stakeholders and use cases, guiding the classification in a way that meets their needs.
  • Scope of the domain: The meta-characteristic should capture the essential scope of the domain being studied. It should be broad enough to encompass all relevant dimensions but specific enough to ensure focus.
  • Mutually exclusive and collectively exhaustive: The meta-characteristic should help guide the development of dimensions and characteristics that are mutually exclusive (no overlap between categories) and collectively exhaustive (covering all relevant aspects)
Given that our goal is to classify the impact areas of OGD, the meta-characteristic defined for our research is: "The potential impact areas influenced by Open Government Data initiatives and their use cases."

3.3.2. Ending Conditions

Next, conditions that end the process must be determined. So called ending conditions are criteria that define when the iterative process in development of a taxonomy should be stopped. According to Nickerson et al. [52], taxonomy development in general is an iterative process involving empirical and/or conceptual steps, and it is essential to have clear criteria for when to stop iterating. Nickerson et al. [52] suggest that both objective and subjective ending conditions must be met before concluding the taxonomy development process. This ensures that the taxonomy is not only structurally complete (objective) but also practical, usable, and aligned with its intended purpose. Ending conditions that were proposed by Nickerson et al. [52] and will be used in this research are presented in Table 1.

3.3.3. Approach Selection

As first defined by Bailey [81] and later expanded and proposed in their model by Nickerson et al. [52], two different approaches can be utilized for taxonomy development: empirical-to-conceptual and conceptual-to-empirical. In the empirical-to-conceptual approach, the researcher selects a subset of objects to classify, typically based on familiarity or accessibility, potentially through literature reviews. This subset may be sampled randomly, systematically, or conveniently. The researcher then identifies common characteristics of these objects, which must logically derive from the meta-characteristic while also effectively discriminating among the objects. The researcher may rely on their knowledge or consult with experts. In the conceptual-to-empirical approach, the researcher starts by conceptualizing the dimensions without examining actual objects. This deductive process relies on the researcher’s understanding of similarities and differences among objects, drawing on existing knowledge and judgment to determine relevant dimensions. Each dimension must have characteristics that logically stem from the meta-characteristic. The appropriateness of these dimensions is assessed by checking if they encompass objects with the proposed characteristics. As in the empirical approach, each dimension must also be mutually exclusive and collectively exhaustive.
As stated by Nickerson et al. [52] one can utilize both approaches while creating a taxonomy, depending on the specific goals of the research and the nature of the subject matter being studied. In developing our taxonomy, we have chosen to utilize both the empirical-to-conceptual and conceptual-to-empirical approaches. This dual methodology allows us to leverage the strengths of each approach to create a comprehensive and robust classification system.

3.3.4. Validation

Besides the validation by using ending conditions Nickerson et al. [52] explains that currently there is no method to provide clear sufficient conditions for determining a taxonomy’s usefulness, other than stating that it is useful if it is actually used by others - a tautological condition. This aligns with design science research, which prioritizes utility over truth [50] and if this is the only sufficient condition, then the only way to assess a taxonomy’s usefulness is by observing its use over time.
Ideally, we would prefer sufficient conditions that are easier to apply and could be evaluated before the taxonomy is put into use. However, such conditions are likely to vary depending on the intended purpose of the taxonomy.

3.3.5. Process Schema

Drawing from the methodology outlined by Nickerson et al. [52], we introduce a high-level process schema (Figure 1) that details the essential steps involved in developing a taxonomy. Each step in this schema will also be referenced in every iteration of the taxonomy development in the Results section to simplify and improve reader's understanding of the process.

4. Results

In Results section, we present each iteration of the taxonomy development process in own section in a way that each section corresponds to a specific iteration and outlines the steps defined in the methodology section, providing a structured overview of the iterative process.
We initially performed a hierarchical clustering on the preprocessed use cases to identify potential high-level impact areas and possibly align them with the ones proposed by the . We first generated document embeddings using the Multilingual BERT model [82] and employed cosine similarity to calculate distances between rows in the dataset, following recommendations from previous studies addressing text mining challenges such as text classification, summarization, and information retrieval [83,84,85]. The results of the hierarchical clustering revealed four major groups in the data. Upon manual inspection of each cluster, we confirmed that most use cases were multi-domain, with three distinct clusters focused primarily on the environment, transport, and education, while the fourth and largest cluster encompassed all other domains. Defining this fourth area as either society or economy would lead to a disproportionate taxonomy, with the majority of taxons falling into this category. Therefore, while the clustering analysis did not show a direct correlation with the impact areas outlined by the Publications Office of the European Union, a manual review of the clusters better aligns with the initial four impact areas defined in the Open Data Maturity Report [19].

4.1. Iteration 1 - Initial Taxonomy Draft Based on Predefined Domains

The first iteration aimed to establish a preliminary taxonomy using predefined categories from the Open Data Maturity Report [19] and Data Europa use case sectors [22] before introducing machine learning techniques. Actions taken in this iteration, that correspond to the Nickerson et al. [52] methodology, are outlined in Table 2.
This iteration resulted in Table 4, which presents the initial taxonomy structure, mapping OGD use approaches, impact dimensions and corresponding use case sectors. However, it became evident that relying solely on predefined classifications limited the granularity and flexibility of the taxonomy. To address these shortcomings, the next iteration applied machine learning techniques to derive impact areas directly from OGD use cases.

4.2. Iteration 2 - Refinement Using GPT-Based Topic Modeling

To refine the taxonomy, GPT-based topic modeling was applied to extract emerging themes and impact areas from the dataset. Actions conducted in this iteration are outlined in Table 5 and refined dimensions with subcategories are presented in Table 6.
This iteration resulted in the updated taxonomy with seven impact dimensions and two additional use approaches. While this structure significantly improved the taxonomy, some extracted terms were too abstract or lacked practical relevance, necessitating further refinement through additional machine learning techniques.

4.3. Iteration 3 - Refinement Through Additional Topic Modeling Techniques

In Iteration 3, multiple topic modeling techniques were applied to validate the findings of GPT-based topic modeling from Iteration 2. The goal was to ensure that the identified impact areas were consistently represented across different machine learning approaches and to identify any additional emerging topics that may have been overlooked in the previous iteration. Actions and outcomes of the Iteration 3 are repesented in Table 7.
Each technique used in this iteration offers unique advantages and limitations, influencing the quality of extracted topics and their relevance to OGD impact classification. The comparison of these techniques is summarized in Table 8, highlighting their strengths and weaknesses.
Given these findings, the taxonomy structure was retained, but terms were manually refined to remove redundancies and clarify definitions before finalizing the taxonomy in Iteration 4. While additional machine learning techniques contributed to validating existing categories, they did not introduce significantly new impact dimensions, reinforcing the structure established in the previous iteration. Instead, few additional characteristics were identified, thus making taxonomy more complete.
This iteration confirmed that the refined taxonomy was robust and comprehensive, requiring only minor refinements in wording and classification logic before being finalized.

4.4. Iteration 4 - Final Refinements and Conceptual Validation

The fourth and final iteration focused on structural validation using Nickerson et al.'s [52] ending conditions.
Table 9. Key actions and outcomes of the fourth and final iteration of taxonomy development.
Step Action Outcome
3ce Approach: conceptual-to-empirical Extend taxonomy based on findings derived from other topic modelling techniques
4ce Conceptual validation Evaluated against taxonomy development criteriaNo additional approaches for using OGD were identified
5ce, 6ce Conceptual validation No additional characteristics or dimensions were identified
7 Assessed taxonomy against ending conditions Verified coverage, exclusivity, simplicity, practicality, and extendibility
The final taxonomy structure is detailed in Table 10, which maps the application of identified OGD use areas, and Table 11, which provides comprehensive descriptions of each dimension along with their corresponding subcategories and characteristics. At this stage, the taxonomy was considered structurally complete, fulfilling both objective and subjective ending conditions.

5. Discussion

The results of this research highlight the significant role of taxonomy development in categorizing OGD impact areas. By employing a combination of empirical-to-conceptual and conceptual-to-empirical methodologies, along with machine learning-driven topic modeling techniques, we successfully created a structured taxonomy that classifies OGD impact into various domains.
One of the key findings is that OGD impact areas extend beyond traditional domains of governance and transparency, affecting sectors such as education, infrastructure, and health. Our taxonomy reveals that OGD initiatives influence societal dynamics, economic conditions, and environmental sustainability. These findings align with prior research on OGD impact, which underscores the need for structured classification systems to measure and evaluate open data initiatives effectively [13,14]. Compared to previous studies, which often focused on single-use cases or specific geographies, our approach applies a scalable methodology by leveraging machine learning for topic identification. This contrasts with previous research that either relied on predefined classifications [37] or manually developed taxonomies [38].
While our taxonomy provides a strong foundation for assessing OGD's impact, it remains subjective and will require validation through domain expert reviews or surveys. Additional limitations apply for our dataset as well. Specifically, the limited size of our dataset constrained the scope of our conclusions and the use cases analyzed were relatively brief, which limited the depth of extracted insights to some extent. Another notable limitation is the subjectivity involved in defining taxonomic categories. While our methodology attempted to minimize bias by incorporating multiple machine learning techniques, human intervention was necessary to refine and interpret the results.

6. Conclusions

This research successfully developed a structured taxonomy for classifying the impact areas of open government data. Our approach integrated empirical data-driven methodologies with conceptual reasoning to create a robust and scalable classification system. The initial research question guiding this study was: How can we systematically classify and assess the impact areas of OGD initiatives? In response, we utilized machine learning techniques such as Latent Dirichlet Allocation (LDA), Non-negative Matrix Factorization (NMF), and Hierarchical Dirichlet Process (HDP) to extract meaningful topics from OGD use cases. Through iterative refinements, we structured OGD impact areas into key dimensions, including Society, Health, Infrastructure, Governance, and Environment.
This taxonomy provides a comprehensive framework for understanding how OGD contributes to various sectors and facilitates more effective policymaking and data utilization. Ultimately, this research contributes to the broader effort of systematically classifying and evaluating OGD’s impact, offering a structured methodology that can be adapted and refined in future studies.
Future work should focus on developing a classification model that can process incoming documents and probabilistically classify them into the relevant taxons, thus enhancing the taxonomy’s applicability and impact assessment capabilities.

Funding

This research was funded by Slovenian Research and Innovation Agency and Ministry of Digital Transformation of Republic of Slovenia, grant number V5-2356, and Slovenian Research and Innovation Agency, grant number P5-0018.

References

  1. Organisation for Economic Co-operation and Development. Open Government Data Report: Enhancing Policy Maturity for Sustainable Impact; OECD Publishing: Paris, France, 2018; pp. 3–4. [Google Scholar] [CrossRef]
  2. Attard, J.; Orlandi, F.; Scerri, S.; Auer, S. A systematic review of open government data initiatives. Government Information Quarterly 2015, 32, 399–418. [Google Scholar] [CrossRef]
  3. Attard, J.; Orlandi, F.; Auer, S. Value Creation on Open Government Data. In Proceedings of the 2016 49th Hawaii International Conference on System Sciences (HICSS), Koloa, HI, USA, 5-8 January 2016; pp. 2605–2614. [Google Scholar] [CrossRef]
  4. Safarov, I.; Meijer, A.; Grimmelikhuijsen, S. Utilization of open government data: A systematic literature review of types, conditions, effects and users. Information Polity 2017, 22, 1–24. [Google Scholar] [CrossRef]
  5. Ubaldi, B. Open Government Data: Towards Empirical Analysis of Open Government Data Initiatives; OECD Publishing: Paris, France, 2013; pp. 4–17. [Google Scholar] [CrossRef]
  6. Yan, A.; Weber, N. Mining Open Government Data Used in Scientific Research. In Proceedings of the 13th International Conference, iConference 2018, Transforming Digital Worlds, Lecture Notes in Computer Science, Sheffield, United Kingdom, 25-28 March 2018; Volume 10766, pp. 303–313. [Google Scholar] [CrossRef]
  7. Jaeger, P.T.; Bertot, J.C. Transparency and technological change: Ensuring equal and sustained public access to government information. Government Information Quarterly 2010, 27, 371–376. [Google Scholar] [CrossRef]
  8. Buttow, C.V.; Weerts, S. Open Government Data: The OECD's Swiss army knife in the transformation of government. Policy & Internet 2022, 14, 219–234. [Google Scholar] [CrossRef]
  9. Fan, B.; Meng, X. Moderating Effects of Governance on Open Government Data Quality and Open Government Data Utilization: Analysis Based on the Resource Complementarity Perspective. Journal of Global Information Technology Management 2023, 26, 300–322. [Google Scholar] [CrossRef]
  10. Nikiforova, A. Smarter Open Government Data for Society 5.0: Are Your Open Data Smart Enough? Sensors 2021, 21, 5204. [Google Scholar] [CrossRef]
  11. Jiang, H.; Duan, Y.; Zhu, Y. Citizens’ Continuous-Use Intention to Open Government Data: Empirical Evidence from China. In Proceedings of the 10th International Conference on Big Data, BigData 2021, Virtual event, 10-14 December 2021; Volume 12988, pp. 62–79. [Google Scholar] [CrossRef]
  12. Roa, H.N.; Loza-Aguirre, E.; Flores, P. A Survey on the Problems Affecting the Development of Open Government Data Initiatives. In Proceedings of the Sixth International Conference on eDemocracy & eGovernment (ICEDEG), Quito, Ecuador, 24-26 April 2019; pp. 157–163. [Google Scholar] [CrossRef]
  13. Ruijer, E.H.J.M.; Martinius, E. Researching the democratic impact of open government data: A systematic literature review. Information Polity 2017, 22, 233–250. [Google Scholar] [CrossRef]
  14. Zuiderwijk, A.; Janssen, M. Open data policies, their implementation and impact: A framework for comparison. Government Information Quarterly 2014, 31, 17–29. [Google Scholar] [CrossRef]
  15. Jamieson, D.; Wilson, R.; Martin, M. The (im)possibilities of open data? Public Money & Management 2019, 39, 364–368. [Google Scholar] [CrossRef]
  16. Zhang, L.; Sok, S. The impact of government open data platform construction on corporate capital market performance: Evidence from stock liquidity. Pacific-Basin Finance Journal 2025, 90, 102667. [Google Scholar] [CrossRef]
  17. Tan, L.; Pei, J. Open government data and the urban–rural income divide in China: An exploration of data inequalities and their consequences. Sustainability 2023, 15, 9867. [Google Scholar] [CrossRef]
  18. Peng, X.; Xiao, D. Can open government data improve city green land-use efficiency? Evidence from China. Land 2024, 13, 1891. [Google Scholar] [CrossRef]
  19. European Commission. 2024 Open Data Maturity Report; Publications Office of the European Union: Luxembourg, 2024; pp. 5–15. [Google Scholar] [CrossRef]
  20. European Commission. European Data Portal Report; Capgemini Invent: Luxembourg, 2020; pp. 10–16. [Google Scholar] [CrossRef]
  21. Young, A; Verhulst, S. The Global Impact of Open Data: Key Findings from Detailed Case Studies Around the World. O'Reilly Media, 2016.
  22. Publications Office of the European Union - Use cases. Available online: https://data.europa.eu/en/publications/use-cases (accessed on 15 February 2025).
  23. Cagliero, L.; Garza, P. Improving classification models with taxonomy information. Data & Knowledge Engineering 2013, 86, 85–101. [Google Scholar] [CrossRef]
  24. Charalabidis, Y.; Alexopoulos, C.; Loukis, E. A taxonomy of open government data research areas and topics. Journal of Organizational Computing and Electronic Commerce 2016, 26, 41–63. [Google Scholar] [CrossRef]
  25. Mohamad, A.N.; Sylvester, A.; Campbell-Meier, J. Towards a taxonomy of research areas in open government data. Online Information Review 2024, 48, 67–83. [Google Scholar] [CrossRef]
  26. Crusoe, J.; Clarinval, A. Classification of Open Government Data Solutions’ Help: A Novel Taxonomy and Cluster Analysis. Electronic Government 2023, 14130, 230–245. [Google Scholar] [CrossRef]
  27. Zuiderwijk, A.; Reuver, M.D. Why open government data initiatives fail to achieve their objectives: categorizing and prioritizing barriers through a global survey. Transforming Government: People, Process and Policy 2021, 15, 377–395. [Google Scholar] [CrossRef]
  28. Hao-En, K. Between International Practice and Academia: Review and integration of Open Government Data Benchmarks. In Proceedings of the 24th Annual International Conference on Digital Government Research, Gdansk, Poland, 11-14 July 2023; pp. 73–89. [Google Scholar] [CrossRef]
  29. Zuiderwijk, A.; Pirannejad, A.; Susha, I. Comparing open data benchmarks: Which metrics and methodologies determine countries’ positions in the ranking lists? Telematics and Informatics 2021, 62, 1–23. [Google Scholar] [CrossRef]
  30. Open Knowledge Foundation - Global Open Data Index. Available online: http://index.okfn.org/ (accessed on 8 July 2024).
  31. Open Data Economy. Available online: https://www.opendataeconomy.org/ (accessed on 8 July 2024).
  32. Open Data Inventory Network. Available online: https://opendatainventory.org/ (accessed on 8 July 2024).
  33. World Bank Group - Readiness Assessment Tool. Available online: https://opendatatoolkit.worldbank.org/en/data/opendatatoolkit/odra (accessed on 8 July 2024).
  34. World Wide Web Foundation - Open data barometer. Available online: https://opendatabarometer.org/ (accessed on 9 July 2024).
  35. Publications Office of the European Union - Open Data Maturity. Available online: https://data.europa.eu/en/publications/open-data-maturity (accessed on 9 July 2024).
  36. Farhadloo, M.; Rosso, M.; Animesh, A. Open government data, innovation and diversification: the pursuit of economic value. Transforming Government: People, Process and Policy 2024, 18, 722–743. [Google Scholar] [CrossRef]
  37. Alderete, M. V. Towards Measuring the Economic Impact of Open Data by Innovating and Doing Business. International Journal of Innovation and Technology Management 2020, 17, 2050022. [Google Scholar] [CrossRef]
  38. Zeleti, A.F. Analytical Frame for Open Data Impact Assessment – An Exploratory Research. SSRN 2023. [Google Scholar] [CrossRef]
  39. Open Useful Reusable Government Data - OURdata. Available online: https://ourdata.org/ (accessed on 10 July 2024).
  40. Lu, H.; Li, Y.; Chen, M.; Kim, H.; Serikawa, S. Brain Intelligence: Go beyond Artificial Intelligence. Mobile Networks and Applications 2017, 23, 368–375. [Google Scholar] [CrossRef]
  41. Dörre, J.; Gerstl, P.; Seiffert, R. Text mining: finding nuggets in mountains of textual data. In Proceedings of the Fifth ACM SIGKDD International Conference on Knowledge Discovery and Data Mining, San Diego, CA, USA, 15-18 August 1999; pp. 398–401. [Google Scholar] [CrossRef]
  42. Collobert, R.; Weston, J.; Bottou, L.; Karlen, M.; Kavukcuoglu, K.; Kuksa, P. Natural Language Processing (Almost) from Scratch. Journal of Machine Learning 2011, 12, 2493–2537. [Google Scholar] [CrossRef]
  43. Afful-Dadzie, E.; Afful-Dadzie, A. Liberation of public data: Exploring central themes in open government data and freedom of information research. International Journal of Information Management 2017, 37, 664–672. [Google Scholar] [CrossRef]
  44. Tinati, R.; Carr, L.; Halford, S.; Pope, C. Exploring the impact of adopting open data in the UK government. In Proceedings of the Digital Futures 2012, Aberdeen, United Kingdom, 23-25 October 2012. [Google Scholar]
  45. Meng, A. Investigating the Roots of Open Data’s Social Impact. JeDEM 2014, 6, 1–13. [Google Scholar] [CrossRef]
  46. Jetzek, T.; Avital, M.; Bjørn-Andersen, N. Generating Value from Open Government Data. In Proceedings of the International Conference on Information Systems, ICIS 2013, Milano, Italy, 15-18 December 2013. [Google Scholar]
  47. Jetzek, T.; Avital, M.; Bjørn-Andersen, N. Data-Driven Innovation through Open Government Data. Journal of Theoretical and Applied Electronic Commerce Research 2014, 9, 100–120. [Google Scholar] [CrossRef]
  48. Bilkova, R.; Machova, R.; Lnenicka, M. Evaluating the Impact of Open Data Using Partial Least Squares Structural Equation Modeling. Scientific Papers of the University of Pardubice - Series D 2015, 22, 29–41. [Google Scholar]
  49. Machova, R.; Lnenicka, M. Modelling E-Government Development through the Years Using Cluster Analysis. JeDEM 2016, 8, 62–83. [Google Scholar] [CrossRef]
  50. Hevner, A.; March, S.; Park, J.; Ram, S. Design Science in Information Systems Research. MIS Quarterly 2004, 28, 75–105. [Google Scholar] [CrossRef]
  51. Azevedo, A.; Santos, M. KDD, SEMMA and CRISP-DM: a parallel overview. In Proceedings of the IADIS European Conference on Data Mining, Amsterdam, The Netherlands, 24-26 July 2008; pp. 182–185. [Google Scholar]
  52. Nickerson, R.; Varshney, U.; Muntermann, J. A method for taxonomy development and its application in information systems. European Journal of Information Systems 2013, 22, 336–359. [Google Scholar] [CrossRef]
  53. Miner, G.D.; Elder, J.F.; Nisbet, R. Practical Text Mining and Statistical Analysis for Non-structured Text Data Applications, 1st ed.; Academic Press: New York, USA, 2012. [Google Scholar]
  54. Textract. Available online: https://textract.readthedocs.io/en/stable/ (accessed on 24 September 2024).
  55. Bird, S.; Loper, E.; Klein, E. Natural Language Processing with Python: Analyzing Text with the Natural Language Toolkit, 1st ed.; O’Reilly Media: Sebastopol, CA, USA, 2009. [Google Scholar]
  56. Barde, B.V.; Bainwad, A.M. An overview of topic modeling methods and tools. Proceedings of 2017 International Conference on Intelligent Computing and Control Systems (ICICCS), Madurai, India, 15-16 June 2017; pp. 745–750. [Google Scholar] [CrossRef]
  57. OpenAI - ChatGPT. Available online: https://openai.com/chatgpt (accessed on 5 March 2024).
  58. Lund, B.; Wang, T. Chatting about ChatGPT: how may AI and GPT impact academia and libraries? Library Hi Tech News 2023, 40, 26–29. [Google Scholar] [CrossRef]
  59. Roumeliotis, K.I.; Tselikas, N.D. ChatGPT and Open-AI Models: A Preliminary Review. Future Internet 2023, 15, 192. [Google Scholar] [CrossRef]
  60. Vaswani, A.; Shazeer, N.M.; Parmar, N.; Uszkoreit, J.; Jones, L.; Gomez, A.N.; Kaiser, L.; Polosukhin, I. Attention is All you Need. In Proceedings of the 31st International Conference on Neural Information Processing Systems (NIPS'17), Long Beach, CA, USA, 4-9 December 2017; pp. 6000–6010. [Google Scholar]
  61. Ambartsoumian, A.; Popowich, F. Self-attention: A better building block for sentiment analysis neural network classifiers. In Proceedings of the 9th Workshop on Computational Approaches to Subjectivity, Sentiment and Social Media Analysis, Brussels, Belgium, 31 October 2018; pp. 130–139. [Google Scholar]
  62. Bahdanau, D.; Cho, K.; Bengio, Y. Neural Machine Translation by Jointly Learning to Align and Translate. In Proceedings of the 3rd International Conference on Learning Representations (ICLR 2015), San Diego, CA, USA, 7-9 May 2015. [Google Scholar] [CrossRef]
  63. OpenAI - API reference introduction. Available online: https://platform.openai.com/docs/api-reference/introduction (accessed on 5 March 2024).
  64. Lee, D.D.; Seung, H. S. Learning the parts of objects by non-negative matrix factorization. Nature 1999, 401, 788–791. [Google Scholar] [CrossRef] [PubMed]
  65. Carbonetto, P.; Sarkar, A.K.; Wang, Z.; Stephens, M. Non-negative matrix factorization algorithms greatly improve topic model fits. Machine Learning 2021. [Google Scholar] [CrossRef]
  66. Purpura, A. Non-negative Matrix Factorization for Topic Modeling. In Proceedings of the Biennial Conference on Design of Experimental Search & Information Retrieval Systems, Bertinoro, Italy, 28-31 August 2018. [Google Scholar]
  67. Blei, D.M.; Ng, A.Y.; Jordan, M.I. Latent dirichlet allocation. Journal of Machine Learning Research 2003, 3, 993–1022. [Google Scholar]
  68. Ostrowski, D. Using latent dirichlet allocation for topic modelling in twitter. In Proceedings of the 2015 IEEE 9th International Conference on Semantic Computing, Anaheim, CA, USA, 7-9 February 2015; pp. 493–497. [Google Scholar] [CrossRef]
  69. Christy, A.; Praveena, A.; Shabu, J. A Hybrid Model for Topic Modeling Using Latent Dirichlet Allocation and Feature Selection Method. Journal of Computational and Theoretical Nanoscience 2019, 16, 3367–3371. [Google Scholar] [CrossRef]
  70. Muchene, L; Safari, W. (2021). Two-stage topic modelling of scientific publications: A case study of University of Nairobi, Kenya. PLoS One 2021, 16, e0243208. [CrossRef]
  71. Teh, Y.; Jordan, M.; Beal, M.; Blei, D. Hierarchical Dirichlet processes. Journal of the American Statistical Association 2006, 101, 1566–1581. [Google Scholar] [CrossRef]
  72. Zhang, M.; He, T.; Li, F.; Peng, L. Incorporating Hierarchical Dirichlet Process into Tag Topic Model. Chinese Lexical Semantics 2013, 8229, 368–377. [Google Scholar] [CrossRef]
  73. Dai, A; Storkey, A. The Supervised Hierarchical Dirichlet Process. IEEE Transactions on Pattern Analysis and Machine Intelligence 2015, 37, 243–255. [Google Scholar] [CrossRef]
  74. Fan, W.; Bouguila, N. Online Data Clustering Using Variational Learning of a Hierarchical Dirichlet Process Mixture of Dirichlet Distributions. In Proceedings of the 19th International Conference, DASFAA 2014, International Workshops: BDMA, DaMEN, SIM³, UnCrowd, Bali, Indonesia, 21-24 April 2014; pp. 18–32. [Google Scholar] [CrossRef]
  75. Deerwester, S.; Dumais, S.T.; Furnas, G.W.; Landauer, T.K.; Harshman, R. Indexing by latent semantic analysis. Journal of the American Society for Information Science 1990, 41, 391–407. [Google Scholar] [CrossRef]
  76. Valdez, D.; Pickett, A.C.; Goodson, P. Topic Modeling: Latent Semantic Analysis for the Social Sciences. Social Science Quarterly 2018, 99, 1665–1679. [Google Scholar] [CrossRef]
  77. Gupta, I.; Chatterjee, I.; Gupta, N. Latent Semantic Analysis based Real-world Application of Topic Modeling: A Review Study. In Proceedings of the 2022 Second International Conference on Artificial Intelligence and Smart Energy (ICAIS), Coimbatore, India, 23-25 February 2022; pp. 1142–1149. [Google Scholar] [CrossRef]
  78. Alghamdi, R.; Alfalqi, K. A Survey of Topic Modeling in Text Mining. International Journal of Advanced Computer Science and Applications 2015, 6, 147–153. [Google Scholar] [CrossRef]
  79. Glass, R.; Vessey, I. Contemporary application-domain taxonomies. IEEE Software 1995, 12, 63–76. [Google Scholar]
  80. Miller, J.; Roth, A. A taxonomy of manufacturing strategies. Management Science 1994, 40, 285–304. [Google Scholar]
  81. Bailey, K. Typologies and Taxonomies – An Introduction to Classification Techniques; Sage: Thousand Oaks, CA, USA, 1994. [Google Scholar]
  82. Devlin, J.; Chang, M.; Lee, K.; Toutanova, K. BERT: Pre-training of Deep Bidirectional Transformers for Language Understanding. In Proceedings of the North American Chapter of the Association for Computational Linguistics: Human Language Technologies, Minneapolis, MN, USA, 2-7 June 2019; Volume 1, pp. 4171–4186. [Google Scholar] [CrossRef]
  83. Gunawan, D.; Sembiring, C.A.; Budiman, M.A. The implementation of cosine similarity to calculate text relevance between two documents. Journal of Physics: Conference Series 2018, 978, 012120. [Google Scholar] [CrossRef]
  84. Li, B.; Han, L. Distance weighted cosine similarity measure for text classification. In Proceedings of the Intelligent Data Engineering and Automated Learning–IDEAL 2013: 14th International Conference, Hefei, China, 20-23 October 2013; pp. 611–618. [Google Scholar] [CrossRef]
  85. Muflikhah, L.; Baharudin, B. Document clustering using concept space and cosine similarity measurement. In Proceedings of the 2009 International Conference on Computer Technology and Development, Kota Kinabalu, Malaysia, 13-15 November 2009; Volume 1, pp. 58–62. [Google Scholar] [CrossRef]
Figure 1. Taxonomy development high-level process schema adapted from Nickerson et al. [52].
Preprints 150450 g001
Table 1. Ending conditions of taxonomy development, adapted from Nickerson et al. [52].
Ending condition Explanation Subjective/Objective
All objects have been classified Every object under consideration is classified into one and only one characteristic for each dimension. Objective
No new dimensions or characteristics emerge In recent iterations, no new dimensions or characteristics have emerged. This indicates that the taxonomy has reached a point of saturation and further iterations are unlikely to add value. Objective
At least one object is classified under every characteristic of every dimension For every dimension in taxonomy, each characteristic must have at least one object that can be placed under that characteristic. Objective
Dimensions are mutually exclusive and collectively exhaustive The dimensions in the taxonomy do not overlap and together they account for all the possibilities within the scope of the meta-characteristic. Objective
All dimensions and characteristics are unique Each dimension and characteristic must be distinct from one another to ensure the clarity and utility of the taxonomy. Objective
Conciseness The taxonomy should not be overly complex. It should be as simple as possible while still fulfilling its purpose. Overly detailed taxonomies might be difficult to use and understand. Subjective
Usefulness The taxonomy should provide value for the intended purpose. Subjective
Comprehensiveness The taxonomy should be complete in the sense that it includes all necessary dimensions and characteristics that are important for the classification. Subjective
Extendibility The taxonomy should be designed so that it can be expanded to accommodate new categories or characteristics that may arise as the field evolves. Subjective
Explanatory power The taxonomy should clearly show the relationships between the different dimensions and characteristics. It should help users see how one category relates to another, and why certain objects are grouped together. Subjective
Table 2. Key actions and outcomes of the first iteration of taxonomy development.
Step Action Outcome
3ec Approach: empirical-to-conceptual Base taxonomy on existing classifications.
4ec Defined OGD use approaches Identified 4 types of use: Everyday use, Long-term use, Direct use, Indirect use.
5ec Classified impact areas Grouped into 4 broad dimensions: Governmental, Social, Environmental, Economic
6ec Created taxonomy matrix Mapped 13 thematic areas to dimensions (see Table 3)
7 Evaluated taxonomy Found lack of granularity, prompting machine learning integration
Table 3. Data Europa use case sectors used in mapping to four broad dimensions of OGD impact.
# Use case sector Abbreviation
1 Agriculture, Fisheries, Forestry & Foods AFF
2 Economy & Finance EFI
3 Education, Culture & Sport ECS
4 Energy ENR
5 Environment ENV
6 Government & Public Sector GPS
7 Health HLT
8 International Issues IIS
9 Justice, Legal System & Public Safety JLP
10 Population & Society PSO
11 Regions & Cities RCI
12 Science & Technology STE
13 Transport TRS
Table 4. Taxonomy draft of OGD impact areas after Iteration 1.
Initiative focus Governmental Social Environmental Economic
GPS RCI IIS ECS HLT PSO JLP AFF ENR ENV EFI STE TRS
Everyday use x x x x x x x x x x x x
Longterm use x x x x x x x x x x x x x
Direct use x x x x x x x x x x x x
Indirect use x x x x x x x x
Table 5. Key actions and outcomes of the second iteration of taxonomy development.
Step Action Outcome
3ec Approach: empirical-to-conceptual Extend taxonomy based on findings derived from GPT topic modelling.
4ec Expanded OGD use approaches Added Collaborative and Individual use
5ec GPT-based topic modeling Extracted 210 unique keywords from OGD use cases
6ec Grouped keywords into impact dimensions Identified 7 refined dimensions (see Table 6) based on hierarchical clustering
New dimensions and approaches were integrated in existing taxonomy
7 Evaluated taxonomy Some terms were too abstract, requiring additional refinement using multiple topic modeling techniques
Table 6. Refined dimensions with corresponding subdimensions identified by GPT-based topic modelling.
# Dimension Subcategories
1 Society Community, Public governance, Social justice
2 Health Public health, Wellness
3 Infrastructure Transport, Urban development
4 Education Skill development, Knowledge dissemination
5 Innovation Technology, Research, Sustainability
6 Governance Policy, Public spending, Crisis management
7 Environment Climate action, Pollution, Sustainability
Table 7. Key actions and outcomes of the third iteration of taxonomy development.
Step Action Outcome
3ec Approach: empirical-to-conceptual Extend taxonomy based on findings derived from other topic modelling techniques
4ec Kept existing use approaches No new ways of use were identified
5ec Topic modeling We used NMF, LDA, HDP, LSA and extracted 453 additional unique keywords from OGD use cases
6ec Merged and refined categories Many terms overlapped, some merged, some removed
7 Evaluated taxonomy Found no new dimensions or subdimensions, only new characteristics.Confirming taxonomy structure
Table 8. Comparison of topic modelling techniques used in this research (strengths and weaknesses).
Technique Strength Weakness
Generative Pre-trained Transformer (GPT) Broad contextual awareness and ability to recognize high-level themes from textual data Generated abstract terms, some lacking specific real-world relevance
Non-negative Matrix Factorization (NMF) Clear topic separation, effectively distinguishing different thematic clusters in the dataset Required manual tuning of parameters, and results varied depending on preprocessing steps
Latent Dirichlet Allocation (LDA) Probabilistic topic assignment allowed for identification of nuanced topics across multiple documents Lacked coherence in some topic groupings
Hierarchical Dirichlet Process (HDP) Adapted dynamically to the data, allowing for a flexible number of topics instead of requiring a predefined topic count Less control over output, making it harder to fine-tune and interpret results
Latent Semantic Analysis (LSA) Found latent relationships between words, improving identification of synonyms and related concepts Required dimensionality reduction, which sometimes led to loss of meaningful information
Table 10. Taxonomy draft of OGD impact areas after Iteration 2, 3 and 4.
Initiative focus Everyday use Longterm use Direct use Indirect use Collaborat. use Individual use
Society
Community dynamics
  Community x x x x x
  Participation x x x x x
  Civic engagement x x x
  Culture x x x x
Public services
Social justice
  Cohesion x x x x
  Justice x x x
  Inequality x x x
  Homelessness x x x x
  Poverty x x x
  Gender equality x x x
Health
Public health
  Health x x x x
  Sanitation x x x
  Food x x x x
  Public health services x x x x
Wellness
  Healthy lifestyle x x x x
  Well-being x x x x x
Infrastructure
Transportation systems
  Transport x x x x
  Public transport x x x x
  Parking x x x
  Cycling x x x
  Urbanism x x x x
Urban development
  Engineering x x
  Infrastructure x x
  Logistics x x
  City information x x x x
  Energy x x x x
Education
Skill development
  Education x x x x
  Data literacy x x x x
  Science x x x
  Technology x x x
Knowledge dissemination
  History x x x
  Trends x x x
  Journalism x x x
  Statistics x x x
  Research x x x
Innovation
Technology and research
  Innovation x x x x x
  Technology innovation x x x
  Industrial innovation x x x
  Engineering x x x
  Data science x x x
  Geospatial science x x x x
Sustainability
Governance
Public governance
  Government x x x
  Policy x x x
  Transparency x x x
  Public spending x x x
  Consulting x x x
  Politics x x x
Crisis management
  Crisis x x x x
  Natural disasters x x x
  Economic crises x x x
  Public health emergencies x x x
Environment
  Pollution x x x x
  Climate action x x x
  Environmental sustainability x x x
  Agriculture x x x x
Table 11. Final taxonomy of OGD impact areas with taxon's description.
Taxons Description Level
Society 1
Community dynamics 2
  Community Refers to the people, groups, and organizations in a particular area or interest, focusing on their interaction and relationships. 3
  Participation The active involvement of individuals in community activities, decision-making, or civic processes. 3
  Civic engagement Activities that connect individuals with public life and governance, such as voting, volunteering, or advocacy. 3
  Culture The shared values, customs, beliefs, and practices within a community that shape collective identity. 3
Public services Services provided by the government for the welfare of the public, such as healthcare, education, and sanitation. 2
Social justice 2
  Cohesion The strength and unity of a society, ensuring members feel part of the community. 3
  Justice The fair and impartial treatment of individuals, ensuring equity in laws and social systems. 3
  Inequality The disparities and unequal distribution of resources, rights, and opportunities in society. 3
  Homelessness The issue of individuals lacking permanent housing and the societal response to this problem. 3
  Poverty The condition where individuals or groups lack the financial resources to meet basic needs. 3
  Gender equality The fair treatment and equal opportunities for all genders. 3
Health 1
Public health 2
  Health The overall state of physical, mental, and social well-being of individuals and populations. 3
  Sanitation Measures to promote hygiene and prevent disease through clean water, waste disposal, etc. 3
  Food Access to nutritious food and addressing food security in the population. 3
  Public health services Health services provided or regulated by the government for public benefit. 3
Wellness 2
  Healthy lifestyle Practices that promote physical, mental, and emotional well-being. 3
  Well-being A broader concept encompassing quality of life, including happiness, health, and life satisfaction. 3
  Infrastructure 1
Transportation systems 2
  Transport General movement of goods and people, including roads, railways, and other means. 3
  Public transport Publicly accessible transport services like buses, trains, subways, etc. 3
  Parking Infrastructure related to vehicle parking and its availability in urban environments. 3
  Cycling Bicycle transportation, infrastructure, and the promotion of cycling as a mode of transport. 3
Urban development 2
  Engineering The application of science and technology in designing and building infrastructure. 3
  Infrastructure The fundamental facilities and systems serving a city or country, including transport, utilities, and buildings. 3
  Logistics The coordination and movement of resources, goods, and people. 3
  City information Systems and technologies providing information and services to urban residents. 3
  Energy Energy production, distribution, and sustainability in cities. 3
  Education 1
Skill development 2
  Education Formal and informal teaching and learning processes. 3
  Data literacy The ability to understand, interpret, and use data in various contexts. 3
  Science Scientific education and research, promoting the understanding of natural and social sciences. 3
  Technology Teaching and learning related to technological innovations and applications. 3
Knowledge dissemination 2
  History The study and sharing of past events and historical information. 3
  Trends Analyzing current and emerging trends in various fields for educational purposes. 3
  Journalism The profession and practice of reporting and disseminating news and information. 3
  Statistics The science of collecting, analyzing, and interpreting data. 3
  Research Systematic investigation to establish facts, theories, or new knowledge. 3
  Innovation 1
Technology and research 2
  Other Innovation The development and application of new ideas, methods, or technologies in fields not explicitly classified. 3
  Technology innovation Advancements in technology aimed at improving systems, products, or services. 3
  Industrial innovation Innovation within the manufacturing and industrial sectors. 3
  Engineering innovation Applying scientific and technical knowledge to innovate and improve infrastructure and technology. 3
  Data science The application of data-driven techniques to extract insights and foster innovation. 3
  Geospatial science Using technologies like GIS and remote sensing to collect, analyze, and interpret spatial data. 3
Sustainability Practices and policies designed to maintain long-term environmental, social, and economic well-being. 2
  Governance 1
Public governance 2
  Government The institution responsible for creating and enforcing laws and policies. 3
  Policy The principles and strategies used by the government to govern public affairs. 3
  Transparency Openness and accountability in governance to ensure public trust. 3
  Public spending Allocation of public funds to various sectors like education, healthcare, etc. 3
  Consulting Advisory services for government and public institutions to improve efficiency. 3
  Politics The activities and decisions related to governance, power, and public administration. 3
Crisis management 2
  Crisis Managing and responding to critical situations affecting public safety or well-being. 3
  Natural disasters Strategies for preparing for and responding to environmental crises like floods, earthquakes, etc. 3
  Economic crises Addressing financial downturns and maintaining economic stability. 3
  Public health emergencies Responding to large-scale health crises, such as pandemics. 3
  Environment 1
Pollution The contamination of air, water, and land due to human activity and its impact on health and ecosystems. 2
Climate action Efforts to reduce or mitigate the effects of climate change through policy and technological innovation. 2
Environmental sustainability Practices aimed at balancing economic growth with the preservation of natural resources. 2
Agriculture Sustainable farming practices and the management of natural resources in food production. 2
Disclaimer/Publisher’s Note: The statements, opinions and data contained in all publications are solely those of the individual author(s) and contributor(s) and not of MDPI and/or the editor(s). MDPI and/or the editor(s) disclaim responsibility for any injury to people or property resulting from any ideas, methods, instructions or products referred to in the content.
Copyright: This open access article is published under a Creative Commons CC BY 4.0 license, which permit the free download, distribution, and reuse, provided that the author and preprint are cited in any reuse.
Prerpints.org logo

Preprints.org is a free preprint server supported by MDPI in Basel, Switzerland.

Subscribe

Disclaimer

Terms of Use

Privacy Policy

Privacy Settings

© 2025 MDPI (Basel, Switzerland) unless otherwise stated