
Submitted:
24 February 2025
Posted:
25 February 2025
You are already at the latest version
Abstract
Background: Asthma designates the most widely spread chronic disease in children. Toll-like receptors (TLRs) are linked to several human diseases including allergic diseases. We aimed to verify the linkage of TLR9 and TLR10 gene polymorphisms with bronchial asthma control and cardiac function. Methods: this a case-control study comprised 80 participants aged between 5 and 12 years old, divided into 20 healthy non-asthmatic participants and 60 asthmatic ones. The asthmatic group members were diagnosed clinically and subdivided by spirometry into three subgroups (well-controlled, partially-controlled, and uncontrolled). Diagnosis of bronchial asthma based on The Global Initiative for Asthma (GINA) guidelines, 2022. Genetic polymorphisms in TLR9 and TLR10 were detected using real-time PCR. Results: We discovered a significant statistical relation between TLR9 gene polymorphisms and PFTs with better results in CC genotype also a significant statistical relation with both RVFWSL (right ventricle free wall longitudinal strain) and GLS A2C (left ventricle global longitudinal strain apical 2-champer view) with better values were associated with CC genotype. Regarding TLR10, there was a significant statistical relation between gene polymorphisms and PFTs with better function in GG genotype and also there was a significant statistical relation between TLR10 gene polymorphisms and GLS AVG (left ventricle global longitudinal strain average) with GG type having significantly better cardiac function. Conclusion: Subclinical cardiac dysfunction of Left and Right ventricles was detected in asthmatic children. CC genotype of TLR9 and GG genotype of TLR10 are associated with better asthma control and better cardiac function. So TLR9 and TLR10 have role in asthma control and cardiac dysfunction.
Keywords:
Toll-like Receptors
; Childhood
; Bronchial Asthma
; Cardiac Function
1. Introduction
The most common chronic illness affecting children is asthma, which puts a persistent stress on the healthcare system. Recently, the occurrence of asthma symptoms in children and adolescents has increased worldwide, especially in Low-Middle Income Countries (LMICs). It places a heavy load on people and the community over the course of their lives [1].
The available information indicates that asthma is a multifaceted illness, and its development is progressively more linked to interplay of genetic susceptibility, environmental factors, and host factors [2]. Furthermore, a thorough understanding of the immunology of this condition can substantially help all asthma sufferers receive personalized, targeted treatment [3].
The initial line of defense against germs is made up of a family of receptors called toll-like receptors (TLRs). They are essential in bridging innate and adaptive immunity because they can detect both external pathogens and internal danger chemicals generated by injured or dying cells [4]. TLRs are widely distributed in the respiratory tract epithelium, where they help to activate immunological responses. Principally, the function of some TLRs during inflammation has raised the possibility that they have a role in the pathophysiology of asthma [5].
Several mechanisms can explain the impact of chronic lung diseases on the heart including recurrent hypoxemia, the release of inflammatory mediators, changes in the pulmonary vasculature, and increased intra-thoracic pressure. These mechanisms directly affect the right ventricle via increasing the pulmonary artery pressure. Left ventricular dysfunction was also reported with chronic lung diseases secondary to changes in the interaction between the right and left ventricles and changes in the ventricular preload and afterload [6].
Therefore, we intended to verify the relation between TLR9 and TLR10 gene polymorphisms and asthma control and the effect of asthma and genes polymorphism on cardiac function of left and right ventricle by a new model of echocardiography (speckle tracking method) to detect subclinical cardiac dysfunction if present.
2. Patients and Method
This case-control study was done at the Pulmonology Unit, Pediatric Department, Zagazig University Children Hospital in co-operation with Echocardiography Unit of Pediatric Department, Zagazig University Children Hospital and the Scientific and Medical Research Center of the Faculty of Medicine, Zagazig University over a period of 35 months between December 2019 and October 2022.
2.1. Sample Size
The sample size was calculated using G power 3.1.9.7 according to the following large expected effect size between asthmatic group and control group in frequency of TLR 10 polymorphism (d=0.5), CI 95%, power 80% and allocation ratio 3:1 so the sample size was calculated to be at least 56 cases 14 in each group.
2.2. Participant Groups Involved in the Study
- The asthma group:
This study encompassed 60 asthmatic children. This group was divided into 3 subgroups according to GINA guidelines 2023[7] for asthma control into:
1-well controlled group included 20 children.
2-partially controlled group included 20 children.
3-uncontrolled group included 20 children
2.3. Inclusion Criteria
Aged between 5 and 12 years diagnosed as bronchial asthma based on The Global Initiative for Asthma (GINA) diagnosis guidelines, 2023[7].
2.4. Exclusion Criteria
Patients outside the age group, asthmatic patients with clinical impairment other than asthma (e.g. congenital heart diseases, congenital pulmonary diseases, chronic lung, heart or kidney diseases, endocrinal or congenital or acquired immune deficiency diseases).
- The control group:
It involved twenty healthy children; these participants were specifically chosen based on the absence of any indications of bronchial asthma, other pulmonary diseases, allergy or atopy.
2.5. Operational Design
-All patients involved in the study underwent the following: 1- Demographic data such as (socio-economic status, age, sex) 2- Full medical history focusing on Family history of asthma and other atopic diseases, when symptoms first appeared, frequency of day time symptoms, frequency of night awakening from exacerbations, effect on normal activities including school attendance, types and route of drugs used, and previous hospital admissions. 3- Careful clinical examination: including general examination anthropometric measurements, local pulmonary examination, and other systems examination to exclude other chronic diseases. 4- Laboratory investigations: complete blood counting, liver function testing, kidney function testing, and C-reactive protein measuring were done. 5- Identification of TLR9 and TLR10 gene polymorphism [8]: Real-time PCR was used. Each participant had two ml of venous blood drawn into sterile EDTA-containing tubes under strict aseptic conditions. To extract DNA, samples were kept at -20 °C or below. Following the manufacturer's guidelines, the Gene JETTM whole blood genomic DNA purification mini kit (Thermo Scientific,USA) was employed to extract DNA from entire blood. The extracted DNA was then kept at -20°C for a genotyping test [9]. The DNA concentration in each sample was performed using Nanodrop spectrophotometer (Thermo Scientific, USA). Genotyping of TLR9 (rs 187084 T/C) and TLR10 (rs11096956 T/G) SNPs: The real-time PCR thermal cycler (Applied Biosystems, USA) was used to identify the SNPs. Using TaqManTM genotyping master mix (Thermo Scientific, USA) and TaqMan Genotyping assays for TLR9 (rs 187084) and TLR10 (rs 11096956) (Thermo Scientific, USA), a total reaction volume of 20 μL encompassing 10 μL TaqManTM genotyping master mix, 1 μL SNP genotyping assay, and 20 ng genomic DNA diluted with DNA/RNA free water to 9 μL., with the following cycling conditions; 10-minute polymerase activation at 95°C followed by 40 cycles that includes 15-second denaturation step at 95°C and annealing/extension at 60°C for 1 minute.
2.6. Pulmonary Function Testing
Using the Jaeger Master Screen TM IOS, version 5.2 produced by VIASYS Health care GmbH, Hoechberg, Germany, under standard conditions, and in accordance with the manufacturer's instructions, this was carried out at our pulmonology unit. FVC, and FEV1 were all tested using the standardized criteria [10].
2.7. Conventional Echocardiography and Two-Dimensional Speckle-Tracking Analysis (Transthoracic)
To perform echocardiography, a 3,5-MHz phased array transducer (Philips EPIQ CVx) was utilized following the guidelines of the American Society of Echocardiography. Apical, subcostal, and parasternal views were obtained.
2.8. Statistical Analysis
The data were analyzed by Statistical Package for Social Science (SPSS); version 26 where qualitative data were presented as frequencies and percentages. For quantitative variables, mean, standard deviation (SD), and (minimum-maximum), Chi square (χ2) with Yate’s correction and one way ANOVA with post hoc Tukey test were employed Also, Person correlation coefficient was determined to evaluate the relationship between various study variables, The results were considered significant statistically and highly significant statistically when the significant probability (P value) was < 0.05 and <0.001 respectively.
3. Results
The current study showed no significant statistical differences in age and sex, weight, height, and body mass index among the four groups under investigation. However, the studied groups differ significantly in terms of family history, as 75% of the uncontrolled patients revealed positive family history whereas all control participants exhibited no positive family history (Table 1). The investigated groups revealed significant statistical difference (P<0.05) concerning eosinophilic count with all asthmatic groups were significantly elevated than controls (Figure 1).
A statistically significant positive association was observed between respiratory function (FEV1) and various parameters including global longitudinal strain apical 4-chamber view (GLS A4C), left ventricular global longitudinal strain apical 2-chamber view (GLS A2C), left ventricular global longitudinal strain apical 3-chamber view (GLS A3C) & left ventricular global longitudinal strain average (GLS AVG), right ventricle free wall longitudinal strain (RVFWSL), and right ventricle four-chamber strain (RV4CSL). Furthermore, a significant positive association was found between respiratory function (FEV1) and tricuspid annular plane systolic excursion (TAPSE). Significant statistical positive associations were observed among respiratory function (FVC) and the following parameters: GLS A2C, RV4CSL and RVFWSL. Respiratory function (FVC) exhibited a positive correlation with fractional shortening (FS) (Figure 2).
Table 2 shows that there was no statistically significant difference between the four studied groups regarding EF (P =0.41) and FS (P= 0.20) While there was statistically significant difference between the four studied groups regarding each of pulmonary artery systolic pressure (PASP) (p= 0.049) with the highest mean value reported in the uncontrolled asthma group, and tricuspid annular plane systolic excursion (TAPSE) (P=0.002) with the highest mean values reported in control group. In addition, there was statistically significant difference between the four studied groups regarding right ventricular Echocardiographic measurements (RVFWSL (p <0.001) and RV4CSL (p <0.001) with the best measures reported in control group and well controlled asthmatic patients. There was statistically significant difference between studied groups regarding GLSA4C (p=0.007), GLSA2C (p<0.001), GLSA3C (p<0.001) and GLSAVG (p<0.001) with significantly best level was reported in control group and well controlled asthmatic patients.
The studied groups revealed statistically significant differences concerning TLR9 polymorphism, as T allele and TT genotype were significantly detected among uncontrolled and partially controlled cases. While C allele and CC genotype were equally detected in normal control and controlled groups (Table 3).
Also, regarding TLR10 polymorphism, T allele and TT genotype were significantly detected among uncontrolled and partially controlled cases while G allele and GG genotype were significantly detected in normal control and controlled group with no difference between well controlled and control group (Table 4).
Table 5 shows that in TLR 9 there was a statistical significance increase in frequency of CT & TT genotype among cases compared to control group (OR=9.09 & 5.24 respectively) and also in T allele (OR=3.23). TLR 10 showed that there was a statistical significance increase in frequency of GT & TT genotype among cases compared to control group (OR=4.29 & 10.71 respectively) and also in T allele (OR=4.64).
There was significant statistical relation between TLR 9 gene polymorphism and respiratory function FEV1% (p= 0.013) & FVC% (p=0.004) as patients having CC genotype had significantly better respiratory function (Table 6).
No significant statistical association was found between TLR9 gene polymorphism and conventional cardiac functions, but there was significant statistical relation between TLR9 gene polymorphism and both RVFWSL (p=0.02) and GLS A2C (p =0.024) with better values were associated with CC genotype (Table 7).
There was significant statistical relation between TLR10 gene polymorphism and respiratory function FEV1% (p =0.047) & FVC% (p =0.04) with GG type had significantly better respiratory function than TT genotype (Table 8).
There was no significant statistical relation between TLR10 gene polymorphism and conventional cardiac functions, also there was no significant statistical relation between TLR10 gene polymorphism and cardiac functions except GLS AVG (p=0.042) which was statistically significant relation with GG type had significantly better cardiac function (Table 9).
4. Discussion
Asthma is a disease of many factors. The lack of consistent replication of genetic connections across different studies highlights the intricate interplay between various environmental and genetic aspects that contribute to the development of this condition [11].
Currently, ten functioning human TLRs (TLRs 1-10) have been identified and their canonical adaptors' pathways in a variety of human disorders, such as allergy diseases, are linked to them [12].
The new points of our study which have not been discussed in any study before, are the relation of TLR9 and TLR10 polymorphisms and subclinical cardiac dysfunction in asthmatic patient.
Our study revealed that both groups (asthmatics and controls) are closely matched as regards their age and sex with no significant statistical differences among the investigated groups (p values were 0.321and 0.656 respectively). This can be explained by the fact that, the cases were recruited first, and then another non-asthmatic unrelated non allergic age and gender matched control group with similar ethnicity was randomly chosen later on.
In our study, we found a distinction among asthmatic children and children of the control group concerning family history. Most of asthmatic patients a confirmed familial predisposition to asthma. Our findings align with previous studies conducted by Hernandez et al. [13], Yu et al. [14], and Guo et al. [15]. These studies reported no significant statistical differences among the groups under study as regards age and gender. However, in these studies, significant differences were found among the investigated groups in terms of family history.
Regarding anthropometric measures, our results showed no significant difference between asthmatic children and control children concerning body mass index (BMI). In line with our findings, Yalçın et al. [16] and Ardura-Garcia et al. [17] indicated no significant differences in BMI among the examined groups.
On the other hand, several studies have found a significant association between BMI and asthma. An Egyptian study conducted by Al-Qerem and Ling [18] on children aged 7-12 years showed a positive association between asthma and increased BMI and comparable findings were documented by Nahhas et al. [19] in Saudi children.
The current study found a highly statistically significant difference regarding eosinophilic count, with all asthmatic groups exhibiting considerably higher values compared to the controls. This finding agreed with those results obtained by Hassane et al. [20] study that found highly statistically significant high eosinophilic count in asthmatic children compared to the control group.
In our study, by using conventional echocardiography for assessment of cardiac function of asthmatic patients and control group, we found a significant difference between them regarding TAPSE. This result agreed with the results obtained by Betül et al. [21] and Özkan et al. [22] who found a significant difference between asthmatics and control group regarding TAPSE with the highest mean values reported in control group. On the other hand, no significant difference in TAPSE between asthmatics and control group was reported by other studies [23,24]. This difference in results may be related to the difference in the duration and severity of asthma among studied populations.
Moreover, our study revealed that there was statistically significant difference between asthmatics and control group regarding pulmonary artery systolic pressure (PASP) being higher in asthmatics. Karasu et al. [25], Manti et al. [26] and De-Paula et al. [27] reported similar results to our study regarding PASP as they found PASP higher in asthmatics. This can be explained by recurrent hypoxemia and hypercapnia related to different cytokines and mediators associated with chronic inflammation of the airways in patients with asthma that lead to pulmonary vasoconstriction and pulmonary hypertension development [6].
On the other hand, by using speckle tracking technique, our study revealed that there was statistically significant difference between asthmatic group and control group regarding RV4CSL and RVFWSL with the best measures were reported in control group.
Moreover, there was statistically significant positive correlation between respiratory function (FEV1 & FVC) and RV4CSL and RVFWSL. It was noted that with decreased pulmonary function, there is a decrease in global longitudinal and free wall strain of RT ventricle. These results coincide with those found by Tuleta et al.[28] reported reduced longitudinal strain values of right ventricle in asthmatic group in comparison to non-asthmatic controls. The same results were obtained by Baystal and Has [29] who conducted on adult asthmatic patients in comparison to control group.
On the other hand, the study of Abdelmohsen et al. [23] performed on 30 children with mild to moderate asthma, found no significant difference between asthmatic group and control group as regards right ventricle strain pattern. These differences can be attributed to small sample size and the focus of their study on patients with mild to moderate asthma.
Regarding LV systolic functions detected by conventional echocardiography, our study revealed that ejection fraction (EF) and fractional shortening (FS) was preserved in the asthmatic group. This coincides with the results obtained by Abdelmohsen et al. [23] and Ozdemir et al. [30] regarding EF.
By speckle tracking echocardiography, we detected statistically significant difference between the four studied groups as regards left ventricle longitudinal strain with the best measures were reported in control group.
Our results were similar to these of Tuleta et al. [28] stated reduced LV longitudinal strain in patients with severe and mild to moderate asthma.
On the other hand, Bystal and Has [29] and Abdelmohsen et al. [23] reported no left ventricular stain pattern in asthmatic patient. This can be due to the fact that their study focused on patients with mild asthma. Moreover, we investigated TLR9 (rs 187084) and TLR10 (rs 11096956) gene polymorphisms and their association with asthma.
In our study, we found that there was statistically significant difference between the studied groups regarding TLR9 polymorphism with TT genotype and T allele were associated with uncontrolled (55%) and partially controlled cases (35%). While CC genotype and C allele were significantly detected in normal control (67.5%) and controlled group (55%) with no difference between well controlled and control group. Our data showed statistically significant relation between TLR9 gene polymorphism and respiratory function with CC genotype had significantly better respiratory function. This coincides with results of Tesse et al. [31] reported an association between TLR9 (rs 187084) and asthma. Also, Kormann et al. [32] evaluated assumed functional genetic variants in all 10 human TLR genes including TLR9 for their relation to different asthma phenotypes in a case-control study, revealed that TLR9 rs 187084 was associated with asthma with a p value of 0.03.
Moreover, our data revealed that there was statistically significant relation between TLR10 gene polymorphism and respiratory function with GG type having significantly better respiratory function than TT genotype. This agrees with the results obtained by Tesse et al. [31] found a significant association between TLR10 gene polymorphism and asthma. However, Klaassen et al. [33] carried a systematic review of TLRs and CD14 in relation to asthma in Caucasian children found no association with bronchial asthma.
Puthothu and Heinzmann [34] who involved 322 asthmatic children and 270 randomly selected controls to assess whether TLR 6 or TLR10 involved in asthma genetics or both, found no individual association of TLR10 rs11096956 with bronchial asthma.
The degree of association of polymorphisms with asthma varies between different populations and sometimes in the same population depending on environmental factors, genetics, sex differences, age of studied patients, study methodologies and differences in the number of subjects [35].
Strengths, Limitations
This study represents the first attempt to examine the association between TLR gene polymorphisms, asthma control, and cardiac function, particularly in Egyptian children. It focused on TLR-9 and TLR-10 polymorphisms, prioritizing common variants due to resource limitations. Future research could expand to include rarer polymorphisms. Furthermore, although statistically adequate, the sample size could have been larger and more proper for relationships within subgroups. Additionally, a more detailed evaluation of asthma treatments and patient history is recommended, as these factors were not comprehensively documented in the current study. Cardiac parameters, which may vary with age, gender, or body size, showed no significant differences in this investigation; however, future studies might benefit from employing more refined metrics.
5. Conclusions
Subclinical cardiac dysfunction of Left and Right ventricles was detected in asthmatic children. CC genotype of TLR9 and GG genotype of TLR10 are associated with better asthma control and better cardiac function. So, we conclude that studying TLR9 and TLR10 polymorphisms can be of value in prediction of bronchial asthma control in asthmatic patients and cardiac dysfunction.
Author Contributions
Conceptualization, R.R., A.H., H. A. and M. N.; Data curation, A. H., H N., D. E. and H. A.; Formal analysis, H.N., D. E. and H. A.; Investigation, H. A., S.S. and M. N.; Methodology, R. R., A. H., S. S., H. N., D. E., H. A. and M. N.; Resources, A.H., H. A.and M. N.; Supervision, H. A. and S. S.; Validation, H. N., D.E., H. A. and M. N.; Writing – original draft, R. R., A. H., H. A., S. S. and M. N.; Writing – review & editing, R. R., A. H., H. A., S. S., H., D. El. and H. A.
Funding
The authors declare that financial support was sponsored by Princess Nourah bint Abdulrahman University, researchers supporting project number (PNURSP2025R347), Princess Nourah bint Abdulrahman University Riyadh, Saudi Arabia.
Data Availability Statement
The datasets used and analyzed during the current study are available from the corresponding author on reasonable request.
Acknowledgments
The authors are grateful to all the participants for their cooperation and to Princess Nourah bint Abdulrahman University, researchers supporting project number (PNURSP2025R347), Princess Nourah bint Abdulrahman University, Riyadh, Saudi Arabia.
Conflicts of Interest
The authors declare no conflict of interest.
References
- Al-Gewely, M.S.; El-Hosseiny, M.; Abou Elezz, N.F.; El-Ghoneimy, D.H.; Hassan, A.M. Health-related quality of life in childhood bronchial asthma. Egyptian Journal of Pediatric Allergy and Immunology. 2013, 11(2), 83–93. [Google Scholar]
- Dharmage, S.C.; Perret, J.L.; Custovic, A. Epidemiology of Asthma in Children and Adults. Front. Pediatr. 2019, 7, 246. [Google Scholar] [CrossRef]
- Gans, M.D.; Gavrilova, T. Understanding the immunology of asthma: Pathophysiology, biomarkers, and treatments for asthma endotypes. Paediatric respiratory reviews. 2020, 36, 118–127. [Google Scholar] [CrossRef]
- Behzadi, P.; García-Perdomo, H.A.; Karpiński, T.M. Toll-Like Receptors: General Molecular and Structural Biology. J. Immunol. Res. 2021, 2021, 1–21. [Google Scholar] [CrossRef] [PubMed]
- Bezemer, G.F.G.; Sagar, S.; van Bergenhenegouwen, J.; Georgiou, N.A.; Garssen, J.; Kraneveld, A.D.; Folkerts, G. Dual Role of Toll-Like Receptors in Asthma and Chronic Obstructive Pulmonary Disease. Pharmacol. Rev. 2012, 64, 337–358. [Google Scholar] [CrossRef] [PubMed]
- Forfia, P.R.; Vaidya, A.; Wiegers, S.E. Pulmonary Heart Disease: The Heart-Lung Interaction and its Impact on Patient Phenotypes. Pulm. Circ. 2013, 3, 5–19. [Google Scholar] [CrossRef]
- Venkatesan, P. 2023 GINA report for asthma. Lancet Respir. Med. 2023, 11, 589–589. [Google Scholar] [CrossRef]
- Sharifi, A.; Ghadiri, A.; Salimi, A.; et al. Evaluating the distribution of (+ 2044G/A, R130Q) rs20541 and (−1112 C/T) rs1800925 polymorphism in IL-13 gene: an association-based study with asthma in Ahvaz, Iran. Int J Med Lab. 2021, 8(1), 62–69. [Google Scholar] [CrossRef]
- Griffiths, L.; Chacon-Cortes, D. Methods for extracting genomic DNA from whole blood samples: current perspectives. J. Biorepository Sci. Appl. Med. 2014. [Google Scholar] [CrossRef]
- Miller, M.; Hankinson, J.; Brusasco, V.; et al. Standardization of Spirometry. European respiratory journal. 2005, 26(2), 319–38. [Google Scholar] [CrossRef]
- Ober, C.; Yao, T. The genetics of asthma and allergic disease: a 21st century perspective. Immunol. Rev. 2011, 242, 10–30. [Google Scholar] [CrossRef] [PubMed]
- Luo, L.; Curson, J.E.B.; Liu, L.; Wall, A.A.; Tuladhar, N.; Lucas, R.M.; Sweet, M.J.; Stow, J.L. SCIMP is a universal Toll-like receptor adaptor in macrophages. J. Leukoc. Biol. 2019, 107, 251–262. [Google Scholar] [CrossRef] [PubMed]
- Hernández, C.D.; Casanello, P.; Harris, P.R.; Castro-Rodríguez, J.A.; Iturriaga, C.; Perez-Mateluna, G.; Farías, M.; Urzúa, M.; Hernandez, C.; Serrano, C.; et al. Early origins of allergy and asthma (ARIES): study protocol for a prospective prenatal birth cohort in Chile. BMC Pediatr. 2020, 20, 1–9. [Google Scholar] [CrossRef]
- Yu, H.; Su, F.; Wang, L.-B.; Hemminki, K.; Dharmage, S.C.; Bowatte, G.; Bui, D.; Qian, Z.; Vaughn, M.G.; Aaron, H.E.; et al. The Asthma Family Tree: Evaluating Associations Between Childhood, Parental, and Grandparental Asthma in Seven Chinese Cities. Front. Pediatr. 2021, 9. [Google Scholar] [CrossRef]
- Guo, S.L.; Liu, F.; Ren, C.J.; Xing, C.H.; Wang, Y.J. Correlations of LTα and NQO1 gene polymorphisms with childhood asthma. European review for medical and pharmacological sciences. 2019, 23(17), 7557–7562. [Google Scholar]
- Yalçın, S.S.; Emiralioğlu, N. Evaluation of blood and tooth element status in asthma cases: a preliminary case–control study. BMC Pulm. Med. 2021, 21, 1–8. [Google Scholar] [CrossRef]
- Ardura-Garcia, C.; Vaca, M.; Oviedo, G.; et al. Risk factors for acute asthma in tropical America: a case–control study in the City of Esmeraldas, Ecuador. Pediatric Allergy and Immunology. 2015, 26(5), 423–430. [Google Scholar]
- Al Qerem, W.; Ling, J. Pulmonary function tests in Egyptian schoolchildren in rural and urban areas. East. Mediterr. Heal. J. 2014, 24, 325–332. [Google Scholar] [CrossRef]
- Nahhas, M.; Bhopal, R.; Anandan, C.; Elton, R.; Sheikh, A. Investigating the association between obesity and asthma in 6- to 8-year-old Saudi children: a matched case–control study. npj Prim. Care Respir. Med. 2014, 24, 14004. [Google Scholar] [CrossRef]
- Fahmy, M.S.; Hassane, F.M.; Khatab, A.A.; Saliem, S.S. Low magnesium concentration in erythrocytes of children with acute asthma. Menoufia Med J. 2015, 28, 477. [Google Scholar] [CrossRef]
- Betül, B. K.; Ayhan, H. Early Impairment of Right Ventricular Functions in Patients with Moderate Asthma and the Role of Isovolumic Acceleration. Koşuyolu Heart. 2022, 25 (2), 157-164.
- zkan, E.; Khosroshahi, H. Evaluation of the Left and Right Ventricular Systolic and Diastolic Function in Asthmatic Children. BMC Cardiovasc Disord. 2016, 16(1), 145. [Google Scholar]
- Abdelmohsen, G.; Mohamed, H.; Mohsen, M.; Abdelaziz, O.; Ahmed, D.; Abdelsalam, M.; Dohain, A. Evaluation of cardiac function in pediatric patients with mild to moderate bronchial asthma in the era of cardiac strain imaging. Pediatr. Pulmonol. 2019, 54, 1905–1913. [Google Scholar] [CrossRef]
- Ozde, C.; Dogru, M.; Ozde, Ş.; Kayapinar, O.; Kaya, A.; Korkmaz, A. Subclinical right ventricular dysfunction in intermittent and persistent mildly asthmatic children on tissue Doppler echocardiography and serum NT-proBNP: Observational study. Pediatr. Int. 2018, 60, 1024–1032. [Google Scholar] [CrossRef] [PubMed]
- Karasu, B.B.; Aydıncak, H.T. Right ventricular-pulmonary arterial uncoupling in mild-to-moderate asthma. J. Asthma 2022, 60, 543–552. [Google Scholar] [CrossRef] [PubMed]
- Manti, S.; Parisi, G.F.; Giacchi, V.; Sciacca, P.; Tardino, L.; Cuppari, C.; Salpietro, C.; Chikermane, A.; Leonardi, S. Pilot study shows right ventricular diastolic function impairment in young children with obstructive respiratory disease. Acta Paediatr. 2018, 108, 740–744. [Google Scholar] [CrossRef]
- De-Paula, C.R.; Magalhães, G.S.; Jentzsch, N.S.; Botelho, C.F.; Mota, C.D.C.C.; Murça, T.M.; Ramalho, L.F.C.; Tan, T.C.; Capuruço, C.A.B.; Rodrigues-Machado, M.D.G. Echocardiographic Assessment of Ventricular Function in Young Patients with Asthma. Arq. Bras. de Cardiol. 2018, 110, 231–239. [Google Scholar] [CrossRef]
- Tuleta, I.; Eckstein, N.; Aurich, F.; Nickenig, G.; Schaefer, C.; Skowasch, D.; Schueler, R. Reduced longitudinal cardiac strain in asthma patients. J. Asthma 2018, 56, 350–359. [Google Scholar] [CrossRef] [PubMed]
- Baysal, S.S.; Has, M. Assessment of biventricular function with speckle tracking echocardiography in newly-diagnosed adult-onset asthma. J. Asthma 2020, 59, 306–314. [Google Scholar] [CrossRef]
- Ozdemir, O.; Ceylan, Y.; Razi, C.H.; Ceylan, O.; Andiran, N. Assessment of Ventricular Functions by Tissue Doppler Echocardiography in Children with Asthma. Pediatr. Cardiol. 2012, 34, 553–559. [Google Scholar] [CrossRef]
- Tesse, R.; Pandey, R.C.; Kabesch, M. Genetic variations in toll-like receptor pathway genes influence asthma and atopy. Allergy 2010, 66, 307–316. [Google Scholar] [CrossRef]
- Kormann, M.S.; Depner, M.; Hartl, D.; Klopp, N.; Illig, T.; Adamski, J.; Vogelberg, C.; Weiland, S.K.; von Mutius, E.; Kabesch, M. Toll-like receptor heterodimer variants protect from childhood asthma. J. Allergy Clin. Immunol. 2008, 122, 86–92.e8. [Google Scholar] [CrossRef] [PubMed]
- Klaassen, E.M.; Thönissen, B.E.; van Eys, G.; Dompeling, E.; Jöbsis, Q. A systematic review of CD14 and toll-like receptors in relation to asthma in Caucasian children. Allergy, Asthma Clin. Immunol. 2013, 9, 10–10. [Google Scholar] [CrossRef] [PubMed]
- Puthothu, B; Heinzmann, A. Allergy. 2006, 61(5), 649–650.
- Ferreira, D.S.; Annoni, R.; Silva, L.F.F.; Buttignol, M.; Santos, A.B.G.; Medeiros, M.C.R.; Andrade, L.N.S.; Yick, C.Y.; Sterk, P.J.; Sampaio, J.L.M.; et al. Toll-like receptors 2, 3 and 4 and thymic stromal lymphopoietin expression in fatal asthma. Clin. Exp. Allergy 2012, 42, 1459–1471. [Google Scholar] [CrossRef]
Figure 1.
Box blot demonstrating eosinophil level (cells/μl) in the studied groups.
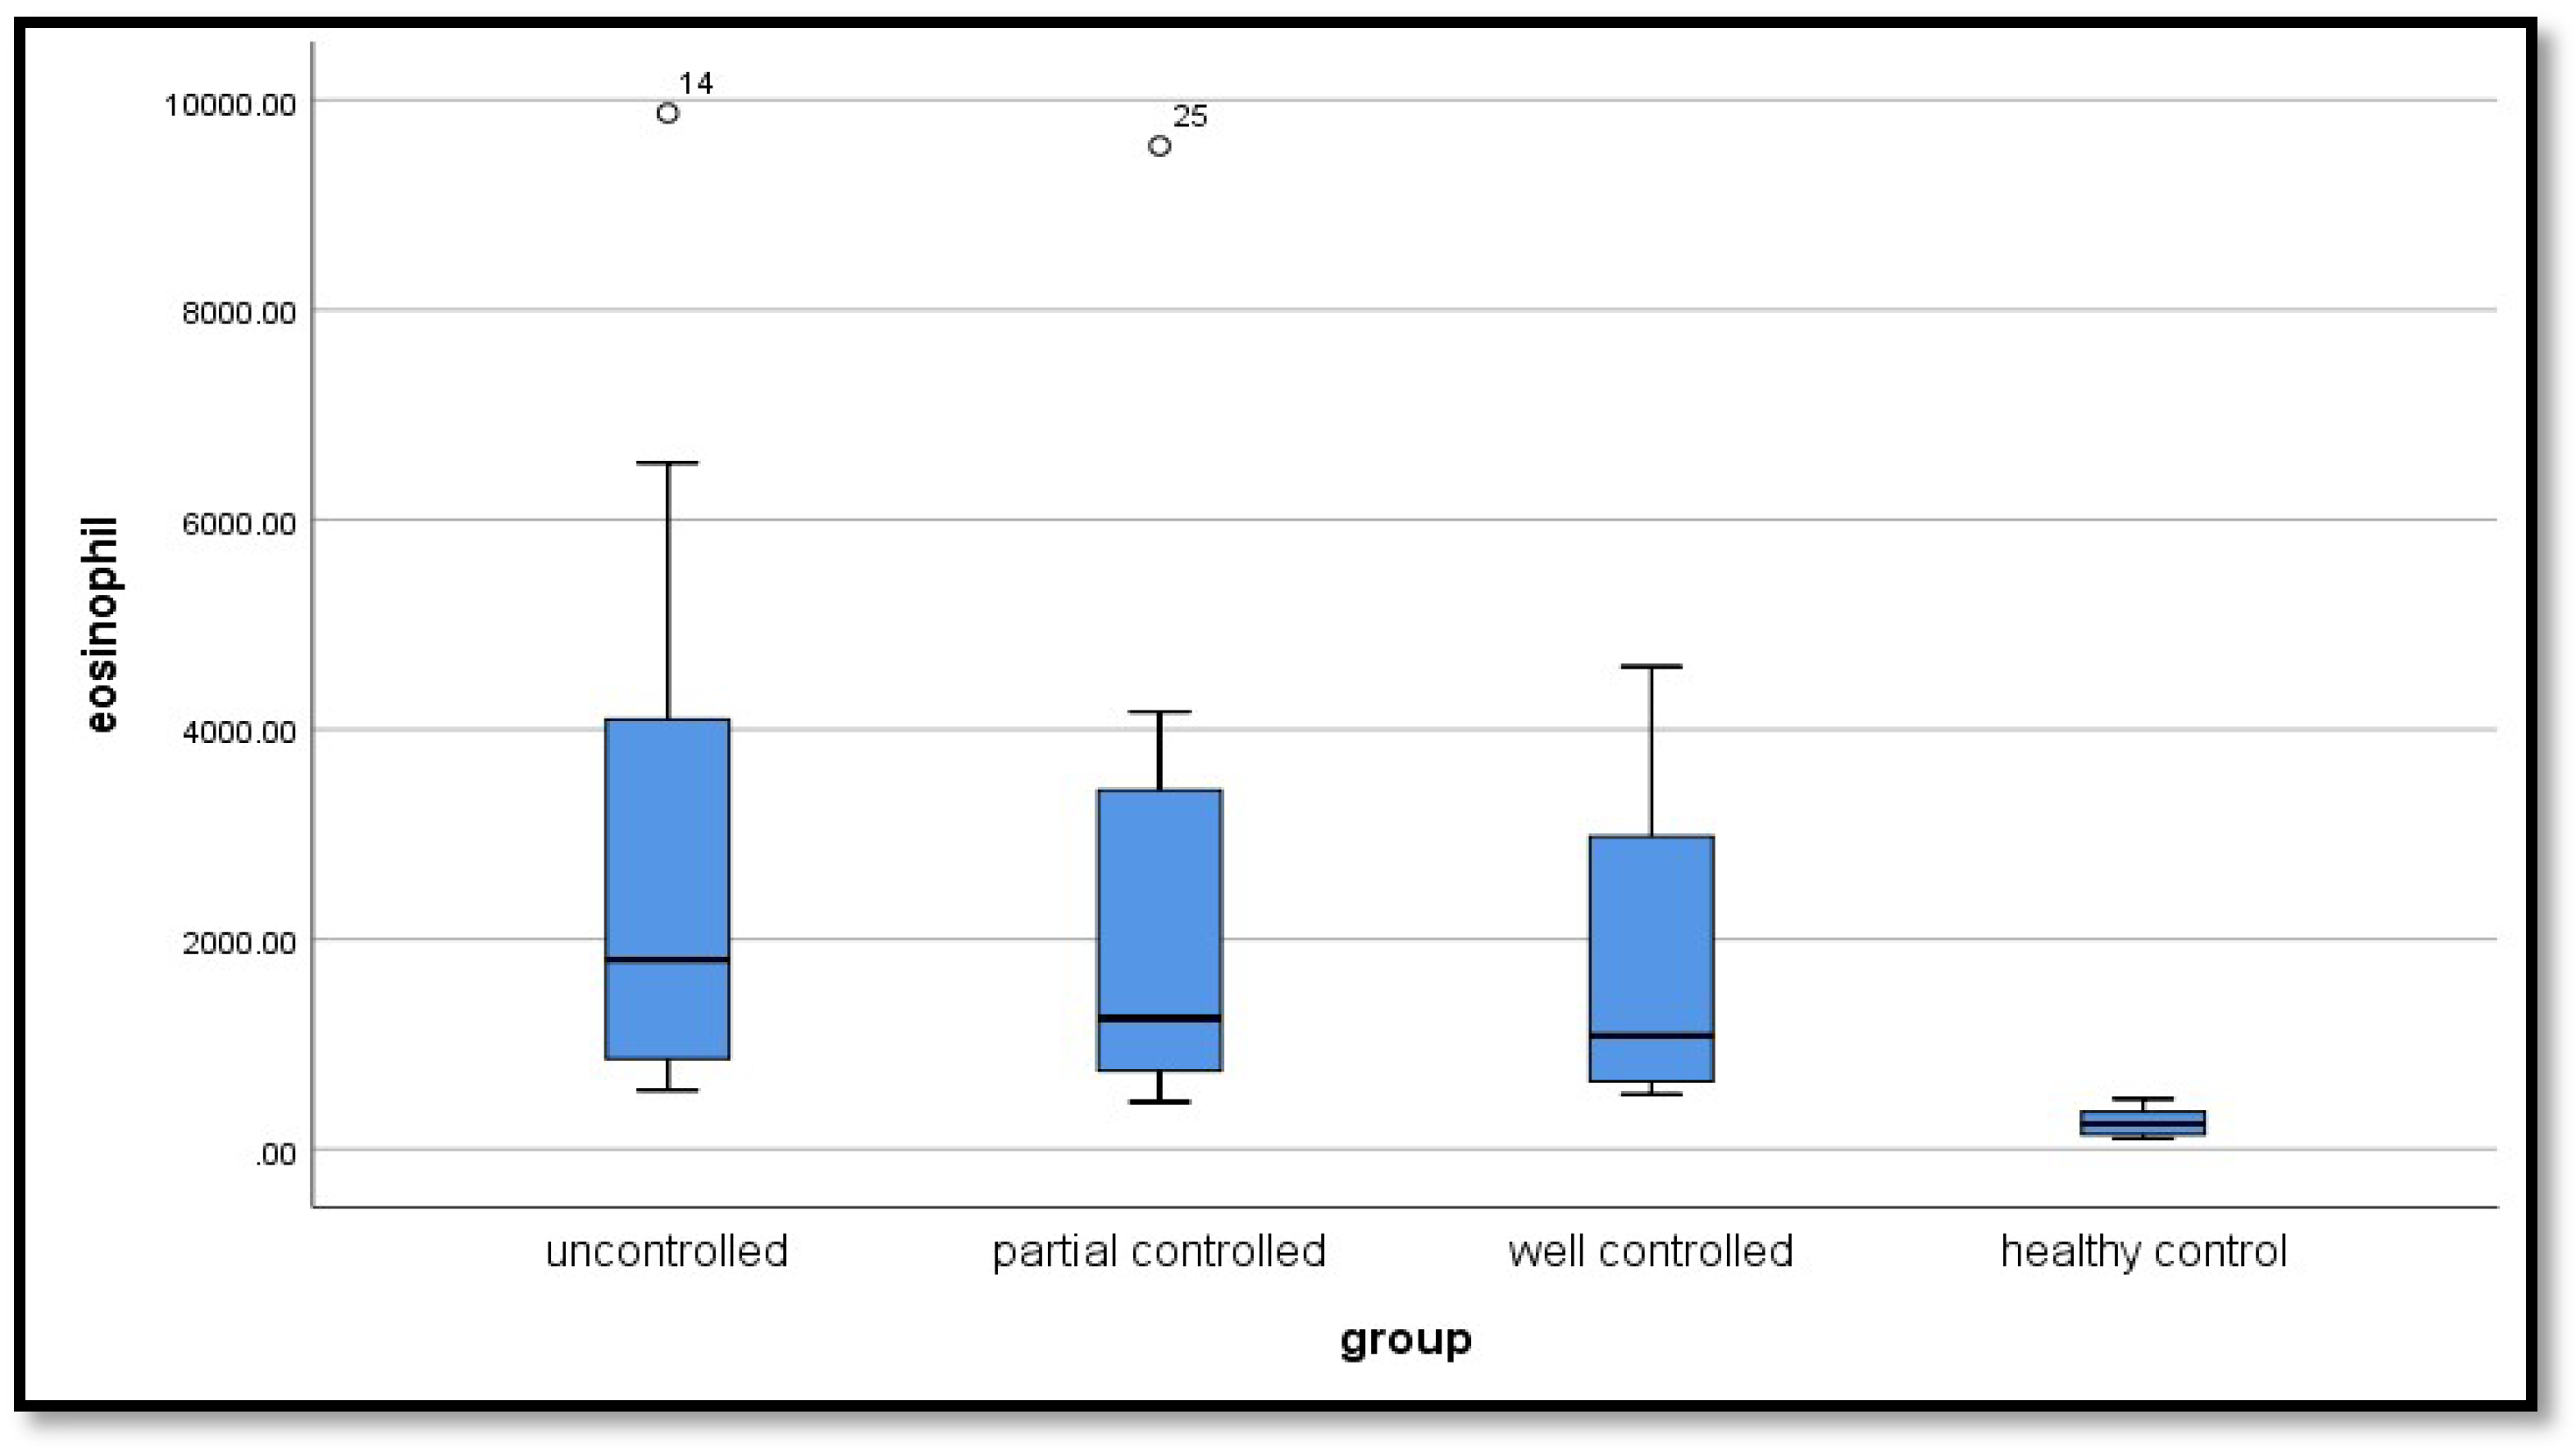
Figure 2.
Scatter diagram illustrating positive correlation between FEV1 and the following parameter (a) TAPSE, (b) RV4CSL, (c) RVFWSL, (d) GLSA4C, (e) GLSA2C, and (f) GLSAVG among the studied groups.
Figure 2.
Scatter diagram illustrating positive correlation between FEV1 and the following parameter (a) TAPSE, (b) RV4CSL, (c) RVFWSL, (d) GLSA4C, (e) GLSA2C, and (f) GLSAVG among the studied groups.
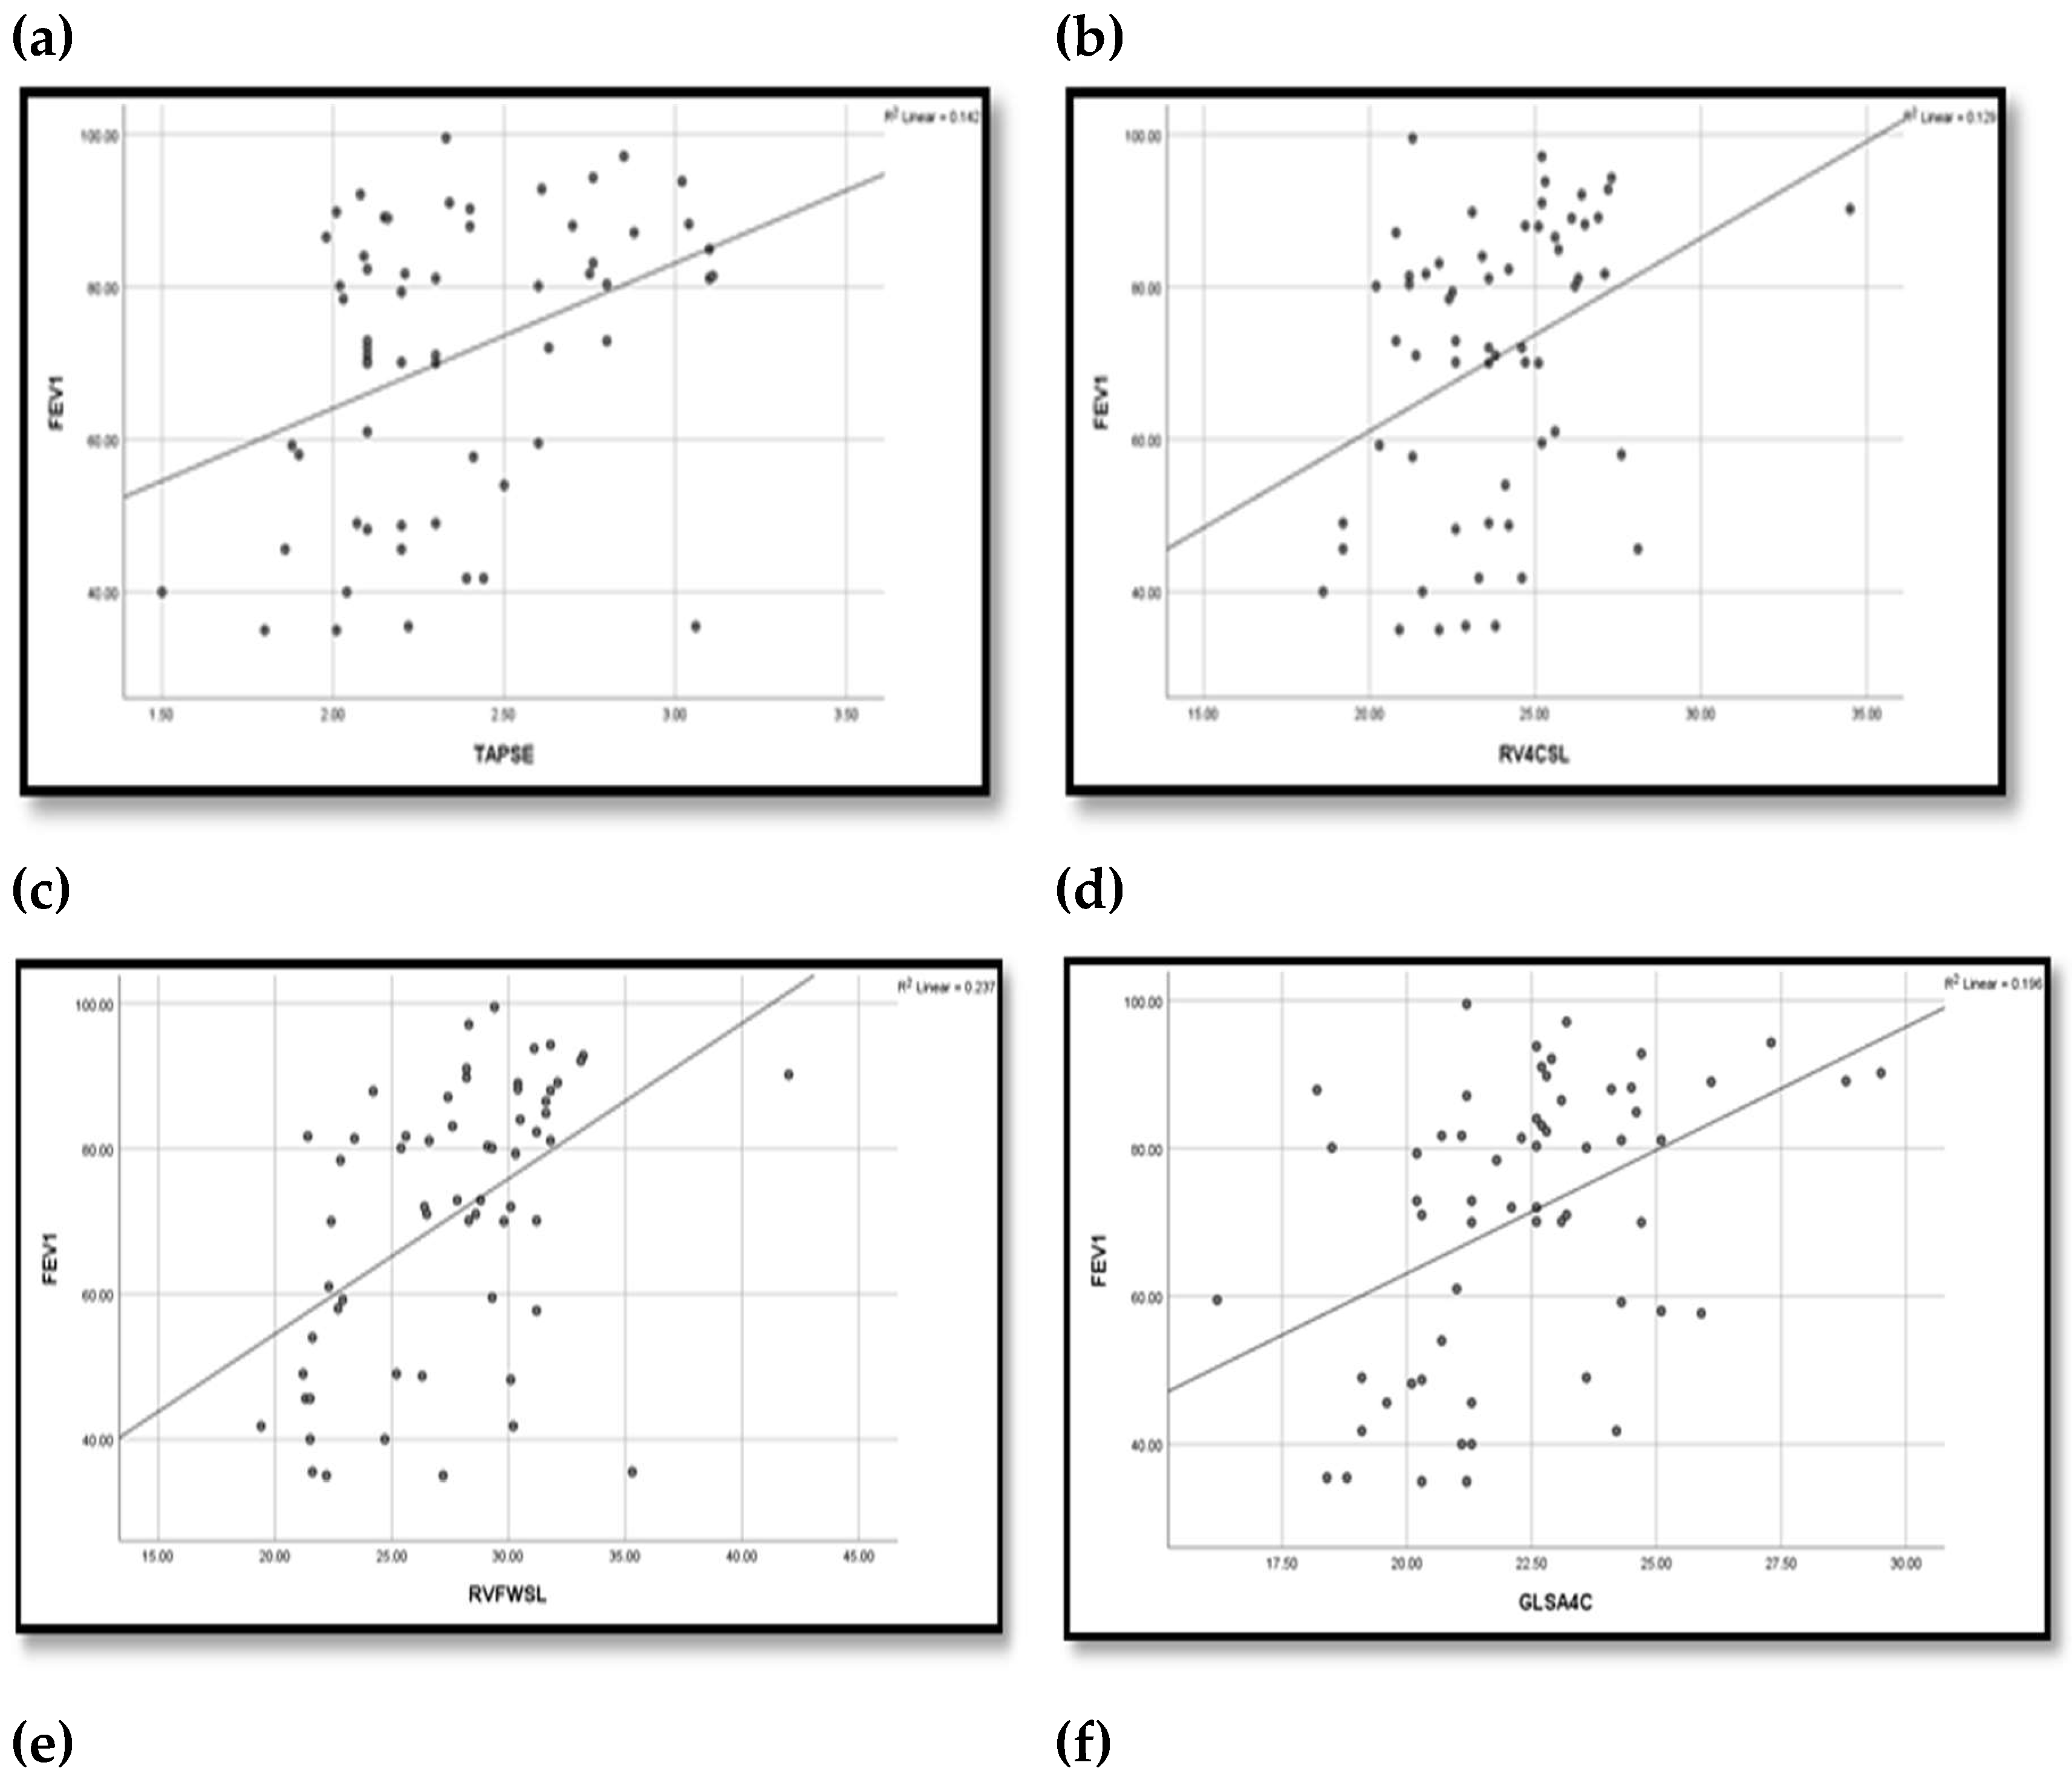
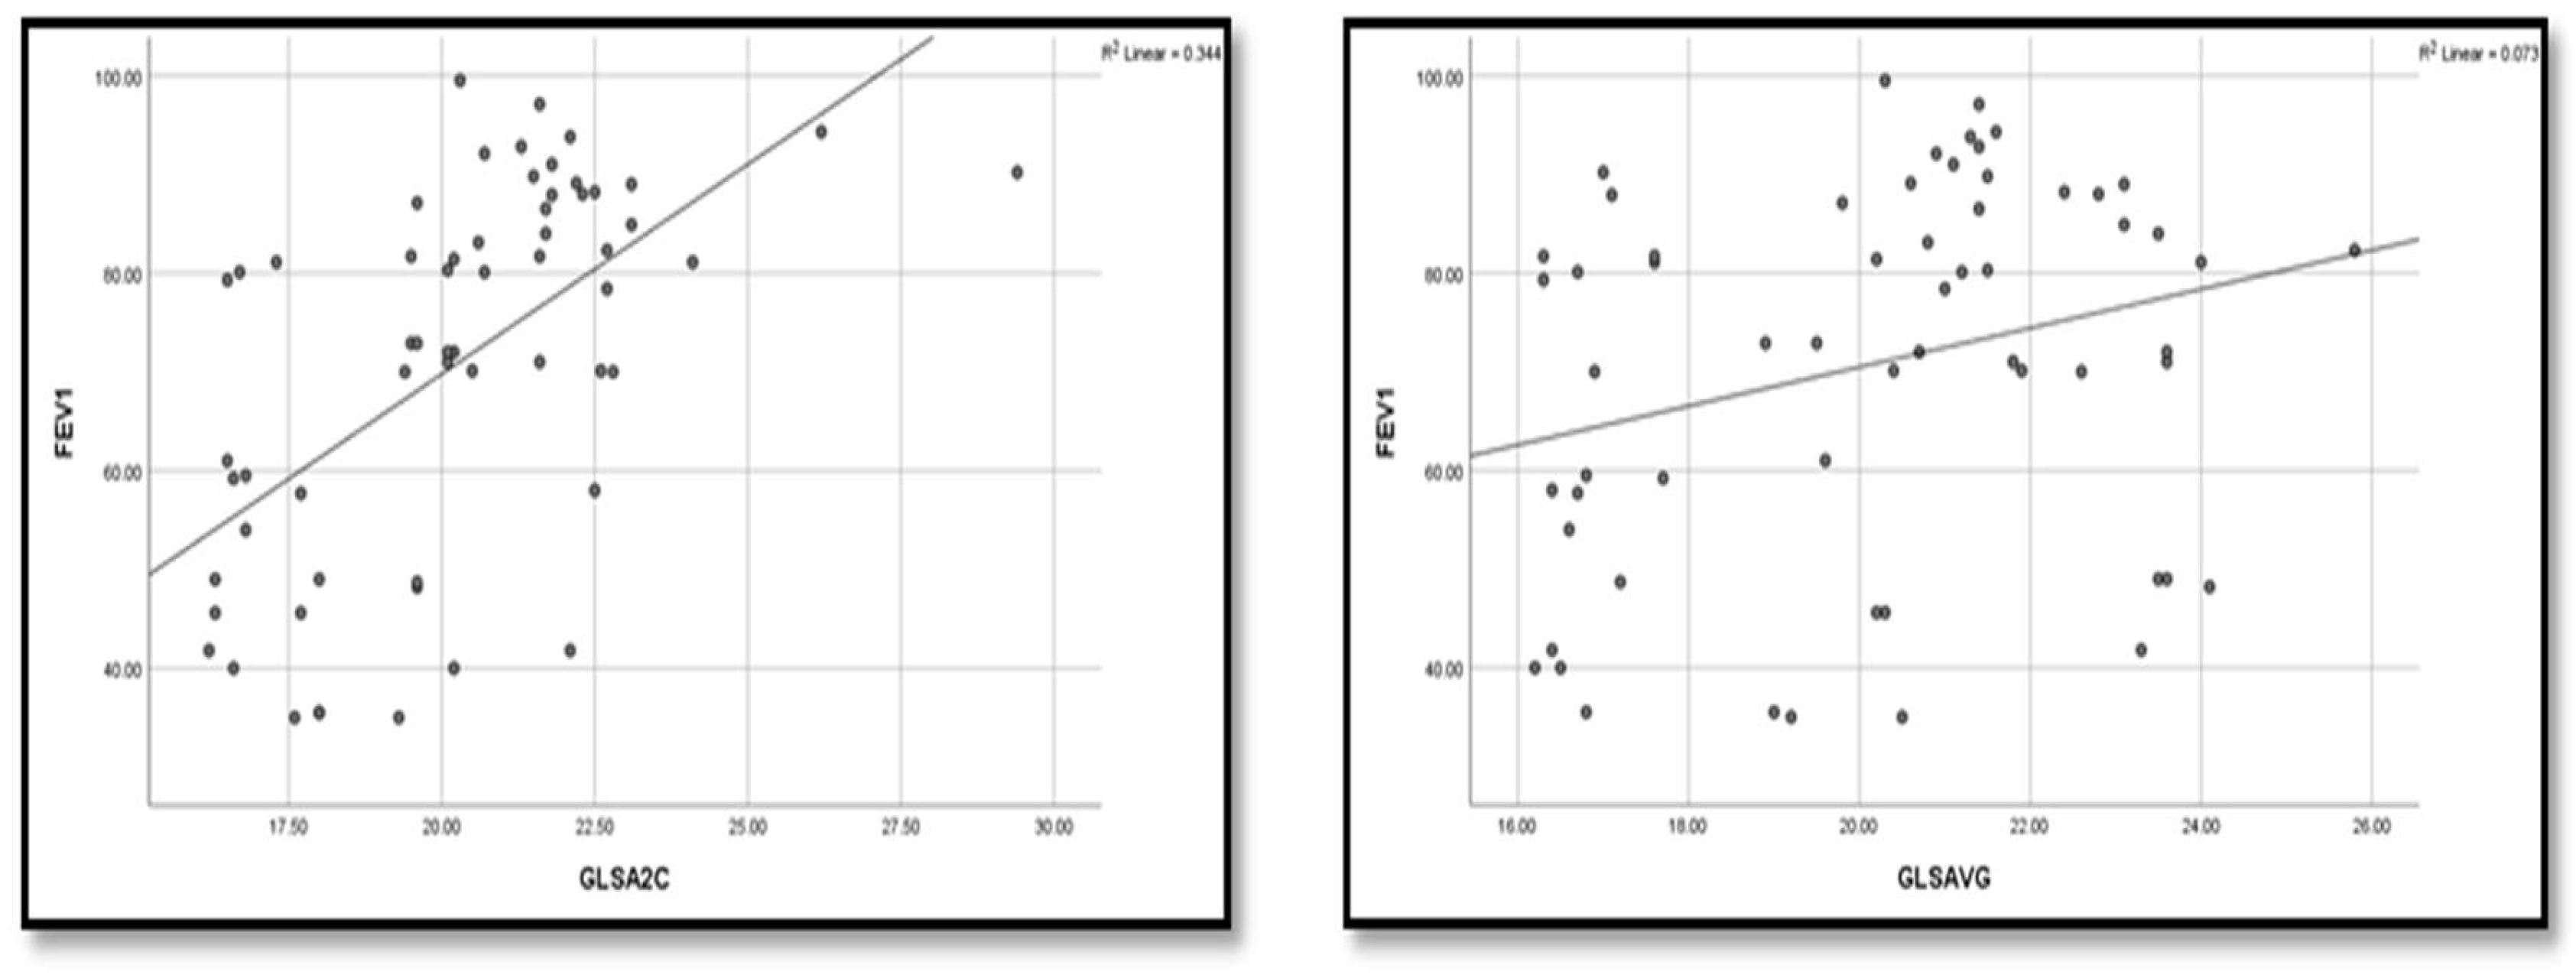

Table 1.
Demographic features of the four groups included in the study.
| Variable | Un controlled group (n=20) |
Partially controlled Group (n=20) |
Well controlled Group (n=20) |
Control group (n=20) |
Tests | |
|---|---|---|---|---|---|---|
| F | p value | |||||
| Age (years) | 1.184 | 0.321 | ||||
| Mean ±SD | 8.15±2.78 | 9.40±4.08 | 7.75±2.73 | 9.05±2.82 | ||
| Range | (5-13) | (5-15) | (5-14) | (5-14) | ||
| Height (cm) | 0.867 | 0.462 | ||||
| Mean ±SD | 133.55±20.27 | 132.05±18.96 | 126.25±14.74 | 134.7±17.67 | ||
| Range | (106-168) | (105-165) | (106-155) | (106-165) | ||
| Weight (kg) | 1.094 | 0.357 | ||||
| Mean ±SD | 35.65±14.12 | 34.30±13.76 | 28.75±10.43 | 32.50±12.55 | ||
| Range | (21-63) | (18-66) | (17-50) | (19-66) | ||
| BMI (kg/m²) | 1.59 | 1.79 | ||||
| Mean ±SD | 19.41±4.27 | 19.12±4.43 | 17.53±3.19 | 17.34±2.92 | ||
| Range | (14.8-24) | (11.03-29.33) | (13.43-24.45) | (12.77±24.4) | ||
| Variable | No (%) | No (%) | No (%) | No (%) | χ2 | P value |
| Sex | 1.616 | 0.656 (ns) | ||||
| Female | 11 (55) | 9 (45) | 7 (35) | 9 (45) | ||
| Male | 9 (45) | 11 (55) | 13 (65) | 11 (55) | ||
| Family history | 48.627 | <0.001** | ||||
| Negative | 5 (25) | 1 (5) | 3 (15) | 20 (100) | ||
| Positive | 15 (75) | 19 (95) | 17 (85) | 0 | ||
SD: Standard deviation, (F) one way ANOVA, (χ2) chi-square testχ2, ( (*) Significant, (**) highly significant.
Table 2.
Mean right ventricular Echocardiographic measurements and Longitudinal strain pattern in speckle tracking in the four studied groups.
Table 2.
Mean right ventricular Echocardiographic measurements and Longitudinal strain pattern in speckle tracking in the four studied groups.
| Variable | Uncontrolled group (n=20) |
Partially controlled (n=20) |
Well Controlled (n=20) |
Control group (n=20) |
Tests | ||
|---|---|---|---|---|---|---|---|
| F | p value | Post hoc | |||||
|
Ejection Fraction EF% Mean ±SD Range |
70.43±3.95 (62-75.1)) |
70.08±2.74 (64.3-74.3 | 71.40±3.67 (63-78.1) | 71.54±2.51 (66.6-77) | 0.961 | 0.416 | P1=0.740 |
| P2=0.349 | |||||||
| P3=0.287 | |||||||
| P4=0.206 | |||||||
| P5=0.164 | |||||||
| P6=0.897 | |||||||
|
Fractional Shortening FS% Mean ±SD Range |
36.3±8.84 (2-44.1) |
37.71±2.93 (32.3-44.3) | 39.06±2.67 (32.6-43.2) | 39.36±2.58 (34.1-43.5) | 1.570 | 0.204 | P1=0.375 |
| P2=0.085 | |||||||
| P3=0.057 | |||||||
| P4=0.397 | |||||||
| P5=0.301 | |||||||
| P6=0.850 | |||||||
|
Pulmonary Artery Systolic Pressure PASP(mm Hg) Mean ±SD Range |
28.8±7.35 (2-35) |
27.5±2.84 (24-33) |
26±3.76 (20-33) | 25±2.25 (22-29) | 2.745 | 0.049* | P1=0.365 |
| P2=0.053 | |||||||
| P3=0.009* | |||||||
| P4=0.296 | |||||||
| P5=0.083 | |||||||
| P6=0.485 | |||||||
|
TAPSE(mm) Mean ±SD Range |
2.18±0.34 (1.5-3.06) |
2.39±0.36 (2.02-3.11) |
2.49±0.38 (1.98-3.1) | 2.74±0.64 (2.02-5.07) | 5.480 | 0.002* | P1=0.133 |
| P2=0.031* | |||||||
| P3<0.001** | |||||||
| P4=0.449 | |||||||
| P5=0.016* | |||||||
| P6=0.077 | |||||||
|
RV4CSL Mean ±SD Range |
-22.94±2.62 (-28.1)-(-18.6) |
-23.26±1.95 (-27.1)- (-20.2) |
-25.33±2.86 (-34.5)-(-20.8) |
-25.49±1.36 (-27.6)-(-2.4) |
6.95 | <0.001* | P1=0.658 |
| P2=0.001* | |||||||
| P3=0.001* | |||||||
| P4=0.005* | |||||||
| P5=0.003* | |||||||
| P6=0.825 | |||||||
|
RVFWSL Mean ±SD Range |
-24.89±4.32 (-35.3) -(-19.4) |
-27.28±3.02 (-31.8) - (-21.4) |
-30.71±3.47 (-42) -(-24.2) |
-30.2±2.05 (-33.3)-(-26.3) |
13.36 | <0.001* | P1=0.025* |
| P2<0.001** | |||||||
| P3<0.001** | |||||||
| P4=0.002* | |||||||
| P5=0.007* | |||||||
| P6=0.628 | |||||||
|
GLS A4C Mean ±SD Range |
-18.95±9.79 (-25.9)-(-21.3) |
-22.08±1.68 (-25.1)- (-18.5) |
-23.78±2.62 (-29.5)- (-26.5) |
-24.31±1.19 (-26.5)-(-22.2) |
4.360 | 0.007* | P1=0.059 |
| P2=0.0048* | |||||||
| P3=0.002* | |||||||
| P4=0.302 | |||||||
| P5=0.178 | |||||||
| P6=0.749 | |||||||
|
GLS A2C Mean ±SD Range |
-18.12±1.88 (-22.5)- (-16.2) |
-20.29±1.98 (-24.1) - (-16.5) |
-22.31±2.14 (-29.4) -(-19.6) |
-22.69±1.85 (-26.7)-(-19.1) |
22.8 | <0.001* | P1=0.001* |
| P2<0.001* | |||||||
| P3<0.001* | |||||||
| P4=0.002* | |||||||
| P5<0.001* | |||||||
| P6=0.548 | |||||||
|
GLS A3C Mean ±SD Range |
-18.37±1.42 (-21.3) - (-16.2) |
-19.5±1.91 (-22.8) - (-16.1) |
-19.83±1.6 (-24.1) - (-16.9) |
-20.83±1.35 (-22.9)-(-18.6) |
8.14 | <0.001* | P1=0.027* |
| P2=0.005* | |||||||
| P3<0.001** | |||||||
| P4=0.519 | |||||||
| P5=0.010* | |||||||
| P6=0.050 | |||||||
|
GLS AVG Mean ±SD Range |
-16.98±9.24 (-24.1) - 20 |
20.12±2.53 (-24) - (-16.3) |
21.35±1.99 (-25.8) - (-17) |
22.61±1.67 (-28.2) - (-20) |
4.72 | <0.001* | P1=0.049* |
| P2=0.007* | |||||||
| P3=0.001* | |||||||
| P4=0.436 | |||||||
| P5=0.117 | |||||||
| P6=0.425 | |||||||
(F) One way ANOVA, (*) Significant (<0.05), (**) highly significant (<0.001), P1 =uncontrolled group vs. partially group. • P2 =uncontrolled group vs. Well controlled group. • P3 = uncontrolled group vs. control group. • P4 = partially controlled group. Vs. Well controlled • P5 = partially controlled group vs. control group. • P6 = well controlled group vs. control group.
Table 3.
TLR9 gene polymorphism distribution in the studied groups.
| Variable | Uncontrolled group (n=20) |
Partially controlled group (n=20) |
Well controlled group (n=20) |
Control group (n=20) |
Tests | Multi comparison analysis | ||||||
|---|---|---|---|---|---|---|---|---|---|---|---|---|
| χ2 | p value | |||||||||||
| No | % | No | % | No | % | No | % | |||||
| CC (n=23) | 0 | 0 | 3 | 15 | 8 | 40 | 12 | 60 | 21.887 | 0.001* |
P1=0.139 P2=0.007* P3<0.001** P4=0.187 P5=0.009* P6=0.389 |
|
| TC (n=28) | 9 | 45 | 10 | 50 | 6 | 30 | 3 | 15 | ||||
| TT (n=29) | 11 | 55 | 7 | 35 | 6 | 30 | 5 | 25 | ||||
| Alleles | ||||||||||||
|
C (n=74) |
9 | 22.5 | 16 | 40.0 | 22 | 55.0 | 27 | 67.5 | 18.2 | 0.001* |
P1=0.09 P2=0.002* P3<0.001** P4=0.178 P5=0.013* P6=0.251 |
|
|
T (n=86) |
31 | 77.5 | 24 | 60.0 | 18 | 45.0 | 13 | 32.5 | ||||
Chi square (χ2), (*) Significant, (**) highly significant, P1= uncontrolled group vs. partially group, P2 =uncontrolled group vs. Well controlled group, P3 = uncontrolled group vs. control group, P4 = partially controlled group. Vs. Well controlled, P5 = partially controlled group vs. control group, P6 = well controlled group vs. control group, CC homozygous wild type, TT homozygous mutant type, TC heterozygous mutant type.
Table 4.
TLR10 gene polymorphism distribution in the studied groups.
| Variable | Uncontrolled group (n=20) | Partially controlled group (n=20) | Well controlled Group (n=20) |
Control Group (n=20) |
Tests | Multi comparison analysis | |||||||
|---|---|---|---|---|---|---|---|---|---|---|---|---|---|
| χ2 | p value | ||||||||||||
| No | % | No | % | No | % | No | % | ||||||
| GG (n=36) | 4 | 20 | 7 | 35 | 10 | 50 | 15 | 75 | 18.8 | 0.004* |
P1=0.557 P2=0.018* P3=0.001** P4=0.114 P5=0.026* P6=0.232 |
||
| GT (n=28) | 8 | 40 | 7 | 35 | 9 | 45 | 4 | 20 | |||||
|
TT (n=16) |
8 | 40 | 6 | 30 | 1 | 5 | 1 | 5 | |||||
| Alleles | |||||||||||||
| G (n=100) | 16 | 40 | 21 | 52.5 | 29 | 72.5 | 34 | 85 | 20.6 | 0.001** |
P1=0.262 P2=0.003* P3=0.001** P4=0.06 P5=0.001** P6=0.171 |
||
|
T (n=60) |
24 | 60 | 19 | 47.5 | 11 | 27.5 | 6 | 15 | |||||
Chi square (χ2), (*) Significant, (**) highly significant, P1 =uncontrolled group vs. partially group, P2 =uncontrolled group vs. Well controlled group, P3 = uncontrolled group vs. control group, P4 = partially controlled group. Vs. Well controlled, P5 = partially controlled group vs. control group, P6 = well controlled group vs. control group, GG homozygous wild type, TT homozygous mutant type, and GT heterozygous mutant type.
Table 5.
TLR9 & TLR 10 gene polymorphism among the studied groups.
| Variable | Cases (n=60) |
Control (n=20) |
P | χ2 | OR | ||
|---|---|---|---|---|---|---|---|
| No | % | No | % | ||||
| TLR 9: | |||||||
| CC | 11 | 18.3 | 12 | 60 | -- | -- | Reference |
| CT | 25 | 41.7 | 3 | 15 | 10.45 | 0.001* | 9.09 (2.13-38.77) |
| TT | 24 | 40 | 5 | 25 | 7.11 | 0.008* | 5.24 (1.48-18.53) |
| Allele: | 9.69 | 0.002* | 3.23 (1.51-6.87) | ||||
| C | 47 | 39.2 | 27 | 67.5 | |||
| T | 73 | 60.8 | 13 | 32.5 | |||
| TLR 10: | |||||||
| GG | 21 | 35 | 15 | 75 | -- | --- | Reference |
| GT | 24 | 40 | 4 | 20 | 5.66 | 0.02* | 4.29 (1.23-14.94) |
| TT | 15 | 25 | 1 | 5 | 6.52 | 0.01* | 10.71(1.27-90.14) |
| Allele: | 11.52 |
<0.001 ** |
4.64(1.81-11.86) | ||||
| G | 66 | 55 | 34 | 85 | |||
| T | 54 | 45 | 6 | 15 | |||
χ2: Chi square test, OR: Odds ratio, *: Significant (P<0.05), **: Highly significant (P<0.001).
Table 6.
Comparison between TLR9 gene polymorphism as regard respiratory function within the studied groups.
Table 6.
Comparison between TLR9 gene polymorphism as regard respiratory function within the studied groups.
| Variable | TLR9 | Tests | ||||
|---|---|---|---|---|---|---|
| CC | CT | TT | F | p value | Post hoc | |
| FEV1% | 4.694 | 0.013* | P1=0.006* | |||
| Mean ±SD | 85.72±6.42 | 67.32±19.62 | 67.59±19.29 | P2=0.007* | ||
| Range | (71-94.3) | (35-97.1) | (35-99.5) | P3=0.958 | ||
| FVC% | 2.337 | 0.0.04* | P1=0.244 | |||
| Mean ±SD | 83.02±11.99 | 76.5±14.62 | 71.18±17.19 | P2=0.038* | ||
| Range | (60.2-97.4) | (52-104) | (29.5-96) | P3=0.229 | ||
SD: Standard deviation, (F) one way ANOVA, (ns) non-significant, (*) Significant, (**) highly significant. P1 CC vs. CT, P2 CC vs. TT, P3 CT vs TT.
Table 7.
Comparison between TLR9 gene polymorphism as regard cardiac function and ECHO findings within the studied groups.
Table 7.
Comparison between TLR9 gene polymorphism as regard cardiac function and ECHO findings within the studied groups.
| Variable | TLR9 | Tests | ||||
|---|---|---|---|---|---|---|
| CC | CT | TT | F | p value | Post hoc | |
|
Ejection Fraction EF% Mean ±SD Range |
1.801 | 0.174 | ||||
| P1=0.083 | ||||||
| 72.41±2.87 | 70.22±3 | 70.26±4.03 | P2=0.091 | |||
| (69.1-78.1) | (63-75.1) | (62-77.4) | P3=0.966 | |||
|
Fractional Shortening FS% Mean ±SD Range |
1.861 | 0.165 | ||||
| P1=0.424 | ||||||
| 37.59±3.06 | 39.2±2.73 | 36.15±8 | P2=0.479 | |||
| (32.6-42.7) | (32.3-44.3) | (2-44.1) | P3=0.059 | |||
|
Pulmonary Artery Systolic Pressure PASP(mm Hg) Mean ±SD Range |
0.292 | 0.748 | ||||
| P1=0.496 | ||||||
| 26.36±3.8 | 27.64±3.76 | 27.71±2 | P2=0.476 | |||
| (20-31) | (23-35) | (2-34) | P3=0.963 | |||
|
TAPSE(mm) Mean ±SD Range |
0.091 | 0.913 | P1=0.853 | |||
| 2.39±0.35 | 2.36±0.4 | 2.33±0.38 | P2=0.686 | |||
| (1.98-2.88) | (1.8-3.11) | (1.5-3.1) | P3=0.778 | |||
|
RV4CSL Mean ±SD Range |
0.523 | 0.596 | P1=0.328 | |||
| -24.59±2.37 | -23.62±1.92 | -23.73±3.45 | P2=0.386 | |||
| (-27.3) – (-20.8) | (-27.6) – (-20.8) | (-34.5) – (-18.6) | P3=0.892 | |||
|
RVFWSL Mean ±SD Range |
4.183 | 0.02* | P1=0.230 | |||
| -30.01±2.5 | -28.21±3.25 | -25.92±5.29 | P2=0.008* | |||
| (-33.1) – (-25.6) | (-35.3) – (-22.2) | (-42) – (-19.4) | P3=0.056 | |||
|
GLS A4C Mean ±SD Range |
1.341 | 0.270 | P1=0.456 | |||
| -23.7±2.72 | -22.04±2.06 | -20.19±9.25 | P2=0.122 | |||
| (-28.8) – (-20.3) | (-25.1) – (-16.2) | (-29.5) – (-21.3) | P3=0.297 | |||
|
GLS A2C Mean ±SD Range |
3.983 | 0.024* | P1=0.271 | |||
| -21.62±1.91 | -20.62±1.68 | -19.22±3.3 | P2=0.011* | |||
| (-26.2) – (-19.5) | (-22.8) – (-16.8) | (-29.4) – (-16.2) | P3=0.055 | |||
|
GLS A3C |
0.629 | 0.537 | P1=0.337 | |||
|
Mean ±SD |
-19.76±1.94 | -19.15±1.39 | -19.08±2 | P2=0.286 | ||
| Range | (-24.1) – (-16.9) | (-22.5) – (-17.1) | (-22.8) – (-16.1) | P3=0.885 | ||
|
GLS AVG Mean ±SD Range |
0.768 | 0.469 | P1=0.256 | |||
| -21.46±1.79 | -19.02±8.58 | -19.05±2.71 | P2=0.263 | |||
| (-23.6) – (-17.6) | (-25.8) – (-20.5) | (-24) – (-16.3) | P3=0.990 | |||
SD: Standard deviation, (F) one way ANOVA, (ns) non-significant, (*) Significant, (**) highly significant. P1 CC vs. CT, P2 CC vs. TT, P3 CT vs TT.
Table 8.
Comparison between TLR10 gene polymorphism as regard respiratory function within the studied groups.
Table 8.
Comparison between TLR10 gene polymorphism as regard respiratory function within the studied groups.
| Variable | TLR10 | Tests | ||||
|---|---|---|---|---|---|---|
| GG | GT | TT | F | p value | Post hoc | |
| FEV1% | 2.544 | 0.047* | P1=0.220 | |||
| Mean ±SD | 77.05±16.57 | 70.2±19.73 | 63.01±18.94 | P2=0.029* | ||
| Range | (41.8-97.1) | (35-99.5) | (35-90.2) | P3=0.242 | ||
| FVC% | 3.076 | 0.04* | P1=0.361 | |||
| Mean ±SD | 80.38±15.14 | 76.22±13.46 | 67.77±17.52 | P2=0.017* | ||
| Range | (43-104) | (52-97.4) | (29.5-86.8) | P3=0.095 | ||
SD: Standard deviation, (F) one way ANOVA, (ns) non-significant, (*) Significant, (**) highly significant. P1 GG vs. GT, P2 GG vs. TT, P3 GT vs TT.
Table 9.
Comparison between TLR10 gene polymorphism as regard cardiac function and ECHO finding within the studied groups.
Table 9.
Comparison between TLR10 gene polymorphism as regard cardiac function and ECHO finding within the studied groups.
| Variable | TLR10 | Tests | ||||
|---|---|---|---|---|---|---|
| CC | CT | TT | F | p value | Post hoc | |
| Ejection Fraction EF% | 0.824 | 0.444 | P1=0.368 | |||
| Mean ±SD | 70.37±3.34 | 71.31±3.09 | 69.93±4.23 | P2=0.710 | ||
| Range | (63-78.1) | (64.3-75.5) | (62-77.4) | P3=0.232 | ||
| Fractional Shortening FS% | 2.576 | 0.085 | P1=0.498 | |||
| Mean ±SD | 37.98±3.26 | 39.09±2.6 | 35.04±9.77 | P2=0.118 | ||
| Range | (32.3-43.2) | (34.9-44.3) | (2-42.1) | P3=0.498 | ||
| Pulmonary Artery Systolic Pressure PASP(mm Hg) | 0.094 | 0.911 | P1=0.982 | |||
| Mean ±SD | 27.29±3.74 | 27.25±4.11 | 27.93±7.81 | P2=0.712 | ||
| Range | (21-35) | (20-34) | (2-34) | P3=0.689 | ||
| TAPSE(mm) | 1.198 | 0.309 | P1=0.148 | |||
| Mean ±SD | 2.45±0.38 | 2.29±0.36 | 2.31±0.39 | P2=0.265 | ||
| Range | (2.01-3.11) | (1.86-3.06) | (1.5-3.1) | P3=0.861 | ||
| RV4CSL | 0.444 | 0.643 | P1=0.726 | |||
| Mean ±SD | -23.82±2.24 | 23.53±2.36 | -24.37±3.69 | P2=0.548 | ||
| Range | (-27.2) – (-19.2) | (-28.1) – (-19.2) | (-34.5) – (-18.6) | P3=0.351 | ||
| RVFWSL | 0.876 | 0.422 | P1=0.775 | |||
| Mean ±SD | -28.24±3.33 | -27.87±3.85 | -26.37±6 | P2=0.207 | ||
| Range | (-33.2) – (-21.2) | (-35.3) – (-21.3) | (-42) – (-19.4) | P3=0.299 | ||
| GLS A4C | 1.096 | 0.341 | P1=0.159 | |||
| Mean ±SD | -22.82±2.06 | -20.2±9.14 | -22.15±3.34 | P2=0.750 | ||
| Range | (-28.8) – (-19.1) | (27.3-) – (-21.3) | (-29.5) – (-16.2) | P3=0.338 | ||
| GLS A2C | 1.135 | 0.328 | P1=0.358 | |||
| Mean ±SD | -20.86±1.67 | -20.13±2.52 | -19.55±3.65 | P2=0.143 | ||
| Range | (-23.1) – (-16.3) | (-26.2) – (-16.3) | (-29.4) – (-16.2) | P3=0.498 | ||
| GLS A3C | 1.133 | 0.329 | P1=0.485 | |||
| Mean ±SD | -19.21±1.1 | -19.58±1.9 | -18.71±2.16 | P2=0.403 | ||
| Range | (-21.6) – (-16.9) | (-24.1) – (-17.1) | (-22.8) – (-16.1) | P3=0.138 | ||
| GLS AVG | 3.344 | 0.042(S) | P1=0.047* | |||
| Mean ±SD | -21.98±1.82 | -18.55±8.53 | -17.47±2.22 | P2=0.021* | ||
| Range | (-25.8) – (-17.6) | (-23.5) – (-20.5) | (-24) – (-16.2) | P3=0.560 | ||
SD: Standard deviation, (F) one way ANOVA (*) Significant, (**) highly significant. P1 CC vs. CT, P2 CC vs. TT, P3 CT vs TT.
Disclaimer/Publisher’s Note: The statements, opinions and data contained in all publications are solely those of the individual author(s) and contributor(s) and not of MDPI and/or the editor(s). MDPI and/or the editor(s) disclaim responsibility for any injury to people or property resulting from any ideas, methods, instructions or products referred to in the content. |
© 2025 by the authors. Licensee MDPI, Basel, Switzerland. This article is an open access article distributed under the terms and conditions of the Creative Commons Attribution (CC BY) license (http://creativecommons.org/licenses/by/4.0/).
Copyright: This open access article is published under a Creative Commons CC BY 4.0 license, which permit the free download, distribution, and reuse, provided that the author and preprint are cited in any reuse.


