Submitted:
24 February 2025
Posted:
26 February 2025
You are already at the latest version
Abstract
In this work, two pentacyanoferrate(II) complexes are synthesized and characterized, and their intense solvatochromic properties are examined in various solvents and solvent mixtures. These complexes feature ligands with flexible xylylene bridges and distinct heterocycles: one combining 4-dimethylaminopyridine (DMAP) with 4,4’-bipyridine, and the other isoquinoline with 4,4’-bipyridine. This structural diversity leads to intriguing solvatochromic behavior, enabling various intermolecular interactions and motifs in solution among the solvents and the complexes acting as solutes. The determined dipole moment changes between ground and excited states of both compounds highlight their sensitivity to small changes in dipolarity within polar media, such as water and polar organic solvents and mixtures thereof. Linear solvation energy relationships are employed to investigate their dependencies on solvent polarity and their responsiveness to different media. Additionally, the solvatochromic aptitude of the molecules examined is utilized to determine the polarity properties of aqueous solutions containing the bio-based molecule urea, a major player in bio-based resins and adhesives and other imminent applications.
Keywords:
Introduction
Results and Discussion
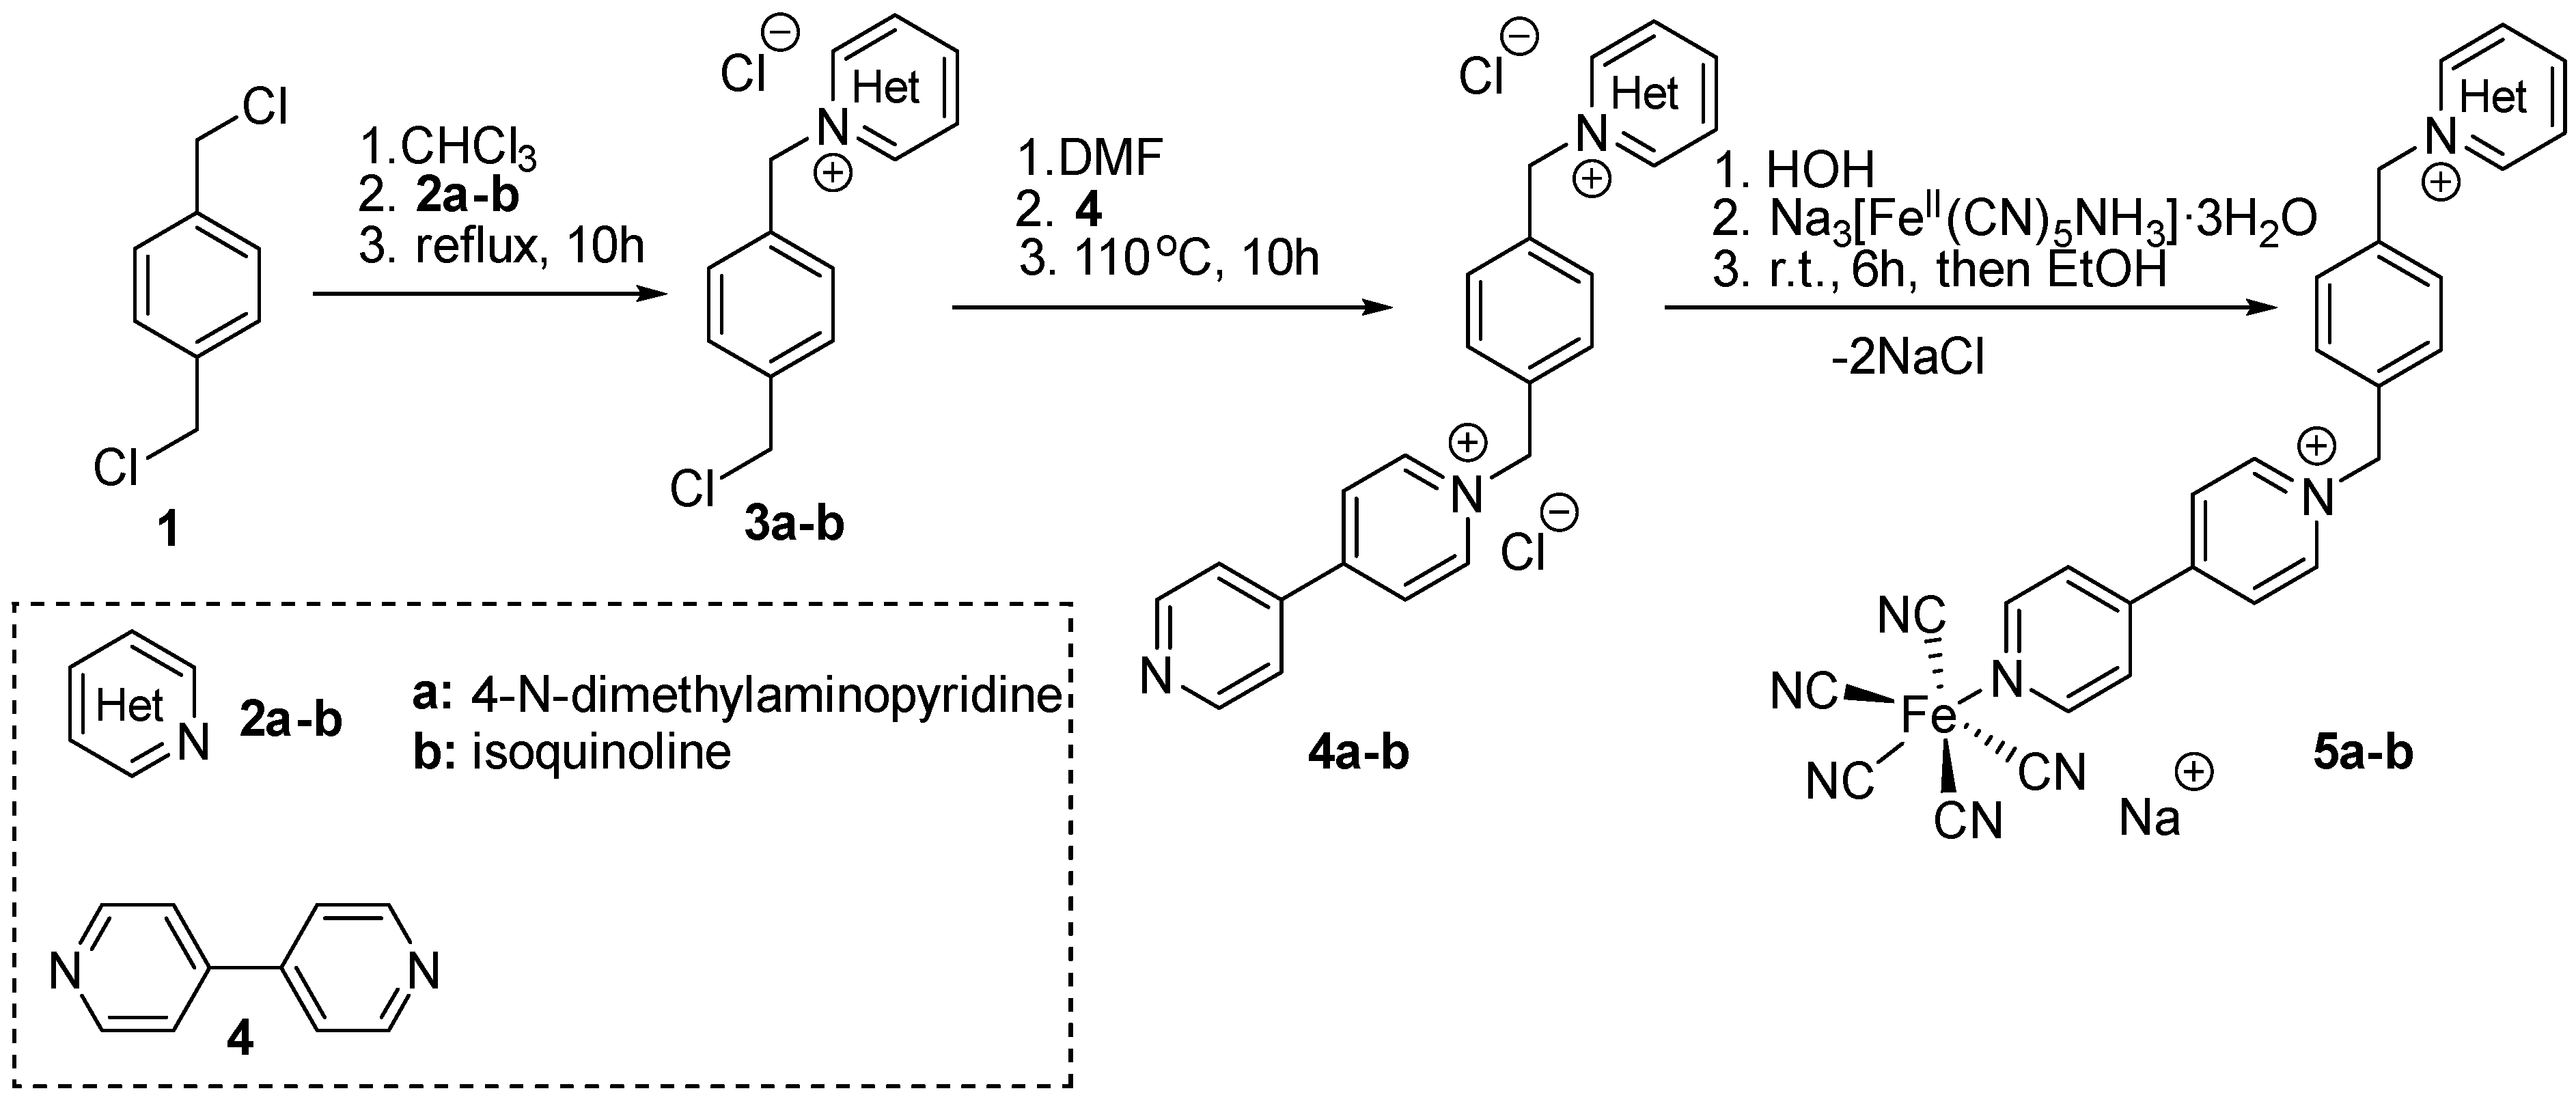
Synthesis and Characterization
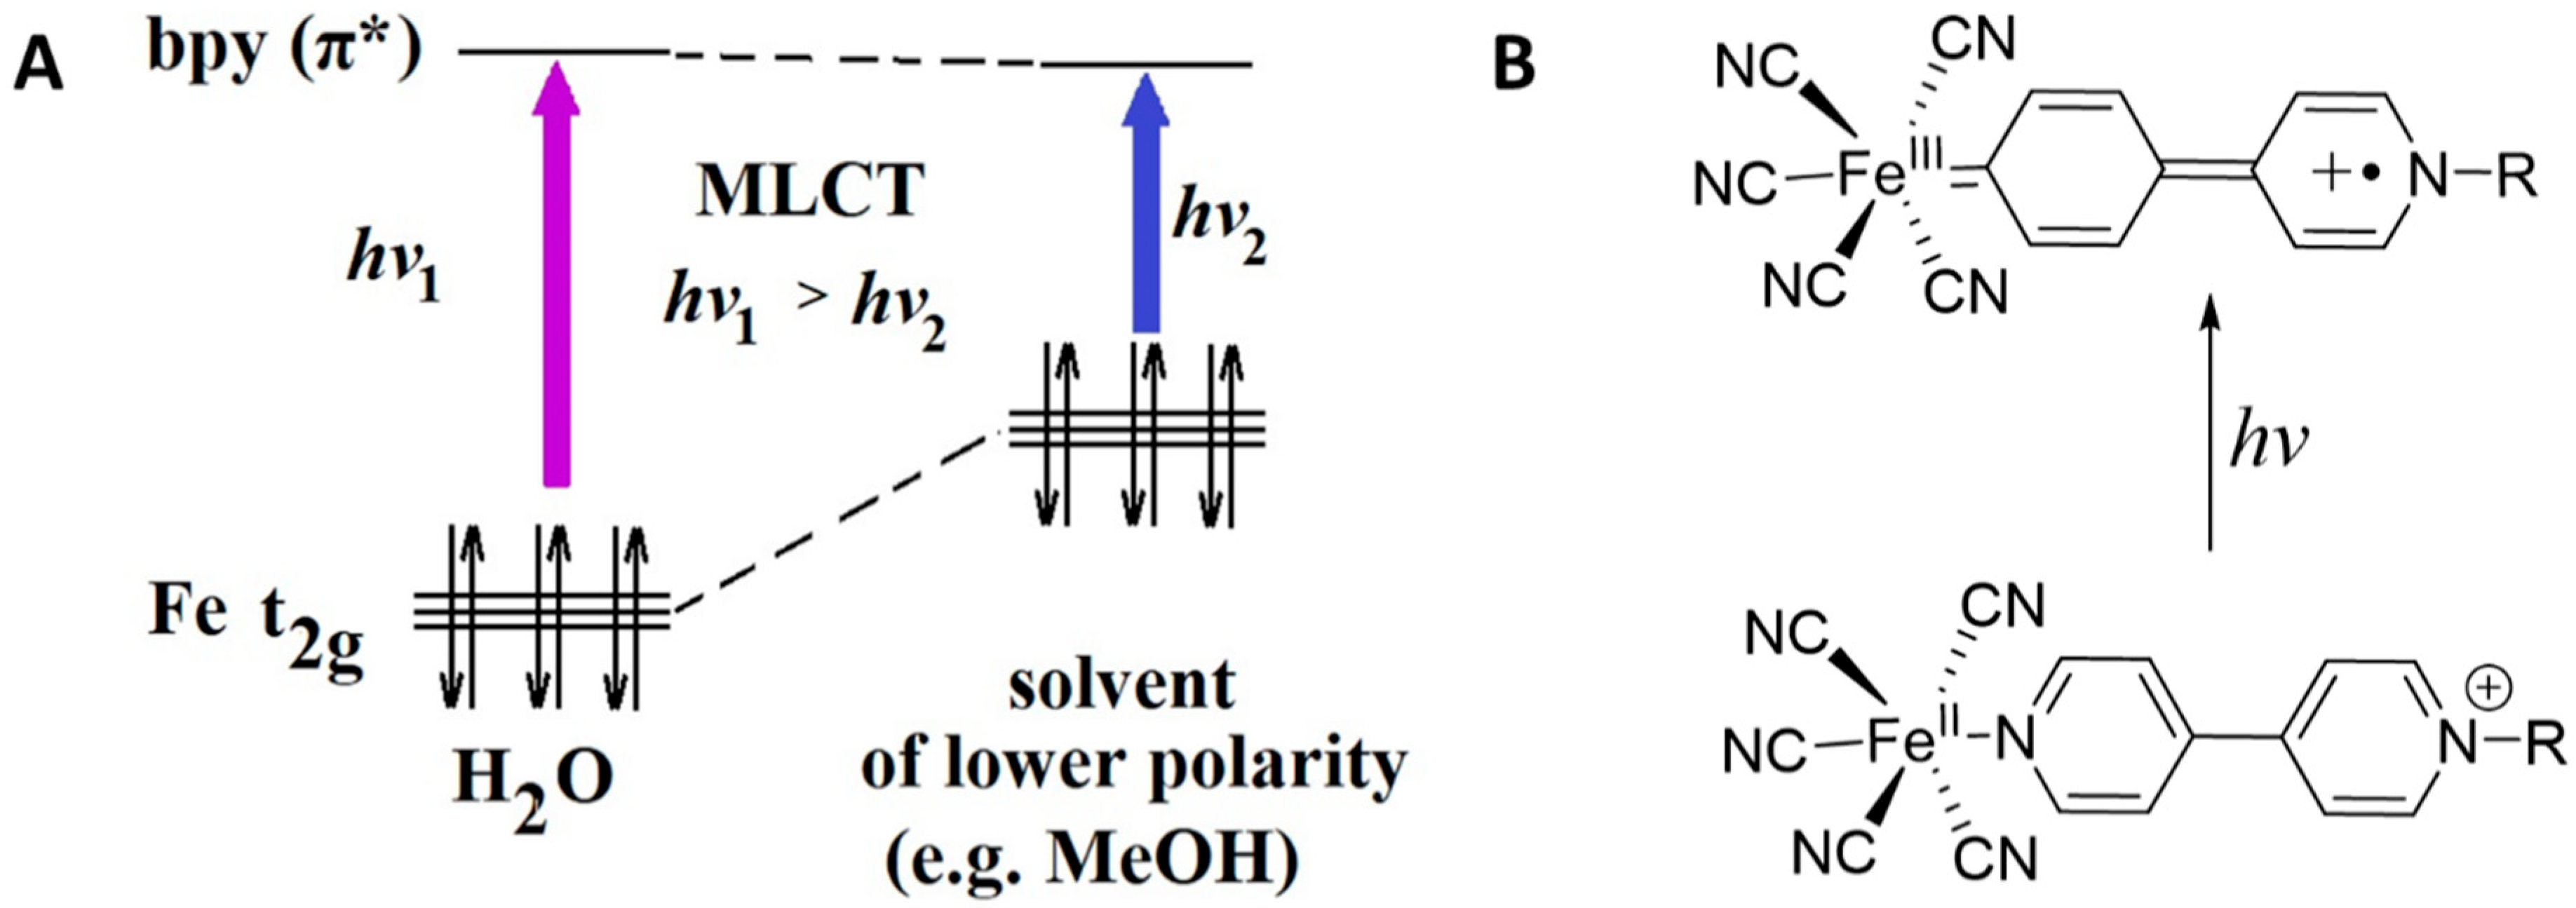
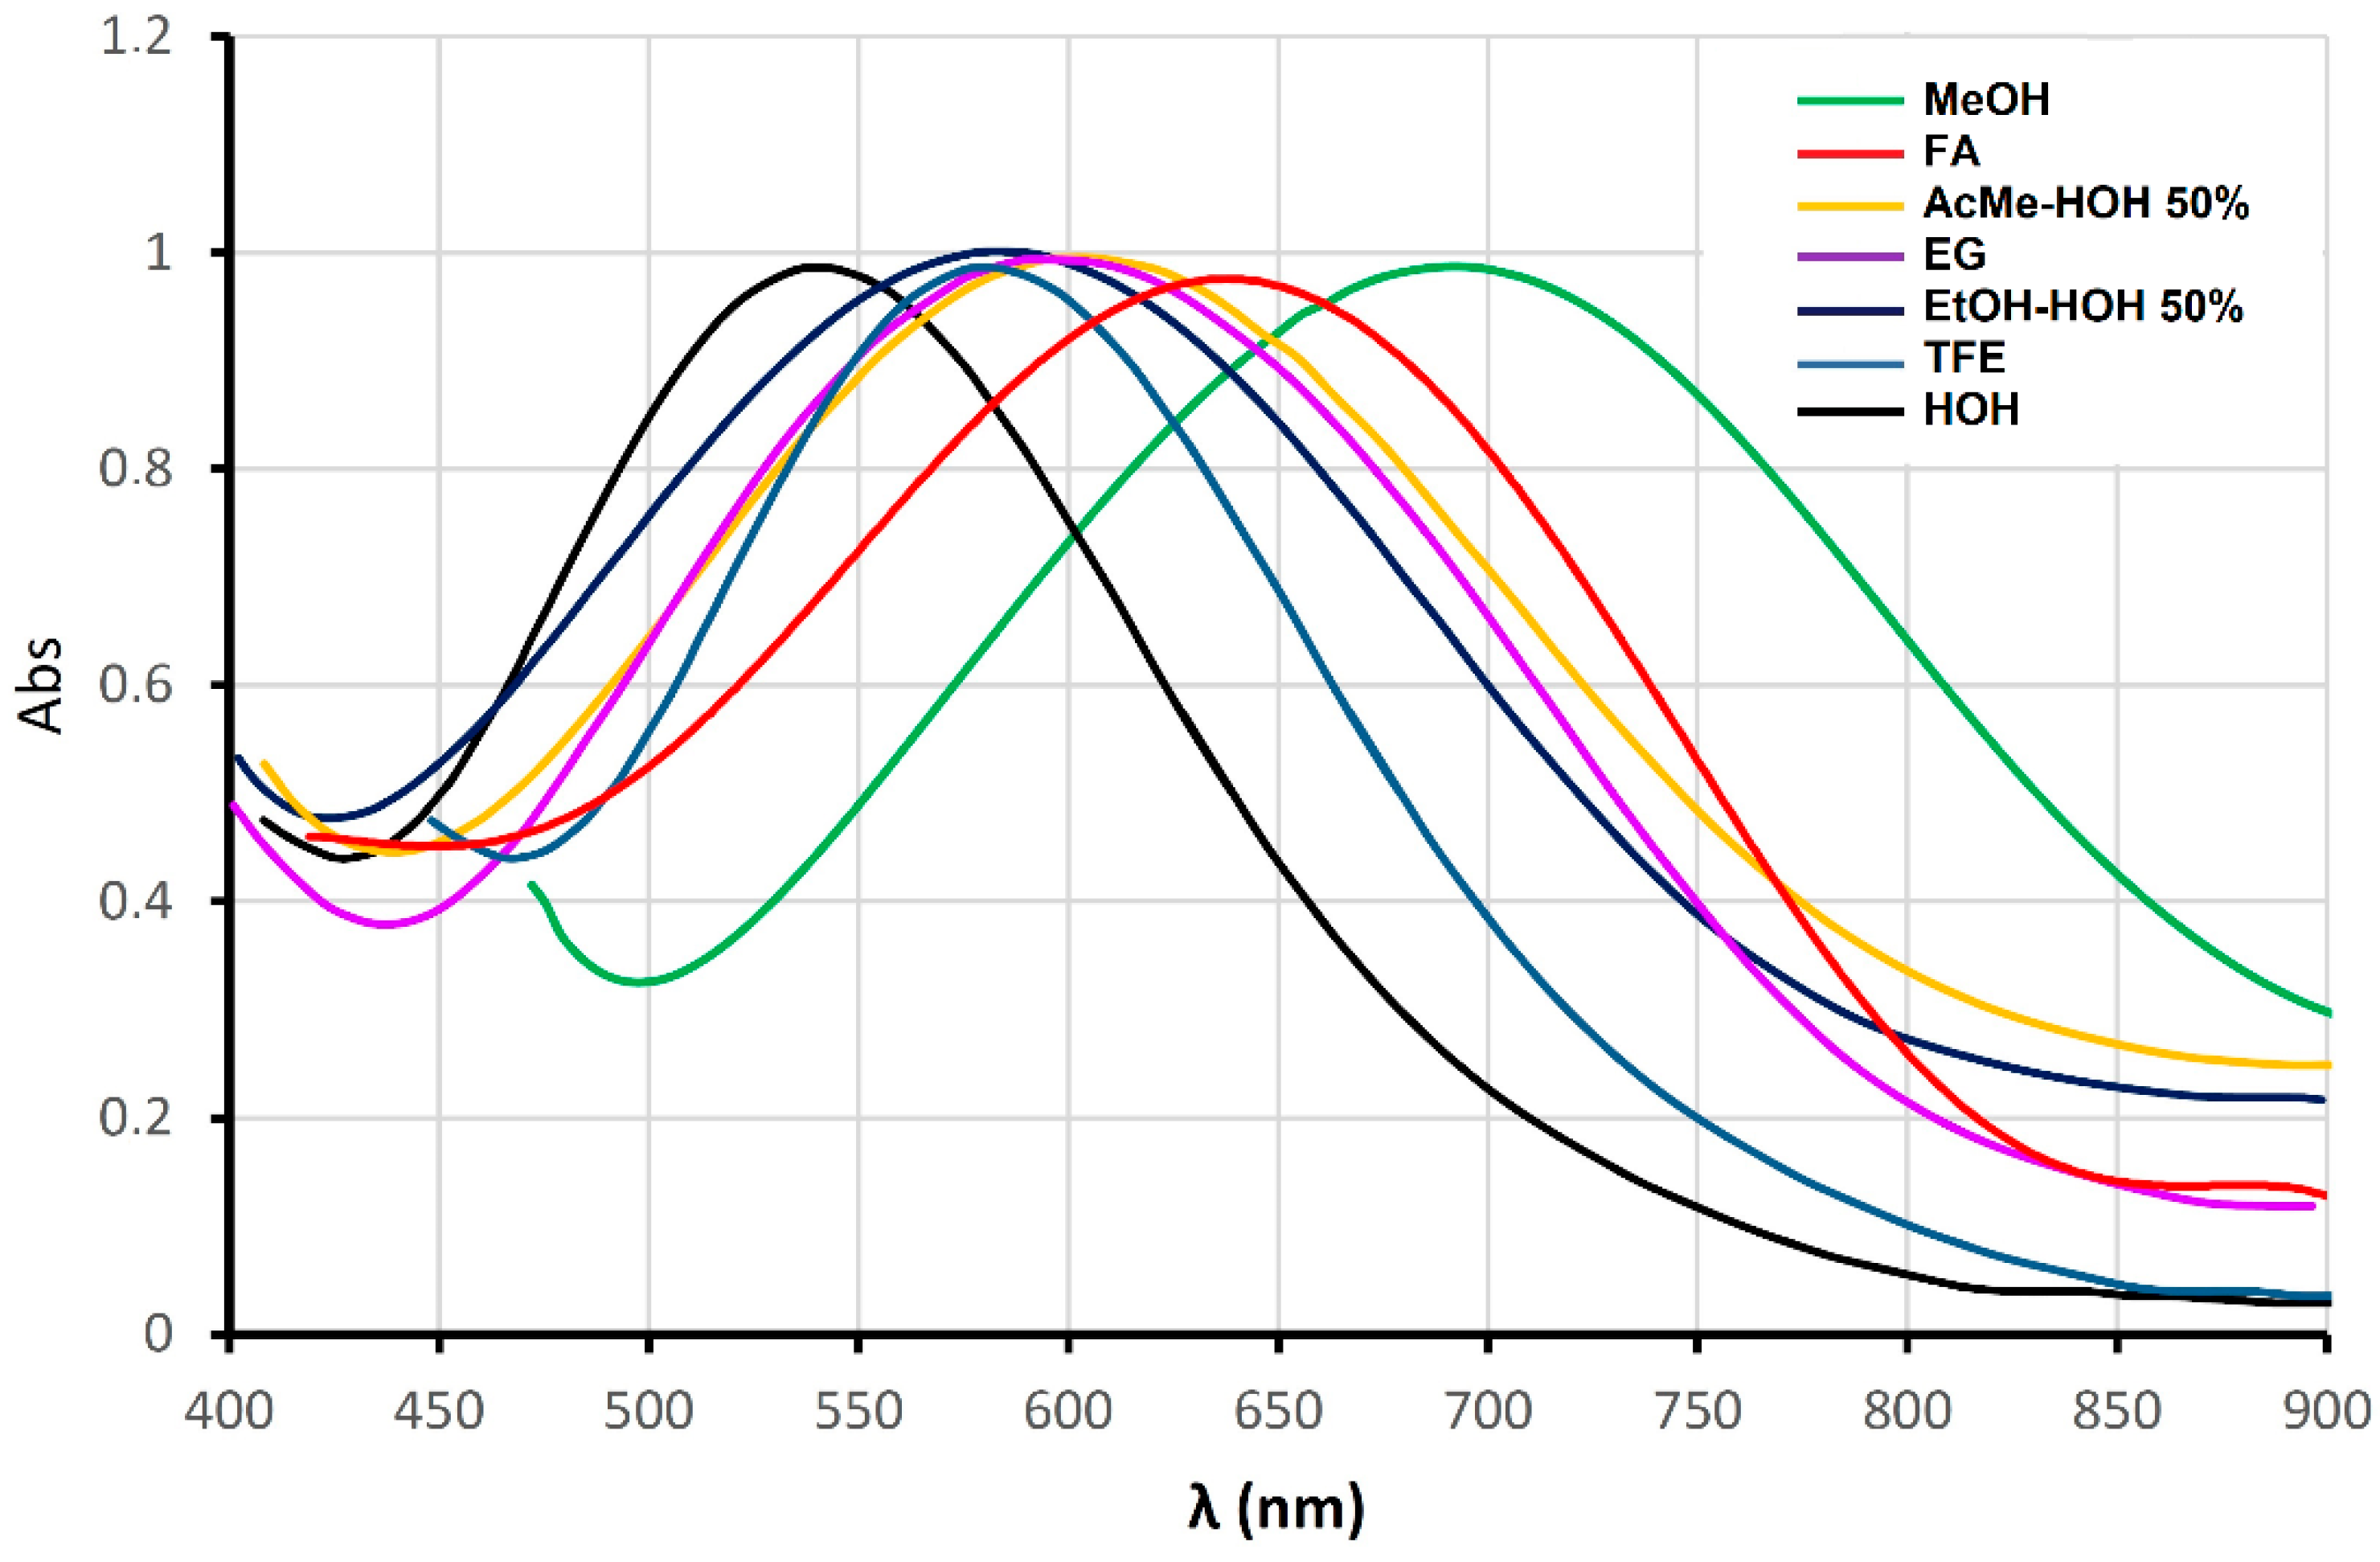
Solvatochromism

| Solvent | (nm)* | (nm)‡ | ) | ) |
|---|---|---|---|---|
| HOH | 534 | 537 | 18.744 | 18.622 |
| TFE | 572† | 577 | 17.470 | 17.341 |
| Glycerol | 605 | 610 | 16.529 | 16.389 |
| EtOH50% | 585 | 585 | 17.094 | 17.094 |
| EG | 600 | 599 | 16.667 | 16.705 |
| FA | 628 | 638 | 15.923 | 15.664 |
| MeOH | 671 | 690 | 14.903 | 14.497 |
| AcMe50% | 599 | 604 | 16.694 | 16.564 |
| NMF | 626 | 625 | 15.978 | 16.009 |
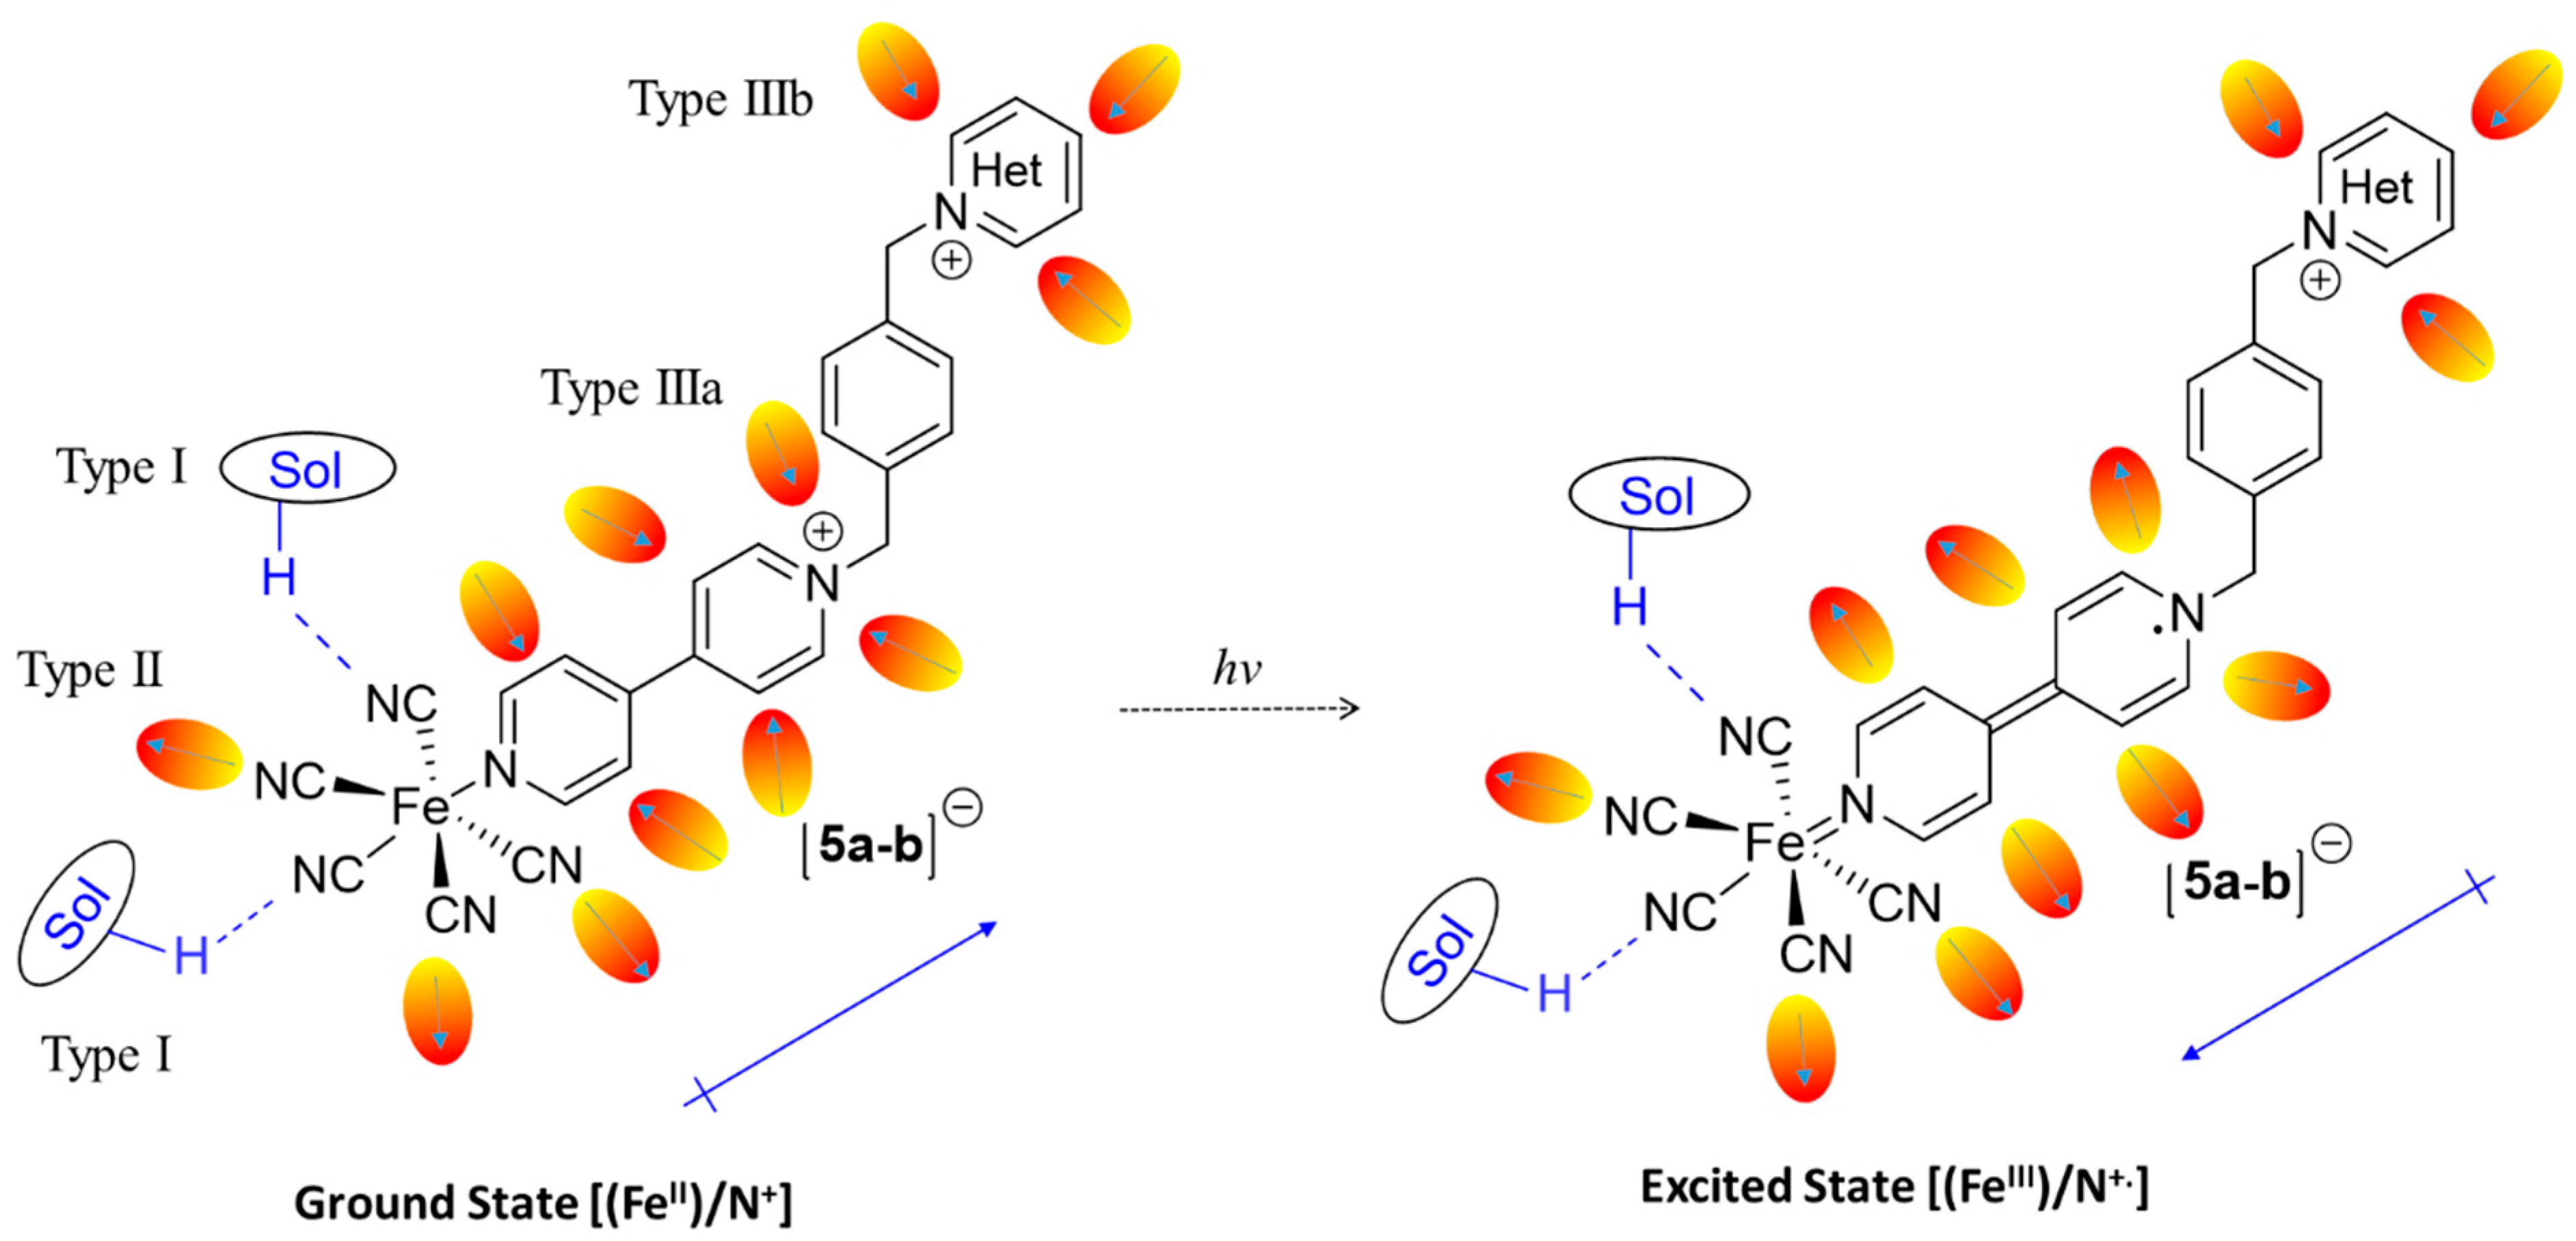
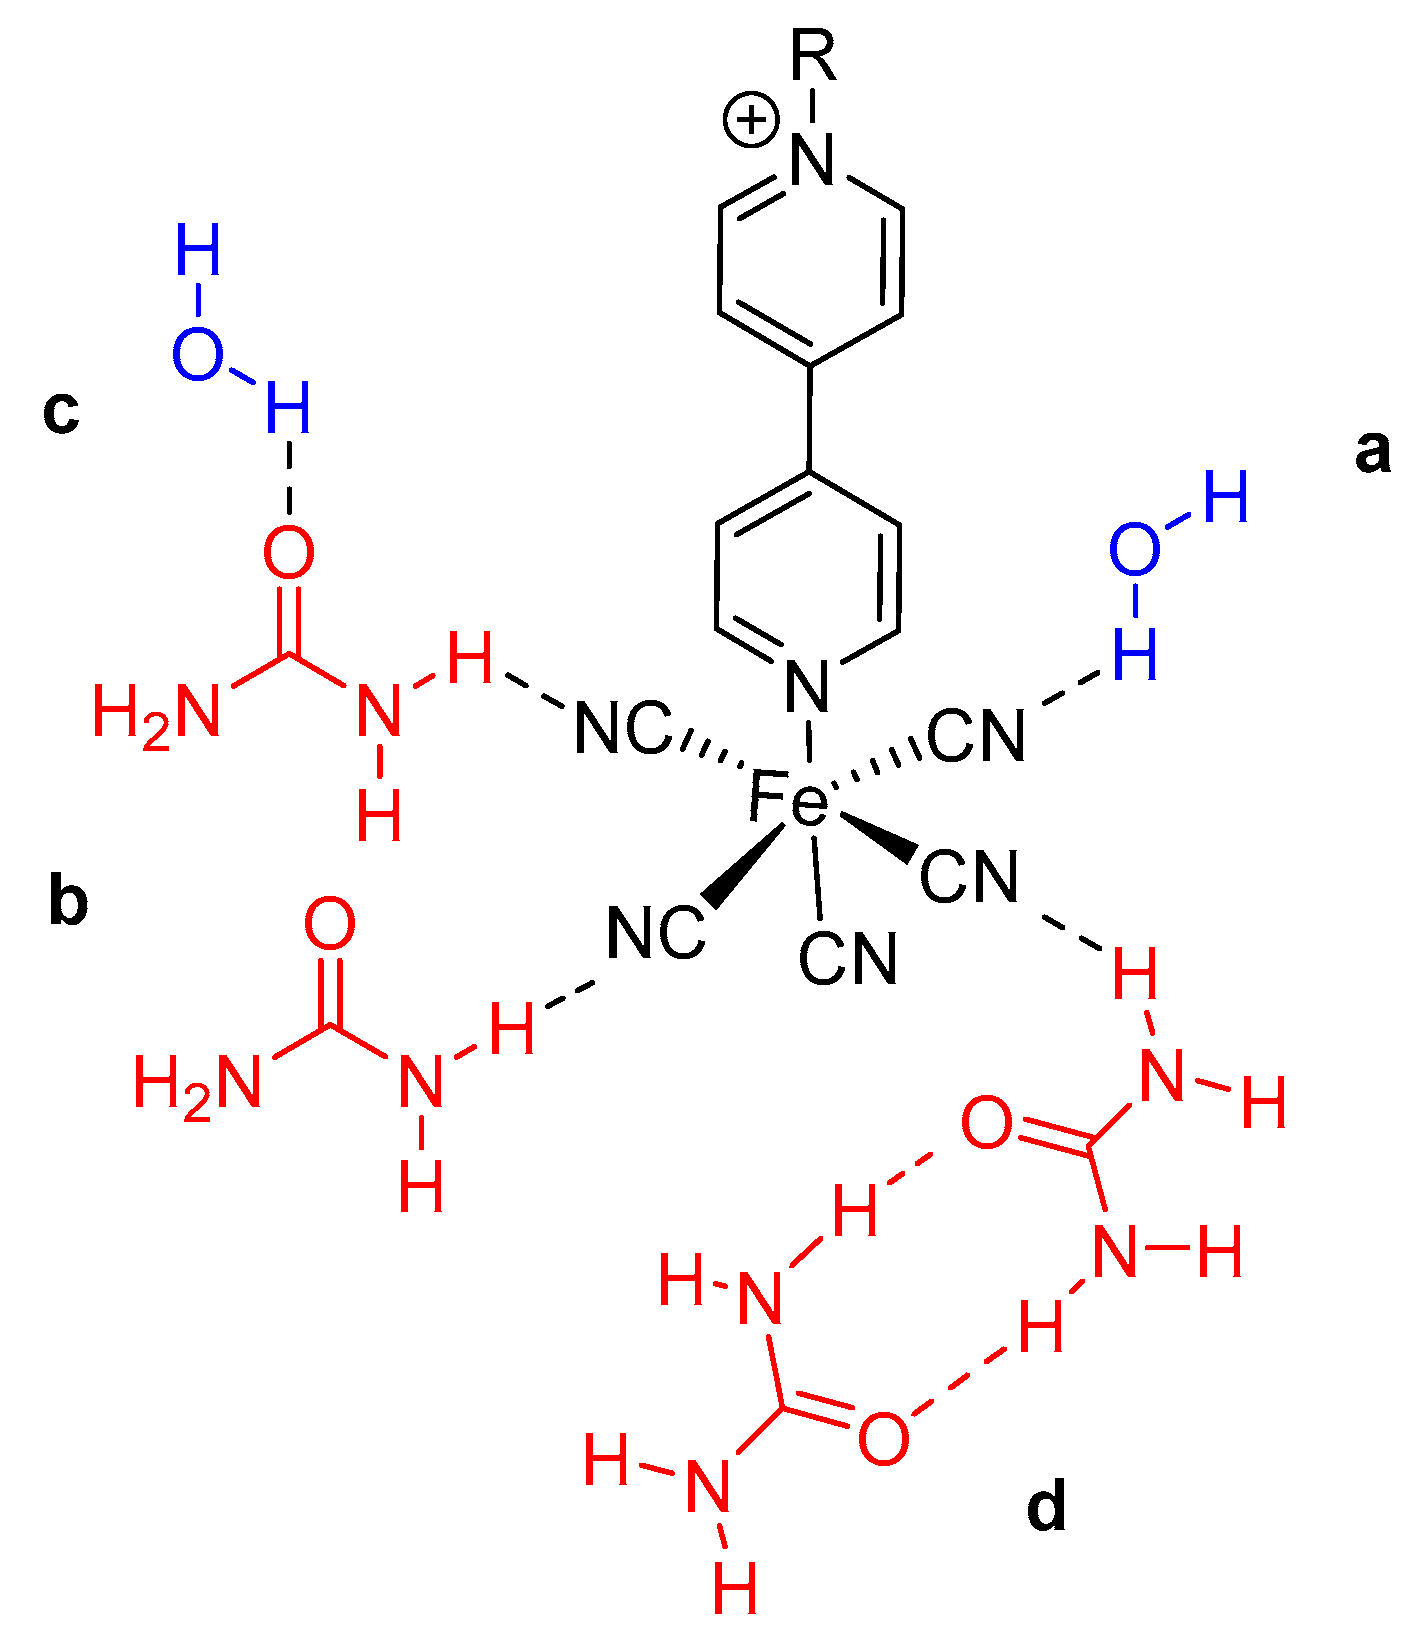
Types of Solute-Solvent Interactions
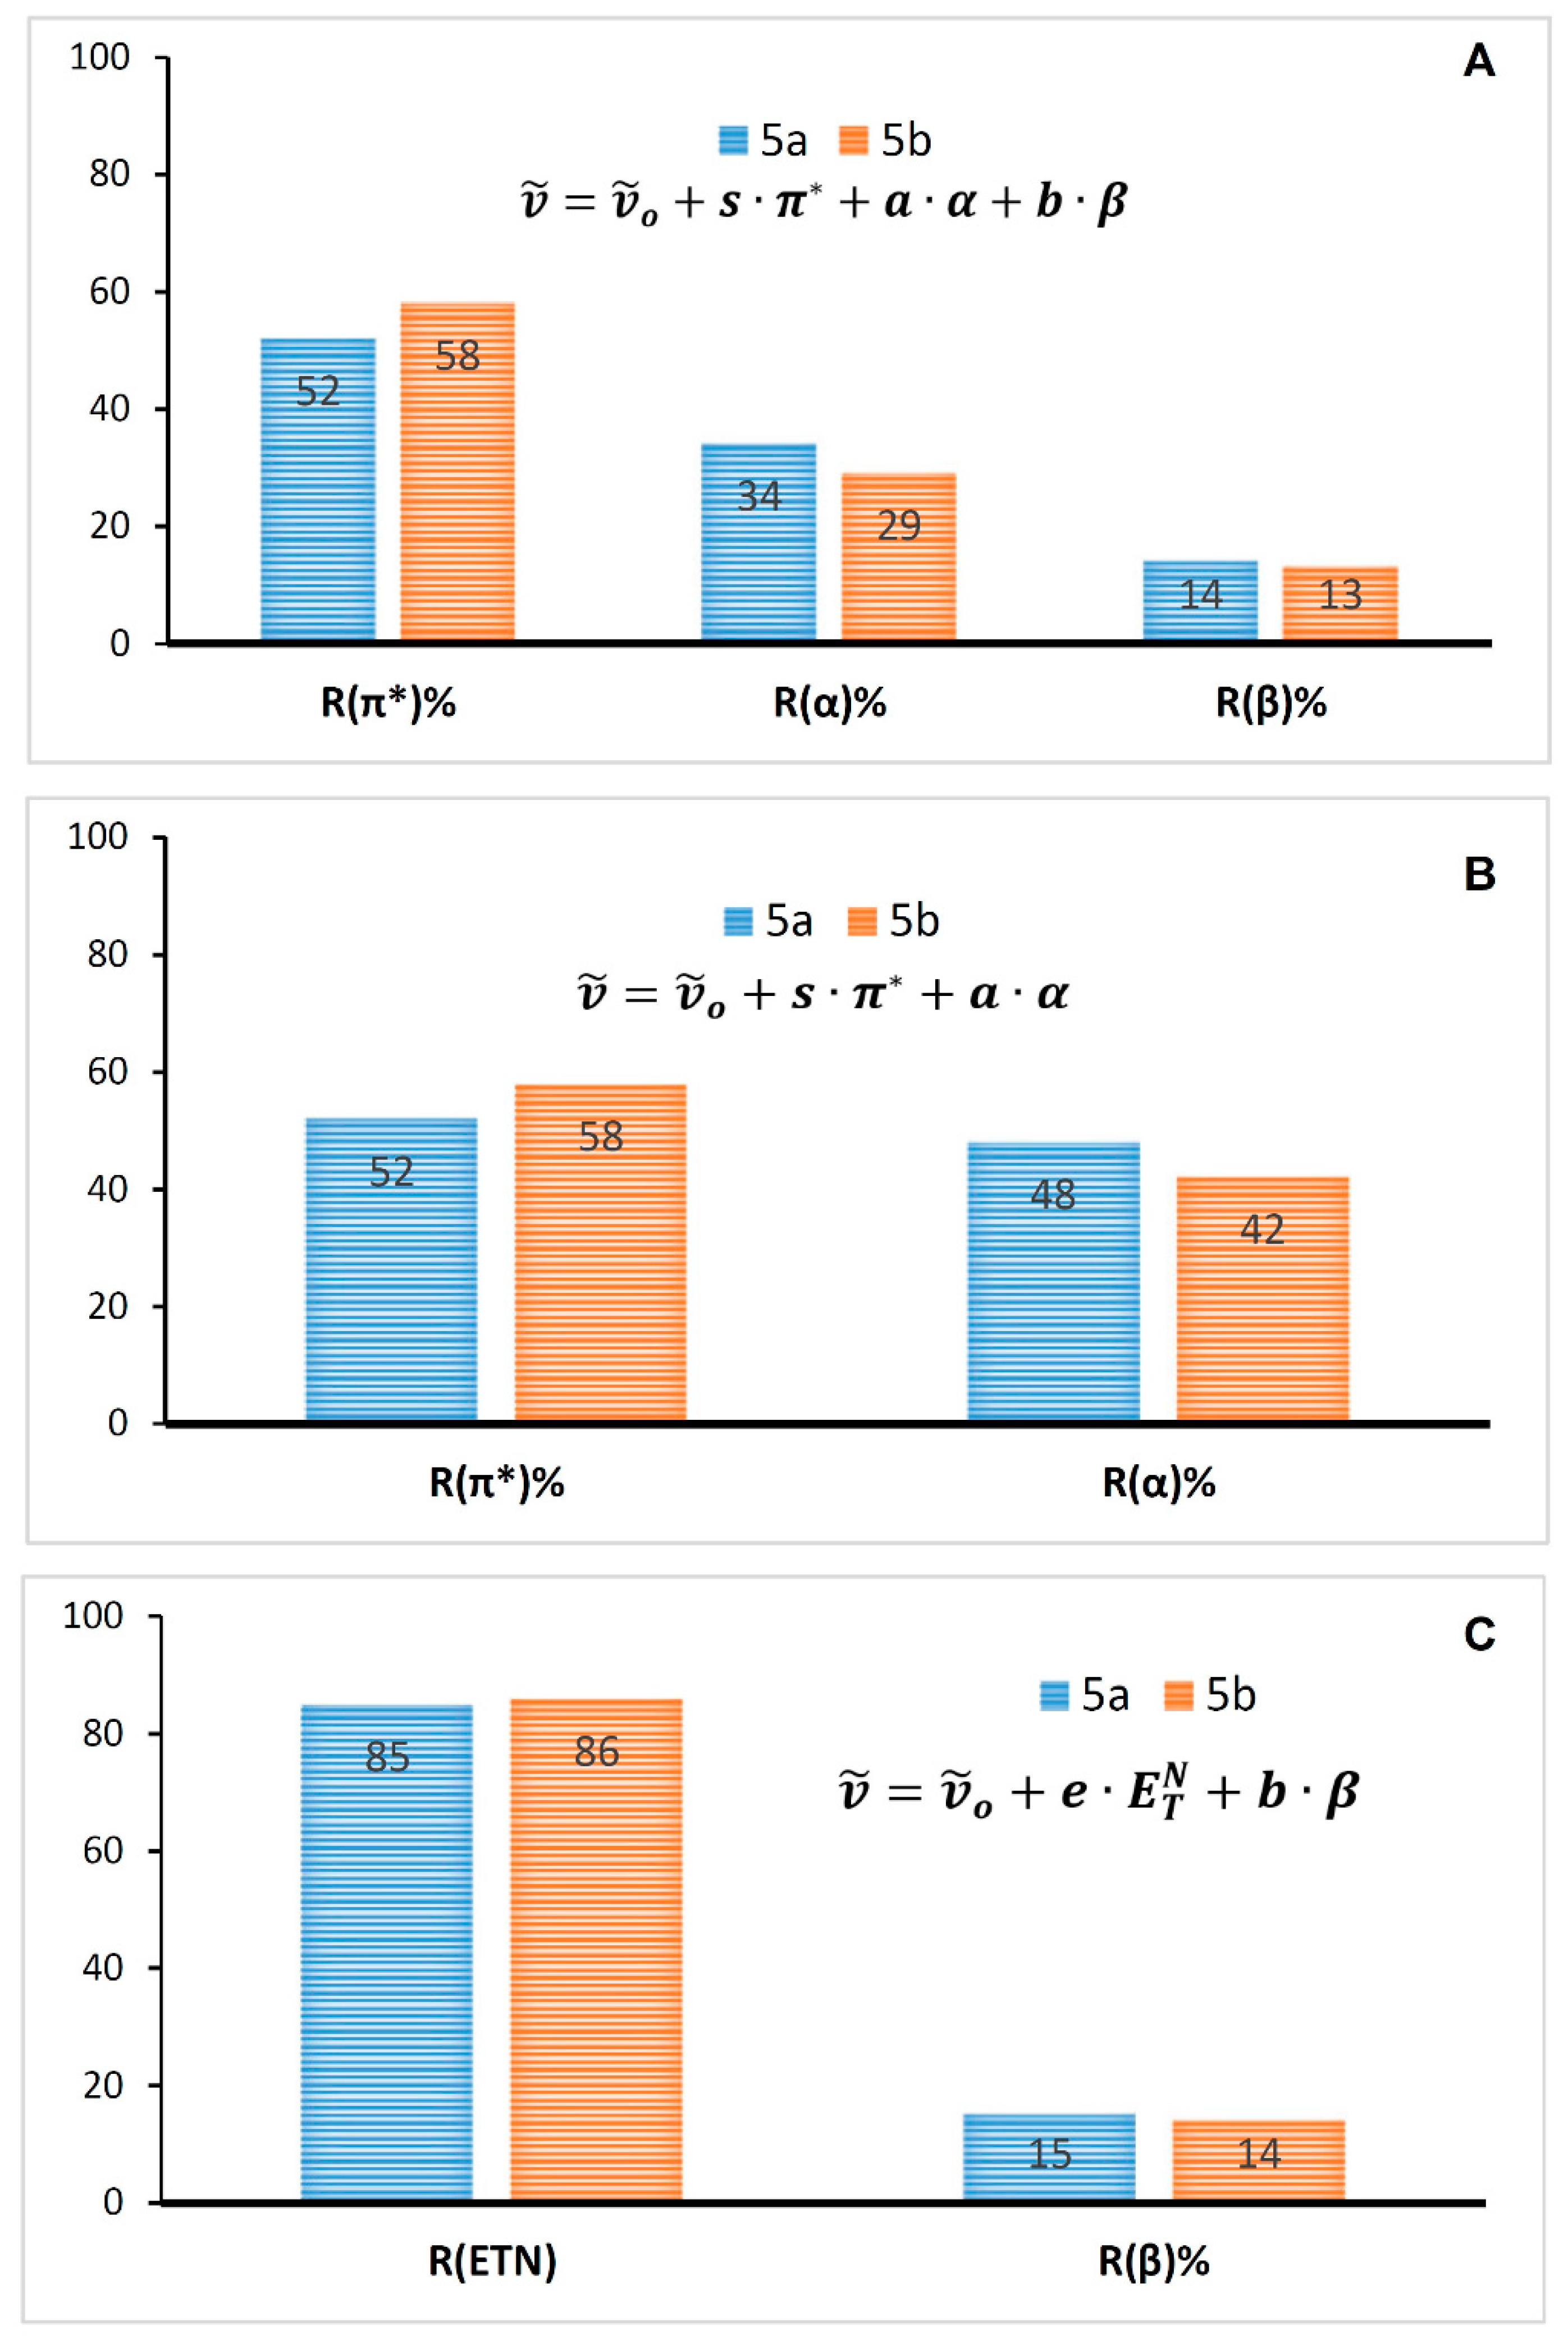
Using LSERs to Rationalize the Solvatochromic Effects
Determination of Electronic Ground and Excited State Dipole Moments
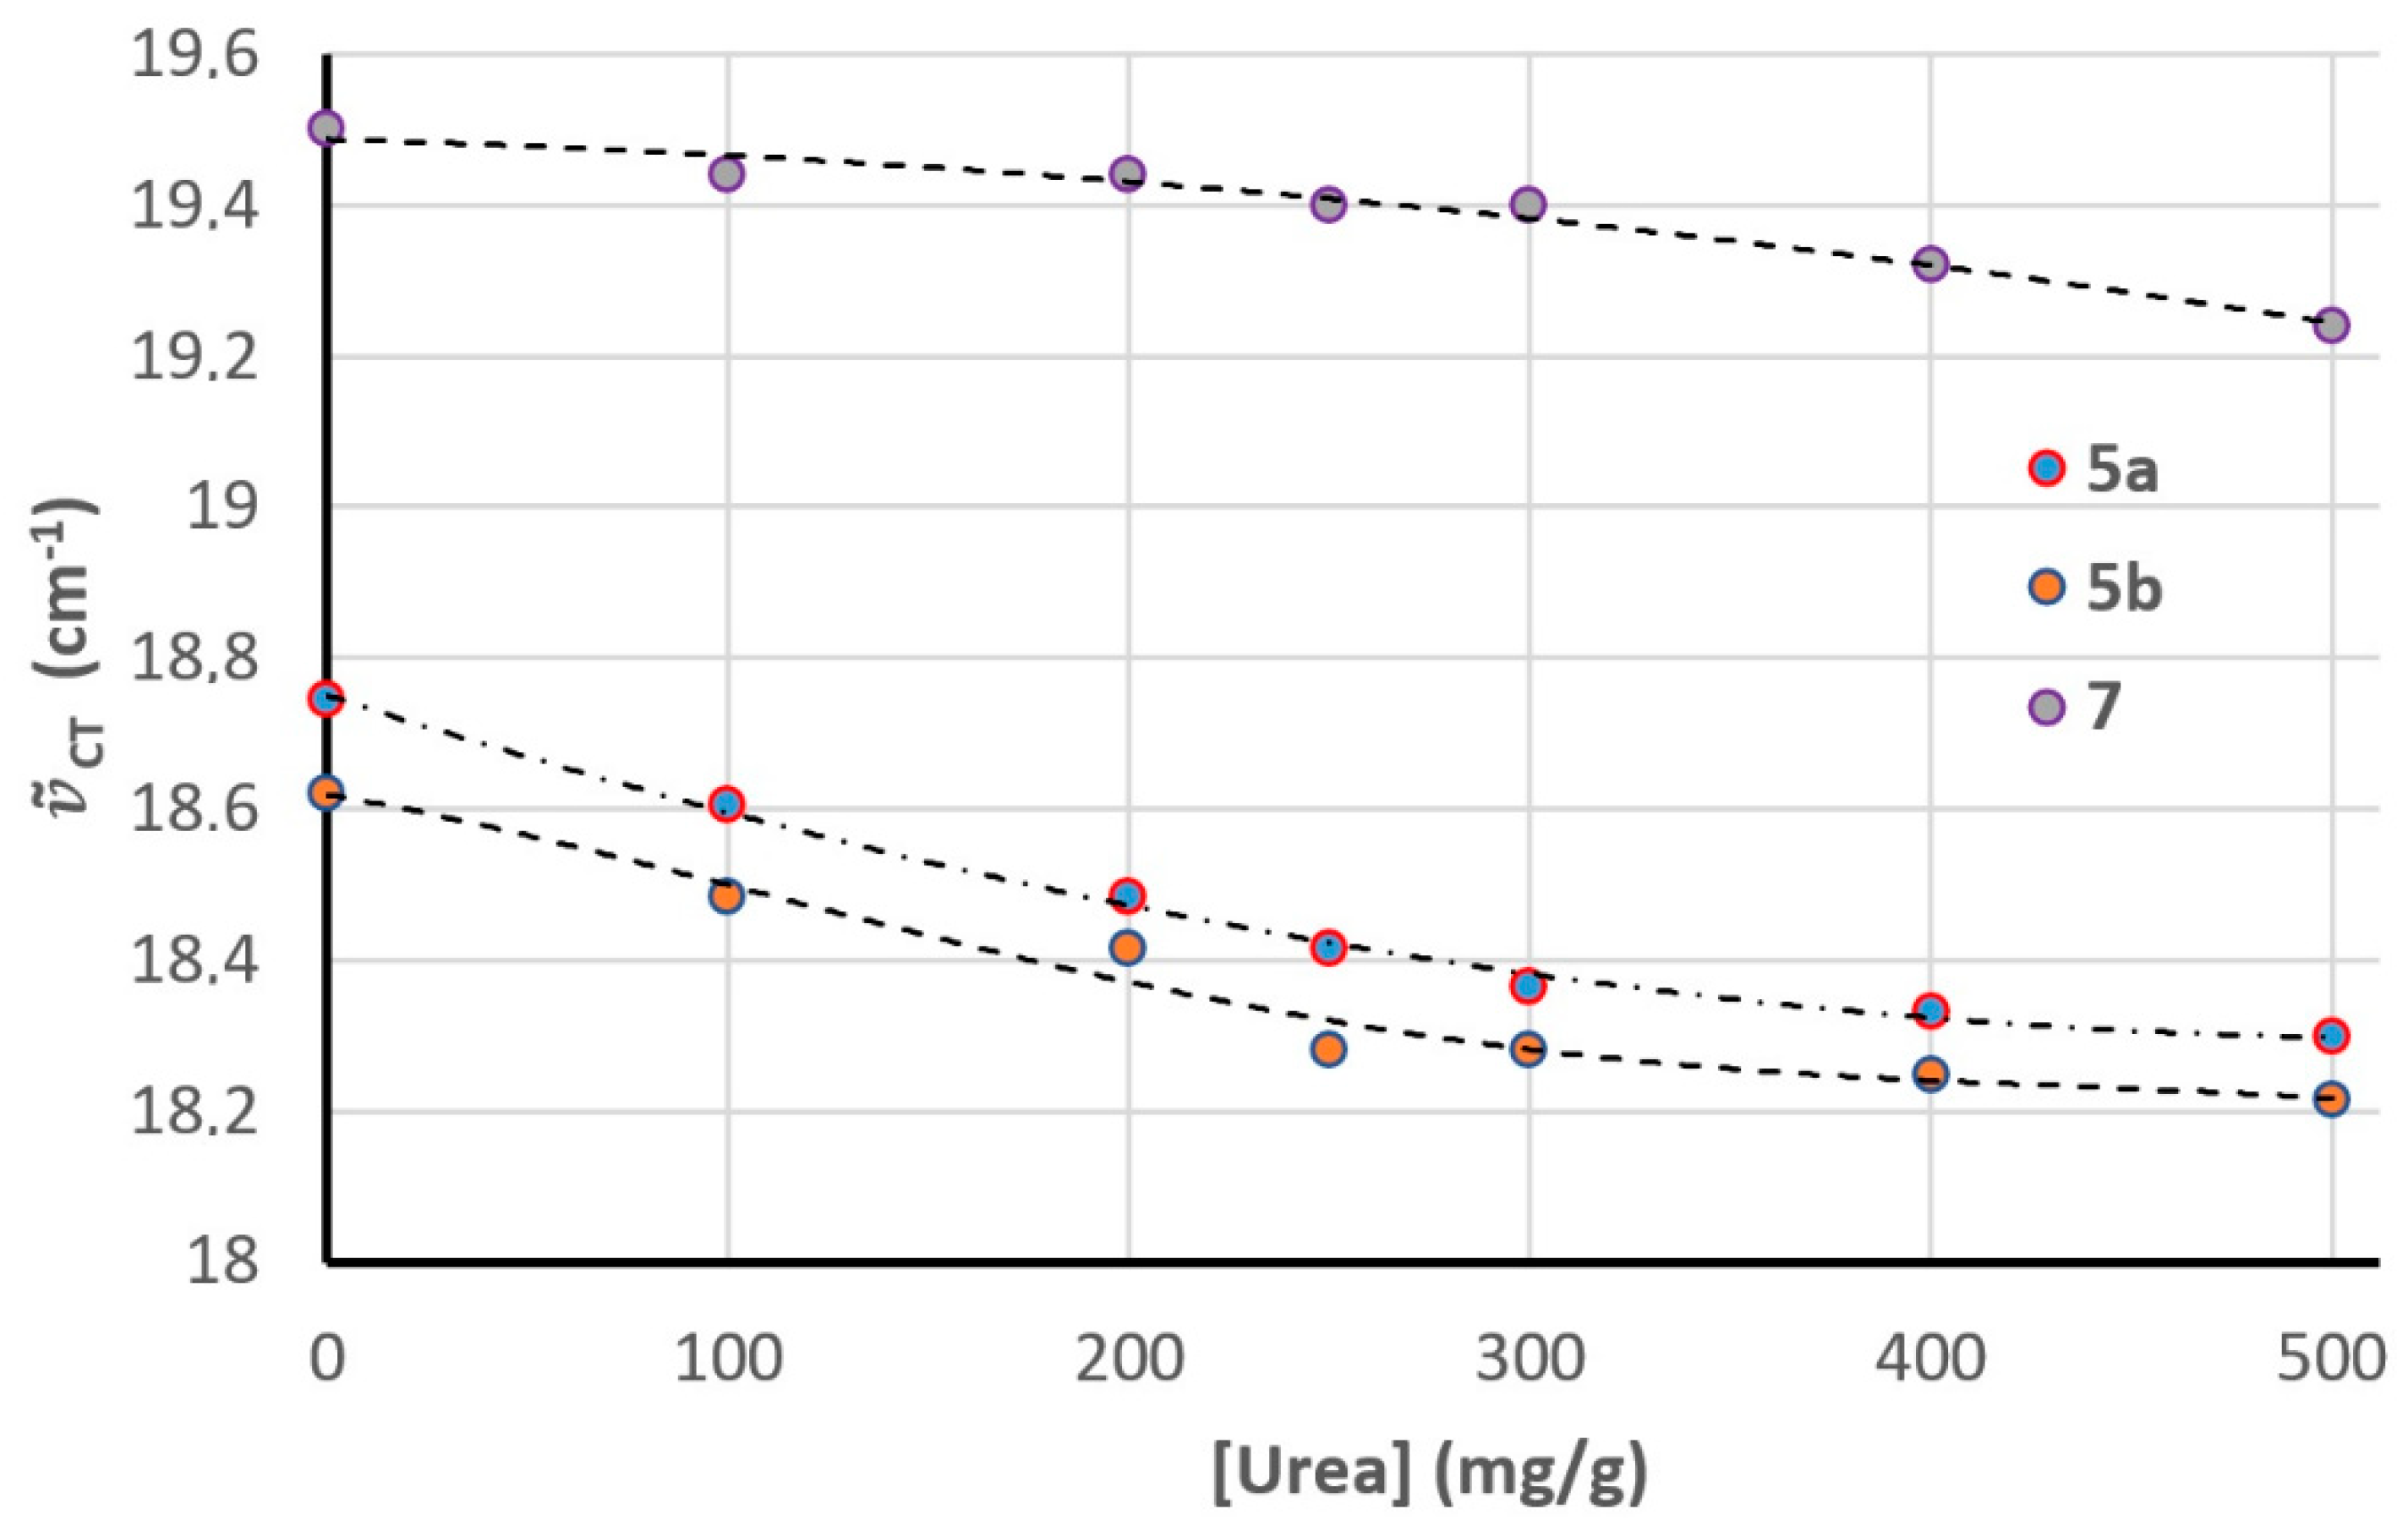
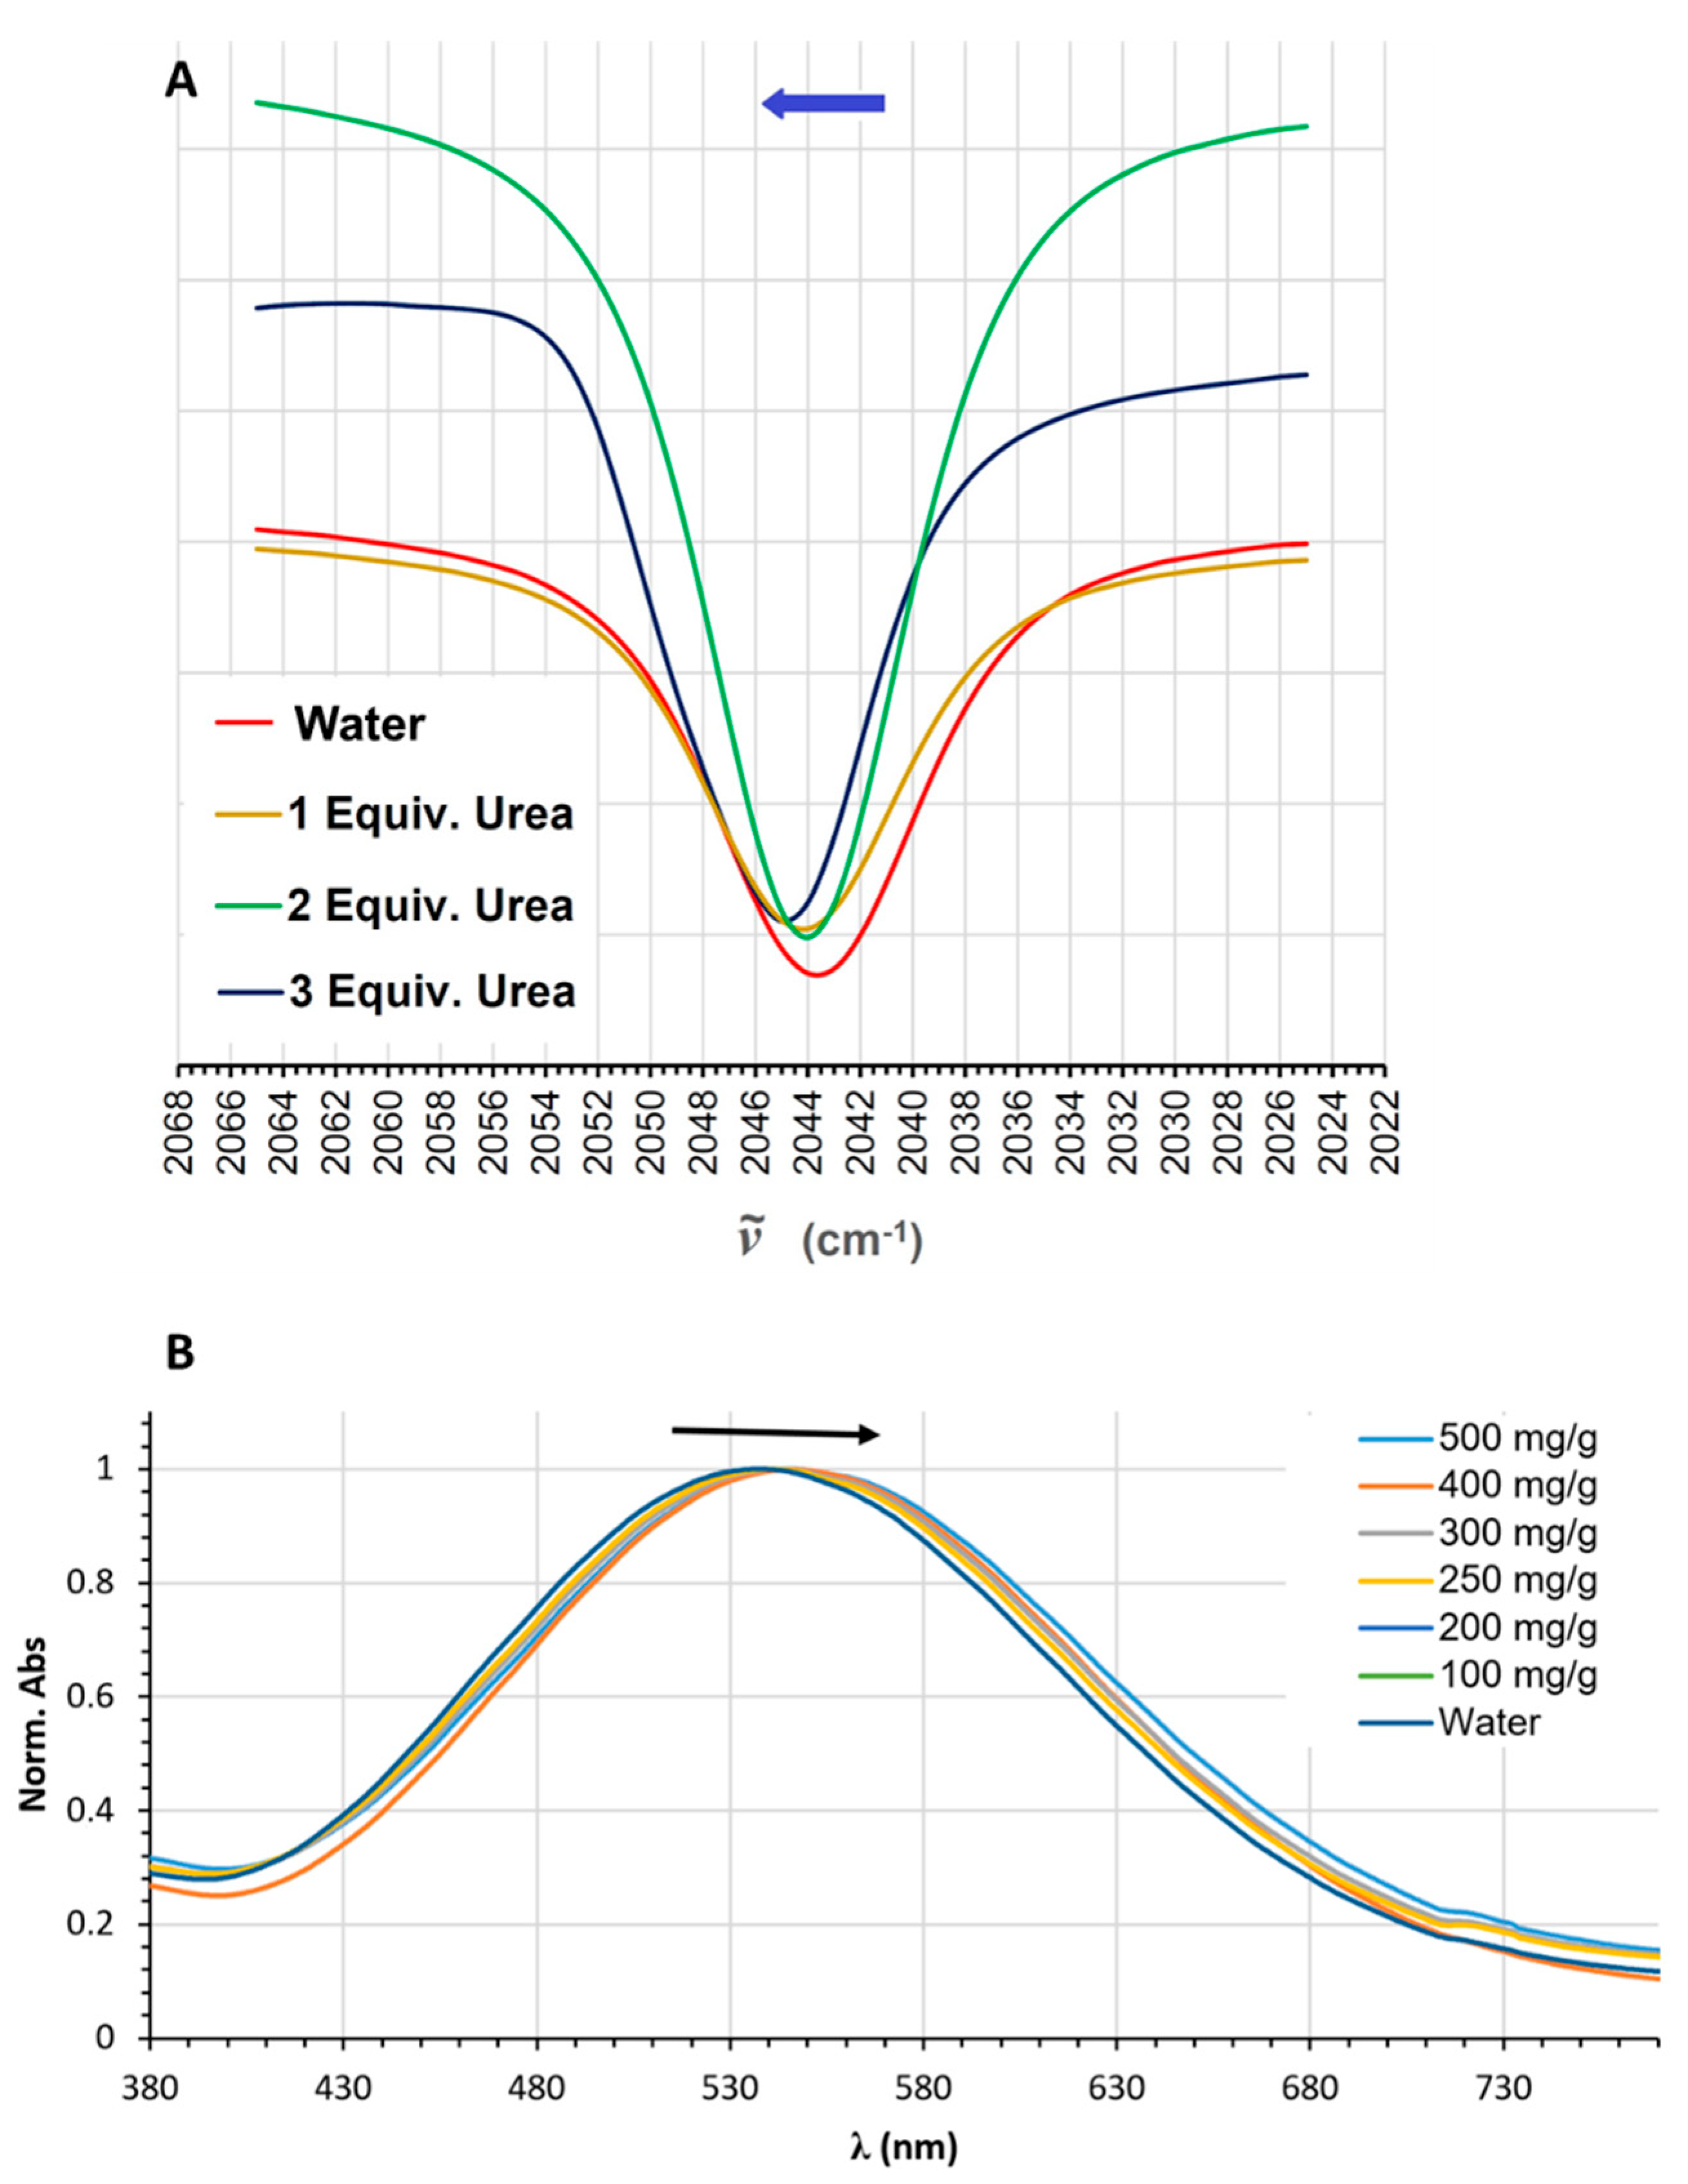
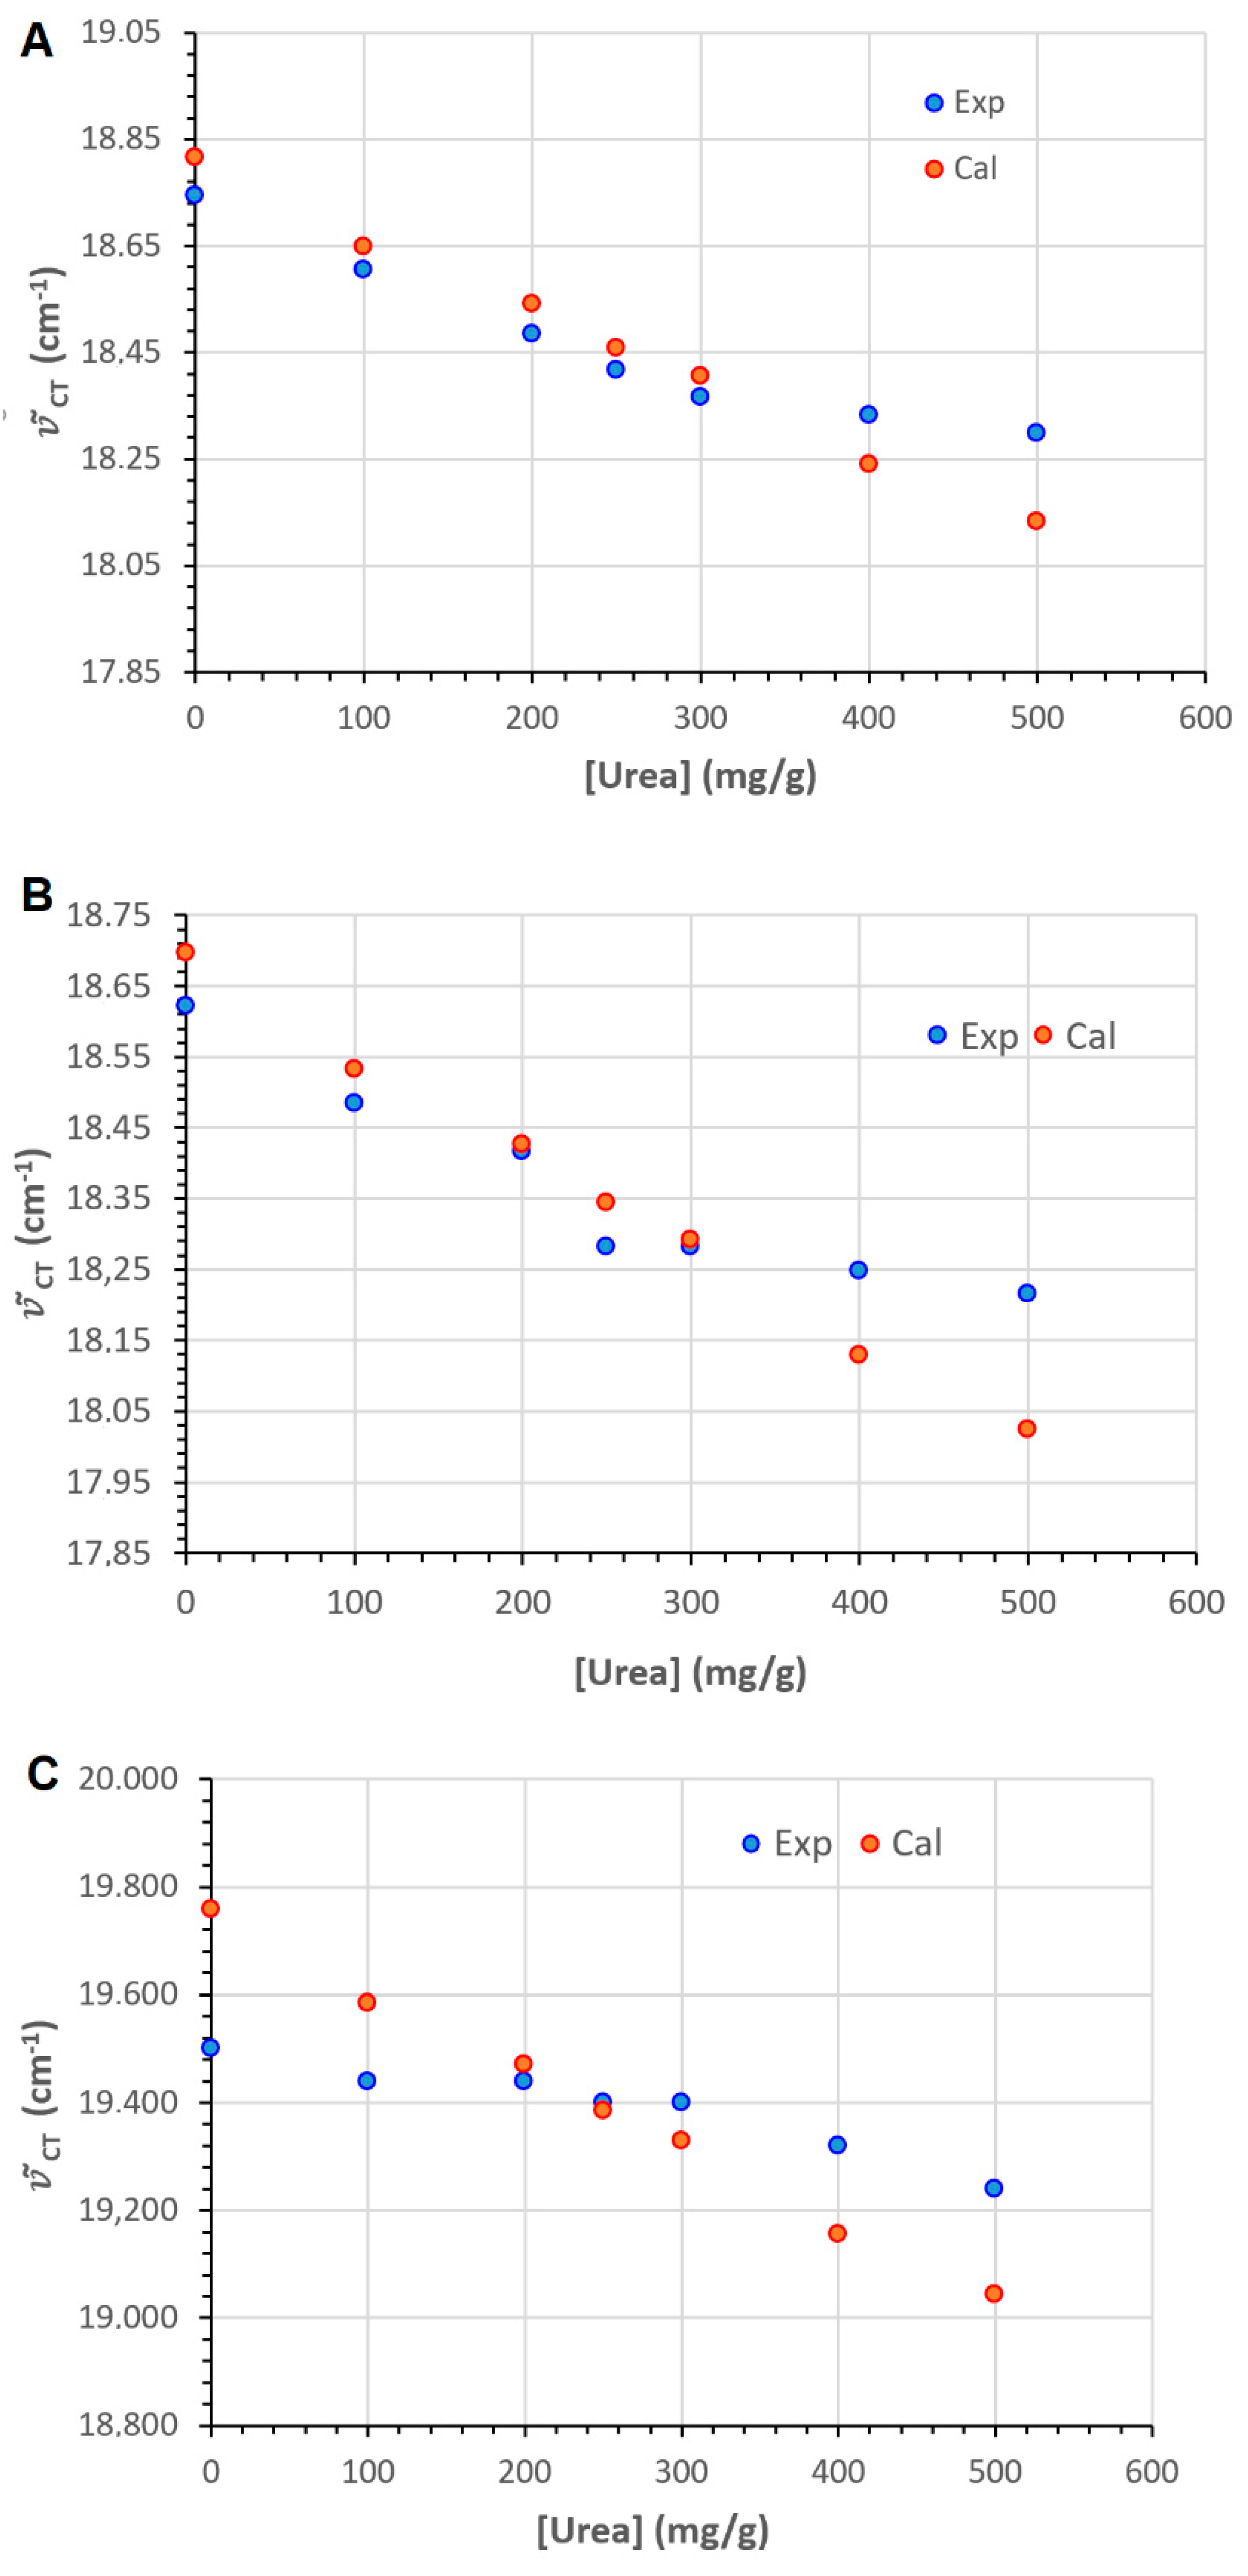
Polarity Sensing in Aqueous Urea
An Inverted Solvatochromic Effect or a Pronounced Specific Effect?
Conclusions
Materials and Methods
Materials
Computations
- Determination of Relative Importance (Contribution) of Each of the Parameters Involved in the LSERS
- Model Describing Aqueous Urea Solvatochromic Sensing
Spectroscopic and Analytical Methods
Syntheses
General Method for the Synthesis of Products (3a-b)
2.-(4-(. chloromethyl)benzyl)isoquinolin-2-ium (3b)
Preparation of Products (4a-b)
2.-(4-([4,4'-. bipyridin]-1-ium-1-ylmethyl)benzyl)isoquinolin-2-ium: Ligand: Ligand 4b
General Method for the Synthesis of Solvatochromic Products (5a-b)
Solvatochromic Complex 5b
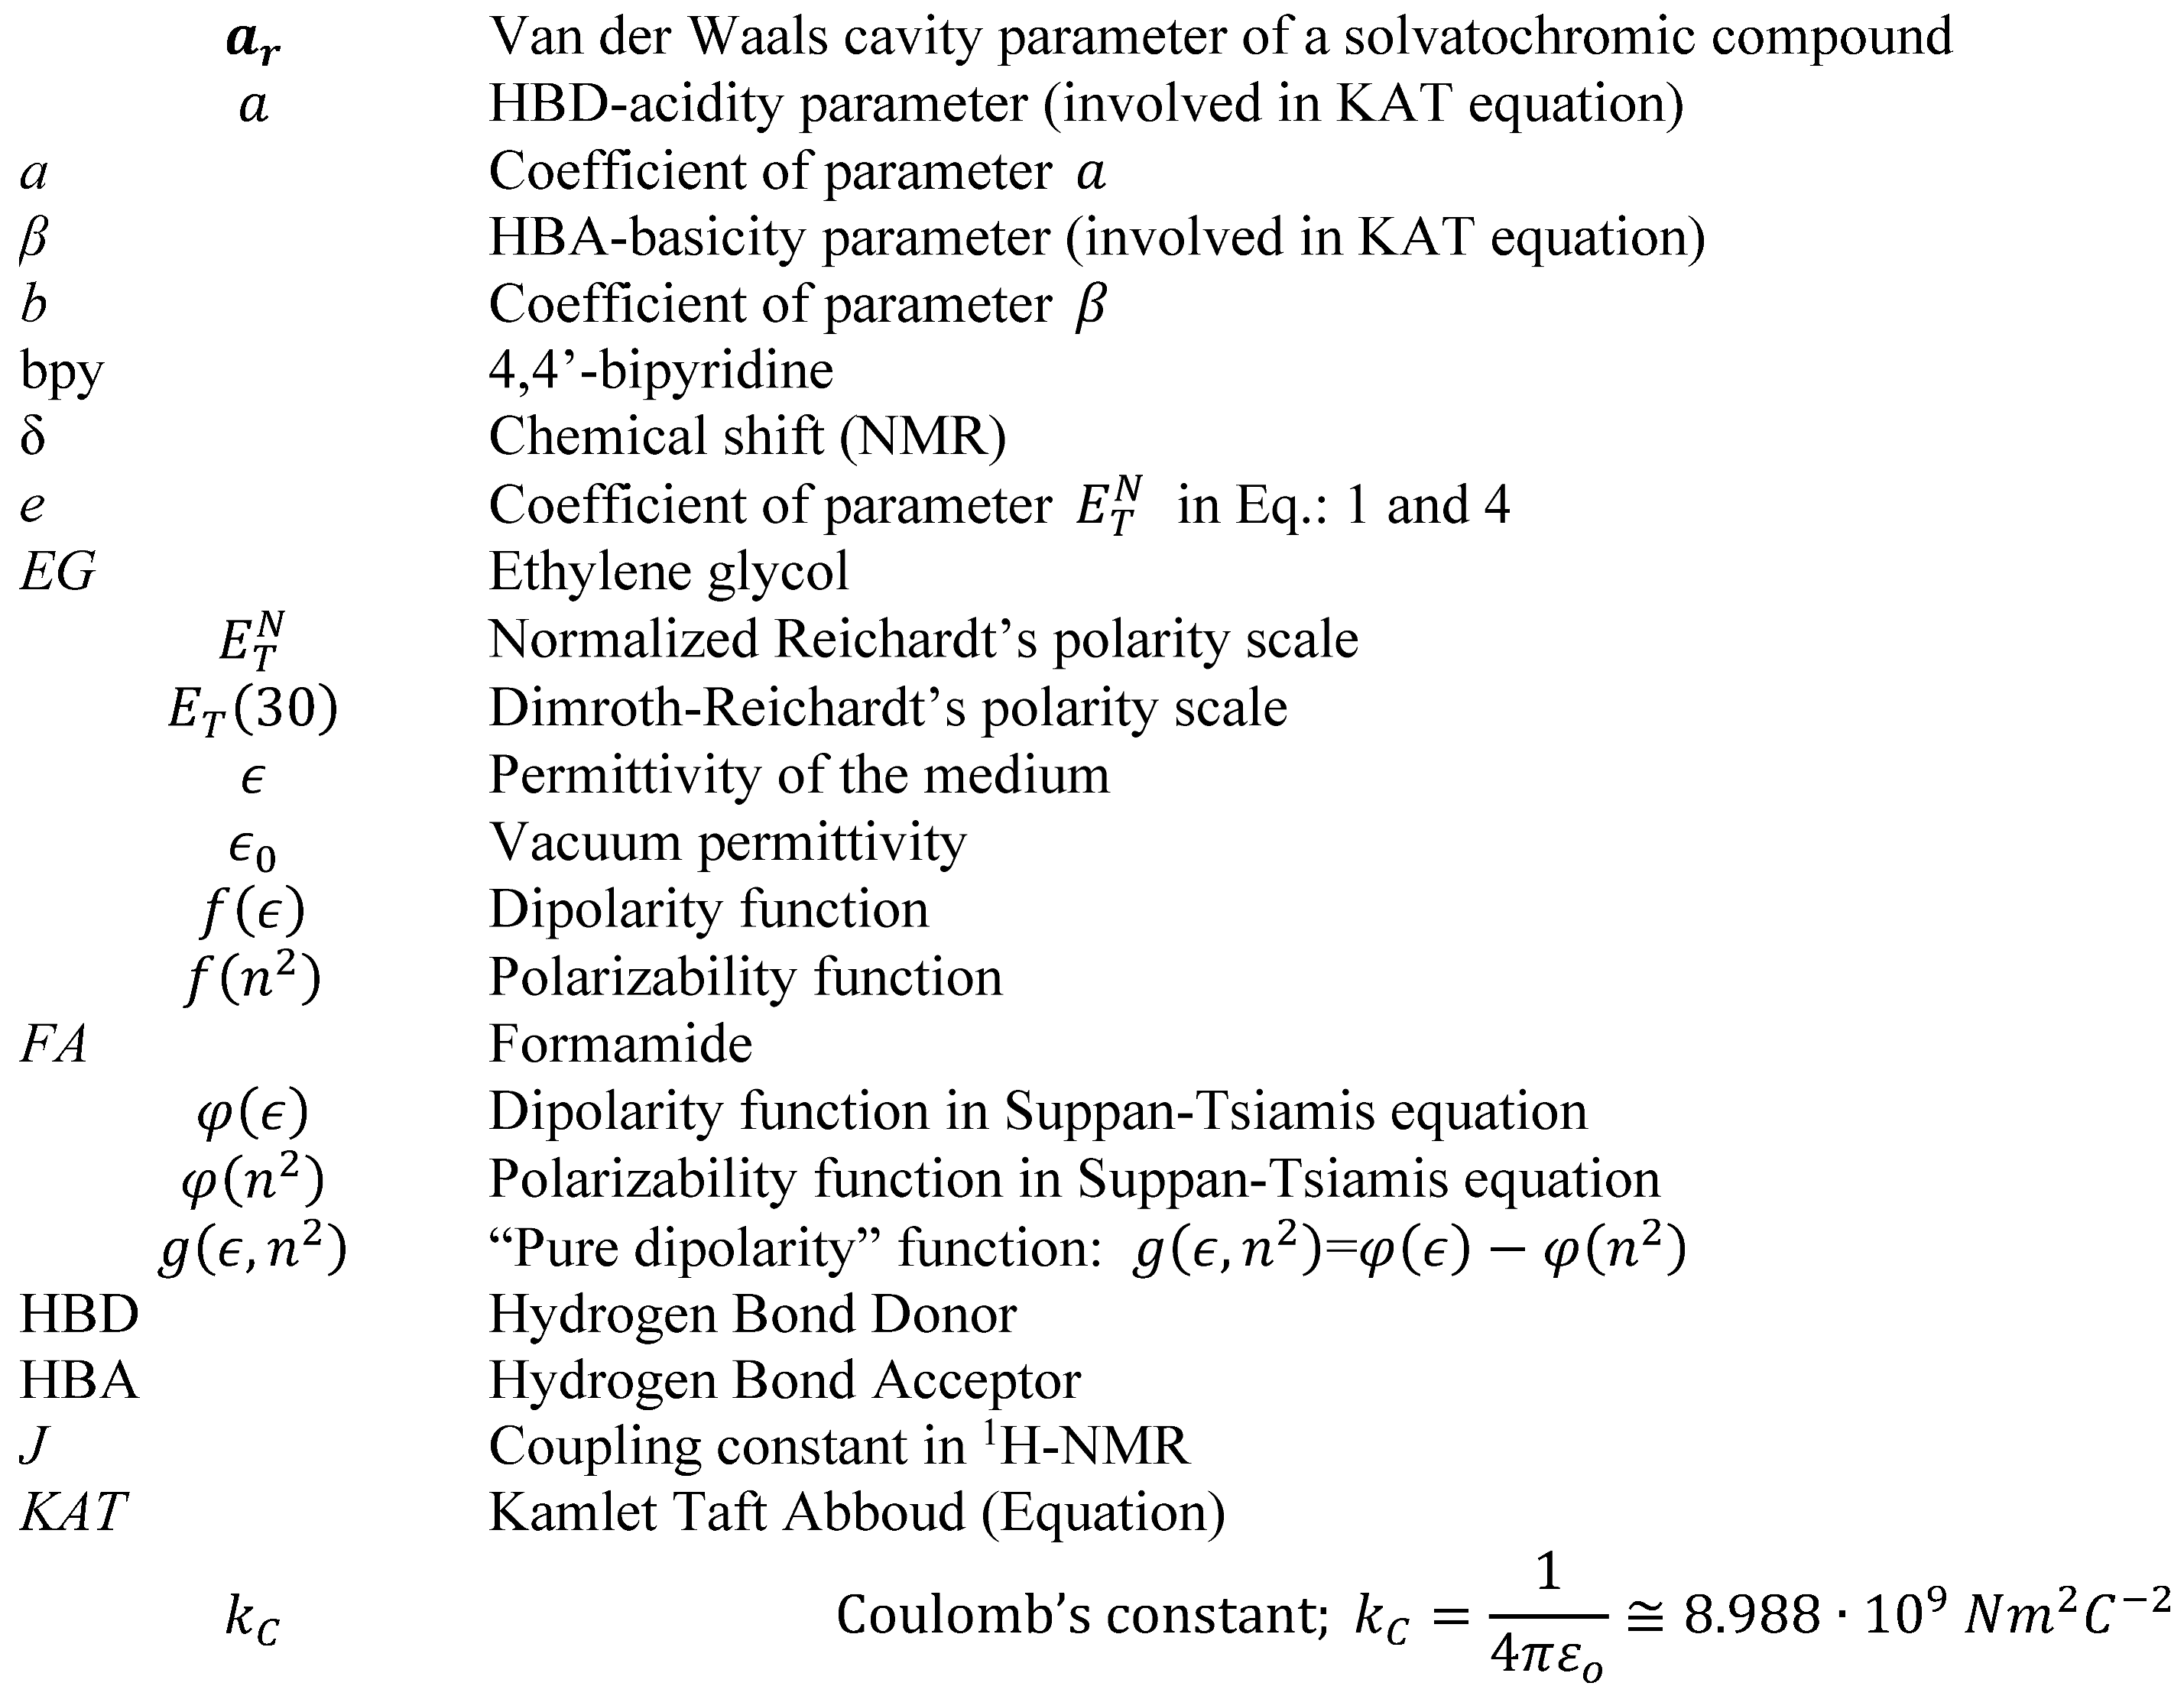
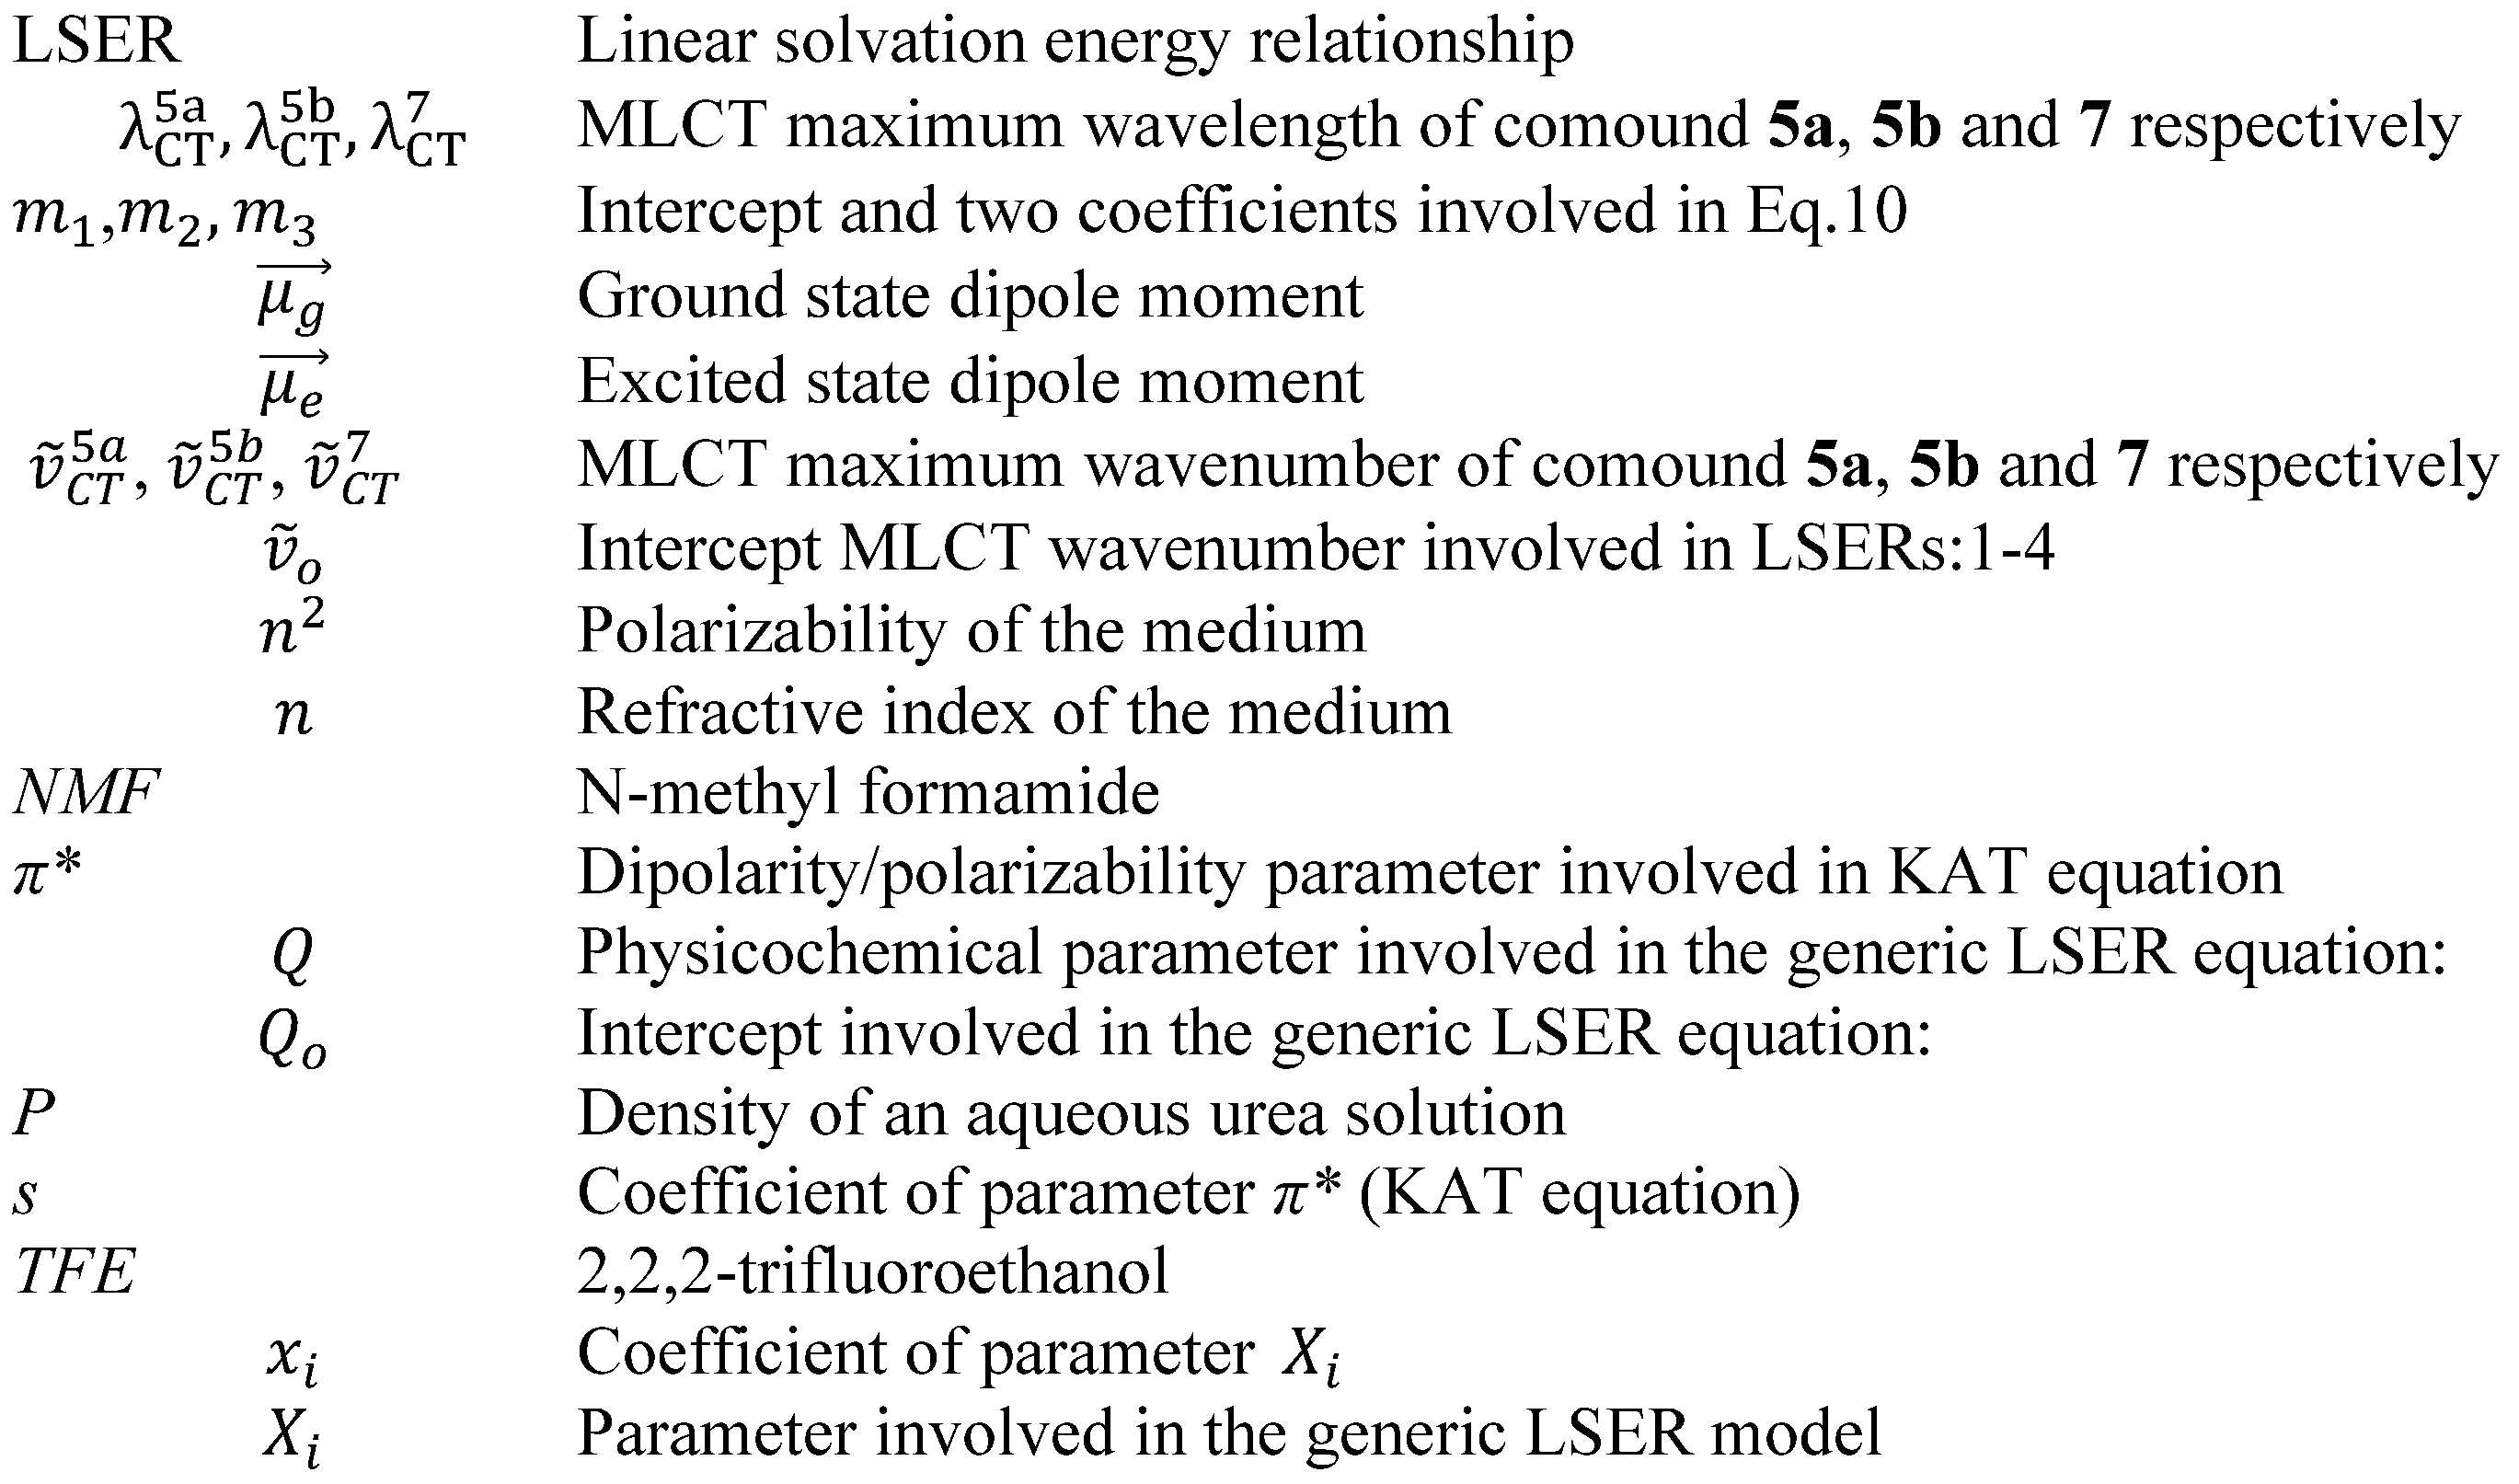
Nomenclature
References
- [1] Macartney, DH. Properties and reactions of substituted pentacyanoferrate (II) complexes. Rev Inorg Chem 1988;9(2-3):101-152. [CrossRef]
- [2]. Pires BM, Galdino FE, Bonacin JA. Electrocatalytic reduction of oxygen by metal coordination polymers produced from pentacyanidoferrate(II) complex. Inorganica Chim Acta. 2017;466:166-173. [CrossRef]
- [3]. M. Pires B, Hegner FS, Bonacin JA, Galán-Mascarós JR. Ligand effects of penta- and hexacyanidoferrate-derived water oxidation catalysts on BiVO4 photoanodes. ACS Appl Energy Mater. 2020;3(9):8448-8456. [CrossRef]
- [4]. Bratskaya SY, Privar YO, Korjakova OV, Mechaev AV, Pestov AV. Pentacyanoferrate(II) complexes with chitosan. Polym Eng Sci. 2014;54(10):2392-2397. [CrossRef]
- [5]. Bratskaya SY, Zheleznov VV, Privar YO, Mechaev AV, Zub YL, Pestov AV. Pentacyanoferrate(II) complexes with N-containing derivatives of chitosan and polyallylamine: Synthesis and cesium uptake properties. Colloids Surf A Physicochem Eng Asp 2014;460:145-150. [CrossRef]
- [6]. Zakaria MB, Chikyow T. Recent advances in Prussian blue and Prussian blue analogues: synthesis and thermal treatments. Coord Chem Rev. 2017;352:328-345. [CrossRef]
- [7]. Carvalho EM, de Freitas Paulo T, Saquet AS, et al. Pentacyanoferrate(II) complex of pyridine-4- and pyrazine-2-hydroxamic acid as source of HNO: investigation of anti-tubercular and vasodilation activities. J Biol Inorg Chem 2020;25(6):887-901. [CrossRef]
- [8]. Toma HE, Malin JM. Properties and reactivity of some pentacyanoferrate(II) complexes of aromatic nitrogen heterocycles. Inorg Chem, 1973;12(5):1039-1045. [CrossRef]
- [9]. Naik RM, Kumar B. The palladium(ii)-catalysed ligand exchange between hexacyanoferrate(ii) and 4-Cyanopyridine in aqueous acidic medium. Prog React Kinet Mech 2012;37(2):147-160. [CrossRef]
- [10]. Gou S, Renz F, Fukuda Y, Linert W. Cyano-bridged dinuclear iron complexes in different oxidation states. Inorganica Chim Acta. 1999;287(1):95-100. [CrossRef]
- [11]. Coe BJ, Foxon SP, Harper EC, et al. Nonlinear optical and related properties of iron(II) pentacyanide complexes with quaternary nitrogen electron acceptor units. Inorg Chem, 2009;48(4):1370-1379. [CrossRef]
- [12]. Papadakis R. Mono- and Di-quaternized 4,4’-bipyridine derivatives as key building blocks for medium- and environment-responsive compounds and materials. Molecules 2019;25(1):1. [CrossRef]
- [13]. Papadakis R. Preferential solvation of a highly medium responsive pentacyanoferrate(II) complex in binary solvent mixtures: Understanding the role of dielectric enrichment and the specificity of solute–solvent interactions. J Phys Chem B, 2016;120(35):9422-9433. [CrossRef]
- [14]. Papadakis R. Solute-centric versus indicator-centric solvent polarity parameters in binary solvent mixtures. Determining the contribution of local solvent basicity to the solvatochromism of a pentacyanoferrate(II) dye. J Mol Liq 2017;241:211-221. [CrossRef]
- [15]. Papadakis R, Deligkiozi I, Nowak KE. Study of the preferential solvation effects in binary solvent mixtures with the use of intensely solvatochromic azobenzene involving [2]rotaxane solutes. J Mol Liq. 2019;274:715-723. [CrossRef]
- [16]. Papadakis R, Deligkiozi I, Giorgi M, Faure B, Tsolomitis A. Supramolecular complexes involving non-symmetric viologen cations and hexacyanoferrate(II) anions. A spectroscopic, crystallographic and computational study. RSC Adv. 2016;6(1):575-585. [CrossRef]
- [17]. Deligkiozi I, Papadakis R. Probing solvation effects in binary solvent mixtures with the use of solvatochromic dyes. In: Dyes and Pigments - Novel Applications and Waste Treatment. IntechOpen; 2021. [CrossRef]
- [18]. Papadakis R. The solvatochromic behavior and degree of ionicity of a synthesized pentacyano (N-substituted-4,4′-bipyridinium) ferrate(II) complex in different media. Tuning the solvatochromic intensity in aqueous glucose solutions. Chem Phys 2014;430:29-39. [CrossRef]
- [19]. Papadakis R, Tsolomitis A. Solvatochromism and preferential solvation of 4-pentacyanoferrate 4′-aryl substituted bipyridinium complexes in binary mixtures of hydroxylic and non-hydroxylic solvents. J Solution Chem 2011;40(6):1108-1125, 1108. [CrossRef]
- [20]. Papadakis R, Tsolomitis A. Study of the correlations of the MLCT Vis absorption maxima of 4-pentacyanoferrate- 4′-arylsubstituted bispyridinium complexes with the Hammett substituent parameters and the solvent polarity parameters E and AN. J Phys Org Chem 2009;22(5):515-521. [CrossRef]
- [21]. Foretić B, Klaser T, Ovčar J, et al. The reversible electron transfer within stimuli-responsive hydrochromic supramolecular material containing pyridinium oxime and hexacyanoferrate (II) ions. Molecules. 2024;29(23). [CrossRef]
- [22]. Tanaka R, Okazawa A, Konaka H, Sasaki A, Kojima N, Matsushita N. Unique hydration/dehydration-induced vapochromic behavior of a charge-transfer salt comprising viologen and hexacyanidoferrate(II). Inorg Chem, 2018;57(4):2209-2217. [CrossRef]
- [23]. Abouelwafa AS, Mereacre V, Balaban TS, Anson CE, Powell AK. Photo- and thermally-enhanced charge separation in supramolecular viologen–hexacyanoferrate complexes. CrystEngComm 2010;12(1):94-99. [CrossRef]
- [24]. Deligkiozi I, Voyiatzis E, Tsolomitis A, Papadakis R. Synthesis and characterization of new azobenzene-containing bis pentacyanoferrate(II) stoppered push–pull [2]rotaxanes, with α- and β-cyclodextrin. Towards highly medium responsive dyes. Dyes Pigm 2015;113:709-722. [CrossRef]
- [25]. Li MH, You MH, Lin MJ. Photochromism- and photoluminescence-tunable heterobimetallic supramolecular hybrid isomers. Cryst Growth Des. 2021;21(5):2856-2867. [CrossRef]
- [26]. Parra-Alfambra AM, Casero E, Ruiz MA, Vázquez L, Pariente F, Lorenzo E. Carbon nanotubes/pentacyaneferrate-modified chitosan nanocomposites platforms for reagentless glucose biosensing. Anal Bioanal Chem 2011;401(3):883-889. [CrossRef]
- [27]. Filho UPR, Gushikem Y, Fujiwara FY, Stadler E, Drago V. Pentacyanoferrates(II) on the surface of organomodified silica gel: The matrix effect. Struct Chem 1994;5(2):129-133. [CrossRef]
- [28]. Li J, Robison T. Application of linear solvation energy relationships to guide selection of polar modifiers in normal-phase liquid chromatographic separations. Anal Chim Acta 1999;395(1-2):85-99. [CrossRef]
- [29]. Spange S, Keutel D. Untersuchungen zur Polarität wäßriger Harnstoff- und Zucker-Lösungen mit der Methode der vergleichenden Solvatochromie. Liebigs Ann Chem, 1993 ;1993(9):981-985. [CrossRef]
- [30]. Wibowo ES, Park BD, Causin V. Recent advances in urea–formaldehyde resins: Converting crystalline thermosetting polymers back to amorphous ones. Polym Rev (Phila Pa)2022;62(4):722-756. [CrossRef]
- [31]. Dorieh A, Selakjani PP, Shahavi MH, et al. Recent developments in the performance of micro/nanoparticle-modified urea-formaldehyde resins used as wood-based composite binders: A review. Int J Adhes Adhes, 2022;114(103106):103106. [CrossRef]
- [32]. Tomita B, Hse CY. Phenol–urea–formaldehyde (PUF) co-condensed wood adhesives. Int J Adhes Adhes 1998;18(2):69-79. [CrossRef]
- [33]. Laskowska A. Characteristics of the pressing process and density profile of MUPF-bonded particleboards produced from waste plywood. Materials (Basel). 2024;17(4):850. [CrossRef]
- [34]. Zhang Q, Yang C, Zhuo H, Lu W, Lu W. Study on the effect of urea-formaldehyde adhesive on the properties and microscopic characteristics of UF solidified foam. Constr Build Mater. 2024;450(138704):138704. [CrossRef]
- [35]. Yang H, Wang H, Du G, et al. Ureido hyperbranched polymer modified urea-formaldehyde resin as high-performance particleboard adhesive. Materials (Basel). 2023;16(11). [CrossRef]
- [36]. Zhang W, Wang C, Fang M, et al. Highly effective flame-retardant coatings consisting of urea-formaldehyde resin/aluminium hydroxide/boric acid for polystyrene foam: Properties and mechanisms investigation. Prog Org Coat, 2024;196(108766):108766. [CrossRef]
- [37]. Zotiadis C, Patrikalos I, Loukaidou V, Korres DM, Karantonis A, Vouyiouka S. Self-healing coatings based on poly(urea-formaldehyde) microcapsules: In situ polymerization, capsule properties and application. Prog Org Coat. 2021;161(106475):106475. [CrossRef]
- [38]. Xu Y, Zhang Q, Lei H, et al. A formaldehyde-free amino resin alternative to urea-formaldehyde adhesives: A bio-based oxidized glucose – urea resin. Ind Crops Prod. 2024;218(119037):119037. [CrossRef]
- [39]. Reichardt, C. [39]. Reichardt, C., & Welton, T. (2010). Solvents and Solvent Effects in Organic Chemistry. Wiley-VCH Verlag GmbH & Co. KGaA.
- [40]. D.R. Lide (Ed.), Handbook of Chemistry and Physics, 76th ed., CRC Press, Boca Raton, 1995.
- [41]. S. Budavari, The Merck Index, 11th ed., Merck and Co, Rahway, NJ, 1989.
- [42]. Coe BJ, Harries JL, Helliwell M, et al. Pentacyanoiron(II) as an electron donor group for nonlinear optics: medium-responsive properties and comparisons with related pentaammineruthenium(II) complexes. J Am Chem Soc. 2006;128(37):12192-12204. [CrossRef]
- [43]. Janjua, N. K. [43]. Janjua, N. K., Qureshi, R., Ahmed, S., Khan, A. Y., Muhammad, M., Subhani, M. S., & Iqbal, R. (2009). Solvent-oriented 1H NMR chemical shifts of pyridinium iodide and application of Buckingham equation. Journal of Molecular Structure, 919(1-3), 321-324. [CrossRef]
- [44]. Kamlet, M.J. Kamlet, M.J., Abboud, J.M., Taft, R.W.: An examination of linear solvation energy relationships. Prog. Phys. Org. Chem. 13, 485 (1981). [CrossRef]
- The properties of organic liquids that are relevant to their use as solvating solvents. Chemical Society Reviews. 22(6), 409–416. [CrossRef]
- [46]. Krygowski, T. M. [46]. Krygowski, T. M., & Fawcett, W. R. (1975). Complementary Lewis acid-base description of solvent effects. I. Ion-ion and ion-dipole interactions. Journal of the American Chemical Society, 97(8), 2143–2148. [CrossRef]
- [47]. Mulla, B. B. A. [47]. Mulla, B. B. A., Nesaragi, A. R., M, M. P. K., Kamble, R. R., & Sidarai, A. H. (2024). Exploration of coumarin derivative: Experimental and computational modeling for dipole moment estimation and thermal sensing application. Journal of Fluorescence, 34(4), 1719–1735. [CrossRef]
- Gsänger, M., Bialas, D., Huang, L., Stolte, M., & Würthner, F. (2016). Organic Semiconductors based on Dyes and Color Pigments. Advanced Materials (Deerfield Beach, Fla.), 28(19), 3615–3645. ( 28(19), 3615–3645. [CrossRef]
- [49]. Carsten, B. [49]. Carsten, B., Szarko, J. M., Son, H. J., Wang, W., Lu, L., He, F., et. al. (2011). Examining the effect of the dipole moment on charge separation in donor-acceptor polymers for organic photovoltaic applications. Journal of the American Chemical Society, 133(50), 20468–20475. [CrossRef]
- [50]. Suppan, P. [50]. Suppan, P., & Tsiamis, C. (1980). Absolute excited state dipole moments from solvatochromic shifts. Spectrochimica Acta. Part A: Molecular Spectroscopy, 36(11), 971–974. [CrossRef]
- [51]. C. Párkányi, Theoretical Organic Chemistry, vol. 5, Elsevier, Amsterdam, 1998, p. 248.
- [52]. Hayashi Y, Katsumoto Y, Omori S, Kishii N, Yasuda A. Liquid structure of the urea-water system studied by dielectric spectroscopy. J Phys Chem B. 2007;111(5):1076-1080. [CrossRef]
- [53]. Bandyopadhyay, D. [53]. Bandyopadhyay, D., Mohan, S., & Ghosh, S. K. (2014). Molecular Dynamics Simulation of Aqueous Urea Solution: Is Urea a Structure Breaker? The Journal of Physical Chemistry B, 118(40), 11579-11589. [CrossRef]
- Rezus, Y. L. A., & Bakker, H. J. (2006). Effect of urea on the structural dynamics of water. Proceedings of the National Academy of Sciences. J. ( 103(49), 18417–18420. [CrossRef]
- [55]. Soper, A. K. [55]. Soper, A. K., Castner, E. W. Jr., & Luzar, A. (2003). Impact of urea on water structure: a clue to its properties as a denaturant?. Biophysical Chemistry, 105(2–3), 649-666. [CrossRef]
- Warren, J. R., Gordon, J. A. (1951). On the Refractive Indices of Aqueous Solutions of Urea. Journal of Chemical Education, 28(6), 291-293. [CrossRef]
- Marcus, Y. (1998). The Properties of Solvents. Wiley.
- Papadakis, R. , Deligkiozi, I., & Tsolomitis, A. (2010). Spectroscopic investigation of the solvatochromic behavior of a new synthesized non symmetric viologen dye: study of the solvent-solute interactions. Analytical and Bioanalytical Chemistry, 397(6), 2253–2259. [CrossRef]
- Gottlieb, H. E. (1997). NMR Chemical Shifts of Common Laboratory Solvents as Trace Impurities. Journal of Organic Chemistry, 62(21), 7512-7515. [CrossRef]
| Solvent | α[[39]] | β[xxxix] | π*[xxxix] | ET30[xxxix] (kcal/mol) | ■ | [[40]] | [[41]] | † | † |
|---|---|---|---|---|---|---|---|---|---|
| HOH | 1.17 | 0.47 | 1.09 | 63.1 | 1.000 | 78.5 | 1.3325 | 0.9810 | 0.3408 |
| TFE | 1.51 | 0.00 | 0.73 | 59.8 | 0.898 | 26.7 | 1.2907 | 0.9449 | 0.3074 |
| Glycerol | 1.14 | 0.87 | 0.92 | 57.0 | 0.812 | 42.5 | 1.4746 | 0.9651 | 0.4391 |
| ‡EtOH50% | 1.10 | 0.54 | 0.96 | 56.5 | 0.796 | 38.1 | 1.3617 | 0.9611 | 0.3628 |
| EG | 0.90 | 0.52 | 0.92 | 56.3 | 0.790 | 41.4 | 1.4318 | 0.9642 | 0.4118 |
| FA | 0.71 | 0.48 | 0.97 | 55.8 | 0.775 | 109.5 | 1.4475 | 0.9864 | 0.4220 |
| MeOH | 0.98 | 0.66 | 0.60 | 55.4 | 0.762 | 33.8 | 1.3264 | 0.9563 | 0.3361 |
| ‡AcMe50% | 0.96 | 0.47 | 1.00 | 54.9 | 0.747 | 30.0 | 1.3583 | 0.9508 | 0.3603 |
| NMF | 0.62 | 0.80 | 0.90 | 54.1 | 0.722 | 182.4 | 1.4319 | 0.9918 | 0.4118 |
| Solvent Parameter/Correlation coefficient | |||||||
|---|---|---|---|---|---|---|---|
| Compound/Equation # | π* | A | β | ||||
| (103.cm-1) | e(103.cm-1) | s(103.cm-1) | a(103.cm-1) | b(103.cm-1) | r2 | rse | |
| 5a/1 | 8.1192.064 | 10.542.531 | - | - | - | 0.712 | 0.618 |
| 5a/2 | 9.5471.636 | - | 5.4861.151 | 9.5471.636 | -0.7300.839 | 0.881 | 0.470 |
| 5a/3 | 8.7331.314 | - | 5.4871.127 | 2.9720.630 | - | 0.864 | 0.460 |
| 5a/4 | 8.5942.833 | 10.143.090 | - | - | -0.2881.072 | 0.716 | 0.664 |
| 5b/1 | 8.1212.525 | 10.393.096 | - | - | - | 0.617 | 0.756 |
| 5b/2 | 9.0521.971 | - | 5.9581.387 | 2.5090.968 | -0.7311.012 | 0.847 | 0.566 |
| 5b/3 | 8.2381.551 | - | 5.9591.330 | 2.9280.743 | - | 0.831 | 0.543 |
| 5b/4 | 8.5133.477 | 10.063.792 | - | - | -0.2381.315 | 0.619 | 0.815 |
| Compound/Equation # | ||||
|---|---|---|---|---|
| 5a/2 | - | 0.52 | 0.34 | 0.14 |
| 5a/3 | - | 0.52 | 0.48 | - |
| 5a/4 | 0.85 | - | - | 0.15 |
| 5b/2 | - | 0.58 | 0.29 | 0.13 |
| 5b/3 | - | 0.58 | 0.42 | - |
| 5b/4 | 0.86 | - | - | 0.14 |
| (Å) | (D) | r2 | |||||
|---|---|---|---|---|---|---|---|
| 5a | 5.01 | 15.1 | 21.5 | 0.997 | |||
| 5b | 5.03 | 14.8 | 21.9 | 0.996 |
| Urea Conc. (mg/g) | ρ (g/L)lii | [Urea] (mol/L) | ET(30)xxix(kcal/mol) | ) | lii | ♠ | ♠ | |
|---|---|---|---|---|---|---|---|---|
| 0 | 998.68 | 0.00 | 63.1 | 19.50 | 78.48 | 1.3310 | 0.4905 | 0.1706 |
| 100 | 1023.4 | 1.70 | 62.5 | 19.44 | 83.74 | 1.3472 | 0.4911 | 0.1760 |
| 200 | 1049.7 | 3.50 | 62.1 | 19.44 | 87.76 | 1.3621 | 0.4915 | 0.1816 |
| 250 | 1063.5 | 4.43 | 61.8 | 19.40 | 90.10 | 1.3698 | 0.4917 | 0.1844 |
| 300 | 1077.7 | 5.38 | 61.6 | 19.40 | 92.48 | 1.3778 | 0.4919 | 0.1873 |
| 400 | 1107.2 | 7.37 | 61.4 | 19.32 | 96.45 | 1.3943 | 0.4923 | 0.1931 |
| 500 | 1138.3 | 9.48 | 61.2 | 19.24 | 102.1 | 1.4118 | 0.4927 | 0.1992 |
| Urea Concentration (mg/g) | (nm) | ) | (nm) |
) |
|---|---|---|---|---|
| 0 | 533.5 | 18.744 | 537.0 | 18.622 |
| 100 | 537.5 | 18.605 | 541.0 | 18.484 |
| 200 | 541.0 | 18.484 | 543.0 | 18.416 |
| 250 | 543.0 | 18.416 | 547.0 | 18.282 |
| 300 | 544.5 | 18.365 | 547.0 | 18.282 |
| 400 | 545.5 | 18.332 | 548.0 | 18.248 |
| 500 | 546.5 | 18.298 | 549.0 | 18.215 |
| (cm-1) | (cm-1.mol.kcal-1) | (cm-1) | *r2 | %RET(30) | %Rf(ϵ) -f(n2) | |
|---|---|---|---|---|---|---|
| 5a | 0.988 | 0.291 | 1.750 | 0.849 | 63 | 37 |
| 5b | 1.168 | 0.286 | 1.621 | 0.898 | 59 | 41 |
| 7 | 1.182 | 0.302 | 1.580 | 0.556 | 11 | 88 |
Disclaimer/Publisher’s Note: The statements, opinions and data contained in all publications are solely those of the individual author(s) and contributor(s) and not of MDPI and/or the editor(s). MDPI and/or the editor(s) disclaim responsibility for any injury to people or property resulting from any ideas, methods, instructions or products referred to in the content. |
© 2025 by the authors. Licensee MDPI, Basel, Switzerland. This article is an open access article distributed under the terms and conditions of the Creative Commons Attribution (CC BY) license (http://creativecommons.org/licenses/by/4.0/).


