Submitted:
24 February 2025
Posted:
25 February 2025
You are already at the latest version
Abstract
Cutaneous metastatic melanoma (CMM) is the most aggressive form of skin cancer with poor prognosis, chemotherapy-induced secondary tumorigenesis and emergency of drug resistance. Triphenyl phosphonium (TPP)-based nanovesicles (BPPB), having amphiphilic properties, recently demonstrated potent ROS-dependent anticancer effects against PLX-sensitive MeOV BRAFV600E and MeTRAV BRAFV600D mutants cell lines, evidencing a more marked sensitiveness of MeOV cells. Here, BPPB was tested on in vitro selected vemurafenib (PLX)-resistant MeOV BRAFV600E and MeTRAV BRAFV600D mutants cell lines and we found strong antiproliferative effects, regardless of their acquired resistance to PLX, that correlated with ROS overproduction only for 24-hours treatments. MeTRAV PLX-R demonstrated a remarkable higher tolerance than MeOV PLX-R to BPPB, after 24 hours, while exposure for longer periods induced similar responses in both cell lines (IC50 = 87.8-106.5 nM on MeOV and 81.0-140.6 nM on MeTRAV). Noteworthy, the cytotoxicity of BPPB to non-tumorigenic human keratinocytes (HaCaT) was low, allowing for selectivity index values (SIs) up to 11.58; instead, the BPPB concentration causing 50% hemolysis (HC50) was found 16-173 and 4-192-fold higher than the IC50 calculated for MeOV and MeTRAV PLX-R cells, respectively. By due correlations studies, it was established that BPPB exerted cytotoxic effect on MeOV and MeTRAV PLX-R cells by a time-dependent mechanism, while a concentration-dependent mechanism is observed only at 24 hour-exposure. Finally, a ROS-dependent mechanism can be assumed only in MeTRAV at 72 hour-exposure.
Keywords:
cutaneous metastatic melanoma (CMM)
; triphenyl phosphonium (TPP) groups
; nanosized bola-amphiphiles vesicles
; cell viability (%) studies
; low hemolytic effects
; low cytotoxicity on HaCaT cells
1. Introduction
Melanoma is a malignant tumour that originates from melanocytes, which are cells responsible for the synthesis of melanin, a dark pigment that is partially responsible for skin colour [1]. Melanocytes are found mostly in the skin [2], even if they are present in the eyes, ears, leptomeninges, gastrointestinal tract, as well as in oral, genital, and sinonasal mucous membranes. Therefore, melanoma can arise in all areas of the body where melanocytes are normally present, with a particular predilection for photo-exposed areas [2]. Although melanoma usually starts as a skin lesion, it can also grow on mucous membranes (mucosal melanoma), such as lips or genitals, and occasionally it occurs in other parts of the body such as eyes and brain [3]. Cutaneous melanoma (CM) accounts for more than 90% of melanoma diagnoses, especially in young age white populations. It is particularly common among Caucasians, especially in northwestern Europeans who live in sunny places, such as Oceania, North America, Europe, South Africa and Latin America [4]. In Italy, CM is currently the third most frequent tumour in both sexes under the age of 50. Over the last 20 years, its incidence has increased dramatically, from 6,000 cases in 2004 to 11,000 in 2014. In the latest report "Cancer numbers in Italy 2024", presented by the Italian Association of Medical Oncology, there are forecasts indicating that melanoma diagnoses, in 2024, could reach the number of 17,000, approximately 4,300 more than the number recorded in 2023 (12,700). This higher number can be interpreted both as a greater sensitivity of the population to undergo regular checks, which are essential for an early diagnosis of the tumour, and as a greater exposure to risk factors, for example to solar rays without adequate protection or the use of tanning beds. Collectively, the incidence of melanoma consists of about 25 new cases per 100 000 population in Europe, 30 cases per 100 000 population in the USA, and 60 cases per 100 000 population in Australia and New Zealand [6].
1.1. Main Causes of CM
CM derives from the step by step gathering of genetic mutations that modify cell proliferation, differentiation, and death [7]. In white populations, CMs are estimated to be caused by the mutagenic effect of ultraviolet radiation (UVR) in more than 75% of cases [8,9]. Cutaneous metastatic melanoma (CMM) originates from a complex interaction of UVR-mediated oncogenic aberrations such as BRAF, NRAS or KIT mutations, inherited germline genetic modifiers, such as CDKN2A, MC1R, or BAP1, and phenotypic risk factors, including lighter skin tones, sun sensitivity, or naevus count and type [2,12,13]. Moreover, immune distress due to solid organ or hematopoietic cell transplantation, other immunodeficiencies[14], and some genodermatoses, such as xeroderma pigmentosum [15], could drive to an increased risk of melanoma.
1.2. Possible Treatments for Melanoma
The management of melanoma mainly depends on its stage. The treatment of choice for primary melanoma implies its removal by excisional biopsy, whose margins are determined by tumor thickness. The chances of tumour recurring or spreading depends on how deeply it has penetrated the layers of the skin. For CMM, the treatments include surgery, chemotherapy, immune checkpoint modulator therapy, and/or radiation therapy. Systemic drug therapies are advised as adjuvants to surgery in patients with resectable locoregional metastases and are the strength of treatment in advanced melanoma. Management of advanced melanoma is difficult, particularly in the case of cerebral metastasis formation. In white populations, the mortality percentage decreased by 18% within 3 years, due to the development of more efficient systemic therapies, which encompass also effective treatment for asymptomatic brain metastasis [16]. Further improvement of current treatments of melanoma depends on scientists’ ability to personalize care, and multidisciplinary care is essential. Anyway, even if therapies evolve rapidly, our best weapon against melanoma remains the prevention.
1.3. The Study
The acquisition of drug resistance mainly due to the constitutive activation of oncogenes, hampers the effectiveness of therapy in terms of overall survival [17,18]. Mutations in BRAF human proto-oncogene have been identified in 50% of malignant melanomas [19], and approximately 40-70% of the cases show a missense mutation, with a substitution of valine with glutamic acid at codon 600, denoted as V600E [20]. The identification of oncogenic driver mutations, such as KRAS and BRAF, has driven to the development of small-molecule inhibitors along the RAS-RAF-MEK-MAPK signalling pathway[21[]. Currently, PLX4032 (commercially known as Vemurafenib) is approved for the treatment of patients with BRAFV600E-mutated CMMs [22,23] and, although less effective, of those with BRAFV600K, BRAFV600R and BRAFV600D mutations [24].
Despite the encouraging results obtained with PLX4032, most BRAF-mutant CMM patients become drug-resistant after 6/7 months of therapy, promoting cancer relapse [25].
On this scenario, we recently reported that triphenyl phosphonium (TPP)-based nanovesicles (BPPB), having amphiphilic properties, possess ROS-dependent anticancer effects against two different PLX4032-sensitive BRAF mutants cell lines (MeOV BRAFV600E and MeTRAV BRAFV600D), evidencing a more marked sensitiveness of MeOV cells.
Here, the efficacy of BPPB was tested on PLX-resistant counterparts (MeOV PLX-R and MeTRAV PLX-R cells), by carrying out concentration- and time-dependent cytotoxicity experiments. Moreover, since we have previously reported that the cytotoxic action of BPPB on MeOV and MeTRAV cells is accompanied by ROS overproduction, this parameter was also evaluated in BPPB-treated PLX-resistant cells. In addition, to support a possible clinical development of BPPB as an adjuvant therapy for CMM management, the cytotoxic effect of BPPB was tested on human keratinocytes (HaCaT), and on red blood cells (RBCs), and its selectivity index (SI) values were calculated. Using proper dispersion graphs and fitting them with different linear and non-linear regression models, the possible dependance of BPPB cytotoxic effects and ROS induction on BPPB concentrations and time of exposure were investigated on both CMM and HaCaT cells conducting an extensive correlation study. Finally, the possible dependance of BPPB cytotoxic effects on ROS increase induction, were similarly studied.
2. Results and Discussion
2.1. 1,1-(1,12-Dodecanediyl)bis[1,1,1]-triphenylphosphonium di-Bromide (BPPB)
The alkyl triphenilphosphonium derivative displaying two triphenyl cationic moieties linked to each other by a C12 alkyl chain (BPPB), was synthetized according to Scheme 1, performing the procedure recently described[26].
Associated with a numbered structure of BPPB, the list of peaks from ATR-FTIR, 1H, 13C and 31P NMR spectra, as well as results from FIA-MS-(ESI) and elemental analyses of BPPB have been included in Section S1 of Supplementary Materials, of our recent work[26].
2.2. Biological Effects of BPPB on Tumoral and Not Tumoral Human Cells Models
2.2.1. The Rational of The Study
Molecules possessing the triphenyl phosphonium (TPP) group, are reported to interact electrostatically and with appreciable selectivity with the negatively-charged constituents of tumor cells cytoplasmic membrane. On these considerations, recently, we have assayed bola-amphiphilic vesicles having two TPP groups (BPPB) on sensitive and multidrug resistant neuroblastoma (NB) cells. Subsequently, the same BPPB was tested on BRAF mutant MeOV (BRAFV600E) and MeTRAV (BRAFV600D) metastatic melanoma cell lines sensitive to vemurafenib (PLX4032), isolated from the biopsies of TT-untreated patients [30,31]. Remarkable cytotoxic effects, which were strongly correlated with ROS production, at least in cutaneous metastatic melanoma (CMM) cells, were observed, associated to low levels of toxicity vs. different mammalian cells lines and to low hemolysis in red blood cells (RBC) by four healthy donors.Here, we have first confirmed the cytotoxic potency of BPPB also against BRAF-mutated PLX-Resistant CMM [34]. Prospecting a possible clinical use on skin to treat topically the melanoma lesions, BPPB selectivity for tumor cells was then assessed by evaluating its possible cytotoxicity and capability to induce ROS increase, on human keratinocytes, while its hemolytic damage on RBCs from up to eight healthy volunteers was investigated. The possible existence of time-dependent, ROS-dependent and concentration-dependent mechanisms was explored, as well.
2.2.2. Concentration- and Time-Dependent Effects of BPPB on MeOV PLX-R and MeTRAV PLX-R Cell Viability
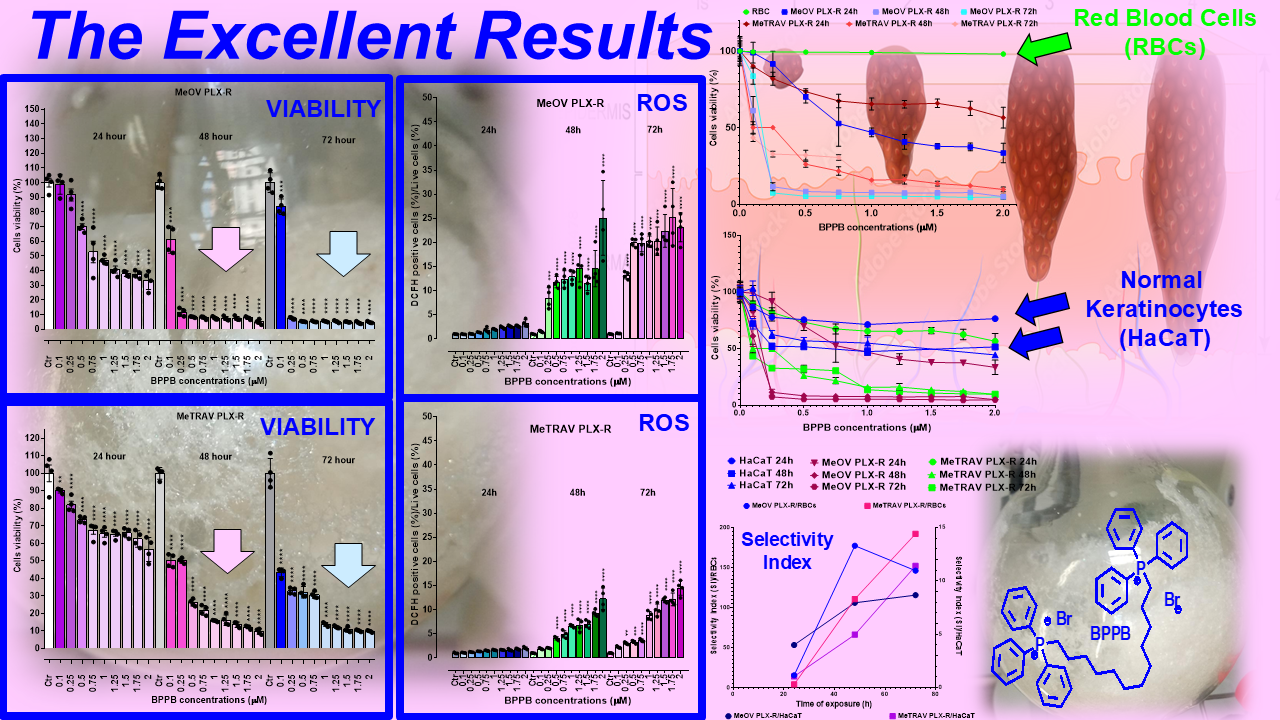
Before our recent studies demonstrating the potent and quite selective anticancer effects of a bis-triphenyl phosphonium (BTPP)-bola-amphiphilic (BA) molecule (BPPB) [30,31],BA materials were extensively studied for other several applications, but not as per se anticancer agents [35]. Here, the effects of BPPB on cell viability were investigated on two PLX4032 resistant CMM cell lines (MeOV PLX-R and MeTRAV PLX-R). As reported in Figure 1, BPPB caused a significant reduction in the viability of MeOV PLX-R cells starting from the lowest concentration used (0.1 µM), after 48 and 72 hours of exposure, while starting from 0.5 µM concentration after shorter period treatments of 24 hours (Figure 1a). On the contrary, BPPB caused a significant reduction in the viability of MeTRAV PLX-R cells already at 0.1 µM concentration after all times of treatments, evidencing a higher sensitivity of MeTRAV PLX-R cells respect to MeOV PLX-R cells at the lowest concentrations (Figure 1b). Specifically, when exposed to 0.1 µM, MeTRAV PLX-R cells were more sensitive than MeOV PLX-R cells to BPPB by 8.9, 18 and 47.8% after 24, 48 and 72 hours of exposure, respectively, as demonstrated by the high viability of MeOV PLX-R cells (98.9%, 24 hours, 61.1%, 48 hours and 83.6%, 72 hours). Although a time-dependent cytotoxic effect was observed in both cell populations, their viability was similar after 48 and 72 of exposure, especially when exposed to BPPB concentrations ≥ 0.25 and 1 µM for MeOV PLX-R and MeTRAV PLX-R cells, respectively (Figure 1a and Figure 1b). Collectively, MeOV PLX-R cells were more susceptible to the action of BPPB respect to MeTRAV PLX-R ones at concentrations ≥ 0.5 µM (24 hours) and ≥ 0.25 (48 and 72 hours). In fact, after the 24-hours treatment, a viability in the range 70.1-33.5% was detected in MeOV PLX-R cells treated with concentrations of BPPB in the range 0.5-2 µM, while a viability in the range 73.5-56.5% was observed in MeTRAV PLX-R cells, exposed to the same concentrations of BPPB. Concerning treatments of 48- and 72-hours, cells viability in the range 11.5-3.10 % after 48 hours and 7.4-4.8 % after 72 hours was observed for MeOV cells, while viability ranges of 50.1-9.7 % after 48 hours and 32.8-9.8 % after 72 hours were detected for MeTRAV cells.
Summarizing, MeOV PLX-R cell viability decreased under 50% at 1.0 µM BPPB after 24 hour-treatment (46.9%), and at 0.25 µM after 48 (11.5%) and 72 hours (7.4%). On the contrary, MeTRAV PLX-R cell viability remained over 50% at all BPPB concentrations tested after 24-hours exposure, while decreased under 50% at 0.5 µM after 48 hours (26.2%) and at 0.1 µM after 72 hours (43.4%). These results showed that BPPB concentrations ≥ 0.25 µM, were able to completely kill PLX-resistant MeOV cells after 48 and 72 hour-treatments (11.5-4.8% viability), while BPPB concentrations ≥1 µM markedly reduced cell viability (15.8-9.8%) of PLX-resistant MeTRAV cells after the same times of exposure.
Based on this data, BPPB resulted remarkably more potent than self-assembled metal-phenolic nanocomplexes synthetized by Li et al., whose administration left alive more than 50% of B16-F10 melanoma cells driven from C57BL/6J mouse, up to 25 mM concentrations [36]. Using the data of cell viability as a function of BPPB concentrations, we calculated the IC50 of BPPB against both cell lines, using GraphPad Prism software (version 8.0.1). Particularly, we first converted the bar graphs of Figure 1a and Figure 1b into the dispersion graphs reported in Figure 2a and Figure 3a.
Then, upon conversion of µM concentrations (x) in Log10 (x), and using a non-linear model which considered the Log 10 (BPPB concentrations) vs. the normalized response, we derived the IC50 values of BPPB for both cell populations at 24, 48 and 72 hours of treatment reported in Table 1.
Furthermore, 72 hour-treatment with BPPB exerted a greater cytotoxic effect on PLX-resistant cells, than the effect induced by PLX on sensitive ones. Specifically, the effect of BPPB was more cytotoxic (5-fold) on PLX-R MeOV cells than that of PLX on PLX-sensitive MeOV cells, while BPPP cytotoxicity on PLX-R MeTRAV cells was 231-fold higher than that of PLX on PLX-sensitive MeTRAV cells [34].
Correlation Between BPPB Cytotoxic Effects and BPPB concentrations
Here, using the dispersion graphs of cell viability (%) of both MeOV PLX-R and MeTRAV PLX-R after 24, 48 and 72 hours of exposure to BPPB vs. BPPB concentrations administered, and their best statistical models, we established if it is possible to hypothesize a concentration-dependent mechanism for the cytotxic effects of BPPB. To this end, we investigated the existence or absence of a significant correlation between BPPB anticancer effects and the administered concentrations, and which type of correlation coud be, on the basis of R-square values of the statistical models which best fitted the data of dispersion graphs. R2 is an index that measures the goodness-of-fit of a statistical model applied to two series of data and its capability to correctly predit a new response variable “y” (cell viability %) from an new experimental data “x” (BPPB concentration) [37]. Higher the value of R2, higher the goodness-of-fit of the regression model used and higher the correlation existing between the two series of data fitted with that model. Low values of R2 also for the best fitting regression models indicated a low reliability of the models and a low correlation between data. In scientific studies, R2 of a model should be > 0.95 to consider that model reliable and to assert the existence of a certain correlation between data [38]. For nonlinear models, R2 can be misleading and may not accurately reflect the performance of the model. This is because R2 is defined for linear models and if applied to nonlinear ones may produce values outside the range 0-1, making it difficult to interpret [39]. In our case, the R2 values provided by Microsoft Excel 365 software for the nonlinear models used were all in the range 0-1, so we considered R2 as a realible parameters for judging the goodness-of-fit of the tested regression models. Figure A1 in Appendix A shows the dispersion graphs of cells viability of MeOV PLX-R (blue square (24 h), pink triangular (48 h) and green round (72 h) indicators) and of MeTRAV PLX-R (red square (24 h), purple triangular (48 h) and sky blue (72 h) indicators) cells vs. BPPB concentrations (0.1-2.0 µM). Additionally, it reports the nonlinear regressions models (dotted lines), which, among others tested, best fitted the data of dispersion graphs according to R2. Figure A1 shows also the equations and values of R2 related to the selected models. The nonlinear regression models were achieved using Microsoft Excel software 365. Values of R2 > 0.95 (0.9869 (MeOV) and 0.9633 (MeTRAV) were obtained only for the statistical models used to describe the data of cell viability vs. BPPB concentrations of both cell lines after 24 hours treatments, thus establishing the existence of a good correlation between data. In particular, for MeOV PLX-R cells a polynomial correlation of second order and for MeTRAV PLX-R cells a logarithmic correlation exist. R2 values slightly < 0.95 (0.9370 (48 h) and 0.9228 (72 h) were obtained for the statistical models used to describe the same data of MeTRAV PLX-R cells, establishing the existence of a poor correlation between them. R2 values of 0.8491 (48 h) and 0.8441 (72 h) were finally obtained for the statistical models used to describe the data of MeOV PLX-R cells, establishing the absence of correlation between them. Collectively, this investigation proven that the anticancer effects of BPPB on both cell lines are dependent on its concentrations only for treatments timing of 24 hours. When cells were treated for longer periods, the dependance of BPPB cytotoxic effects on its concentrations were scarce for MeTRAV PLX-R cells and absent for MeOV PLX-R ones.
Correlation Between BPPB Cytotoxic Effects and Time of Exposure
Here, following the same method used in the previous Section, we assessed the existence or absence of a certain dependance of BPPB anticancer effects on times of treatments. As shown in Figure A2 in Appendix A, on the basis of the very high R2 values (both equal to 1) of the nonlinear regression models that best fitted the dispersion graphs of the IC50 values (µM) vs. times of exposure (hours) obtained for MeOV PLX-R cells (blue square indicators) and MeTRAV PLX-R ones (pink triangular indictors), it was found that a strong correlation of second order polynomial type exists between data. Collectively, although not linear, the existence of a correlation between the cytotoxic effects of BPPB and the duration of treatments established the existence of a certain time-dependent mechanism in the action of BPPB. Despite the exixtence of a strong correlation between the IC50 values of BPPB and the exposure timing, this findings were nonetheless different from those observed when BPPB was tested on CMM cells sensitive to PLX [30]. Indeed, in that case, a linear correlation was accepted on the basis of R2 values of the linear regression models obtained using similar graphs (0.9754 (MeOV) and 0.9190 (MeTRAV)). Furthermore, the dispersion graphs in Figure A1, clearly show as, except in experiments at 24 hours were MeTRAV PLX-R cells were 3.8-times more tollerant to BPPB than MeOV PLX-R ones, at both 48 and 72 hours of exposure the IC50 values of BPPB were similar and no significant difference was observed in the responses of both MeOV and MeTRAV, regarless their different BRAF-mutation.
2.2.3. Concentration- and Time-Dependent Effects of BPPB on ROS Production Into PLX-R Cells
TPP-based compounds, including TPP-BA as BPPB, were found to induce an overproduction of ROS, as marker of oxidative stress (OS), that can be responsible for the cytotoxic effects of such compounds [28,30[]. In this regard, we recently reported that BPPB induced a decrease in MeOV and MeTRAV cell viability that was linearly correlated with the increase of ROS production [30]. Therefore, ROS levels were analogously analyzed also in MeOV and MeTRAV PLX-R cell populations treated with BPPB, to confirm or confute the previous findings.
As shown in Figure 4a and Figure 4b, upon 48 and 72 h, BPPB induced a significant concentration- and time-dependent increase of ROS production in both cell populations, while no significant changes were observed in 24 hour-treated cells. Collectively, ROS production was slightly higher in MeOV PLX-R than in MeTRAV PLX-R cells, showing an opposite trend to that observed for cell viability. In fact, when PLX-R cells were exposed to BPPB for only 24 hours, a low ROS production in both cell populations was accompanied by an high cell viability, especially in MeTRAV cells. Instead, at longer times of exposure, cell viability was remarkably lower, and ROS production was significantly higher respect to the control. Based on these findings, a possible ROS-dependent mechanism for BPPB effects could be hypothesized.
Correlation Between ROS Production Increase and BPPB Concentrations
Here, we investigated the existence of a possible correlation between the increasing production of ROS and BPPB concentrations, thus being capable of assuming a concentration-dependent mechanism. Figure A3 in Appendix A reports the dispersion graphs of the ratios DCFH positive cells (%)/viable cells (%) vs. BPPB concentrations (µM) (round indicators without lines), for both cell lines after 24, 48 and 72 of treatments. The related best fitting nonlinear regression models, their equations and the connected R2 values were also provided by Microsoft Excel 365, to assess the possible existence of a certain type of correlation between the two series of data. Values of R2 > 0.95 [38] would have confirmed the existence of a correlation and of a concentration-dependent mechanism. Figure A3 reveals that, regardless of their values of R2, the nonlinear regression models which best described the data of dispersion graphs were of second order polynomial type for data for experiments on MeOV PLX-R cells at 24 hours of exposure and on MeTRAV PLX-R cells at 72 hours of exposure. Logarithmic nonlinear statistical regressions were the models which best fitted experimental data obtained on MeOV PLX-R cells at 48 and 72 hours of exposure, while statistical models of Power type best fitted the experimental data obtained on MeTRAV PLX-R cells at 24 and 48 hours of exposure. Anyway, only the R2 value of the nonlinear regression model which best fitted the data of the dispersion graph obtained in experiments on MeTRAV PLX-R cells when treated with BPPB for 72 hours was > 0.95 (0.9799), thus confirming the existence of a positive correlation of second order polynomial type between ROS increasing production and BPPB concentrations (µM). In all other cases, R2 values of the best fitting nonlinear regression models were < 0.95, thus establishing the absence of a significant correlation of any type between ROS increasing production and BPPB concentrations (µM). Collectively, only for the BPPB ROS induction in MeTRAV PLX-R cells treated for 72 hours, it is possible to claim a concentration-dependent mechanism. The dependance of BPPB ROS induction in MeTRAV PLX-R cells treated for 48 and 24 hours, was from scarce to very poor (R2 = 0.9228 and 0.9011, respectively, as well as scarce was such dependence in MeOV PLX-R cells when treated for 24 hours with BPBB (R2 = 0.9324). Finally, no ROS-dependance on BPPB concentrations exists for BPPB ROS induction in MeOV PLX-R cells when treated for 48 hours.
Correlation Between ROS Production Increase and Exposure Timing
Figure A4 in Appendix A reports the dispersion graphs of the average ROS production, expressed as ratio DCFH positive cells (%)/live cells (%) in both MeOV and MeTRAV PLX-R cells’ lines vs. times of exposure tested. The related logarithmic regression models, which best fitted the dispersion graphs and the connected R2 values were also provided by the Microsoft Excel 365, to assess the possible existence of a type of correlation between the two series of data. Figure A4 demonstrated that the average ROS production in MeOV PLX-R cells was higher than that in MeTRAV PLX-R ones by 1.3- (24 h), 2.0- (48h) and 2.3-times (72 h). A very high logarithmic correlation was found between the average ROS production and exposure timing in both types of cells, thus confirming that ROS production was dependent on the time of treatments. Moreover, the average ratio DCFH positive cells (%)/viable cells (%) increased by 5.9- and 8.6-times respectively, passing from 24 to 48 and then to 72 hours exposure, being the increase from 48 to 72 hours of 1.5 times, when MeOV PLX-R CMM cells were treated. Differently, it increased only by 3.7- and 4.7-times respectively, passing from 24 to 48 and then to 72 hours exposure, being the increase from 48 to 72 hours of 1.3 times, when MeTRAV PLX-R cells were exposed to BPPB.
Correlation Between BPPB Cytotoxic Effects (Cell Viability %) and ROS Overproduction
As evidenced in Section 2.2.3., apparently, the trend observed for ROS over production was like and opposite that observed for cell viability (%) obtained in the cytotoxicity experiments, thus envisaging a possible correlation between cytotoxicity effects of BPPB and its capability to induce ROS production and therefore a ROS-induced anticancer mechanism. So, to confirm this assumption, we carried out experiments like those performed in the previous Sections for other series of data. Figure A5 in Appendix A reports the dispersion graphs of the ratios DCFH positive cells (%)/viable cells (%) vs. cell viability (%) (round indicators without lines) observed at the same concentrations of BPPB, for both cell lines after 24, 48 and 72 of treatment. The related best fitting nonlinear regression models, their equations and the connected R2 values were also provided by Microsoft Excel 365, to assess the possible existence of a certain type of correlation between the two series of data. Values of R2 > 0.95 would have confirmed the assumed correlation. Figure A5 highlights that, regardless their values of R2, the nonlinear regression models which best described the data of dispersion graphs were of Power type for experiments on both cell lines at 24 and 72 hours of exposure, while were of second order polynomial types when the duration of treatments was of 48 hours, thus establishing a similar trend for both MeOV and MeTRAV PLX-R cells. Anyway, only the R2 value of the nonlinear regression model which best fitted the data of the dispersion graph obtained in experiments on MeTRAV PLX-R cells treated with BPPB for 72 hours was > 0.95 (0.9694), thus confirming the existence of an inverse correlation of Power type between ROS hyperproduction and cell viability (%). In all other cases, R2 values of the best fitting nonlinear regression models were < 0.95, thus establishing the absence of a significant correlation of any type between ROS hyperproduction and cell viability (%). Collectively, only for the cytotoxic effects of BPPB on MeTRAV PLX-R cells treated for 72 hours, it was possible to claim a ROS-dependent mechanism. The dependance of the cytotoxic effects of BPPB on MeTRAV PLX-R cells treated for 24 and 48 hours, was from scarce to poor (R2 = 0.9305 and 0.9193, respectively), while no ROS-dependance existed for BPPB cytotoxic effects on MeOV PLX-R cells. From these early experiments, a possible oxidative cell death can be hypothesized for MeTRAV PLX-R cells after 72-hour exposure. Although in MeOV and MeTRAV cells sensitive to PLX, a ROS-dependent cytotoxic effect was established for both cell lines, it was similarly stronger for MeTRAV cells respect to MeOV ones [[[45]30].
2.2.4. In vitro Hemolytic Toxicity of BPPB on Red Blood Cells (RBC)
The hemolytic ratio percentage (%) caused by BPPB has been assessed as recently reported with slight changes[41]. Particularly, EDTA-blood samples from eight healthy donors were exposed to increasing concentrations of BPPB (0.1-50 µM). The results have been expressed as an average of eight independent determinations ± S.D. and are shown in the form of bar graph of these means vs. BPPB concentrations in Figure 5a, and in the form of dispersion graph (pink square indicators) in Figure 5b. In Figure 5b, the best fitting nonlinear statistical model related to the dispersion graph (punctuated pink line) with its equation and R2 value, as obtained using Microsoft Excel 365 software, was also included. Figure 5c reports the RBC, MeOV PLX-R and MeTRAV PLX-R cell viability (%) vs. BPPB concentration in the range 0.1-2.0 µM, as done in cytotoxicity experiments.
As observable, hemolysis was statistically significant with respect to control (CTRL) only for concentrations ≥ 10 µM but limited to 23.8% for BPPB = 10 µM. A concentration of BPPB = 20 µM was necessary to determine a hemolysis slightly > 50% (50.3%). Based on R2 value > 0.95 (0.9617) we can assert that the decrease of RBCs viability (%) and consequently the increase of hemolysis is correlated to BPPB increasing concentration. Specifically, a second order polynomial correlation was detected between RBCs viability and BPPB concentration, thus establishing a concentration dependent mechanism for the observed hemolysis. Figure 5c shows that at the highest concentration tested on both CMM cells (2.0 µM), RBCs viability (%) was still 98.03 %, while that of MeOV PLX-R cells was 33.48% (24 h), 4.97% (48 h) and 4.83% (72 h), and that of MeTRAV PLX-R cells was 56.51% (24 h), 9.67% (48 h) and 9.78% (72 h). As previously described for viability experiments carried out with BPPB on CMM cells, the dispersion graph of BPPB concentrations vs RBCs viability reported in Figure 5b was used to calculate the HC50 value of BPPB on RBCs (intended as the concentration of BPPB needed to cause 50% hemolysis) using GraphPad Prism 8.0.1 Software (GraphPad Software, Boston, MA, USA). Briefly, data of RBCs viability (%) vs. BPPB concentrations were transformed into those of RBCs viability vs. Log10 BPPB concentrations (green indicators with error bars in Figure A6 in Appendix A). The plot of nonlinear regression of Log10 concentrations of BPPB vs. normalized response (green trace without indicators in Figure A6) was obtained using GraphPad Prism 8.0.1 Software (GraphPad Software, Boston, MA, USA) and used to calculate the HC50 which was 15.56 ± 12.13 µM.
2.2.5. Concentration- and Time-Dependent effects of BPPB on HaCaT Cell Viability
To ensure possible clinical developments of BPPB as a topical drug for treatment of melanoma skin lesions, it was necessary to ascertain its effects on non-cancerogenic dermal cells. Therefore, HaCaT cells, an immortal non-cancerous keratinocyte cell line originated from adult human skin [42–45], were treated with BPPB (0.1-10 µM for 24-, 48- and 72-hours) and then analyzed in terms of cell viability. The results of cell viability (%), under treatments of HaCaT cells with increasing BPPB concentrations at all times tested, have been reported as bar graphs in Figure 6a and as dispersion graphs in Figure 6b and 6c. In Figure 6c, the best fitting nonlinear statistical models related to the dispersion graph (punctuated lines) with their equations and R2 value, as obtained using Microsoft Excel 365 software, were also included. Furthermore, Figure A7 in Appendix A reports a comparison between HaCaT, MeOV PLX-R and MeTRAV PLX-R viability (%) vs. BPPB concentration in the range 0.1-2.0 µM.
As shown in Figure 6a and 6b, 24-hour-BPPB treatment significantly reduced cell viability which, however, remained > 50% (59.80%) up 6.0 µM BPPB concentration, while it dramatically decreased to 10.08% at 10.0 µM, the highest concentration tested. A similar trend was observed also at 48 and 72 hours. Although HaCaT cell response to BPPB was very similar at 48- and 72-hour treatments, data recorded after all exposure timings highlighted that there is a threshold concentration over which BPPB was dramatically lethal (Figure 6a,b). Based on the R2 values of the best fitting nonlinear models shown in Figure 6c, a second order polynomial correlation between cell viability (%) and BPPB concentrations is observable only in the 24-hours experiments (R2 > 0.95). The correlation (logarithmic type) was scarce at 72-hours treatment (R2 = 0.9324), while no correlation existed (R2 = 0.8414) in the 48-hours experiments, thus establishing that a concentration-dependent mechanism is conceivable only for short 24-hour treatments, as observed also for tumoral cell populations here considered. Collectively, even if less tolerant to BPPB than RBCs, HaCaT cells were much more tolerant than MeOV and MeTRAV cells, regardless of their resistance to PLX (Figure A7), thus allowing to envisage a certain selectivity of BPPB for CMM cells and a promising therapeutic potential. Anyway, to confirm this assumption and to allow a direct comparison of the cytotoxic effects of BPPB observed towards HaCaT cells and those observed vs. CMM cells, as well as comparisons with the cytotoxic effects of other synthetized nanoparticles reported in literature, the IC50 of BPPB vs. HaCaT was calculated. As previously described for viability experiments carried out with BPPB on CMM cells and RBCs, the transformed dispersion graph of Log10 BPPB concentrations vs HaCaT cell viability (%) and the plots of nonlinear regression of Log10 concentrations of BPPB vs. normalized response reported in Figure A8 in Appendix A were used to calculate the IC50 value of BPPB on HaCaT. Graphs in Figure A8 and the IC50 results reported in Table 2 were achieved using GraphPad Prism 8.0.1 Software (GraphPad Software, Boston, MA, USA). Table 2 reports also the IC50 values of BPPB found vs. MeOV and MeTRAV PLX-R cells, as well as HC50 values vs. RBCs, for direct comparisons.
The IC50 values reported in Table 2 confirmed that at all times of exposure tested, HaCaT cells were more tolerant to BPPB than both melanoma cell populations, and especially at 48 and 72 hours. Additionally, BPPB cytotoxicity towards HaCaT cells was minor of that of cationic dendrimer nanoparticles (PAMAM) of fourth (G4), fifth (G5) and sixth (G6) generation observed by Mukherjee et al. after 24 hour-exposure . Specifically, BPPB was less toxic than G4, G5 and G6 by 1.3, 3.8 and 3.9 times respectively. Curiously, as observed for MeOV PLX-R cells, but to a major extent, the IC50 values calculated for HaCaT were higher after 72 hours of exposure than after 48 hour-treatments, thus forecasting for a sort of adaptation of these cells over time to the cytotoxic effects of BPPB. The trend of the cytotoxic effects of BPPB vs. HaCaT as a function of exposure timing is shown in Figure A9 in Appendix A. Figure A9 reports also the best fitting nonlinear statistical models related to the trend dispersion graphs (punctuated lines) with their equations and R2 value, as obtained using Microsoft Excel 365 software. Based on the R2 value (R2 = 1), a strong second order polynomial correlation exists between the IC50 values of BPPB and exposure timing, thus establishing for a time-dependent mechanism, as previously observed on both PLX-R cells.
2.2.6. Concentration- and Time-Dependent Effects of BPPB on ROS production by HaCaT cells
As for MeOV and MeTRAV PLX-R cells, ROS levels were analyzed in HaCaT cells exposed to increasing concentrations of BPPB.
As shown in Figure 7a, the increase of ROS levels was significant and very strong only at the highest concentrations tested (10.0 µM) after 24- and 48-hours exposure (ratios = 10.25 and 12.67 respectively) and at 6.0 and 10.0 µM after 72 hours (ratios = 9.13 and 8.92, respectively). At the highest concentration, ROS amount after 72 hours of exposure was lower than after 48 hours, inducing to hypothesize a cellular adaptation. Collectively, this response is like that observed for PLX-resistant cells in which an inverse relationship between cell viability and ROS production has been reported (Figure A10 in Appendix A). Therefore, it is conceivable that the BPPB cytotoxic effects could depend on ROS production increase. This assumption found confirmation modelling data of HaCaT cell viability (%) vs. the ratios DCFH positive cells (%)/viable cells (%) into HaCaT cells after exposure to increasing concentrations (0.1-10.0 µM) of BPPB for 24, 48 and 72 hours, with the best fitting regression models (Figure 7d). Based on the high R2 values (0.9874 (24 h), 0.9967 (48 h), 0.9927 (72 h), a strong correlation of Power type existed between cell viability (%) and ROS increase. Dispersion graphs and associated best fitting nonlinear models in Figure 7b,c were elaborated to evidence the possible existence of concentration- or time-dependent mechanism for ROS increase. Based on the R2 values reported (0.9685 (24 h), 0.9669 (48 h), 0.9345 (72 h), a good second order polynomial correlation between ROS increase and BPPB concentrations existed only in treatments of 24 and 48 hours, for which it is possible to confirm a concentration-dependent mechanism, while in treatments of 72 hours the correlation was scarce. The increase in ROS levels was strongly correlated to exposure timing, thus establishing a time-dependent mechanism for ROS production induced by BPPB.
2.2.7. Selectivity Index
The selectivity index (SI) of BPPB for CMM cells vs. RBCs and HaCaT cells was calculated to predict its therapeutic potential. Generally, the SI values against tumoral cells (TCs) in relation to non-tumoral cells (NTCs) is calculated using the formula (1).
SI = IC50 for NTCs/IC50 for TCs
A sufficiently high value of the SI is an essential requirement to make a new molecule worthy of consideration for further studies and future development as a new therapeutic agent. Generally, the tested compounds with selectivity indices higher than 1 indicate drugs with greater efficacy against tumor cells than toxicity against normal cells[48]. Although opinions are contrasting, Krzywik et al. have recently reported that SIs > 1.0 can be considered sufficient and favorable for the development of a new molecule as chemotherapeutic[48].
The IC50 values reported in Table 2 determined after 24, 48 and 72 hours of exposure of CMM and HaCaT cells, as well as the HC50 determined on RBCs after the time of experiments as for protocol [41] were used to calculate the SIs according to Eq. 1 and reported in Table 3.
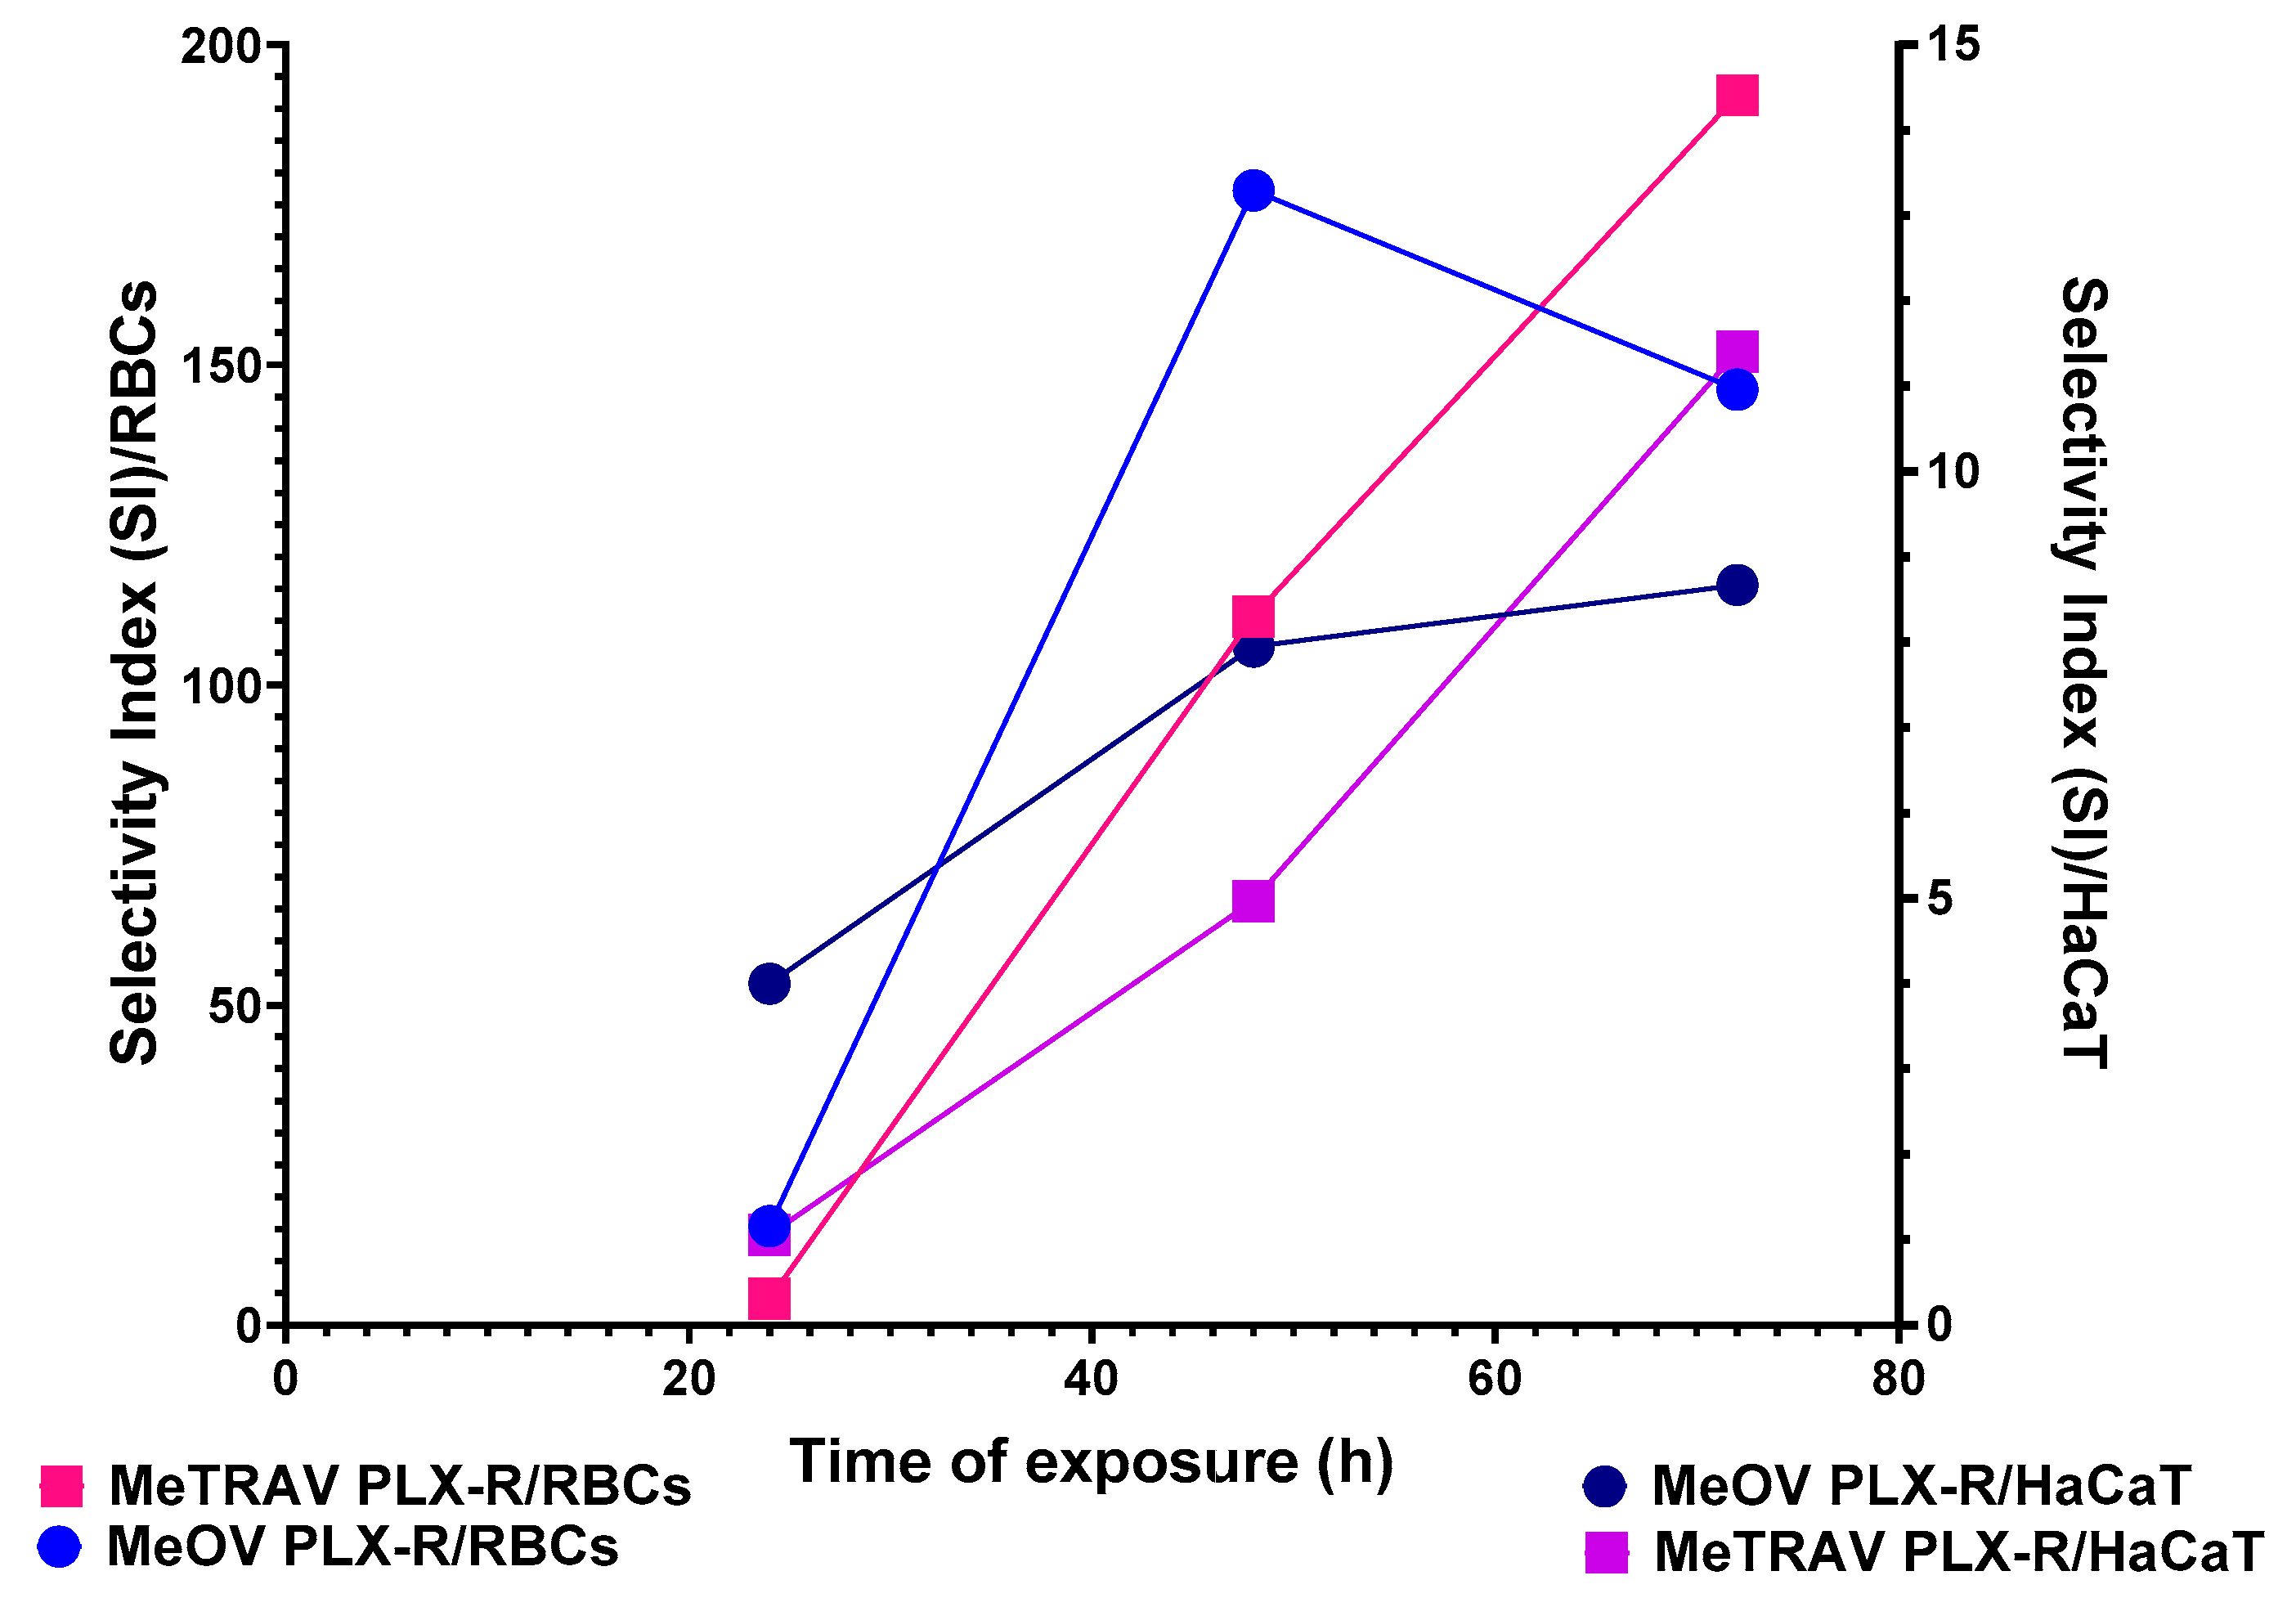
Concerning RBCs, the selectivity of BPPB for tumor cells was from good to very high for both cell lines and at all times of exposure tested. Specifically, SI values were under 20 (4.10 vs. MeOV PLX-R and 14.46 vs. MeTRAV PLX-R cells) for exposure timing of 24 hours, while for longer periods of exposure they were > 100 up to 177.22 (48 h, MeOV PLX-R cells) and 192.10 (72 h, MeTRAV PLX-R cells). Interesting, the selectivity of BPPB for MeTRAV PLX- R cells respect to RBCs after 72 hours of exposure was higher than that of Pulsatilla Saponin D derivative 14 reported by Zhong et al, which was the most active and less toxic anticancer device against A549, human lung cancer cell line[49]. In fact, by using the reported data of IC50 on A549 cells after 72 hours of exposure and HC50 on RBCs reported for compound 14, a SI < 192.10 and equal to 178.57 can be calculated [49]. Regarding all other compounds, two demonstrated SI < 10 (1.05 and 7.3), eight ≤ 50 (20, 23.9, 29, 30.8 and 50), two < 100 (80 and 98) and only one >100 (108), which was lower by 1.4 and 1.8 than those calculated for BPPB when assayed on MeOV and MeTRAV PLX-R cells[49]. Curiously, while the SI values vs. MeTRAV PLX-R cells were 3.5 and 1.6 times lower than MeOV PLX-R cells when exposed to BPPB for 24 and 48 hours, they were higher by 1.3 times when exposed for 72 hours. Practically, longer periods of exposure reduced (48 h) and even reversed (72 h) the differences in cell tolerability to BPPB, as observed also for HaCaT cells both in terms of cell viability and ROS production. This trend has been shown in Figure A11 in Appendix A, reporting in graph the SI values of BPPB for both MeOV and MeTRAV PLX-R cells in relation to its hemolytic toxicity as function of time of exposure. Concerning HaCaT cells, the selectivity of BPPB for tumor cells was from > 1 up to 11.4 for both CMM cell lines and at all times of exposure tested. Specifically, SI values were >>> 1 vs. MeOV PLX-R (4.00 (24 h), 7.95 (48 h) and 8.67 (72 h)) with a 2-time increase passing from 24- to 48-hours exposure, and a further 1.1-times increase at 72-hours exposure. Considering MeTRAV PLX-R cells, although the SI was only 1.06 for short times of exposure (24 h), it progressively increased by 4.7 and further 2.3 times for longer exposure timing of 48 and 72 hours. Collectively, after 72 hours exposure, BPPB demonstrated a selectivity for both PLX-resistant melanoma cells here considered higher than that observed by Wróblewska-Łuczka for four out of five terpenes for four melanoma cell lines (A375, SK-MEL 28, FM55P and FM55M2), being these SI values under 4 [50]. Only Carvacrol was found to own a selectivity index above 10, as in the case of BPPB when was administered to MeTRAV PLX-R cells[50]. The trend of the SI values of BPPB for both MeOV and MeTRAV PLX-R cells in relation to its cytotoxicity vs. HaCaT cells as function of time of exposure, is available in Figure A11 in Appendix A.
3. Materials and Methods
3.1. Chemicals and Instruments
All reagents and solvents used in this study were obtained by Merk (Milan, Italy) and were used without further purification. 1,1-(1,12-dodecanediyl)bis[1,1,1]-triphenylphosphonium di-bromide (BPPB) was synthetized and characterized as recently described[26].
3.2. BPPB Cytotoxicity Evaluation on PLX-resistant CMM Cells
3.2.1. Cell Lines and Culture Conditions
PLX4032-resistant (PLX-R) MeOV and MeTRAV cells were selected by treating the whole population of parental cells with increasing concentrations of PLX4032, as previously reported [34]. Both cell lines were maintained in RPMI 1640 medium (Euroclone Spa, Pavia, Italy) supplemented with 10% Fetal Bovine Serum (FBS, Euroclone Spa, Pavia, Italy), 1% L-Glutamine (Euroclone Spa, Pavia, Italy), and 1% Penicillin/Streptomicin (Euroclone Spa, Pavia, Italy) and grown in standard conditions (37 °C humidified incubator with 5% CO2).
3.2.2. Treatments
To determine the cytotoxic effects of BPPB, PLX-R MeOV and MeTRAV cell lines were treated for 24, 48 and 72 h with increasing concentration (0.1–2.0 µM) of BPPB. The stock solutions of these compounds were prepared in 40,000-fold diluted DMSO, and preliminary experiments demonstrated that the final DMSO concentrations did not change any of the cell responses analyzed. Cell cultures were carefully monitored before and during the experiments to ensure optimal cell density. Notably, samples were discarded if the cell confluence reached >90%.
3.2.3. Cell Viability Assay
Cell viability was determined by using the CellTiter 96® AQueous One Solution Cell Proliferation Assay (Promega, Madison, WI, USA), as previously described[52,53[]. Briefly, cells (10,000 cells/well) were seeded into 96-well plates (Corning Incorporated, Corning, NY, USA) and then treated. Next, cells were incubated with 20 µL of CellTiter, and the absorbance at 490 nm was recorded using a microplate reader (EL-808, BIO-TEK Instruments Inc., Winooski, VT, USA). The cell survival rate, expressed as cell viability percentage (%), was evaluated based on the experimental outputs of treated groups vs. the untreated groups (CTR) and was calculated as follows: cell viability (%) = (OD treated cells − OD blank)/(OD untreated cells − OD blank) × 100%. IC50 was evaluated by GraphPad Prism 8.0.1 Software (GraphPad Software, Boston, MA, USA) as explained in the discussion section.
3.3. In Vitro Hemolytic Toxicity of BPPB Using Red Blood Cells (RBCs)
Hemolytic ratio was evaluated, as recently reported with slight changes [41], in EDTA-blood samples from eight healthy donors from the San Martino Hospital Transfusion Centre. In detail, red blood cells (RBCs) were isolated by diluting 0.2 mL of blood with 0.4 mL of phosphate-buffered saline (PBS) and centrifuged for 5 min at 10,000 g. The pellet, consisting of RBC, was washed 5 times with 1.0 mL PBS and finally resuspended with 2.0 mL PBS. The assay was carried out on 0.1 mL of resuspended RBCs added to 0.1 mL of H2O (positive control), 0.1 mL of PBS (negative control) or 0.1 mL of the different concentrations (0.1-50 µM) of the compound to be tested (BPPB). The samples were incubated for 60 min at 37°C and at the end they were centrifuged for 5 min at 10,000 g. Finally, 0.1 mL of supernatant was transferred to a transparent 96-well plate and measured by a spectrophotometer (Dynex Technologies; Chantilly, VA, U.S.A.) at 595 nm. The hemolytic ratio was calculated using the formula:
Hemolytic ratio (%) = (OD TEST - OD NEGATIVE CONTROL)/ (OD POSITIVE CONTROL - OD NEGATIVE CONTROL) × 100
3.4. Evaluation of Cytotoxicity of BPPB on Human Keratinocites (HaCaT)
3.4.1. Cell Culture
Human skin keratinocytes cells (HaCaT), obtained thanks to a generous gift from the IRCCS Ospedale Policlinico San Martino, Proteomics and Mass Spectrometry Unit (Genoa, Italy), were were maintained in DMEM medium (Euroclone Spa, Pavia, Italy) supplemented with 10% Fetal Bovine Serum (FBS, Euroclone Spa, Pavia, Italy), 1% L-Glutamine (Euroclone Spa, Pavia, Italy), and 1% Penicillin/Streptomicin (Euroclone Spa, Pavia, Italy) and grown in standard conditions (37 °C humidified incubator with 5% CO2).
3.4.2. Treatments
To determine the cytotoxic effects of BPPB on human keratinocytes (HaCaT), cells were treated for 24, 48 and 72 h with increasing concentration (0.1–10.0 µM) of BPPB. Cell cultures were carefully monitored before and during the experiments to ensure optimal cell density. Notably, samples were discarded if the cell confluence reached > 90%.
3.4.3. Viability Assay
Viability assay on HaCaT cells was performed as described in Section 3.2.3.
3.5. ROS Production
ROS production was evaluated using 2′-7′-dichlorofluorescein-diacetate (DCFH-DA; Merk Life Science S.r.l. Milan, Italy) as previously reported[52–54]. DCFH-diacetate (DA) staining is a simple method to detect ROS in cells, on the base of H2O2 produced, upon chemical treatment or genetic modifications [40].
3.6. Statistical Analyses
Results have been expressed as means ± S.D. of four independent experiments in which different wells were analyzed every time for each experimental condition. In the analysis of cell viability or H2O2 levels, the condition of untreated cells was set as 100% ± S.D. and 1 ± S.D., respectively. Statistical significance of differences was determined by one-way analysis of variances (ANOVA) followed by Dunnet’s multiple comparison test correction using GraphPad Prism 8.0.1 (GraphPad Software v8.0, San Diego, CA, USA). Asterisks indicate the following p-value ranges: * p < 0.05, ** p < 0.01, *** p < 0.001, **** p < 0.0001. p > 0.05 was not considered statistically significant and no symbol was used in the images.
4. Conclusions
Systematic studies on genetic alterations in human malignancies have supported the development of genotype-driven targeted drugs for several types of cancers, including cutaneous melanoma. Nonetheless, the occurrence of acquired resistance to these anti-cancer agents puts a critical obstacle for improving cancer patient prognosis. In fact, if the inhibition of BRAF or of the combined BRAF/MEK initially reduced the tumor progression in BRAF V600E mutant melanoma patients, the targeted therapy resistance emerged in most of them within 1 or 2 years, by several mechanisms. It is the case of vemurafenib (PLX), which improves disease and overall survival in inoperable advanced BRAFV600E mutant melanoma patients, but its tolerance is often poor, and resistance frequently occurs, without predictive factor. Collectively, the current worrisome scenario concerning melanoma is made of a therapeutic arsenal no longer effective against resistant BRAF mutant metastatic melanoma and of limited possibilities to improve patients’ conditions and survival. Here, we demonstrated that synthetized triphenyl phosphonium cationic nano vesicles (BPPB), which have been previously found to be effective on two populations of BRAF mutant metastatic melanoma cells still sensitive to PLX (MeOV BRAFV600E and MeTRAV BRAFV600D cells), are effective also on the PLX-resistant counterpart of cells (MeOV BRAFV600E PLX-R and MeTRAV BRAFV600D PLX-R cells), at nanomolar concentrations after 48- and 72-hour treatment. Overall, also when used to treat PLX-resistant BRAF mutant cells for 72 hours treatments, BPPB was more potent than PLX when used to treat PLX-sensitive cells for the same times of exposure. Collectively, although further experiments are needed, these promising early findings could pave the way for the future clinical development of BPPB as topical drug to treat skin melanoma lesions, due to its good tolerability by derma cells.
Author Contributions
Conceptualization, S.A., B.M., C.D; methodology, software, validation, formal analysis, investigation, data curation, B.M, S.A, C.T., F.B.; writing—original draft preparation, S.A; writing—review and editing, S.A., B.M., C.D.; visualization, S.A.; supervision, S.A., B.M. and C.D.; project administration, S.A., B.M. and C.D.; Confocal microscopy analysis B.M., M.P.; Hemolysis assays M.G.S. All authors have read and agreed to the published version of the manuscript.
Funding
This research received no external funding.
Institutional Review Board Statement
Not applicable.
Informed Consent Statement
Not applicable.
Data Availability Statement
All data supporting reported results are included in this manuscript.
Conflicts of Interest
The authors declare no conflicts of interest.
Appendix A
Figure A1.
Dispersion graphs (no lines) of cell viability (%) of MeOV PLX-R and MeTARV PLX-R cells vs. increasing BPPB concentrations (0.1-2.0 µM) after 24 hours (blue and red square indicators, respectively), 48 hours (pink and purple triangular indicators, respectively) and 72 hours (green and sky-blue spherical indicators, respectively) of exposure. Dotted lines represent the nonlinear regression models which best fitted the data of dispersion graphs, according to R2. In same colours, the associated R-squared values and the equations expressing the mathematical relationship existing between data, have been shown.
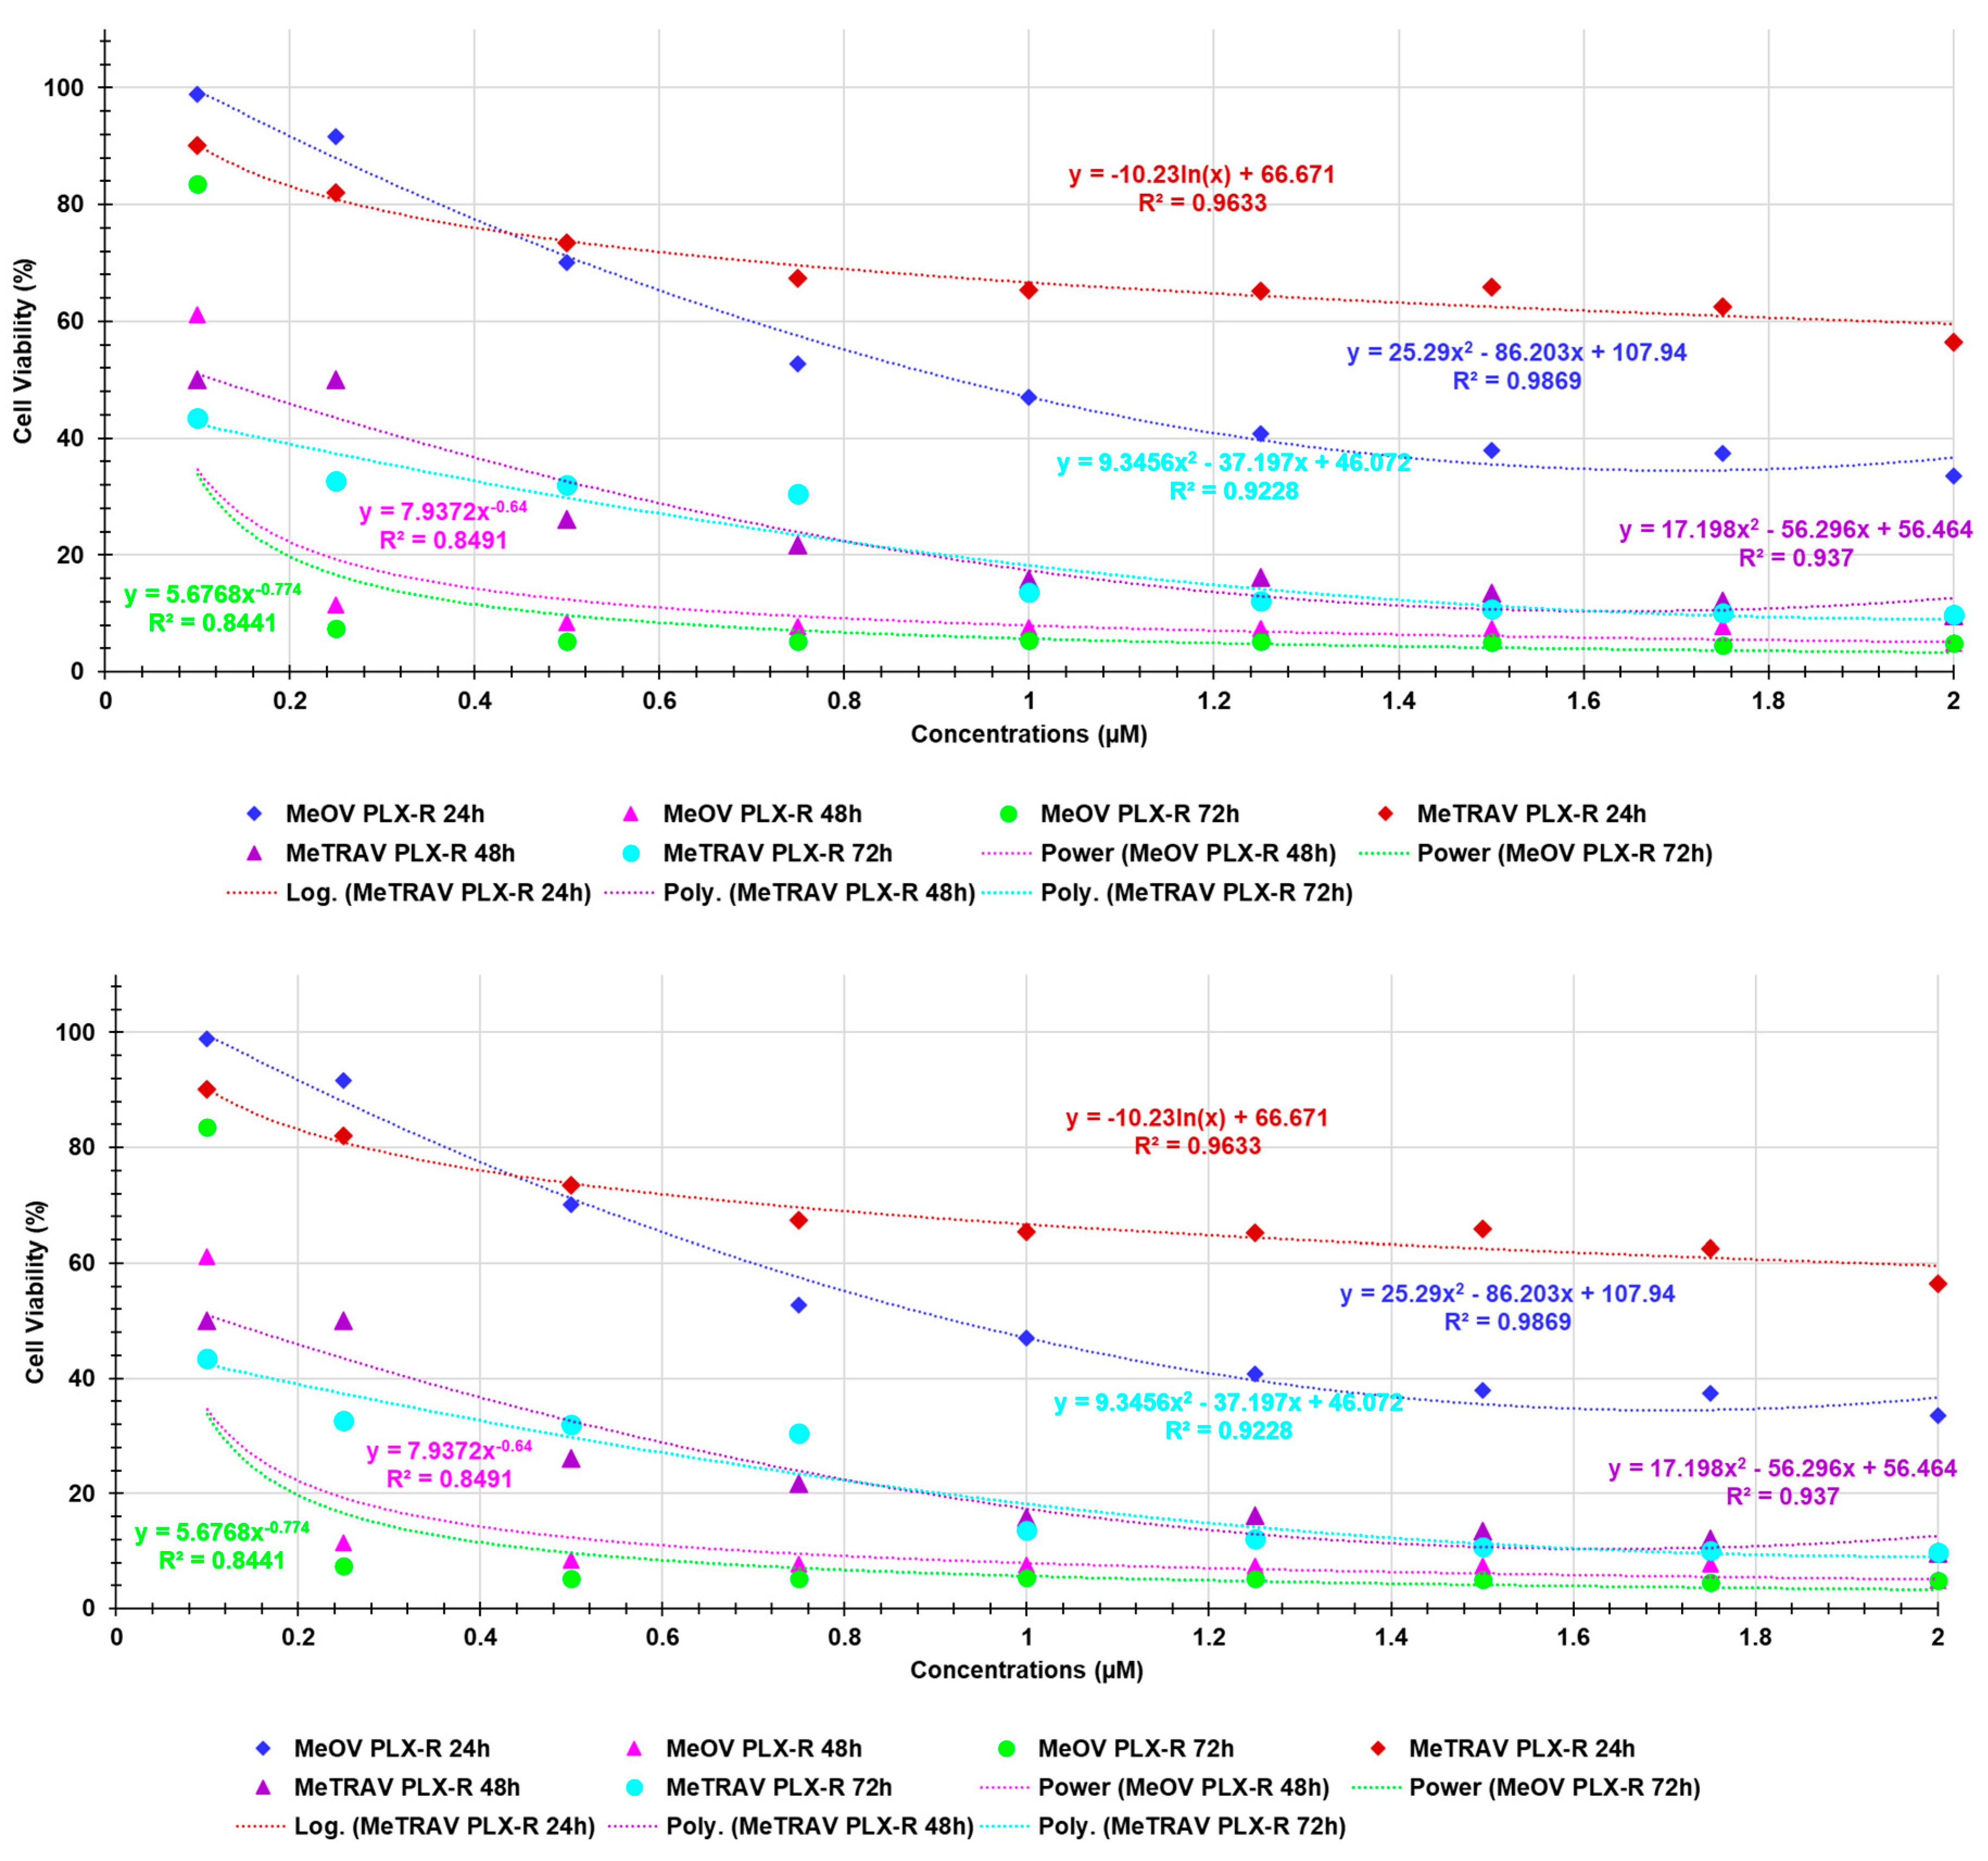
Figure A2.
Dispersion graphs of IC50 values of BPPB towards MeOV PLX-R (blue square indicators) and MeTRAV PLX-R (pink triangular indicators) as functions of exposure timing with related second order polynomial regression models (punctuated blue and pink lines), their equations and R2 values, as provided by Microsoft Excel 365 software. The IC50 value of BPPB on MeTRAV PLX-R cells at 24 hours of exposure is an extrapolation predicted by the nonlinear model constructed by using GraphPad Prism 8.0.1 Software (GraphPad Software, Boston, MA, USA).
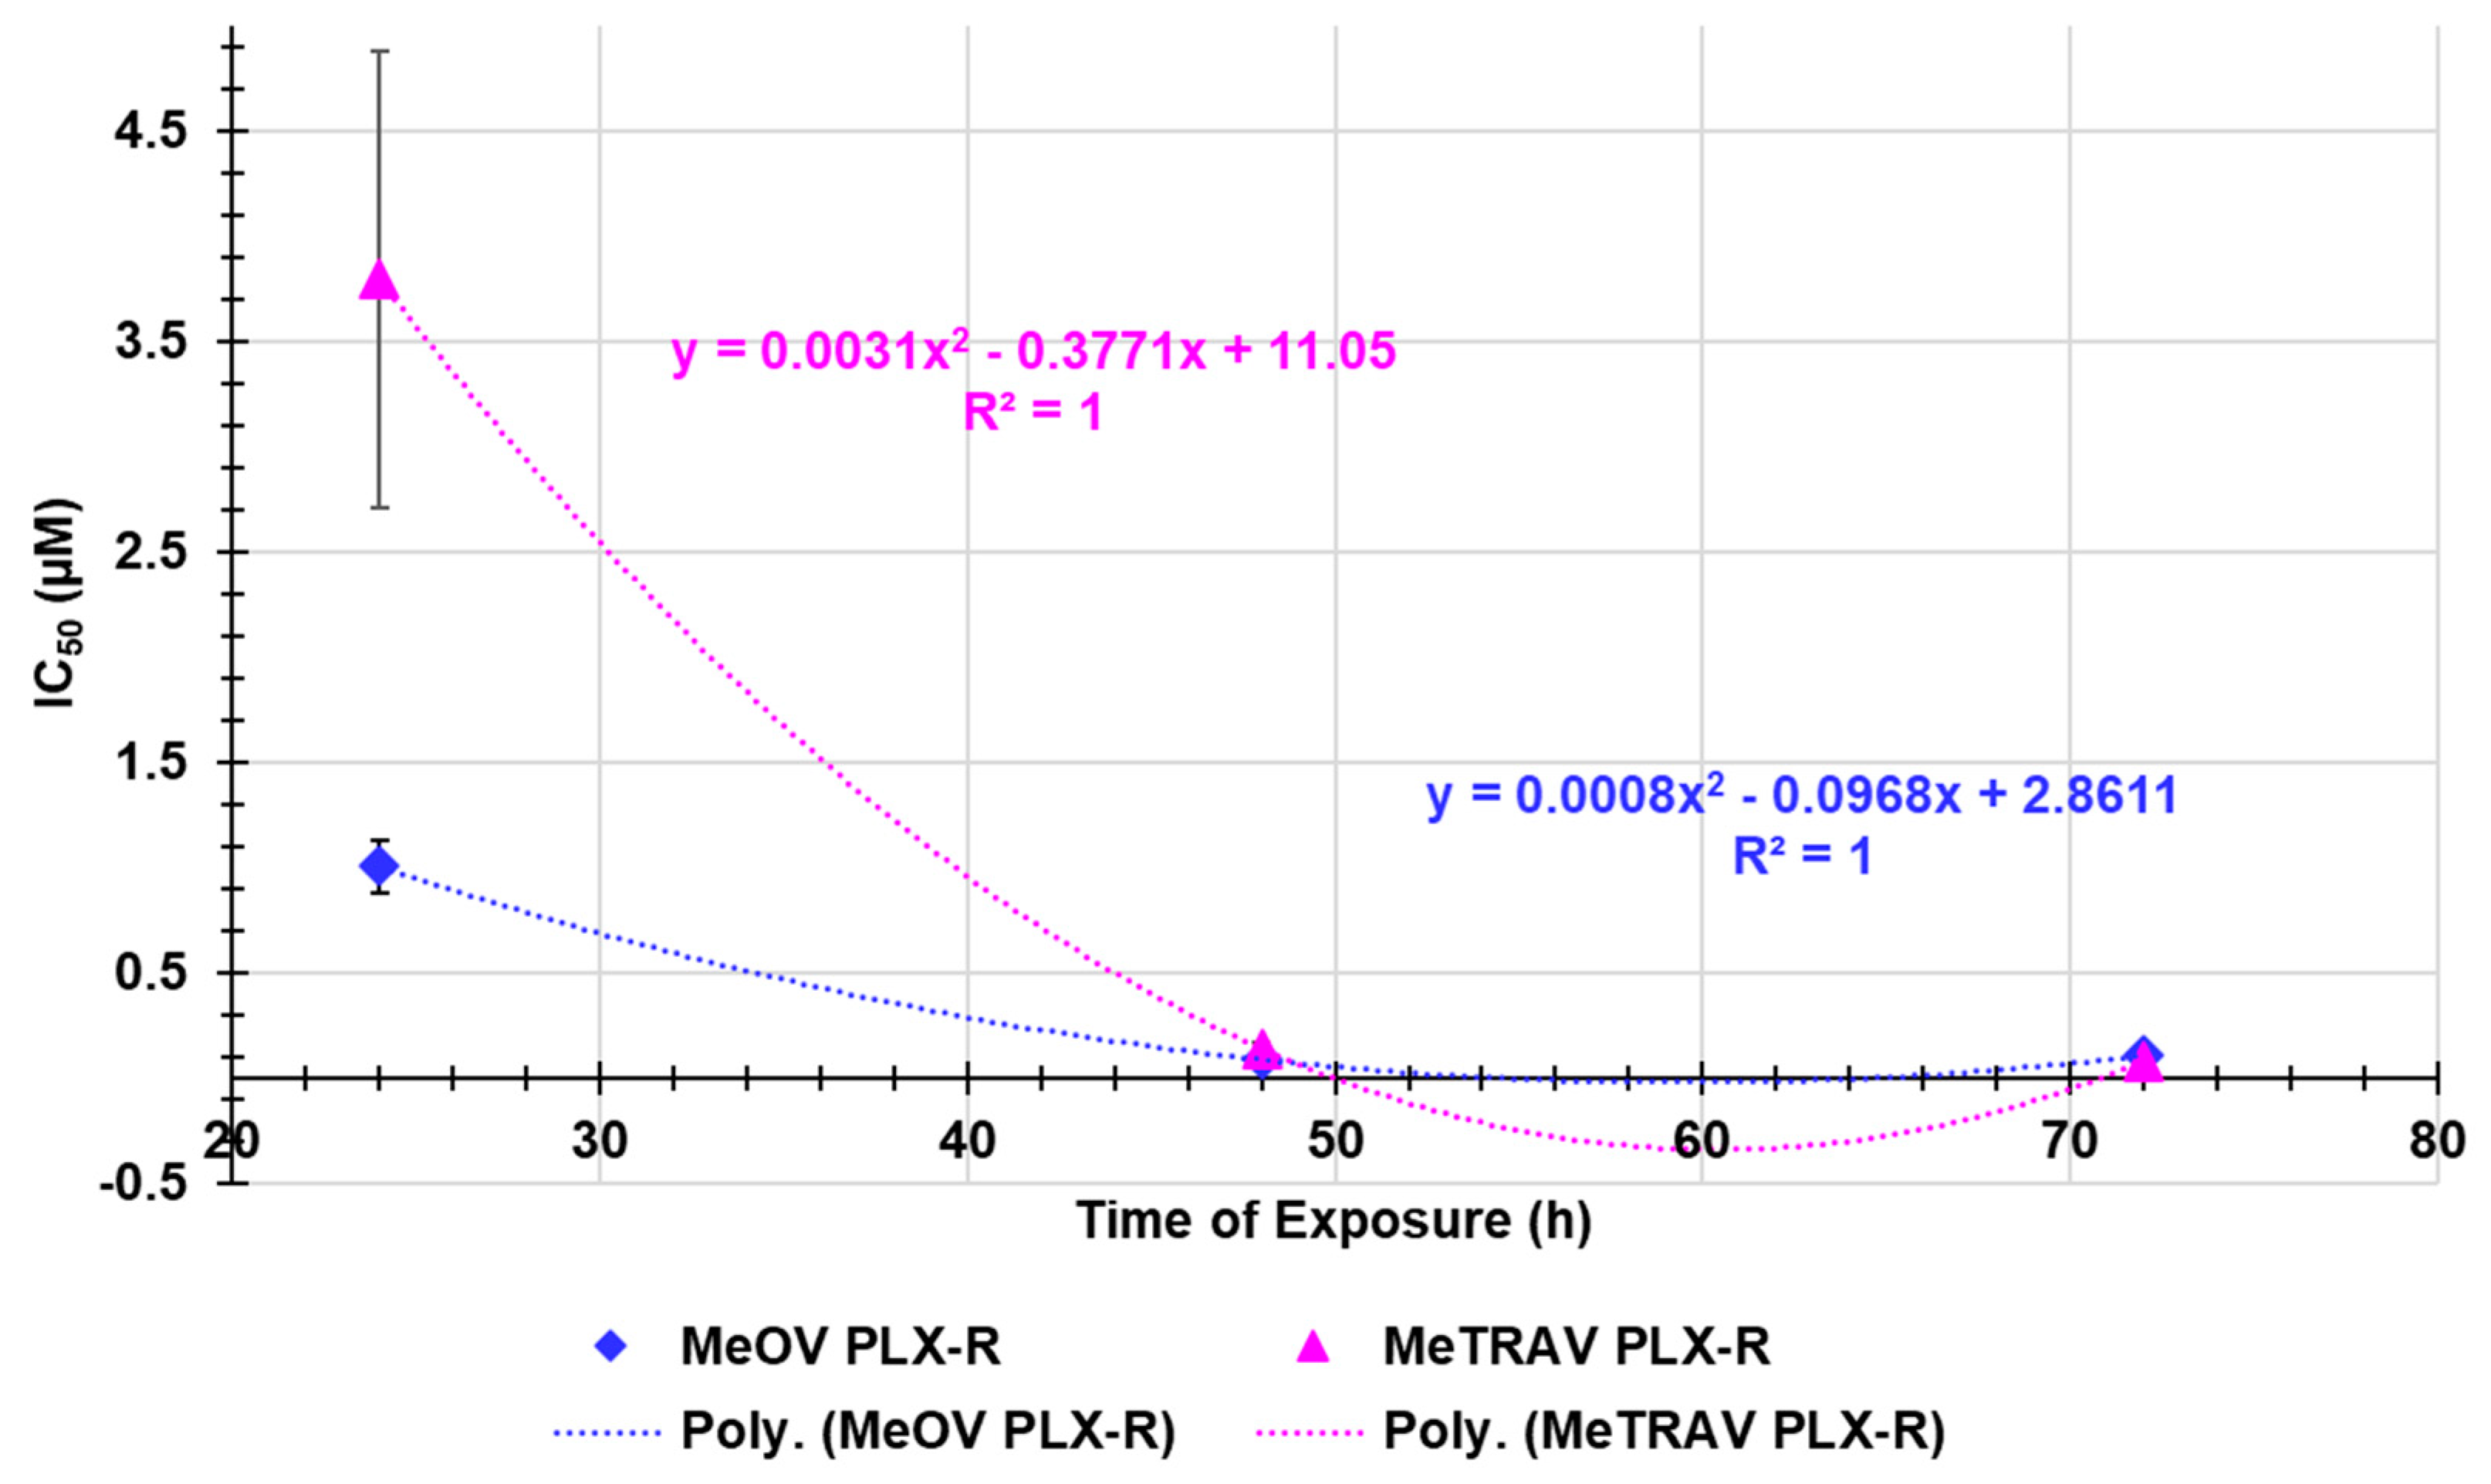
Figure A3.
Dispersion graphs of the values of ratios DCFH positive cells (%)/viable cells (%) vs. BPPB concentrations (µM) concerning MeOV PLX-R and MeTRAV PLX-R cells after 24 (sky-blue and yellow round indicators, respectively) 48 (pink and purple round indicators, respectively) and 72 hours (red and green round indicators, respectively) of treatment. Punctuated lines with the same colors of indicators represent the best fitting nonlinear statistical models, which have been shown with their equations and R2 values.
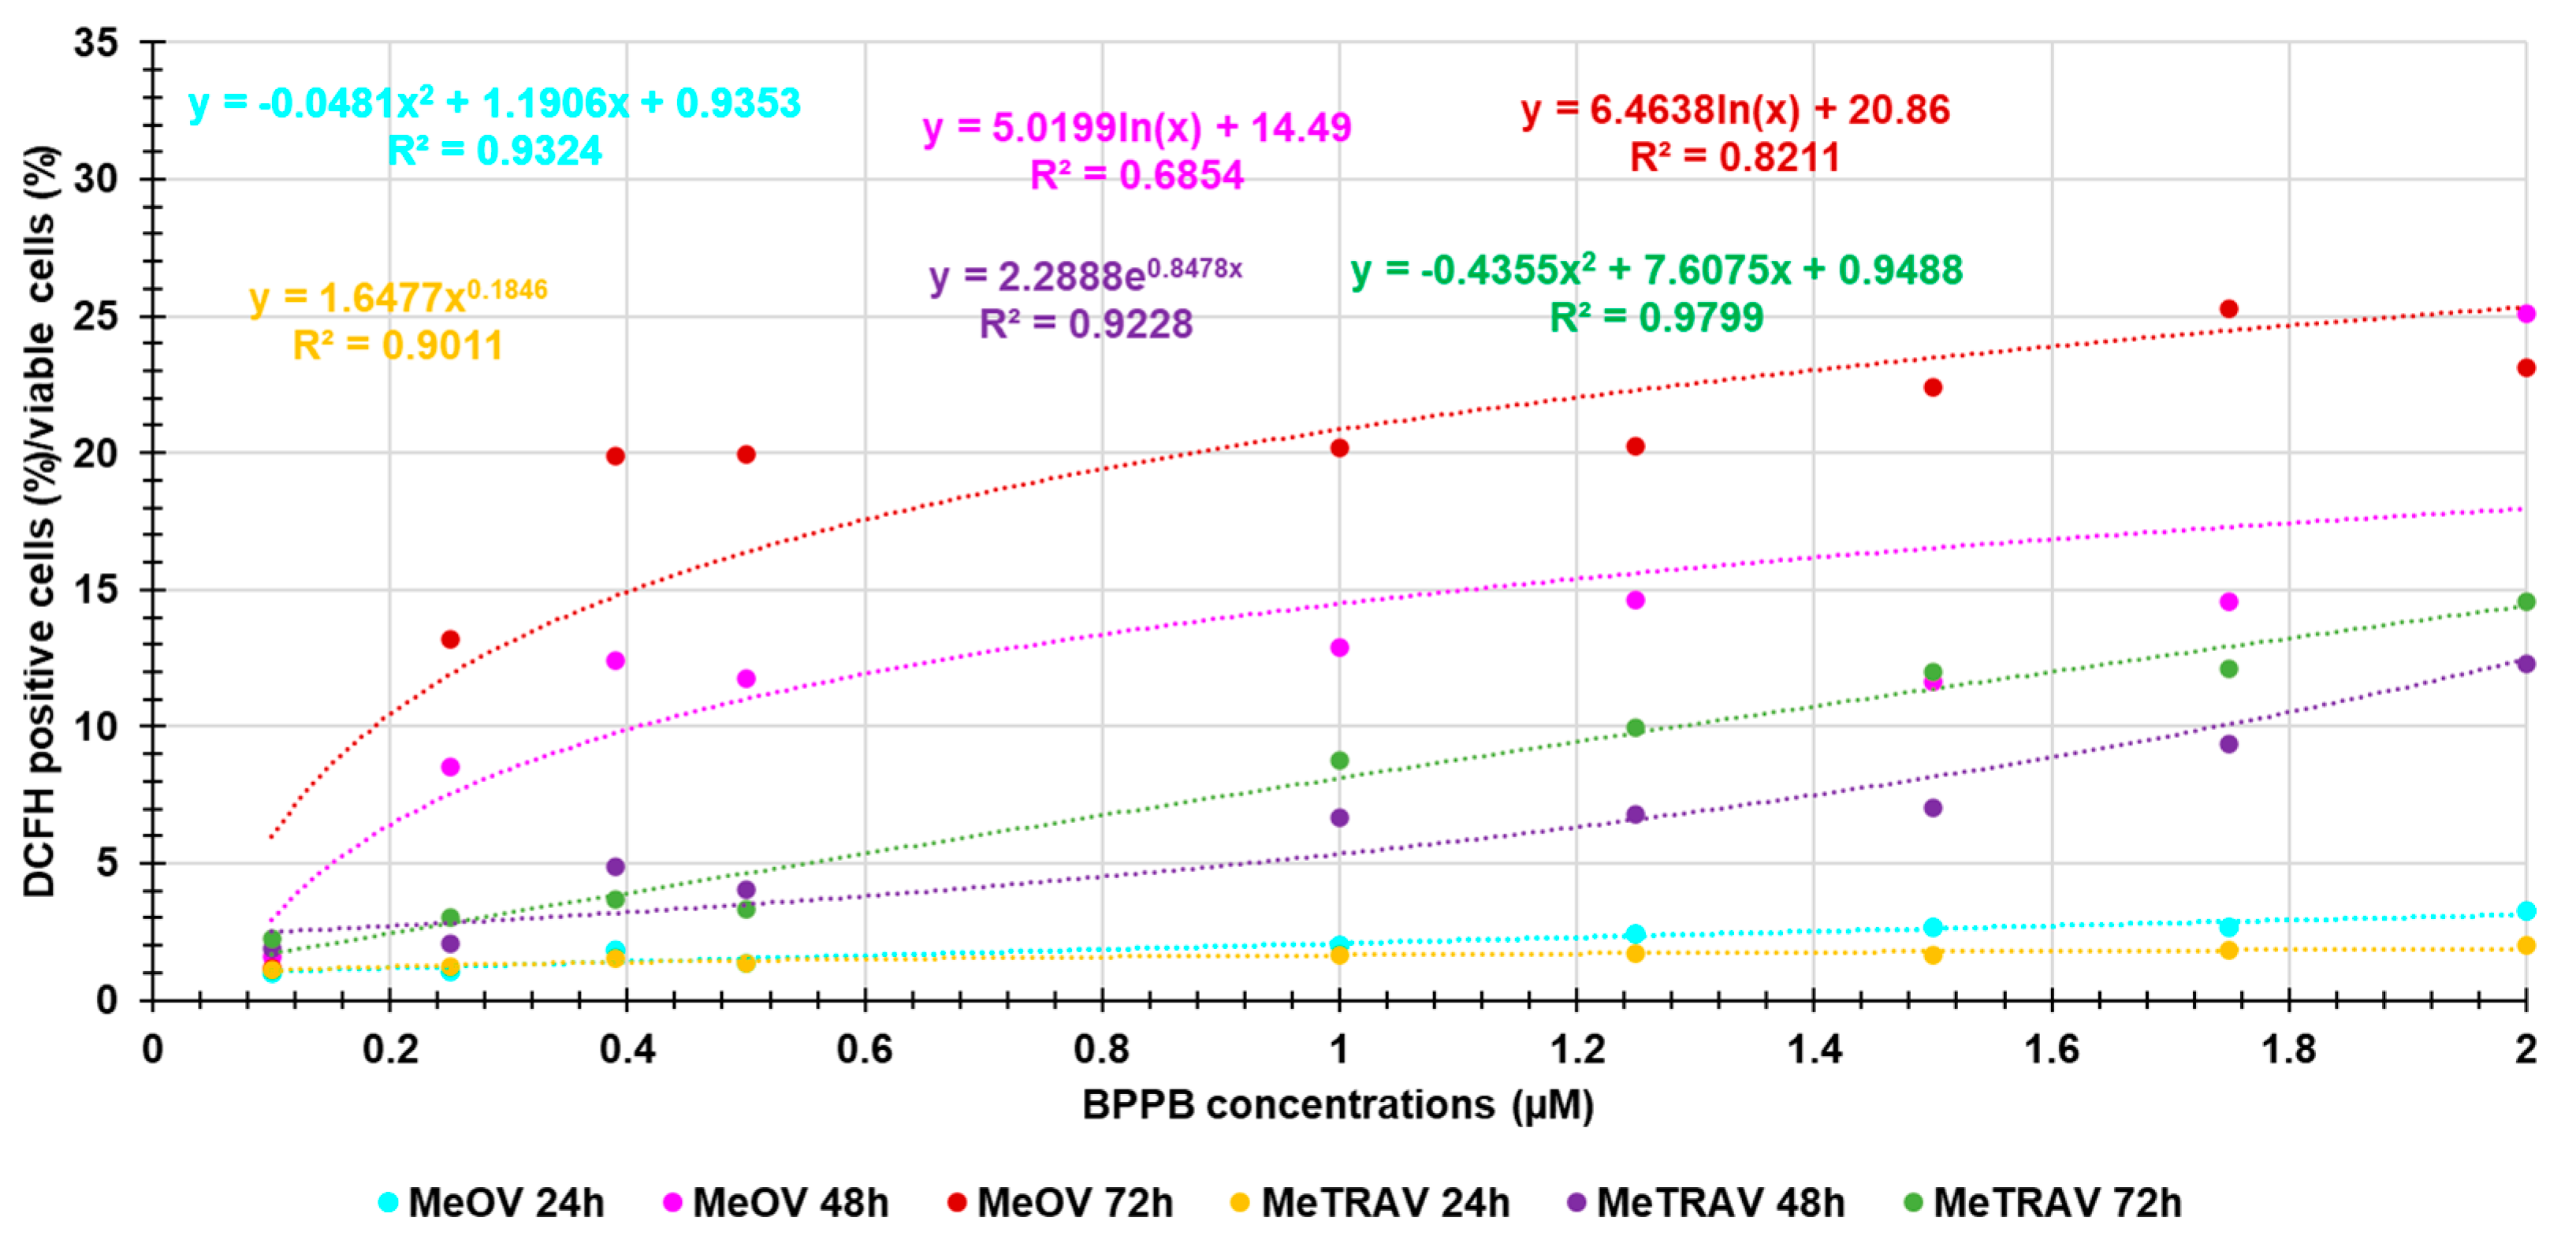
Figure A4.
Dispersion graphs of the average ratio DCFH positive cells (%)/viable cells (%) observed for both cells’ lines vs. exposure timing, with the related nonlinear regression models which best fitted the data and their R2 values.
Figure A4.
Dispersion graphs of the average ratio DCFH positive cells (%)/viable cells (%) observed for both cells’ lines vs. exposure timing, with the related nonlinear regression models which best fitted the data and their R2 values.
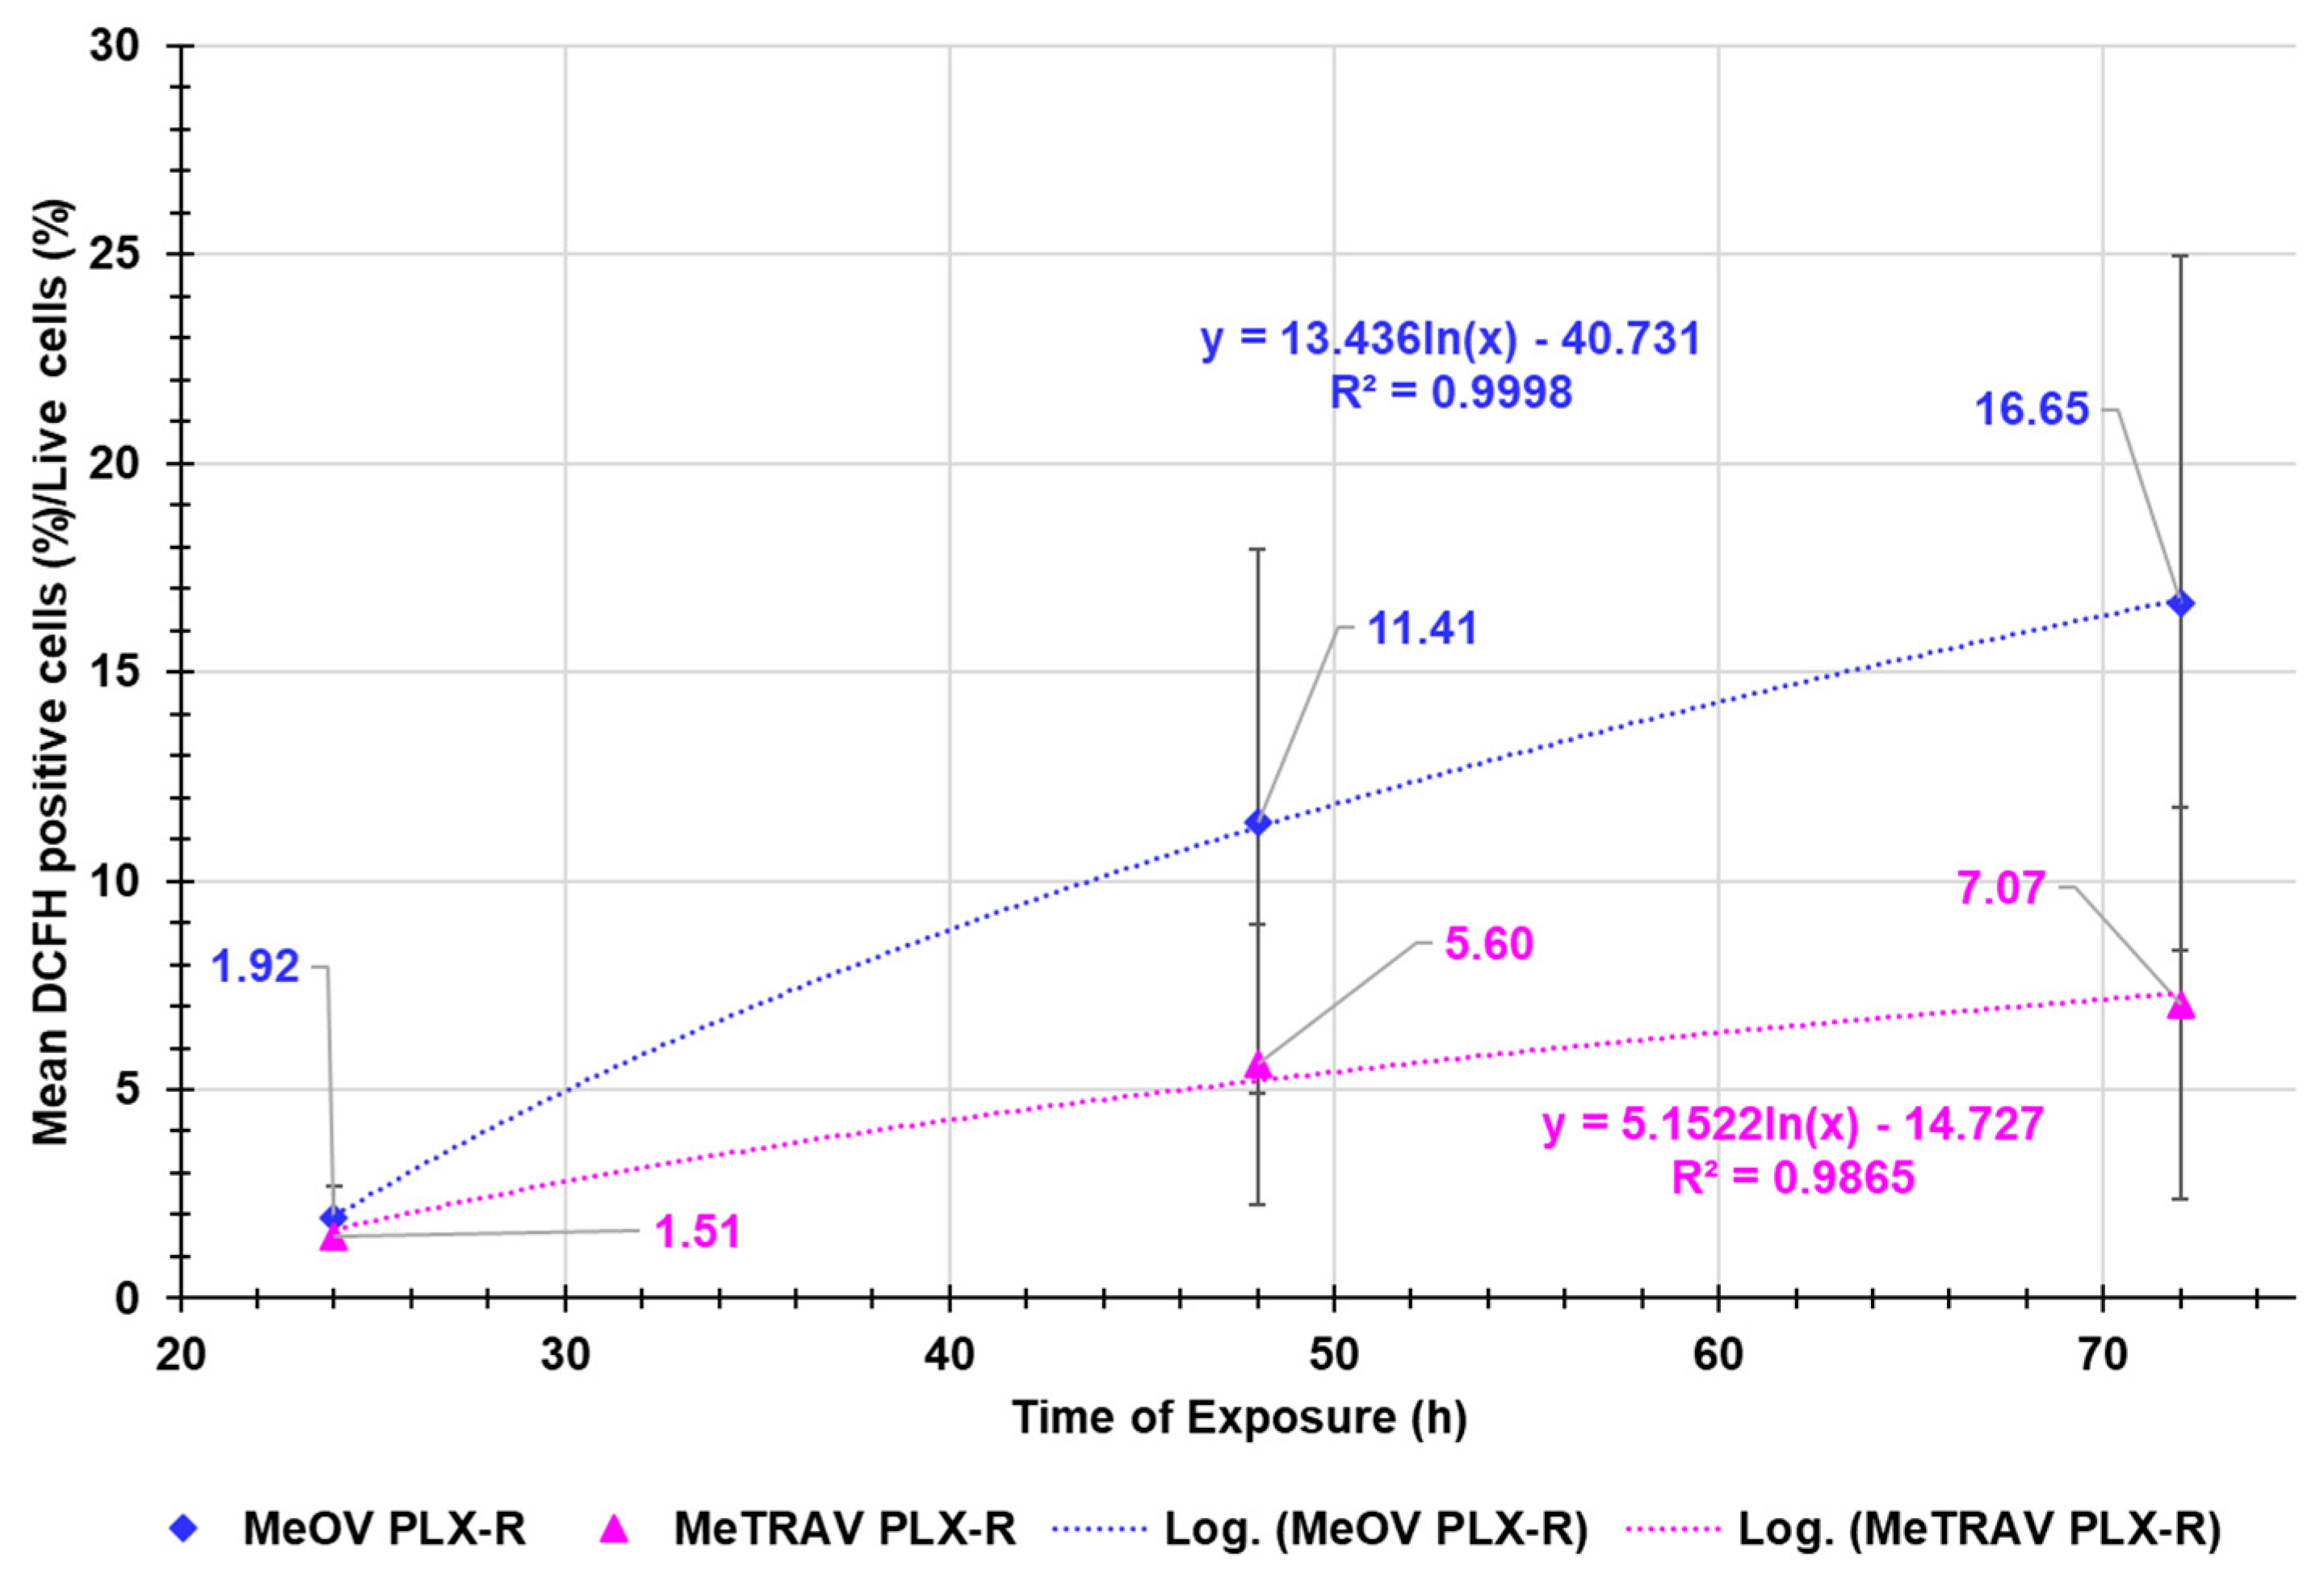
Figure A5.
Dispersion graphs of the values of ratios DCFH positive cells (%)/viable cells (%) vs. cells viability concerning MeOV PLX-R and MeTRAV PLX-R cells after 24 (sky-blue and yellow round indicators, respectively) 48 (pink and purple round indicators, respectively) and 72 hours (red and green round indicators, respectively) of treatment. Punctuated lines with the same colors of indicators represent the best fitting nonlinear statistical models, which have been shown with their equations and R2 values.
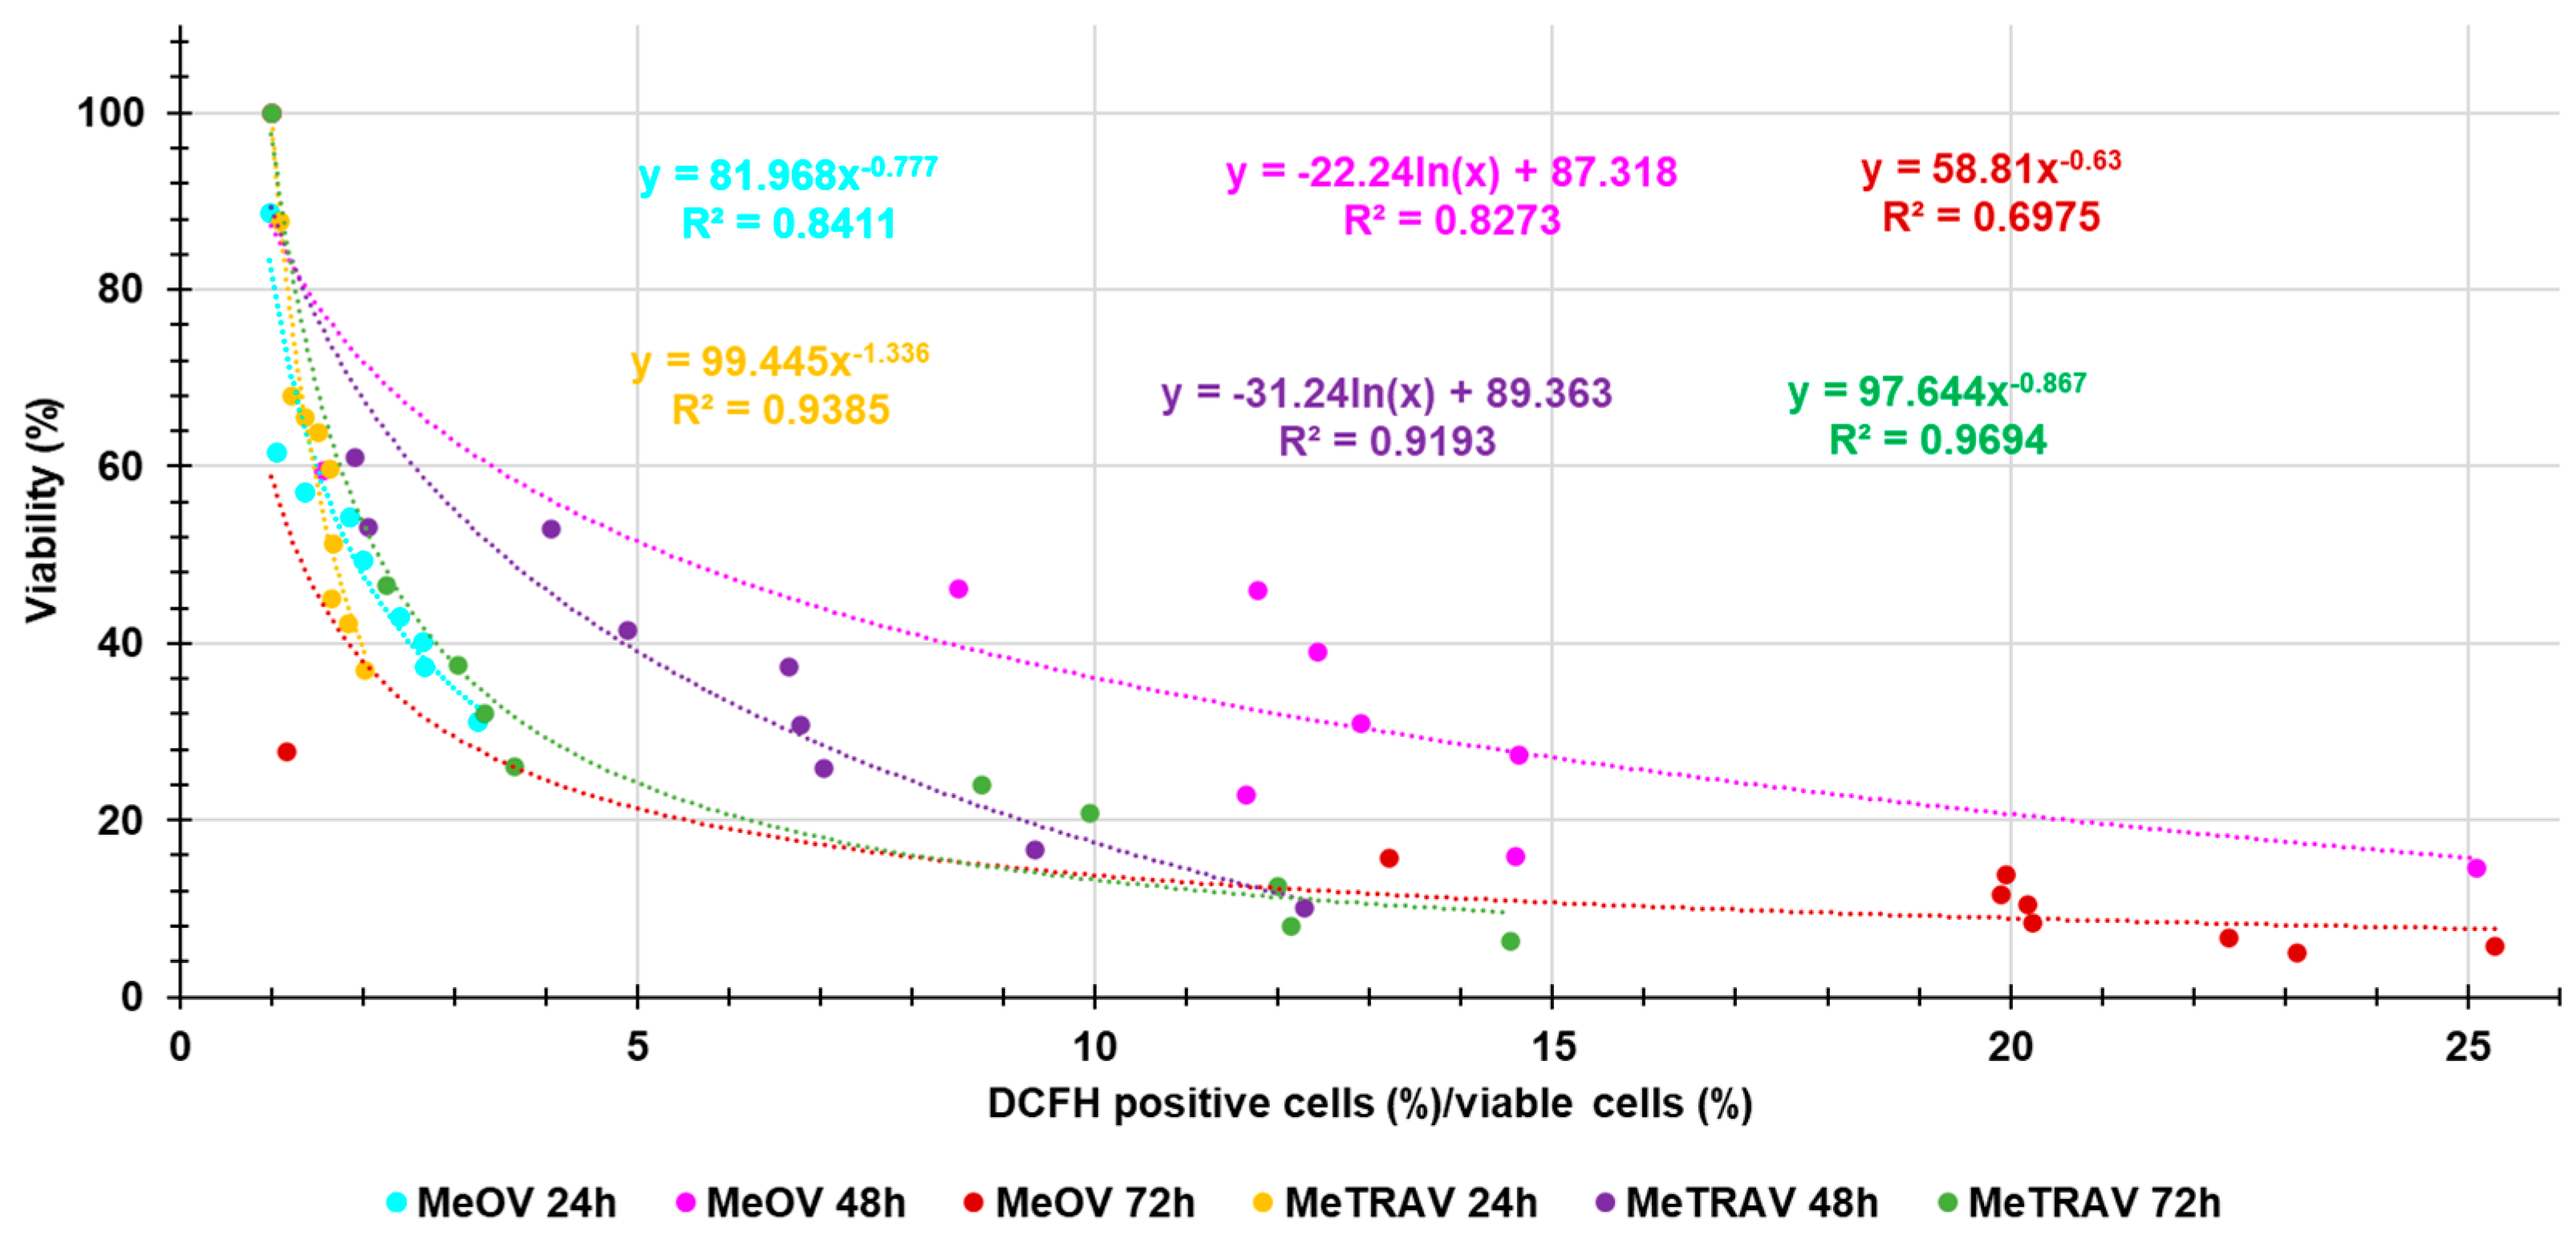
Figure A6.
Plot of Log concentration of BPPB vs. RBCs viability (%) (green indicators with error bars) and plot of nonlinear regressions of Log concentrations of BPPB vs. normalized response (green trace without indicators).
Figure A6.
Plot of Log concentration of BPPB vs. RBCs viability (%) (green indicators with error bars) and plot of nonlinear regressions of Log concentrations of BPPB vs. normalized response (green trace without indicators).
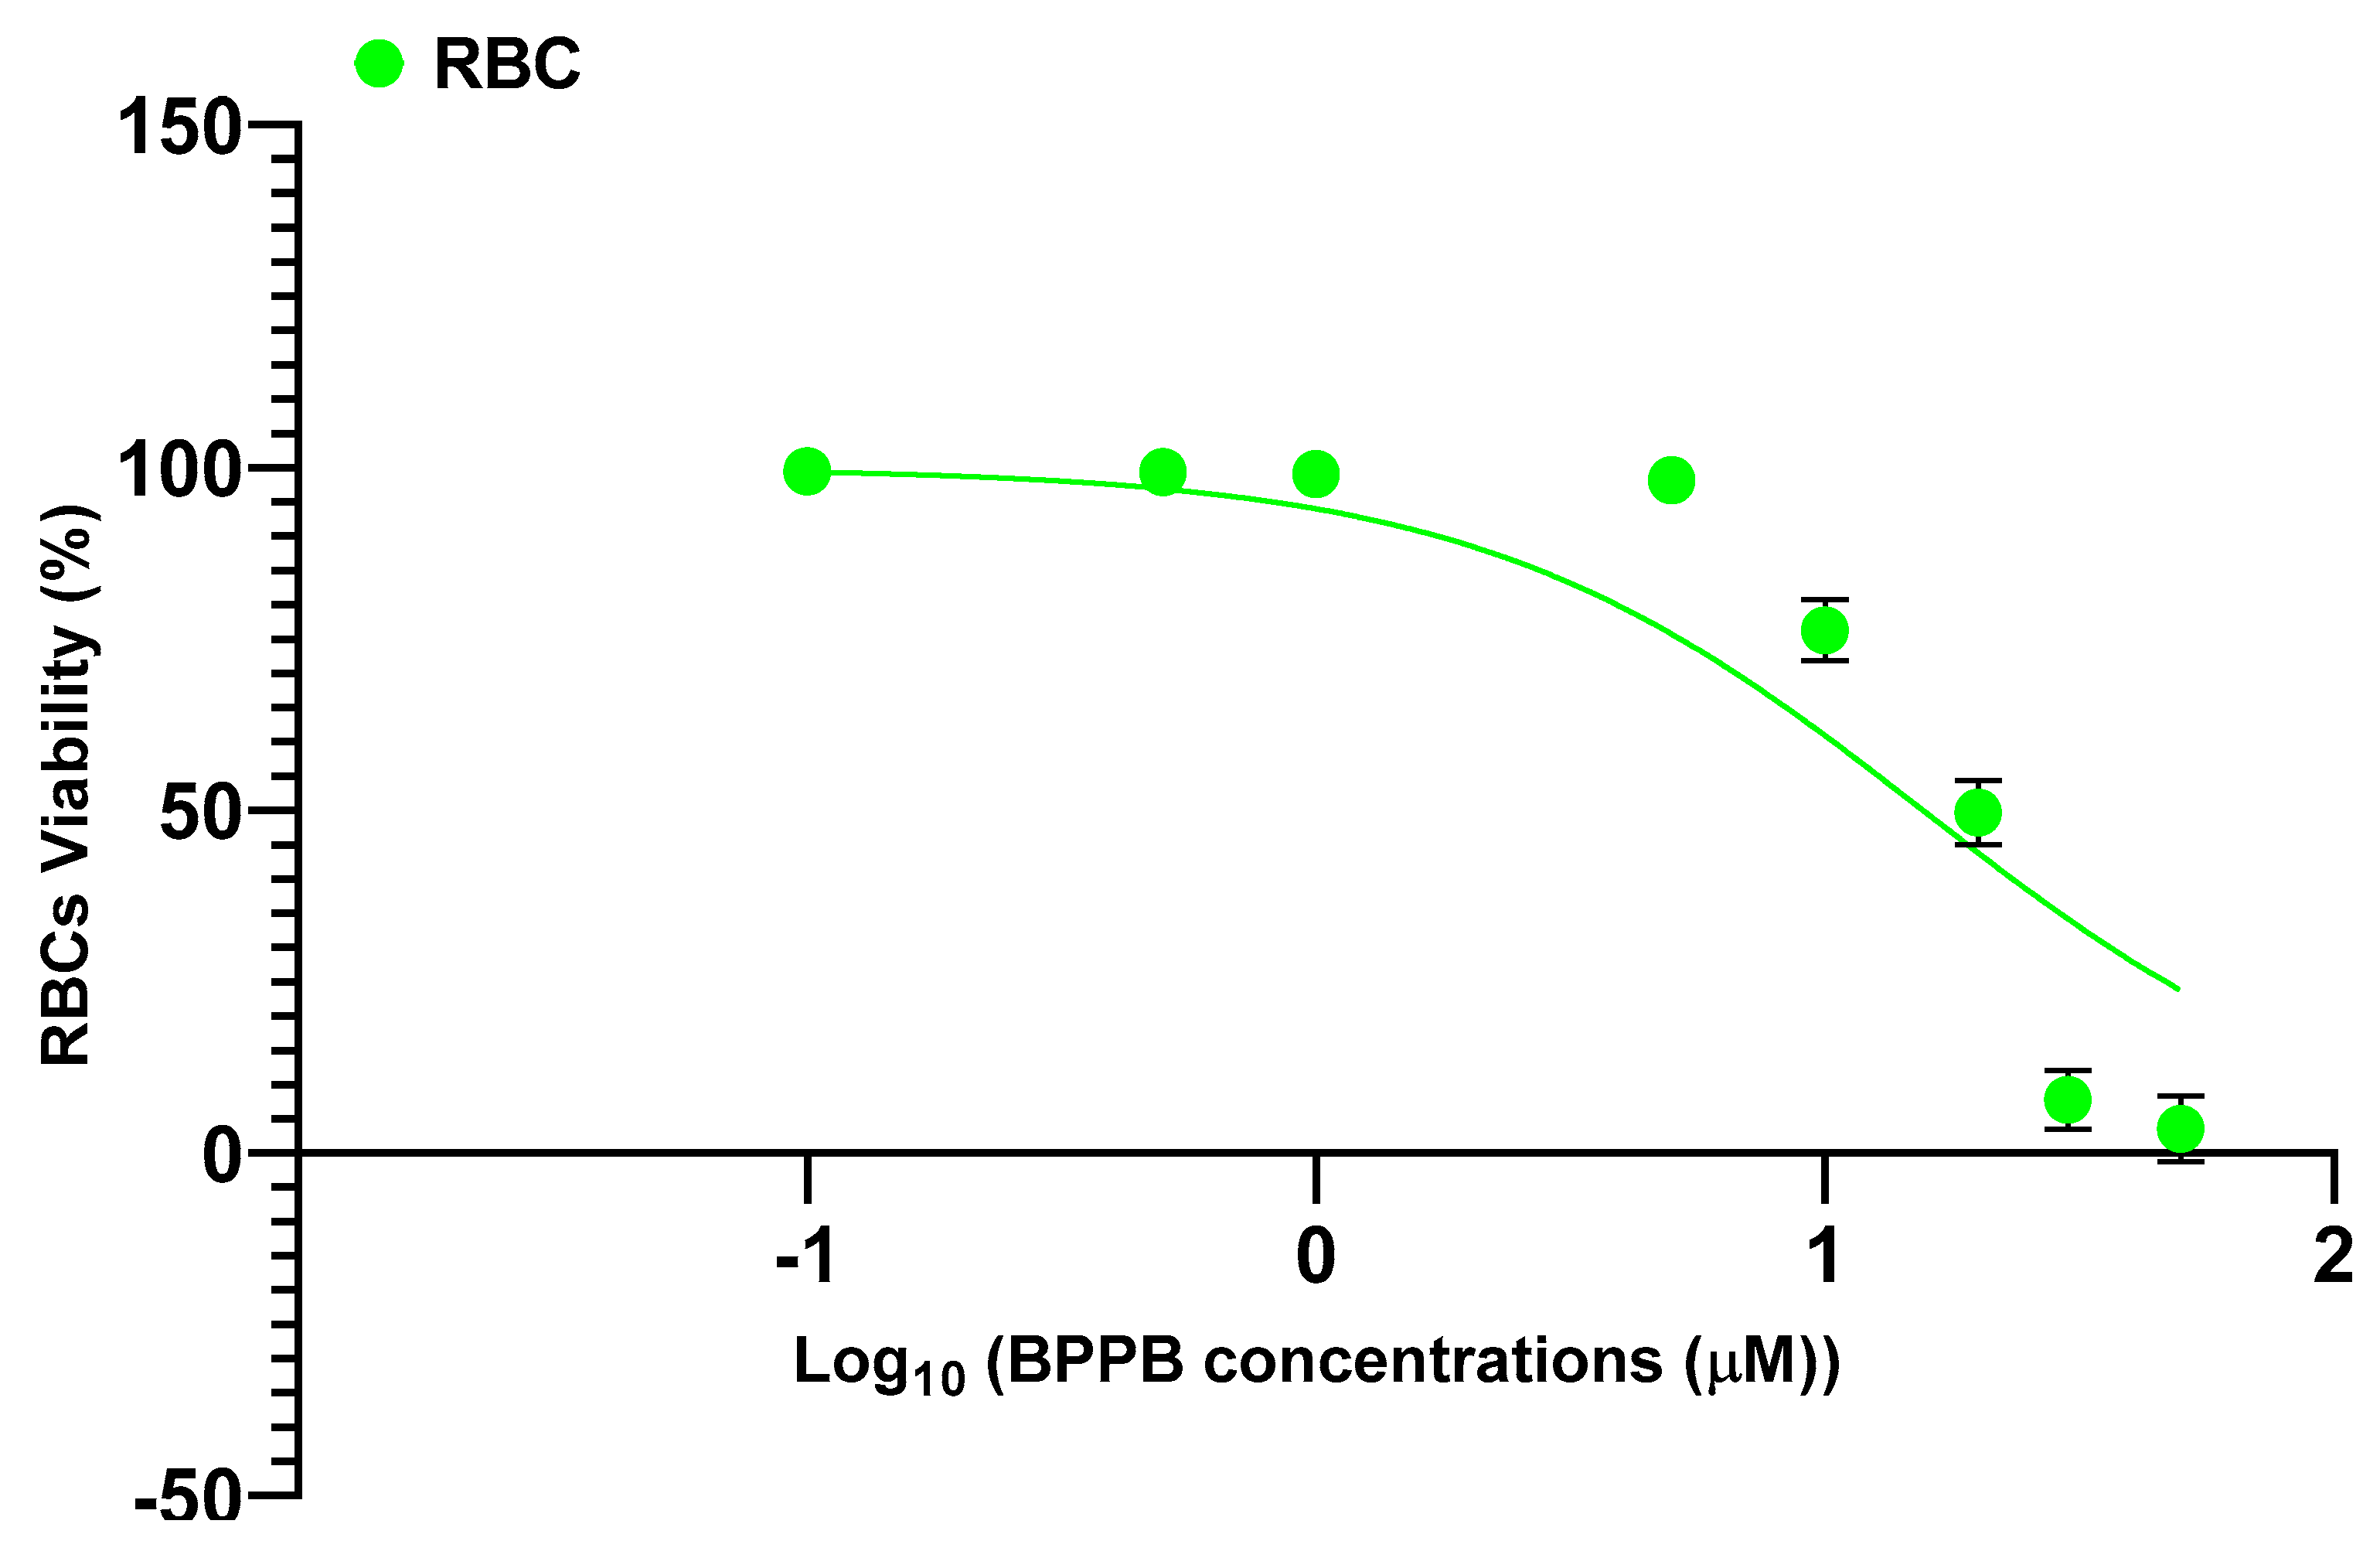
Figure A7.
Comparison between HaCaT, MeOV PLX-R and MeTRAV PLX-R viability (%) vs. BPPB concentration in the range 0.1-2.0 µM.
Figure A7.
Comparison between HaCaT, MeOV PLX-R and MeTRAV PLX-R viability (%) vs. BPPB concentration in the range 0.1-2.0 µM.
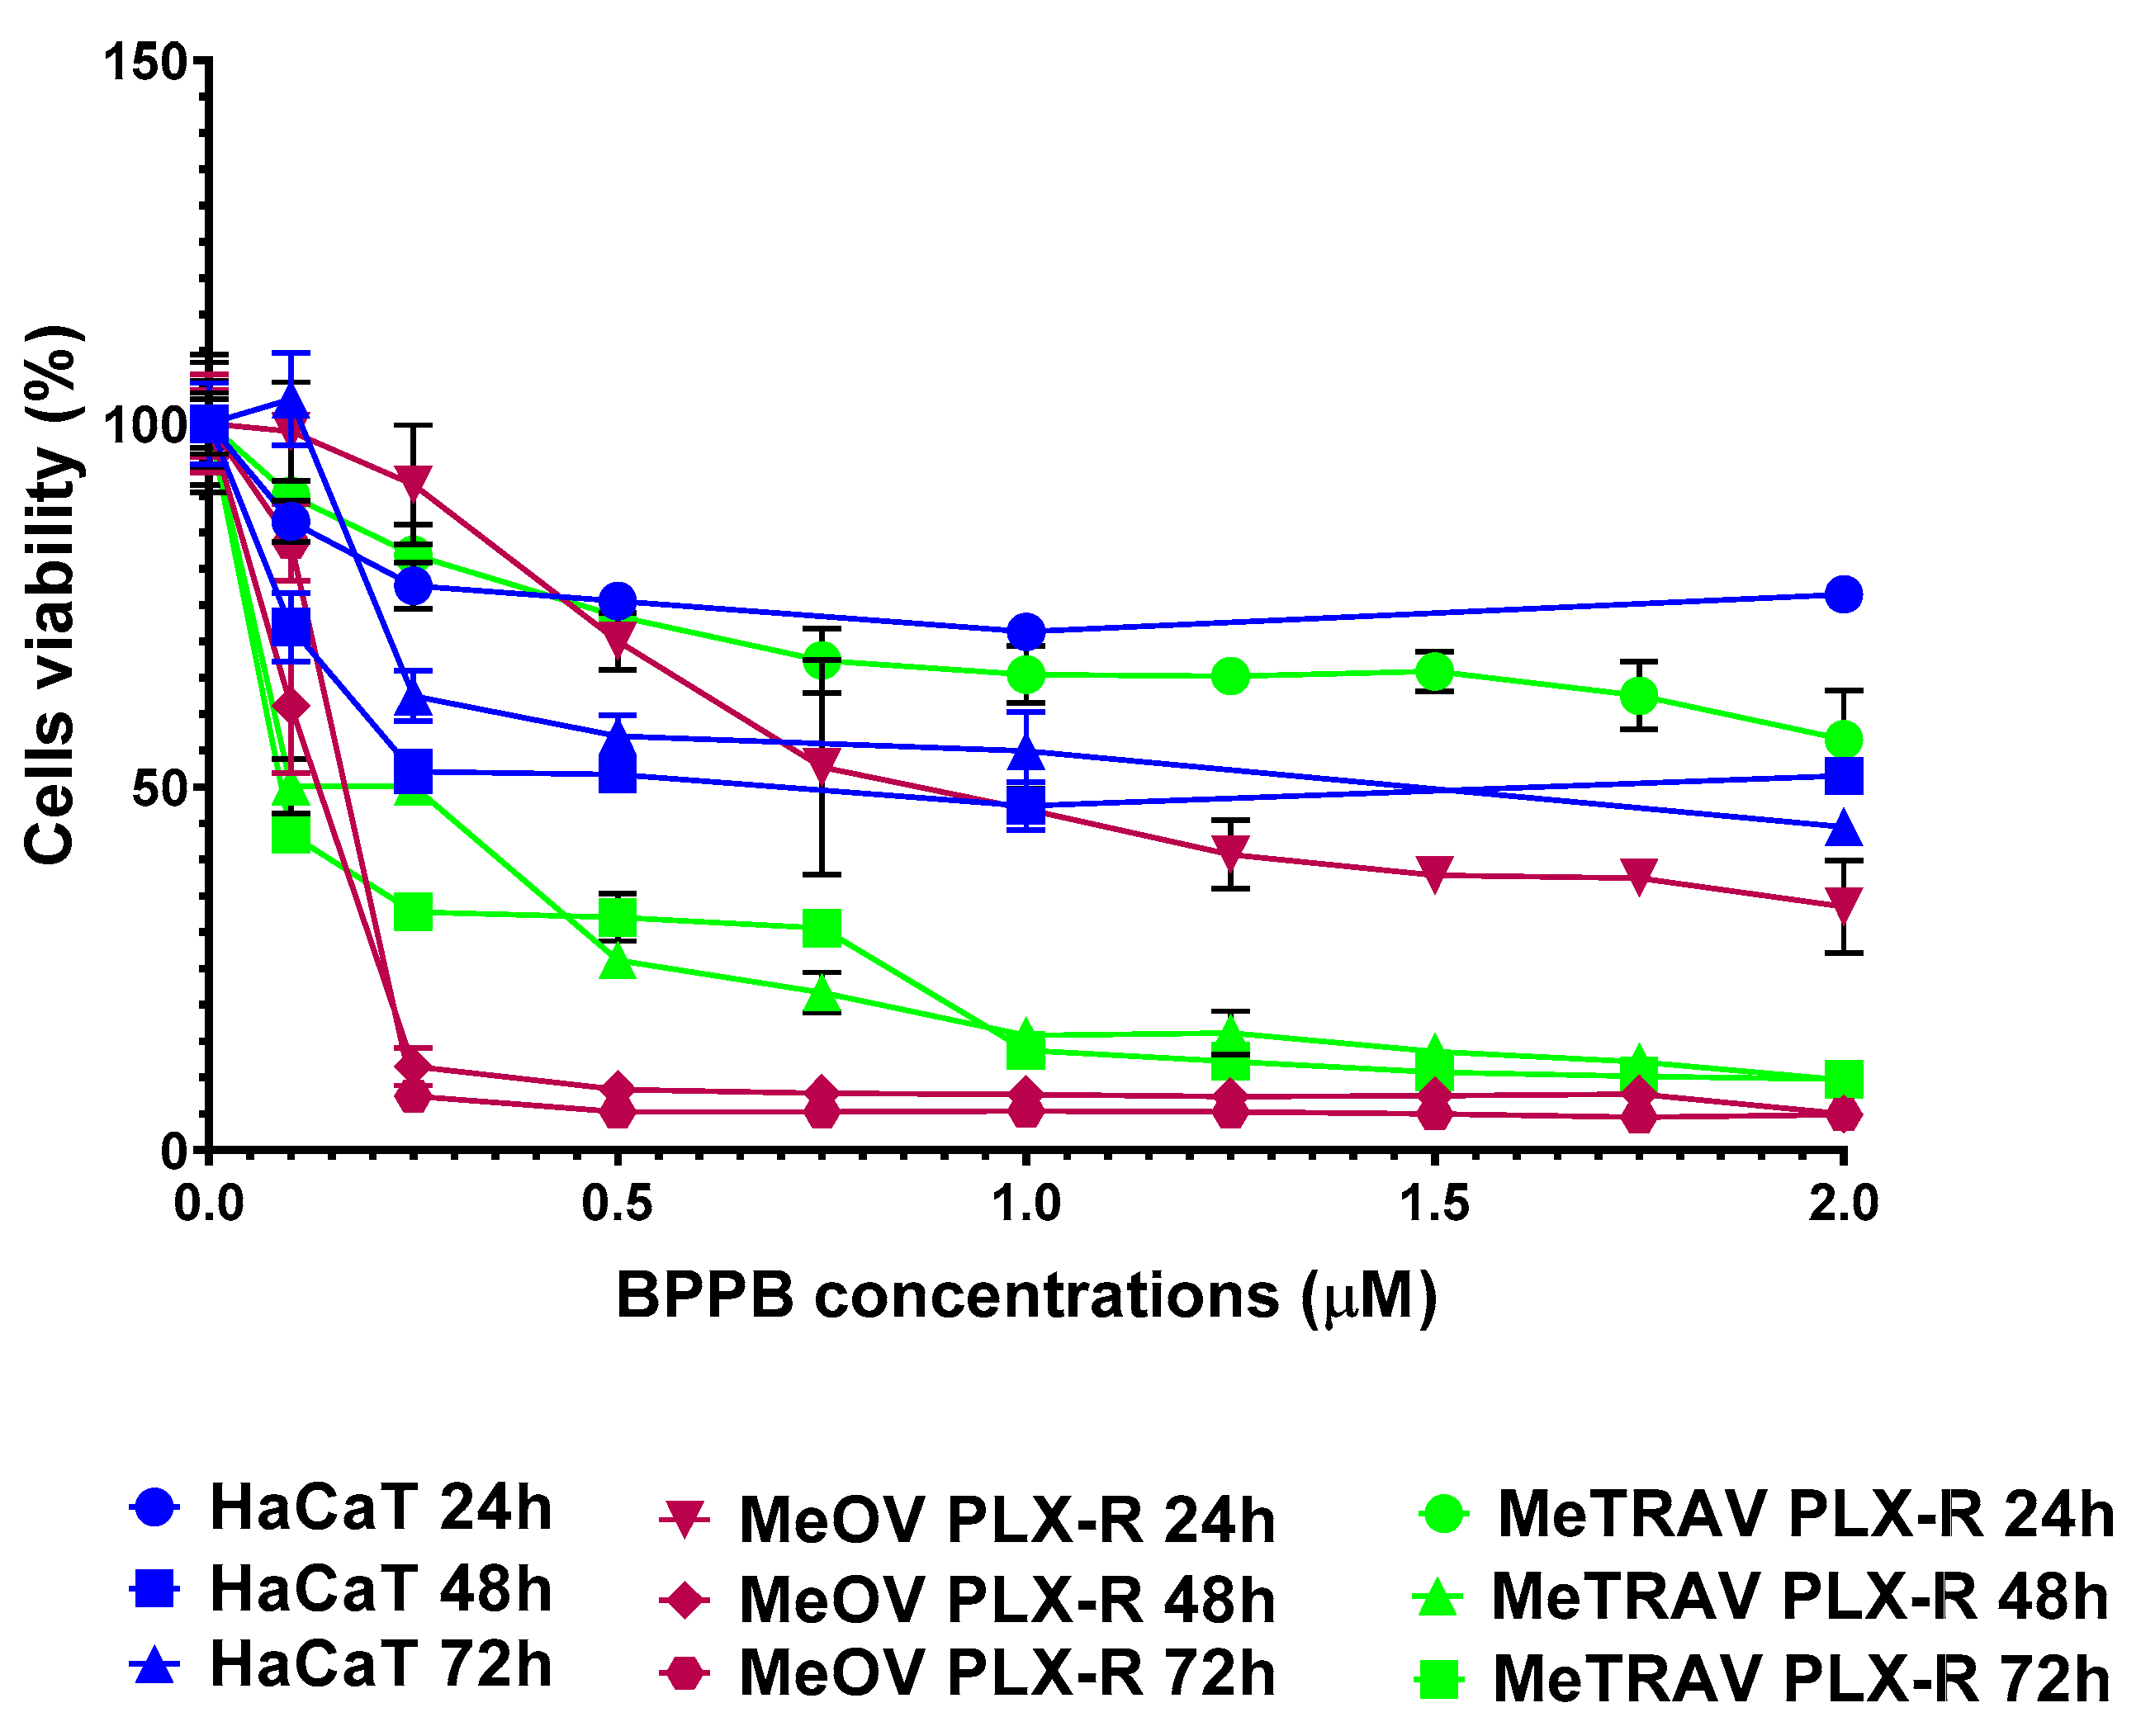
Figure A8.
Plot of Log concentration of BPPB vs. viability (%) of HaCaT cells (round blue, square pink and triangular green indicators with error bars for experiments at 24-, 48- and 72-hours exposure, respectively) and plot of nonlinear regressions of Log concentrations of BPPB vs. normalized response (traces of the same colors of indicators without indicators and error bars).
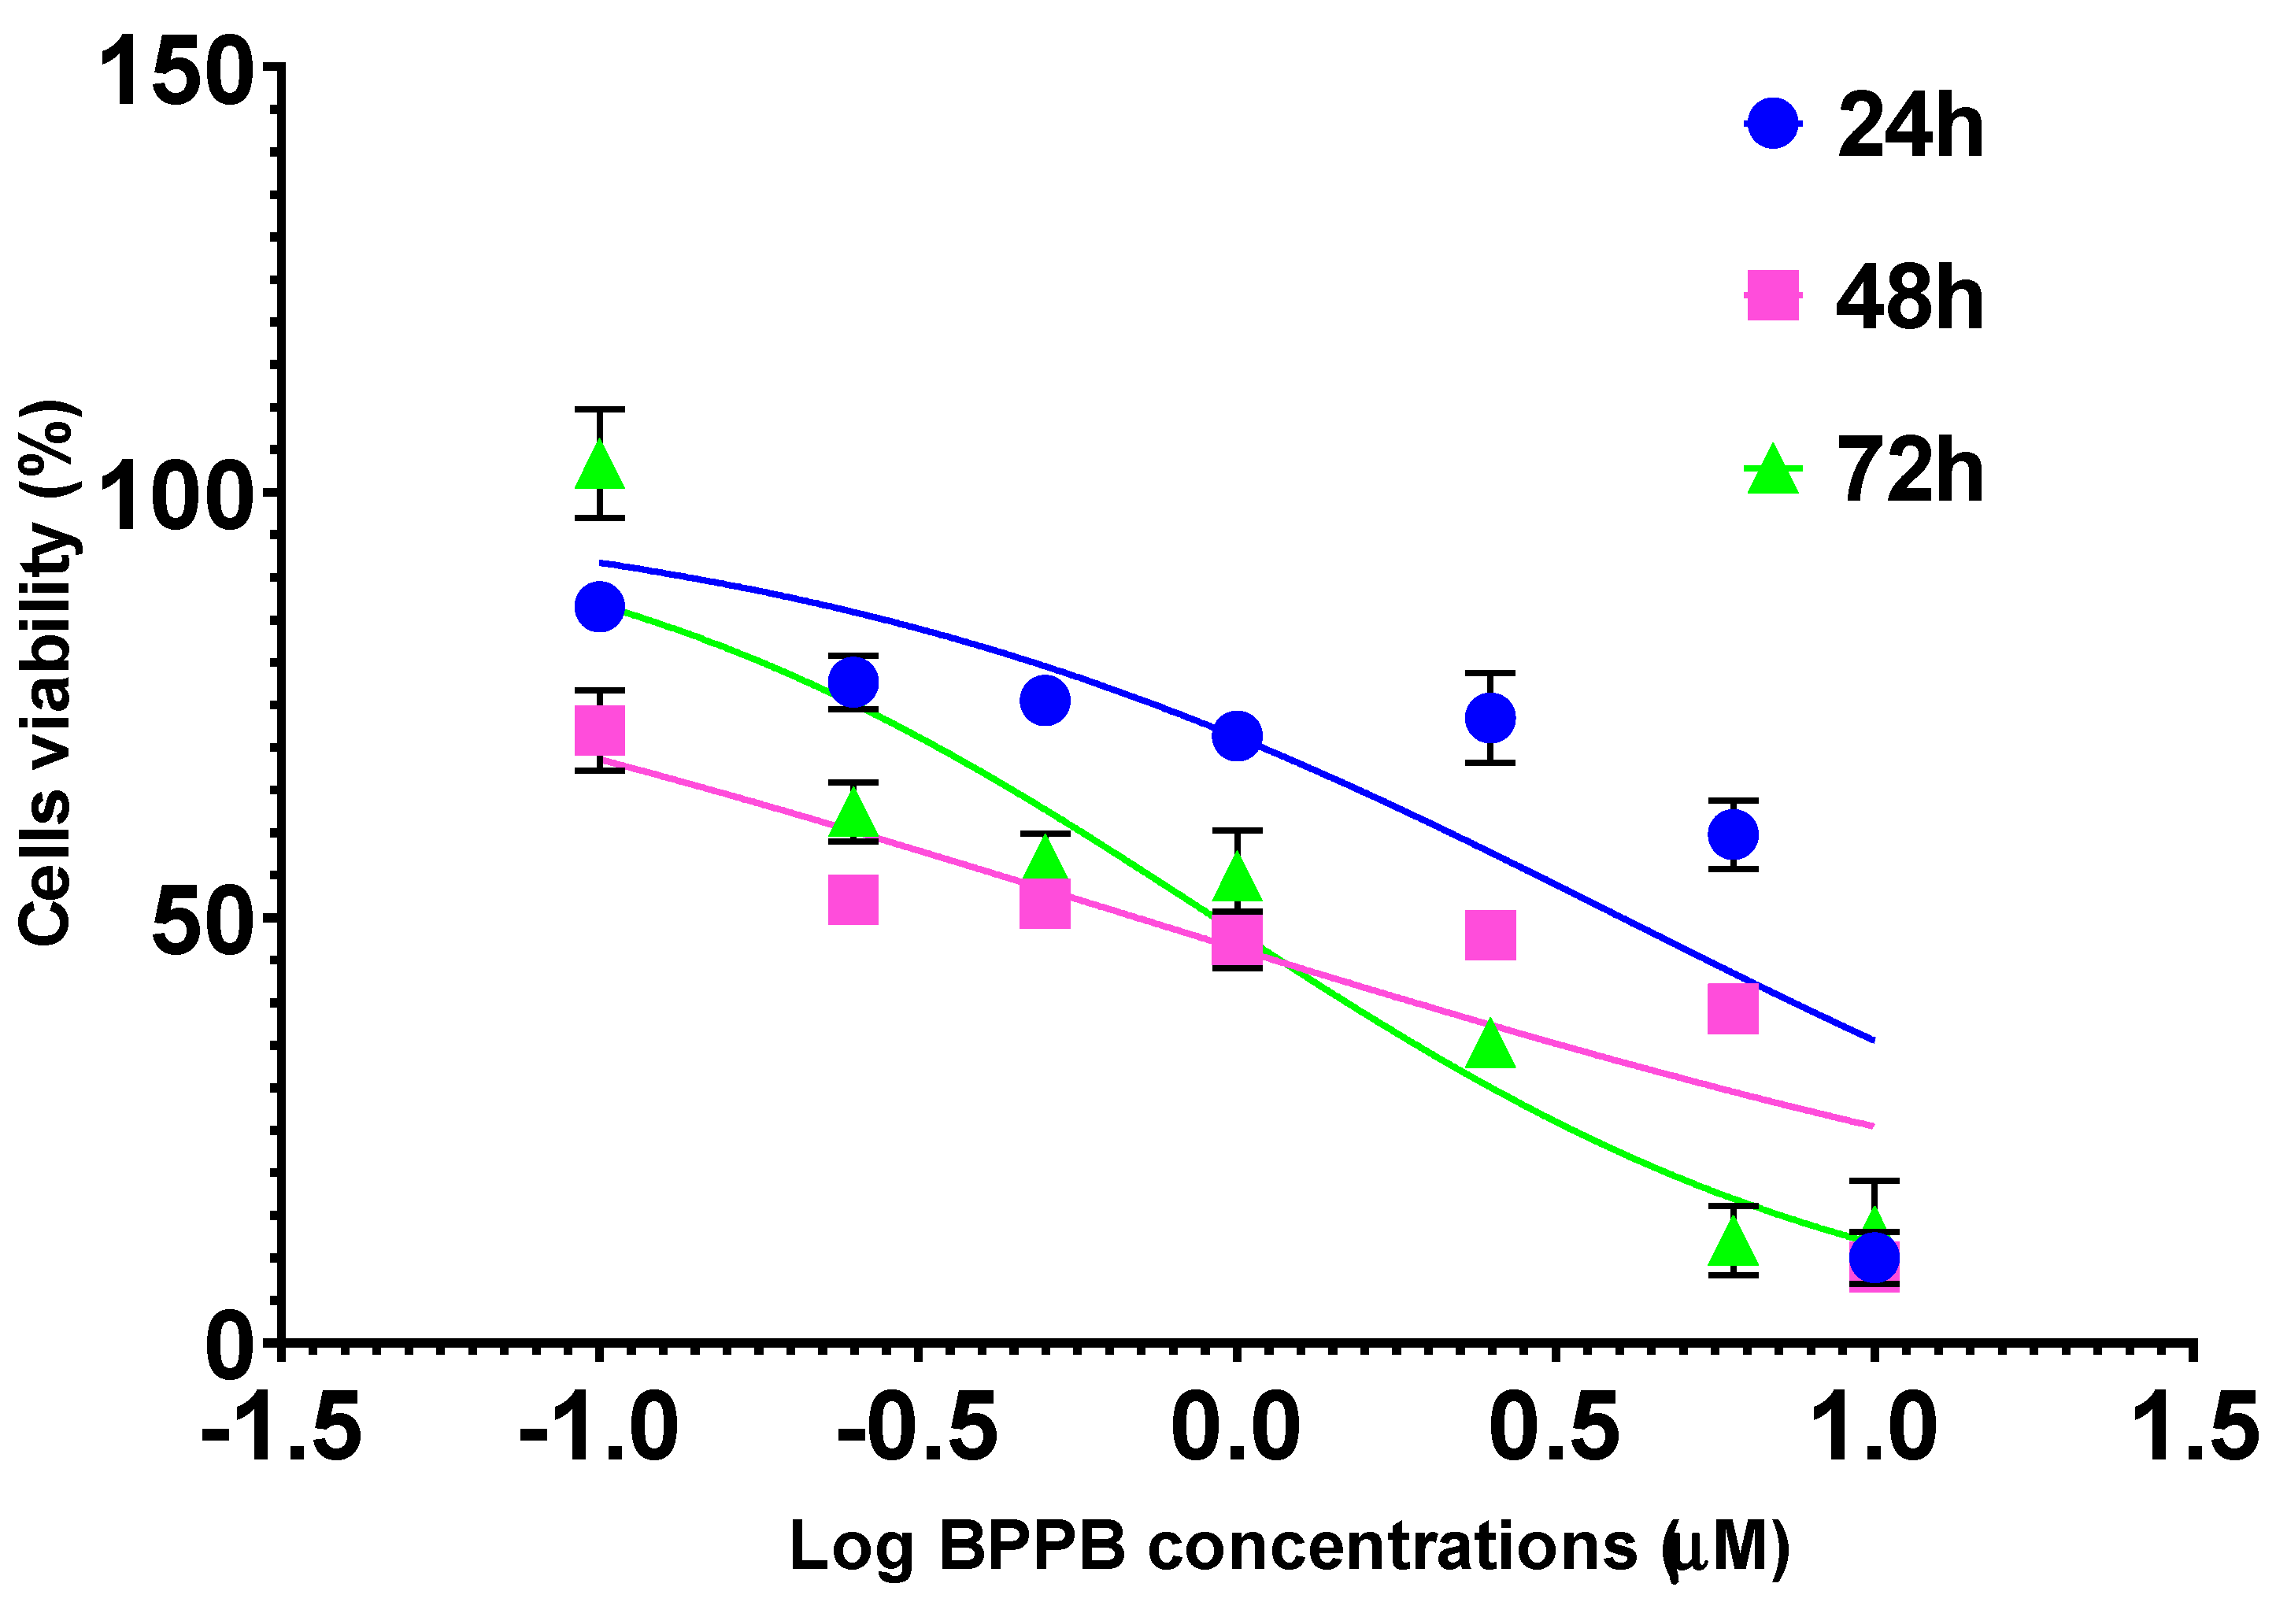
Figure A9.
Dispersion graphs of IC50 values of BPPB towards HaCaT cells (green triangular indicators) as functions of exposure timing with related second order polynomial regression model (punctuated green line), its equation and R2 value, as provided by Microsoft Excel 365 software.
Figure A9.
Dispersion graphs of IC50 values of BPPB towards HaCaT cells (green triangular indicators) as functions of exposure timing with related second order polynomial regression model (punctuated green line), its equation and R2 value, as provided by Microsoft Excel 365 software.
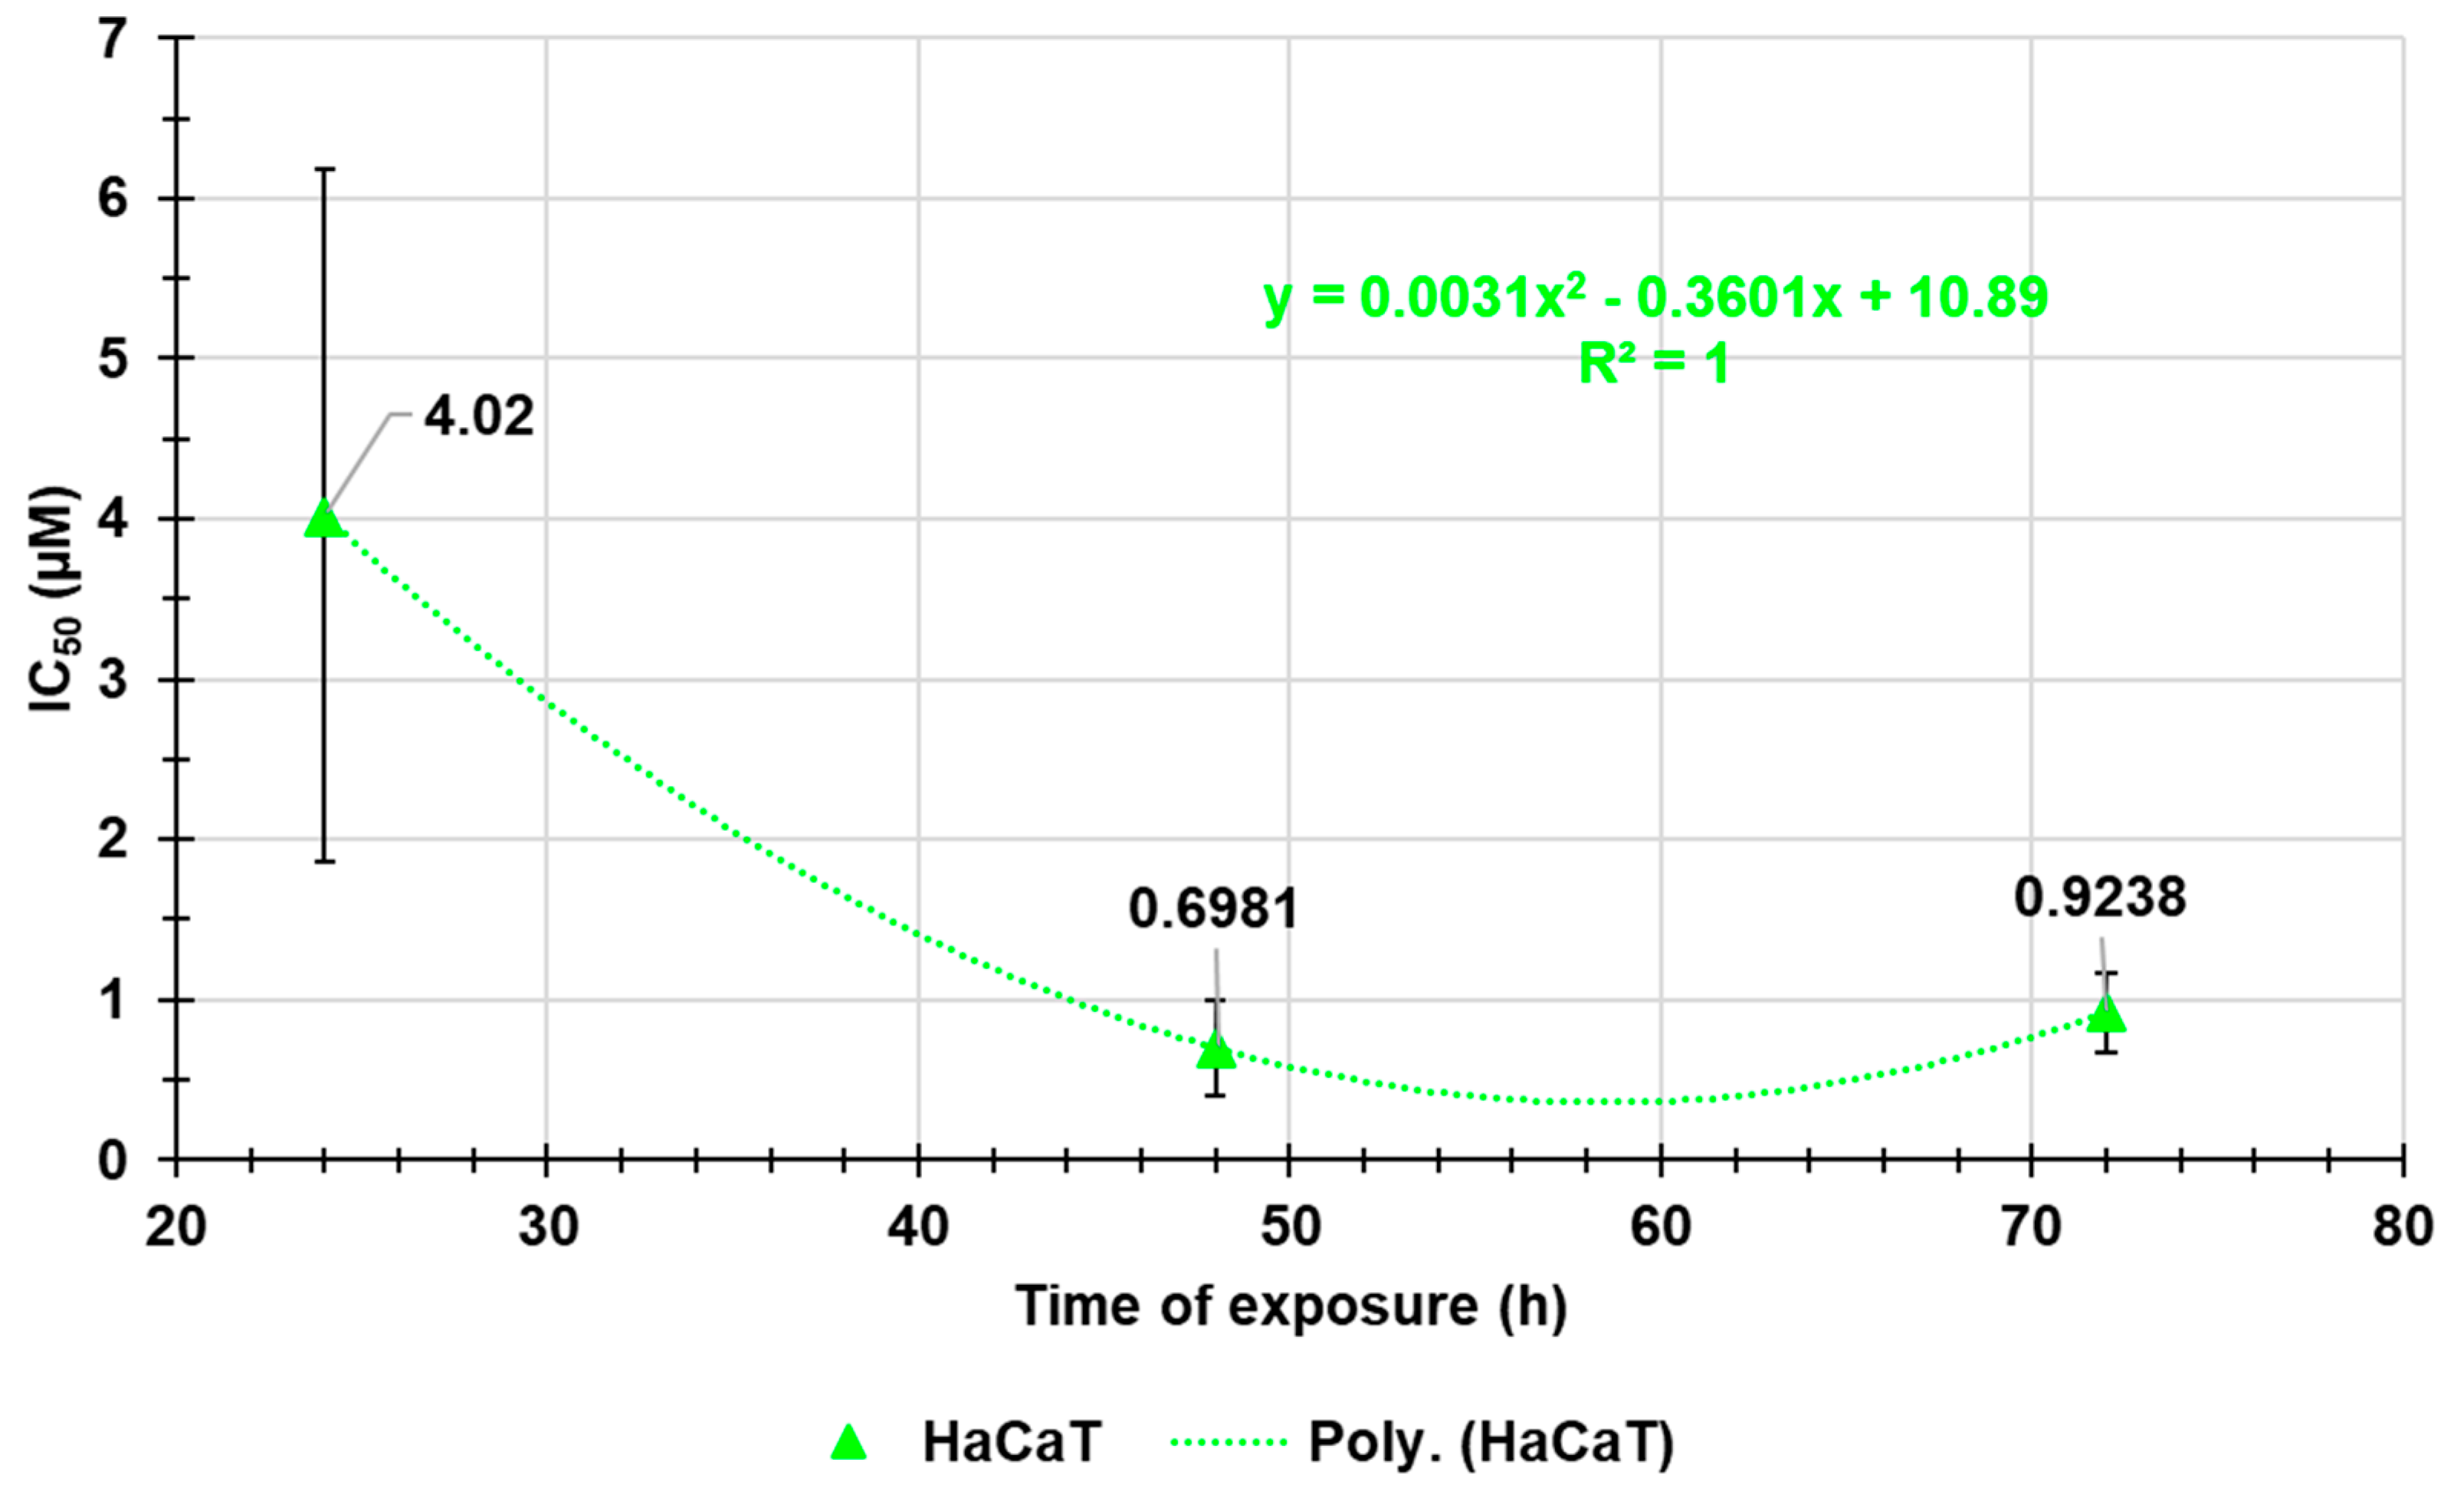
Figure A10.
Comparison between the plot of HaCaT viability (%) and those of DCFH positive cells/viable cells (%) vs. increasing BPPB concentrations in the range 0.1-10 µM.
Figure A10.
Comparison between the plot of HaCaT viability (%) and those of DCFH positive cells/viable cells (%) vs. increasing BPPB concentrations in the range 0.1-10 µM.
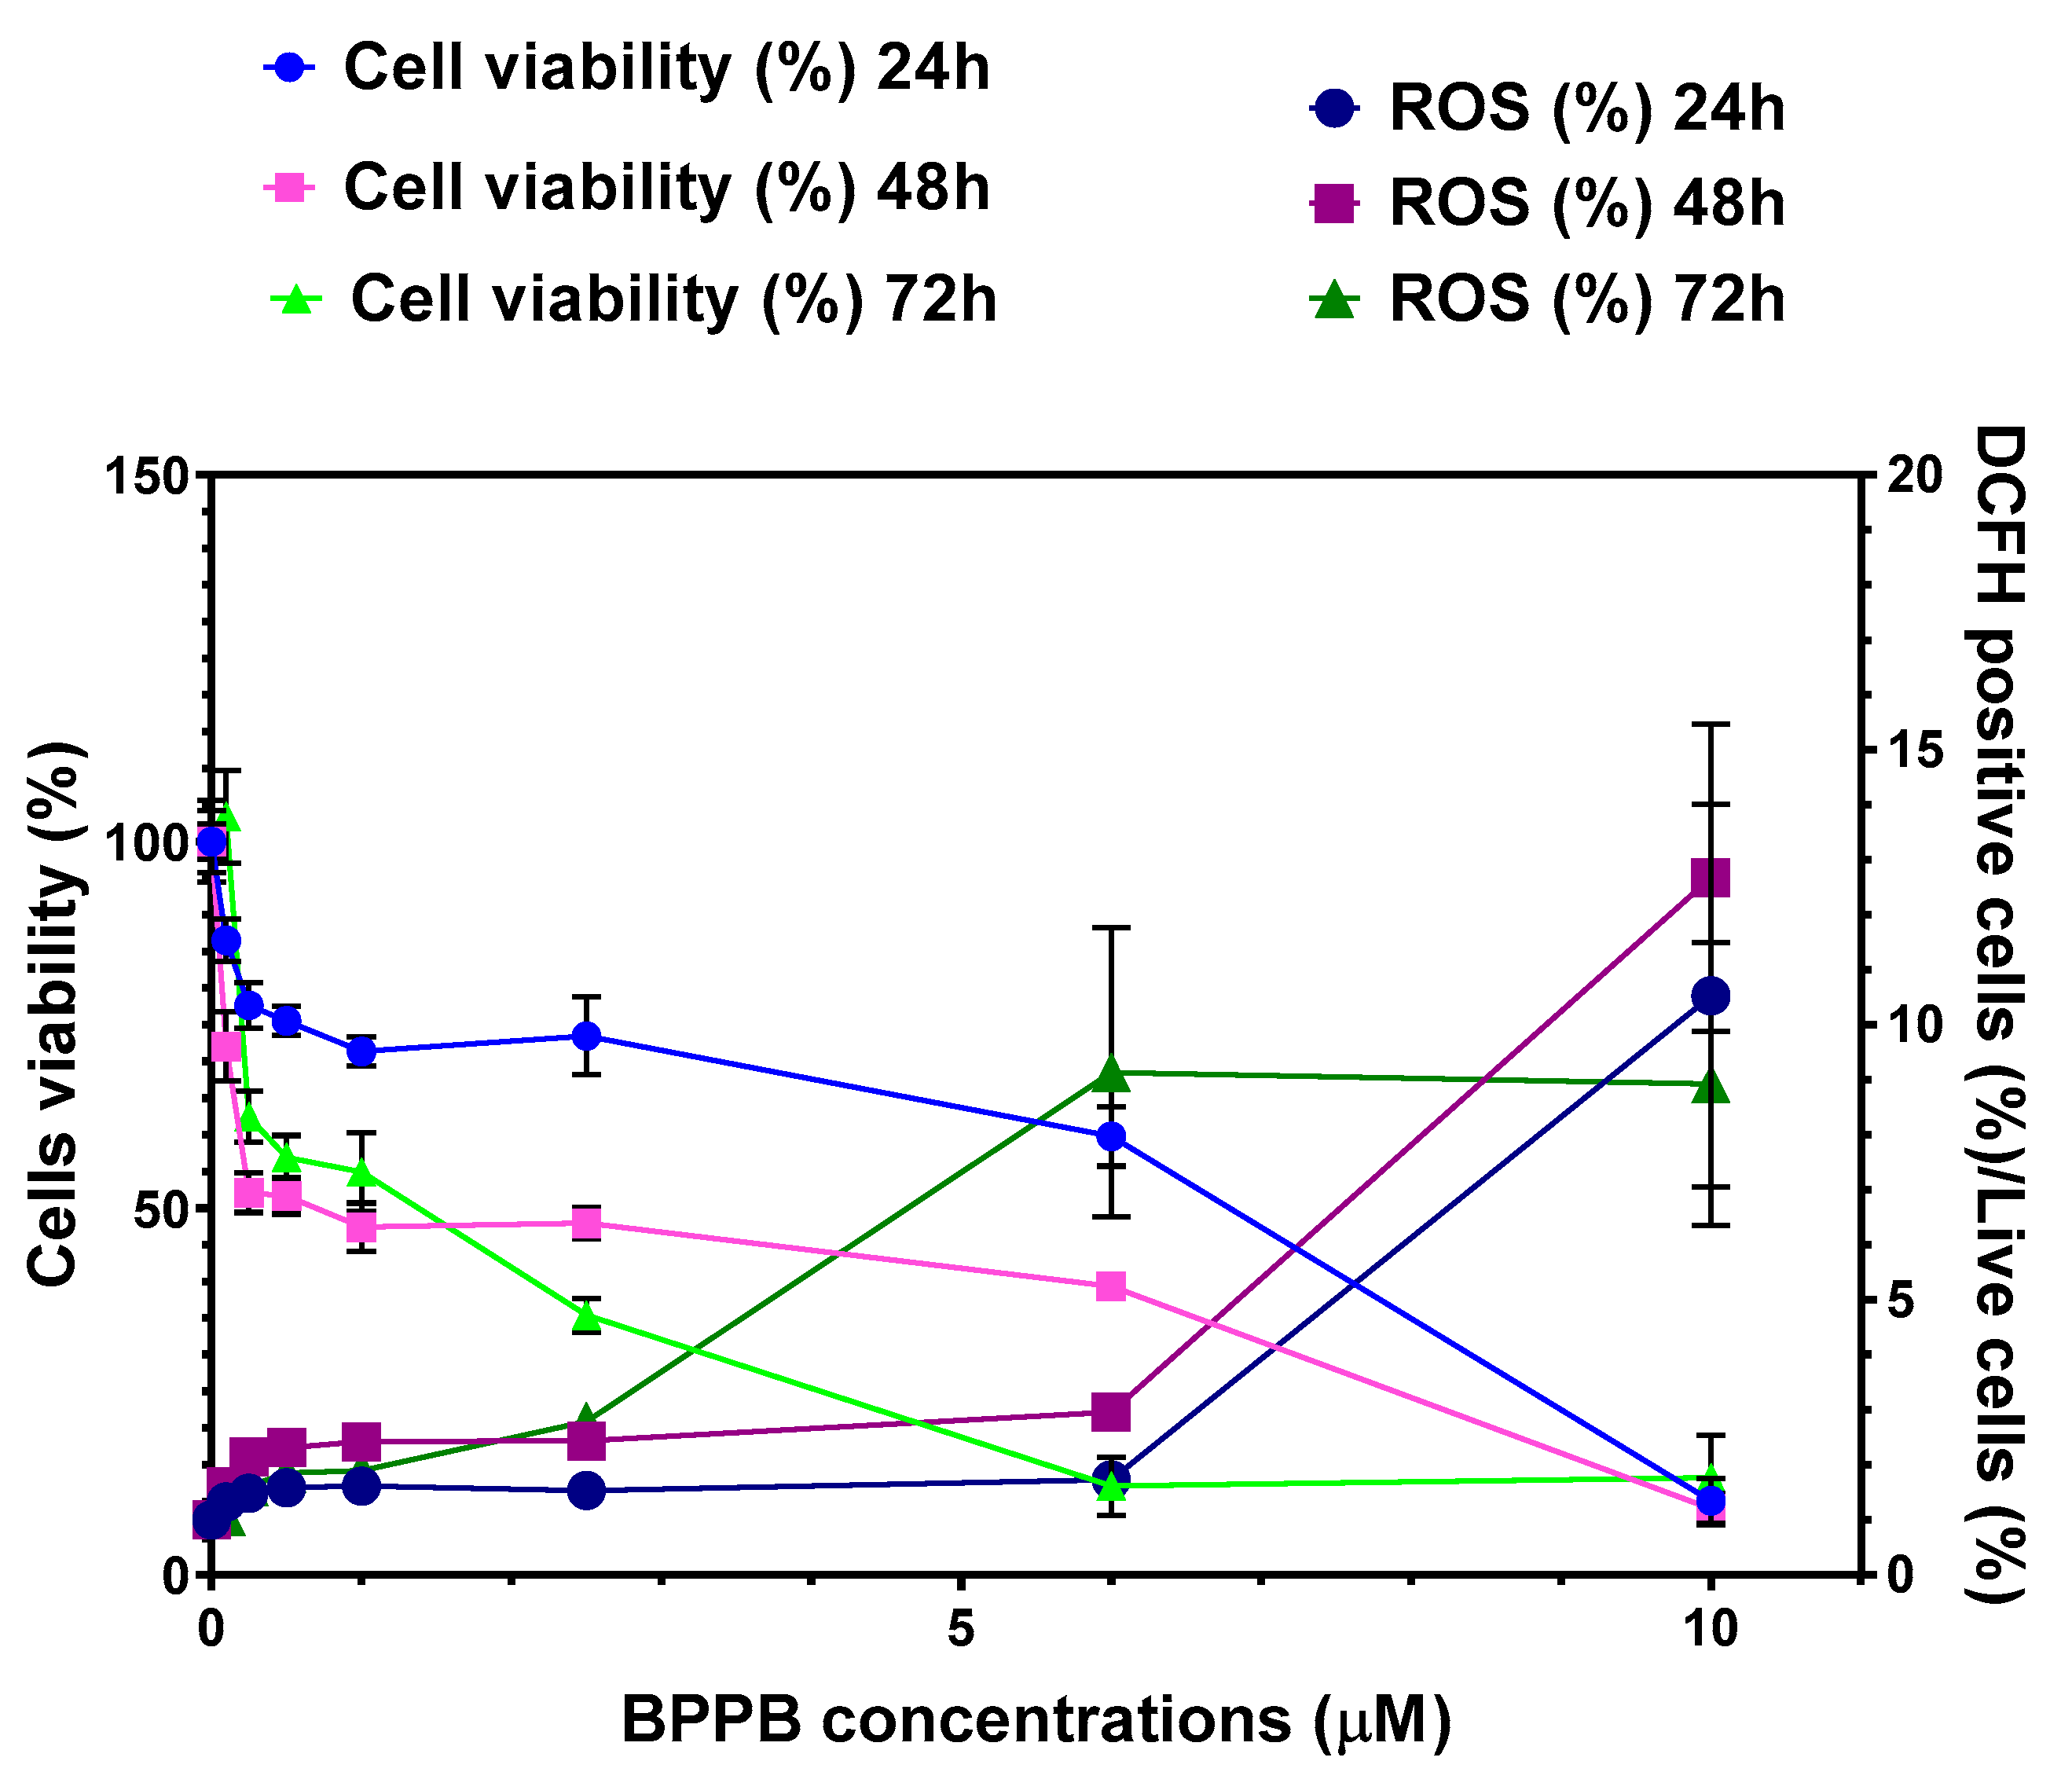
Figure A11.
SI values of BPPB for both MeOV and MeTRAV PLX-R cells in relation to its hemolytic toxicity (blue and pink lines) and to its toxicity to HaCaT cells (dark blue and purple lines) as function of time of exposure.
Figure A11.
SI values of BPPB for both MeOV and MeTRAV PLX-R cells in relation to its hemolytic toxicity (blue and pink lines) and to its toxicity to HaCaT cells (dark blue and purple lines) as function of time of exposure.
References
- Drugs in Clinical Development for Melanoma. Pharmaceut Med 2012, 26, 171–183. [CrossRef]
- Long, G. V.; Swetter, S.M.; Menzies, A.M.; Gershenwald, J.E.; Scolyer, R.A. Cutaneous Melanoma. The Lancet 2023, 402, 485–502. [Google Scholar] [CrossRef]
- Schadendorf, D.; Fisher, D.E.; Garbe, C.; Gershenwald, J.E.; Grob, J.-J.; Halpern, A.; Herlyn, M.; Marchetti, M.A.; McArthur, G.; Ribas, A.; et al. Melanoma. Nat Rev Dis Primers 2015, 1, 15003. [Google Scholar] [CrossRef] [PubMed]
- Parkin, D.M.; Bray, F.; Ferlay, J.; Pisani, P. Global Cancer Statistics, 2002. CA Cancer J Clin 2005, 55, 74–108. [Google Scholar] [CrossRef] [PubMed]
- Park, S.; Yun, S.-J. Acral Melanocytic Neoplasms: A Comprehensive Review of Acral Nevus and Acral Melanoma in Asian Perspective. Dermatopathology 2022, 9, 292–303. [Google Scholar] [CrossRef]
- J Ferlay; M Ervik; FC Lam, et al Global Cancer Observatory: Cancer Today International Agency for Research on Cancer. Available online: https://gco.iarc.fr/today/en (accessed on 21 January 2025).
- Bastian, B.C. The Molecular Pathology of Melanoma: An Integrated Taxonomy of Melanocytic Neoplasia. Annual Review of Pathology: Mechanisms of Disease 2014, 9, 239–271. [Google Scholar] [CrossRef]
- Keim, U.; Gandini, S.; Amaral, T.; Katalinic, A.; Holleczek, B.; Flatz, L.; Leiter, U.; Whiteman, D.; Garbe, C. Cutaneous Melanoma Attributable to UVR Exposure in Denmark and Germany. Eur J Cancer 2021, 159, 98–104. [Google Scholar] [CrossRef]
- Islami, F.; Goding Sauer, A.; Miller, K.D.; Siegel, R.L.; Fedewa, S.A.; Jacobs, E.J.; McCullough, M.L.; Patel, A.V.; Ma, J.; Soerjomataram, I.; et al. Proportion and Number of Cancer Cases and Deaths Attributable to Potentially Modifiable Risk Factors in the United States. CA Cancer J Clin 2018, 68, 31–54. [Google Scholar] [CrossRef]
- Nguyen, N.T.; Fisher, D.E. <scp>MITF</Scp> and <scp>UV</Scp> Responses in Skin: From Pigmentation to Addiction. Pigment Cell Melanoma Res 2019, 32, 224–236. [Google Scholar] [CrossRef]
- Elder, D.E.; Bastian, B.C.; Cree, I.A.; Massi, D.; Scolyer, R.A. The 2018 World Health Organization Classification of Cutaneous, Mucosal, and Uveal Melanoma: Detailed Analysis of 9 Distinct Subtypes Defined by Their Evolutionary Pathway. Arch Pathol Lab Med 2020, 144, 500–522. [Google Scholar] [CrossRef]
- Gandini, S.; Sera, F.; Cattaruzza, M.S.; Pasquini, P.; Abeni, D.; Boyle, P.; Melchi, C.F. Meta-Analysis of Risk Factors for Cutaneous Melanoma: I. Common and Atypical Naevi. Eur J Cancer 2005, 41, 28–44. [Google Scholar] [CrossRef]
- Bliss, J.M.; Ford, D.; Swerdlow, A.J.; Armstrong, B.K.; Cristofolini, M.; Elwood, J.M.; Green, A.; Holly, E.A.; Mack, T.; Mackie, R.M.; et al. Risk of Cutaneous Melanoma Associated with Pigmentation Characteristics and Freckling: Systematic Overview of 10 Case-control Studies. Int J Cancer 1995, 62, 367–376. [Google Scholar] [CrossRef] [PubMed]
- Kubica, A.W.; Brewer, J.D. Melanoma in Immunosuppressed Patients. Mayo Clin Proc 2012, 87, 991–1003. [Google Scholar] [CrossRef] [PubMed]
- Bradford, P.T.; Goldstein, A.M.; Tamura, D.; Khan, S.G.; Ueda, T.; Boyle, J.; Oh, K.-S.; Imoto, K.; Inui, H.; Moriwaki, S.-I.; et al. Cancer and Neurologic Degeneration in Xeroderma Pigmentosum: Long Term Follow-up Characterises the Role of DNA Repair. J Med Genet 2011, 48, 168–176. [Google Scholar] [CrossRef]
- Berk-Krauss, J.; Stein, J.A.; Weber, J.; Polsky, D.; Geller, A.C. New Systematic Therapies and Trends in Cutaneous Melanoma Deaths Among US Whites, 1986–2016. Am J Public Health 2020, 110, 731–733. [Google Scholar] [CrossRef]
- Erdei, E.; Torres, S.M. A New Understanding in the Epidemiology of Melanoma. Expert Rev Anticancer Ther 2010, 10, 1811–1823. [Google Scholar] [CrossRef] [PubMed]
- Leary, M.; Heerboth, S.; Lapinska, K.; Sarkar, S. Sensitization of Drug Resistant Cancer Cells: A Matter of Combination Therapy. Cancers (Basel) 2018, 10, 483. [Google Scholar] [CrossRef]
- Davies, H.; Bignell, G.R.; Cox, C.; Stephens, P.; Edkins, S.; Clegg, S.; Teague, J.; Woffendin, H.; Garnett, M.J.; Bottomley, W.; et al. Mutations of the BRAF Gene in Human Cancer. Nature 2002, 417, 949–954. [Google Scholar] [CrossRef]
- Holderfield, M.; Deuker, M.M.; McCormick, F.; McMahon, M. Targeting RAF Kinases for Cancer Therapy: BRAF-Mutated Melanoma and Beyond. Nat Rev Cancer 2014, 14, 455–467. [Google Scholar] [CrossRef]
- Haq, R.; Fisher, D.E.; Widlund, H.R. Molecular Pathways: BRAF Induces Bioenergetic Adaptation by Attenuating Oxidative Phosphorylation. Clinical Cancer Research 2014, 20, 2257–2263. [Google Scholar] [CrossRef]
- Bollag, G.; Hirth, P.; Tsai, J.; Zhang, J.; Ibrahim, P.N.; Cho, H.; Spevak, W.; Zhang, C.; Zhang, Y.; Habets, G.; et al. Clinical Efficacy of a RAF Inhibitor Needs Broad Target Blockade in BRAF-Mutant Melanoma. Nature 2010, 467, 596–599. [Google Scholar] [CrossRef] [PubMed]
- Hallmeyer, S.; Gonzalez, R.; Lawson, D.H.; Cranmer, L.D.; Linette, G.P.; Puzanov, I.; Taback, B.; Cowey, C.L.; Ribas, A.; Daniels, G.A.; et al. Vemurafenib Treatment for Patients with Locally Advanced, Unresectable Stage IIIC or Metastatic Melanoma and Activating Exon 15 BRAF Mutations Other than V600E. Melanoma Res 2017, 27, 585–590. [Google Scholar] [CrossRef] [PubMed]
- Joseph, R.; Swaika, A.; Crozier, J.A. Vemurafenib: An Evidence-Based Review of Its Clinical Utility in the Treatment of Metastatic Melanoma. Drug Des Devel Ther 2014, 775. [Google Scholar] [CrossRef]
- Tanda, E.T.; Vanni, I.; Boutros, A.; Andreotti, V.; Bruno, W.; Ghiorzo, P.; Spagnolo, F. Current State of Target Treatment in BRAF Mutated Melanoma. Front Mol Biosci 2020, 7. [Google Scholar] [CrossRef] [PubMed]
- Alfei, S.; Zuccari, G.; Bacchetti, F.; Torazza, C.; Milanese, M.; Siciliano, C.; Athanassopoulos, C.M.; Piatti, G.; Schito, A.M. Synthesized Bis-Triphenyl Phosphonium-Based Nano Vesicles Have Potent and Selective Antibacterial Effects on Several Clinically Relevant Superbugs. Nanomaterials 2024, 14, 1351. [Google Scholar] [CrossRef]
- Zielonka, J.; Joseph, J.; Sikora, A.; Hardy, M.; Ouari, O.; Vasquez-Vivar, J.; Cheng, G.; Lopez, M.; Kalyanaraman, B. Mitochondria-Targeted Triphenylphosphonium-Based Compounds: Syntheses, Mechanisms of Action, and Therapeutic and Diagnostic Applications. Chem Rev 2017, 117, 10043–10120. [Google Scholar] [CrossRef]
- Ceccacci, F.; Sennato, S.; Rossi, E.; Proroga, R.; Sarti, S.; Diociaiuti, M.; Casciardi, S.; Mussi, V.; Ciogli, A.; Bordi, F.; et al. Aggregation Behaviour of Triphenylphosphonium Bolaamphiphiles. J Colloid Interface Sci 2018, 531, 451–462. [Google Scholar] [CrossRef]
- Dhanya, D.; Giuseppe, P.; Rita, C.A.; Annaluisa, M.; Stefania, S.M.; Francesca, G.; Vitale, D.V.; Anna, R.; Claudio, A.; Pasquale, L.; et al. Phosphonium Salt Displays Cytotoxic Effects Against Human Cancer Cell Lines. Anticancer Agents Med Chem 2018, 17. [Google Scholar] [CrossRef]
- Alfei, S.; Zuccari, G.; Athanassopoulos, C.M.; Domenicotti, C.; Marengo, B. Strongly ROS-Correlated, Time-Dependent, and Selective Antiproliferative Effects of Synthesized Nano Vesicles on BRAF Mutant Melanoma Cells and Their Hyaluronic Acid-Based Hydrogel Formulation. Int J Mol Sci 2024, 25, 10071. [Google Scholar] [CrossRef]
- Alfei, S.; Giannoni, P.; Signorello, M.G.; Torazza, C.; Zuccari, G.; Athanassopoulos, C.M.; Domenicotti, C.; Marengo, B. The Remarkable and Selective In Vitro Cytotoxicity of Synthesized Bola-Amphiphilic Nanovesicles on Etoposide-Sensitive and -Resistant Neuroblastoma Cells. Nanomaterials 2024, 14, 1505. [Google Scholar] [CrossRef]
- Severina, I.I.; Vyssokikh, M.Yu.; Pustovidko, A.V.; Simonyan, R.A.; Rokitskaya, T.I.; Skulachev, V.P. Effects of Lipophilic Dications on Planar Bilayer Phospholipid Membrane and Mitochondria. Biochimica et Biophysica Acta (BBA) - Bioenergetics 2007, 1767, 1164–1168. [Google Scholar] [CrossRef] [PubMed]
- Brusnakov, M.; Golovchenko, O.; Velihina, Y.; Liavynets, O.; Zhirnov, V.; Brovarets, V. Evaluation of Anticancer Activity of 1,3-Oxazol-4-ylphosphonium Salts in Vitro. ChemMedChem 2022, 17. [Google Scholar] [CrossRef] [PubMed]
- Garbarino, O.; Valenti, G.E.; Monteleone, L.; Pietra, G.; Mingari, M.C.; Benzi, A.; Bruzzone, S.; Ravera, S.; Leardi, R.; Farinini, E.; et al. PLX4032 Resistance of Patient-Derived Melanoma Cells: Crucial Role of Oxidative Metabolism. Front Oncol 2023, 13. [Google Scholar] [CrossRef] [PubMed]
- Nuraje, N.; Bai, H.; Su, K. Bolaamphiphilic Molecules: Assembly and Applications. Prog Polym Sci 2013, 38, 302–343. [Google Scholar] [CrossRef]
- Li, K.; Xiao, G.; Richardson, J.J.; Tardy, B.L.; Ejima, H.; Huang, W.; Guo, J.; Liao, X.; Shi, B. Targeted Therapy against Metastatic Melanoma Based on Self-Assembled Metal-Phenolic Nanocomplexes Comprised of Green Tea Catechin. Advanced Science 2019, 6. [Google Scholar] [CrossRef]
- Heinisch, O.; Steel, R.G.D. , and J. H. Torrie: Principles and Procedures of Statistics. (With Special Reference to the Biological Sciences.) McGraw-Hill Book Company, New York, Toronto, London 1960, 481 S., 15 Abb.; 81 s 6 d. Biom Z 1962, 4, 207–208. [Google Scholar] [CrossRef]
- Zach Bobbitt Statology. What Is a Good R-Squared Value? Available online: https://www.statology.org/good-r-squared-value/#:~:text=For%20example%2C%20in%20scientific%20studies%2C%20the%20R-squared%20may,if%20there%20is%20extreme%20variability%20in%20the%20dataset. (accessed on 22 January 2025).
- Valutazione Della Bontà Di Adattamento per Modelli Non Lineari: Metodi, Parametri e Considerazioni Pratiche Available online:. Available online: https://www.geeksforgeeks.org/evaluating-goodness-of-fit-for-nonlinear-models-methods-metrics-and-practical-considerations/ (accessed on 22 January 2025).
- Kim, H.; Xue, X. Detection of Total Reactive Oxygen Species in Adherent Cells by 2’,7’-Dichlorodihydrofluorescein Diacetate Staining. Journal of Visualized Experiments 2020. [Google Scholar] [CrossRef]
- Chandrasekhar, B.; Gor, R.; Ramalingam, S.; Thiagarajan, A.; Sohn, H.; Madhavan, T. Repurposing FDA-Approved Compounds to Target JAK2 for Colon Cancer Treatment. Discover Oncology 2024, 15, 226. [Google Scholar] [CrossRef]
- Boukamp, P.; Petrussevska, R.T.; Breitkreutz, D.; Hornung, J.; Markham, A.; Fusenig, N.E. Normal Keratinization in a Spontaneously Immortalized Aneuploid Human Keratinocyte Cell Line. J Cell Biol 1988, 106, 761–771. [Google Scholar] [CrossRef]
- Ölschläger, V.; Schrader, A.; Hockertz, S. Comparison of Primary Human Fibroblasts and Keratinocytes with Immortalized Cell Lines Regarding Their Sensitivity to Sodium Dodecyl Sulfate in a Neutral Red Uptake Cytotoxicity Assay. Arzneimittelforschung 2011, 59, 146–152. [Google Scholar] [CrossRef]
- Schoop, V.M.; Fusenig, N.E.; Mirancea, N. Epidermal Organization and Differentiation of HaCaT Keratinocytes in Organotypic Coculture with Human Dermal Fibroblasts. Journal of Investigative Dermatology 1999, 112, 343–353. [Google Scholar] [CrossRef]
- Mukherjee, S.P.; Davoren, M.; Byrne, H.J. In Vitro Mammalian Cytotoxicological Study of PAMAM Dendrimers – Towards Quantitative Structure Activity Relationships. Toxicology in Vitro 2010, 24, 169–177. [Google Scholar] [CrossRef]
- Nakagawa, Y.; Akao, Y.; Morikawa, H.; Hirata, I.; Katsu, K.; Naoe, T.; Ohishi, N.; Yagi, K. Arsenic Trioxide-Induced Apoptosis through Oxidative Stress in Cells of Colon Cancer Cell Lines. Life Sci 2002, 70, 2253–2269. [Google Scholar] [CrossRef] [PubMed]
- SNOW, E.; SYKORA, P.; DURHAM, T.; KLEIN, C. ; Arsenic, Mode of Action at Biologically Plausible Low Doses: What Are the Implications for Low Dose Cancer Risk? Toxicol Appl Pharmacol 2005, 207, 557–564. [Google Scholar] [CrossRef] [PubMed]
- Krzywik, J.; Mozga, W.; Aminpour, M.; Janczak, J.; Maj, E.; Wietrzyk, J.; Tuszyński, J.A.; Huczyński, A. ; Synthesis, Antiproliferative Activity and Molecular Docking Studies of Novel Doubly Modified Colchicine Amides and Sulfonamides as Anticancer Agents. Molecules 2020, 25, 1789. [Google Scholar] [CrossRef]
- Chen, Z.; Duan, H.; Tong, X.; Hsu, P.; Han, L.; Morris-Natschke, S.L.; Yang, S.; Liu, W.; Lee, K.-H. ; Cytotoxicity, Hemolytic Toxicity, and Mechanism of Action of Pulsatilla Saponin D and Its Synthetic Derivatives. J Nat Prod 2018, 81, 465–474. [Google Scholar] [CrossRef]
- Wróblewska-Łuczka, P.; Kulenty, L.; Załuska-Ogryzek, K.; Góralczyk, A.; Łuszczki, J.J. Screening of the Antimelanoma Activity of Monoterpenes—In Vitro Experiments on Four Human Melanoma Lines. Curr Issues Mol Biol 2025, 47, 97. [Google Scholar] [CrossRef] [PubMed]
- Furfaro, A.L.; Loi, G.; Ivaldo, C.; Passalacqua, M.; Pietra, G.; Mann, G.E.; Nitti, M. HO-1 Limits the Efficacy of Vemurafenib/PLX4032 in BRAFV600E Mutated Melanoma Cells Adapted to Physiological Normoxia or Hypoxia. Antioxidants 2022, 11, 1171. [Google Scholar] [CrossRef]
- Alfei, S.; Marengo, B.; Domenicotti, C. Polyester-Based Dendrimer Nanoparticles Combined with Etoposide Have an Improved Cytotoxic and Pro-Oxidant Effect on Human Neuroblastoma Cells. Antioxidants 2020, 9, 50. [Google Scholar] [CrossRef]
- Alfei, S.; Marengo, B.; Zuccari, G.; Turrini, F.; Domenicotti, C. Dendrimer Nanodevices and Gallic Acid as Novel Strategies to Fight Chemoresistance in Neuroblastoma Cells. Nanomaterials 2020, 10, 1243. [Google Scholar] [CrossRef]
- Colla, R.; Izzotti, A.; De Ciucis, C.; Fenoglio, D.; Ravera, S.; Speciale, A.; Ricciarelli, R.; Furfaro, A.L.; Pulliero, A.; Passalacqua, M.; et al. Glutathione-Mediated Antioxidant Response and Aerobic Metabolism: Two Crucial Factors Involved in Determining the Multi-Drug Resistance of High-Risk Neuroblastoma. Oncotarget 2016, 7, 70715–70737. [Google Scholar] [CrossRef] [PubMed]
Scheme 1.
Synthetic path to achieve BPPB.
Figure 1.
Cell viability was evaluated in MeOV (a) and MeTRAV (b) PLX-R CMM cells exposed to increasing concentrations of BPPB (0.1–2.0 µM) for 24, 48 and 72 h. Bar graphs summarize quantitative data of the means ± S.D. of four independent experiments run in triplicate. Significance refers exclusively to control (*). Specifically, p > 0.05 no symbols; **** p < 0.0001; *** p < 0.001 (0.0002); p < 0.01 ** (one-way ANOVA followed by Dunnet’s multi-comparisons test).
Figure 2.
(a) Cell viability (%) of MeOV PLX-R cells vs increasing BPPB concentrations (0.1-2.0 µM) after 24 hours (blue line), 48 hours (pink line) and 72 hours (green line) of exposure. Concentration = 0.0 µM corresponded to the control. (b) Plot of Log concentration of BPPB vs. cell viability (%) of MeOV PLX-R after 24, 48, and 72 hours of exposure (blue, pink and green traces with indicators and error bars) and plot of nonlinear regressions of Log concentrations of BPPB vs. normalized response after 24, 48, and 72 hours of exposure (blue, pink and green traces without indicators).
Figure 3.
(a) Cell viability (%) of MeTRAV PLX-R cells vs increasing BPPB concentrations (0.1-2.0 µM) after 24 hours (blue line), 48 hours (pink line) and 72 hours (green line) of exposure. Concentration = 0.0 µM corresponded to the control. (b) Plot of Log concentration of BPPB vs. cell viability (%) of MeTRAV PLX-R after 24, 48, and 72 hours of exposure (blue, pink and green traces with indicators and error bars) and plot of nonlinear regressions of Log concentrations of BPPB vs. normalized response after 24, 48, and 72 hours of exposure (blue, pink and green traces without indicators).
Figure 4.
H2O2 production was analyzed in MeOV (a) and MeTRAV (b) PLX-R cells exposed to increasing concentrations of BPPB (0.1-2 µM) at 24 h (blue bars), 48 h (green bars), and 72 h (pink to purple bars). The ratio for the control (Ctr) was fixed to 1. Bar graphs summarize quantitative data of the means ± SD of three independent experiments. Significance refers to control (*). Specifically, Specifically, p > 0.05 no symbols; p < 0.01 **; p < 0.001 ***, and p < 0.0001 ****.
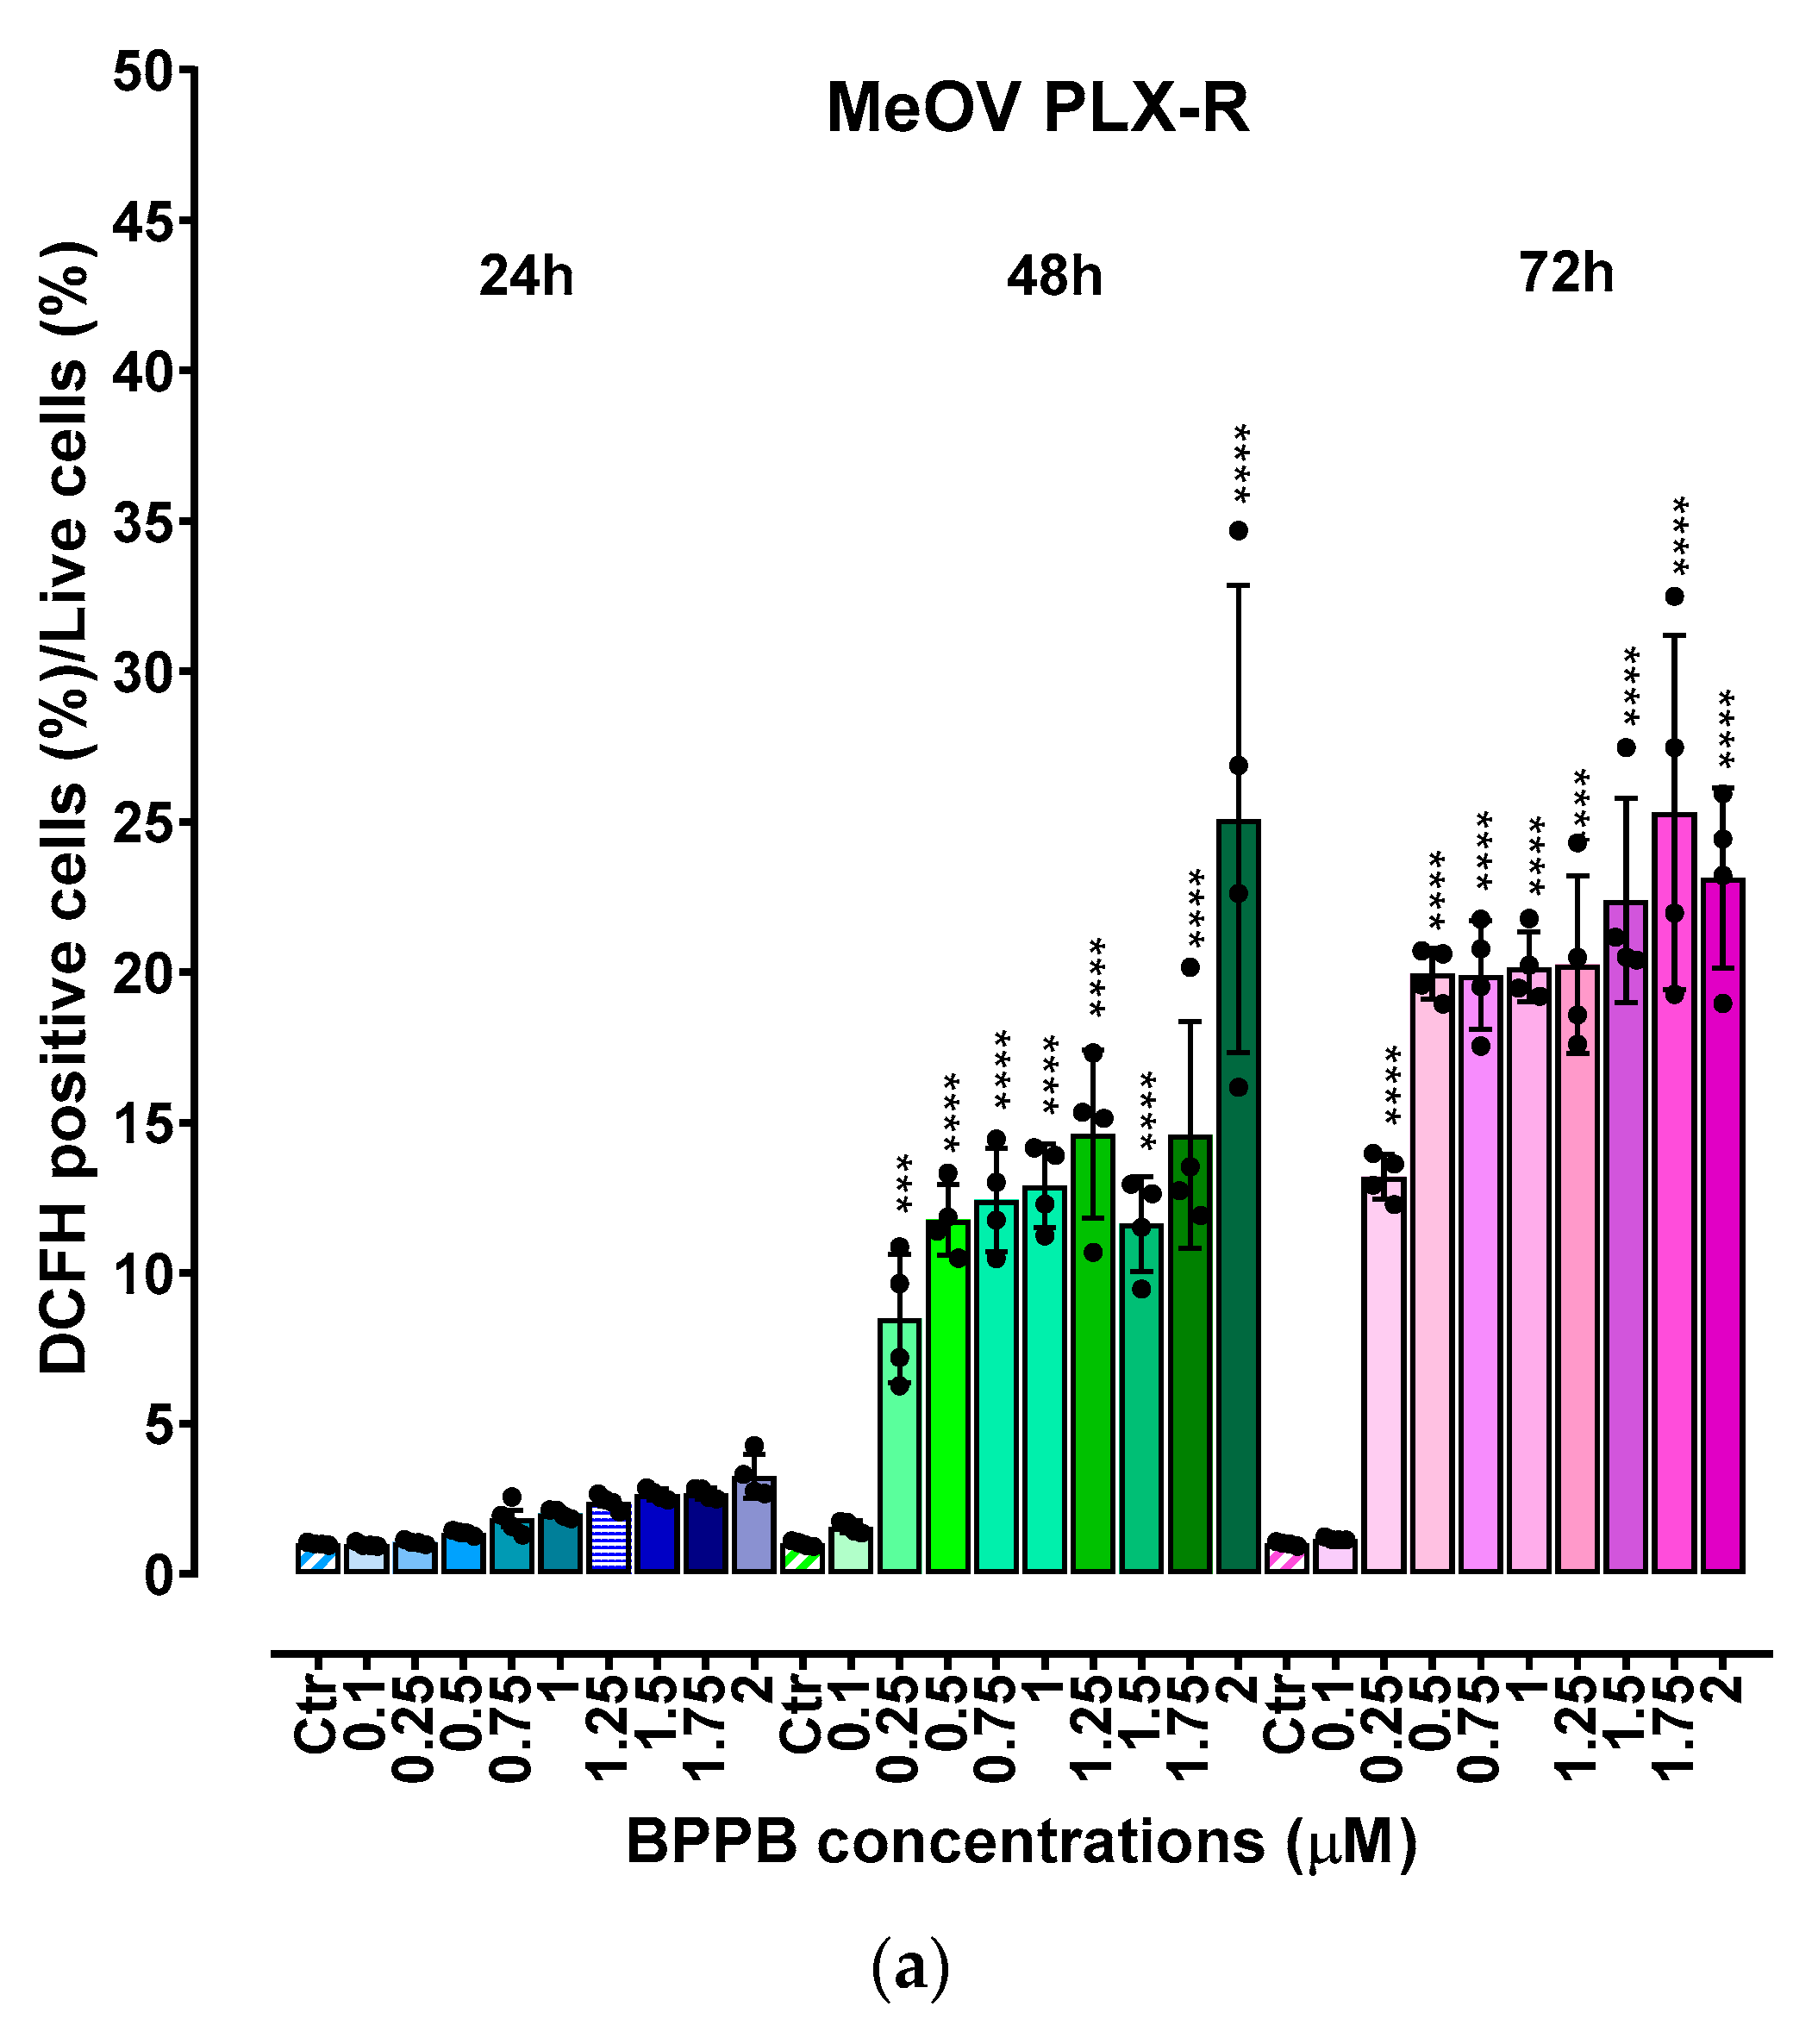
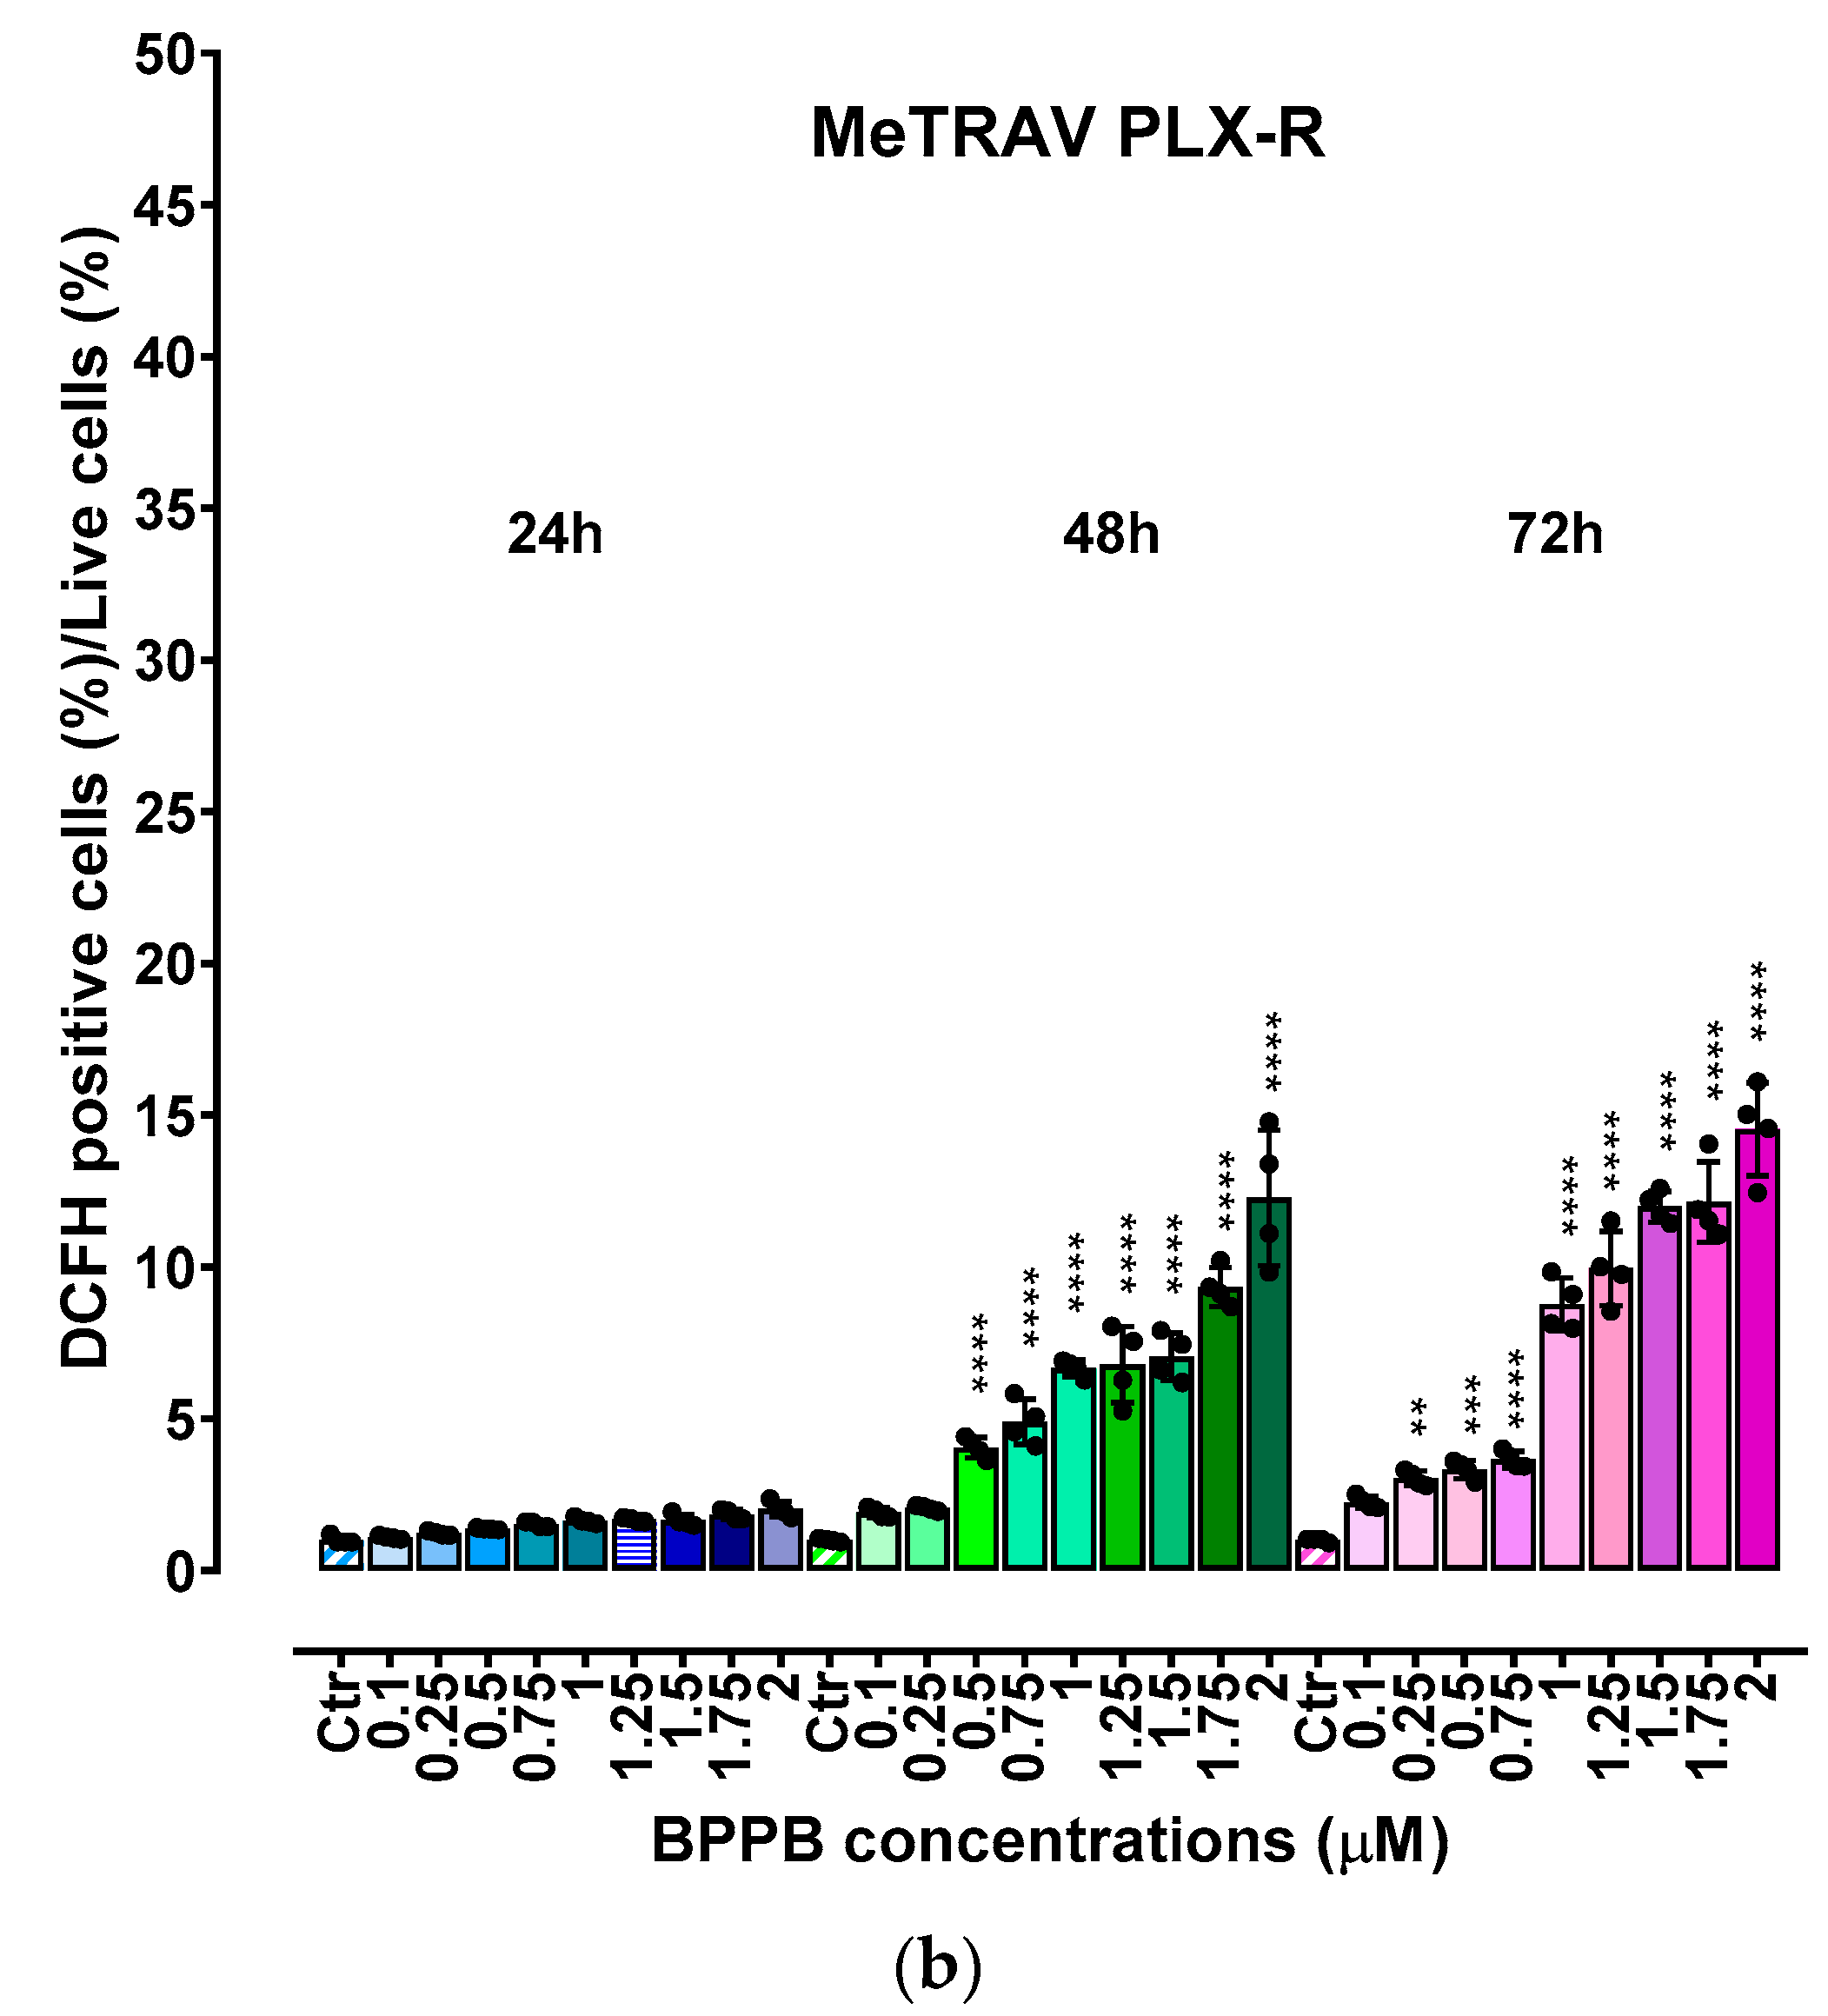
Figure 5.
(a) Hemolytic ratio percentage (%) determined by a recently reported protocol slightly modified[41]. The bar graph shows the hemolytic ratio percentage (%) in untreated RBCs (CTRL), and after exposure to increasing concentrations (0.1-50.0 µM) of BPPB. Experimental data are expressed as the mean ± S.D. of the data obtained on blood from eight healthy donors. Significance is indicated exclusively vs. control (CTRL) as follows: no symbols p > 0.05 and **** p < 0.0001 (one-way ANOVA followed by Tukey’s multi-comparisons test). (b) Dispersion graph of the RBCs viability (%) vs. BPPB concentrations in the range 0.1-50 µM, the related best fitting nonlinear statistical model with its equation and R2 value. (c) Dispersion graphs of the RBCs, MeOV and MeTRAV PLX-R cells vs. BPPB concentrations in the range 0.1-2.0 µM.
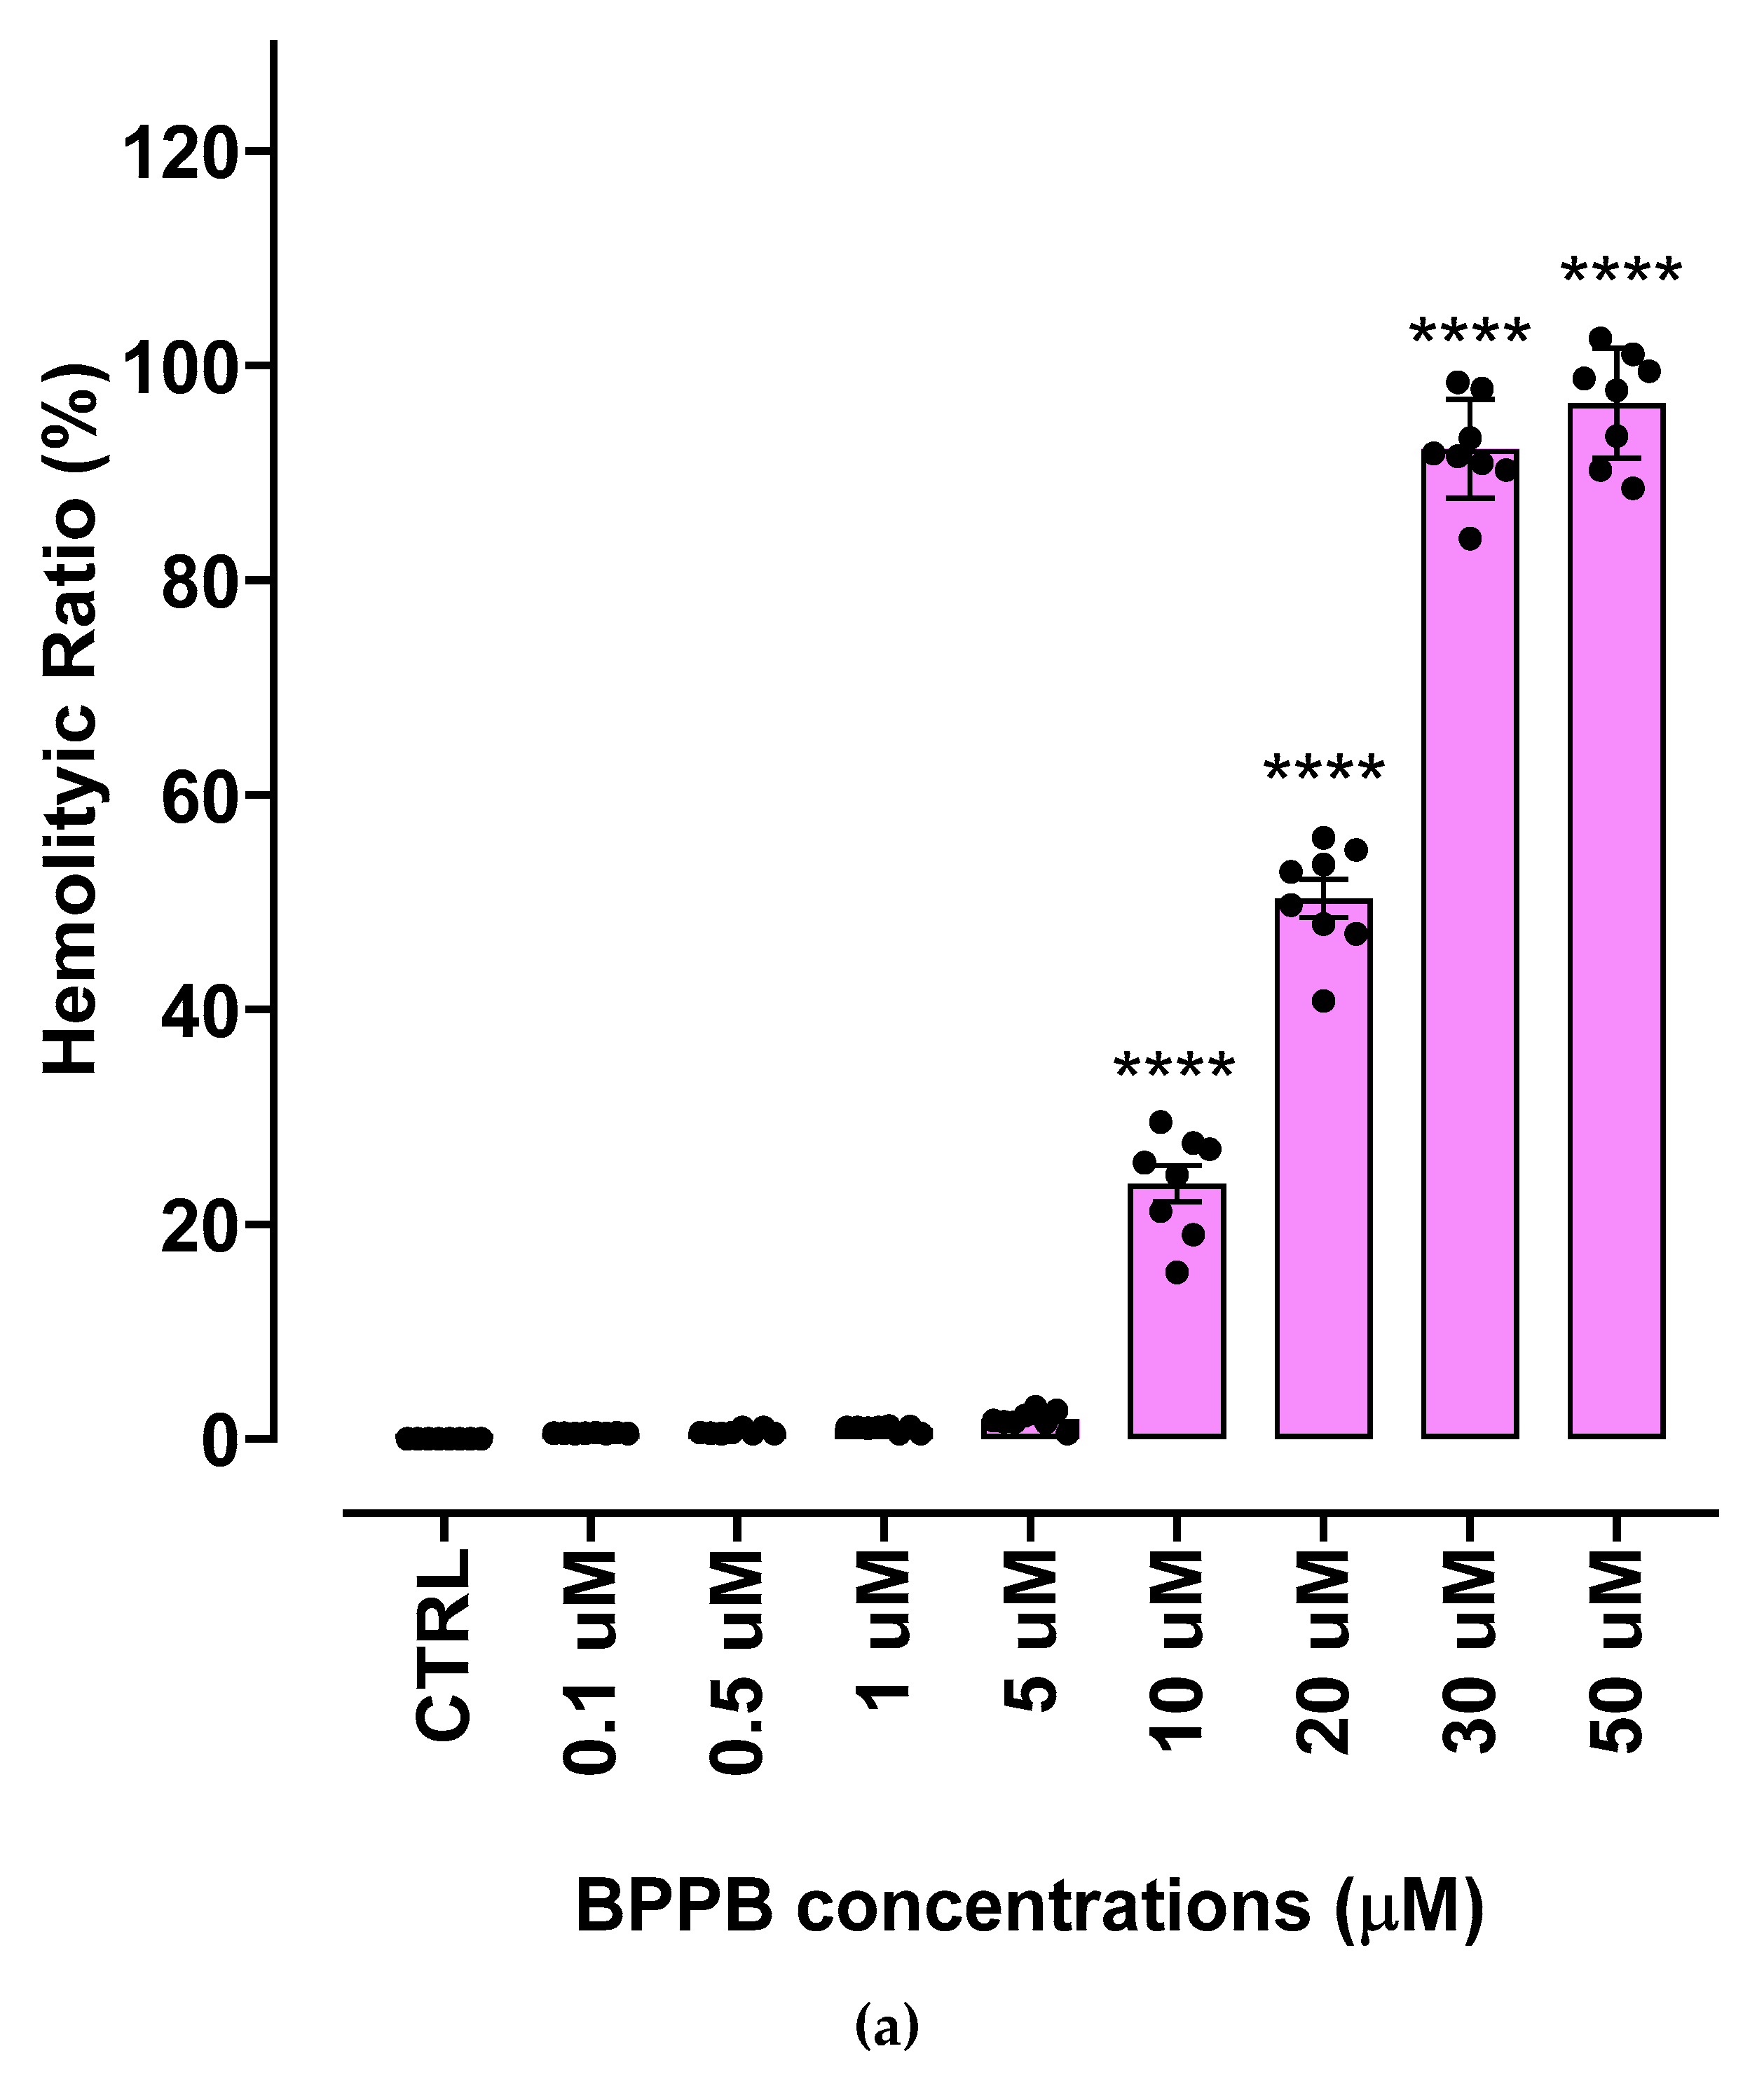
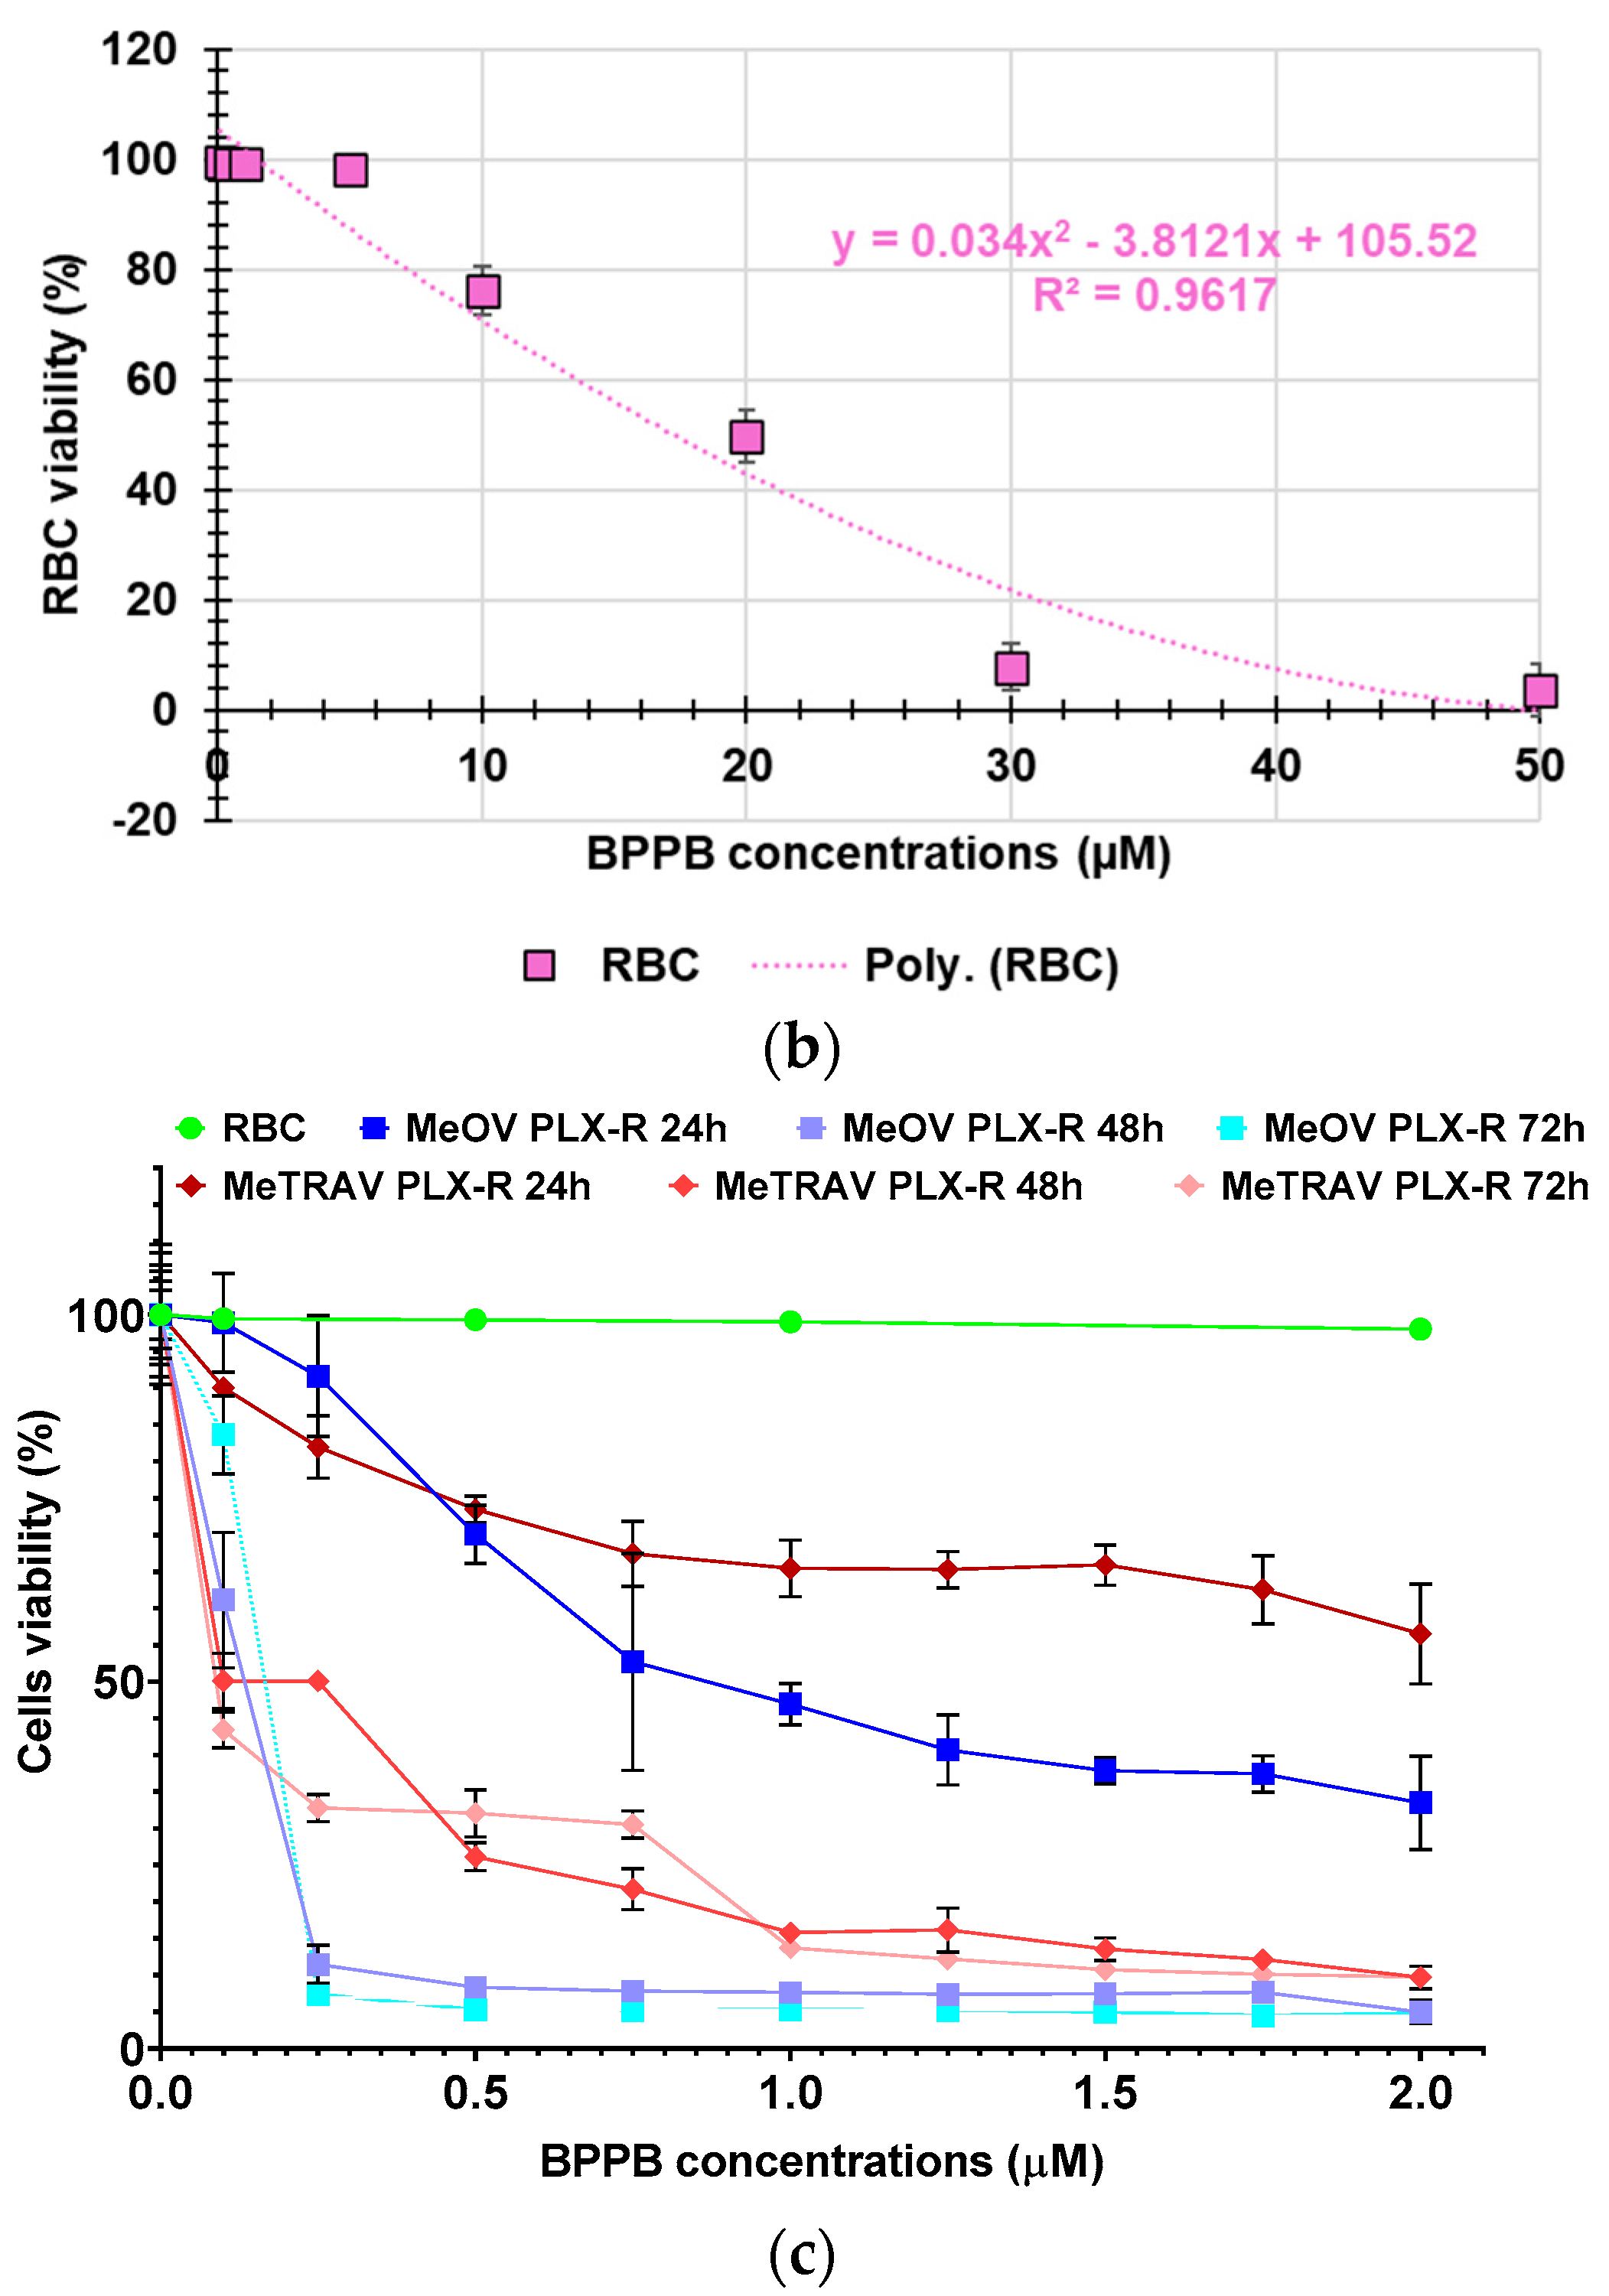
Figure 6.
(a) Bar graphs of the HaCaT cells viability (%) after exposure to increasing concentrations (0.1-10.0 µM) of BPPB for 24, 48 and 72 hours. Experimental data are expressed as the mean ± S.D. four independent experiment made in triplicate. Significance is indicated exclusively vs. control (CTr) as follows: no symbols p > 0.05 and **** p < 0.0001 (one-way ANOVA followed by Dunnet’s multi-comparisons test). (b) Dispersion graph of the HaCaT cells viability (%) vs. BPPB concentrations in the range 0.1-10 µM, after 24-, 48- and 72-hours treatments. (c) Dispersion graphs of the HaCaT cells viability (%) vs. BPPB concentrations in the range 0.1-10.0 µM after 24-, 48- and 72-hours treatments, the related best fitting nonlinear statistical models with their equations and R2 value.
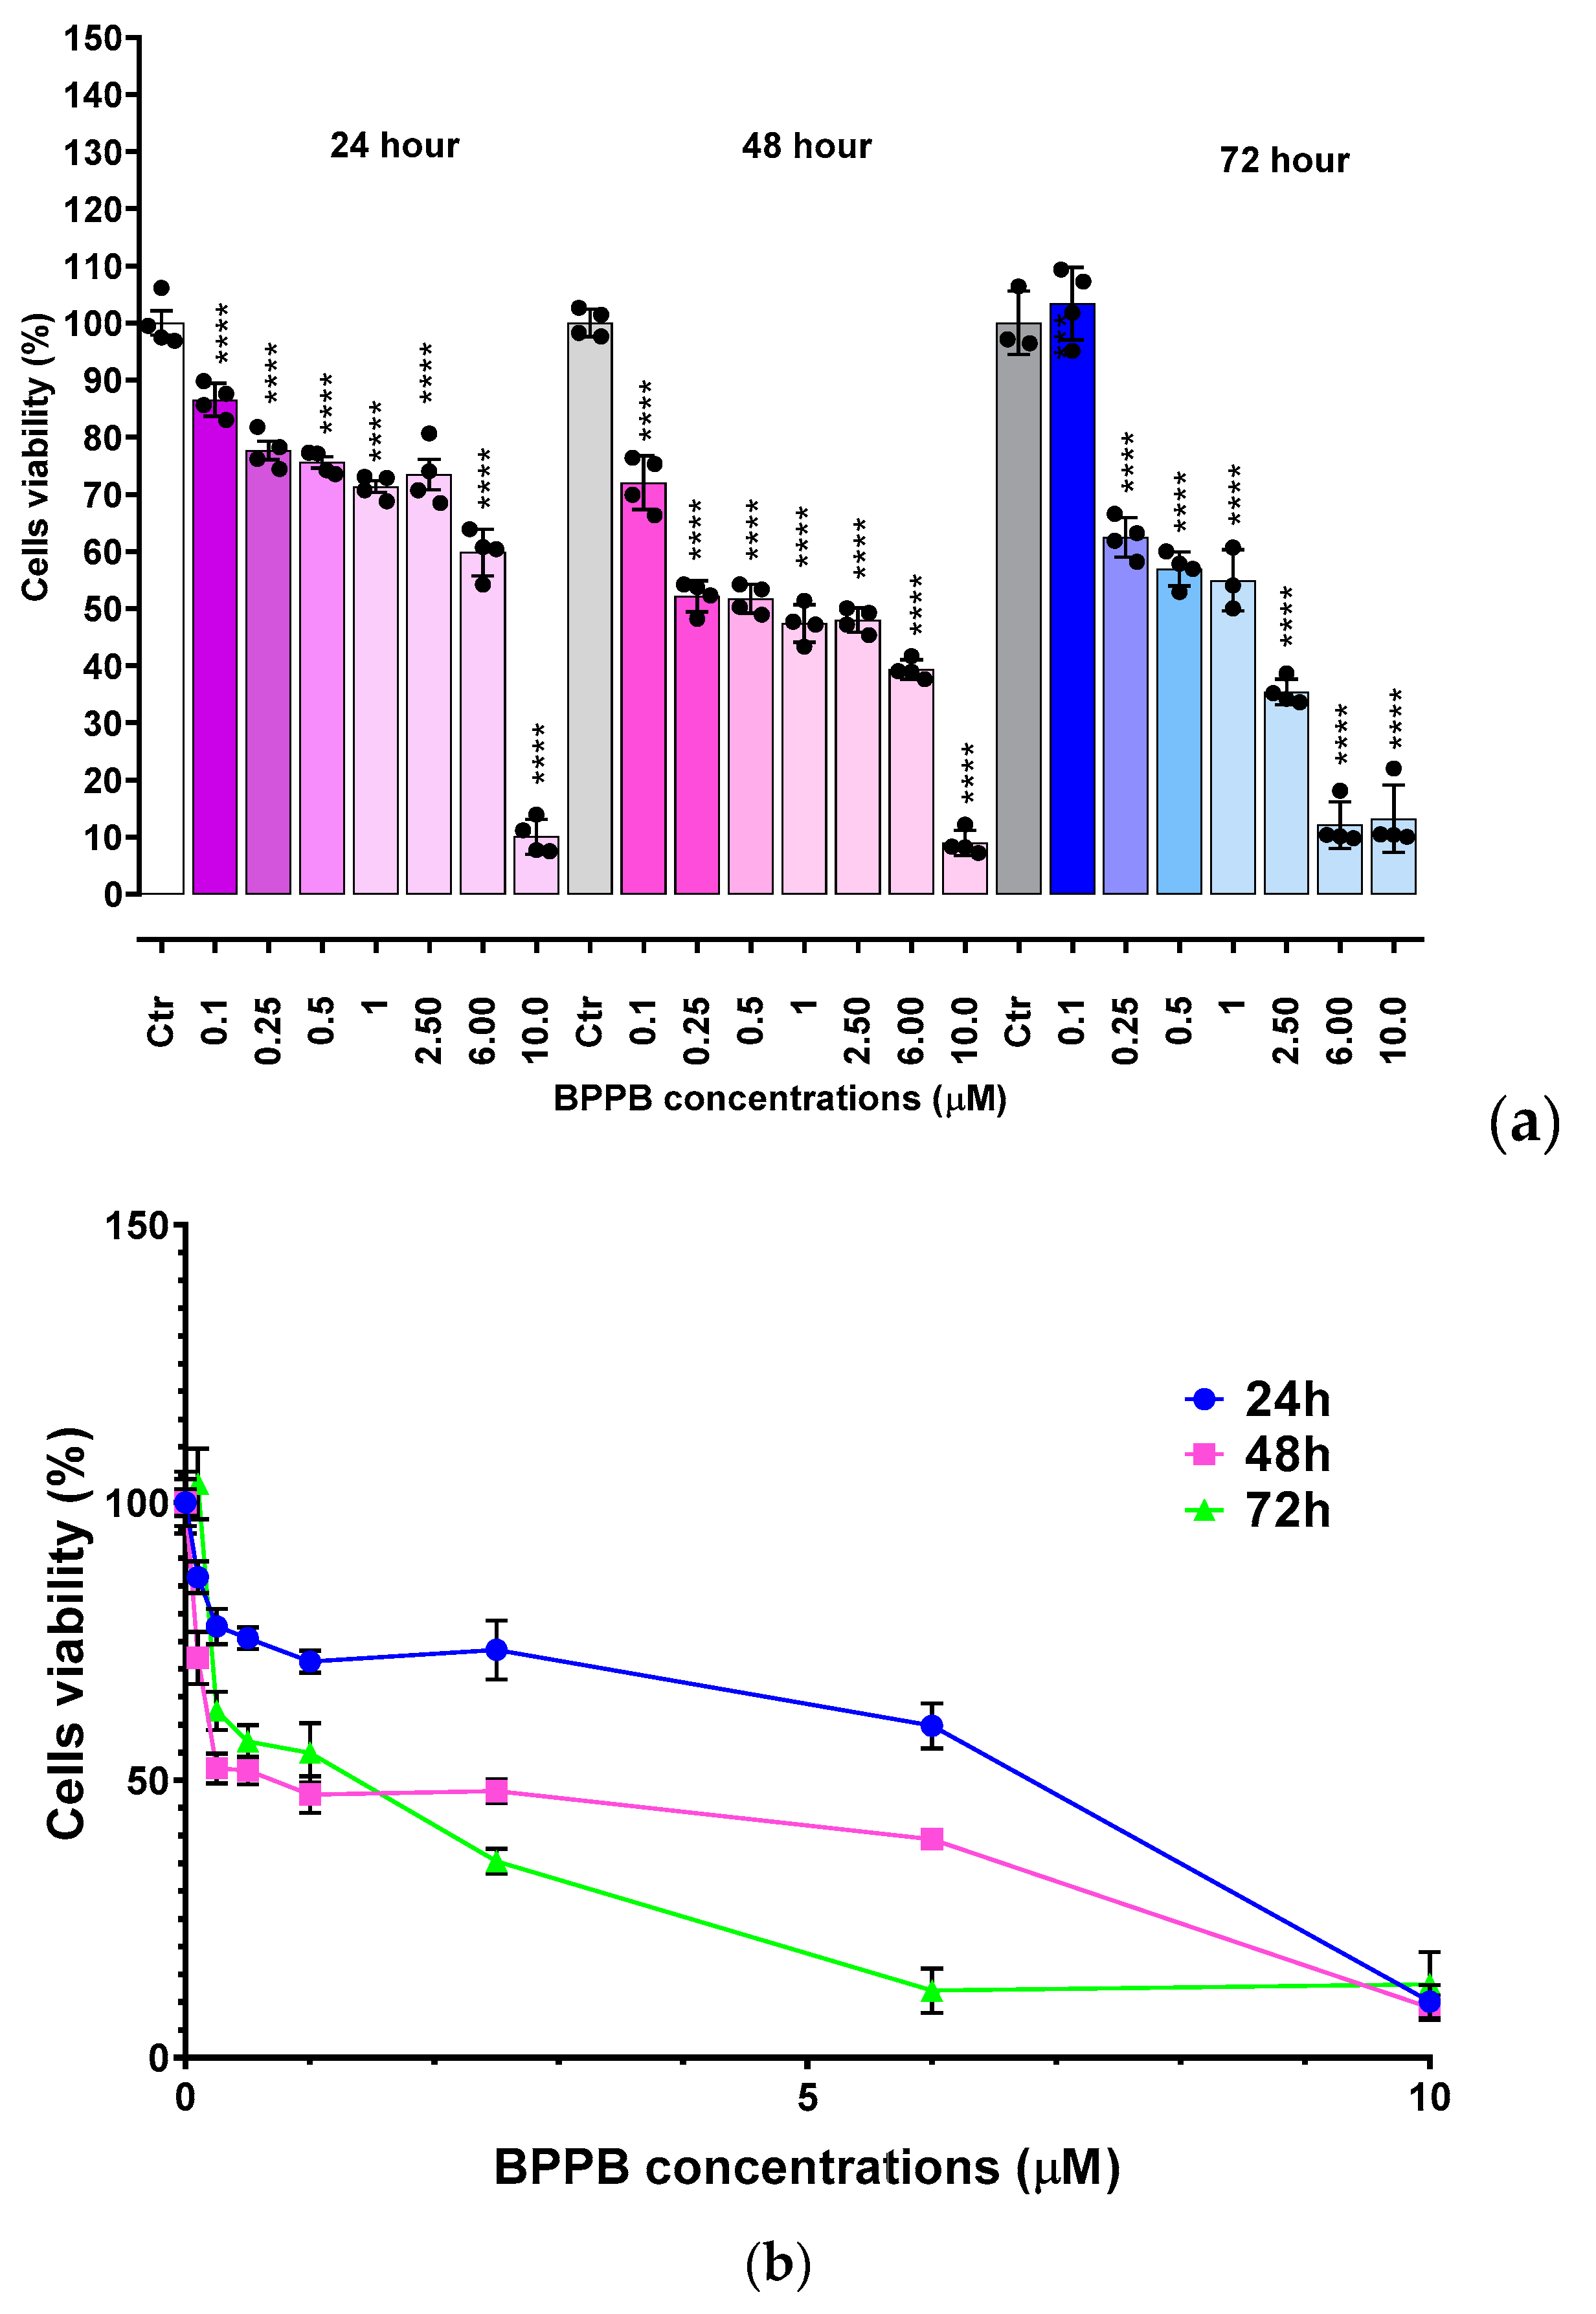
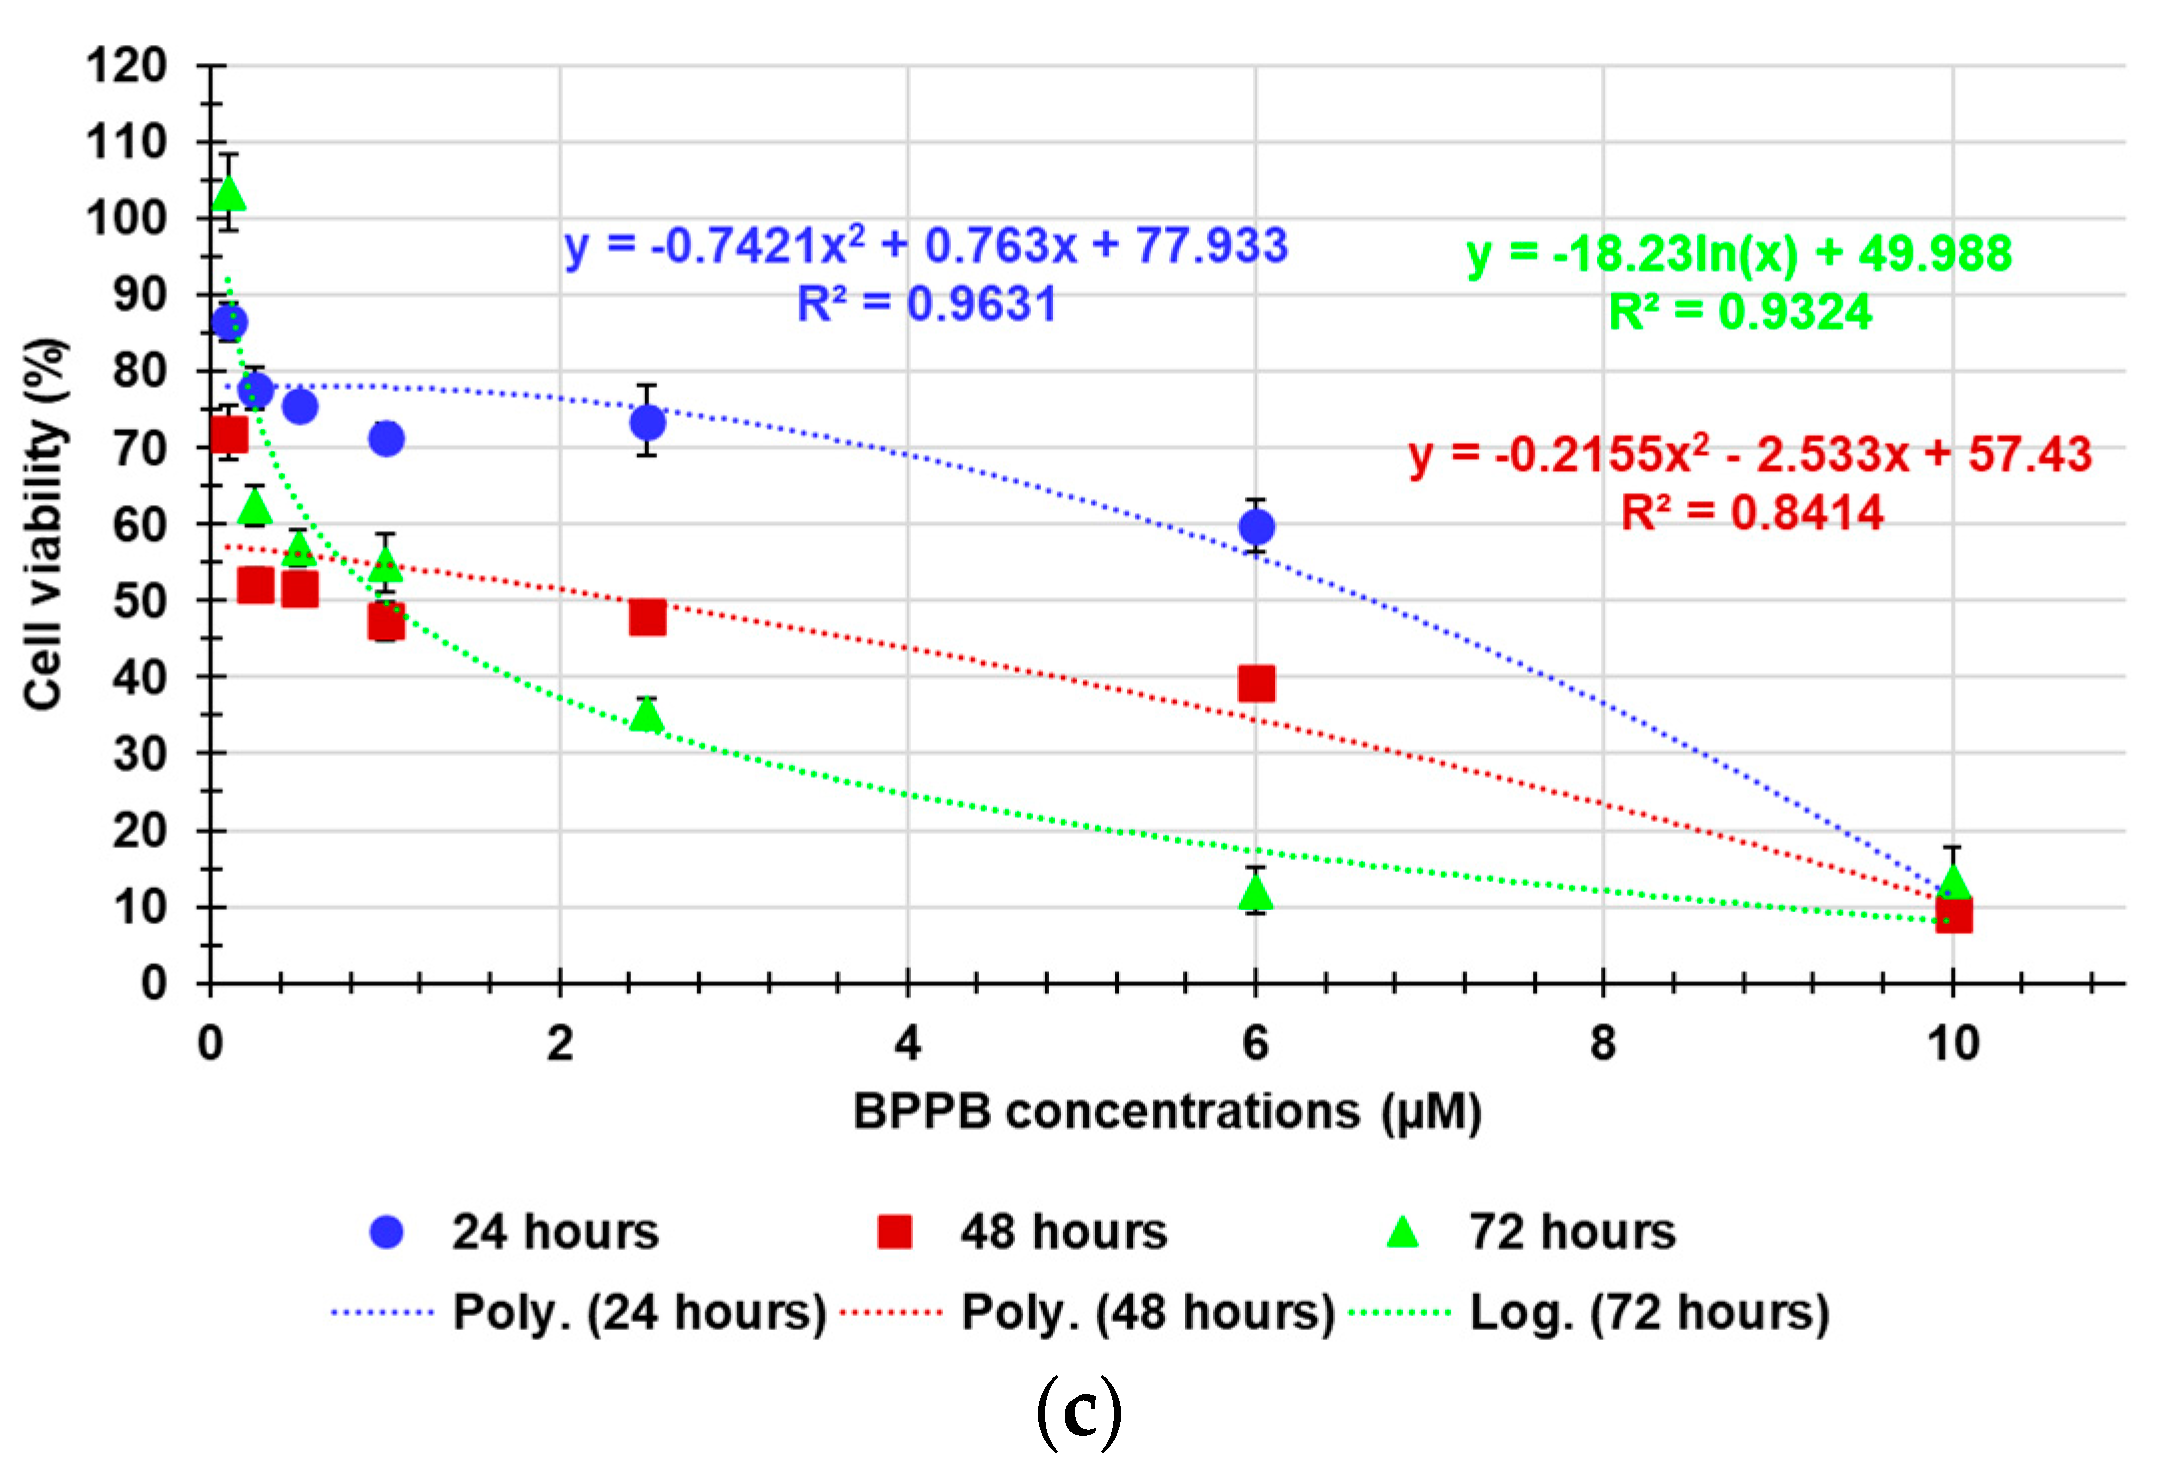
Figure 7.
Bar graphs of the ratios DCFH positive cells (%)/viable cells (%) calculated for HaCaT cells exposed to increasing concentrations (0.1-10.0 µM) of BPPB for 24, 48 and 72 hours (a). The ratio for the control (Ctr) was fixed to 1. Experimental data are expressed as the mean ± S.D. of four independent experiments made in triplicate. Significance is indicated exclusively vs. control (Ctr) as follows: no symbols p > 0.05 and **** p < 0.0001 (one-way ANOVA followed by Dunnet’s multi-comparisons test). Dispersion graphs of the ratios DCFH positive cells (%)/viable cells (%) into HaCaT cells vs. BPPB concentrations in the range 0.1-10 µM, after 24-, 48- and 72-hours treatments (b). Dispersion graphs of the average ratio DCFH positive cells (%)/viable cells (%) into HaCaT vs. exposure timings (green triangular indicators with error bars) (c). Dispersion graphs of HaCaT cell viability (%) vs. the ratios DCFH positive cells (%)/viable cells (%) into HaCaT cells after exposure to increasing concentrations (0.1-10.0 µM) of BPPB for 24 (round blue indicators), 48 (square red indicators) and 72 (triangular green indicators) hours(d). The dotted lines in Figure 7b, 7c and 7d in the same colors of indicators represent the best fitting nonlinear models which have been reported with their equations and R2 values, as provided by Microsoft Excel 365 software.
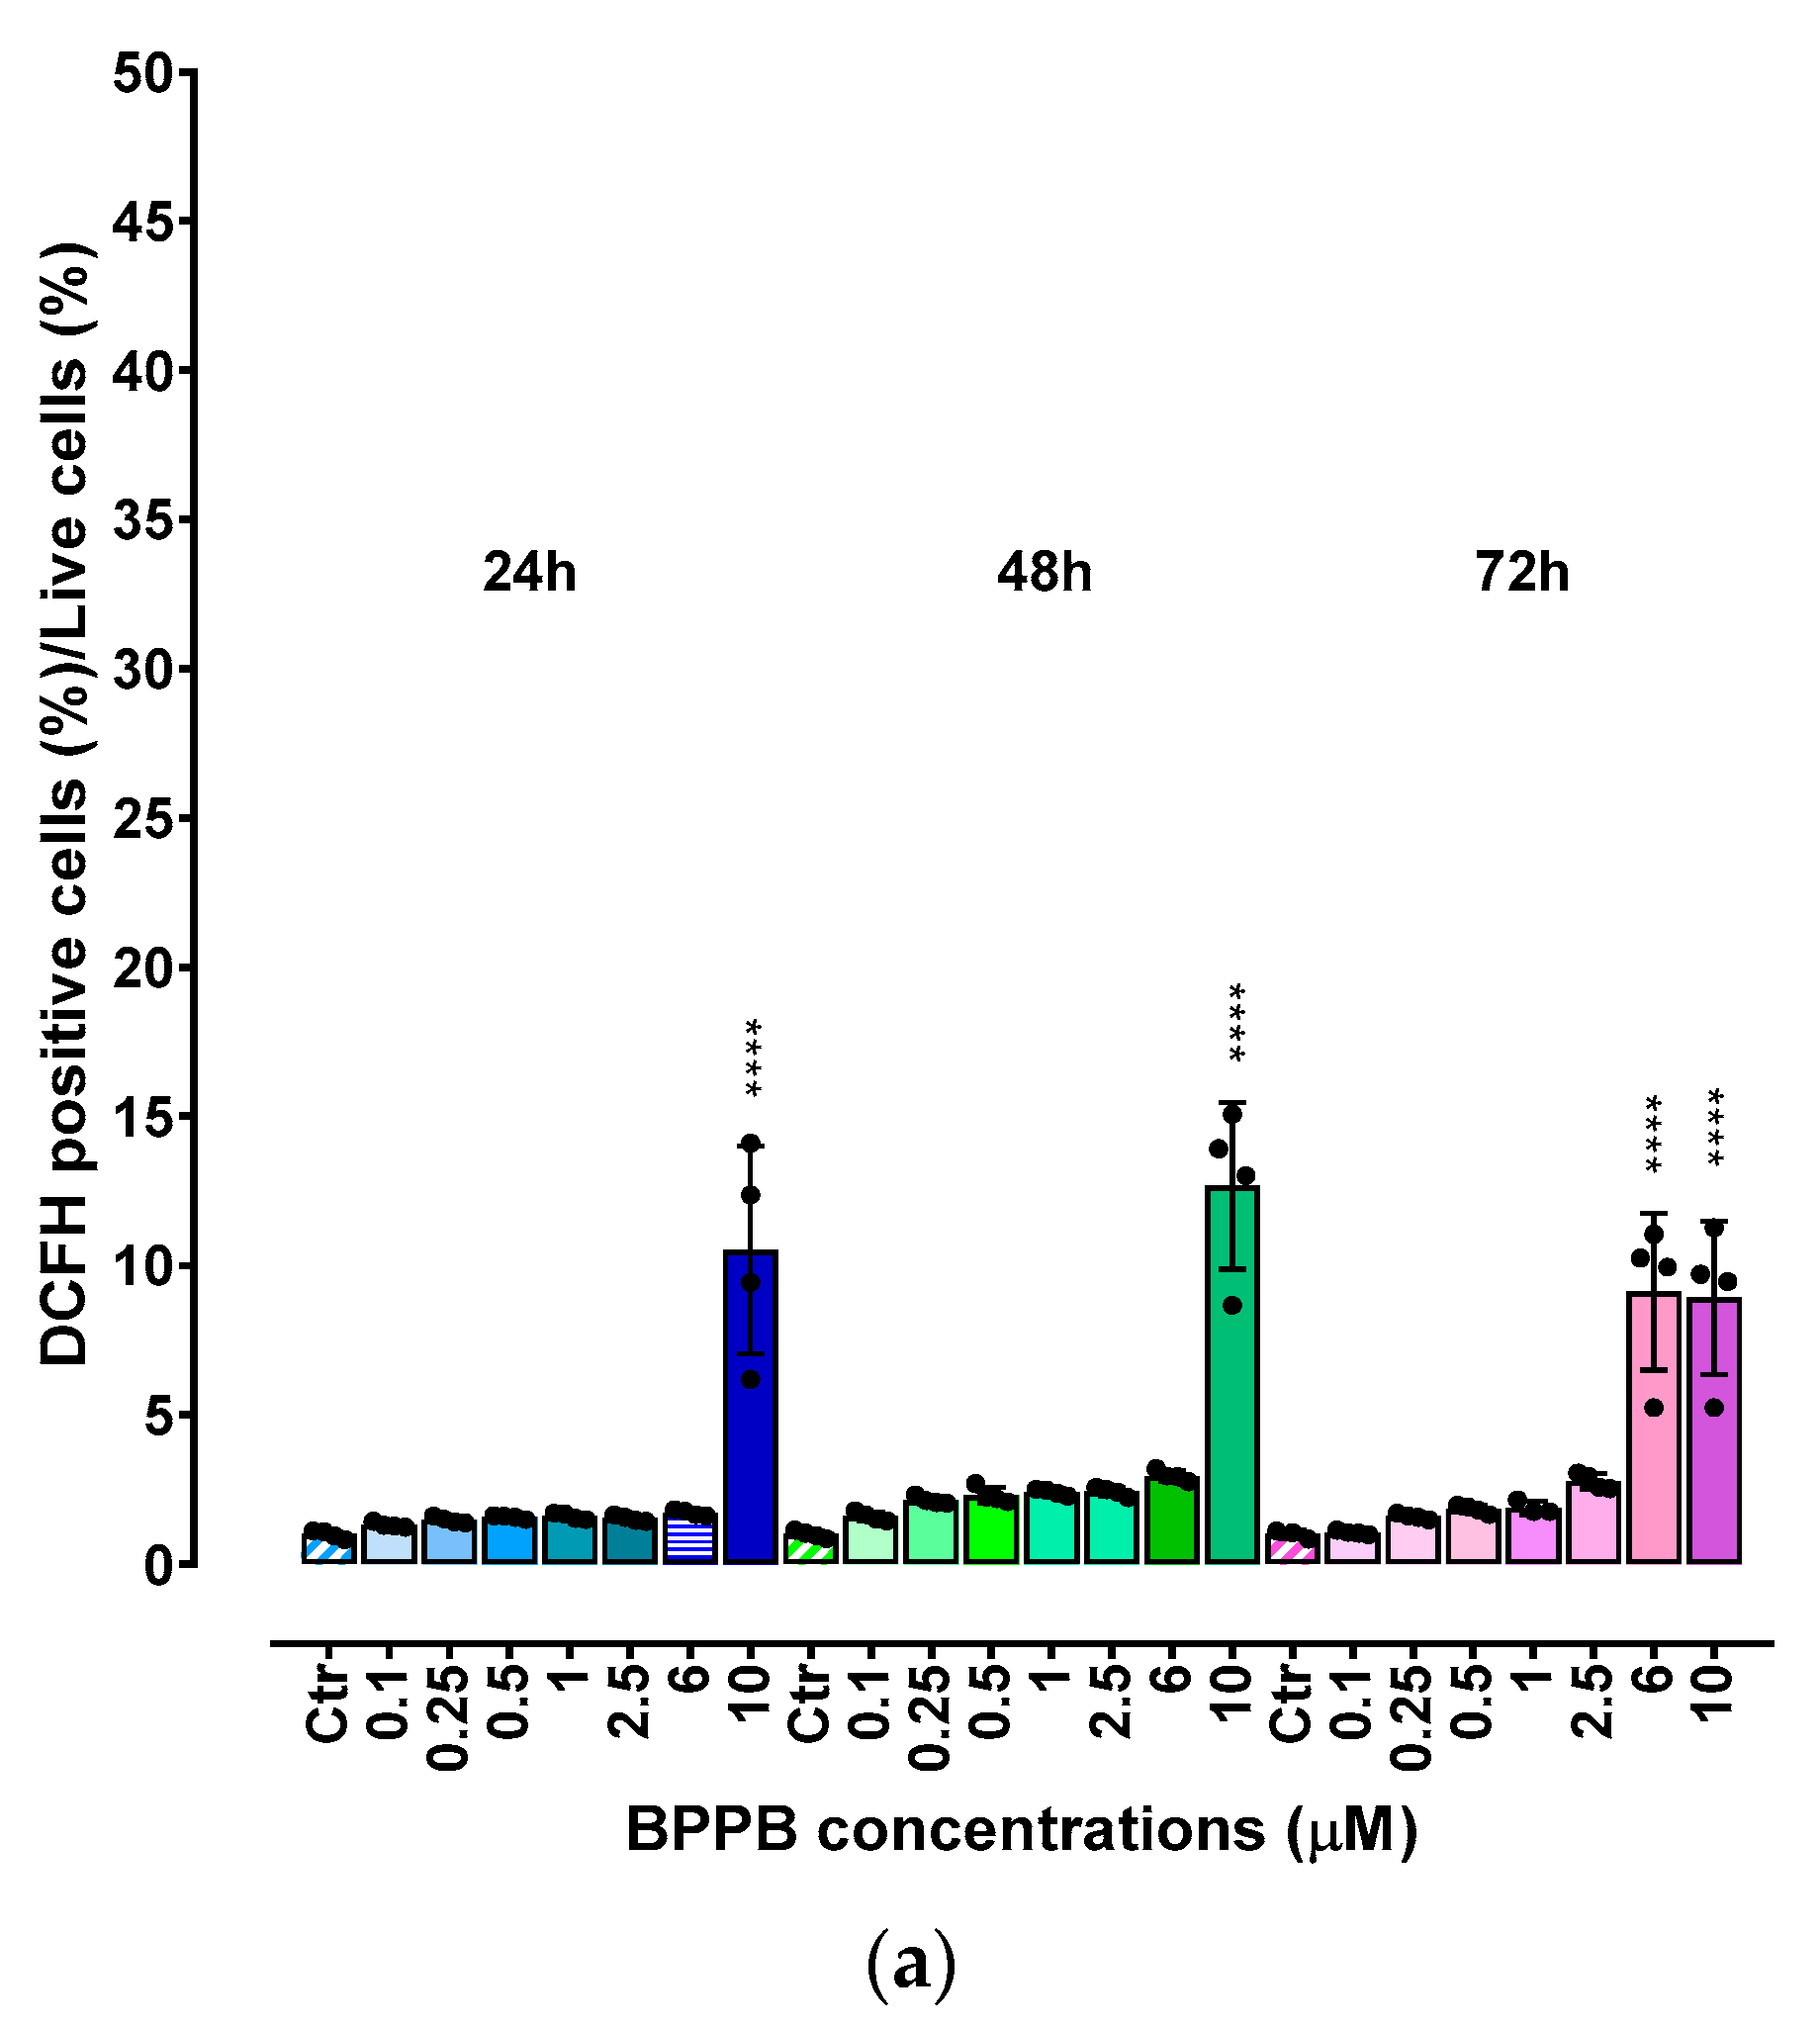
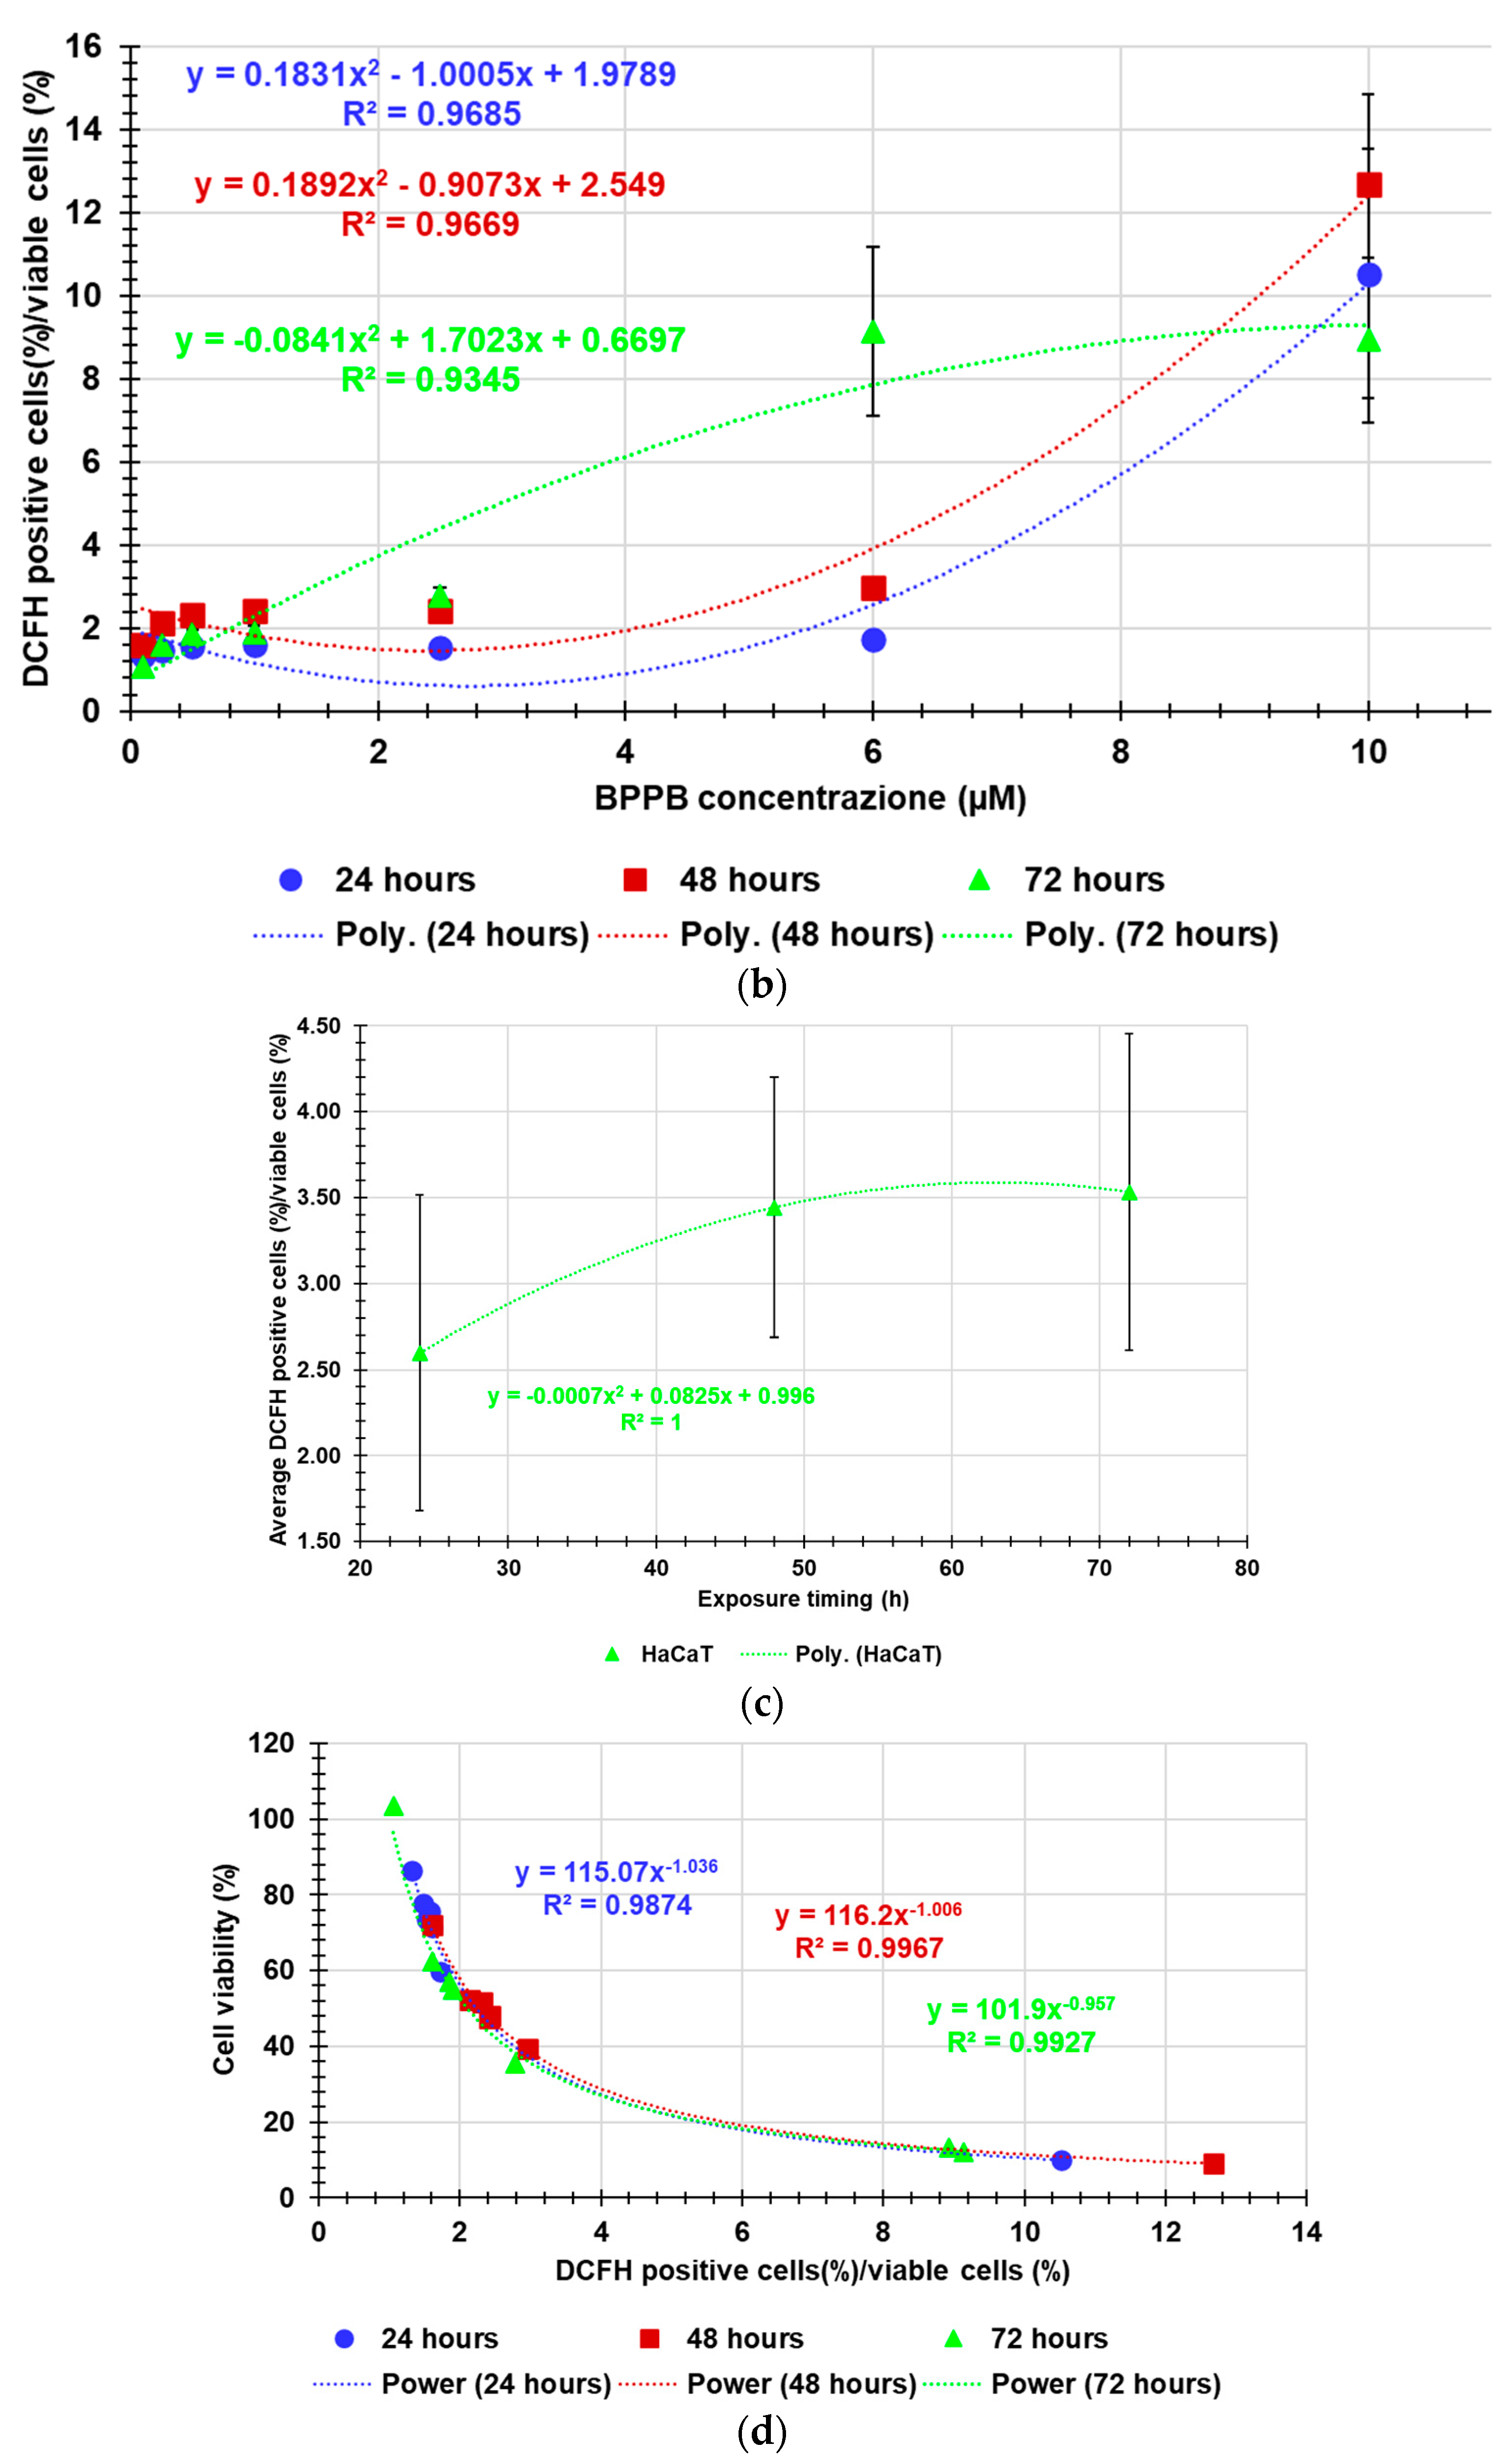

Table 1.
IC50 values of BPPB in MeOV and MeTRAV PLX-R cells. The calculation was obtained from the cytotoxicity data.
Table 1.
IC50 values of BPPB in MeOV and MeTRAV PLX-R cells. The calculation was obtained from the cytotoxicity data.
| Exposure time (hours) | IC50 MeOV PLX-R (µM) | IC50 MeTRAV PLX-R (µM) |
|---|---|---|
| 24 | 1.0060 ± 0.1253 | N.D. |
| 48 | 0.0878 ± 0.0187 | 0.1406 ± 0.0271 |
| 72 | 0.1065 ± 0.0343 | 0.0809 ± 0.0268 |
N.D. = not detected; in the range of concentrations considered, cell, viability was > 50% for all concentrations tested. An extrapolation provided by the nonlinear model mentioned in the main text provided an IC50 = 3.797 ± 1.088, which was used in the following sections.
Table 2.
IC50 values of BPPB calculated for HaCaT cells and PLX-resistant CMM cell populations and its HC50 values observed for RBCs.
Table 2.
IC50 values of BPPB calculated for HaCaT cells and PLX-resistant CMM cell populations and its HC50 values observed for RBCs.
| IC50 (µM) | IC50 24 hours (µM) | IC50 48 hours (µM) | IC50 72 hours (µM) | HC50 experiment time (µM) |
|---|---|---|---|---|
| RBCs | N.A.Q. | N.A.Q. | N.A.Q. | 15.56 ± 12.13 |
| MeOV PLX-R | 1.0060 ± 0.1253 | 0.0878 ± 0.0187 | 0.1065 ± 0.0343 | ---- |
| MeTRAV PLX-R | 3.7970 ± 1.0880 | 0.1406 ± 0.0271 | 0.0810 ± 0.0268 | ---- |
| HaCaT | 4.0210 ± 2.1590 | 0.6981 ± 0.3030 | 0.9238 ± 0.2487 | ---- |
N.A.Q. = not acquired.
Table 3.
Selectivity of BPPB for CMM cells expressed as selectivity index (SI) in relation to its effects on HaCaT cells and RBCs.
Table 3.
Selectivity of BPPB for CMM cells expressed as selectivity index (SI) in relation to its effects on HaCaT cells and RBCs.
| Cells | SI 24 hours a | SI 48 hours a | SI 72 hours a |
|---|---|---|---|
| RBCs * | 15.46 | 177.22. | 146.10. |
| RBCs ** | 4.10 | 110.67. | 192.10 |
| HaCaT * | 4.00 | 7.95 | 8.67 |
| HaCaT ** | 1.06 | 4.97 | 11.40 |
a Time of exposure of CMM cells; * vs. MeOV; ** vs. MeTRAV
Disclaimer/Publisher’s Note: The statements, opinions and data contained in all publications are solely those of the individual author(s) and contributor(s) and not of MDPI and/or the editor(s). MDPI and/or the editor(s) disclaim responsibility for any injury to people or property resulting from any ideas, methods, instructions or products referred to in the content. |
© 2025 by the authors. Licensee MDPI, Basel, Switzerland. This article is an open access article distributed under the terms and conditions of the Creative Commons Attribution (CC BY) license (http://creativecommons.org/licenses/by/4.0/).
Copyright: This open access article is published under a Creative Commons CC BY 4.0 license, which permit the free download, distribution, and reuse, provided that the author and preprint are cited in any reuse.


