
Submitted:
22 February 2025
Posted:
25 February 2025
You are already at the latest version
Abstract
Drought monitoring is crucial for water resource management in cold climate regions. For drought monitoring, different drought indices are used. Some drought indices, only consider precipitation and ignore temperature-driven evapotranspiration, which face significant limitations in cold regions. SPEI index provides a more comprehensive and adaptable tool by integrating temperature-driven evapotranspiration and water balance analysis. So, this index performance is worth evaluating in cold climate and mountainous regions. So, this study aims to compare the performance of Standardized Precipitation Evapotranspiration Index (SPEI) in two mountainous and cold climate regions in Iran and the United States (US). The Mann-Kendall Test was employed to assess the trend in the Upper Colorado River Basin (UCRB) in the US and Lorestan province. The results revealed a predominantly decreasing trend in drought occurrences across Lorestan, especially in southern and southwestern areas with lower elevations. In contrast, the UCRB showed a positive trend, indicating a wet period. The western parts of the UCRB were predominantly affected by drought. Among the studied stations, Khorram Abad station exhibited the most statistically significant trend at the 99% confidence level (Z > 2.57). The temporal trend analysis of drought revealed more positive and negative abrupt changes in the UCRB than in Lorestan. This indicates a higher degree of small-scale variability in the UCRB compared to Lorestan. This study provides a temperature-responsive method for drought assessment, supporting the development of adaptive strategies that address snowmelt variability, seasonal water availability, and shifting drought patterns in cold regions.
Keywords:
Drought
; Cold Climate
; Standardized Precipitation Evapotranspiration Index
; Mann-Kendall Test
; Lorestan
; Upper Colorado River Basin
Introduction
Droughts have intensified in frequency and severity due to climate change, rising water demand and threatening global water security. Declining precipitation and extreme rainfall fluctuations are among the factors exacerbating the water crisis and leading to numerous droughts in recent years. Drought is one of the most significant natural disasters, defined as a prolonged period of reduced precipitation (Mokhtar et al., 2021).
Droughts are classified into various types: meteorological drought, agricultural drought, hydrological drought, and socio-economic drought (Tigkas et al., 2016; Delpla et al., 2009). Meteorological drought occurs first and leads to other types of droughts. A meteorological drought can result in agricultural drought, followed by hydrological drought with a lag (Wan et al., 2023).
One of the essential steps in drought studies is determining an appropriate index or indices for evaluating the intensity and duration of droughts. Standardized Precipitation Index (SPI) (McKee et al. 1993) and Effective Drought Index (EDI) (Byun and Wilhite, 1999), rely solely on precipitation data. These indices are based on two assumptions. First, precipitation variations are more significant than other climatic variables, such as temperature and evapotranspiration. Second, other climatic variables, apart from precipitation, do not have temporal trends. However, many researchers emphasize the role of temperature in occurrence of drought events (Knapp et al., 2024).
Moreover, over the past 150 years, temperature has increased by approximately 0.5 to 2 °C, as shown by climate change models (Jiang, 2023). This increase has led to a rise in droughts and, consequently, increased water demand due to higher evapotranspiration rates (Peng et al., 2023). To address this challenge, the Standardized Precipitation-Evapotranspiration Index (SPEI) (Vicente-Serrano et al. 2010) was developed, which indirectly incorporates temperature by subtracting evapotranspiration from precipitation (Özçelik and Akkuzu, 2023). This index uses a simple water balance approach (P - PET), allowing it to reflect moisture availability more accurately in snow-dominated regions where temperature variations play a crucial role. SPEI showed promising for detecting long-term drought periods in the Aegean region of Turkey, but its effectiveness decreases for shorter timescales with more frequent and shorter drought events (Özçelik and Akkuzu 2023). Nejadrekabi et al. (2022) confirmed the effectiveness of using SPEI and Normalized Difference Vegetation Index (NDVI) for monitoring drought conditions in Khuzestan Province, Iran.
There exist drought indices which are suitable for monitoring drought in cold climate regions. Standardized snow water equivalent index (SWEI) was developed by considering snow water equivalent (SWE) to assess global snow drought (Huning and Aghakouchak 2020). The surface water supply index (SWSI) (Shafer and Dezman 1982), Snow-based hydroclimatic aggregate drought index (SHADI) (Bazrkar et al. 2024), and aggregate drought index (ADI) (Keyantash and Dracup 2004) account for snowpack amounts in addition to other hydroclimatic variables. The standardized snowmelt and rainfall index (SMRI) (Staudinger 2014) and hydroclimatic aggregate drought index (HADI) (Bazrkar et al. 2020) consider snowmelt and rainfall. The trade-off between complexity and accuracy of these aggregated drought indices requires further evaluation. While the simplicity of SPEI makes it a useful tool for drought monitoring, its performance in cold climate regions warrants further investigation. However, when Thornthwaite’s method is used to estimate PET, significant limitations arise, especially in cold climates and snow-covered regions (Aschonitis et al. 2022). During winter, precipitation is stored as snow rather than contributing to immediate water availability, but SPEI may misinterpret low PET as an absence of drought. Similarly, during spring snowmelt, a large influx of water occurs despite low precipitation, but SPEI may falsely indicate drought due to higher calculated PET.
This study evaluates the effectiveness of the SPEI in monitoring drought conditions in cold, mountainous climates by comparing its performance in two hydroclimatically similar yet geographically distinct regions. Given the unique hydrological dynamics of snow-dependent areas, where seasonal snow accumulation and melt play a critical role in water availability, traditional drought indices may not fully capture drought onset and severity. By assessing the accuracy and responsiveness of SPEI against observed drought trends and historical hydroclimatic data, this study aims to determine its reliability in regions where snowmelt is a primary water source. This paper is organized as follows: Section 2 describes the study areas and methodology for calculation of SPEI and Mann-Kendall Test. Section 3 provides the results of SPEI, drought and trend analyses and comparisons of SPEI performance in two regions. Section 4 discusses the results. Finally, Section 5 presents the conclusions.
Materials and Methods
This study compares Lorestan and UCRB due to their shared characteristics of being cold, mountainous regions with seasonal precipitation variability. While Lorestan represents a mid-sized basin with a strong winter precipitation regime, UCRB spans a large area with more spatial heterogeneity but remains an important reference for snowpack-dependent hydrology.
Study Area
Lorestan in Iran and UCRB in the United States are mainly characterized as mountainous, snow dominated, and cold climate regions. Figure 1 illustrates the geographical location of UCRB within the United States and Lorestan Province in Iran.
Lorestan Province, located in western Iran, spans an area of 28,064 km² and largely covered by the Zagros Mountains. The UCRB, covering over 279,720 km² across seven states, provides water to 26 million people within and beyond the basin. Elevation in Lorestan ranges from 500 m in the southernmost areas to 4,050 m at its highest point. Similarly, elevation in the UCRB varies from 900 m in the southwest to 4,300 m in the northeast.
Lorestan has a long-term average annual precipitation of 498.6 mm, with the highest monthly rainfall of 86.4 mm occurring in April. Of its total precipitation, 43% falls in winter, 29.5% in autumn, and 27% in spring. In contrast, approximately 64% of the UCRB is classified as arid or semi-arid, receiving an average annual precipitation of 370 mm and maintaining a mean annual temperature of 6 °C (Miller and Piechota 2011). Temperature plays a vital role in shaping drought and wet conditions in the Colorado River Basin (Woodhouse and Pederson 2018).
The long-term average maximum and minimum temperatures in Lorestan are 22.6 °C and 7.7 °C, respectively, with Poldokhtar recording the highest average temperature (22.8 °C) and Nourabad the lowest (11.9 °C). August is the hottest month, while January is the coldest. February experiences the highest relative humidity (66.2%), making it the wettest month, whereas August is the driest (25.1%). The land cover in the UCRB consists mainly of rangeland (65%) and evergreen forest (25%).
For this study, data from 26 stations in UCRB (McAffee et al. 2019) were analyzed, with details presented in Table 1. Table 2 provides detailed information about the latitude, longitude, elevation, long-term climatic data, and climatic classification (based on the Emberger method) for nine synoptic stations in Lorestan, whose geographical distribution is shown in Figure 1.
Data Used and SPEI Calculation
For drought analysis using SPEI, precipitation and temperature data (mean, minimum, and maximum) were obtained from nine stations in Lorestan and 26 stations in UCRB. The data period for UCRB covered 65 years (1950–2014). For Lorestan, the data periods varied by station, ranging from 2007–2022 (Azna station) to 1958–2022 (Khorram Abad station). To compare drought conditions between two regions, the overlapping period of 2007–2014 was considered.
The SPEI is calculated at different timescales using a simple water balance equation that measures the difference between precipitation (P) and potential evapotranspiration (PET) based on the Thornthwaite approach (Vicente-Serrano et al. 2010):
The values of D at different timescales are calculated using Equation (2) (Vicente-Serrano et al. 2010):
where k is the selected timescale in months, and n is the number of months. A three-parameter distribution function is applied to account for negative values of D. Among the tested distributions, the log-logistic distribution showed the best fit for time-series data.
The cumulative probability function for the D data series is calculated as follows:
where α, β, and γ are scale, shape, and location parameters, respectively, for the values of D. After calculating the cumulative distribution function and converting it to normalized values, the SPEI is extracted.
SPEI values can be calculated for timescales such as 1-month, 3-months, 6-months, 9-months, 12-months, and 18-months. In this study only 1-month SPEI is calculated because of short-term drought assessment, immediate climatic responses, and the 1-month SPEI is highly sensitive to temperature spikes and evaporation rates. Positive SPEI values indicate a water surplus, while negative values indicate a water deficit. This index is suitable for monitoring dry and wet periods. Drought begins when the SPEI falls below -1 and ends when it becomes positive. The classification of SPEI values is shown in Table 3.
Mann-Kendall Test
The Mann-Kendall test, endorsed by the World Meteorological Organization, is a statistical method used to assess time trends in data. It is based on non-parametric linear regression principles and determines whether a parameter’s time series exhibits a significant increasing or decreasing trend within a certain confidence level. In other words, this test is primarily used for detecting the presence and direction of a trend in a time series. A key advantage of the Mann-Kendall test is its insensitivity to data normality, making it suitable for analyzing datasets that do not follow a specific distribution. Originally introduced by Mann (1945) and further refined by Kendall (1975), the test is particularly effective for time series analysis. In this test, the null hypothesis states that there is no trend in the data, meaning that the observations are independent and randomly distributed over time. while the alternative hypothesis (H1) suggests a significant increase or decrease in trend.
One of the strengths of the Mann-Kendall method lies in its applicability to non-normally distributed data, allowing for reliable trend analysis in diverse datasets. In this method, the S statistic for the g-th month and the k-th station is calculated as follows:
where n is the number of series data and sgnθ is a function of the sign and θ is the difference between the two observations in each of the studied parameters in different years I and j, which are as follows:
When n≥ 10, the S statistic is distributed almost normally and has a mean of 0 and the following standard deviation:
where d is the same number of data in the time series. In this method, Sgk is normalized as follows:
S’gk = Sgk – sgn(Sgk)
Then the standardized test statistic or Z, which has a standard normal distribution with a mean of 0 and a variance of 1, is obtained as follows:
Positive Z-Value (Z>0) Indicates a positive trend (an increasing trend in the time series), and Negative Z-Value (Z<0) Indicates a negative trend (a decreasing trend in the time series). If the value of Z is greater than ± 1.96, the data has a trend and the null hypothesis is rejected, otherwise it has no trend. Z is the standard normal distribution statistic and is used in a two-domain test depending on the confidence levels of the item. The test can take different values and S is a parameter of the Mann-Kendall method which is calculated. The value of Z statistic for 95% and 99% confidence levels the percentages are considered to be 1.96 and 2.58, respectively. If the p-value of the Z statistic is greater than the significance level (e.g., 0.05), then H0 cannot be rejected, meaning there is no significant trend. Conversely, if the p-value is less than the significance level, H0 is rejected, indicating that there is a statistically significant trend in the direction indicated by Z.
Results and Discussion
Drought conditions in Lorestan and UCRB were evaluated and compared using the SPEI index. The temporal variations of this index were analyzed and compared at a monthly timescale for each station.
Drought Trends in Lorestan
The time series charts in Figure 3 illustrate the monthly SPEI variations for nine stations in Lorestan. Based on these charts, drought variability over time is significant. However, drought conditions remained within the “normal” range at five stations: Alieshtar, Aligoudarz, Azna, Boroujerd, and Doroud. In contrast, drought conditions deviated from the normal range at four stations: Khorramabad, Koohdasht, Nourabad, and Poldokhtar. For example, droughts were recorded in Kouhdasht in 2022, Khorram Abad in 1970, 1980, and 2022, and Poldokhtar in 2005 and 2022. Conversely, wet periods were observed in Khorramabad in 2000 and Nourabad in 2005. The results indicate that southern and southwestern regions of Lorestan, which are predominantly lowland areas, have experienced more severe droughts.
Drought Trends in UCRB
Comparison of the Common Period (2007–2014)
Examining the overlapping period between the two regions (highlighted by a dashed line in the charts) revealed that in Lorestan, the SPEI index showed decreasing trends at Azna, Khorram Abad, and Nourabad stations, while increasing trends were observed in other areas, indicating a tendency toward wetter conditions. In contrast, UCRB exhibited a consistent pattern across all 26 stations.
Temporal Trend Analysis Using the Mann-Kendall Test
The Mann-Kendall test was employed to evaluate the temporal trends of drought time series in the study regions. Table 4 presents the Mann-Kendall statistics for drought time series in Lorestan and UCRB. Figure 6(a) and (b) shows the spatial distribution of Mann-Kendall statistics and normalized Mann-Kendall statistics over UCRB and Lorestan, respectively. While some stations in Lorestan (e.g., Khorram Abad) showed statistically significant increasing trends (Z>2.57) compared to others that were not statistically significant that confirmed by the heatmap in Figure 6b. This distinction suggests that localized factors, such as elevation, land use changes, and proximity to water sources, may be influencing the observed variability in drought trends. This can be attributed to Khorram Abad’s status as the station with the highest annual mean precipitation in Lorestan. Additionally, its location within a Cold Wet climate zone further supports this observation. Azna, Boroujerd, Doroud, Koohdasht, Nourabad, and Poldokhtar stations showed decreasing trends in the SPEI index, but these trends were not statistically significant as their Z values fell within the ±1.96 range. Nourabad, among the stations, has the lowest annual mean temperature (11.9 °C); however, its precipitation (467.9 mm) levels are neither among the highest (631.7 mm) nor the lowest (361 mm). It is generally classified as having a Hot Dry climate. This classification can explain the lowest Mann-Kendall Z value (-0.69) observed for Nourabad station. A similar study by Nejadrekabi et al. (2022) on trend analysis of SPEI using the Mann-Kendall test showed significantly higher impact of temperature increase than precipitation reduction.
Among the 26 stations in UCRB, Canyon de Chelly, Fruita, Gunnison 3SW, Montrose #2, Blanding, and Steamboat Springs exhibited decreasing trends in the SPEI index. Other stations showed increasing trends, with Dillon 1E, Green River, and Pinedale stations displaying statistically significant positive trends at the 95% confidence level (Z > 1.96). The yellow spots, stretching from the north to the center of the UCRB, represent these values, as shown in Figure 6(a).
Analysis of SPEI Trend Charts
The trend charts for the SPEI index in both regions are shown in Figure 5 and Figure 6, which align with the Z-statistic results. In Lorestan (Figure 7), Sharp rise in drought trends occurred in Aleshtar (2006, 2010, 2016), Doroud (2014), Khorram Abad (1991), Koohdasht (2009, 2013, 2018), and Nourabad (2012, 2014, 2016). Sharp drop in trends of SPEI were observed in Aleshtar (2007), Khorramabad (2015), Koohdasht (2018), and Nourabad (2013, 2020). These Abrupt changes significantly influenced the overall drought trends during the study period.
In UCRB (Figure 8 and Figure 9), sharp drop occurred in Steamboat Springs (2000) corresponds to a period of severe droughts across the western United States, attributed to La Nina induced precipitation deficits, Ft. Duchesne (2008, 2012), and Salina 24 E (2011). Sudden spikes were observed in Green River (1954), Pinedale (1955), and Rock Springs AP (1954). the wet anomalies in Green River and Pinedale align with documented El Nino events that brought above-average precipitation to the region. These Significant fluctuations highlight the role of precipitation and temperature changes in drought variability across the UCRB.
Comparison of Lorestan and UCRB
The results of drought analysis using the SPEI index revealed distinct patterns between Lorestan and the Upper Colorado River Basin (UCRB), despite some similarities in their geographic and climatic characteristics. UCRB is much larger and spans multiple climatic zones, whereas Lorestan covers a more localized region. One key difference is UCRB’s strong reliance on snowpack, while Lorestan has a mix of rain-fed and snow-dependent regions. Additionally, UCRB contains extensive semi-arid and arid areas, whereas Lorestan generally experiences a wetter climate. In terms of drought trends, Lorestan exhibited a generally declining trend, indicating an increase in drought frequency, particularly in southern and southwestern areas with lower elevations. Conversely, UCRB showed increasing trends, suggesting wetter periods in most regions, although drought-affected areas were mainly concentrated in the western part of the basin. Moreover, the temporal variability of droughts was higher in UCRB, with more pronounced positive and negative jumps observed throughout the study period. This suggests that UCRB experiences greater small-scale variability in drought conditions compared to Lorestan, likely due to its larger spatial extent and diverse climatic influences. This suggests greater small-scale variability in UCRB compared to Lorestan.
Limitations
Wind speed and direction significantly influence air temperature, especially in cold climate regions, (Akbari 2020 and Abari et al. 2025). This study utilized the Thornthwaite method for PET estimation and SPEI computation, which may introduce biases in cold climates where PET is influenced by factors beyond temperature, such as wind speed and solar radiation. SPEI was calculated at a 1-month timescale, which is useful for short term drought monitoring but may not fully capture long-term hydrological drought trends. When it comes to data, this study relied on station-based precipitation and temperature data, which may not fully represent spatial heterogeneity in large basins such as UCRB. While efforts were made to standardize datasets, differences in data availability between Lorestan (1958 – 2022) and UCRB (1950 – 2014) influences trend comparability. Besides methodological and data constraints, SPEI does not account for snowpack accumulation and melt, which are crucial hydrological components in cold, mountainous regions. Other drought indices incorporating snow water equivalent provide additional insights.
Future directions
Future studies should explore different PET estimation methods, such as Penman-Monteith approach, to assess their impact on SPEI performance in snow-dependent basins. Additionally, analyzing multi-timescale SPEI variations (3 month, 6 month, 12 month) could provide a comprehensive understanding of cumulative drought effects, particularly for hydrological and agricultural drought assessments. Given the importance of snowpack in cold climate regions, integrating snow-dependent drought indices such as Standardized Snow Water Equivalent Index (SWEI) and Snow-based Hydroclimate Aggregate Drought Index (SHADI) could improve drought detection accuracy.
The future studies should also assess the role of large scale climate oscillations such as El Nino Southern Oscillation, North Atlantic Oscillation, and Pacific Decadal Oscillation in driving drought trends in Lorestan and UCRB, helping to distinguish between local and global climatic influences. Moreover, the use of remote sensing and machine learning could improve and enhance spatial drought assessments, particularly in data scarce regions where station-based measurements are limited. These approaches would contribute to a robust, high-resolution and predictive drought monitoring framework for cold, mountainous regions.
Conclusion
This study compared drought conditions in two regions: Lorestan in Iran and UCRB in the United States. SPEI performances in these cold and mountainous regions were evaluated. The findings indicate that Lorestan has faced more frequent droughts compared to UCRB, with the southern and southwestern regions of Lorestan being particularly affected. On the other hand, UCRB generally fell within the “normal” range, with trends tending toward wetter conditions. Specifically, 20 out of the 26 studied stations in UCRB showed positive trends in the SPEI index. However, except for three stations where the trends were statistically significant at the 95% confidence level, the trends at other stations were not significant.
The comparative analysis of the shared time period (2007–2014) between the two regions revealed that Lorestan experienced more pronounced and volatile changes in drought conditions than UCRB. This can be attributed to localized climatic changes in temperature and precipitation distribution pattern in Lorestan during the study period. These results highlight differences between the two regions on a smaller spatial and temporal scale.
For future studies, it is recommended to compare and evaluate the two regions based on additional hydrological parameters, such as soil moisture, groundwater levels, and snow water equivalent, to provide a more comprehensive understanding of drought variability in both regions. Additionally, integrating multi-timescale drought indices and exploring the role of large-scale atmospheric circulation patterns could further improve drought trend analysis
References
- Aschonitis, V. , Touloumidis, D., ten Veldhuis, M. C., & Coenders-Gerrits, M. (2022). Correcting Thornthwaite potential evapotranspiration using a global grid of local coefficients to support temperature-based estimations of reference evapotranspiration and aridity indices. Earth System Science Data, 14(1), 163-177. [CrossRef]
- Akbari, S. (2020). Studying window energy performance using thermal camera (Master’s thesis). North Dakota State University.
- Akbari, S. , Gao, J., Flores, J. P., & Smith, G. (2025). Evaluating Energy Performance of Windows in High-Rise Residential Buildings: A Thermal and Statistical Analysis. Preprints. [CrossRef]
- Bazrkar, M.H.; Zhang, J.; Chu, X. Hydroclimatic aggregate drought index (HADI) (2020) A new approach for identification and categorization of drought in cold climate regions. Stoch. Environ. Res. Risk Assess., 34, 1847–1870. [CrossRef]
- Byun, H. , & Wilhite, D. (1999). Objective Quantification of Drought Severity and Duration. Journal of Climate, 12(9), 2747-2756. [CrossRef]
- Delpla, I. , Jung, A.V., Baures, E., Clement, M. and Thomas, O., 2009. Impacts of climate change on surface water quality in relation to drinking water production. Environmental International 35(8), 1225-1233. [CrossRef]
- Jiang, J. (2023). A fuzzy weighted moving average to analyze actual warming. Earth Science and Engineering, 1(1), 43. [CrossRef]
- Kendall, M. G. (1975). Rank Correlation Methods, Charles Griffin, London, UK.
- Keyantash, J.A.; Dracup, J.A. (2004). An aggregate drought index: Assessing drought severity based on fluctuations in the hydrologic cycle and surface water storage. Water Resour. Res., 40, W09304. [CrossRef]
- Knapp, P. A. , Soulé, P. T., Mitchell, T. J., Catherwood, A. A., & Lewis, H. S. (2024). Increasing radial growth in old-growth high-elevation conifers in Southern California, USA, during the exceptional “hot drought” of 2000–2020. International Journal of Biometeorology, 68(4), 743-748. [CrossRef]
- Mann, H. B. (1945). Nonparametric tests against trend. Econometrica: Journal of the Econometric Society,13(3). 245-259.
- McAfee, S. A. , McCabe, G. J., Gray, S. T., & Pederson, G. T. (2019). Changing station coverage impacts temperature trends in the Upper Colorado River basin. International Journal of Climatology, 39(3), 1517-1538. [CrossRef]
- McKee, T.B.; Doesken, N.J.; Kleist, J. (1993). The relationship of drought frequency and duration to time scales. In Proceedings of the 8th Conference on Applied Climatology, American Meteorological Society. Anaheim, CA, USA, 17–22 January.
- Miller, W.P.; Piechota, T.C. Trends in Western U.S. (2011). Snowpack and Related Upper Colorado River Basin Streamflow1. JAWRA J. Am. Water Resour. Assoc. 47. 1197–1210. [CrossRef]
- Mokhtar, A. , Jalali, M., He, H., Al-Ansari, N., Elbeltagi, A., Alsafadi, K.,... & Rodrigo-Comino, J. (2021). Estimation of SPEI meteorological drought using machine learning algorithms. IEEe Access. 9, 65503–65523. [CrossRef]
- Nejadrekabi, M, Eslamian, S.., Zareian, M. J. 2022, Use of Spatial Statistics Techniques for SPEI and NDVI Drought Indices: A Case Study of Khuzestan Province, International Journal of Environmental Science and Technology, 19, 6573-6594. [CrossRef]
- Özçelik, Ş. , & Akkuzu, E. (2023). Evaluation of drought with standardized precipitation evapotranspiration index (SPEI) in the aegean region, Ege Üniversitesi Ziraat Fakültesi Dekanligi, Vol. 60, No. 3, 515-528. [CrossRef]
- Peng, L. , Sheffield, J., Wei, Z., Ek, M., & Wood, E. F. (2023). An Enhanced SPEI Drought Monitoring Method Integrating Land Surface Characteristics. EGUsphere, 2003. [Google Scholar] [CrossRef]
- Shafer, B.A.; Dezman, L.E. Development of a surface water supply index (SWSI) to assess the severity of drought conditions in snowpack runoff areas. (1982). In Proceedings of the 50th Annual Western Snow Conference, Reno, NV, USA, 19–23 April pp. 164–175.
- Staudinger, M.; Stahl, K.; Seibert, J. A (2014). drought index accounting for snow. Water Resour. Res., 50, 7861–7872. [CrossRef]
- Tigkas, D. , Vangelis, H. and Tsakiris, G. 2016. Introducing a modified Reconnaissance Drought Index (RDIe) incorporating effective precipitation. Procedia Engineering, 162, 332-339. [CrossRef]
- Vicente-Serrano, S.M.; Beguería, S.; López-Moreno, J.I. (2010). A multiscalar drought index sensitive to global warming: The standardized precipitation evapotranspiration index. J. Clim., 23, 1696–1718. [CrossRef]
- Wan, L. , Bento, V. A., Qu, Y., Qiu, J., Song, H., Zhang, R.,... & Wang, Q. (2023). Drought characteristics and dominant factors across China: Insights from high-resolution daily SPEI dataset between 1979 and 2018. Science of The Total Environmentt, 901, 166362. [CrossRef]
- Woodhouse, C.A.; Pederson, G.T. (2018). Investigating runoff efficiency in upper Colorado river streamflow over past centuries. Water Resour. Res., 54, 286–300. [CrossRef]
Figure 1.
Geographical locations of UCRB and Lorestan province and the stations.
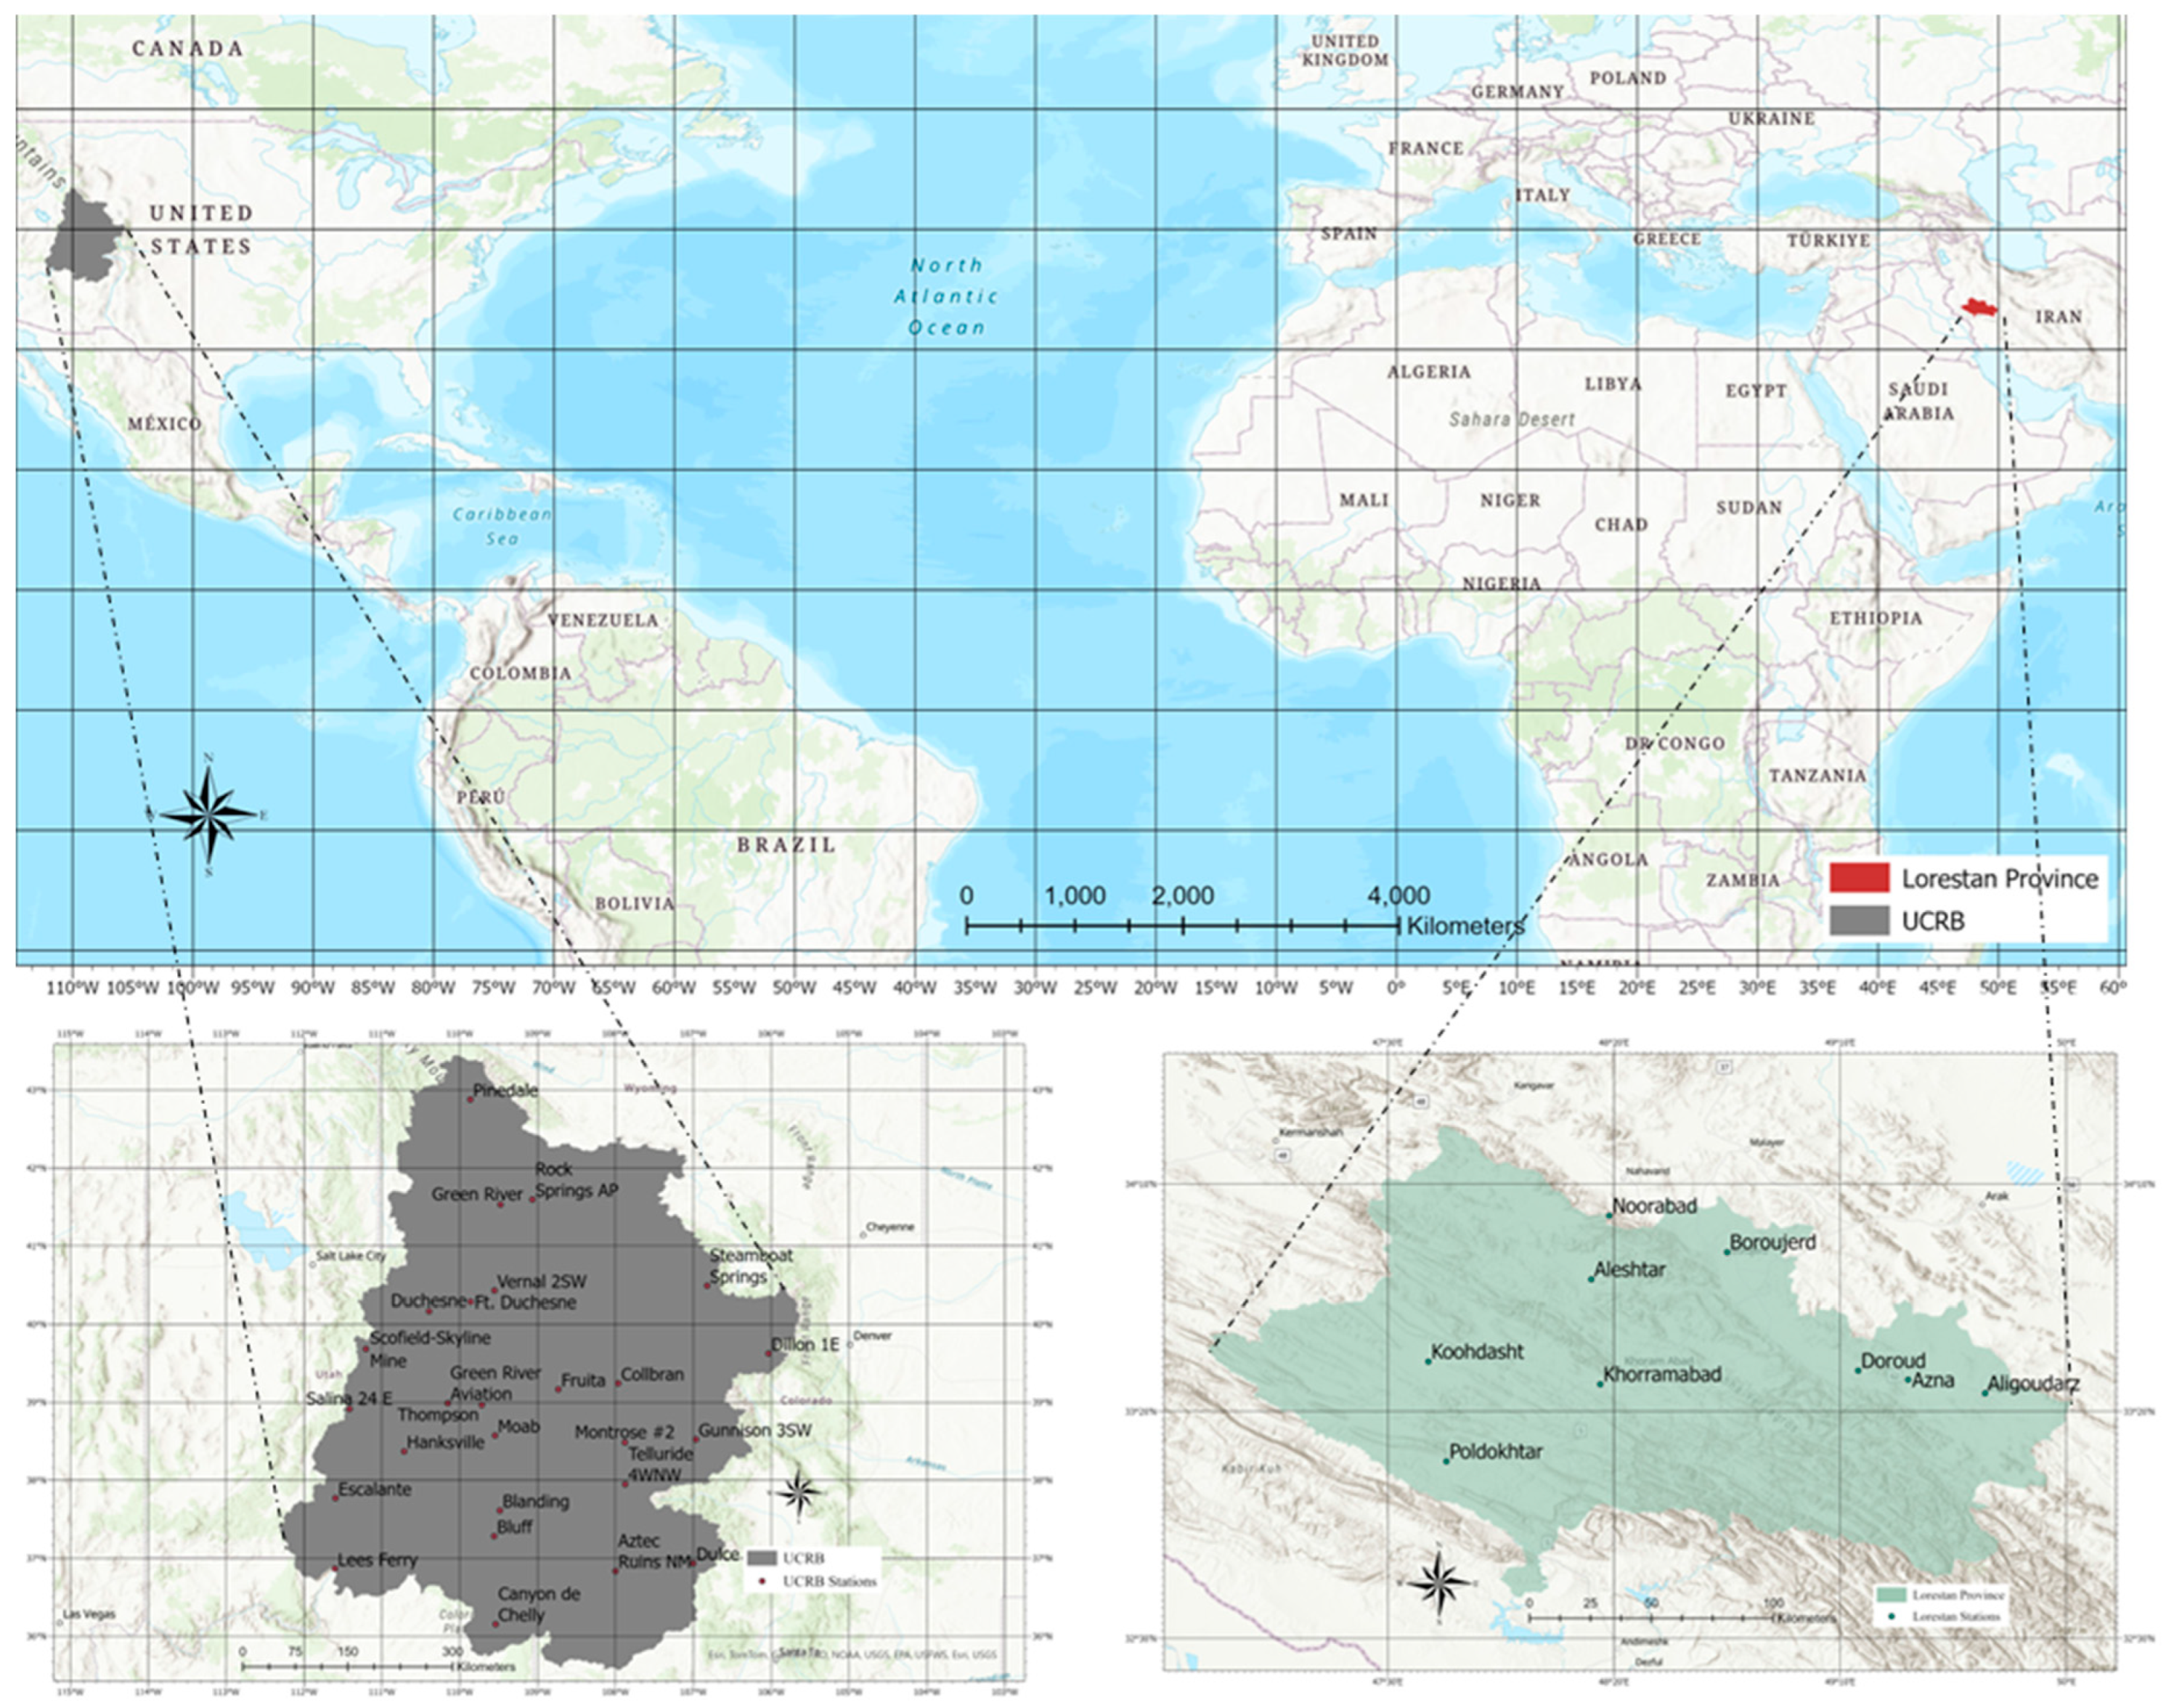
Figure 3.
Time series of monthly SPEI in Lorestan.
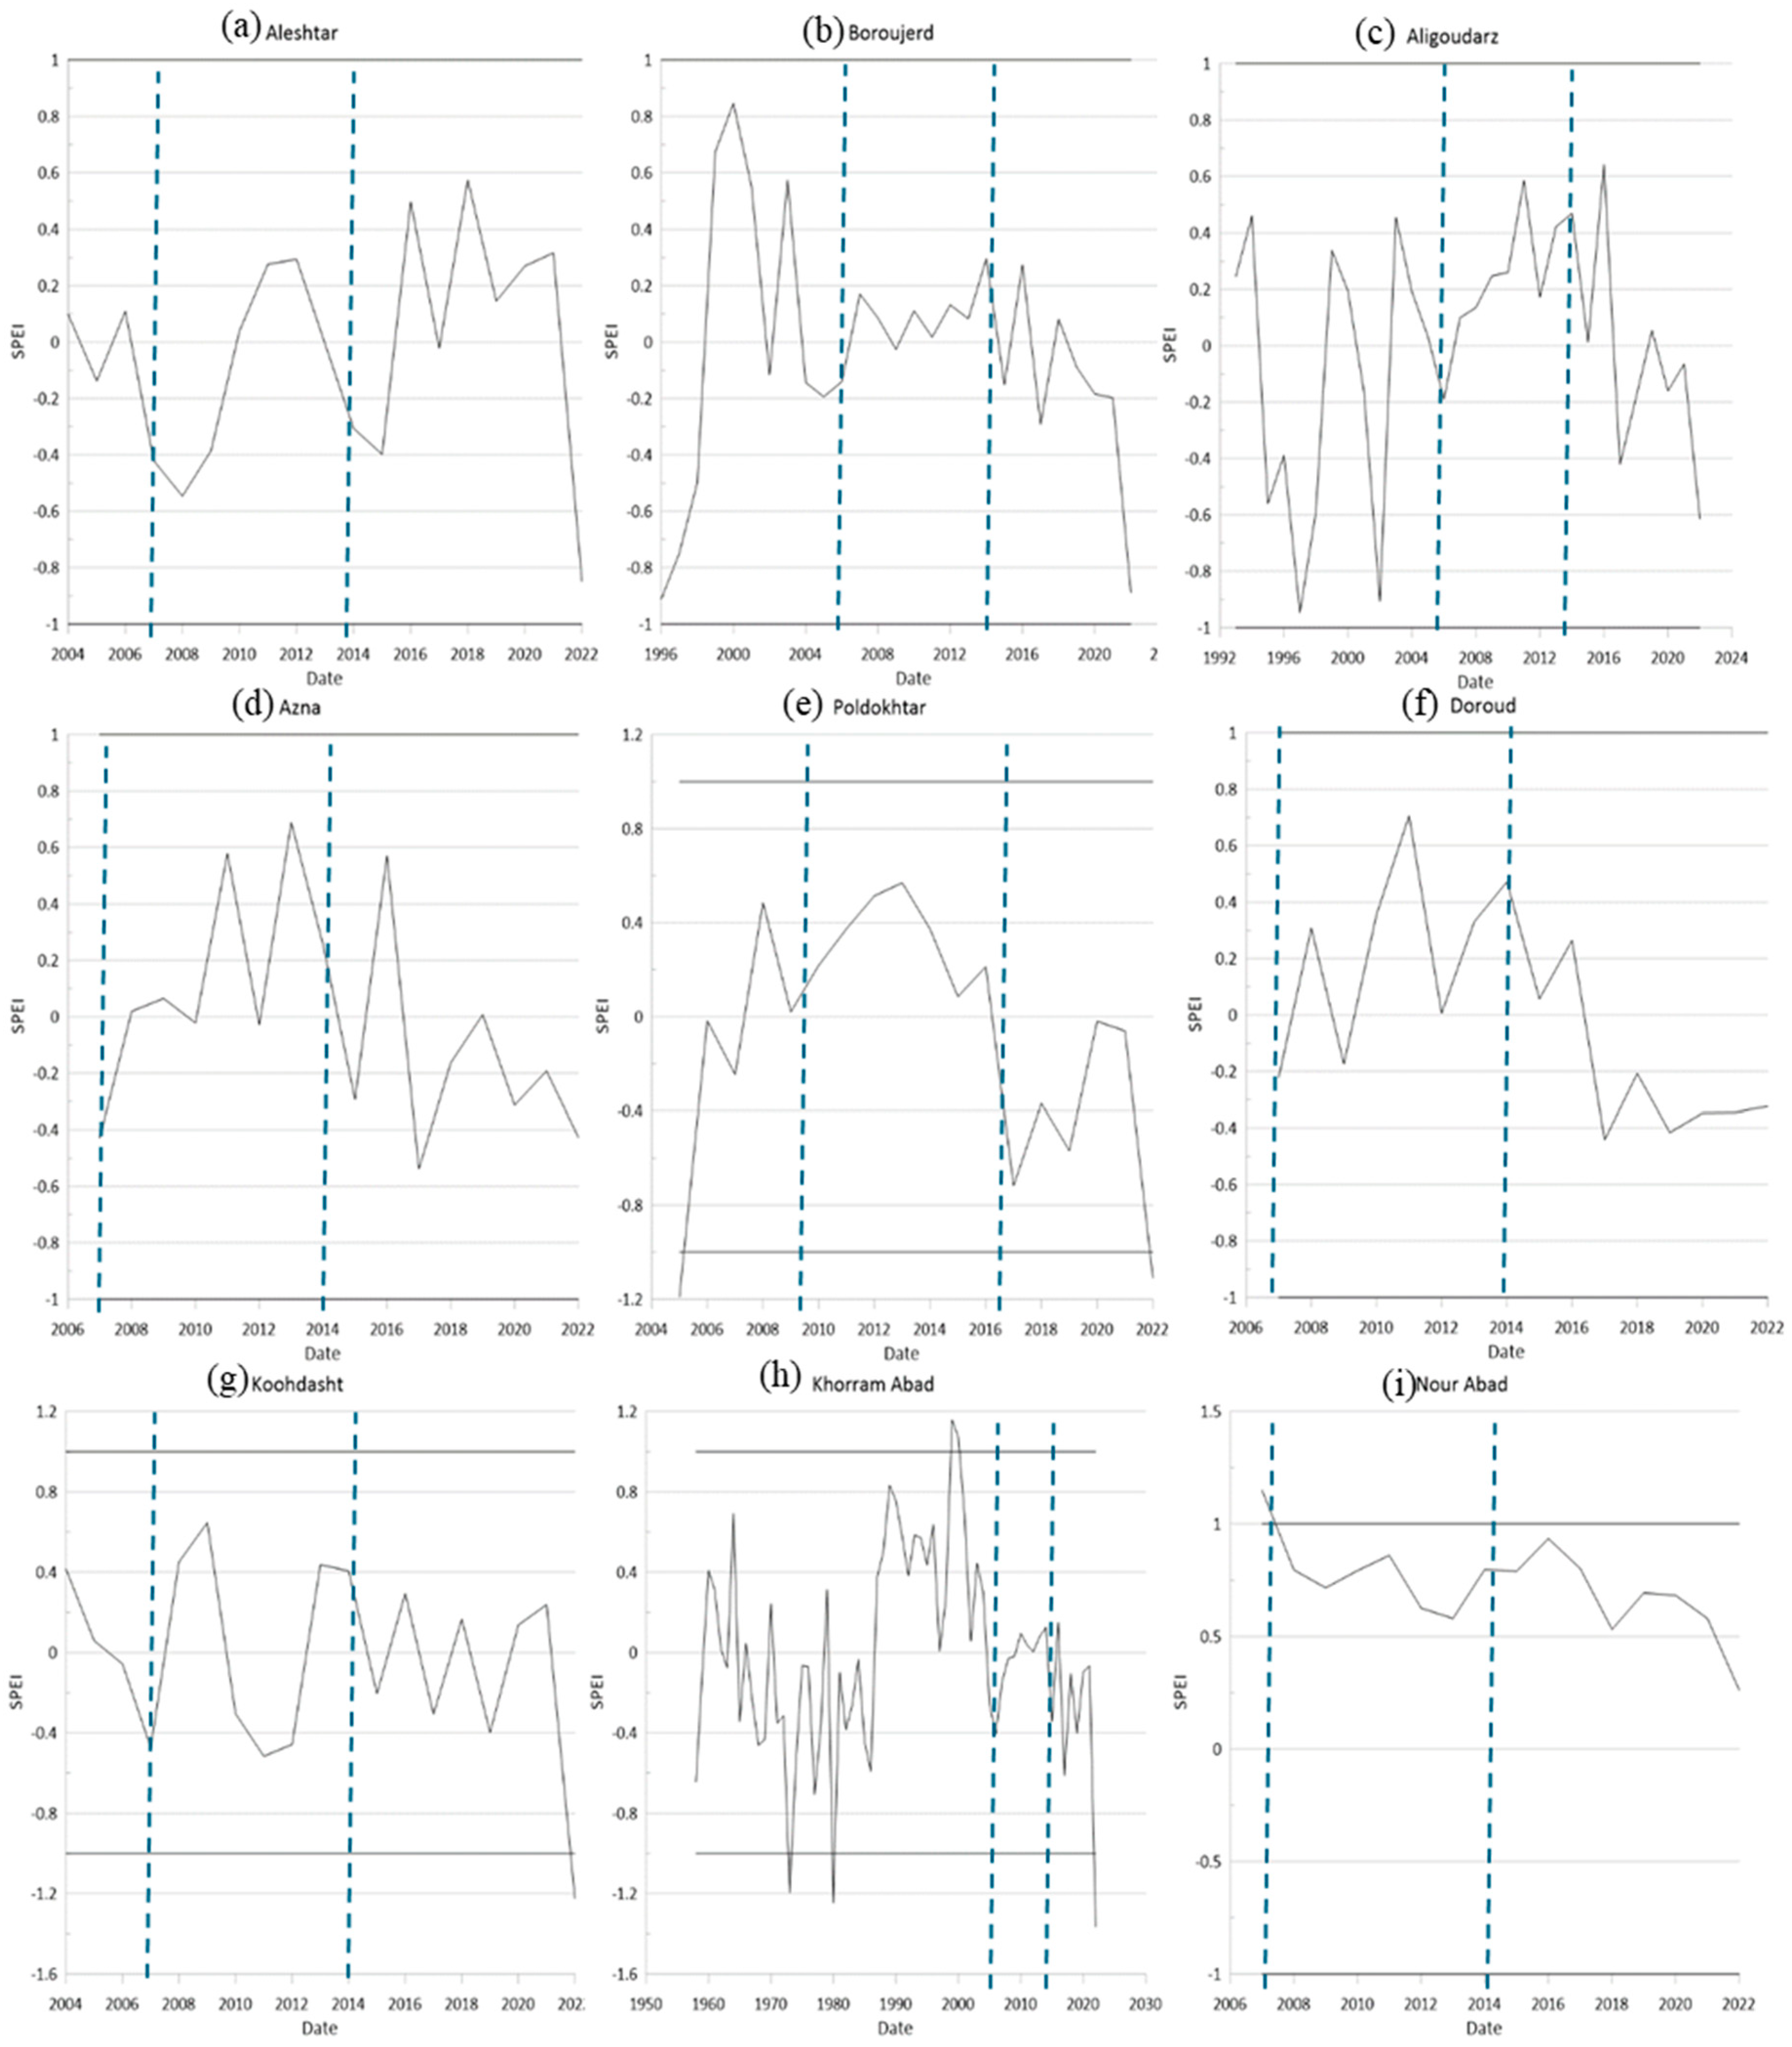
Figure 4.
Time series of monthly SPEI in Green and Bear Drainage, Colorado Drainage Basin, Uinta Basin, and Northern Mountains in UCRB.
Figure 4.
Time series of monthly SPEI in Green and Bear Drainage, Colorado Drainage Basin, Uinta Basin, and Northern Mountains in UCRB.
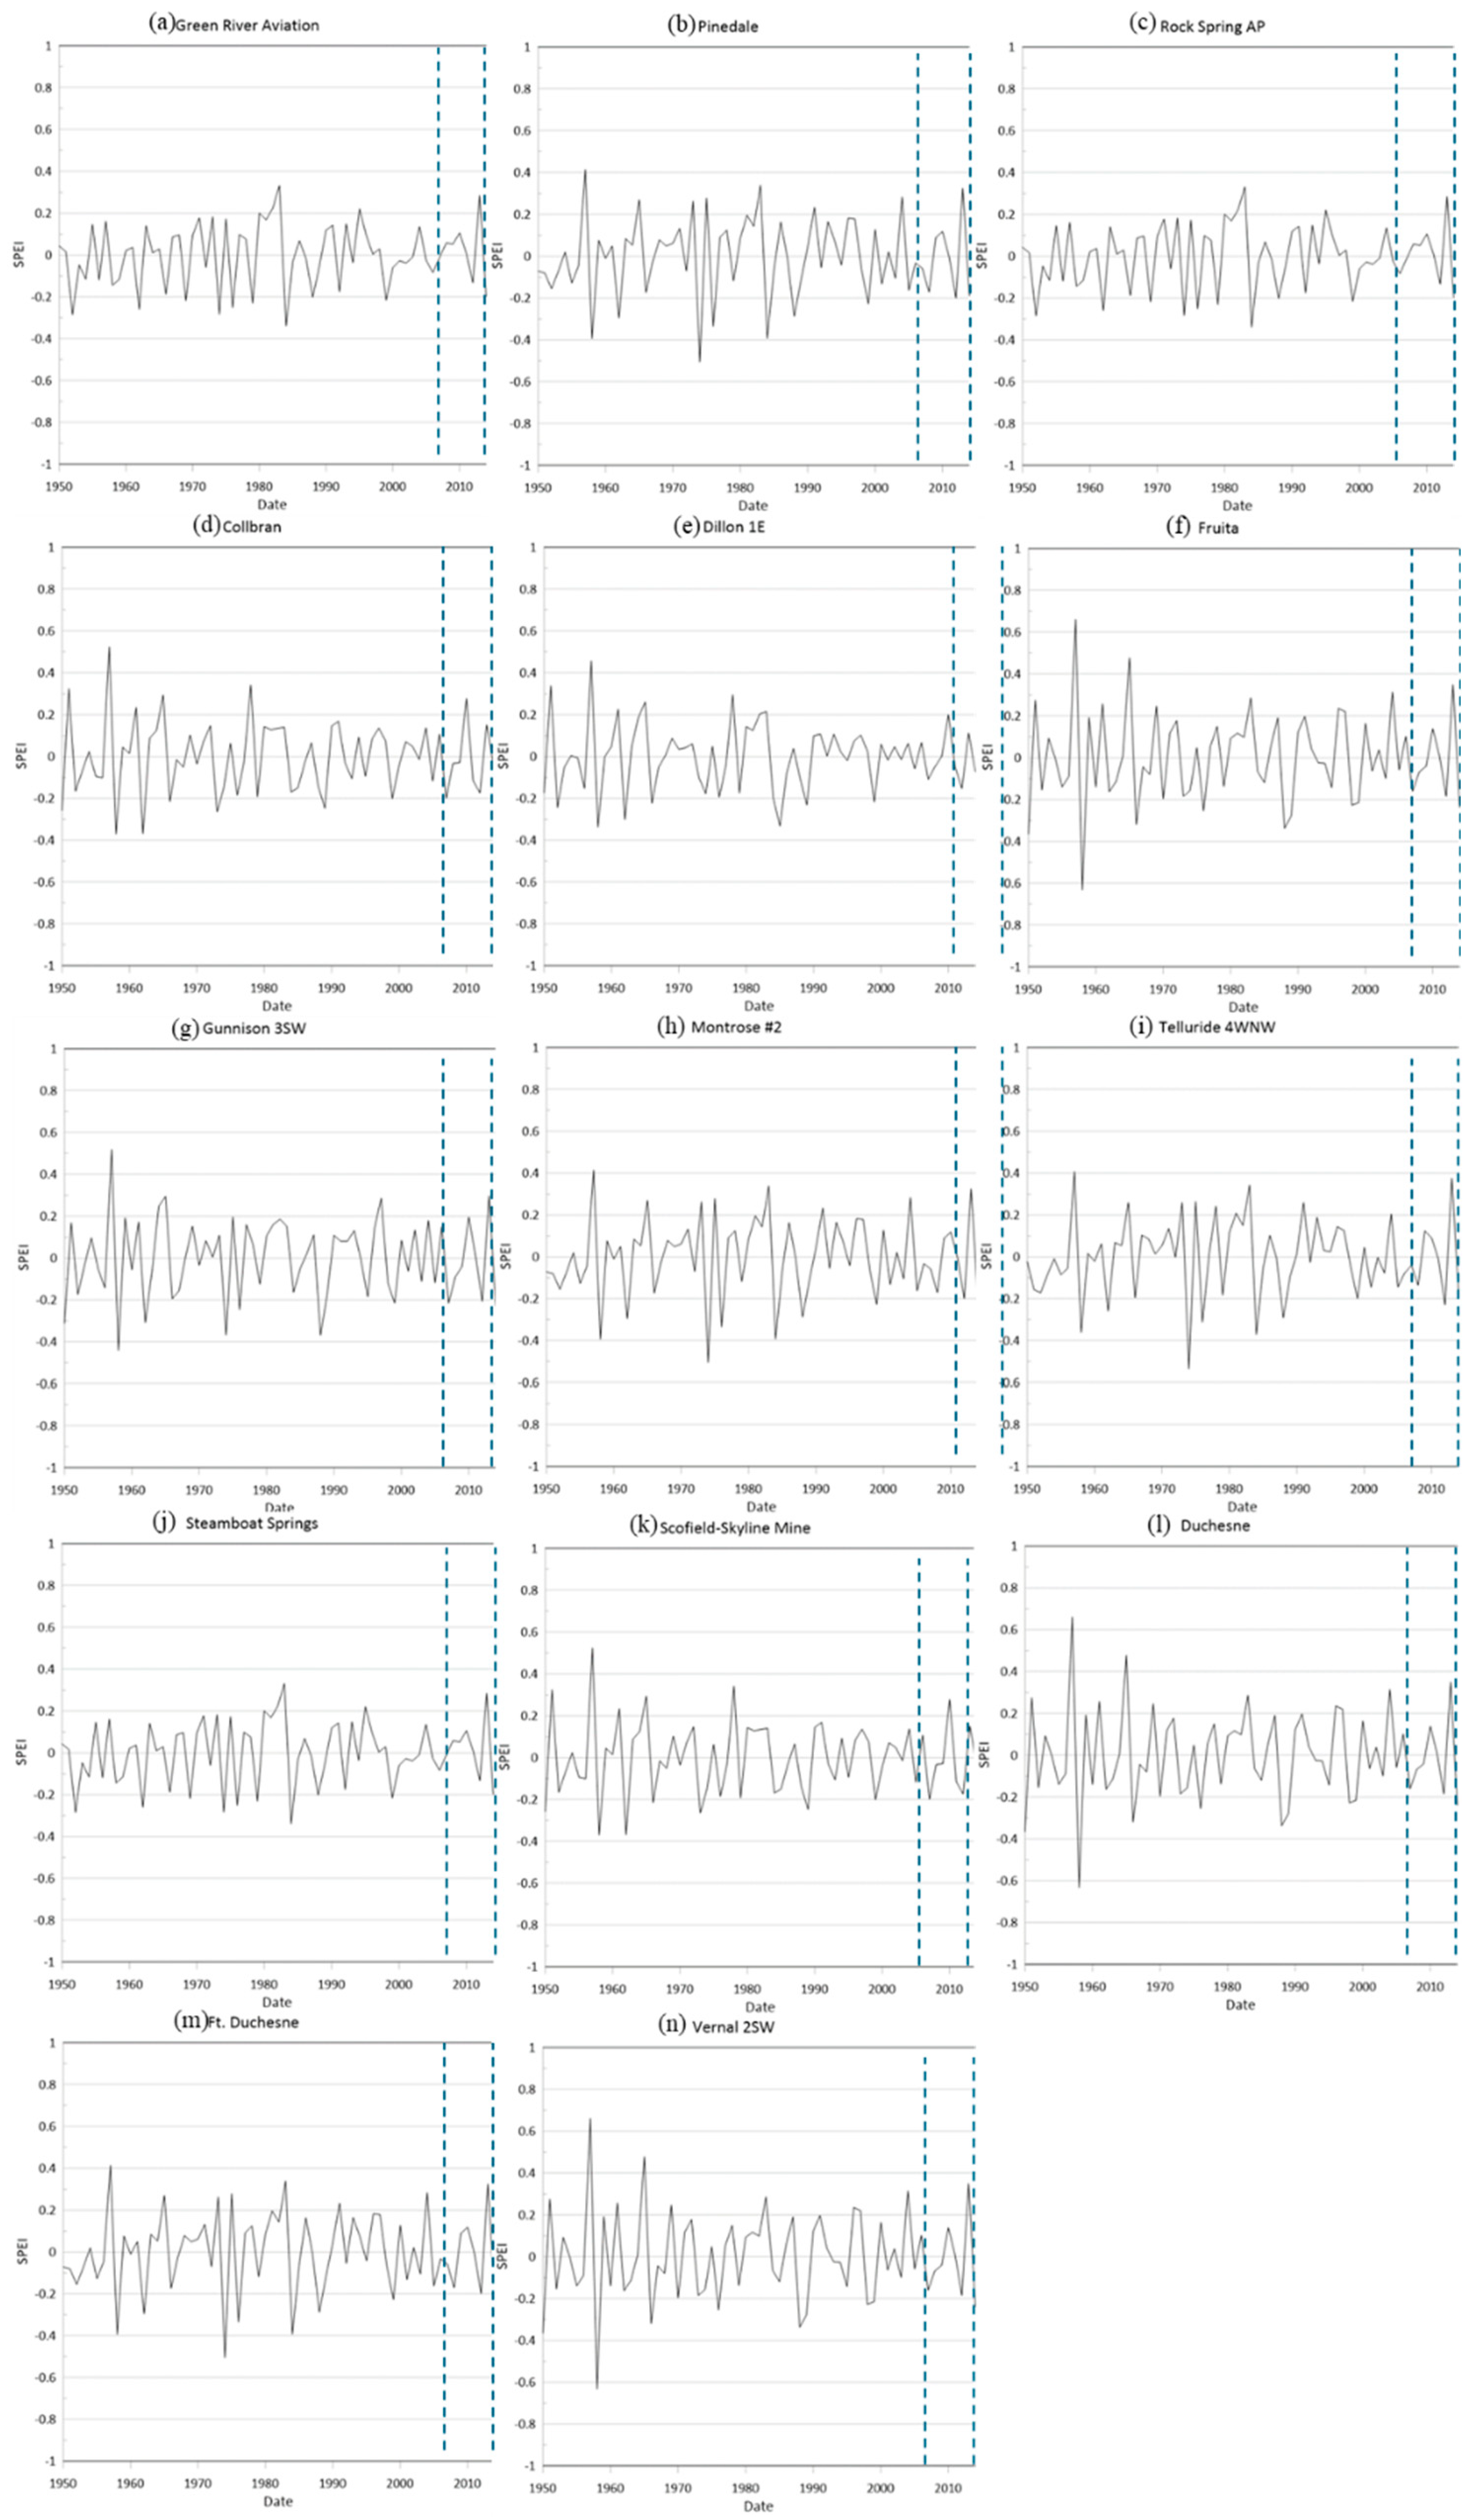
Figure 5.
Time series of monthly SPEI in Southeast, South Central, Northwestern Plateau, and Northeast in UCRB.
Figure 5.
Time series of monthly SPEI in Southeast, South Central, Northwestern Plateau, and Northeast in UCRB.
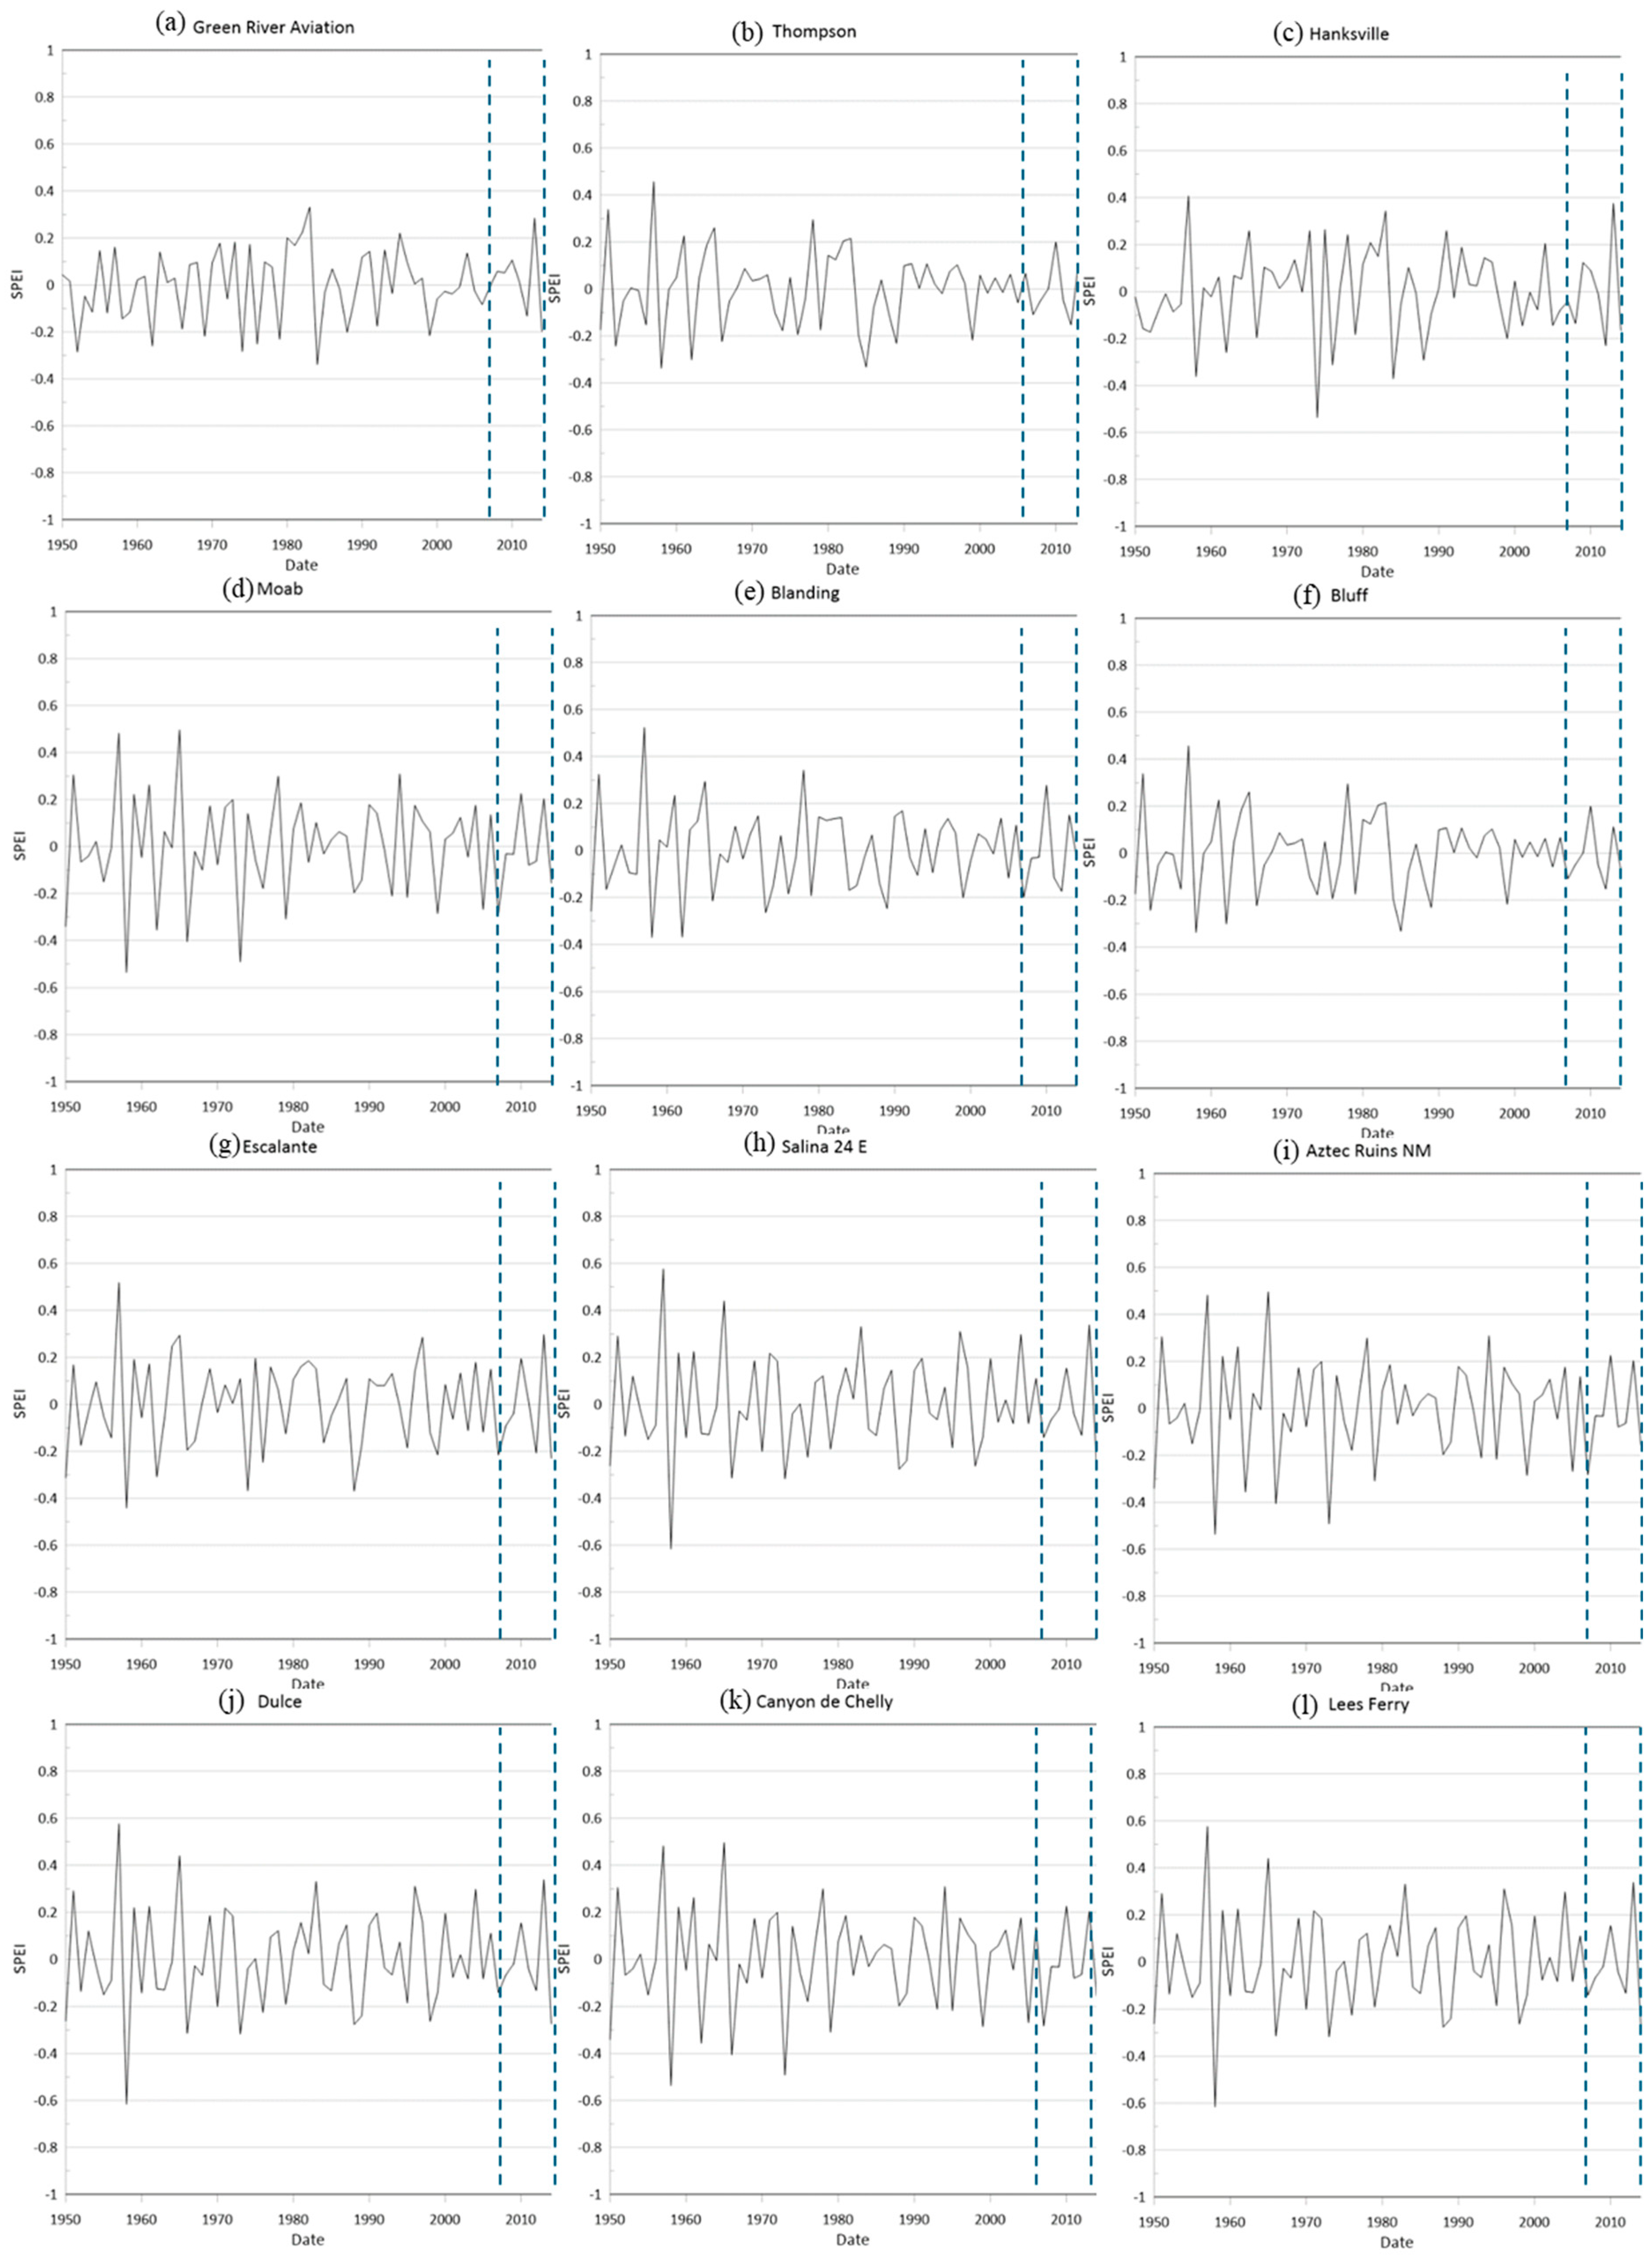
Figure 6.
Spatial distribution analysis of the Man-Kendall Z values and heatmaps of normalized Mann-Kendall Z values in (a) UCRB and (b) Lorestan.
Figure 6.
Spatial distribution analysis of the Man-Kendall Z values and heatmaps of normalized Mann-Kendall Z values in (a) UCRB and (b) Lorestan.
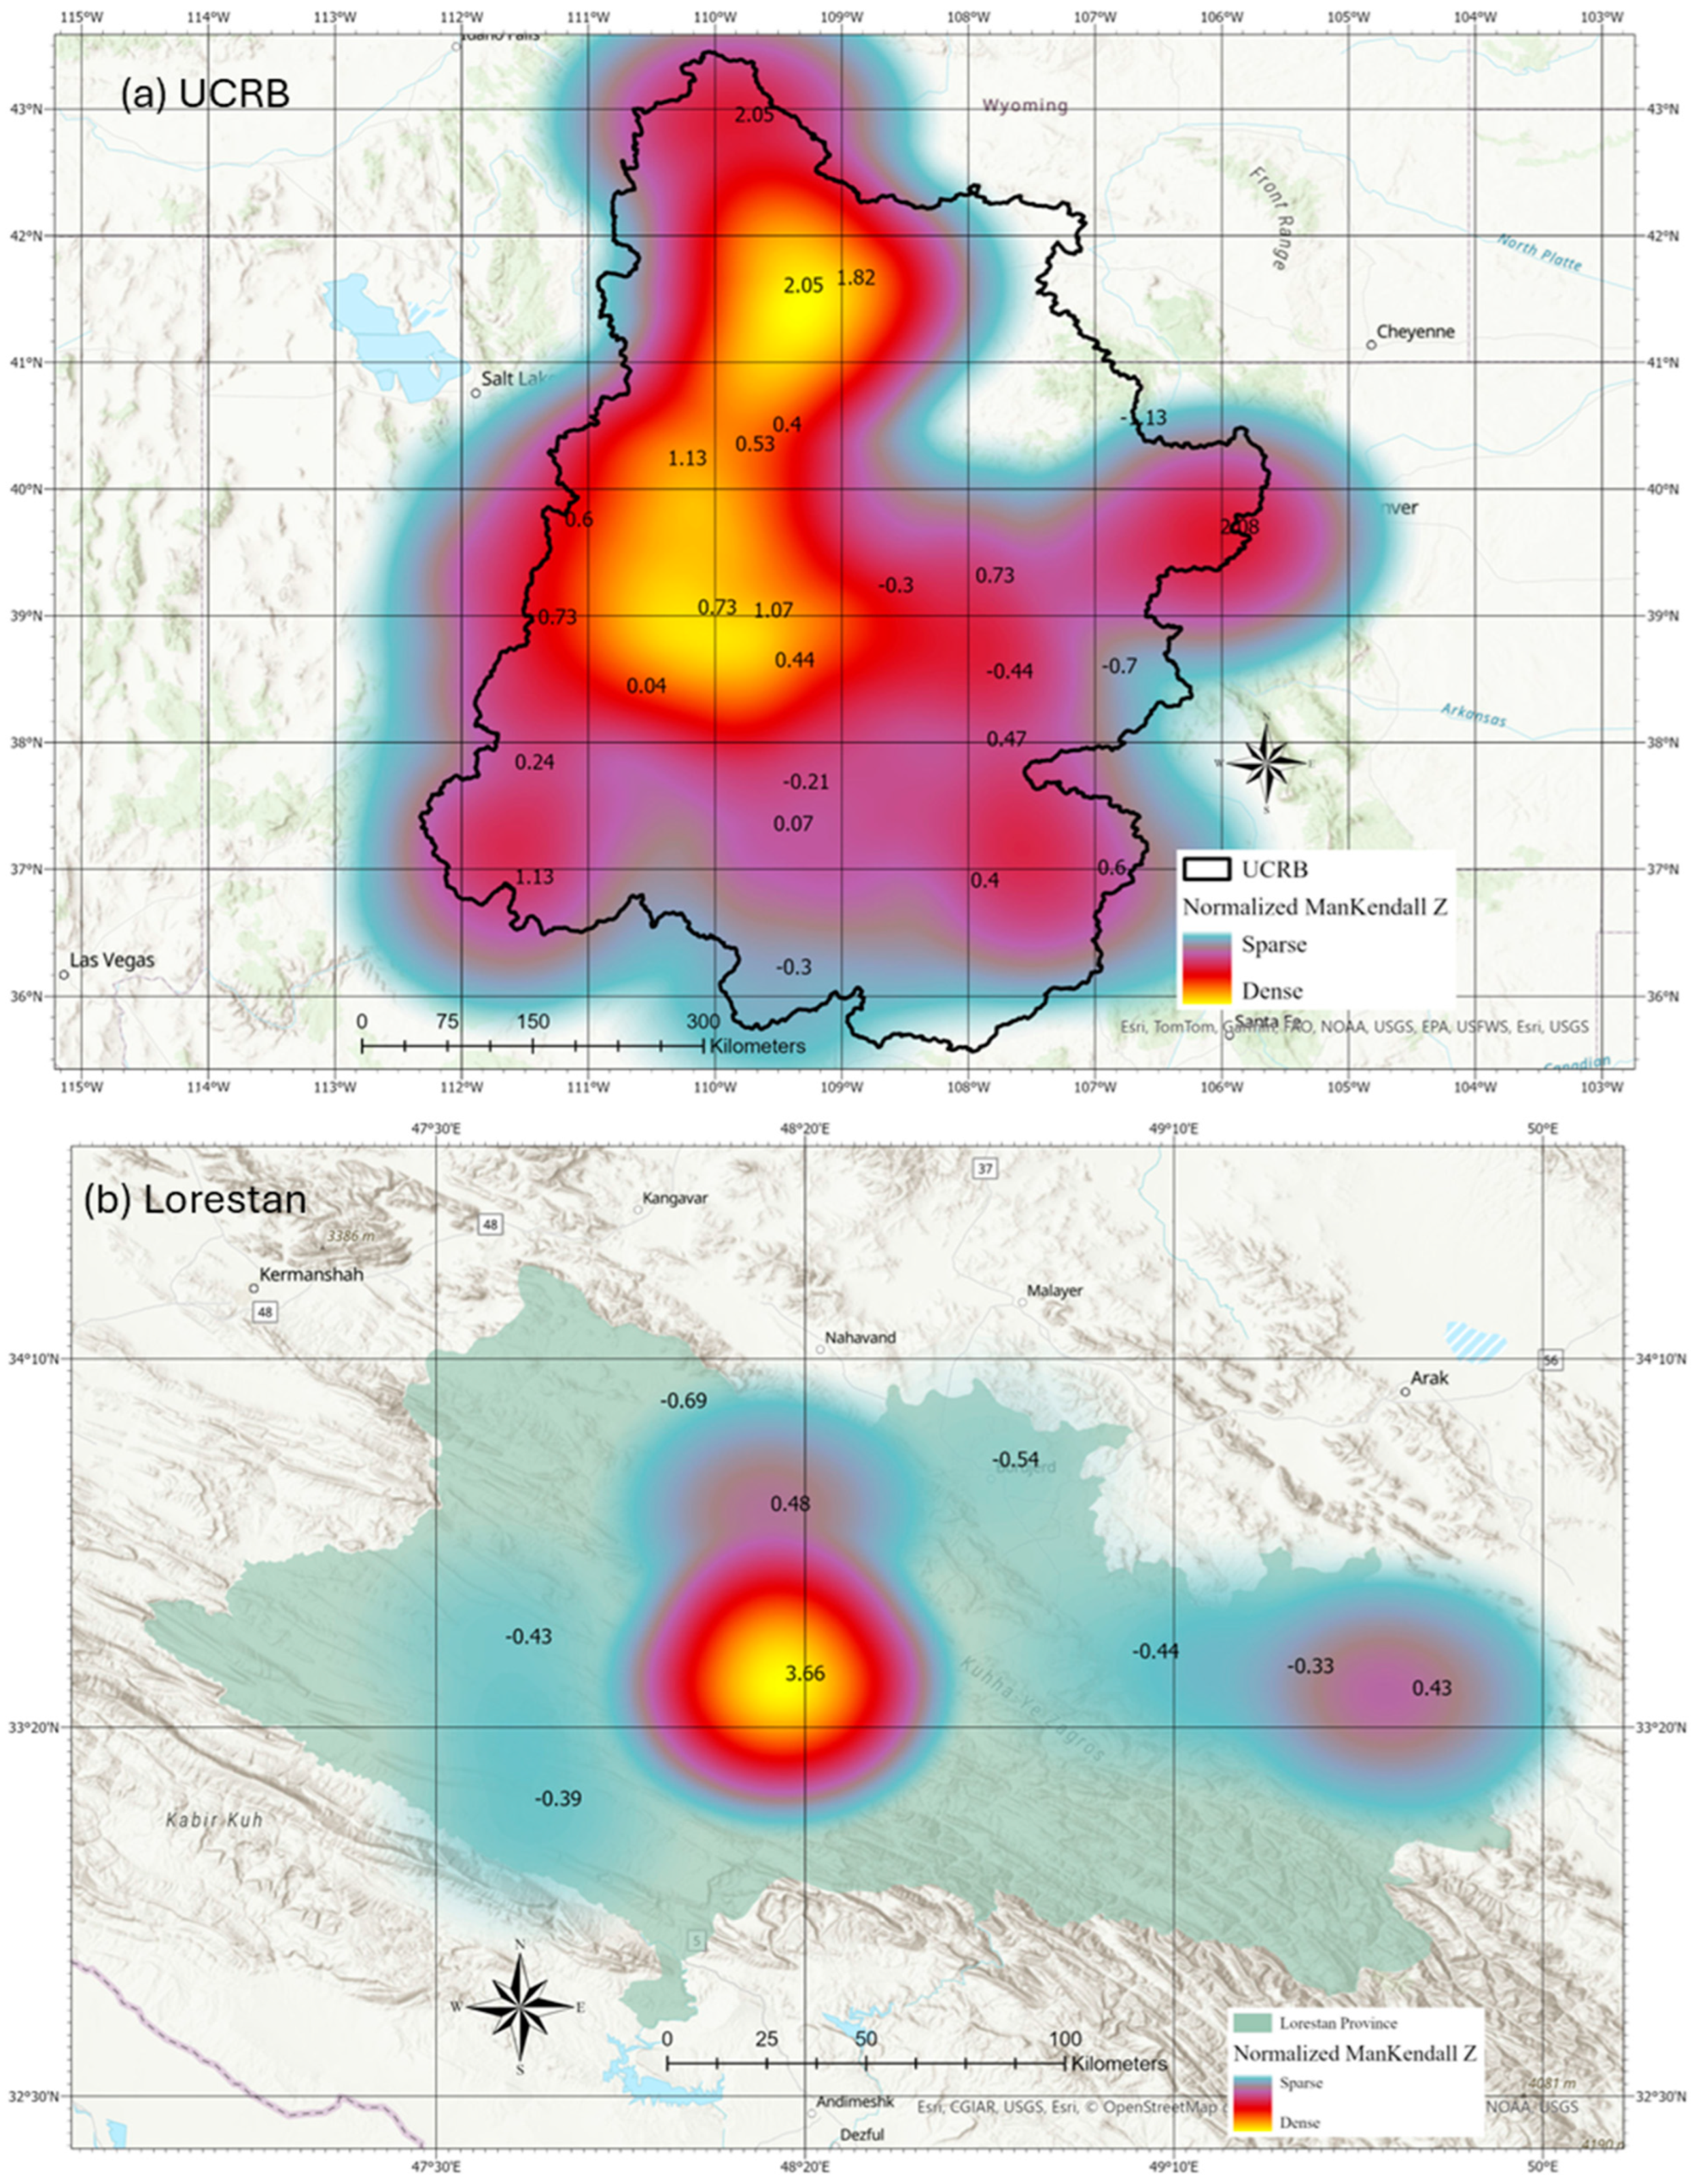
Figure 7.
Mann-Kendall Graph for monthly SPEI in Lorestan.
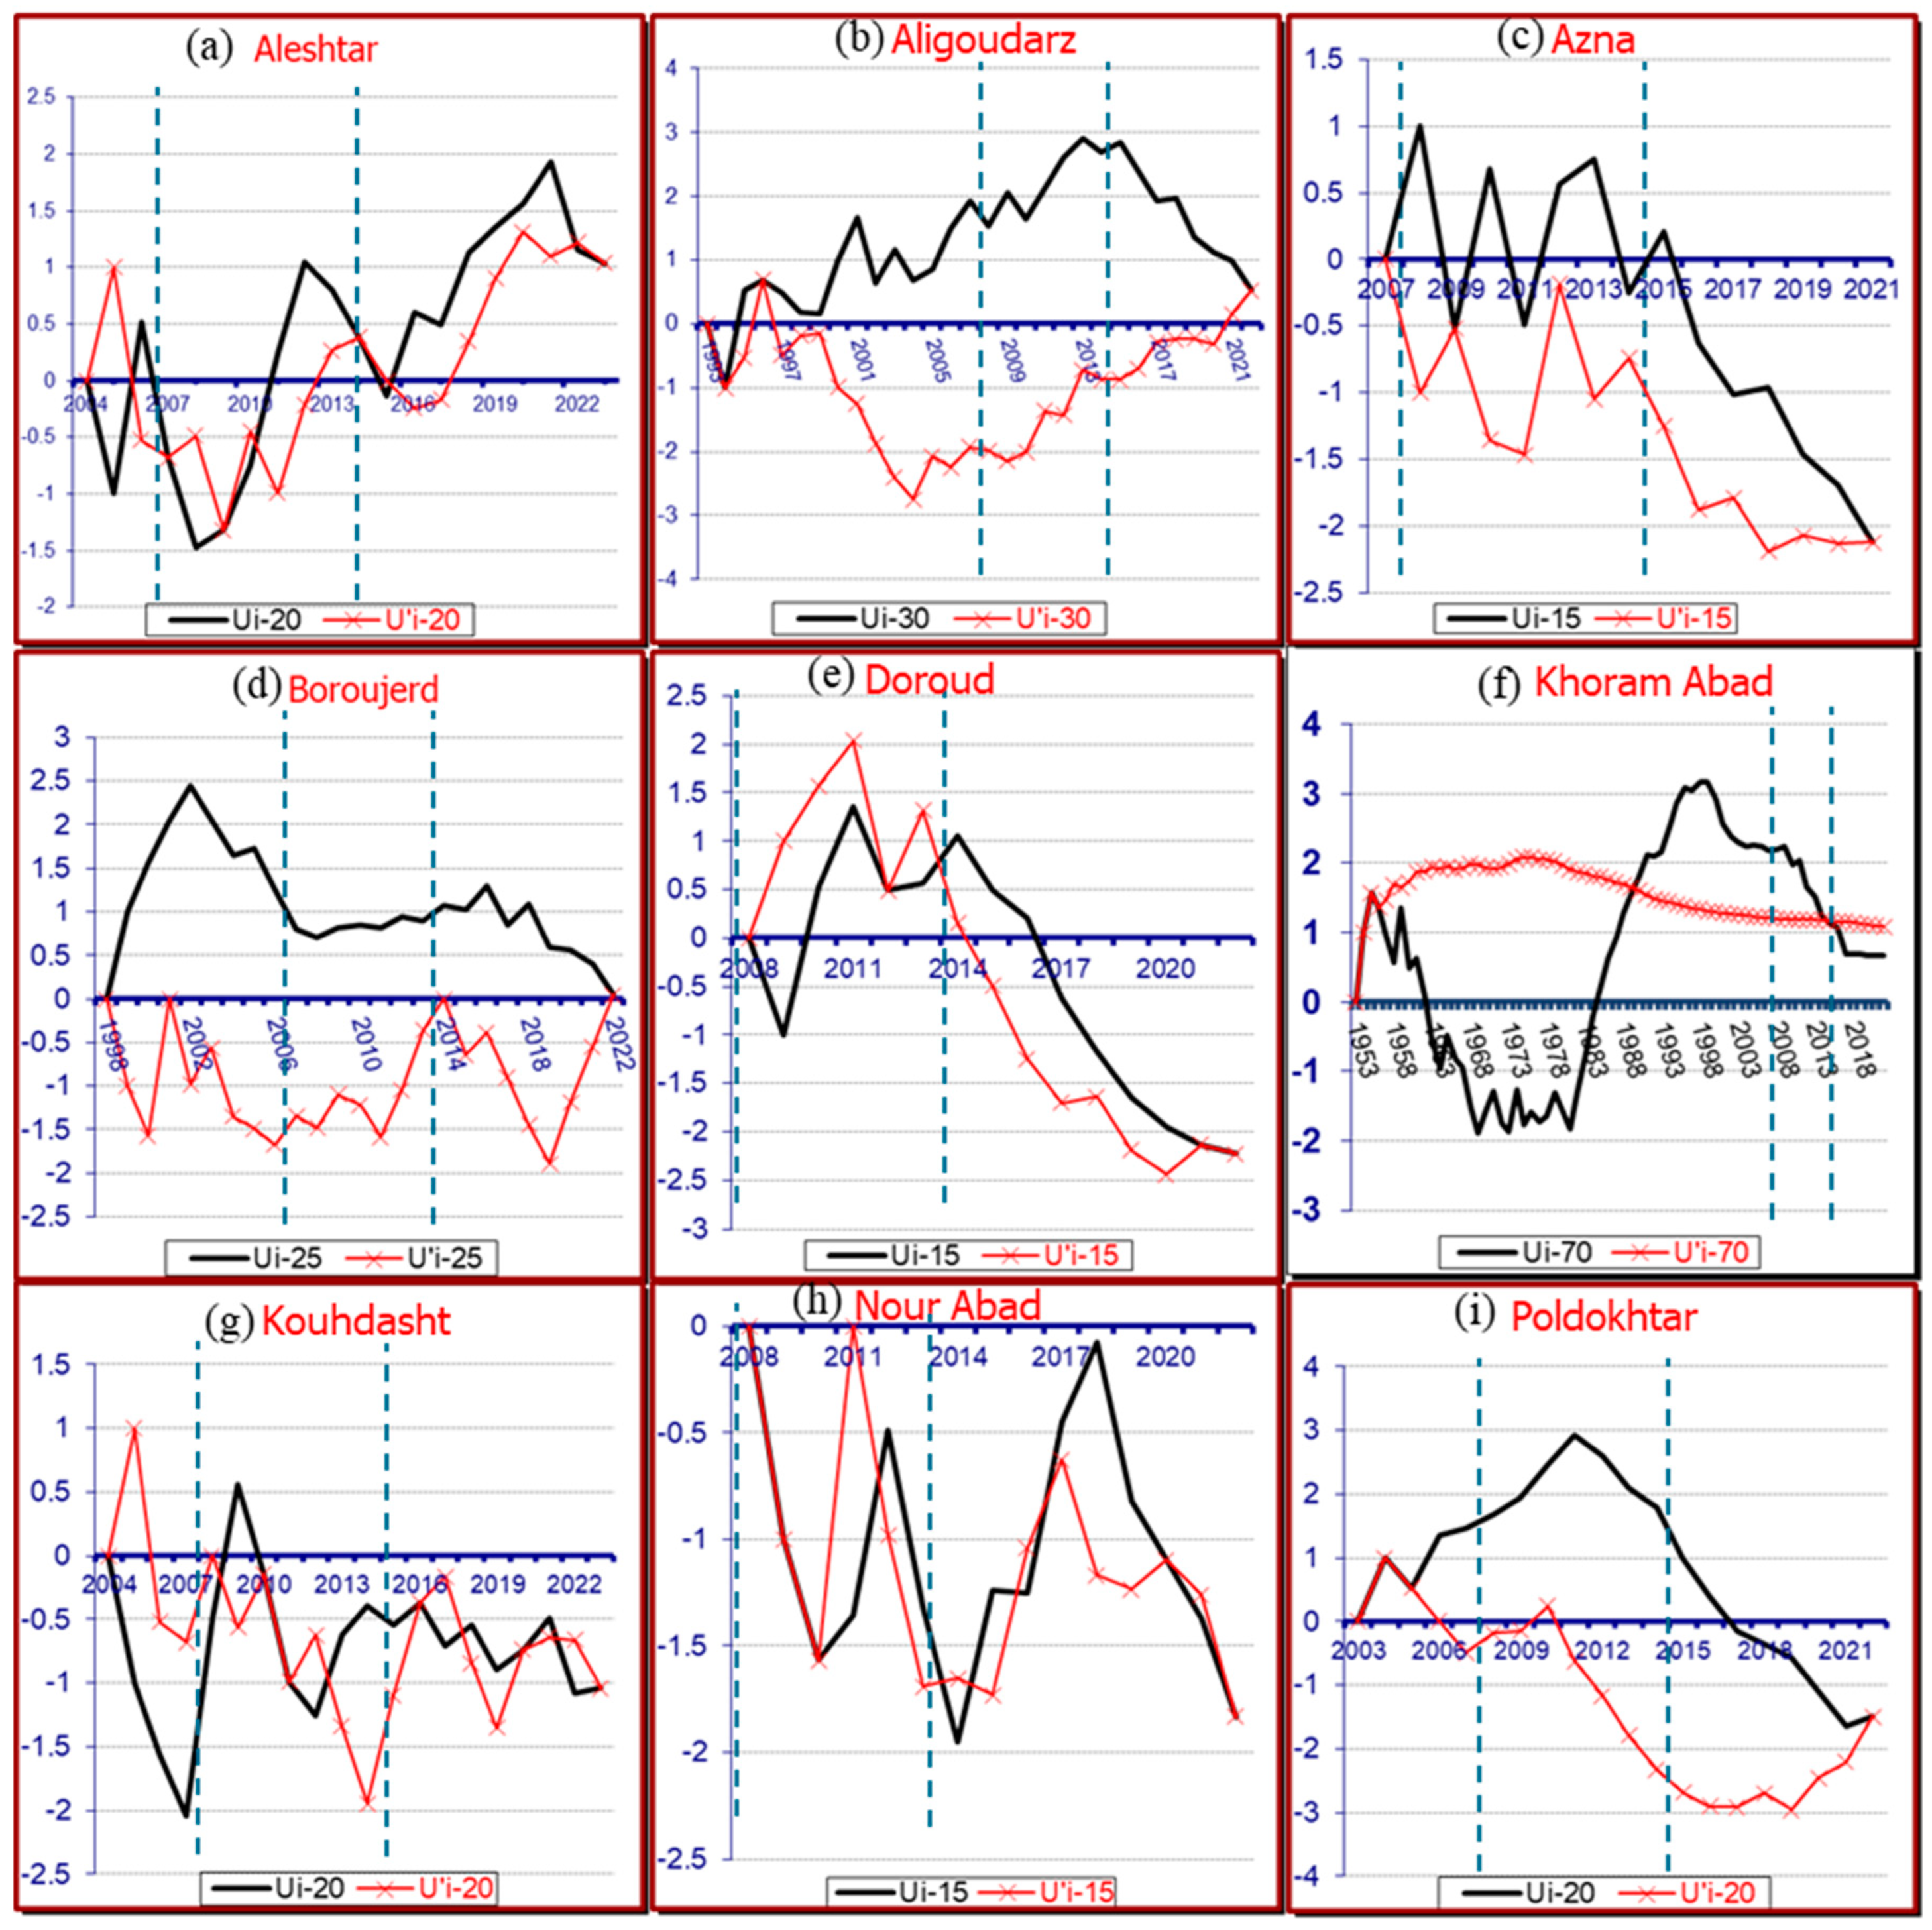
Figure 8.
Mann-Kendall ll Graph for monthly SPEI in Green and Bear Drainage, Colorado Drainage Basin, Uinta Basin, and Northern Mountains in UCRB.
Figure 8.
Mann-Kendall ll Graph for monthly SPEI in Green and Bear Drainage, Colorado Drainage Basin, Uinta Basin, and Northern Mountains in UCRB.
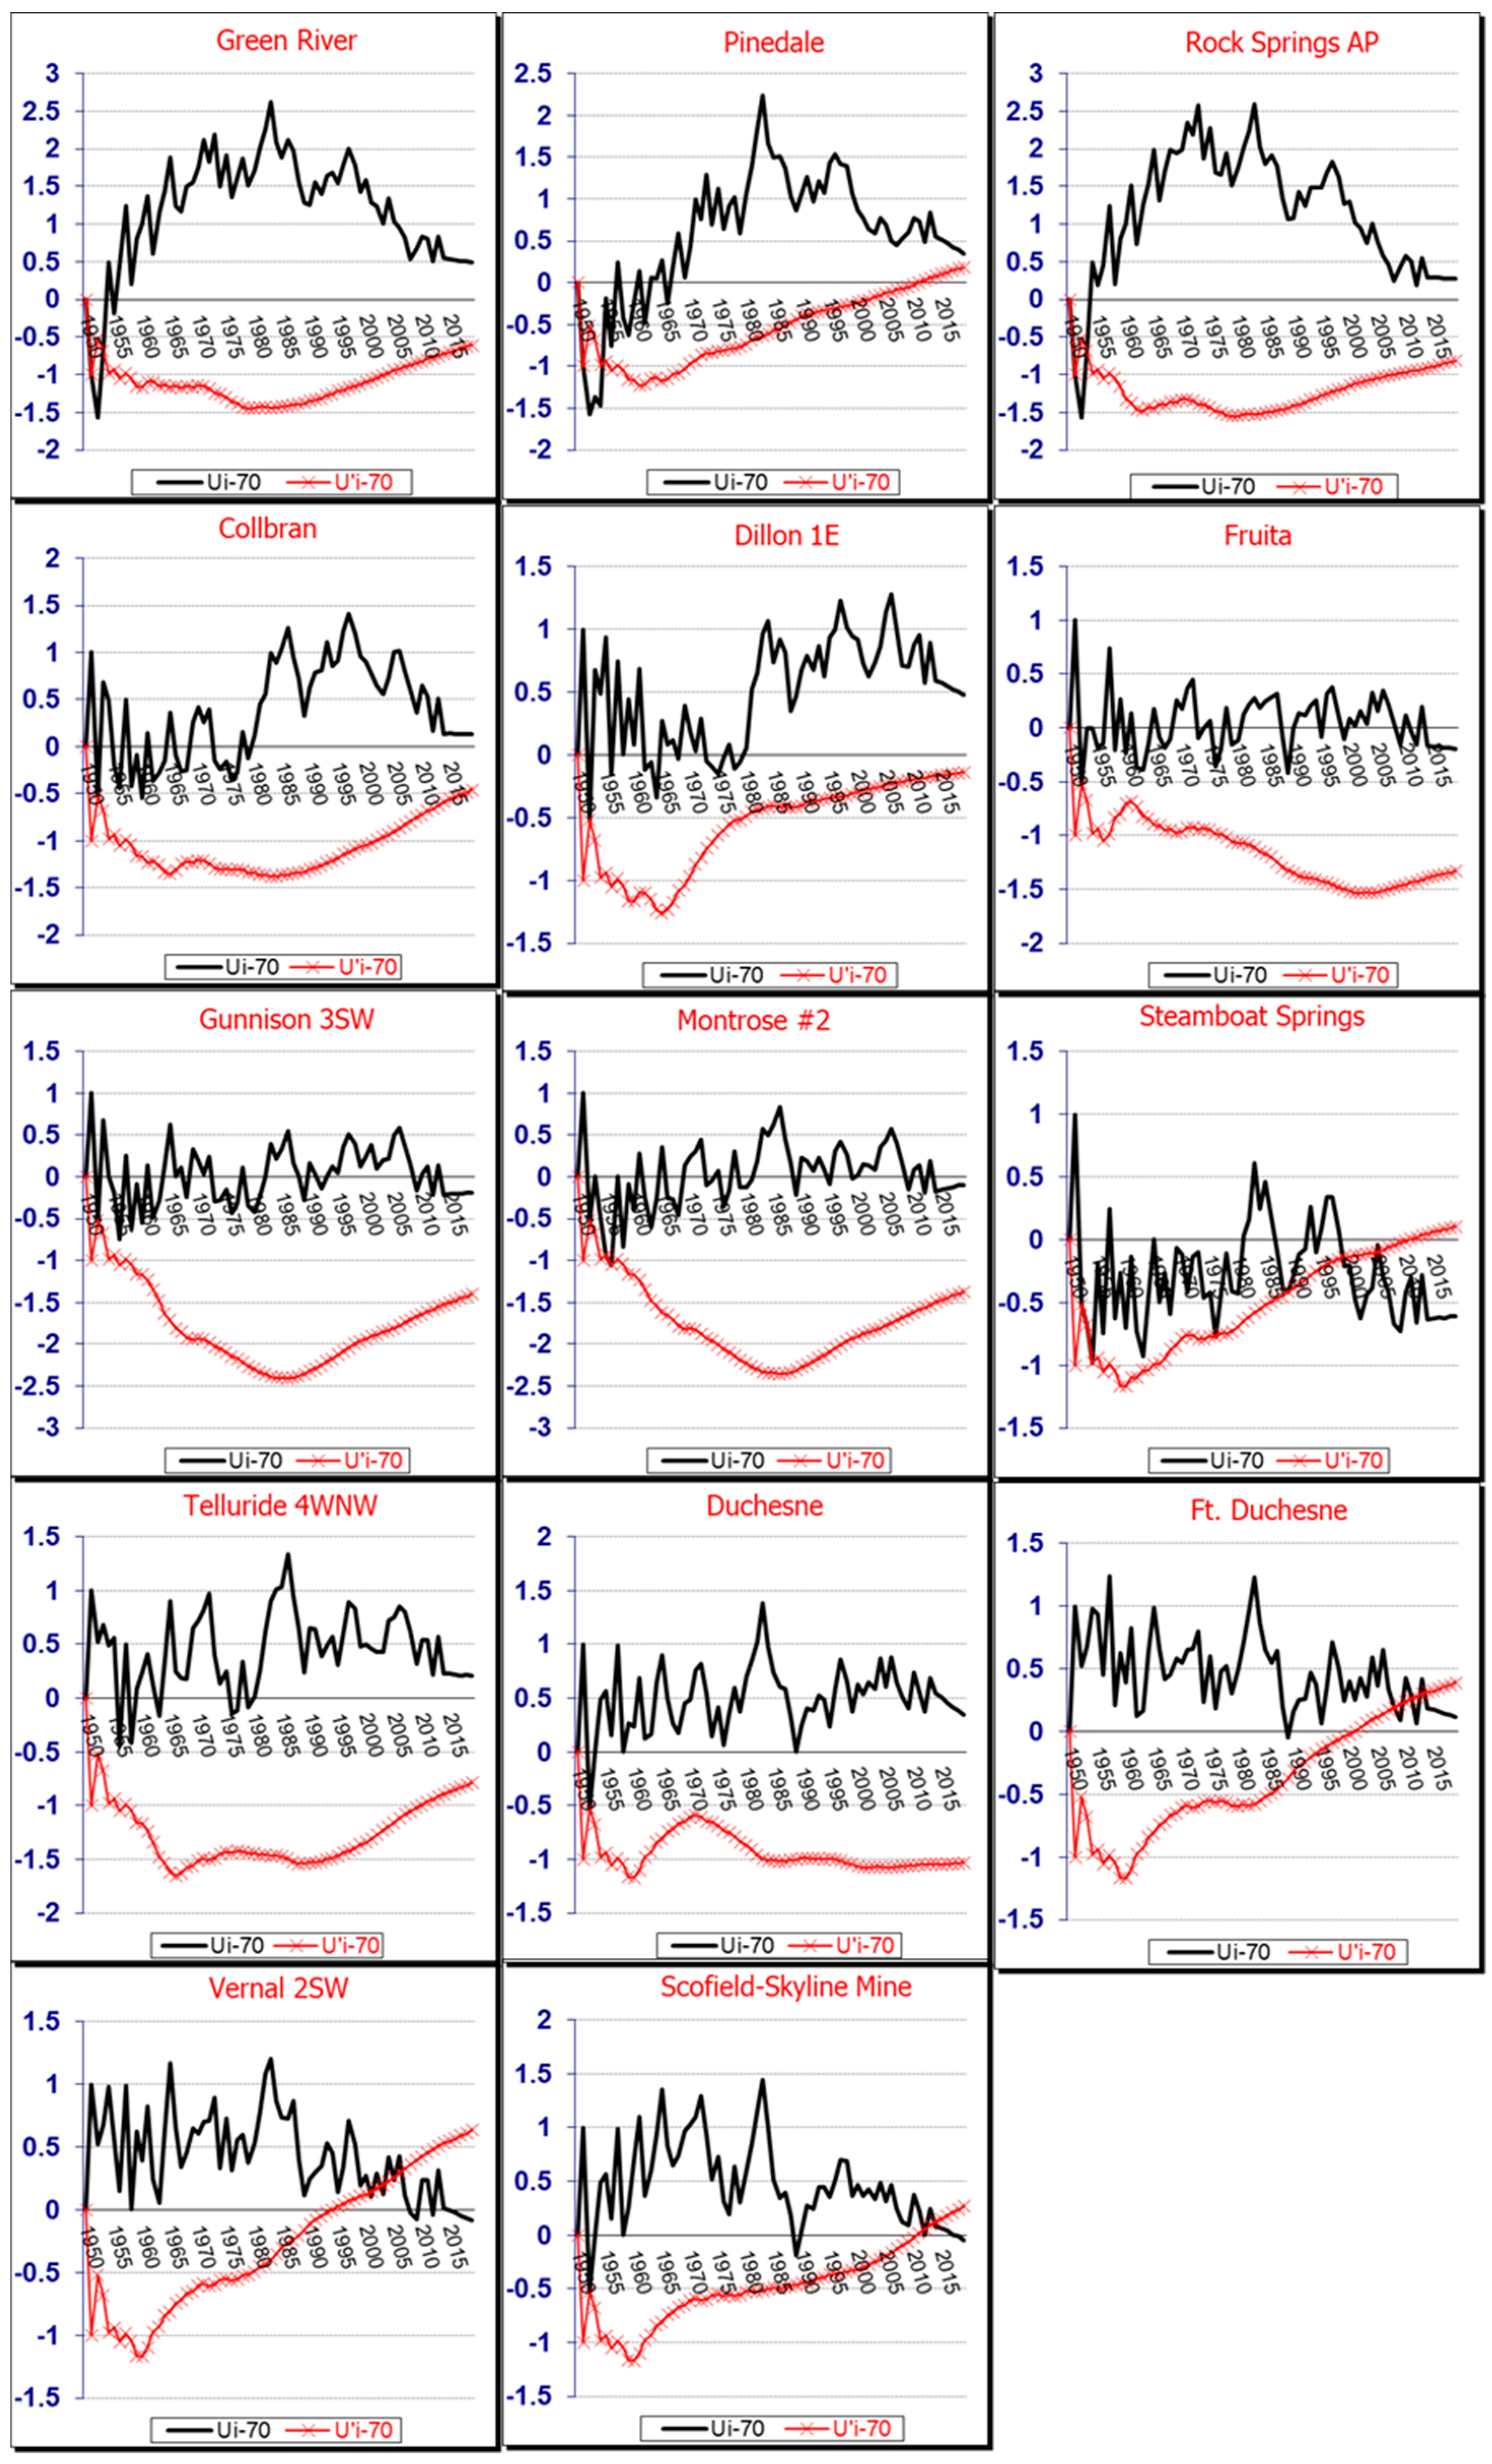
Figure 9.
Mann-Kendall Graph for monthly SPEI in Southeast, South Central, Northwestern Plateau, and Northeast in UCRB.
Figure 9.
Mann-Kendall Graph for monthly SPEI in Southeast, South Central, Northwestern Plateau, and Northeast in UCRB.
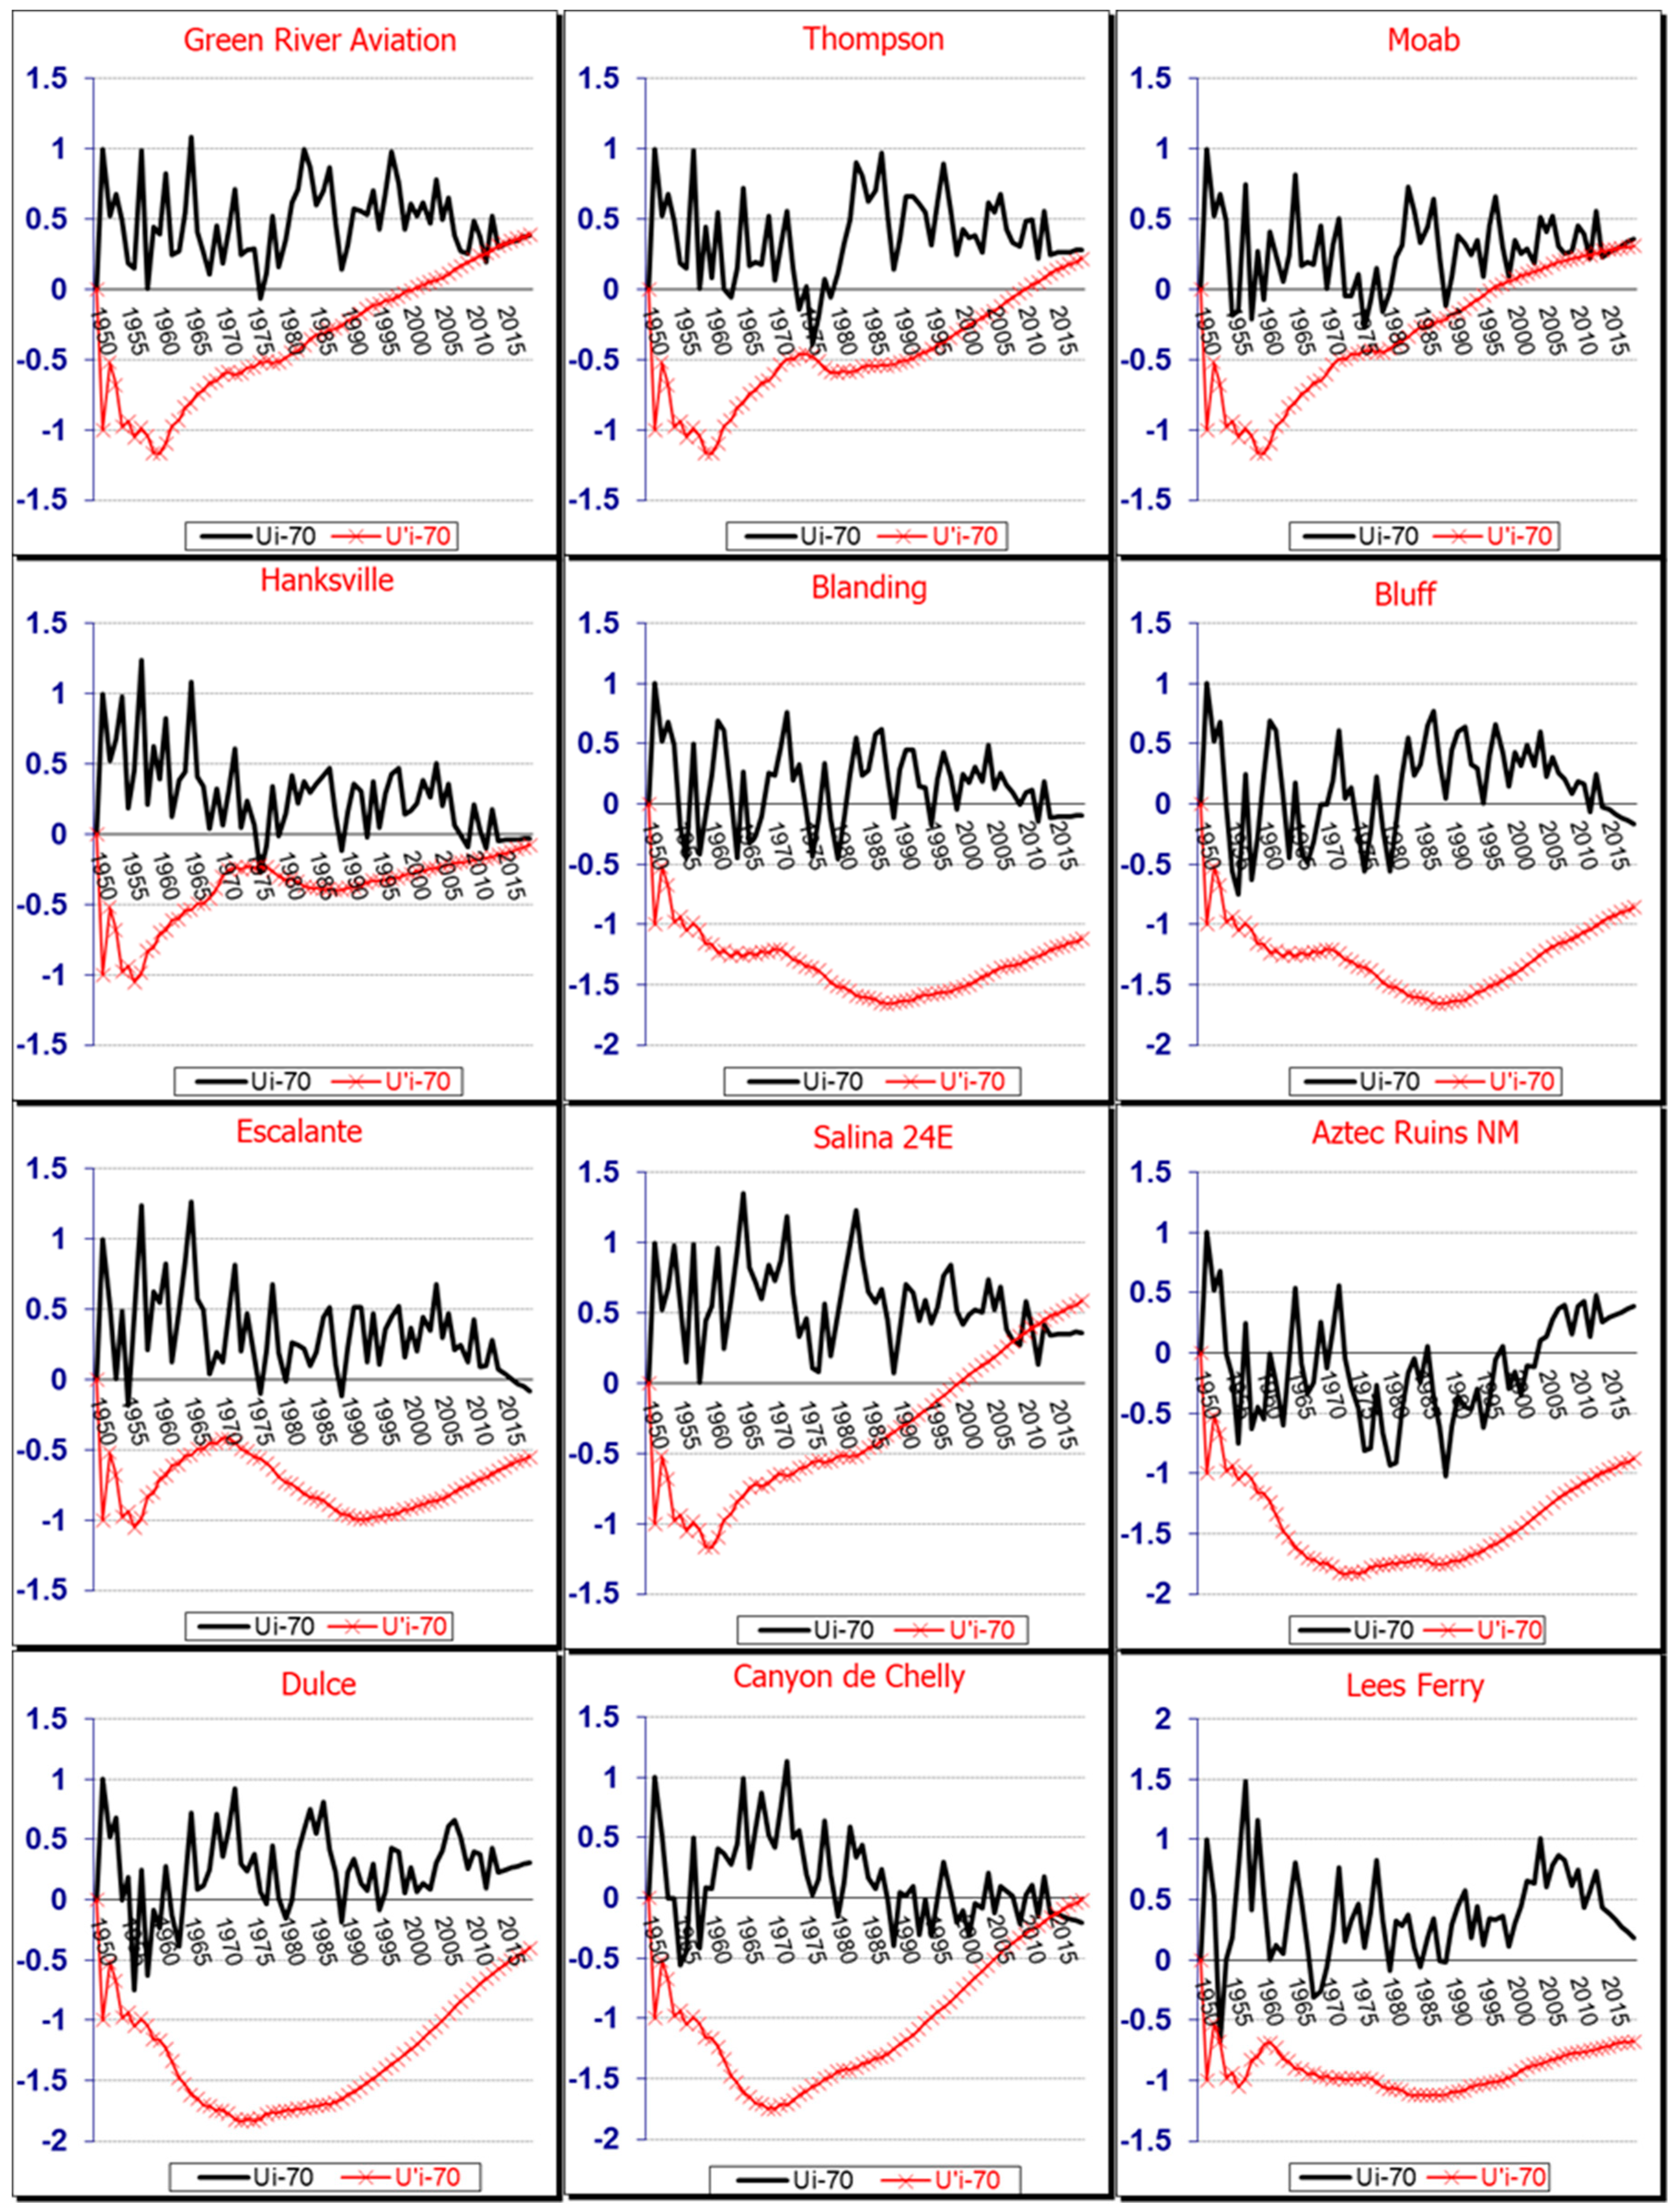

Table 1.
Geographical characteristics of stations in the UCRB and the climate divisions (CDs).
| CD Name | CD ID | Station Name | State | Elevation (m) | Longitude | Latitude |
| Green and bear drainage | 4803 | Green River | WY | 1852.3 | -109.4767 | 41.5314 |
| Pinedale | WY | 2193 | -109.8642 | 42.8797 | ||
| Rock Springs AP | WY | 2055 | -109.0653 | 41.5942 | ||
| Colorado Drainage Basin | 502 | Collbran | CO | 1822.7 | -107.9631 | 39.2425 |
| Dillon 1E | CO | 2763 | -106.0353 | 39.6261 | ||
| Fruita | CO | 1378.9 | -108.7331 | 39.1653 | ||
| Gunnison 3SW | CO | 2323.8 | -106.9675 | 38.5258 | ||
| Montrose #2 | CO | 1764.5 | -107.8792 | 38.4858 | ||
| Steamboat Springs | CO | 2094 | -106.8233 | 40.4883 | ||
| Telluride 4WNW | CO | 2643.2 | -107.8733 | 37.9492 | ||
| Uinta Basin | 4206 | Duchesne | UT | 1682.5 | -110.395 | 40.1678 |
| Ft. Duchesne | UT | 1539.2 | -109.8611 | 40.2842 | ||
| Vernal 2SW | UT | 1668.5 | -109.5531 | 40.4269 | ||
| Northern Mountains | 4205 | Scofield-Skyline Mine | UT | 2655.4 | -111.2047 | 39.6847 |
| Southeast | 4207 | Green River Aviation | UT | 1240.5 | -110.1544 | 38.9906 |
| Thompson | UT | 1554.2 | -109.7167 | 38.9667 | ||
| Moab | UT | 1242.7 | -109.5458 | 38.5744 | ||
| Hanksville | UT | 1313.1 | -110.7153 | 38.3706 | ||
| Blanding | UT | 1854.7 | -109.4847 | 37.6131 | ||
| Bluff | UT | 1318 | -109.5578 | 37.2828 | ||
| South Central | 4204 | Escalante | UT | 1770.9 | -111.5978 | 37.7686 |
| Salina 24 E | UT | 2304.3 | -111.4161 | 38.9139 | ||
| Northwestern Plateau | 2901 | Aztec Ruins NM | NM | 1720.3 | -108.0006 | 36.835 |
| Dulce | NM | 2070.5 | -107 | 36.9358 | ||
| Northeast | 202 | Canyon de Chelly | AZ | 1709.9 | -109.5394 | 36.1533 |
| Lees Ferry | AZ | 978.4 | -111.6022 | 36.8644 |
Table 2.
Geographical and climatic characteristics of synoptic stations in Lorestan province.
| Climate types (Emberger) | Station name | Mean Precipitation (mm) | Tmean | Tmax | TMin | Elevation (m) | Longitude | Latitude |
| Cold Semi-Dry | Aleshtar | 444.7 | 13 | 19.32 | 6 | 1567 | 48° 15′ | 33° 49′ |
| Boroujerd | 456.4 | 16.75 | 22.42 | 10.03 | 1629 | 48° 45′ | 33° 35′ | |
| Azna | 411.6 | 13.73 | 22.17 | 3.3 | 1872 | 49° 25′ | 33° 27′ | |
| Poldokhtar | 360.1 | 23.3 | 29.07 | 16.73 | 713 | 47° 43′ | 33° 09′ | |
| Koohdasht | 366.7 | 15.04 | 21.73 | 8.61 | 1198 | 47° 39′ | 33° 31′ | |
| Cold Dry | Aligoudarz | 387.3 | 16.64 | 24.87 | 7.18 | 2022 | 49° 42′ | 33° 24′ |
| Doroud | 631.7 | 14.13 | 20.37 | 4.72 | 1527 | 49° 14′ | 33° 29′ | |
| Cold Wet | Khorram Abad | 500.1 | 12.93 | 19.35 | 4.77 | 1148 | 45° 17′ | 33° 26′ |
| Hot Dry | Noorabad | 467.9 | 17.32 | 25.32 | 9.09 | 1860 | 48° 19′ | 34° 03′ |
Table 3.
Classification scale of SPEI values (McKee et al. 1993).
| class | SPEI values |
| Extreme drought | 2-> |
| Severe Drought | -1.99 to -1.49 |
| Mild Drought | -1 to -1.49 |
| Normal | -0.99 to 0.99 |
| Mild wet | 1 to 1.49 |
| Severe wet | 1.5 to 1.99 |
| Extreme wet | >2 |
Table 4.
The Man-Kendall statistics values for Lorestan and UCRB.
| Lorestan | Z | Poldokhtar | Nour Abad | Koohdasht | Khorram Abad | Doroud | Boroujerd | Azna |
| -0.39 | -0.69 | -0.43 | 3.66 | -0.44 | -0.54 | -0.33 | ||
| Aligoudarz | Aleshtar | |||||||
| 0.43 | 0.48 | |||||||
| UCRB | Z | Telluride 4WNW | Steamboat Springs | Montrose #2 | Gunnison 3SW | Fruita | Dillon 1E | Collbran |
| 0.47 | -1.13 | -0.44 | -0.7 | -0.3 | 2.08 | 0.73 | ||
| Lees Ferry | Canyon de Chelly | Hanksville | Green River Aviation | Ft. Duchesne | Escalante | Duchesne | ||
| 1.13 | -0.3 | 0.04 | 0.73 | 0.53 | 0.24 | 1.13 | ||
| Bluff | Blanding | Dulce | Aztec Ruins NM | Rock Springs AP | Pinedale | Green River | ||
| 0.07 | -0.21 | 0.6 | 0.4 | 1.82 | 2.05 | 2.05 | ||
| Vernal 2SW | Thompson | Scofield-Skyline Mine | Salina 24 E | Moab | ||||
| 0.4 | 1.07 | 0.6 | 0.73 | 0.44 |
Disclaimer/Publisher’s Note: The statements, opinions and data contained in all publications are solely those of the individual author(s) and contributor(s) and not of MDPI and/or the editor(s). MDPI and/or the editor(s) disclaim responsibility for any injury to people or property resulting from any ideas, methods, instructions or products referred to in the content. |
© 2025 by the authors. Licensee MDPI, Basel, Switzerland. This article is an open access article distributed under the terms and conditions of the Creative Commons Attribution (CC BY) license (http://creativecommons.org/licenses/by/4.0/).
Copyright: This open access article is published under a Creative Commons CC BY 4.0 license, which permit the free download, distribution, and reuse, provided that the author and preprint are cited in any reuse.


