Submitted:
23 February 2025
Posted:
24 February 2025
You are already at the latest version
Abstract
The gully region of the Loess Plateau is among the most ecologically fragile areas in China, where rapid urbanization and unique geographical characteristics have intensified territorial spatial conflicts. Characterizing the spatial evolution and the factors driving these conflicts is crucial for promoting sustainable development in the region. This study utilizes land use remote sensing data from 1990, 2000, 2010, and 2020 to examine the evolution of territorial spatial conflicts in Qingyang City, Gansu Province. A transfer probability matrix and a comprehensive spatial conflict index model were employed, coupled with the optimal parameter geographical detector (OPGD) model, to identify key influencing factors. Our findings reveal significant regional differences in spatial patterns, with ecological and urban spaces expanding while agricultural land contracted. Over time, the intensity of spatial conflicts has increased, particularly in the central urban area of Xifeng District and the urban-rural fringe. The main driving factors identified include the normalized difference vegetation index (NDVI), land use intensity, and annual average precipitation, with land use intensity becoming increasingly influential in recent decades. These results provide valuable insights for future territorial spatial planning and management in Qingyang City.
Keywords:
territorial spatial conflicts
; spatial conflict index
; optimal parameters geographical detector (OPGD)
; Loess Plateau
1. Introduction
Land-use conflicts are defined as the competition and disputes over land rights that occur among stakeholders during land resource use, particularly regarding methods and structures of land use (Junhui Liu, 2015). Research in this area dates back to 1977, when the British Countryside Commission organized discussions on “Land Management, Land Use Relationships, and Conflicts.” Since then, international studies have primarily explored the origins and types of land-use conflicts, how these conflicts evolve, and strategies for their management (Adam et al., 2015; Andrew, 2003; de Groot, 2006; Fienitz, 2023; Iojă et al., 2014; Pavón et al., 2003). In China, the rapid pace of socio-economic change and increased efforts toward ecological protection have intensified pressures on land use, leading to significant challenges. Current research has largely focused on imbalances in land use patterns and the resulting conflicts. In 2019, the Central Committee of the Communist Party of China and the State Council issued opinions aimed at establishing a comprehensive territorial spatial planning system. This system was designed to integrate key plans, such as main functional zone planning, land use planning, and urban-rural planning, into a unified framework known as “multi-plan integration” (Junhui Liu, 2015; Zhang et al., 2023; Zhou and Shen, 2017) As a result, China’s territorial spatial planning system has become more consolidated, with the coordination and optimization of land use becoming a crucial focus for future research. Territorial spatial conflicts can be defined as land-use conflicts on a larger scale, encompassing the management of natural resources, ecological environments, and human activities. With the ongoing progress of urbanization and industrialization, these conflicts have become increasingly severe, particularly in ecologically fragile regions where the pressures are most acute (Ying et al., 2020). Scholars have approached this issue from both ecological and geographical perspectives, analyzing the evolution, driving mechanisms, simulation optimization, and management strategies of territorial spatial conflicts. These studies have adopted methods such as territorial suitability evaluation models, land development intensity assessments, and landscape pattern indices (BO Liming, 2024; Gu et al., 2024; Hao et al., 2021; LIN et al., 2024; Peng, 2022; Yilin et al., 2019). The gully region of the Loess Plateau, characterized by its unique terrain and fragile ecology, has become a key area for research on territorial spatial conflicts in China. In this region, spatial conflicts not only arise from competition between agricultural, urban, and ecological spaces but are also influenced by the area’s challenging topography, which has a significant impact on the allocation and distribution of land resources (Huang, 2021; Yu et al., 2009) .
2. Study area and data sources
2.1. Overview of the study area
Qingyang City, situated in the eastern section of Gansu Province, is an important area within the gully region of the Loess Plateau in China(Figure 1). The city is located at 35°42' N latitude and 107°38' E longitude. Qingyang governs one district and seven counties, with a permanent population of around 2.13 million as of the end of 2023. The city experiences a typical continental climate, with most of its annual precipitation occurring in the summer, ranging from 382.9 to 602.0 mm. The average annual temperature falls between 9.5 °C and 10.7 °C. The terrain is marked by significant elevation differences, with higher altitudes in the north and lower altitudes in the south. The distinctive gully landscapes of the Loess Plateau, along with its complex geological conditions, make the region particularly vulnerable to geological hazards, including landslides, collapses, and debris flows .
Qingyang is rich in mineral resources and is home to China’s second-largest oil and gas field, the Changqing Oilfield, which plays a significant role in driving the local economy. However, oil extraction and related industrial activities have posed certain risks to the region’s water resources and environment. In recent years, Qingyang has seen rapid socio-economic development, characterized by large-scale industrial projects, extensive oil and coal mining, and significant urban growth, including the construction of high-rise buildings and land development projects involving mountain cutting and valley filling. The significant changes in land use have resulted in conflicts between resource exploitation and environmental protection, posing challenges to the region’s sustainable development. As a crucial part of the Loess Plateau’s gully region, Qingyang City exhibits unique natural and economic characteristics. Studying the territorial spatial conflicts and their underlying causes in this area is vital for advancing sustainable development and ecological preservation.
2.2. Data sources and processing
To analyze the territorial spatial evolution and measure the conflict index for Qingyang City, multi-period land use/land cover remote sensing data from China was used. This data follows a three-tier classification system. The first level comprises six broad categories based on land resources and their usage: cultivated land, forest land, grassland, water bodies, construction land, and unused land. The second level further refines these categories according to the land’s natural characteristics, resulting in 25 specific land types. The third level offers additional subdivisions of the second-level types. For example, paddy fields (category 11 at the second level) are subdivided into mountainous paddy fields (111), hilly paddy fields (123), plain paddy fields (113), and paddy fields on slopes exceeding 25 degrees (114).
Land use data for Qingyang City from the years 1990, 2000, 2010, and 2020 were sourced from the Resource and Environmental Science and Data Center of the Chinese Academy of Sciences (http://www.resdc.cn). Data for 1990, 2000, and 2010 was primarily based on Landsat-TM/ETM remote sensing imagery, while the 2020 data update relied on Landsat 8 remote sensing data, all with a resolution of 30 × 30 meters. The multi-period land use data for Qingyang City includes six primary classifications and 18 secondary classifications. Building on the “three zones” classification system used in territorial spatial planning (which divides space into ecological, urban, and agricultural zones), and incorporating findings from previous research (Hao et al., 2021; Hu et al., 2023; Liu and Zhou, 2021; Shugao et al., 2022; Ying et al., 2020)along with the specific conditions of the study area, a tailored territorial spatial classification system was developed (Table 1).
Research methods
3.1. Analysis of changes in territorial spatial structure
This study uses the transfer probability matrix model to analyze the transformation of territorial spatial structure over different periods. In particular, the Markov model (CA-Markov) (Yang et al., 2007)is applied to assess transitions between various types of territorial spatial structures within the study area. The formula used for this analysis is as follows:
In the formula, represents the area of land that transitions from territorial space type i in the initial period to territorial space type j in the final period . Here, i and j correspond to the territorial space types before and after the transition, respectively, while n denotes the total number of territorial space types.
3.2. Construction of the comprehensive index for territorial spatial conflicts
Building on ecological risk assessment methods, a spatial conflict model was developed using the risk source-risk receptor-risk effect framework (Torre et al., 2014). Based on prior research, the measurement of territorial spatial conflict levels is expressed as: “Spatial Conflict = External Pressure + Spatial Exposure - Spatial Stability.” The calculation formula is detailed in Table 2.
Given that the scale of analysis can affect both the scientific validity and practical applicability of the results, this study uses the moving window method in Fragstats 4.3 to assess territorial spatial conflict levels. Various window sizes (300 m × 300 m, 1 km × 1 km, 2 km × 2 km, and 3 km × 3 km) were compared, taking into account the study area’s scale, data volume, and spatial patch conditions. The results indicated that a 1 km × 1 km grid best captures the spatial conflict distribution characteristics while maintaining a manageable data volume. Therefore, the 1 km × 1 km grid was chosen as the assessment unit. The landscape ecological indices for each spatial grid unit were calculated across different periods and integrated into the spatial conflict index model. The overall spatial conflict index was then categorized into five levels using the equal interval method: weak spatial conflict (0.0–0.2), moderately weak spatial conflict (0.2–0.4), moderate spatial conflict (0.4–0.6), moderately strong spatial conflict (0.6–0.8), and strong spatial conflict (0.8–1.0).
3.3 Optimal parameter geographic detector (OPGD)
The OPGD (Song et al., 2020) is a statistical technique used to identify spatial differentiation in geographical phenomena and to determine the factors driving these variations.
- Spatial differentiation and factor detection
The factor detector evaluates the significance of explanatory variables using the Q statistic. The Q statistic gauges a factor’s explanatory power by comparing the total variance across the study area with the variance within the variable layers. The formula is as follows:
where Q represents the explanatory power index of each influencing factor, with values ranging from 0 to 1. A higher Q value indicates a greater influence of the factor on the formation and evolution of the territorial spatial pattern. L denotes the number of categories for the influencing factor. Nh and N denote the number of units in the hth layer and the entire study area, while and represent the variance of territorial spatial land use area in the ℎth layer and the entire study area, respectively. The formula for calculating the total variance of Y in the entire area is:
where and represent the value of the ith sample in the study area and the mean value of the entire region, respectively.
- Parameter optimization
In this study, the Q value for each continuous variable is calculated by testing various combinations of discretization methods and category counts. Different classification methods and numbers of categories are applied to the continuous variables in the geographic spatial data. The combination that produces the highest Q value is chosen as the optimal discretization method, effectively capturing the explanatory power of the factors.
The factor detection analyzes how each factor influences the territorial spatial types (ecological, urban, and agricultural spaces) within the study area. Interaction detection assesses how the interactions between different factors affect the results. The calculation formula is:
where q is the explanatory power index of each influencing factor, also ranging from 0 to 1. A higher q value indicates a stronger influence of the factor on the formation and evolution of the territorial spatial pattern. L represents the number of categories for the influencing factor, denotes the number of units in the ℎth layer, and N is the total number of units in the entire study area. and represent the variance of territorial spatial land use area in the hth layer and the entire study area, respectively.
4. Results
4.1 Characteristics of territorial spatial evolution
4.1.1 Spatiotemporal patterns of territorial spatial evolution
The territorial spatial pattern in Qingyang City exhibits notable regional differences (Figure 2, Table 3), with significant changes across various spatial areas. The key details are as follows:
- Ecological spaces show a general trend of expansion.
The Water Ecological Space occupies a relatively small area and has experienced little change from 1990 to 2020. The Forest Ecological Space is primarily located along the Zi Wuling Mountain range in Zhengning, Ning, Heshui, and Huachi Counties, with Heshui County having the largest forested area. From 1990 to 2020, the Forest Ecological Space expanded significantly, increasing from 11.72% to 13.14%. Grassland Ecological Space is mainly distributed in Huan County and is dominated by natural grasslands. Grassland areas increased from 48.03% in 1990 to 49.29% by 2020, with most of the growth concentrated in Qingcheng and Zhengyuan Counties.
- Urban space has expanded considerably.
Urban Living Space grew from 0.06% in 1990 to 0.19% in 2020, with significant expansion around key cities such as Xifeng District, Zhengyuan County, and Qingcheng County. Although the area of Industrial and Mining Production Space remains relatively small, it has seen notable growth, increasing from 0.01% in 1990 to 0.08% in 2020.
- Agricultural space has generally shown a trend of contraction.
In 1990, Agricultural Production Space covered 38.98% of the total area, decreasing to 35.62% by 2020. This reduction mainly occurred around Xifeng District and surrounding areas in Zhengyuan, Huan, and Huachi Counties. Meanwhile, Rural Living Space has gradually expanded from 0.94% in 1990 to 1.39% in 2020, primarily in the central and southern regions, including Ning, Zhengning, and Zhengyuan Counties.
4.1.2 Characteristics of territorial spatial structure transformation
Between 1990 and 2020, the transformation of Qingyang City’s territorial spatial structure was primarily marked by the exchange between ecological and agricultural spaces, with the most significant changes occurring between grassland and agricultural production areas.(Figure3-4)
Figure 3.
Sankey Diagram of Territorial Spatial Transfers in Qingyang City (1990-2000).
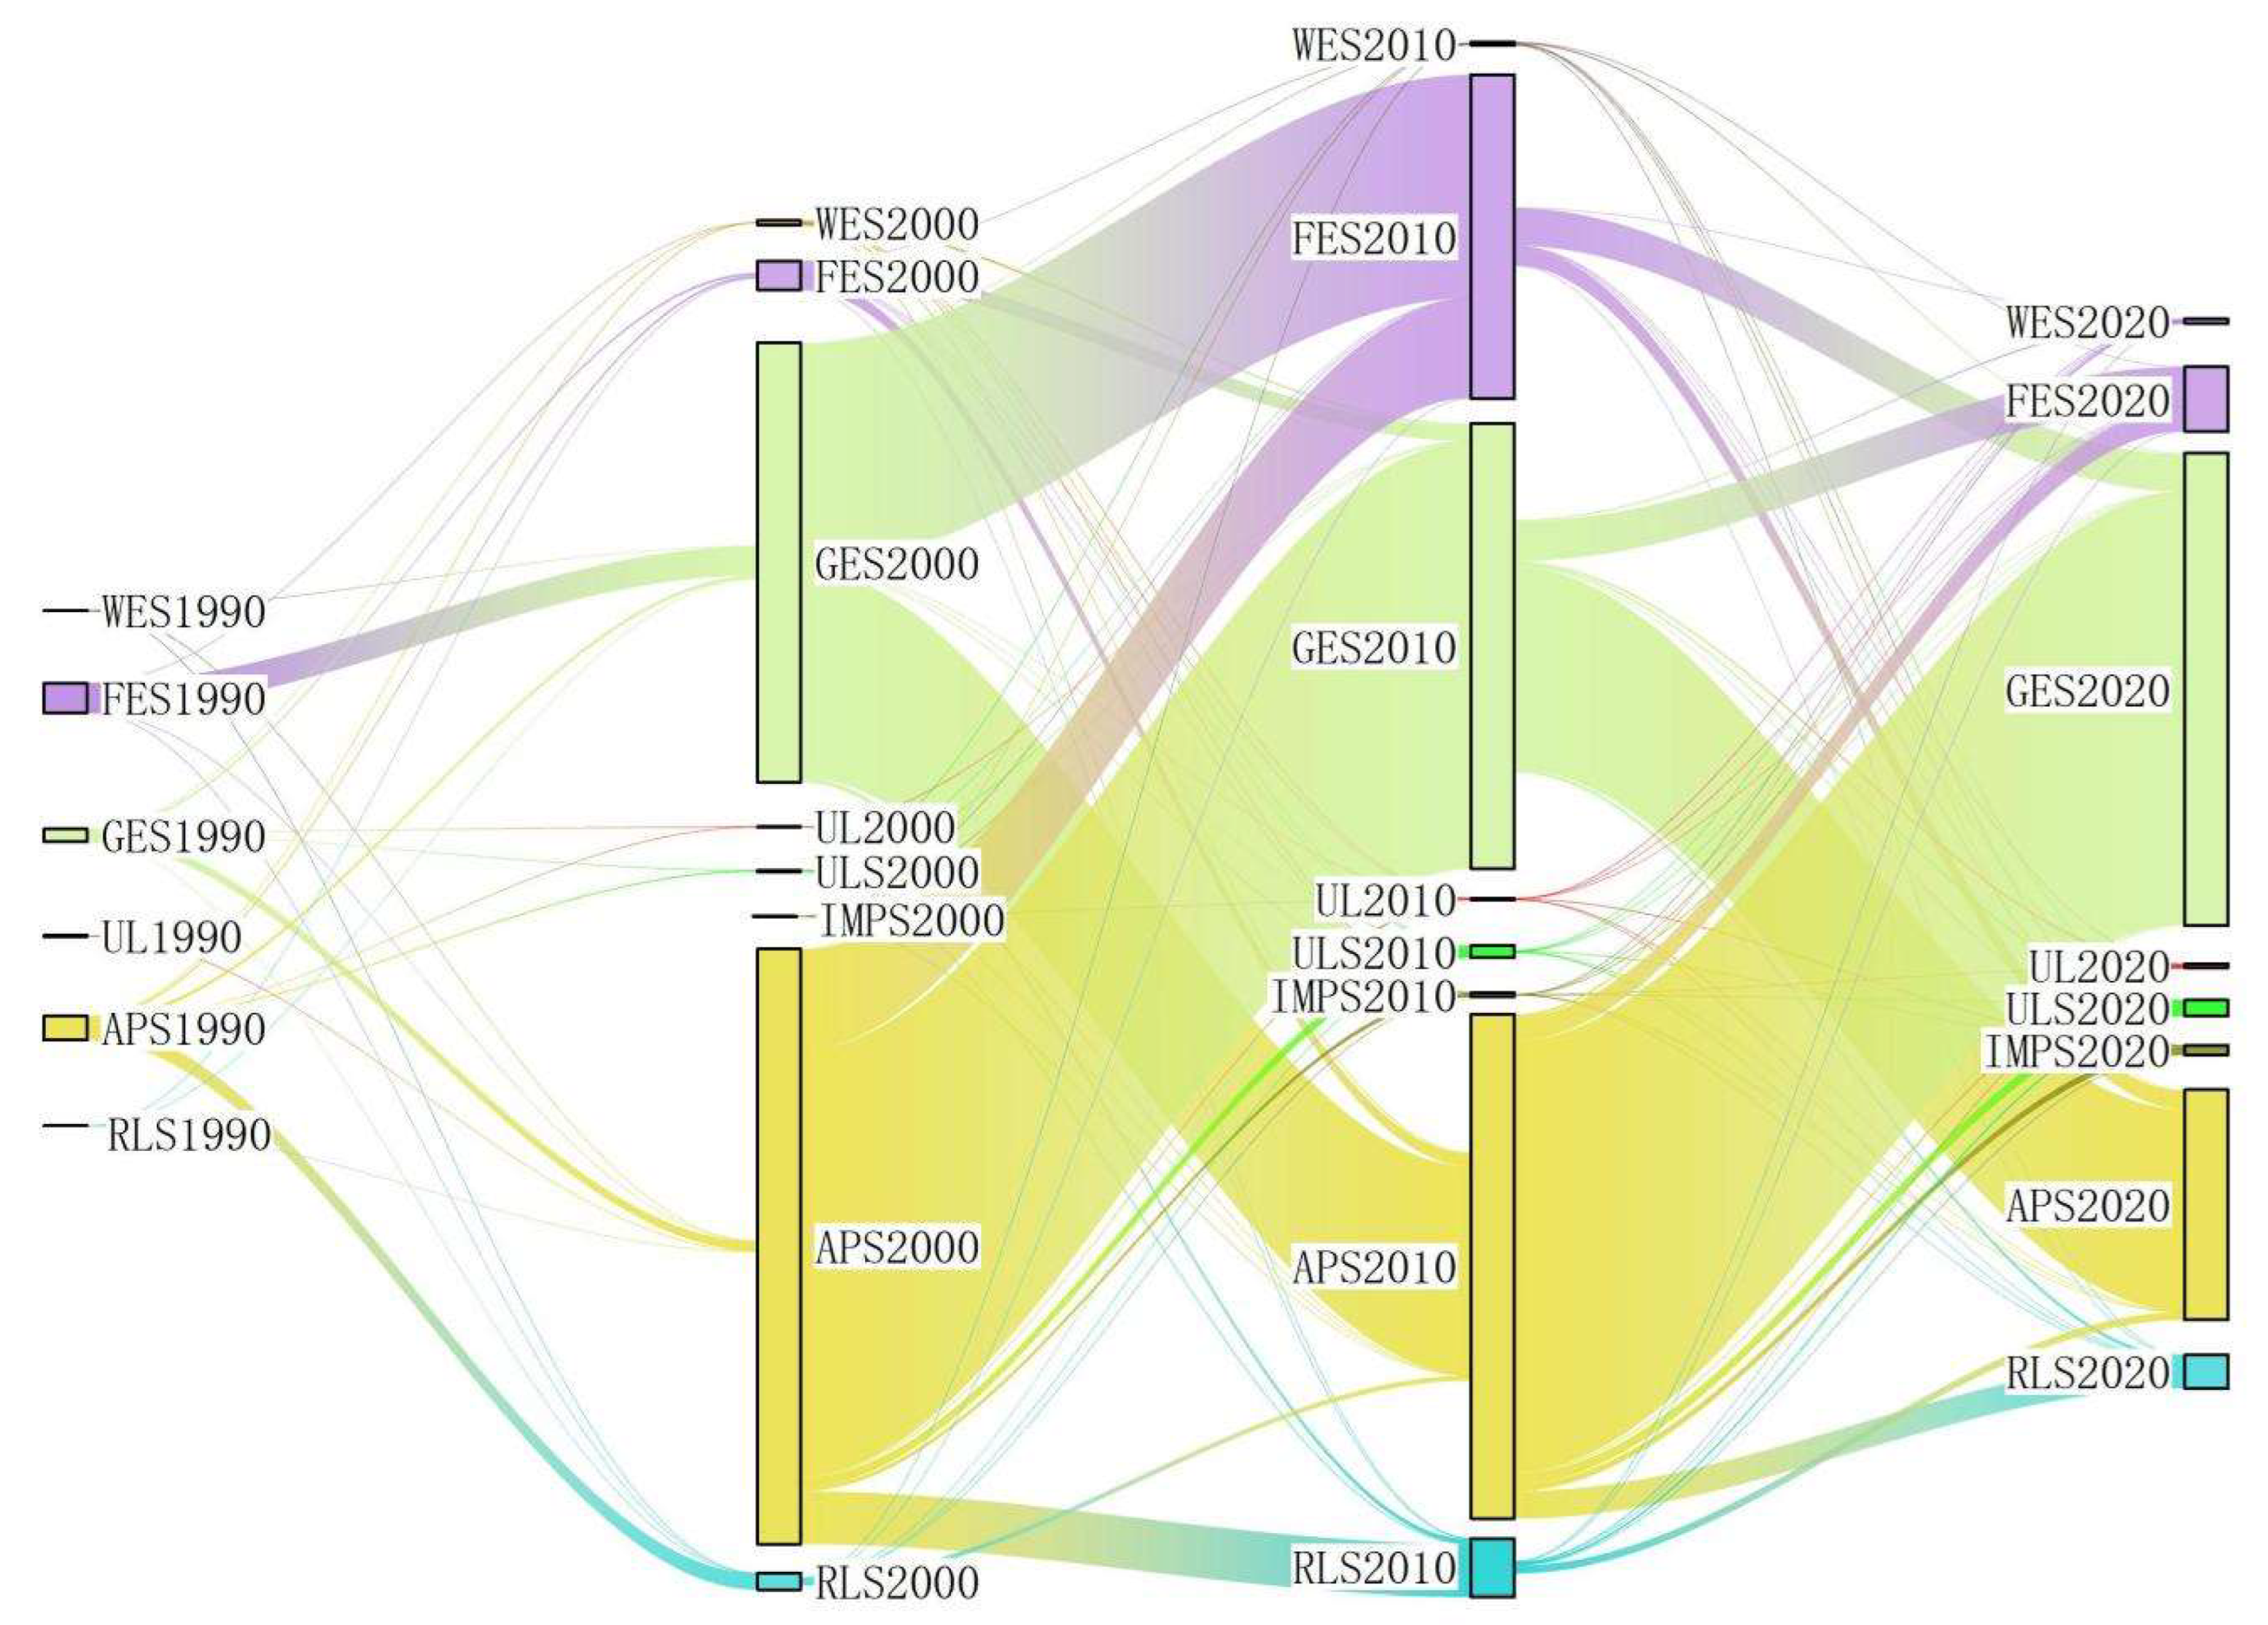
From 1990 to 2000, spatial transformation was relatively modest, primarily involving the conversion of ecological space into agricultural production space, particularly in Huan and Huachi Counties. However, from 2000 to 2010, there was a substantial increase in spatial transformation, with the predominant trend being the conversion of agricultural space back into ecological space. This shift led to significant growth in forested areas across various counties.
Figure 4.
Spatial pattern changes of territorial space structure in Qingyang City (1990–2020).

From 2010 to 2020, the trend of converting agricultural space into ecological space continued to dominate. This period also saw urbanization in Xifeng District, Ning County, Zhengyuan, and Heshui, where urban construction land expanded significantly, largely at the expense of agricultural space.
In 1999, in response to the national “Grain for Green” policy, Qingyang City initiated two rounds of farmland-to-forest and grassland conversion projects. These initiatives rapidly transformed large areas of farmland into forest and grassland, resulting in a notable reduction in agricultural space. As a result, soil erosion and land desertification were mitigated, leading to significant improvements in the quality of the ecological environment.
4.2 Spatiotemporal evolution characteristics of territorial spatial conflicts
The comprehensive assessment of territorial spatial conflict in Qingyang City across different stages was conducted using the Comprehensive Spatial Conflict Index model (Table 4), and the spatial characteristics of conflict levels were visualized in Figure 5. From 1990 to 2020, Qingyang City experienced significant spatiotemporal changes in territorial spatial conflicts. Over time, conflict levels showed a general trend of fluctuating increases. Spatially, there were notable differences in conflict levels across regions, with the most significant conflicts occurring in central urban areas and the urban-rural fringe.
4.2.1 Temporal variation characteristics
An analysis of the territorial spatial conflict results at four time points—1990, 2000, 2010, and 2020—revealed substantial changes in the level of territorial spatial conflict in Qingyang City during this period.
Between 1990 and 2000, minimal transformation of various territorial spaces resulted in almost no change in the proportion of territorial spatial conflicts. However, from 2000 to 2010, significant shifts occurred in the proportions of weak and moderately weak spatial conflicts, indicating a relatively mild overall conflict during this period. From 2010 to 2020, the proportion of weak spatial conflicts declined sharply, while moderate, moderately strong, and strong spatial conflicts increased, signaling an intensification of conflicts driven by urbanization. In 1990 and 2000, weak spatial conflicts accounted for 13.06% of the total, significantly increasing to 41.24% in 2010 before declining to 12.00% in 2020. This indicates that territorial spatial conflicts were relatively mild between 1990 and 2010 but escalated thereafter. Moderately weak spatial conflicts remained steady at 77.49% in both 1990 and 2000, dropped to 56.29% in 2010, and then rose to 71.19% in 2020, showing a trend of initial decline followed by recovery. For moderate spatial conflicts, the proportion remained stable at 8.57% in 1990 and 2000, decreased significantly to 1.50% in 2010, and then increased to 15.14% in 2020. The proportion of moderately strong spatial conflicts was 0.66% in 1990 and 2000, slightly decreased to 0.62% in 2010, and then rose to 1.07% in 2020. Although moderately strong conflicts remained relatively low, their upward trend in 2020 is notable. Strong spatial conflicts, which accounted for 0.22% in both 1990 and 2000, increased to 0.36% in 2010 and further to 0.61% in 2020, indicating a more pronounced intensification of territorial spatial conflicts in the later period.
4.2.2 Spatial differentiation characteristics
From a spatial distribution perspective, the level of territorial spatial conflicts in Qingyang City’s counties (districts) exhibits significant spatial differentiation (Figure 5, Table 4). In 1990 and 2000, conflicts were primarily concentrated at moderate and moderately weak levels, with relatively weaker conflicts observed in Huan County, Huachi County, and Zhengyuan County. By 2010, the proportion of moderately weak conflicts had increased significantly across Qingyang City, particularly in Qingcheng County, Ning County, Huachi County, and Zhengyuan County, where conflict levels eased.In 2020, the moderately weak conflict level increased once again, but there was also a notable rise in moderate and strong conflict levels, particularly in Xifeng District, Zhengyuan County, and Zhengning County. The rise in conflicts in these areas reflects the intensifying pressure of urbanization on territorial spatial conflicts.
4.3 Analysis of factors influencing the evolution of territorial spatial conflicts
The evolution of territorial spatial conflicts is driven by the interaction of multiple factors. Differences in terrain and hydrothermal conditions lead to uneven spatial distribution and varying sensitivities to human disturbances. These natural environmental factors serve as the foundation for the development of territorial spatial conflicts. As urbanization progresses rapidly, the allocation of regional resources and spatial structures undergo significant changes (Kexin et al., 2024; Ying et al., 2020). The patterns of resource use and availability change quickly, often reflecting specific stages of economic and social development. As a result, socioeconomic factors become the primary drivers of territorial spatial conflicts. The spatial heterogeneity of an area plays a vital role in shaping geographical patterns. Transportation, as a key component of spatial connectivity, directly affects urbanization and interacts in complex ways with other factors. Variations in transportation conditions lead to different urbanization strategies. By influencing the economic structure, transportation conditions contribute to changes in both urbanization levels and urban spatial configurations. Thus, transportation and locational factors are essential spatial drivers in the evolution of territorial spatial conflicts (Yong, 2010; Zhang et al., 2021; Zhuang and Liu, 1997). The evolution of territorial spatial conflicts is driven by the interaction between natural environmental factors, socioeconomic conditions, and locational factors. Therefore, changes in the allocation and unequal influence of these factors across regions result in spatiotemporal variations in in conflict intensity.
4.3.1 Selection of influencing factors
Based on a comprehensive assessment of the current state of territorial spatial conflicts in Qingyang City, 13 factors were selected across three key categories: natural conditions, socioeconomic factors, and locational factors. These factors were then used to construct an influencing factor index system for analyzing territorial spatial conflicts (Table 5).
4.3.2 Detection of influencing factors
- Optimal parameter selection
The choice of spatial discretization methods and classification approaches can greatly influence the q value, which reflects the relationship between driving factors and geographical phenomena. Subjective classification may not always provide an accurate explanation of this relationship. To scientifically explore the driving mechanisms behind territorial spatial evolution in the study area, we selected the parameter combination that produced the highest q value (in terms of both classification method and number of breaks) as the optimal choice for geographic detection. The classification methods employed in the analysis include natural breaks, equal interval breaks, standard deviation breaks, geometric interval breaks, and quantile breaks. The number of classes ranged from 4 to 10, based on the principle of avoiding excessive classifications (Li et al., 2017; Yong, 2010). Table 6 presents the parameter combinations of different factors that produced the highest q values for two specific years.
- Single-factor detection analysis
During the analysis of factors influencing territorial spatial conflicts, it was observed that the spatial distribution of natural environment, socioeconomic factors, and locational conditions demonstrated a high degree of convergence across different years. Therefore, this study focuses on the key influencing factors of territorial spatial conflicts in Qingyang City, using 2000 and 2020 as time points for analysis. According to the detection results for both years, the driving factors were categorized by q value into key influencing factors, major influencing factors, and other factors(Table 7). The key influencing factors are the primary determinants shaping the territorial spatial structure in Qingyang. In 2000, the key influencing factors included NDVI, LA, and PRE, with q values of 0.2083, 0.1409, and 0.1142, respectively. The major influencing factors, which mainly drove the evolution of territorial space, included GDP per unit area, TEM, DEM, and RD.
In 2020, the key influencing factors continued to be the NDVI, LA, and PRE, though their impacts changed, with q values of 0.1481, 0.1622, and 0.1358, respectively. Notably, LA became the most influential factor in 2020, indicating that over the 20-year period, changes in land use intensity had a more significant impact on territorial spatial conflicts. The major influencing factors, ranked by their q values, were RD, POP, GDP per unit area, and NL. This shift highlights the growing significance of infrastructure development in spatial conflicts, the increasing impact of population changes on spatial distribution, and a reduction in the relative influence of GDP, though it remained a key factor. NL reflects the effects of human activities during urbanization on spatial distribution. Comparing the two periods, it is evident that natural factors, such as vegetation cover and precipitation, remained consistently important, while the influence of land use intensity notably increased by 2020. Simultaneously, socioeconomic factors, particularly infrastructure development and population density, exerted a much stronger influence in 2020, underscoring the substantial role of economic growth and urbanization in shaping territorial spatial conflicts. These changes highlight the complex interaction between natural and socioeconomic factors in the evolution of territorial space in the Qingyang region.
- Multi-factor interactive detection analysis
The formation and evolution of regional territorial spaces are driven by the combined effects of multiple factors, making the analysis of their interactions essential. The interaction detection results of influencing factors can be classified into five categories: nonlinear weakening, single-factor nonlinear weakening, two-factor enhancement, independence, and nonlinear enhancement. Analysis of the interaction of influencing factors for territorial spatial conflicts in the Qingyang region (Figure 6) revealed that most factor interactions exhibit an enhanced effect. The impact of interacting factors is stronger than that of any single factor and shows an upward trend. No factors act independently, meaning that the interaction between any two factors has a greater impact on territorial spatial conflicts than the effect of a single factor alone.
In 2000, the interaction between various factors significantly influenced territorial spatial conflicts. The interaction between the NDVI and PRE had the highest explanatory power for territorial spatial conflicts. This is because vegetation and precipitation directly affect land use and the ecological environment, leading to a notable impact on spatial conflicts. Additionally, the interaction between GDP per unit area and LA also showed high q values when combined with other factors, highlighting their significant influence on territorial spatial conflicts.
In 2020, the interaction between various factors continued to play a major role in territorial spatial conflicts. PRE, NDVI, and LA maintained strong interactions with other factors. However, these interactions became even more pronounced, especially between LA and other factors, underscoring the increasing importance of land use changes in influencing territorial spatial conflicts. Interactions involving POP and RD with other factors also intensified, while the interaction between GDP per unit area and other factors weakened. This suggests that population growth and transportation infrastructure are becoming increasingly significant in shaping territorial spatial conflicts. As economic development progresses, the explanatory power of pure economic growth for spatial conflicts is gradually being replaced by more direct factors, such as land use intensity and POP.
Overall, the interaction of factors in 2000 and 2020 provided consistent explanatory power for territorial spatial conflicts. However, there were notable differences in the specific combinations of factors and their relative influence.
5. Discussion
This study reveals the evolution and conflict characteristics of territorial spaces (ecological, urban, and agricultural) in Qingyang City, Gansu Province, from 1990 to 2020. The results show significant regional differences in the spatial patterns of Qingyang City, with notable changes in land use. Specifically, ecological and urban spaces expanded significantly, while agricultural land exhibited an overall shrinking trend. The primary shifts in Qingyang City’s territorial spatial structure occurred due to the transformation between ecological and agricultural spaces. From 1990 to 2010, spatial conflicts in Qingyang City were relatively mild, largely owing to the Grain for Green Project implemented in 1999. This initiative effectively reduced agricultural land and expanded ecological areas, contributing to a reduction in spatial conflicts. However, between 2010 and 2020, urban land expansion led to a significant intensification of spatial conflicts, especially in Xifeng District’s central urban area and other county towns and their surrounding regions. These areas faced substantial land use pressure during urbanization, resulting in pronounced spatial conflicts and differentiation. These findings align with earlier research, such as Zhang Yunxia’s (2021) analysis of spatial conflicts in oasis counties in the arid regions of Northwest China, which identified similar territorial spatial conflict patterns. Additionally, using the optimal parameter geographical detector, we identified the key factors driving these conflicts, offering a fresh perspective on their root causes.
These findings have important practical implications. At the policy level, governments should carefully assess the effects of policy formulation and implementation on territorial spaces, particularly during urban expansion. Strengthening ecological protection and safeguarding agricultural land are essential to mitigate the encroachment of urban areas into these spaces. Theoretically, this study enhances our understanding of territorial spatial conflicts, particularly in the gully region of the Loess Plateau, and offers valuable insights for future research in similar contexts.
Funding sources
This research was funded by the National Natural Science Foundation of China (grant number 52068040).
Acknowledgements
This research was supported by the National Natural Science Foundation of China (Grant No. 52068040). We would like to express our gratitude to the Resource and Environmental Science and Data Center of the Chinese Academy of Sciences for providing the land use/land cover remote sensing data that was fundamental to our analysis. We also extend our appreciation to the experts and colleagues at Lanzhou Jiaotong University for their valuable feedback and technical support. Special thanks to the local government of Qingyang City for offering essential information and field access during the study. Finally, we are deeply grateful to our families and friends for their continued support and encouragement throughout this research.
References
- Adam, Y.O. Pretzsch, J., Darr, D., 2015. Land use conflicts in central Sudan: Perception and local coping mechanisms. Land Use Policy 42, 1-6. [CrossRef]
- Andrew, J.S. 2003. Potential application of mediation to land use conflicts in small-scale mining. Journal of Cleaner Production 11, 117-130. [CrossRef]
- BO Liming, Y.L. WEI Wei, ZHAO Lang, XIA Junnan, 2024. Evolution characteristics and its driving mechanism of territorial spatial pattern in the Hexi Corridor from 2000 to 2020. Arid Land Geography - 47, 885-897.http://alg.xjegi.
- de Groot, R. 2006. Function-analysis and valuation as a tool to assess land use conflicts in planning for sustainable, multi-functional landscapes. Landscape and Urban Planning 75, 175-186. [CrossRef]
- DONG, Z. YUAN, Q., WANG, Z., REN, P., 2023. Analysis and simulation prediction of the evolutionary characteristics of the living-production-ecological spatial conflicts in the agriculture-pastoral ecotone in western Sichuan: Taking four counties in Aba Prefecture as examples. Acta Ecologica Sinica 43, 6243-6256. [CrossRef]
- Fienitz, M. 2023. Taking Stock of Land Use Conflict Research: A Systematic Map with Special Focus on Conceptual Approaches. Society & Natural Resources 36, 715-732. [CrossRef]
- Gu, G. Wu, B., Zhang, W., Lu, R., Wang, P.-q., Liao, W., Feng, X., 2024. Regional differences in the evolution of territorial space and its driving mechanisms in Chinese border areas. JOURNAL OF NATURAL RESOURCES.
- Hao, Q. Peng, J., Wei, Y., Wang, F., Yao, H.-s., Li, Y., Wang, W., Zhang, S.-h., Deng, L., Zhao, Y.-t., Ma, X., Ge, D., Dai, J., Zhu, H., Zhang, M.-x., 2021. The connotation of territory and the suggestions of drawing up spatial planning in the New Era. JOURNAL OF NATURAL RESOURCES.
- Hu, G. Huang, J., Shi, J., Chen, S., 2023. The formation of the Chinese territorial spatial planning system and international comparison. Transactions in Planning and Urban Research 2, 16-36. [CrossRef]
- Huang, J. Xue, D., Ma, B., & Song, 2021. Spatial and temporal evolution pattern and driving mechanism of coordinated level of human-land-industry system in rural areas of the Loess Plateau.. Human Geography 36, 190-203. [CrossRef]
- Iojă, C.I. Niţă, M.R., Vânău, G.O., Onose, D.A., Gavrilidis, A.A., 2014. Using multi-criteria analysis for the identification of spatial land-use conflicts in the Bucharest Metropolitan Area. Ecological Indicators 42, 112-121.
- Junhui Liu, C.Z. Jixi Gao, Su Ma, Wenjie Wang, Kun Wu, Yang Liu, 2015. Location determination of ecologically vulnerable regions in China. Biodiv Sci 23, 725-732. [CrossRef]
- Kexin, F. Zhen, L.I.U., Shenghe, L.I.U., Hui, L.I.U., 2024. Evolution and influencing factors of population shrinkage in China’s border areas, 1990-2020. Resources Science 46, 1045-1059 https://www.resci.cn/EN/10.18402/resci.2024.06.01.
- Li, J. Wen, J., Jiang, B., 2017. Spatial Spillover Effects of Transport Infrastructure in Chinese New Silk Road Economic Belt. International Journal of e-Navigation and Maritime Economy 6, 1-8. [CrossRef]
- LIN, Z. LI, S., YI, B., FU, T., GAO, Q., SUN, X., QIU, L., 2024. Multiple Scenario Perspective of Production-Living-Ecological Space Change Simulation and Effect Evaluation in Yunnan Province. Journal of Soil and Water Conservation 38, 220-230. [CrossRef]
- Liu, Y. Zhou, Y., 2021. Territory spatial planning and national governance system in China. Land Use Policy 102, 105288. [CrossRef]
- Pavón, D. Ventura, M., Ribas, A., Serra, P., Saurı́, D., Breton, F., 2003. Land use change and socio-environmental conflict in the Alt Empordà county (Catalonia, Spain). Journal of Arid Environments 54, 543-552. [CrossRef]
- Peng, X. 2022. A conflict coordination approach for territory spatial planning based on security pattern theory. Journal of Natural Resources 37, 2856-2866. [CrossRef]
- Shugao, L. Rucheng, L., Zongda, Y., Shaokun, L., Bojian, B., Shiyu, D., 2022. Evolution Characteristics and Formation Mechanism of Territorial Space Pattern in Guangxi Zhuang Autonomous Region. SCIENTIA GEOGRAPHICA SINICA 42, 1963-1974. [CrossRef]
- Torre, A. Melot, R., Magsi, H., Bossuet, L., Cadoret, A., Caron, A., Darly, S., Jeanneaux, P., Kirat, T., Pham, H.V., Kolokouris, O., 2014. Identifying and measuring land-use and proximity conflicts: methods and identification. SpringerPlus 3, 85. [CrossRef]
- Yilin, L. Junsan, Z., Meng, Z., Guoping, C., 2019. Identification of Territory Space Pattern and Spatio-temporal Evolution Analysis of Urban Agglomeration in Central Yunnan. Transactions of the Chinese Society for Agricultural Machinery. [CrossRef]
- Ying, F. Jing, W., Long-yang, H., Tian-lin, Z., 2020. Determining and identifying key areas of ecosystempreservation and restoration for territorial spatial planning based on ecological security patterns: A case study of Yantai city. JOURNAL OF NATURAL RESOURCES 35, 190. [CrossRef]
- Yong, L., 2010. Transport Infrastructure Investment,Regional Economic Growth and the Spatial Spillover Effects——Based on Highway and Marine's Panel Data Analysis. China Industrial Economics. Corpus ID: 156986542.
- Yu, X. Zhang, X., Niu, L., Yue, Y., Zhang, M., 2009. Dynamic evolution and driving force analysis of land use/cover change on loess plateau watershed. Nongye Gongcheng Xuebao/Transactions of the Chinese Society of Agricultural Engineering 25, 219-225. [CrossRef]
- Zhang, R. Chen, Y., Zhang, X., Fang, X., Ma, Q., Ren, L., 2021. Spatial-temporal pattern and driving factors of flash flood disasters in Jiangxi province analyzed by optimal parameters-based geographical detector. Geogr. Geo-Inform. Sci 37, 72-80. [CrossRef]
- Zhang, Y., Man, X., Zhang, Y., 2023. From “Division” to “Integration”: Evolution and Reform of China’s Spatial Planning System. Buildings 13, 1555.https://www.mdpi.com/2075-5309/13/6/1555.
- Zhou, J. Shen, C., 2017. The Reform of Dutch Spatial Planning System and Its Inspirations. Urban Planning International 32, 113-121. [CrossRef]
- Zhuang, D. Liu, J., 1997. Modeling of regional differentiation of land-use degree in China. Chinese Geographical Science 7, 302-309.
Figure 1.
Location of the study area.
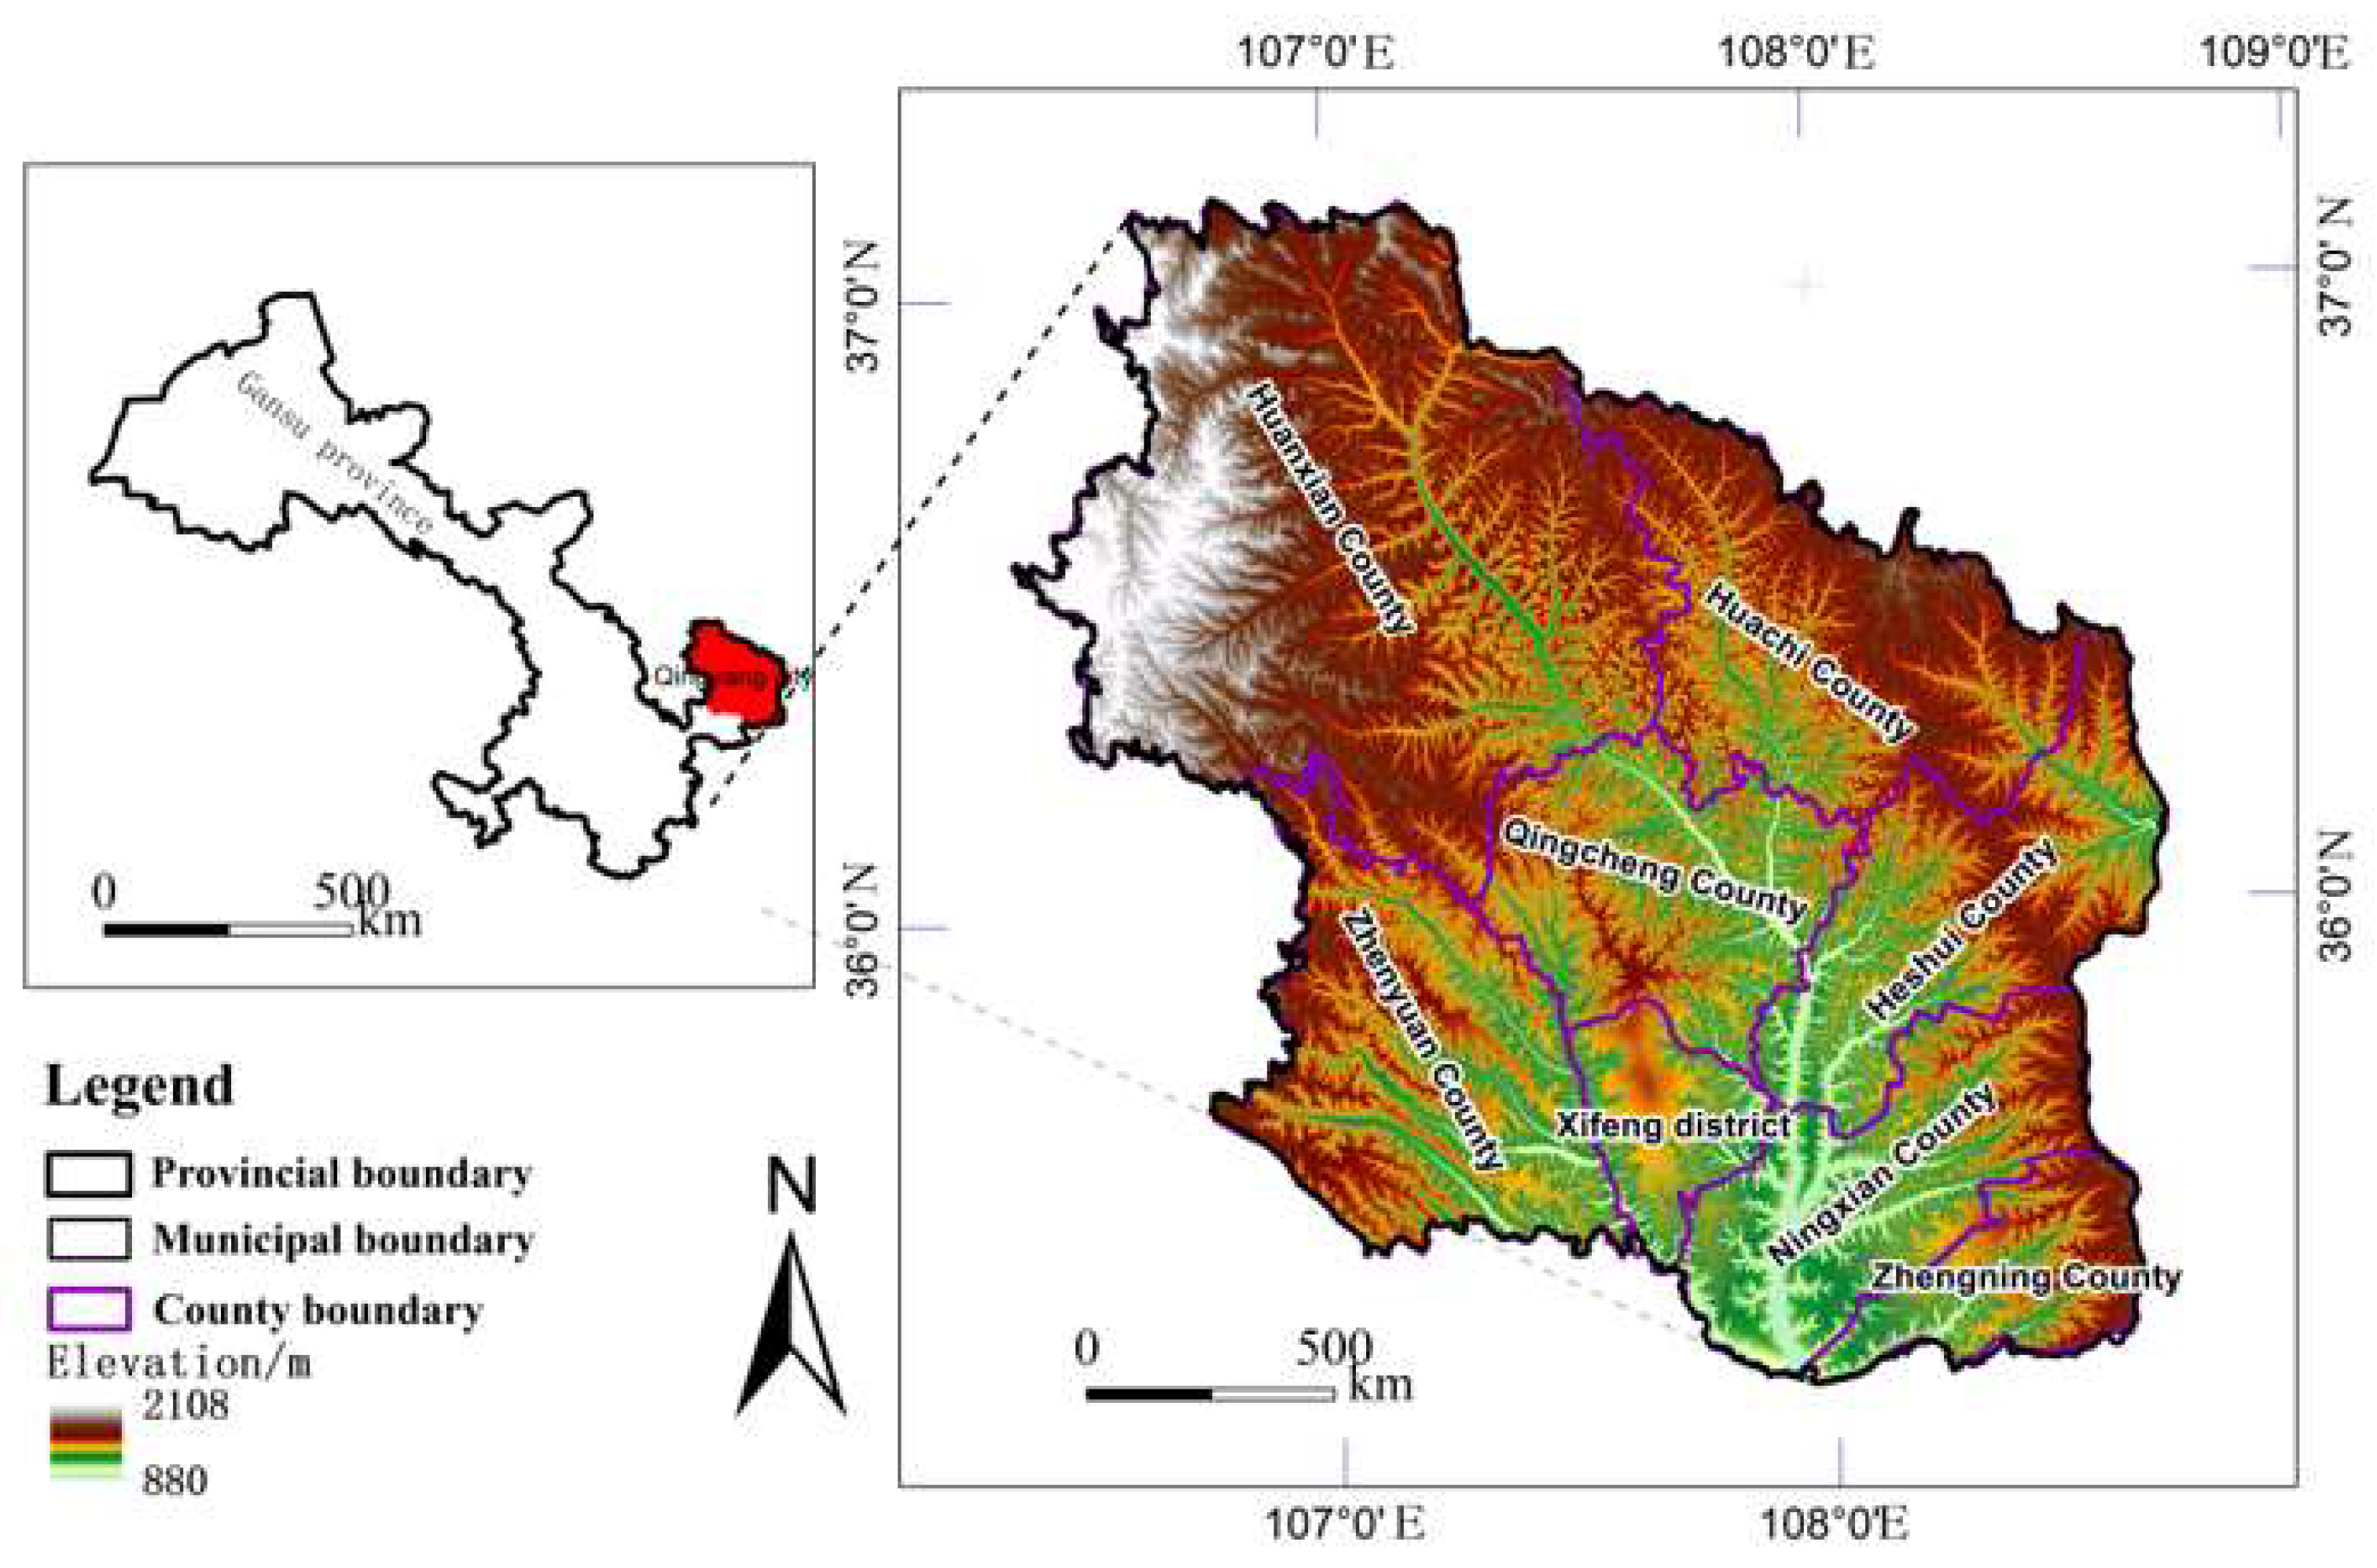
Figure 2.
Spatial pattern characteristics of territorial space in Qingyang City (1990–2020).
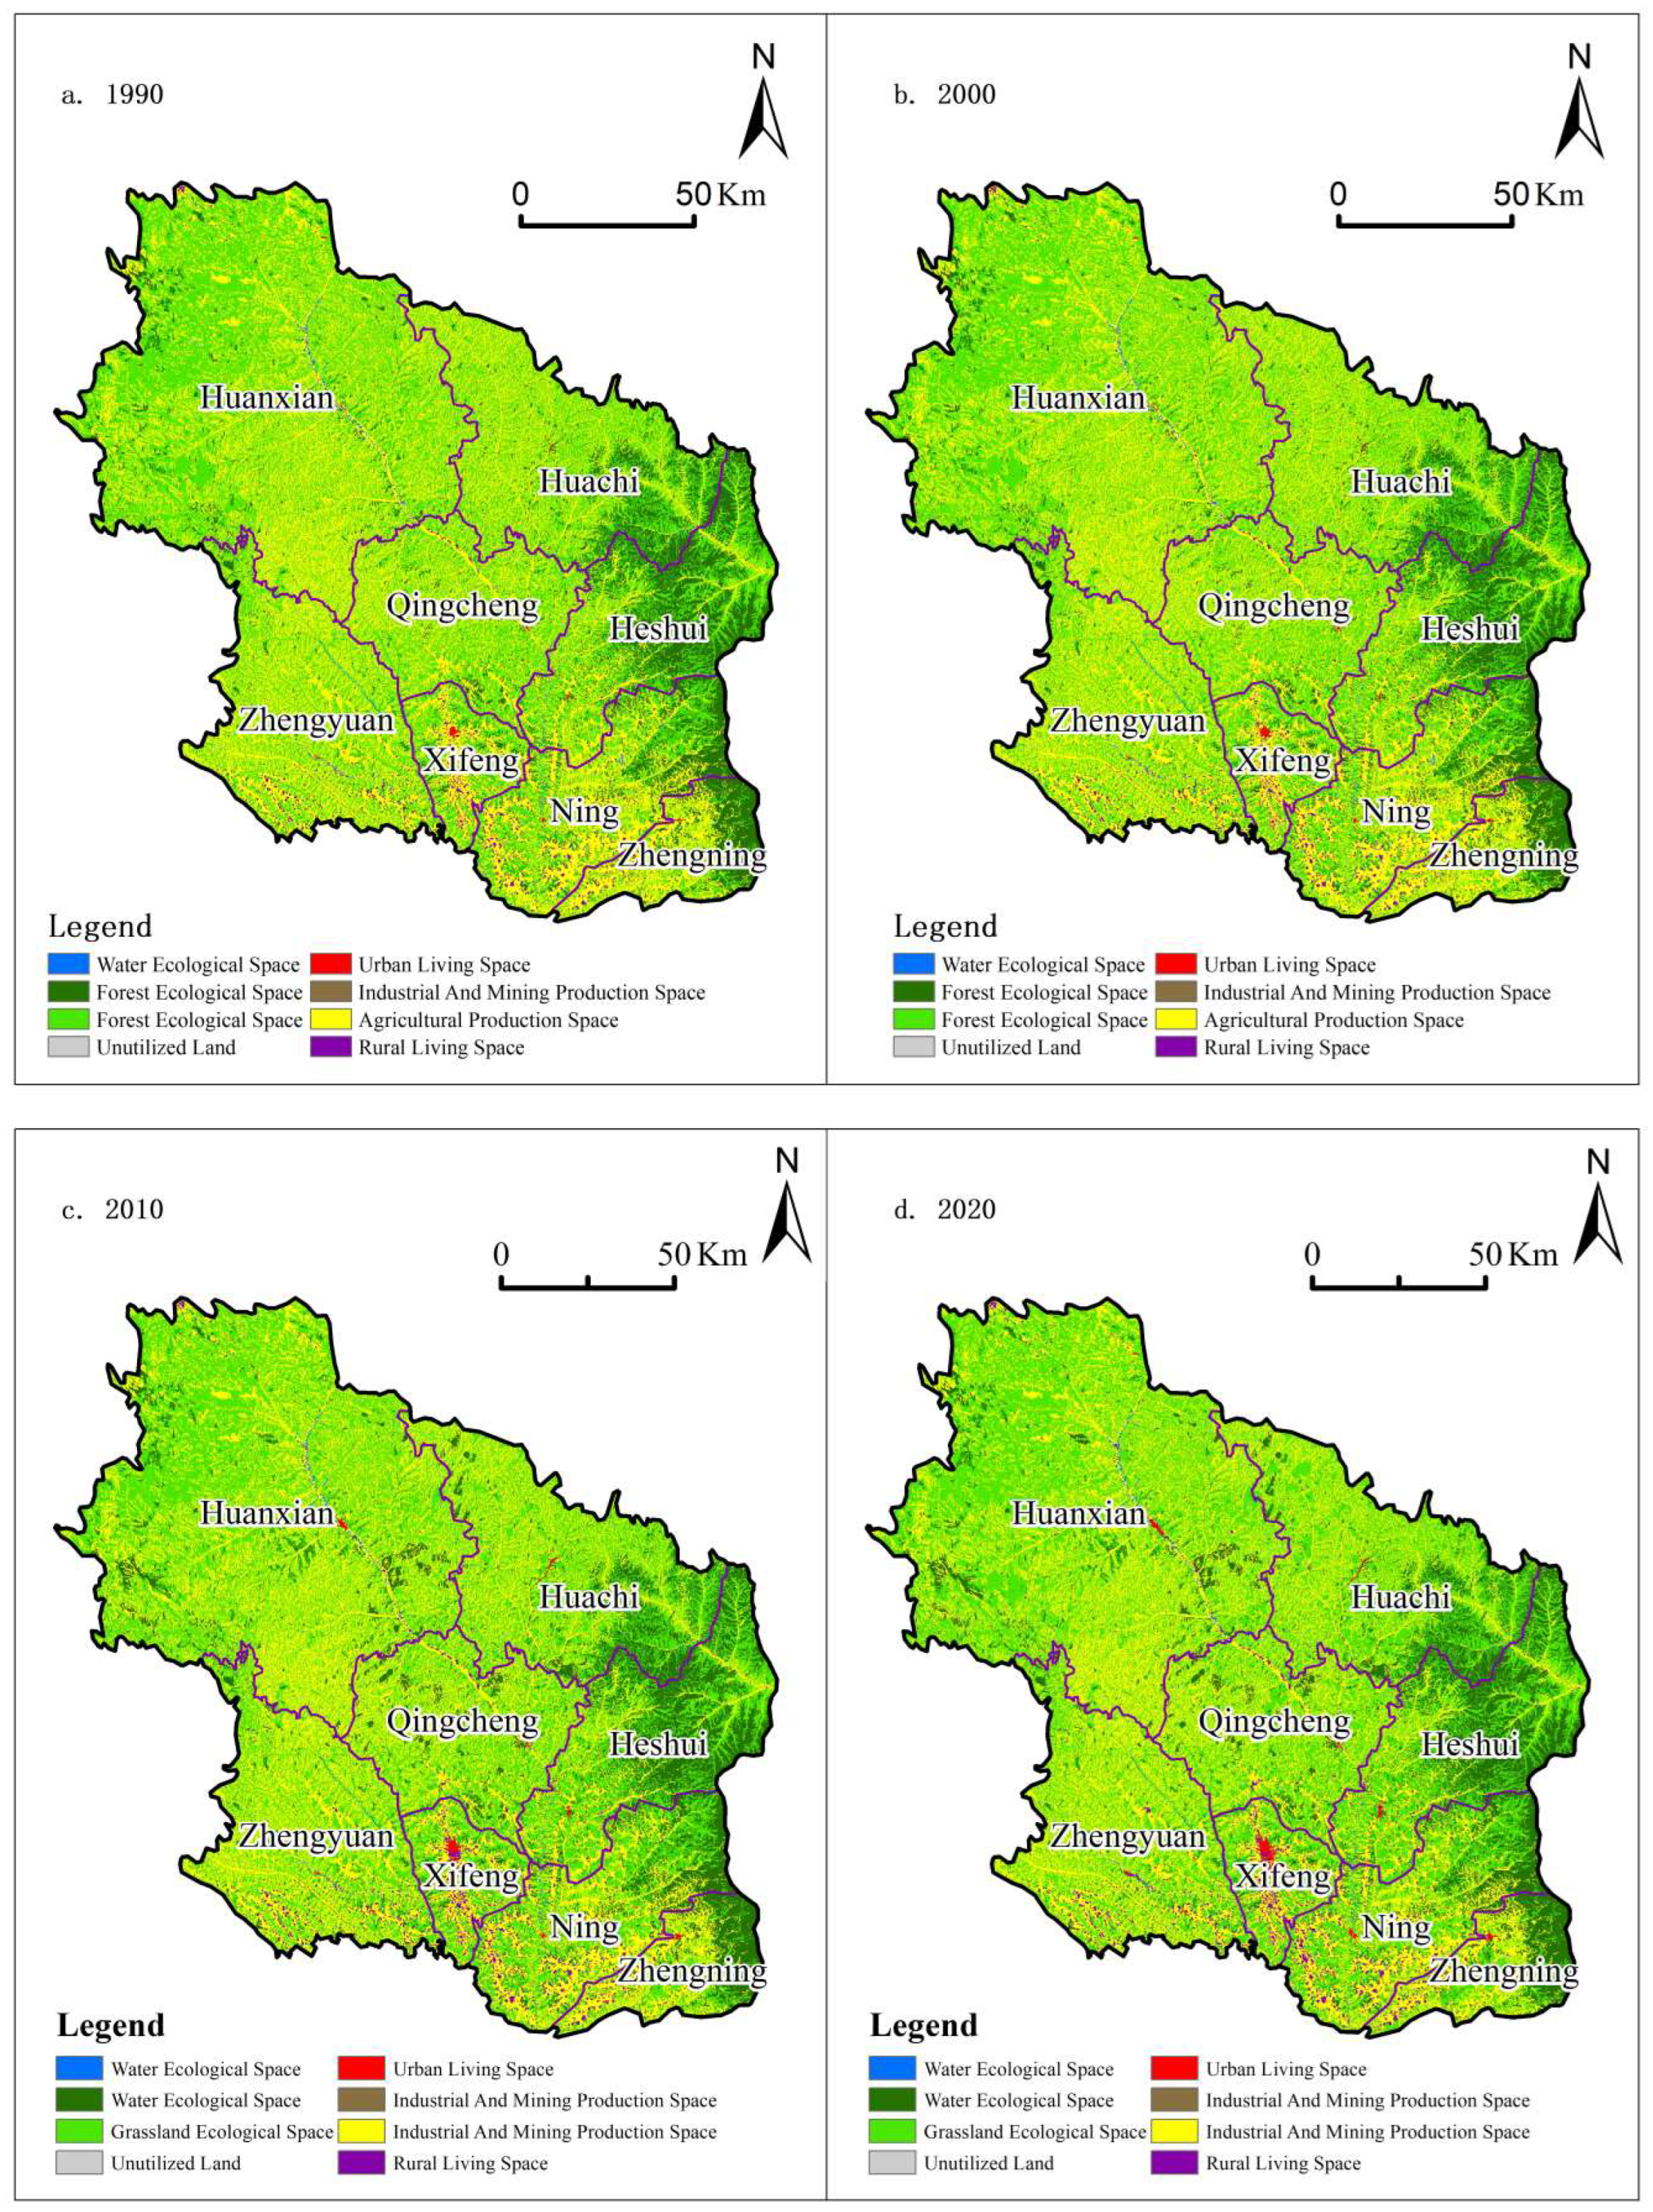
Figure 5.
Evolution of territorial special conflicts in Qingyang City (1990–2020).
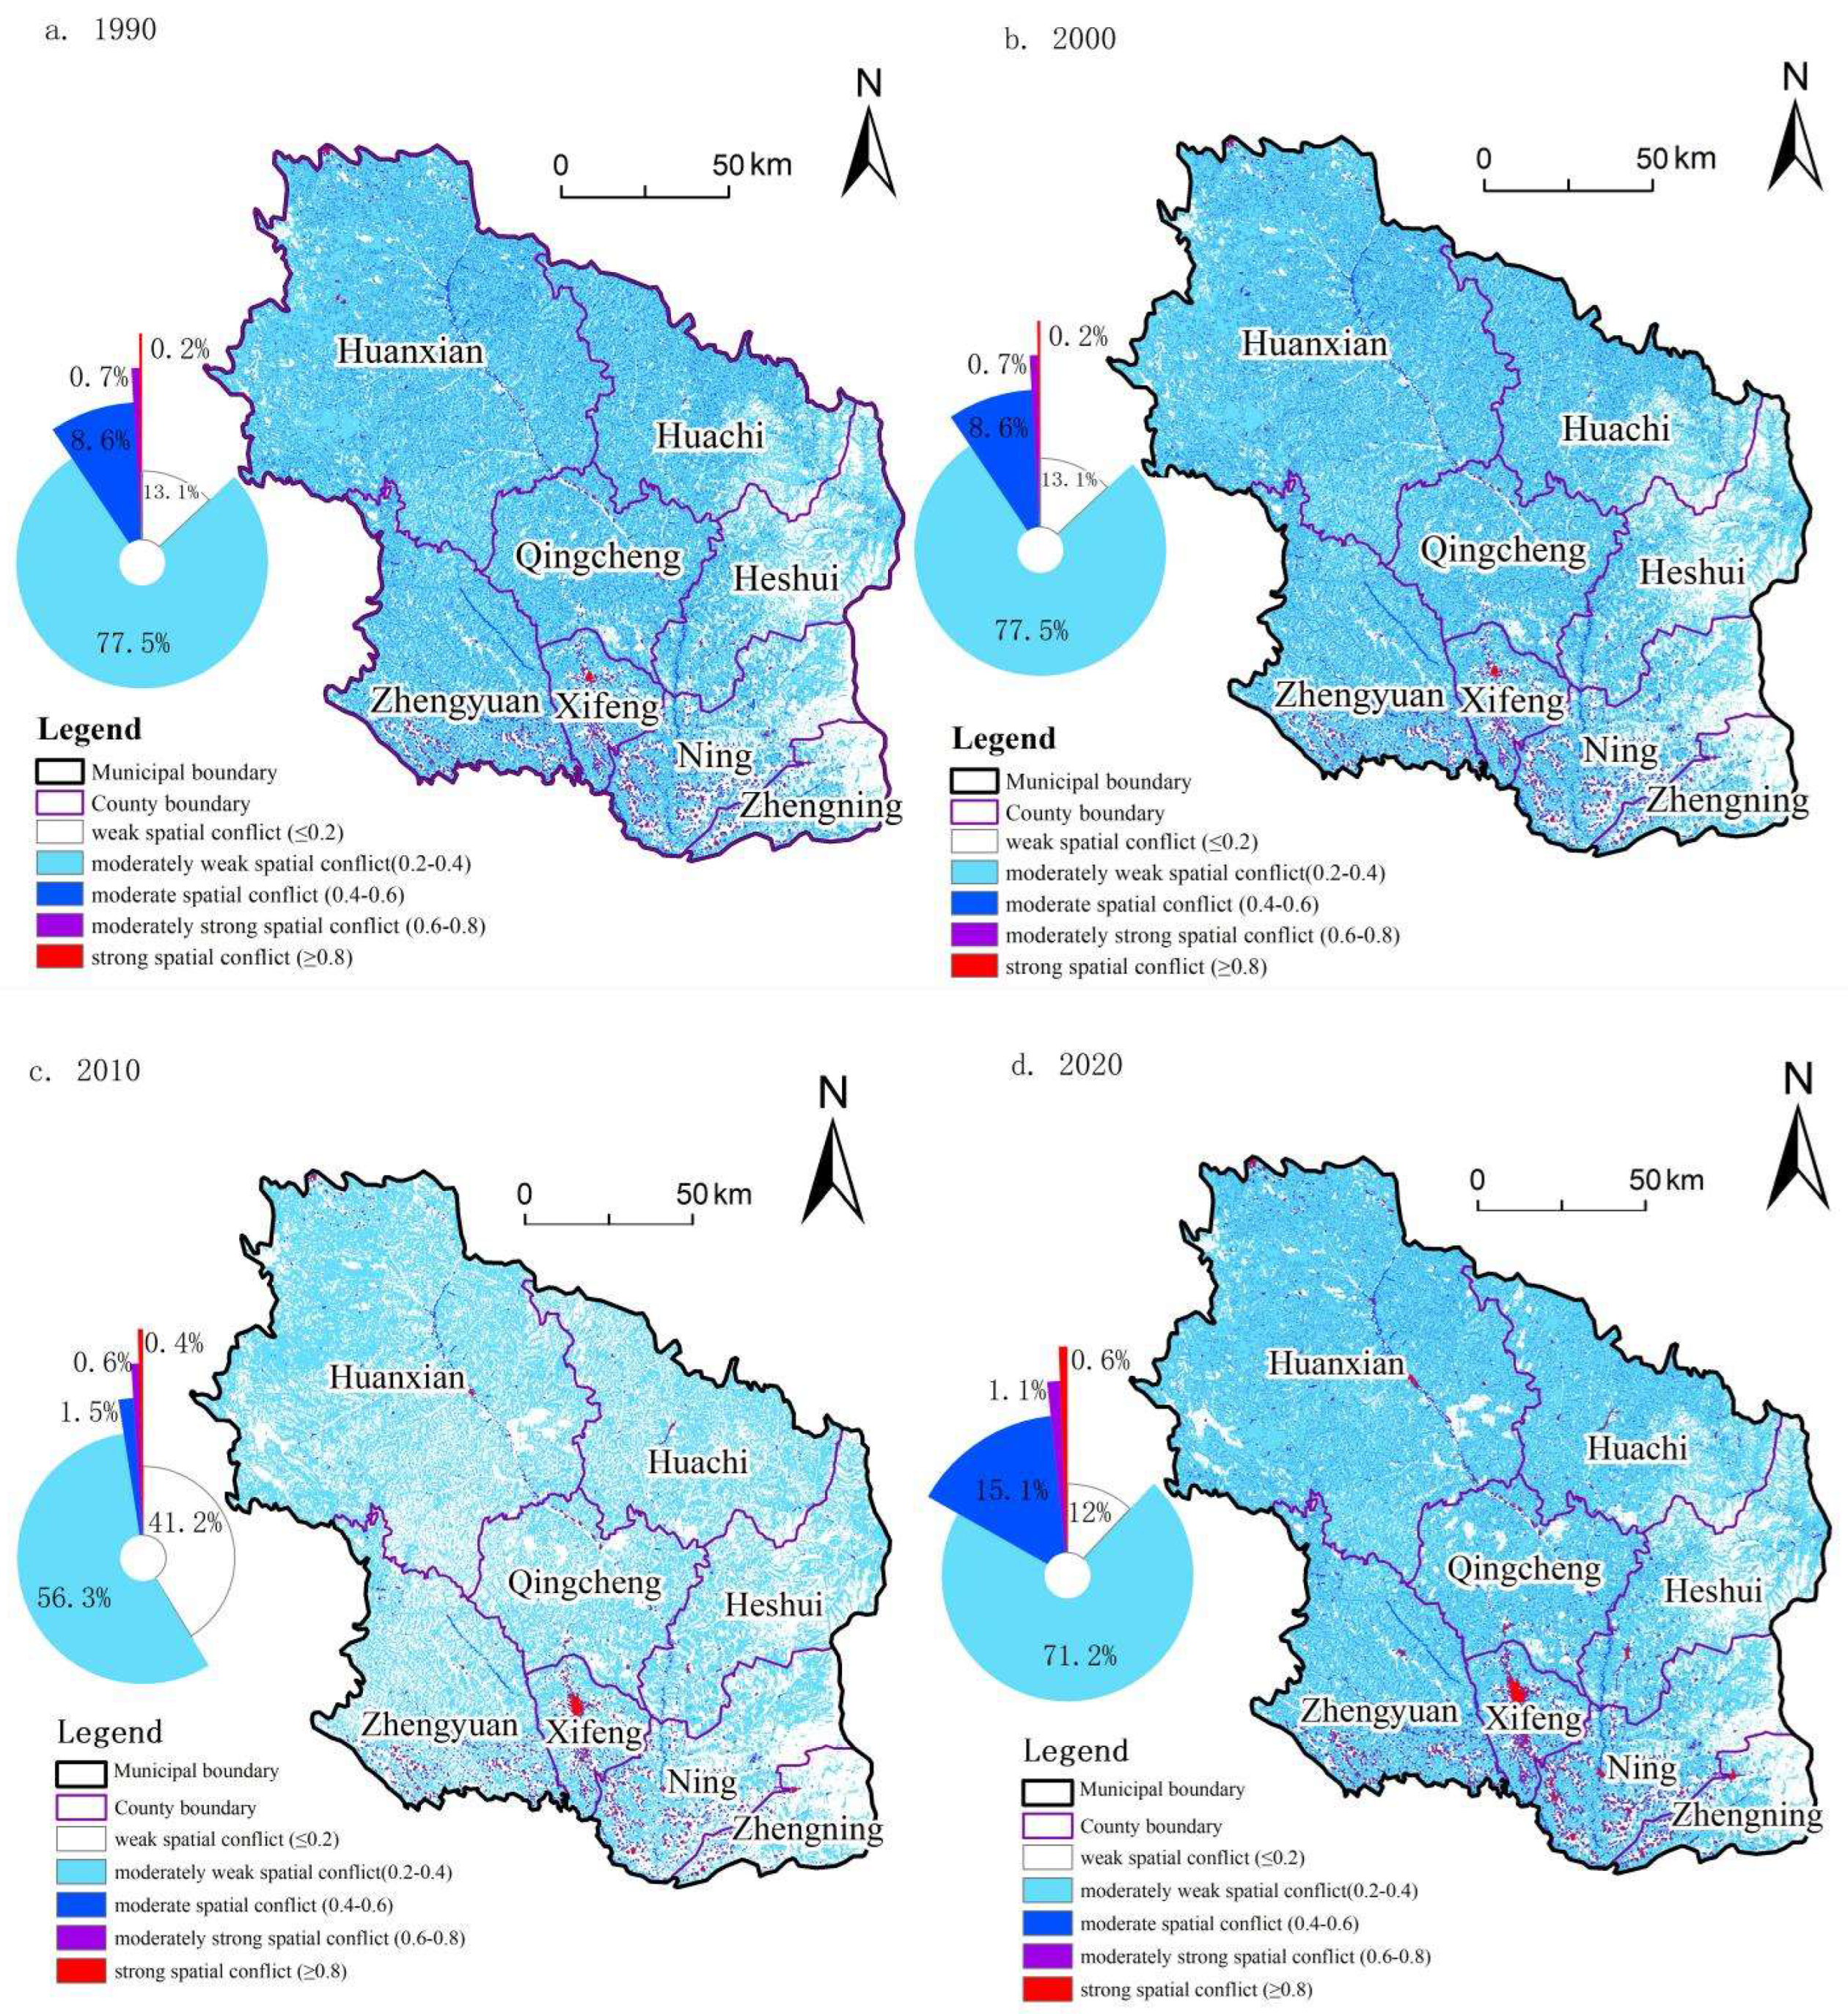
Figure 6.
Interaction of influencing factors for territorial spatial conflicts in the Qingyang region.
Figure 6.
Interaction of influencing factors for territorial spatial conflicts in the Qingyang region.
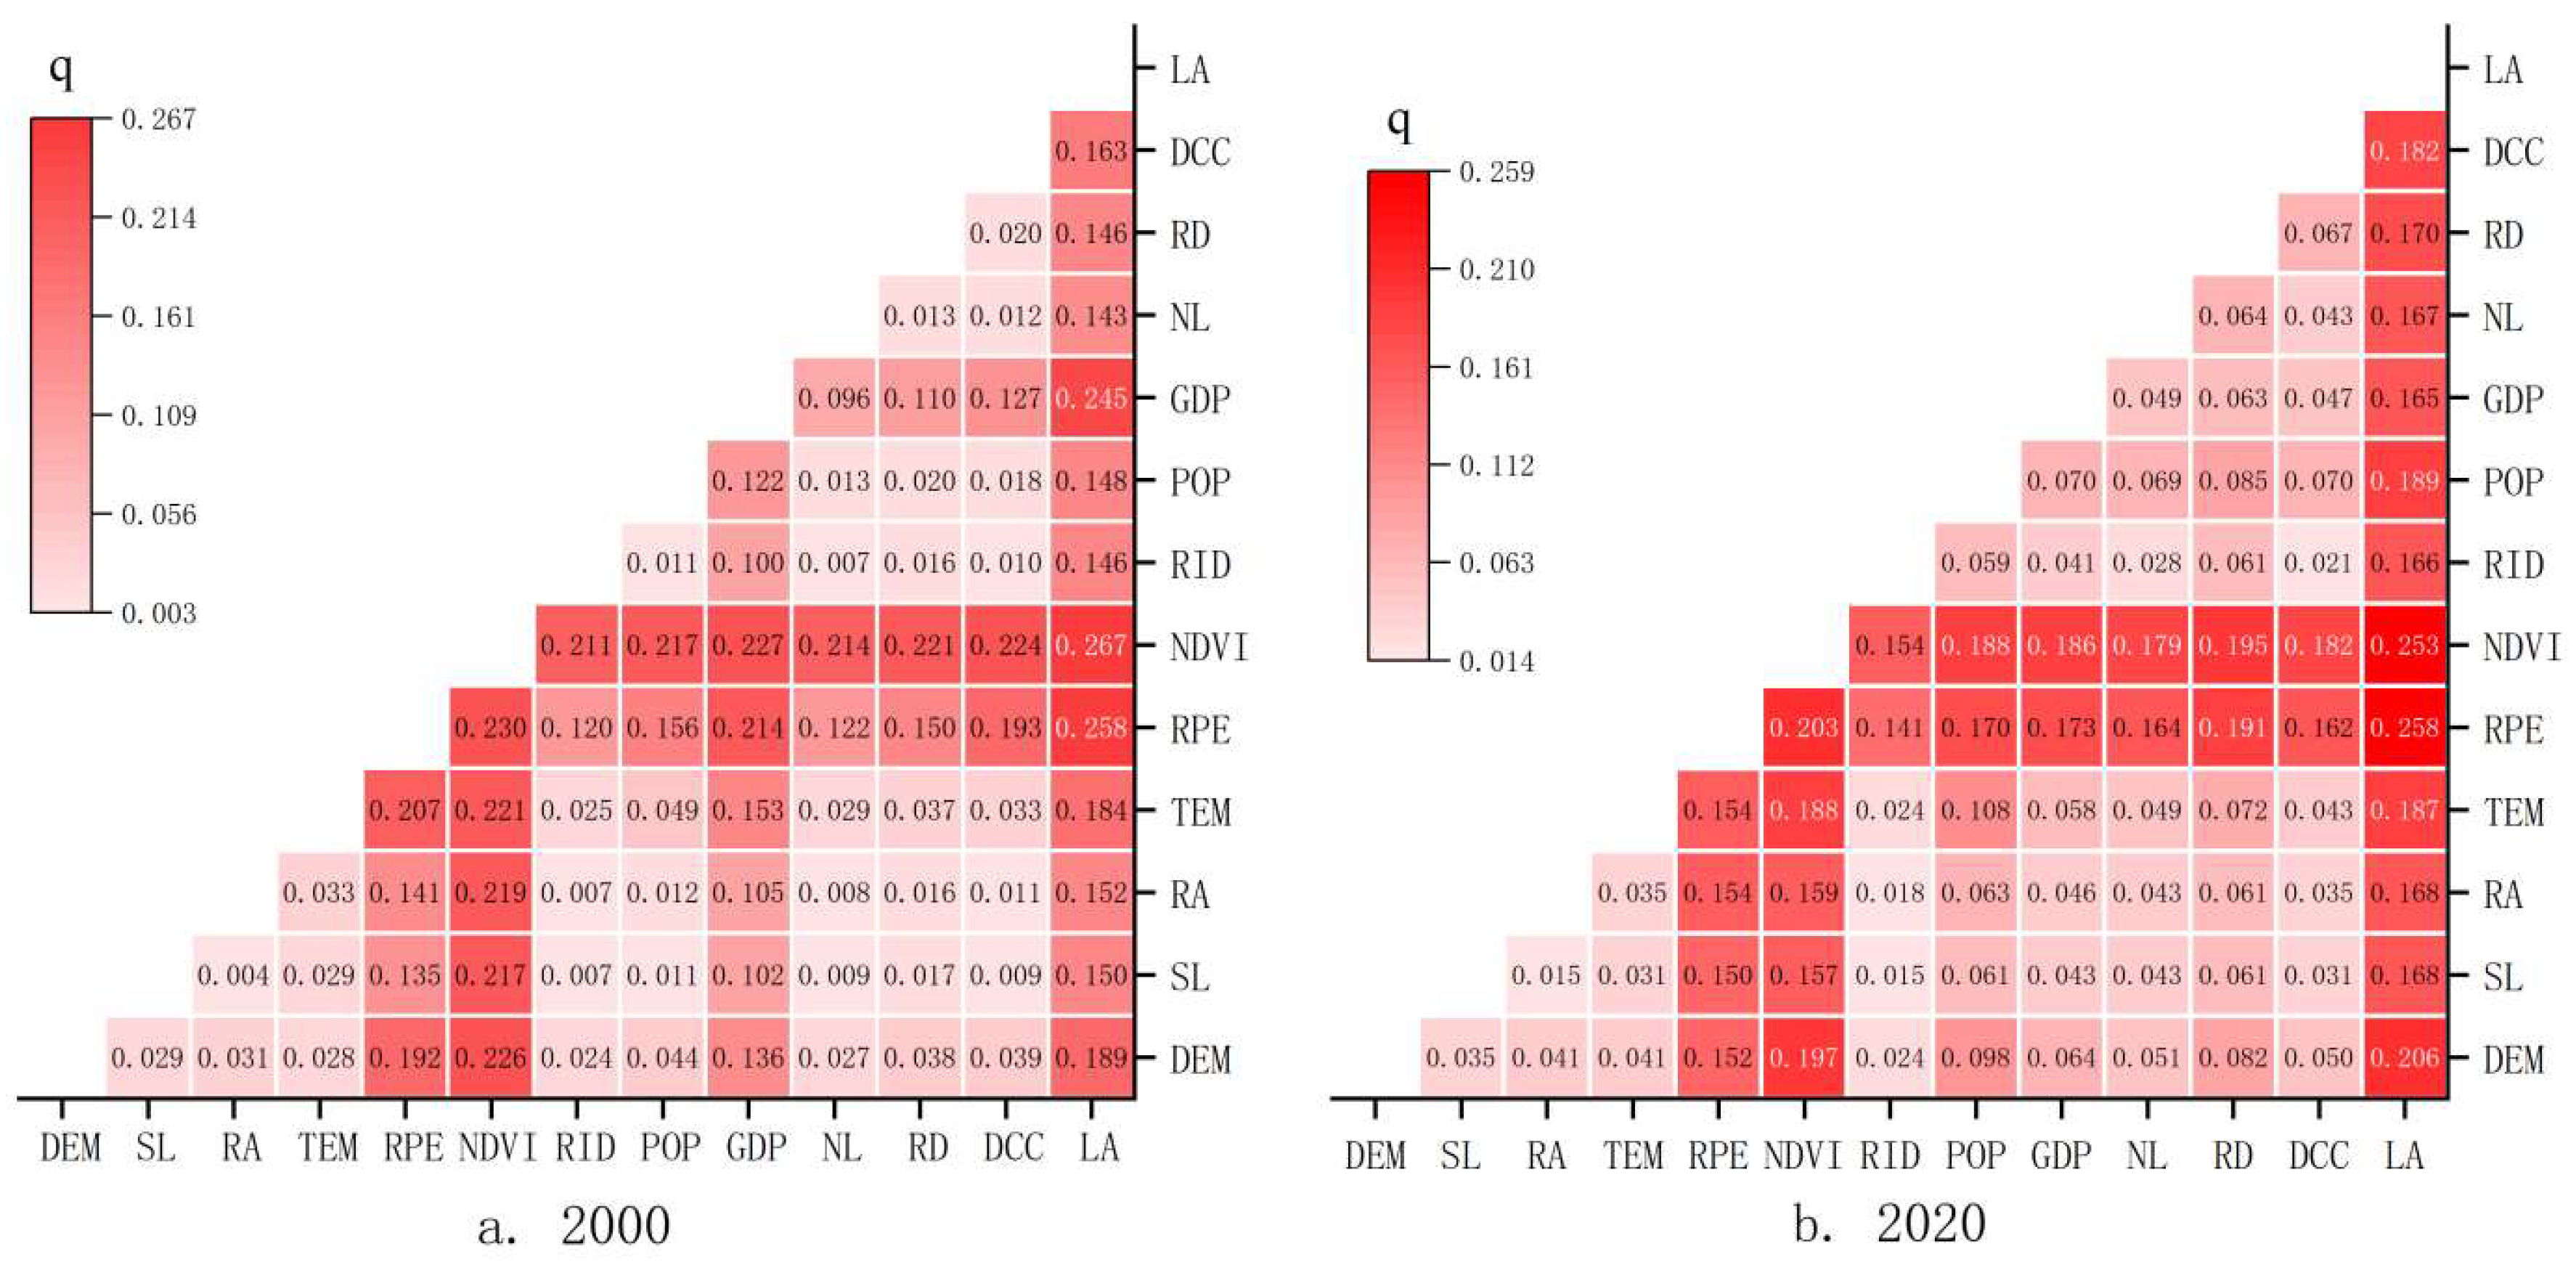

Table 1.
Territorial spatial classification system.
| Territorial space | Spatial type | Spatial type codes | Secondary land use classification |
| Ecological space | Water ecological space (WES) Forest ecological space (FES) Grassland ecological space (GES) Unutilized land (UL) |
1 2 3 4 |
41. Graff; 42. Lake; 43.Reservoirs and ponds; 46. Intertidal zone; 21. Forest land; 22. Shrubland; 23. Sparse wood; 24. Other forest land 31. High cover grassland; 32. Medium cover grassland; 33. Low-coverage grassland 61. Sandy land; 65. Bare land |
| Urban space | Urban living space (ULS) Industrial and mining production space (IMPS) |
5 6 |
51. Urban land 53. Other construction land (including land for factories, mines, large industrial zones, oilfields, salt fields, quarries, as well as transportation land, roads, airports, and special use land) |
| Agricultural space | Agricultural production space (APS) Rural living space (RLS) |
7 8 |
11. Paddy field; 12. Dry farm 52. Rural residential land |
Table 2.
Calculation method for the comprehensive index of territorial spatial conflicts.
| Index Name | Calculation Formula | Formula Description |
| Spatial complexity index (CI) | (2) | Pij represents the perimeter of the patch; aij denotes the area of the patch; A is the total area of the spatial type; ij refers to the jth spatial type within the ith spatial unit; m represents the total number of spatial evaluation units in the study area; and n is the total number of spatial types. |
| Spatial vulnerability index (FI) | (3) | Fi represents the vulnerability index of spatial type i; n is the total number of spatial types; ai denotes the area of each spatial type within the unit; S is the total area of the spatial unit. According to existing literature, the spatial vulnerability of Fi is ranked from highest to lowest as follows: construction land (6), forest land (5), water bodies (4), arable land (3), grassland (2), and unused land (1) (DONG et al., 2023). |
| Spatial stability index (SI) | (4) | ni represents the number of patches of spatial type i within the spatial unit; A denotes the area of the spatial unit. |
| Comprehensive spatial conflict index (SCCI) | (5) | SCCI stands for the Comprehensive Spatial Conflict Index; CI, FI, and SI represent the Spatial Complexity Index, Spatial Vulnerability Index, and Spatial Stability Index, respectively. |
Table 3.
Proportion of territorial spatial area in Qingyang City, 1990–2020.
| Year | Ecological space (%) | Urban space (%) | Agricultural space (%) | |||||
| WES | FES | GES | UL | ULS | ULS | APS | APS | |
| 1990 | 0.27% | 11.72% | 48.03% | 0.01% | 0.06% | 0.01% | 38.98% | 0.94% |
| 2000 | 0.27% | 11.59% | 48.13% | 0.01% | 0.06% | 0.01% | 38.91% | 1.02% |
| 2010 | 0.25% | 13.11% | 48.16% | 0.02% | 0.12% | 0.04% | 37.03% | 1.28% |
| 2020 | 0.26% | 13.14% | 49.29% | 0.03% | 0.19% | 0.08% | 35.62% | 1.39% |
Table 4.
Calculation results of the comprehensive territorial spatial conflict index for Qingyang City (1990–2020).
Table 4.
Calculation results of the comprehensive territorial spatial conflict index for Qingyang City (1990–2020).
| Type of Spatial Conflict | 1990 | 2000 | 2010 | 2020 | |||||
| Quantity (Number) | Proportion (%) | Quantity (Number) | Proportion (%) | Quantity (Number) | Proportion (%) | Quantity (Number) | Proportion (%) | ||
| weak spatial conflict (≤0.2) | 39206 | 13.06% | 39206 | 13.06% | 123742 | 41.24% | 36038 | 12.00% | |
| moderately weak spatial conflict (0.2-0.4) | 232569 | 77.49% | 232573 | 77.49% | 168910 | 56.29% | 213818 | 71.19% | |
| moderate spatial conflict (0.4-0.6) | 25712 | 8.57% | 25718 | 8.57% | 4486 | 1.50% | 45466 | 15.14% | |
| moderately strong spatial conflict (0.6-0.8) | 1975 | 0.66% | 1977 | 0.66% | 1850 | 0.62% | 3217 | 1.07% | |
| strong spatial conflict (≥0.8) | 669 | 0.22% | 657 | 0.22% | 1077 | 0.36% | 1821 | 0.61% | |
Table 5.
Influencing factors of territorial special conflicts in Qingyang City and their descriptions.
Table 5.
Influencing factors of territorial special conflicts in Qingyang City and their descriptions.
| Attribute | Influencing factors | Data source and description | Unit |
| Natural Factors | Digital elevation model (DEM) | 30 m resolution elevation data GDEMV2, sourced from the Geospatial Data Cloud platform of the Chinese Academy of Sciences (http://www.gscloud.cn) | m |
| Slope (SL) | Generated using the slope tool in ArcGIS, based on DEM data | degree | |
| Relief amplitude (RA) | The maximum elevation difference of the DEM (maximum DEM value - minimum DEM value), generated using the Focal Statistics tool in ArcGIS | dimensionless | |
| Annual mean temperature (TEM) | Geospatial Data Cloud platform of the Chinese Academy of Sciences. (http://www.resdc.cn), 1 km resolution | degree centigrade | |
| Annual mean precipitation (RPE) | Geospatial Data Cloud platform of the Chinese Academy of Sciences (http://www.resdc.cn), 1 km resolution | mm | |
| River density (RID) | Geospatial Data Cloud platform of the Chinese Academy of Sciences (http://www.resdc.cn), 1 km resolution | km/km2 | |
| Normalized difference vegetation index (NDVI) | Based on MODIS 16-day 250 m continuous time series NDVI and EVI data products, from the Chinese Academy of Sciences (http://www.resdc.cn) | dimensionless | |
| Socioeconomic Factors | Population density (POP) | Kilometer-grid data of population spatial distribution; Geospatial Data Cloud platform of the Chinese Academy of Sciences (http://www.resdc.cn), 1 km resolution | people/km² |
| Gross domestic product (GDP) | The Geospatial Data Cloud platform of the Chinese Academy of Sciences (http://www.resdc.cn), 1 km resolution | ¥10,000/km² | |
| Nighttime light index (NL) | Derived from two sets of nighttime light remote sensing data: DMSP/OLS (1992–2013) and NPP/VIIRS (2012 to present); Geospatial Data Cloud platform of the Chinese Academy of Sciences (http://www.resdc.cn), 1 km resolution | dimensionless | |
| Land use intensity (LA) | The Comprehensive Index of Land Use Intensity reflects the overall level of land use intensification for all land use types within a specific year. (9) In the formula, La represents the Comprehensive Land Use Intensity Index, Ai denotes the land use intensity classification index for the ith level, Ci is the percentage of land area for the ith land use intensity classification |
dimensionless | |
| Locational Condition Factors | Road density (RD) | National Geomatics Center of China 1:1,000,000 Fundamental Geographic Database (http://ngcc.sbsm.gov.cn) | km/km2 |
| Distance from county center (DCC) | The coordinates of the county and district centers were obtained from Amap, and the Euclidean distance was calculated using the ArcGIS Euclidean Distance tool | km |
Table 6.
Parameter combinations of different factors when the q value is at its maximum.
| 2000 | 2020 | ||||||
| Variable factors | Symbol | Break method | Number of breaks | Variable factors | Symbol | Break method | Number of breaks |
| RA | X3 | Standard deviation | 9 | TEM | X4 | Standard deviation | 9 |
| DEM | X1 | Quantile | 10 | NL | X10 | 10 | |
| RID | X7 | 10 | DCC | X12 | 10 | ||
| GDP | X9 | 9 | DEM | X1 | Quantile | 10 | |
| NL | X10 | 10 | SL | X2 | Geometric | 9 | |
| SL | X2 | Geometric | 9 | RA | X3 | 9 | |
| POP | X8 | 7 | RID | X7 | 8 | ||
| RD | X11 | 9 | POP | X8 | 8 | ||
| DCC | X12 | Natural | 6 | GDP | X9 | 9 | |
| TEM | X4 | Equal | 10 | RPE | X5 | Equal | 10 |
| RPE | X5 | 10 | NDVI | X6 | 10 | ||
| NDVI | X6 | 9 | LA | X13 | 10 | ||
| LA | X13 | 10 | RD | X11 | Natural | 9 | |
Table 7.
Detection results of single factors influencing territorial spatial conflicts in Qingyang City.
Table 7.
Detection results of single factors influencing territorial spatial conflicts in Qingyang City.
| Impact factors | 2000 | 2020 | ||||
| q | p | Ranking by q value | q | p | Ranking by q value | |
| DEM | 0.0210 | 0 | 6 | 0.0202 | 0 | 8 |
| SL | 0.0018 | 0 | 13 | 0.0090 | 0 | 12 |
| RA | 0.0020 | 0 | 12 | 0.0135 | 0 | 11 |
| TEM | 0.0217 | 0 | 5 | 0.0197 | 0 | 9 |
| PRE | 0.1142 | 0 | 3 | 0.1358 | 0 | 3 |
| NDVI | 0.2083 | 0 | 1 | 0.1481 | 0 | 2 |
| RID | 0.0032 | 0.3206 | 11 | 0.0048 | 0 | 13 |
| POP | 0.0079 | 0 | 8 | 0.0512 | 0 | 5 |
| GDP | 0.0917 | 0 | 4 | 0.0364 | 0 | 6 |
| NL | 0.0043 | 0.6163 | 10 | 0.0215 | 0 | 7 |
| RD | 0.0117 | 0 | 7 | 0.0563 | 0 | 4 |
| DCC | 0.0050 | 0 | 9 | 0.0149 | 0 | 10 |
| LA | 0.1409 | 0 | 2 | 0.1622 | 0 | 1 |
Disclaimer/Publisher’s Note: The statements, opinions and data contained in all publications are solely those of the individual author(s) and contributor(s) and not of MDPI and/or the editor(s). MDPI and/or the editor(s) disclaim responsibility for any injury to people or property resulting from any ideas, methods, instructions or products referred to in the content. |
© 2025 by the authors. Licensee MDPI, Basel, Switzerland. This article is an open access article distributed under the terms and conditions of the Creative Commons Attribution (CC BY) license (http://creativecommons.org/licenses/by/4.0/).
Copyright: This open access article is published under a Creative Commons CC BY 4.0 license, which permit the free download, distribution, and reuse, provided that the author and preprint are cited in any reuse.


