Submitted:
23 February 2025
Posted:
24 February 2025
You are already at the latest version
Abstract
In recent years, rock burst accidents have frequently occurred in deep mining operations in China's coal mines. With the gradual increase in mining depth of inclined coal seams in many mining areas, the threat of rock burst disasters in working faces has intensified. This paper employs a comprehensive approach, including theoretical analysis, numerical simulation, and field measurements, to analyze the movement of overlying strata and the distribution laws of abutment pressure in inclined coal seam working faces. A computational model for stress superposition on the working face and the solid coal side of the gate road is established. Based on stress control theory, a method for assessing rock burst risk in inclined coal seam working faces is proposed. By analyzing the calculated results of abutment pressure and numerical simulation results, the rock burst risk level of the working face is comprehensively determined. Building on theoretical analysis and field measurements, the relationship between deep mining pressure and rock burst in inclined coal seam working faces is further investigated. The results indicate that the theoretical model calculates a medium rock burst risk level during the square period of the working face, with abutment pressure reaching its maximum value. The microseismic events and energy release also peak, validating the rationality of the theoretical model. The numerical simulation results and field monitoring data collectively demonstrate that mining pressure manifestations are most pronounced during the square period of the working face. By combining the established model to assess the rock burst risk level, the research confirms the mining pressure manifestation laws during the square period. The calculated rock burst risk level aligns with field conditions, providing guidance for subsequent mining operations and rock burst prevention during the square period of the working face.
Keywords:
deep mines
; inclined coal seams
; mining pressure manifestation laws
; rock burst
; risk assessment
1. Introduction
Inclined coal seams are widely distributed in China, characterized by complex geological conditions and significant mining challenges. Although inclined coal seams account for only 10.16% of the total minable coal reserves[1], their superior coal quality and the large number of mines operating in such seams underscore their economic importance. According to the list of severe disaster-prone coal mines released by the National Mine Safety Administration on April 15, 2024, there are 138 rock burst-prone production coal mines nationwide. Provinces with the highest concentrations include Shandong (37 mines), Shaanxi (29 mines), Heilongjiang (13 mines), and Inner Mongolia (11 mines). Among these 138 rock burst-prone mines, inclined coal seam mines account for 10%, and this proportion is expected to rise as mining depths increase.In recent years, multiple rock burst accidents have occurred in inclined coal seam mines. Notable examples include:2016: A significant roof collapse (triggered by a rock burst) at Junde Coal Mine of Longmei Hegang Mining Co., Ltd. (coal seam dip angle: 32.5°), resulting in 5 fatalities.January 17, 2017: A major roof accident caused by a rock burst at Danshuigou Coal Industry Co., Ltd. (coal seam dip angle: 22°–37°), leading to 10 fatalities.June 9, 2019: A rock burst incident in the haulage gateway of the 305 fully mechanized mining face at Longjiabao Mining Co., Ltd. (coal seam dip angle: 18°), causing 9 fatalities and 12 injuries.January 1, 2023: A rock burst accident in the (4-5) 06W belt gateway development face at Yankuang Liuhuanggou Coal Mine (coal seam dip angle: 22°–26°), resulting in 1 fatality and 1 injury.Table 1.1 summarizes selected inclined coal seam mines with recorded rock burst incidents, as compiled by the author.

Table 1.1.
Partially inclined coal seam rock burst mine
| Name of rock burst mine | provinces and cities | dip angle of coal seam |
| Shanxi Zhongmei Danshuigou Coal Industry Co., Ltd. | Shuozhou City, Shanxi Province | 22°~37° (average 29°) |
| Otog Front Banner Great Wall No.5 Mining Co., Ltd., Inner Mongolia | Ordos City, Inner Mongolia Autonomous Region | 20°~34° |
| Junde Coal Mine, Longmei Hegang Mining Co., Ltd., Heilongjiang | Hegang City, Heilongjiang Province | 32.5° |
| Yangcheng Coal Mine, Jikuang Luneng Coal & Power Co., Ltd., Shandong | Jining City, Shandong Province | 25° |
| Shanjia Village Coal Mine, Yulong Mining Group Co., Ltd., Shandong | Jining City, Shandong Province | 30° |
| Suncun Coal Mine, Xinwen Mining Group Co., Ltd., Shandong | Tai 'an Xintai City | average 27° |
| Panxi Coal Mine, Shandong Wanxiang Mining Co., Ltd. | Jinan City, Shandong Province | 18~29° (average 26°) |
| No.4 Shaft, Wangjiashan Coal Mine Branch, Jingmei Energy Co., Ltd., Gansu | Baiyin City, Gansu Province | 28~55° (average 41°) |
| Dongxia Coal Mine, Huating Coal & Electricity Co., Ltd., Gansu | Pingliang City, Gansu Province | average 34.5° |
| Liuhuanggou Coal Mine, Yankuang Xinjiang Mining Co., Ltd. | Changji Hui Autonomous Prefecture of Xinjiang Uygur Autonomous Region | 22°~26° |
The abutment pressure distribution in surrounding rock masses differs significantly between inclined and horizontal coal seam conditions. In inclined coal seams, both vertical and horizontal stresses act as stress components during mining. The mining-induced stresses acting on the two sides of the working face in inclined coal seams are asymmetrical, with the abutment pressure on the lower gate road side generally exceeding that on the upper gate road side. In recent years, as mining depths have increased in some inclined coal seam operations, mining pressure manifestations have intensified, accompanied by heightened risks of rock burst disasters.
In the field of mining pressure law research, scholars have conducted in-depth investigations through diverse methodologies:Kong Linghai[2] employed microseismic monitoring technology to study the dynamic correlations between microseismic events, strata movement, and mining pressure manifestations during the square period of longwall faces. His work revealed how microseismic signals reflect critical stages of roof fracturing.Wang Jin'an[3] established a thin-plate mechanical model for the main roof of steeply inclined coal seams under combined transverse and longitudinal loads, based on elastic mechanics theory. He identified the developmental trajectory of main roof fracture lines and proposed the "V-Y-shaped fracture pattern" for the initial rupture of steeply inclined coal seam roofs.Gao Xicai[4] utilized physical similarity simulation experiments and field monitoring to analyze overlying strata movement laws in fully mechanized top-coal caving mining faces with variable-angle and fixed-angle layouts in steeply inclined coal seams. His findings highlighted the asymmetric subsidence characteristics induced by dip angle variations.Tan Yunliang[5] statistically analyzed hard roof fracture patterns across multiple Chinese coal mines, establishing quantitative criteria for roof weighting during the square period. His research emphasized the critical role of roof stiffness and span-to-thickness ratios in triggering intense strata behavior.
In the study of abutment pressure, scholars have advanced the understanding of stress distribution mechanisms through multidisciplinary approaches:Luo Shenghu[6] integrated field measurements, theoretical analysis, and numerical modeling to investigate the spatiotemporal evolution of mining-induced stress transfer paths in roof strata and their dip angle dependency. His research quantified how seam inclination amplifies stress asymmetry and alters energy accumulation zones.Wang Hongwei[7] developed a novel 3D loadable physical model system to simulate strata behavior. Experimental results demonstrated that in the upper section of the working face, overlying strata collapse thoroughly with extensive fracture networks, forming a high-positioned key stratum. Conversely, the lower section exhibits incomplete collapse, a low-positioned key stratum, and an asymmetric arch-shell structure in the caved zone. Critical parameters such as stress magnitude, weighting intensity, and stress concentration coefficients in the abutment pressure zone were 1.5–2.2 times higher in the upper section than in the lower section.Liu Jinhai[8] conducted numerical simulations to characterize abutment pressure distribution during the square period. His findings revealed a bimodal stress profile with peak concentrations near the coal wall and goaf edge, correlating with dynamic roof fracturing events.Jiang Fuxing[9] established an engineering mechanics model for gob-side entries, identifying that high-stress gradient zones adjacent to abutment pressure regions serve as primary loci for rock burst initiation. This stress-driven mechanism explains 78% of dynamic failures in deep inclined seams, per field validations.
In the domain of rock burst risk assessment, researchers have developed innovative methodologies integrating theoretical frameworks and advanced computational models:Wang Cunwen[10] proposed a rock burst prediction method grounded in the overlying strata spatial structure theory. By analyzing the stratigraphic composition, movement patterns, and stress distribution characteristics of "S-shaped overlying strata spatial structures" through mechanical modeling, his work established a theoretical basis for identifying high-risk zones in inclined coal seams.Cui Feng[11] investigated the spatiotemporal evolution of microseismic parameters during roadway excavation in steeply inclined and ultra-thick coal seams. He developed a PSR-LSTM prediction model (Pressure-State-Response Long Short-Term Memory) by integrating deep learning with multivariate chaotic time series analysis, achieving an accuracy of 89.2% in early warning of dynamic pressure events.Wang Chao[12] established three mechanical models of roof structures based on the failure degree of overlying strata in gob areas. He introduced a risk evaluation index system incorporating roof structural features (e.g., fracture density, energy release rate) and formulated a hierarchical assessment framework to quantify rock burst susceptibility under varying geological conditions.
Based on the aforementioned research landscape, scholars have extensively investigated mining pressure laws in inclined coal seams through diverse methodologies. However, most rock burst risk assessment studies focus on subhorizontal coal seams and steeply inclined coal seams, with limited attention to moderately inclined coal seams. To address this gap, this study systematically investigates the mining pressure manifestation laws during the square period of deep inclined coal seam working faces by integrating theoretical analysis and field measurements. Building on conventional mining pressure theory, we propose a rock burst risk assessment methodology tailored to deep inclined coal seams. The findings provide critical insights for safe mining operations during subsequent square periods in similar geological conditions.
2. Project Profile
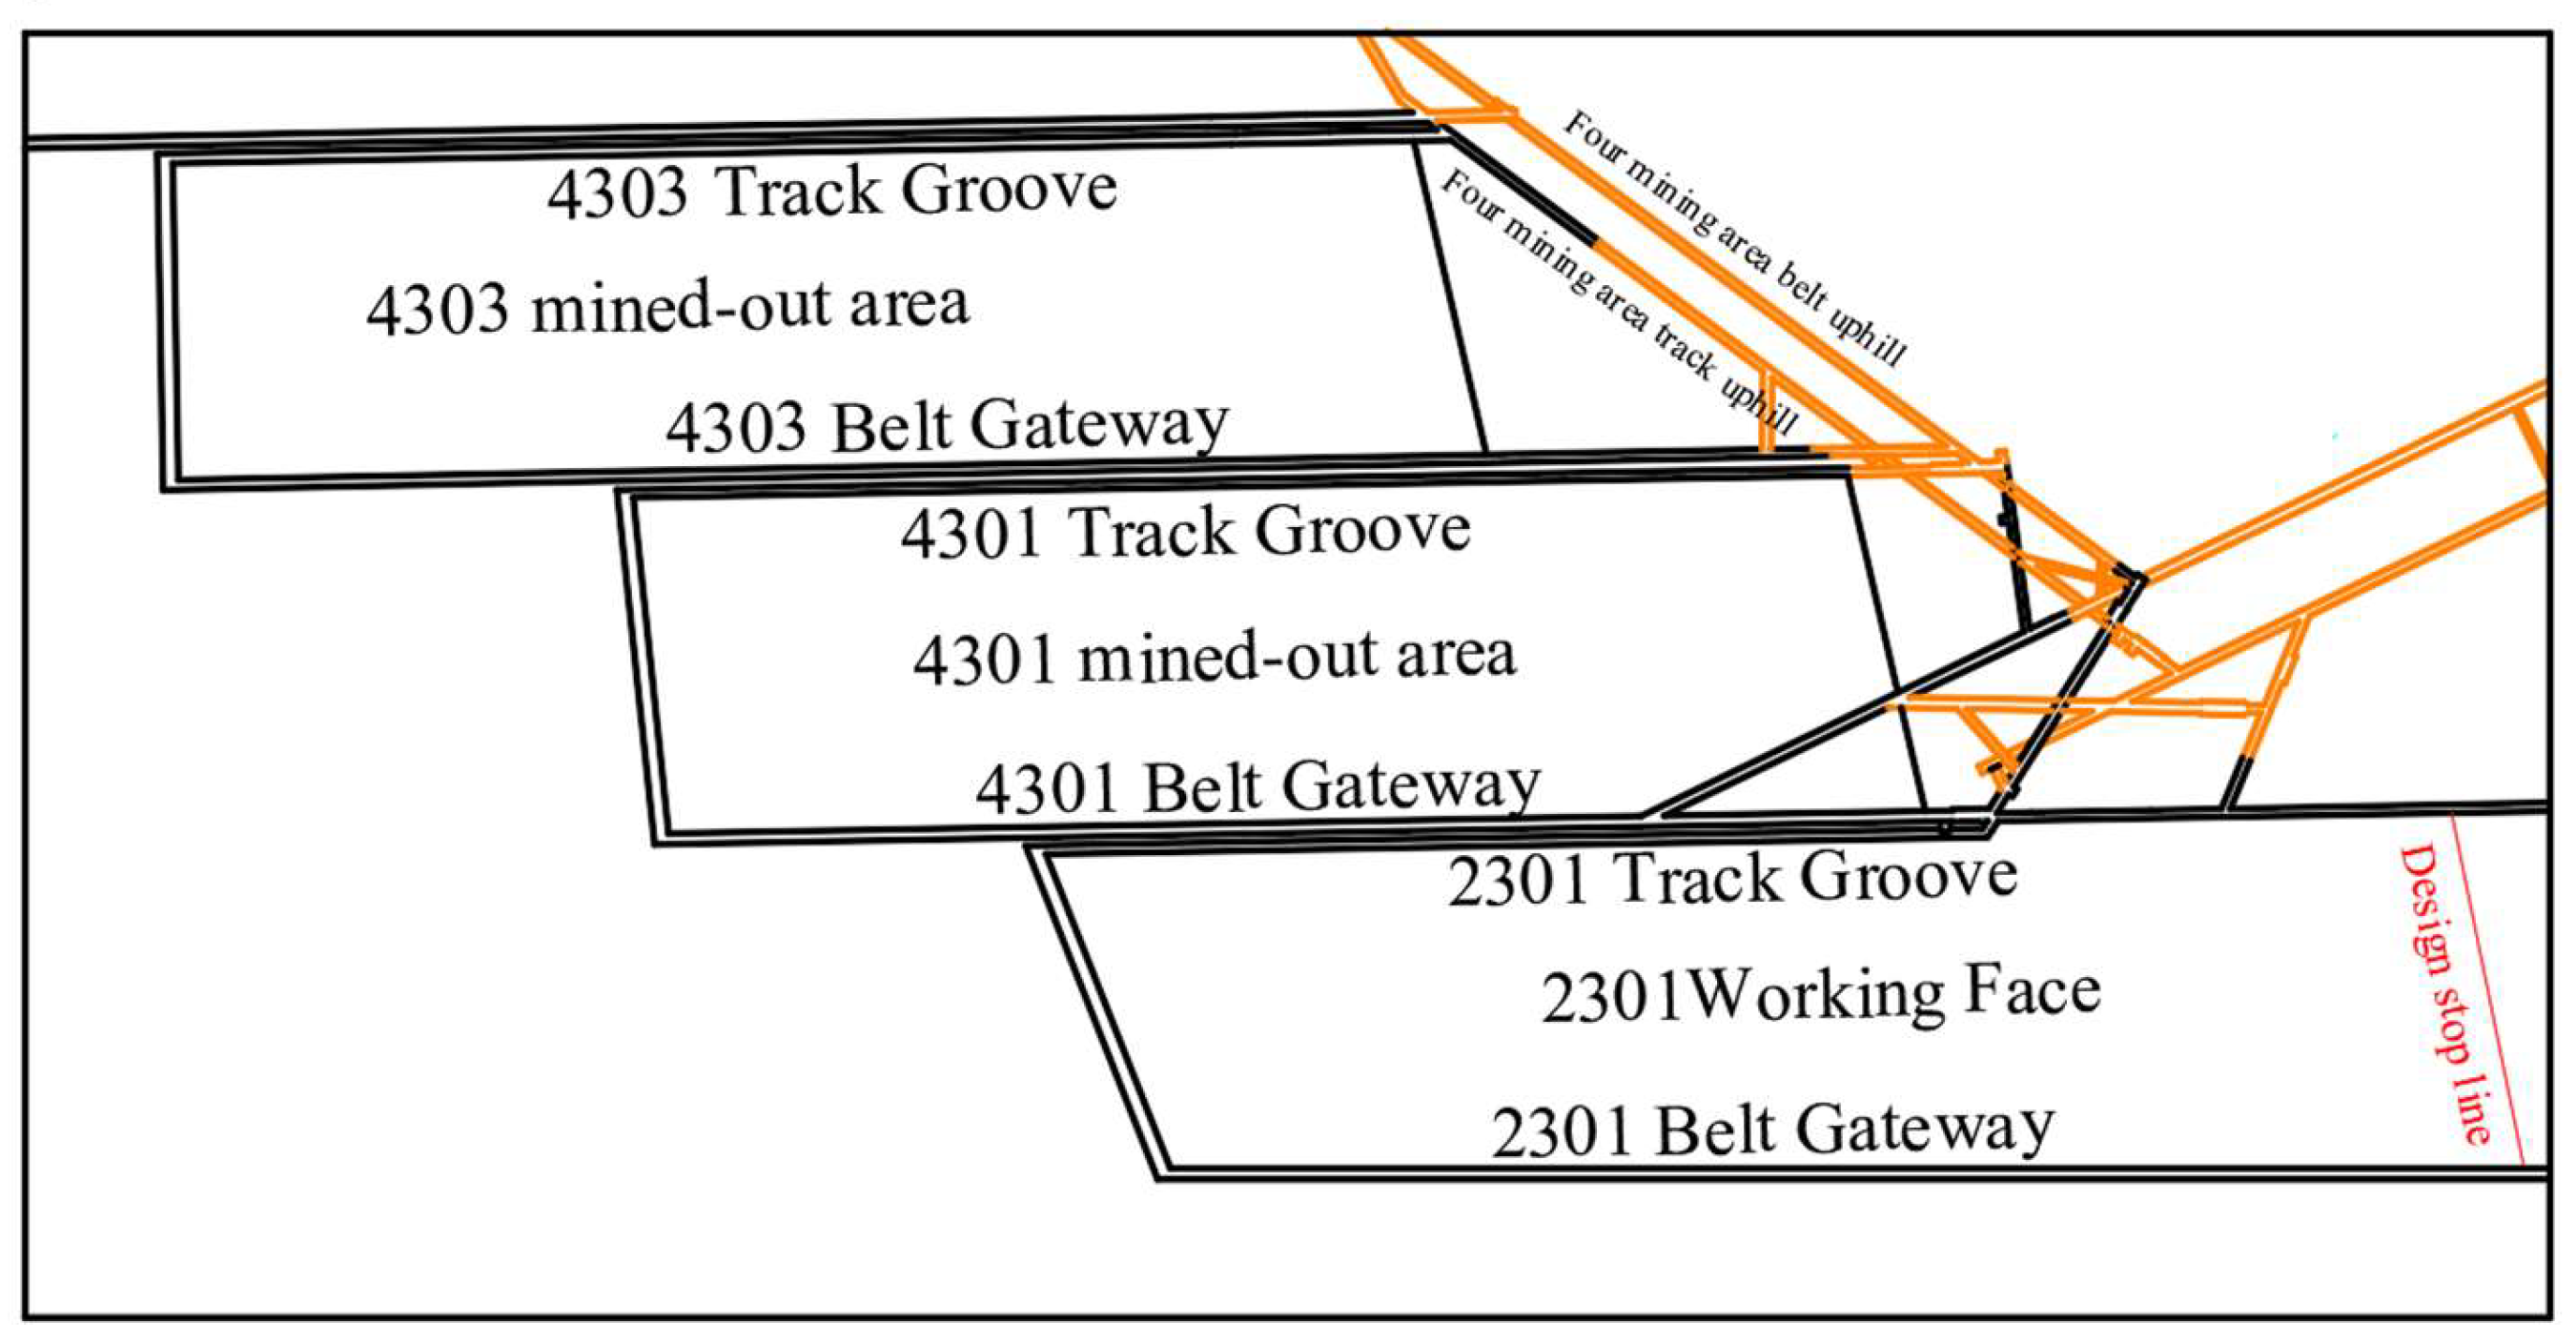
The 2301 fully mechanized top-coal caving mining face extracts coal from the No. 3 coal seam, which has an average thickness of 7.5 m, a simple structure, and is classified as a stable coal seam. The ground surface elevation of the working face ranges from +36.7 m to +40.3 m, while the roof and floor elevations of the coal seam span -597.0 m to -752.5 m. The face has an average dip angle of 25° and is situated in the No. 2 Mining District, serving as the district’s first mining face. It is adjacent to the following geological and operational boundaries:
Northwest: Gob areas of the 4301 and 4303 working faces.
North: 2302 working face.
East: DF38 fault.
The working face has a length of 160 m and a planned advancing length of 733 m. Mining employs the fully mechanized top-coal caving method, with the complete caving method adopted for roof management.
Figure 2.1.
Overview of 2301 working face
The No. 3 coal seam in this mine exhibits the following mechanical and dynamic properties:
Uniaxial compressive strength: Average value of 7.70 MPa.
Dynamic failure time: Average value of 175.67 ms.
Elastic energy index: Average value of 3.64.
Impact energy index: Average value of 2.22.
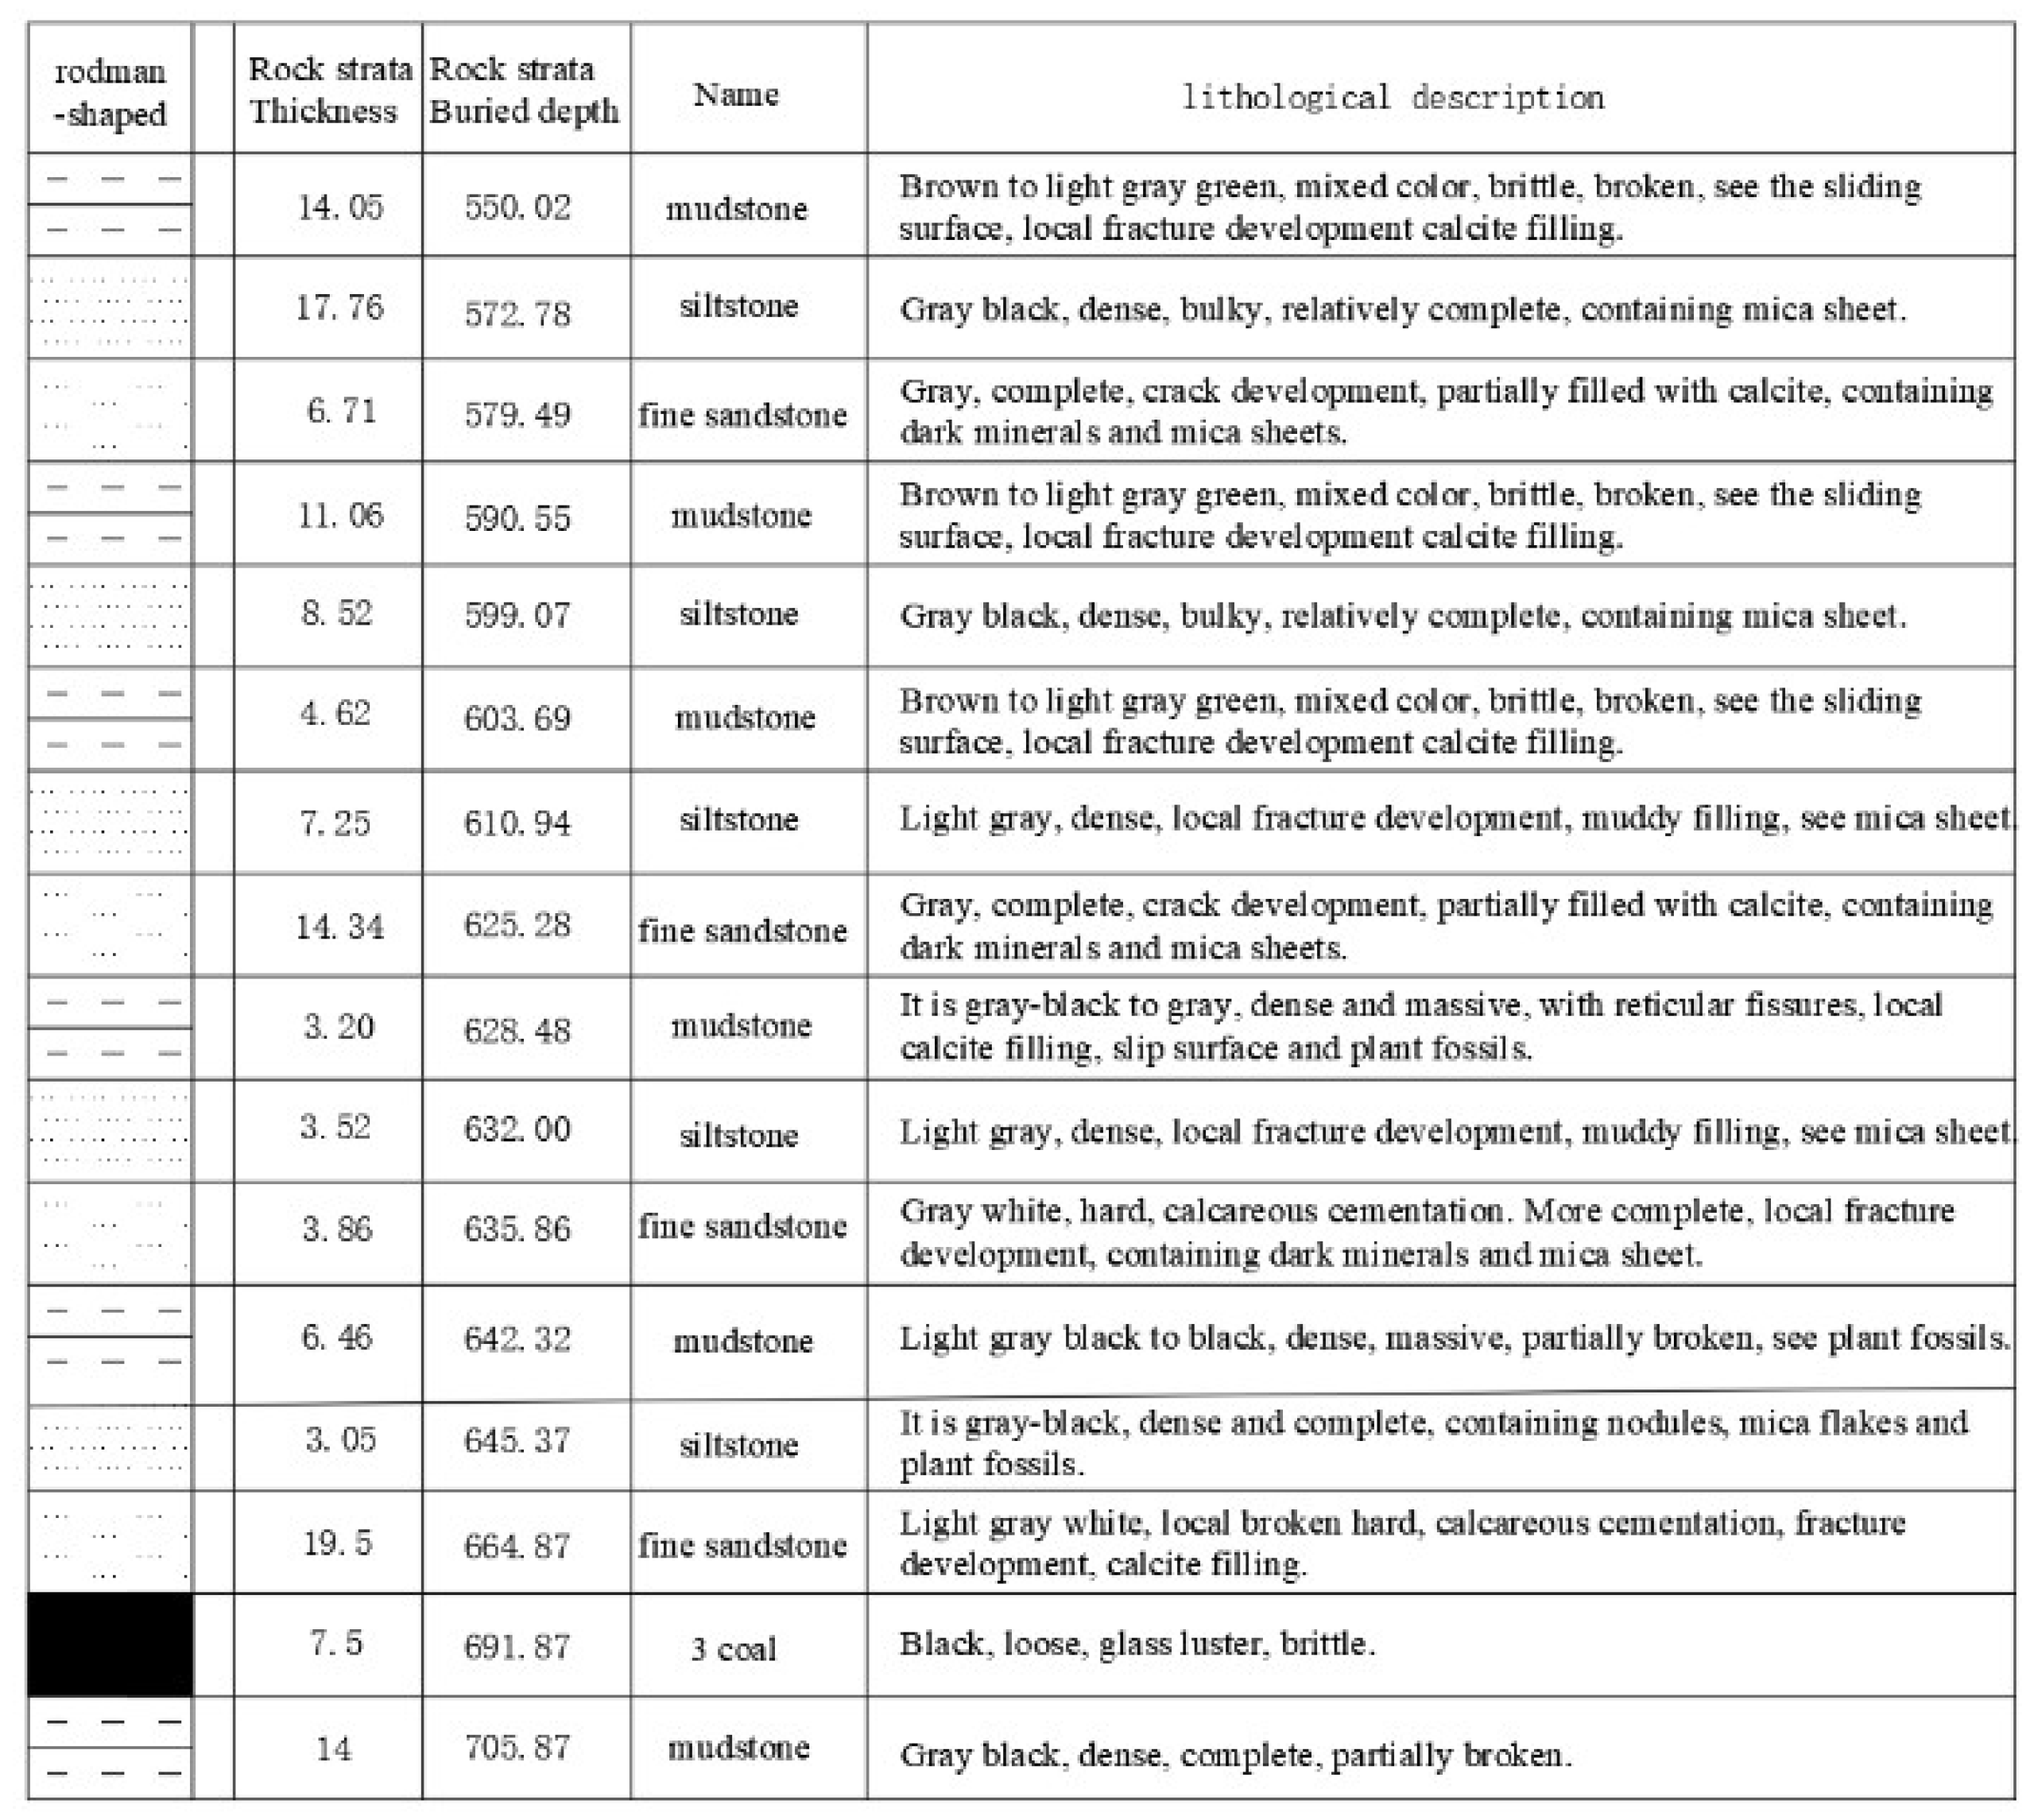
Based on these parameters, the No. 3 coal seam and its immediate roof/floor strata are classified as having weak rock burst tendency. Figure 2.2 illustrates the borehole columnar chart of the Y14-3 drilling hole in this working face.
Figure 2.2.
y14-3 borehole histogram
During the mining period of the 2301 working face, a comprehensive monitoring and early warning system was implemented, integrating stress online monitoring, microseismic monitoring, and drilling cuttings monitoring.
Stress Online Monitoring:Stress monitoring stations were installed in the gate roads during the development phase, with a spacing of 20–30 m between stations.Each station consists of two measurement points, with sensors embedded at depths of 8 m and 14 m (shallow holes at 8 m near the setup room). The distance between the two measurement points within a station does not exceed 2 m.The system monitors stress changes in the production side of the gate roads within rock burst-prone zones, ensuring a monitoring range of at least 300 m ahead of the working face.
Microseismic Monitoring:Two geophones were installed in each gate road. The first geophone is positioned 100–350m from the working face, with the distance between two geophones in the same gate road not exceeding 350 m.For gate roads with insufficient length, additional geophones were deployed in surrounding roadways to ensure at least four geophones are installed within a 500 m radius of the working face.
Drilling Cuttings Monitoring:Monitoring holes were drilled in the solid coal side within the monitoring range, with a spacing of 20–30 m and a depth of 12 m. The holes are arranged in a single row, parallel to the coal seam dip direction.The monitoring frequency is no more than 3 days, with each monitoring session involving at least three holes.
3. Movement Characteristics of Overlying Strata in Deep Inclined Coal Seam Working Faces
After the extraction of the working face, the overlying strata undergo subsidence, with the main roof fracturing and rotating downward. The overlying strata can be divided into three zones from bottom to top: the caved zone, the fractured zone, and the bending subsidence zone, forming a distinct overburden structure. The fractured zone, characterized by a rock beam structure, plays a critical role in stress transfer.In inclined coal seam mining, the overlying strata exhibit asymmetric subsidence. After the collapse of the caved zone, the fractured rock beams partially slide and collapse deeper into the goaf due to the dip angle. Consequently, the key rock blocks in the fractured zone near the upper gate road experience greater rotational subsidence compared to those near the lower gate road. Based on theoretical analysis, the overburden structure model of the working face is established, as illustrated in the figure.According to the rock beam structure characteristics of the fractured zone and the analysis of key rock groups in mining pressure theory, the following parameters for the 2301 working face are calculated based on geological conditions:
Initial weighting interval of the main roof: 76.9 m.
Fracture interval of the main roof: 79.1 m.
Periodic weighting interval of the main roof: 30.87 m.
Ultimate caving interval of the roof: 95.4 m.
Figure 3.1.
Structural characteristics of lateral overburden rock in working face
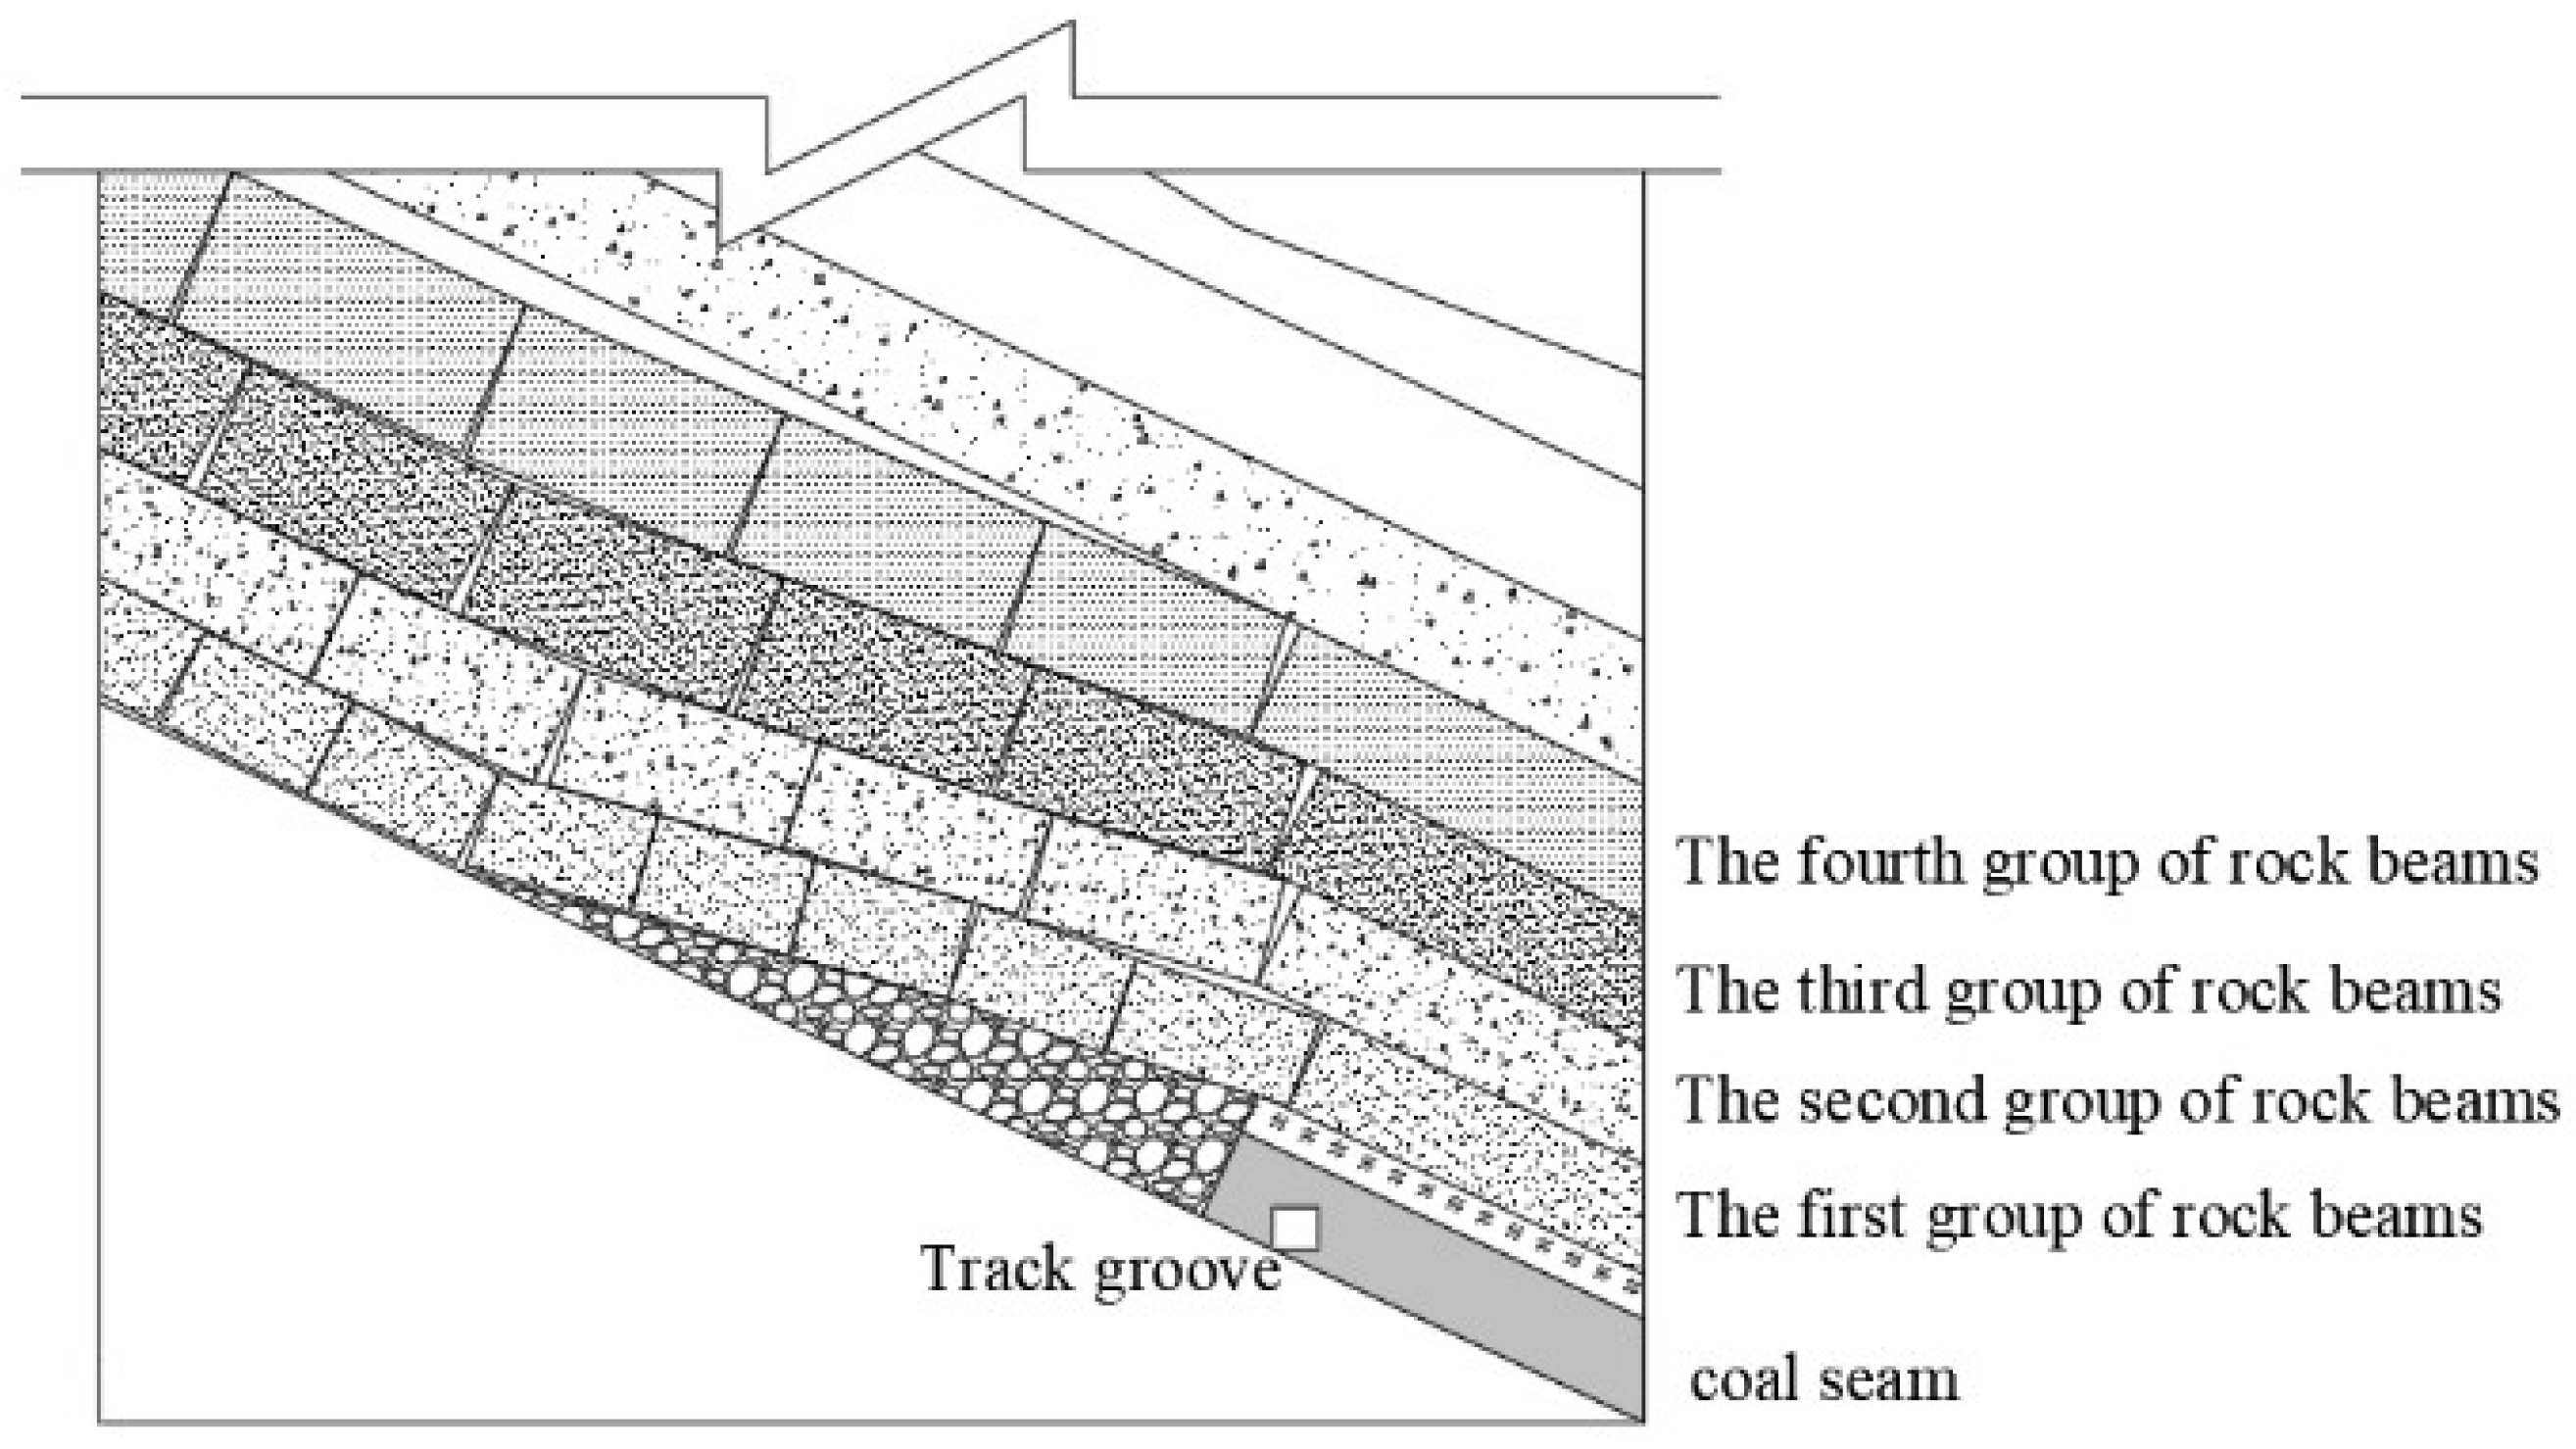
Figure 3.2.
The structural characteristics of lateral overburden rock in working face
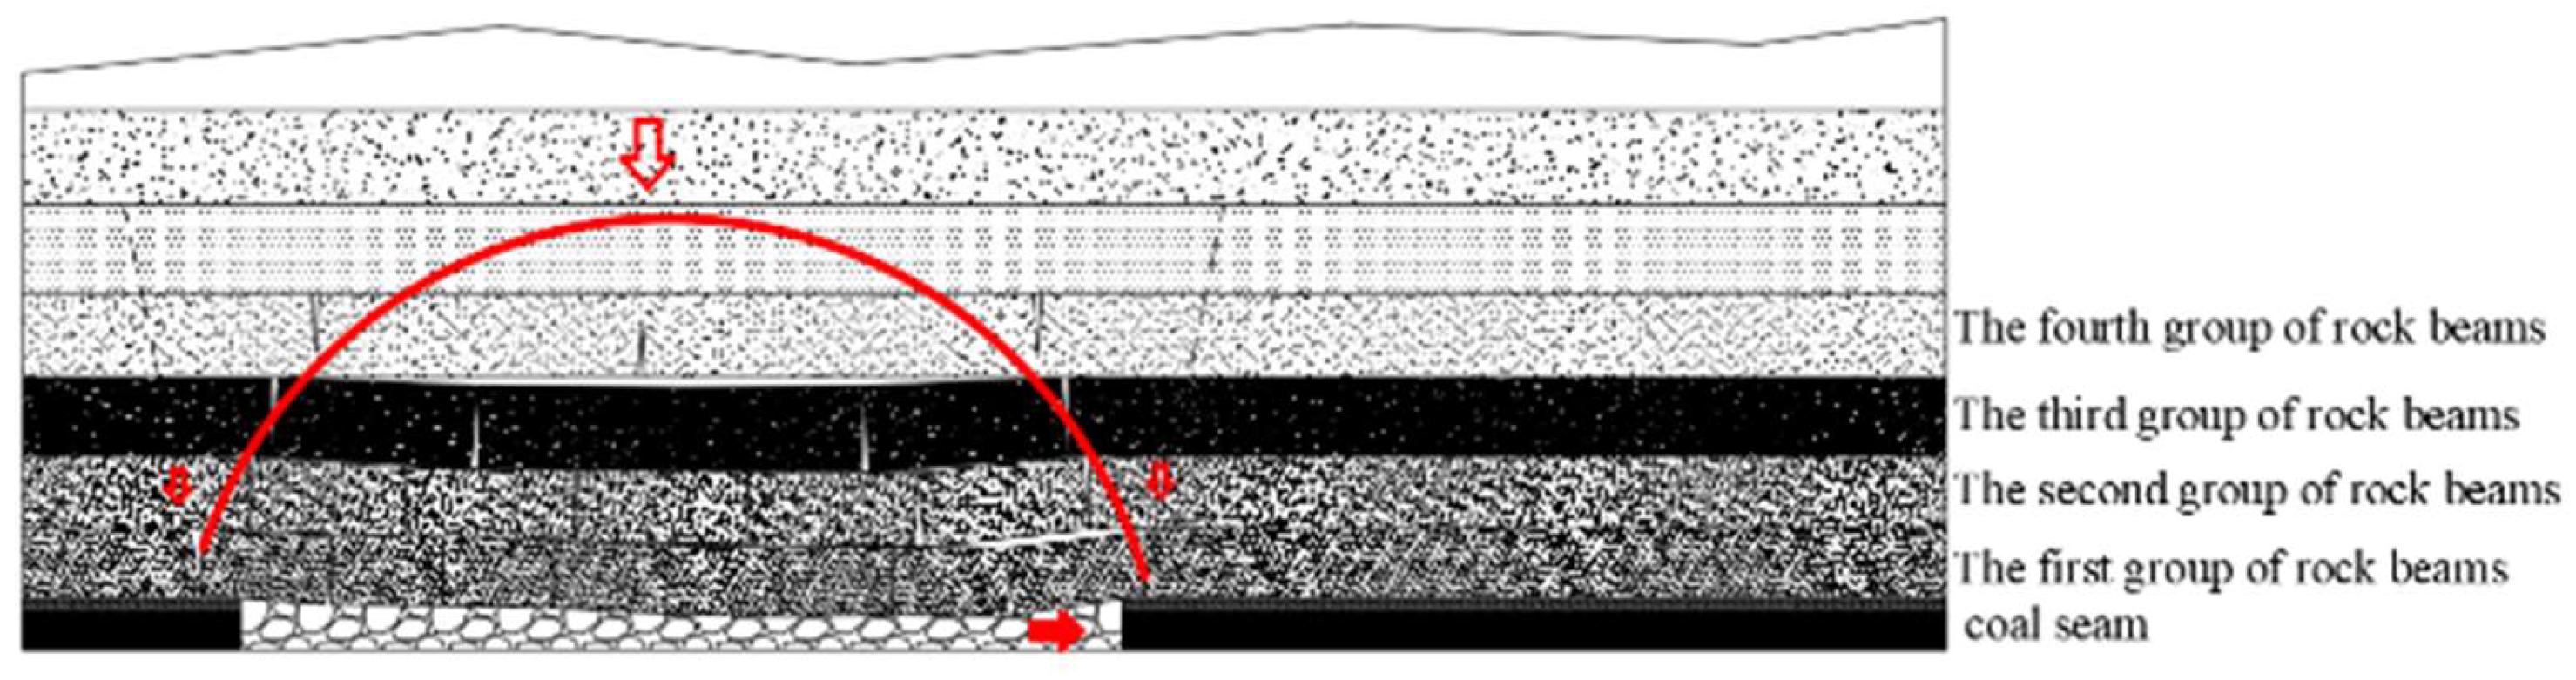
In the gob-side working face, as the face advances, the overlying strata above the goaf enter the fully mined stage during the square period. The height of strata fracturing is approximately half the width of the goaf. The movement of overlying strata occurs in rock layer groups, with each group dominated by a key stratum—a thick and hard rock layer that controls the deformation and movement of the group.The line connecting the separation points on the goaf side is termed the strata movement line, and the angle (α) between this line and the horizontal is defined as the strata movement angle.
The lateral abutment pressure () on the coal mass at the goaf side consists of two components[13]:
Self-weight stress (): The stress induced by the overburden weight of the coal mass.
Stress increment (): The additional stress caused by mining-induced redistribution of overburden loads.
In the formula: represents the sum of pressures transmitted to the coal mass on one side by the exposed sections of key strata above the goaf。
Figure 3.3.
Lateral abutment pressure calculation model
For each hard and thick rock layer group, half of the weight from its overhanging section is transferred to the coal mass on the gob side, and the resulting stress increment can be approximated as a linear distribution, as illustrated in Figure 3.3. Consequently, the stress increment transmitted to the gob-side coal mass by the i-th rock layer group is expressed as:
In the formula: is the maximum abutment pressure acting on the coal body at the side of the goaf by the i layer rock group,;
is half of the weight of the hanging part of the i layer rock group in the goaf, ,kN/m3;
is the thickness of the first layer of rock group;
is the distance from the thickness center of the ith stratum group to the coal seam floor,;
is the hanging length of the thickness center of the key layer of the first layer in the goaf,.
The stress increment Δσ is obtained by superimposing the stress increment produced by the hanging part of n rock strata group. The self-weight stress σq is:
In the formula :H is mining depth,m;
γ is rock bulk density,t/m3;
α is the rock movement angle,°;
θ is the dip angle of coal seam,°。
Considering the substantial bedrock thickness, with a strata movement angle of 80.6°, a mining depth of 650 m, and an inclined working face length of 160 m, the calculation intervals for the piecewise function variable are determined as: [0, 14], [14, 29], [29, 87], and [87, +∞]. By simplifying the computational process, the formula for lateral abutment pressure is derived as:
According to the calculation formula of lateral abutment pressure, the distribution diagram of lateral abutment pressure is drawn. The distribution diagram is shown in the figure.
Figure 3.4.
Lateral abutment pressure distribution curve
Under the influence of overlying strata movement, the lateral abutment pressure on the working face gradually increases. As illustrated in the figure, the lateral abutment pressure is divided into four segments, reaching its maximum value of 27.55 MPa at a distance of 29 m from the goaf edge.In the 2301 working face, the track gateway and coal pillar zone correspond to the 0–10 m region within the 29 m segment. The peak point of abutment pressure is located at 19 m on the lower side of the track gateway.
4. Numerical Simulation Study on the Stress Distribution Laws of Surrounding Rock in the Working Face
Based on the geological and mining conditions of the mine, a numerical model was established using the FLAC3D software, with reference to the Y14-3 borehole columnar chart. The model dimensions are 535 m (length) × 1260 m (width) × 395 m (height), while the working face dimensions are 160 m (length) × 660 m (width) × 7.5 m (height). The average dip angle of the coal and rock layers is 25°.Boundary Conditions:Displacement boundaries were applied to the four sides and the bottom of the model.A uniform load of 10 MPa was applied to the top of the model to simulate the overburden stress from the model top to the surface, representing a 400 m thick rock layer.Material Model:The Mohr-Coulomb failure criterion was adopted for the constitutive modeling of the coal and rock masses.
Table 4.1.
Lithology table of coal seam roof and floor
|
Rock strata Name |
Bulk modulus /GPa |
shear modulus /GPa |
tensile strength /MPa |
cohesion /MPa |
angle of internal friction /° |
Density /Kg·m-3 |
|
| siltstone | 13.56 | 9.75 | 2.56 | 3.5 | 32 | 2500 | |
| fine sandstone | 14.34 | 9.87 | 3.49 | 3.65 | 34 | 3000 | |
| mudstone | 2.37 | 1.49 | 1.71 | 1.14 | 33 | 2515 | |
| 3 coal | 0.65 | 0.38 | 0.86 | 0.96 | 30 | 1300 | |
Figure 4.1.
numerical model for simulating
Based on the initial weighting interval of the main roof and comprehensive model analysis, the excavation scheme for the working face is designed as follows:The working face is excavated in four stages, with each stage advancing 40 m.After each excavation stage, the ahead-of-face abutment pressure and lateral abutment pressure (vertical stress) are analyzed to evaluate stress redistribution and potential rock burst risks.
Figure 4.2.
Vertical stress distribution cloud of working face
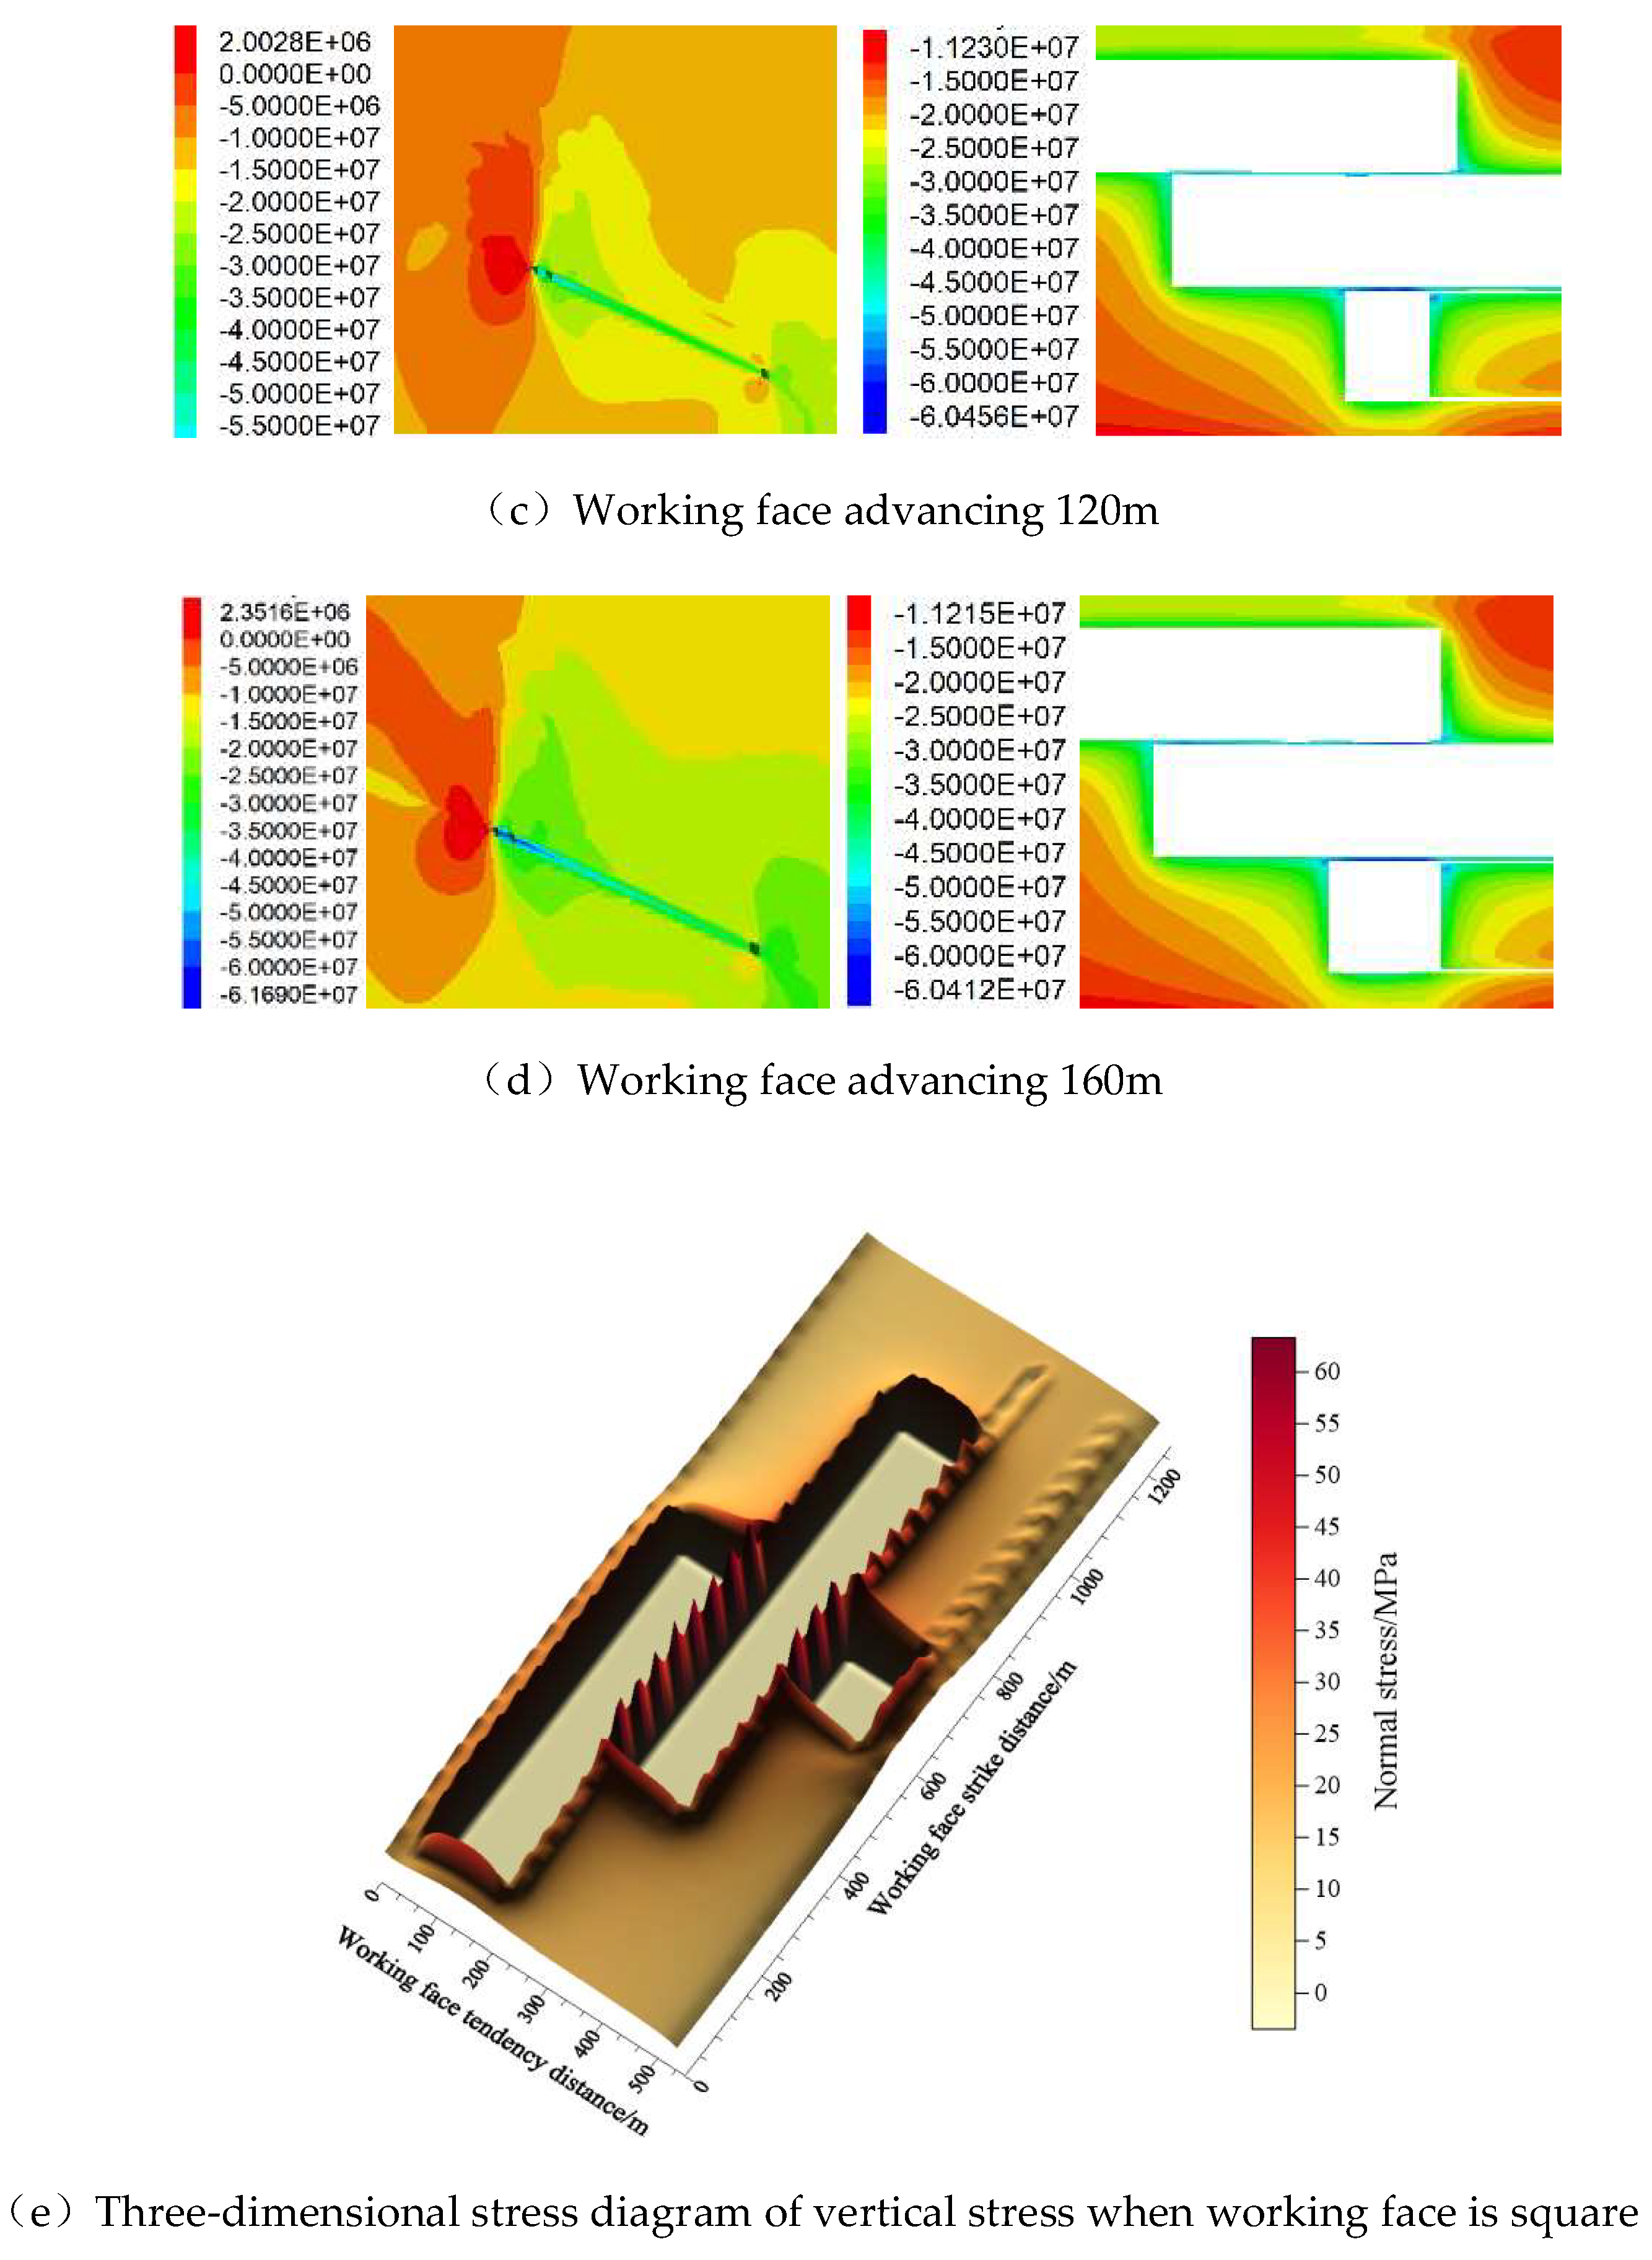
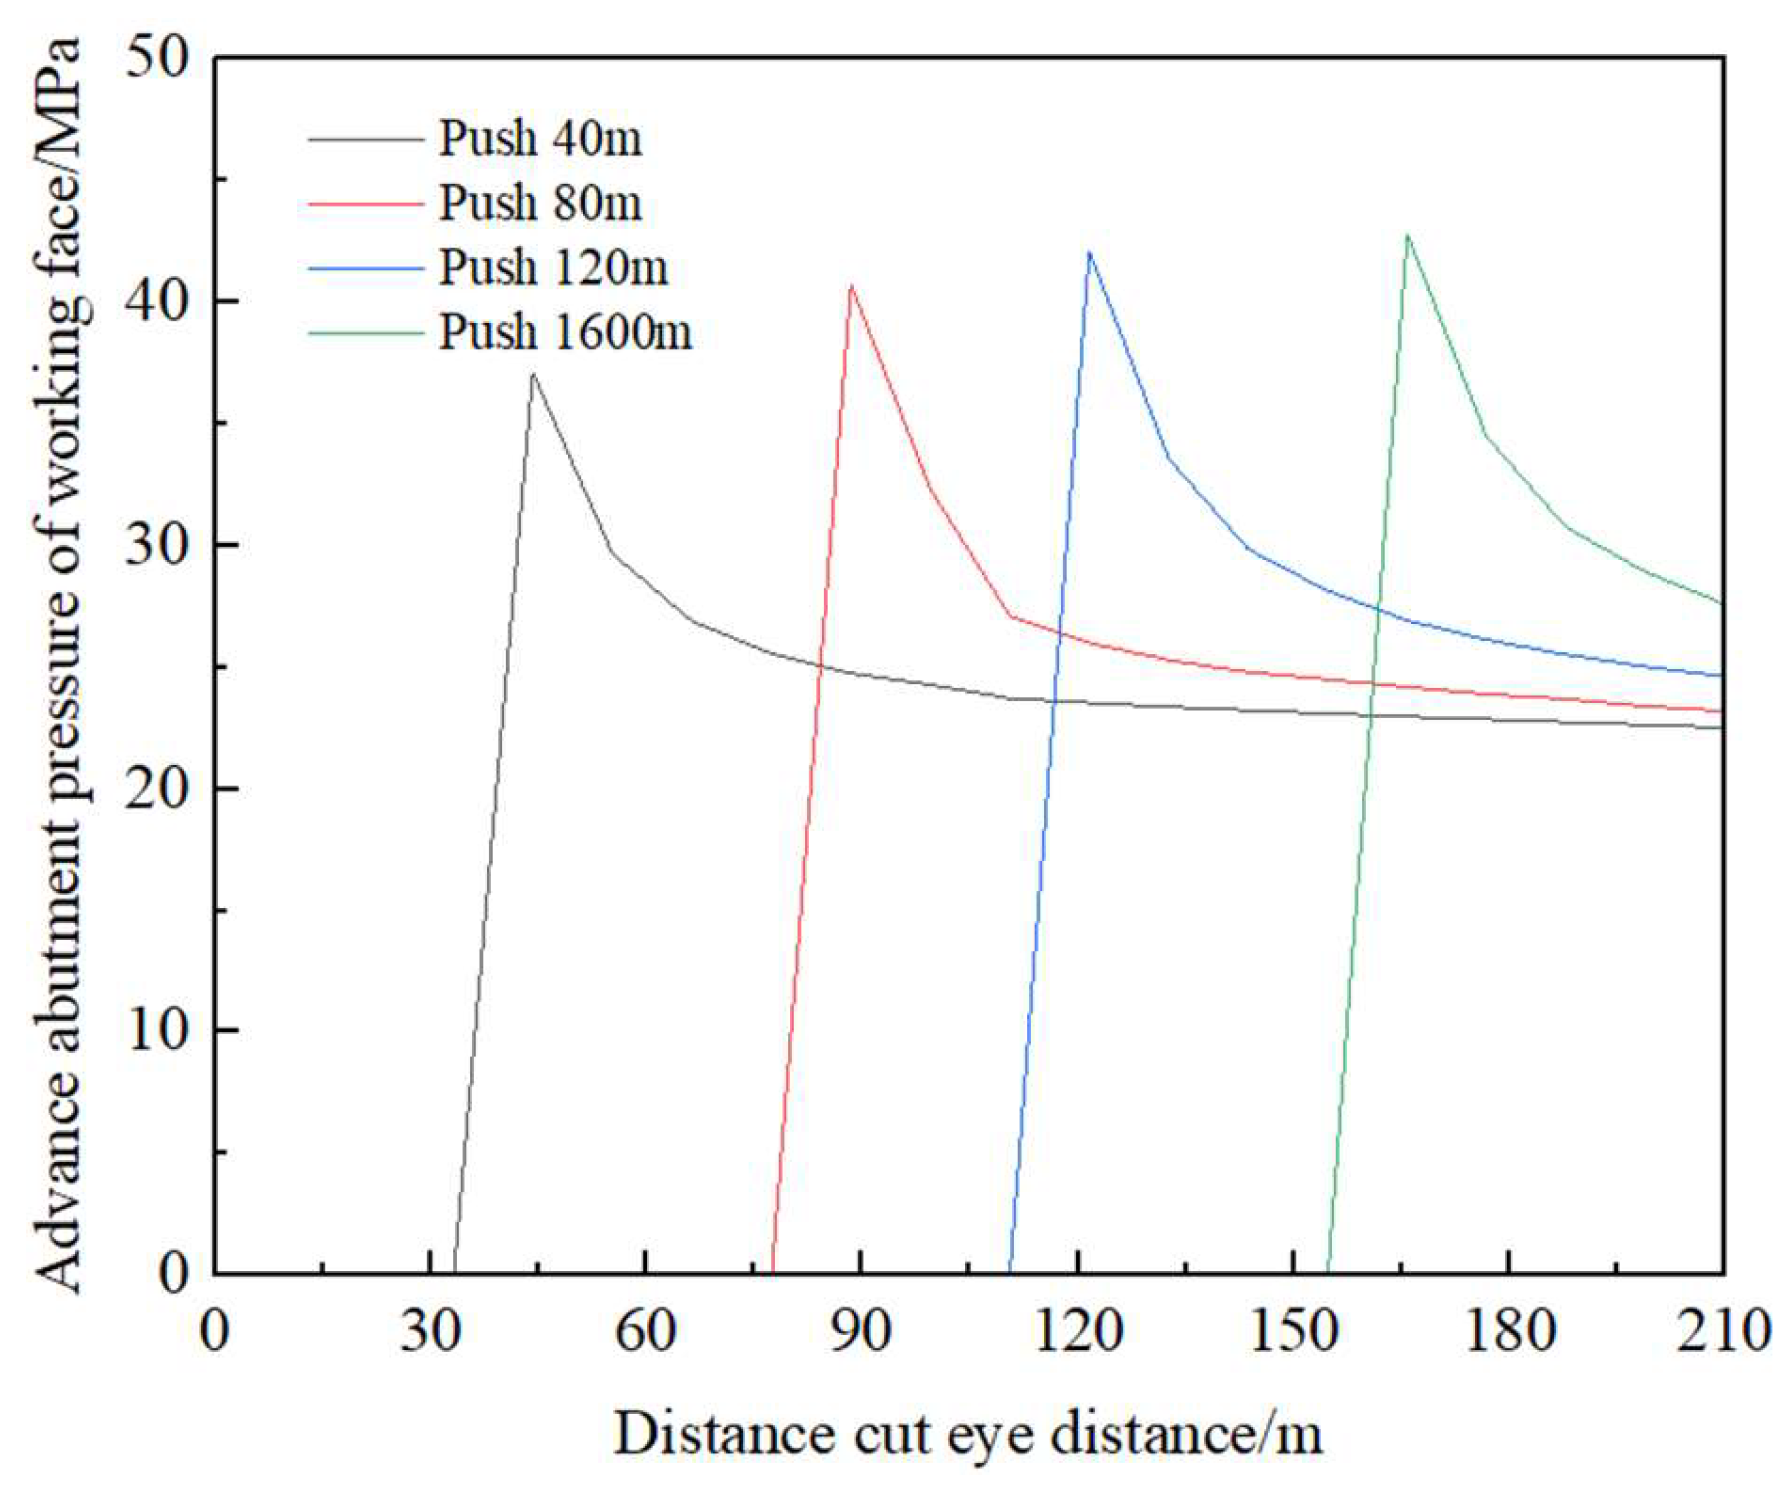
By examining the vertical stress distribution contour maps above the working face and combining the ahead-of-face abutment pressure curves (Figure 4.3) and lateral abutment pressure curves (Figure 4.4), the following observations are made:As the working face advances, stress concentration zones form on both sides of the face.Due to the influence of the adjacent goaf, the upper gate road exhibits significantly higher stress concentration compared to the lower gate road.At a face advance of 30 m, the vertical stress near the upper gate road reaches approximately 43 MPa, while the lower gate road experiences a vertical stress of about 27 MPa.Stress Migration and Tensile Zone Formation:The stress concentration zones gradually shift toward the front and rear of the working face.A tensile stress zone forms above the goaf, with its extent proportional to the working face dimensions.Ahead-of-Face Abutment Pressure Evolution:As the working face advances to 40 m, 80 m, 120 m, and 160 m, the peak ahead-of-face abutment pressure is observed at distances of 44.2 m, 88.4 m, 122 m, and 166 m from the setup room, respectively.The corresponding peak abutment pressures are 37 MPa, 40.7 MPa, 42 MPa, and 42.7 MPa, with stress concentration coefficients of 2.2, 2.3, 2.4, and 2.5, respectively.
Figure 4.3.
Advance abutment pressure curve of working face
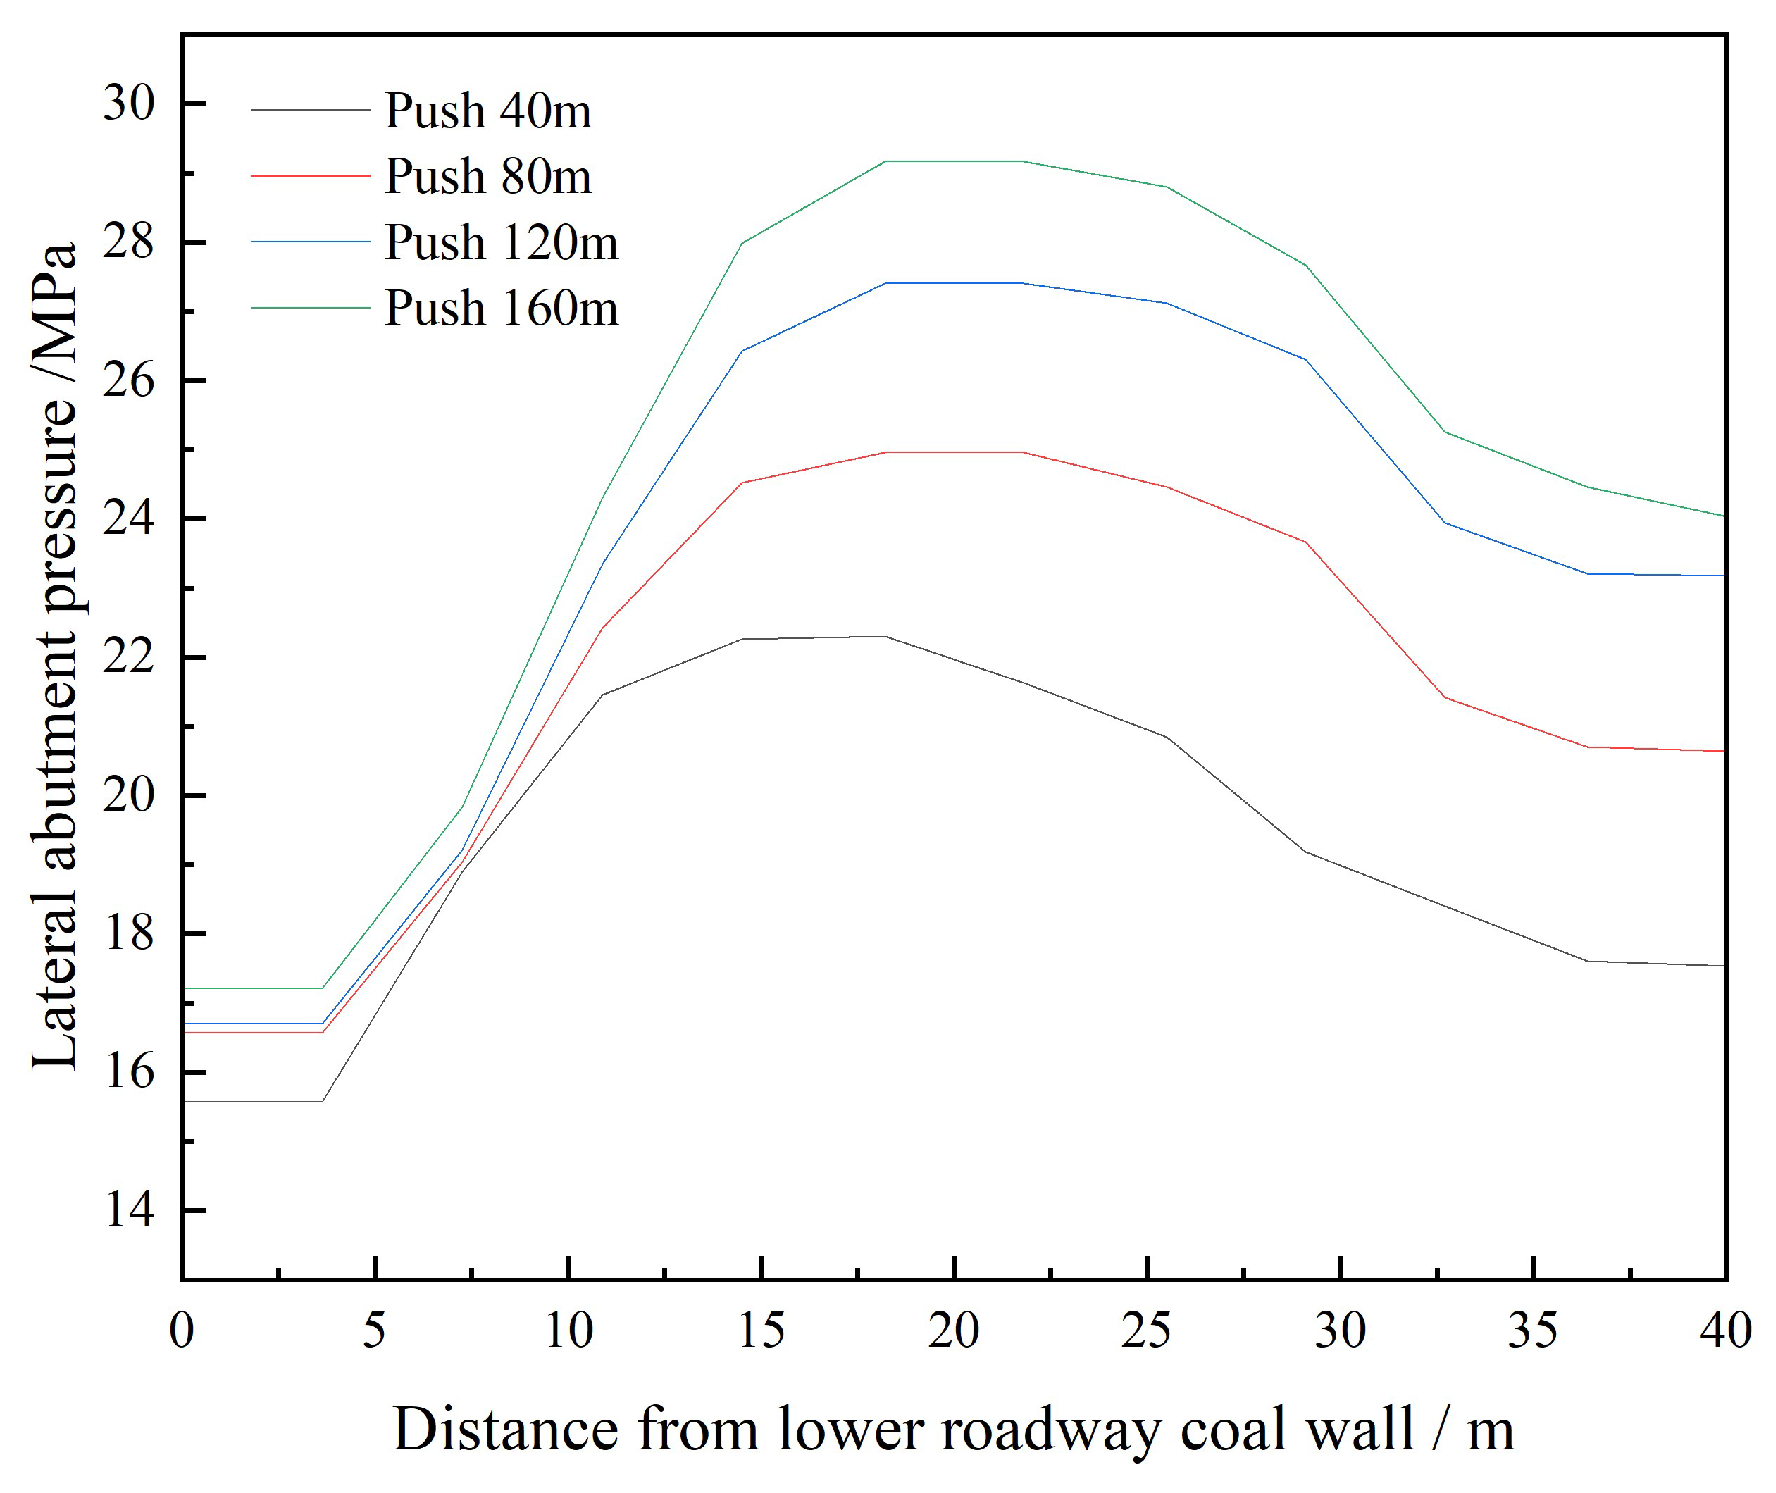
As the working face advanced to 40 m, 80 m, 120 m, and 160 m, the lateral abutment pressure in the coal mass on the lower side of the haulage gateway exhibited the following characteristics:
The peak abutment pressure was consistently observed at a distance of approximately 18.2 m from the lower gate road.
The corresponding peak pressures were 22.3 MPa, 24.9 MPa, 27.4 MPa, and 29.1 MPa, respectively.
The stress concentration coefficients at these stages were 1.3, 1.5, 1.6, and 1.7, respectively.
Figure 4.4.
Lateral abutment pressure curve of coal wall in lower roadway
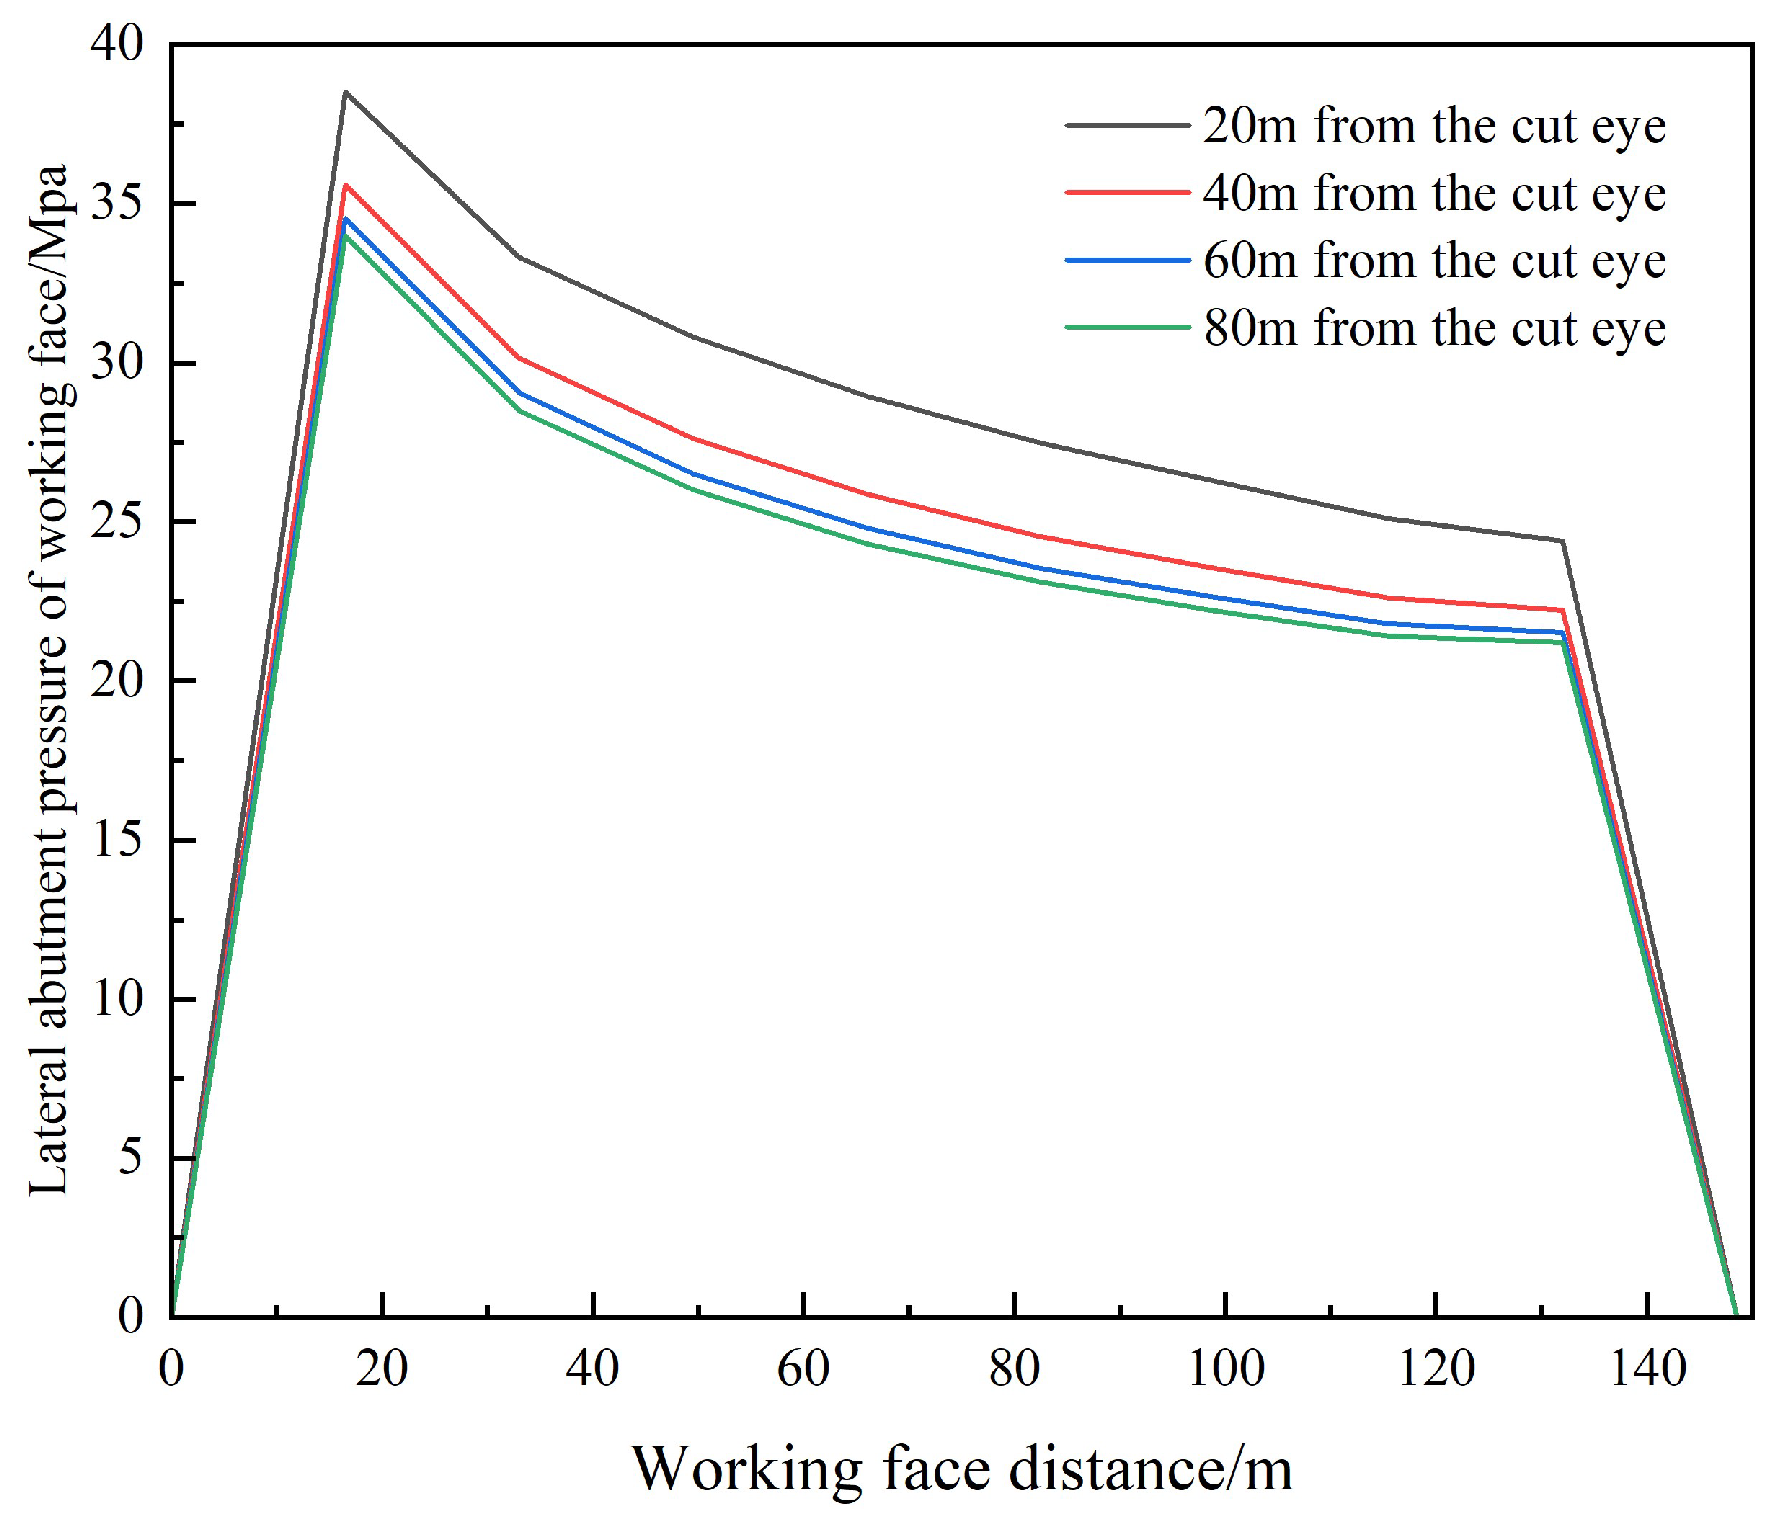
It can be seen from Fig.4.5 that the working face advances 160m, that is, during the square of the working face, the peak value of the lateral abutment pressure of the coal body in the 2301 working face is about 16.5m from the upper roadway to the working face, and 20m, 40m, 60m, and 80m from the open-off cut. The peak values of abutment pressure are : 38.4Mpa, 35.6Mpa, 34.5Mpa, and 34Mpa. The maximum stress concentration factors are 2.3,2.1,2.0 and 2.0, respectively.
Figure 4.5.
Lateral abutment pressure curve of 2301 working face
The simulation results reveal the following key insights regarding abutment pressure evolution and rock burst risks during the square period of the working face:
Ahead-of-Face Abutment Pressure:The peak ahead-of-face abutment pressure exhibits minimal increase during the square period, as it is marginally influenced by the overlying strata movement of the current working face and adjacent goafs.
Lateral Abutment Pressure in the Haulage Gateway:The lateral abutment pressure on the lower side of the haulage gateway is significantly affected by both adjacent goafs and overlying strata movement.As the working face advances, the peak lateral abutment pressure remains at a relatively stable distance from the lower gateway (~16 m from the track gateway in simulations), while the peak stress magnitude gradually increases.Theoretical calculations from Chapter 2 predict a peak pressure distance of 29 m, which includes the 10 m coal pillar between adjacent working faces and the track gateway section. The simulation results align closely with theoretical predictions.
Rock Burst Risk Assessment:When the working face advances to the 160 m region (square period), the stress concentration coefficient exceeds 1.5, indicating a high rock burst risk based on empirical thresholds.The superposition of ahead-of-face and lateral abutment pressures further elevates the risk coefficient in this zone.Consequently, the 160 m region (distance from the setup room) during the square period represents a critical zone for rock burst prevention, necessitating enhanced monitoring and pressure relief measures.
5. Study on Evaluation Method of Rockburst Risk in Inclined Coal Seam Working Face Based on Stress Superposition
The primary cause of stress superposition-induced rock bursts is the stress concentration in the elastic core zone exceeding the critical threshold for instability. The core principle of stress control theory[14] is to regulate the stress distribution state in coal and rock masses to prevent such exceedance.Based on the actual conditions of the 2301 working face in the mine, basal stress superposition models were established for both the working face and the solid coal side of the belt gateway. The models simplify the stress state in the elastic core zone into an average stress condition, approximating the stress curve as a straight line to facilitate rock burst risk assessment.
5.1. Working Face Foundation Stress Superposition Model
Figure 5.1.
Working face foundation stress superposition calculation model

In order to facilitate the theoretical analysis, it is assumed that the load stress distribution in the local area of the working face is uniform, and the total load Q of the working face during the mining process can be expressed as :
In the formula:k1 is the stress concentration factor of static factors such as structure and goaf;
L is the inclined length of the working face;
γ is the formation bulk density;
H is the buried depth of the coal seam along the track;
ΔH is the height difference between two roadways。
The mining of the working face with impact risk is due to the pressure relief drilling of the coal seam of the working face. At this time, the total load of the working face is :
In the formula:D is the depth of borehole pressure relief;
η is the bearing stress coefficient of the elastic core in the working face.
The total load of the overlying coal seam before and after the mining of the working face is unchanged, so , simplification can be obtained :
According to the three-dimensional stress state, the instability threshold of the elastic core area of the coal pillar is 3 times the uniaxial compressive strength of the coal seam [σc] [15]. The instability threshold of the elastic core area of the working face under the approximate three-dimensional stress state is also 3 times the uniaxial compressive strength of the coal seam [σc]. The risk coefficient I of the basic stress superposition impact on the working face can be expressed as :
Based on the previous research results of foundation stress superposition impact assessment[16,17], when I calculation interval [ 0,0.5 ), [ 0.5,1 ), [ 1,1.5 ), [ 1.5, + ∞ ), the working face has no, weak, medium and strong foundation stress superposition instability impact risk level respectively.
According to the actual conditions of 2301 working face in a mine, L=160m,d=12m,a=5m,H=600m,ΔH=80m,[σ_c]=7.7MPa,γ=0.025MN/m3,k1=2 ( 4301 goaf influence, fault concentrated stress ). The above parameters are brought into the expression of the risk coefficient I of the basic stress superposition impact, and it is concluded that I = 1.5, which can be preliminarily judged that the working face of the 2301 working face has a medium impact risk in the mining stage.
5.2. Stress Superposition Model of Solid Coal Side Foundation of Belt Conveyor Roadway
Similarly, the above-mentioned calculation model of foundation stress superposition on the solid coal side of the lower roadway is established for the working face model. The model simplifies the stress of the elastic core area on the solid coal side of the lower roadway into an average stress state.
Figure 5.2.
Stress superposition calculation model of solid coal side foundation of belt conveyor roadway coal side foundation in lower roadway
Figure 5.2.
Stress superposition calculation model of solid coal side foundation of belt conveyor roadway coal side foundation in lower roadway
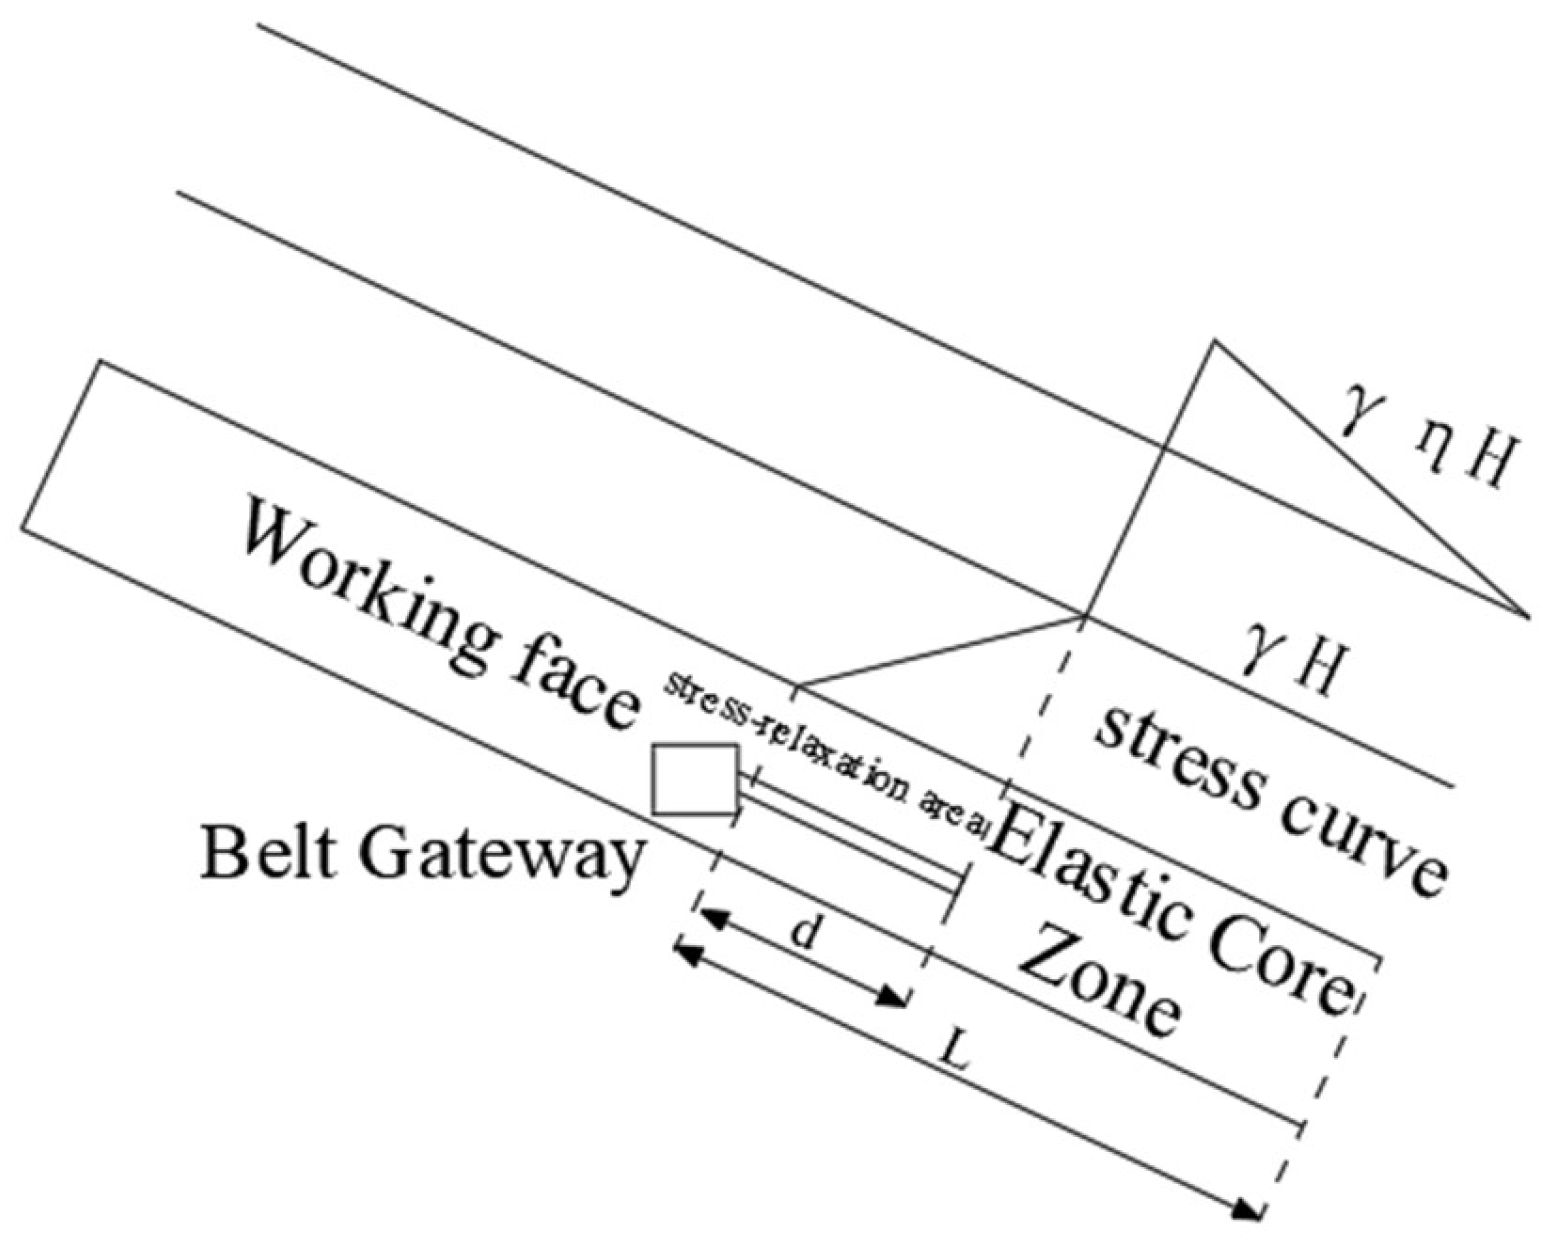
It is assumed that the load stress distribution on the local area of the solid coal side of the lower roadway is uniform and linear. The total load Qq of the working face on the solid coal side of the lower roadway during the mining process can be expressed as :
In the formula : k2 is the stress concentration factor of static factors such as structure and goaf ;
L is the affected length of the solid coal side of the lower roadway.
The mining of the working face with impact risk is due to the pressure relief drilling of the coal seam in the lower roadway. At this time, the total load on the solid coal side of the lower roadway is :
Similarly, simplification can be obtained :
The risk coefficient I of the basic stress superposition impact on the working face can be expressed as :
L=60m,d=12m,a=5m,H=680m,ΔH=30m,[σ_c]=7.7MPa,γ=0.025MN/m3,k2=1.5 (fault concentrated stress). Taking the above parameters into the expression of the risk coefficient I of the basic stress superposition impact, it is concluded that I = 1.3, which can preliminarily judge that the solid coal side of the lower roadway in the mining stage of the 2301 working face has a medium impact risk.
In order to proceed from the safety point of view, the above calculation results leave a safety margin to a certain extent. Comprehensive analysis shows that the risk assessment model is basically in line with the actual situation on site.
6. Engineering Practice
Taking the measured results during the period from July 1,2023 to September 21,2023 as an example, during the period, the self-cutting eye of the working face was advanced by 159.6 m, and the average advancing speed was 1.92 m / d. The engineering measurement during the square of the working face was analyzed and verified.
6.1. Comparison of Impact Risk Assessment Results
The rock burst risk during the retreat mining period of the 2301 working face was evaluated using the comprehensive index method, which yielded a "weak" risk classification.During the square period, a multi-factor coupling method was employed to delineate rock burst risk zones by integrating geological and operational parameters, including mining depth, fault structures (e.g., DF38 and XF1/XF2 faults), roof activity, and gob conditions. The spatial superposition of hazard zones and risk levels revealed that:
Track Gateway: A moderate rock burst risk was identified in the range of 190–280 m from the setup room.
Belt Gateway: A moderate rock burst risk was observed in the range of 145–175 m from the setup room.
The basal stress superposition model established in the previous section also predicted a moderate rock burst risk during the square period. This result aligns closely with the evaluations from both the comprehensive index method and multi-factor coupling method, demonstrating the consistency and reliability of the proposed risk assessment framework.
6.2. Field Measurement Results
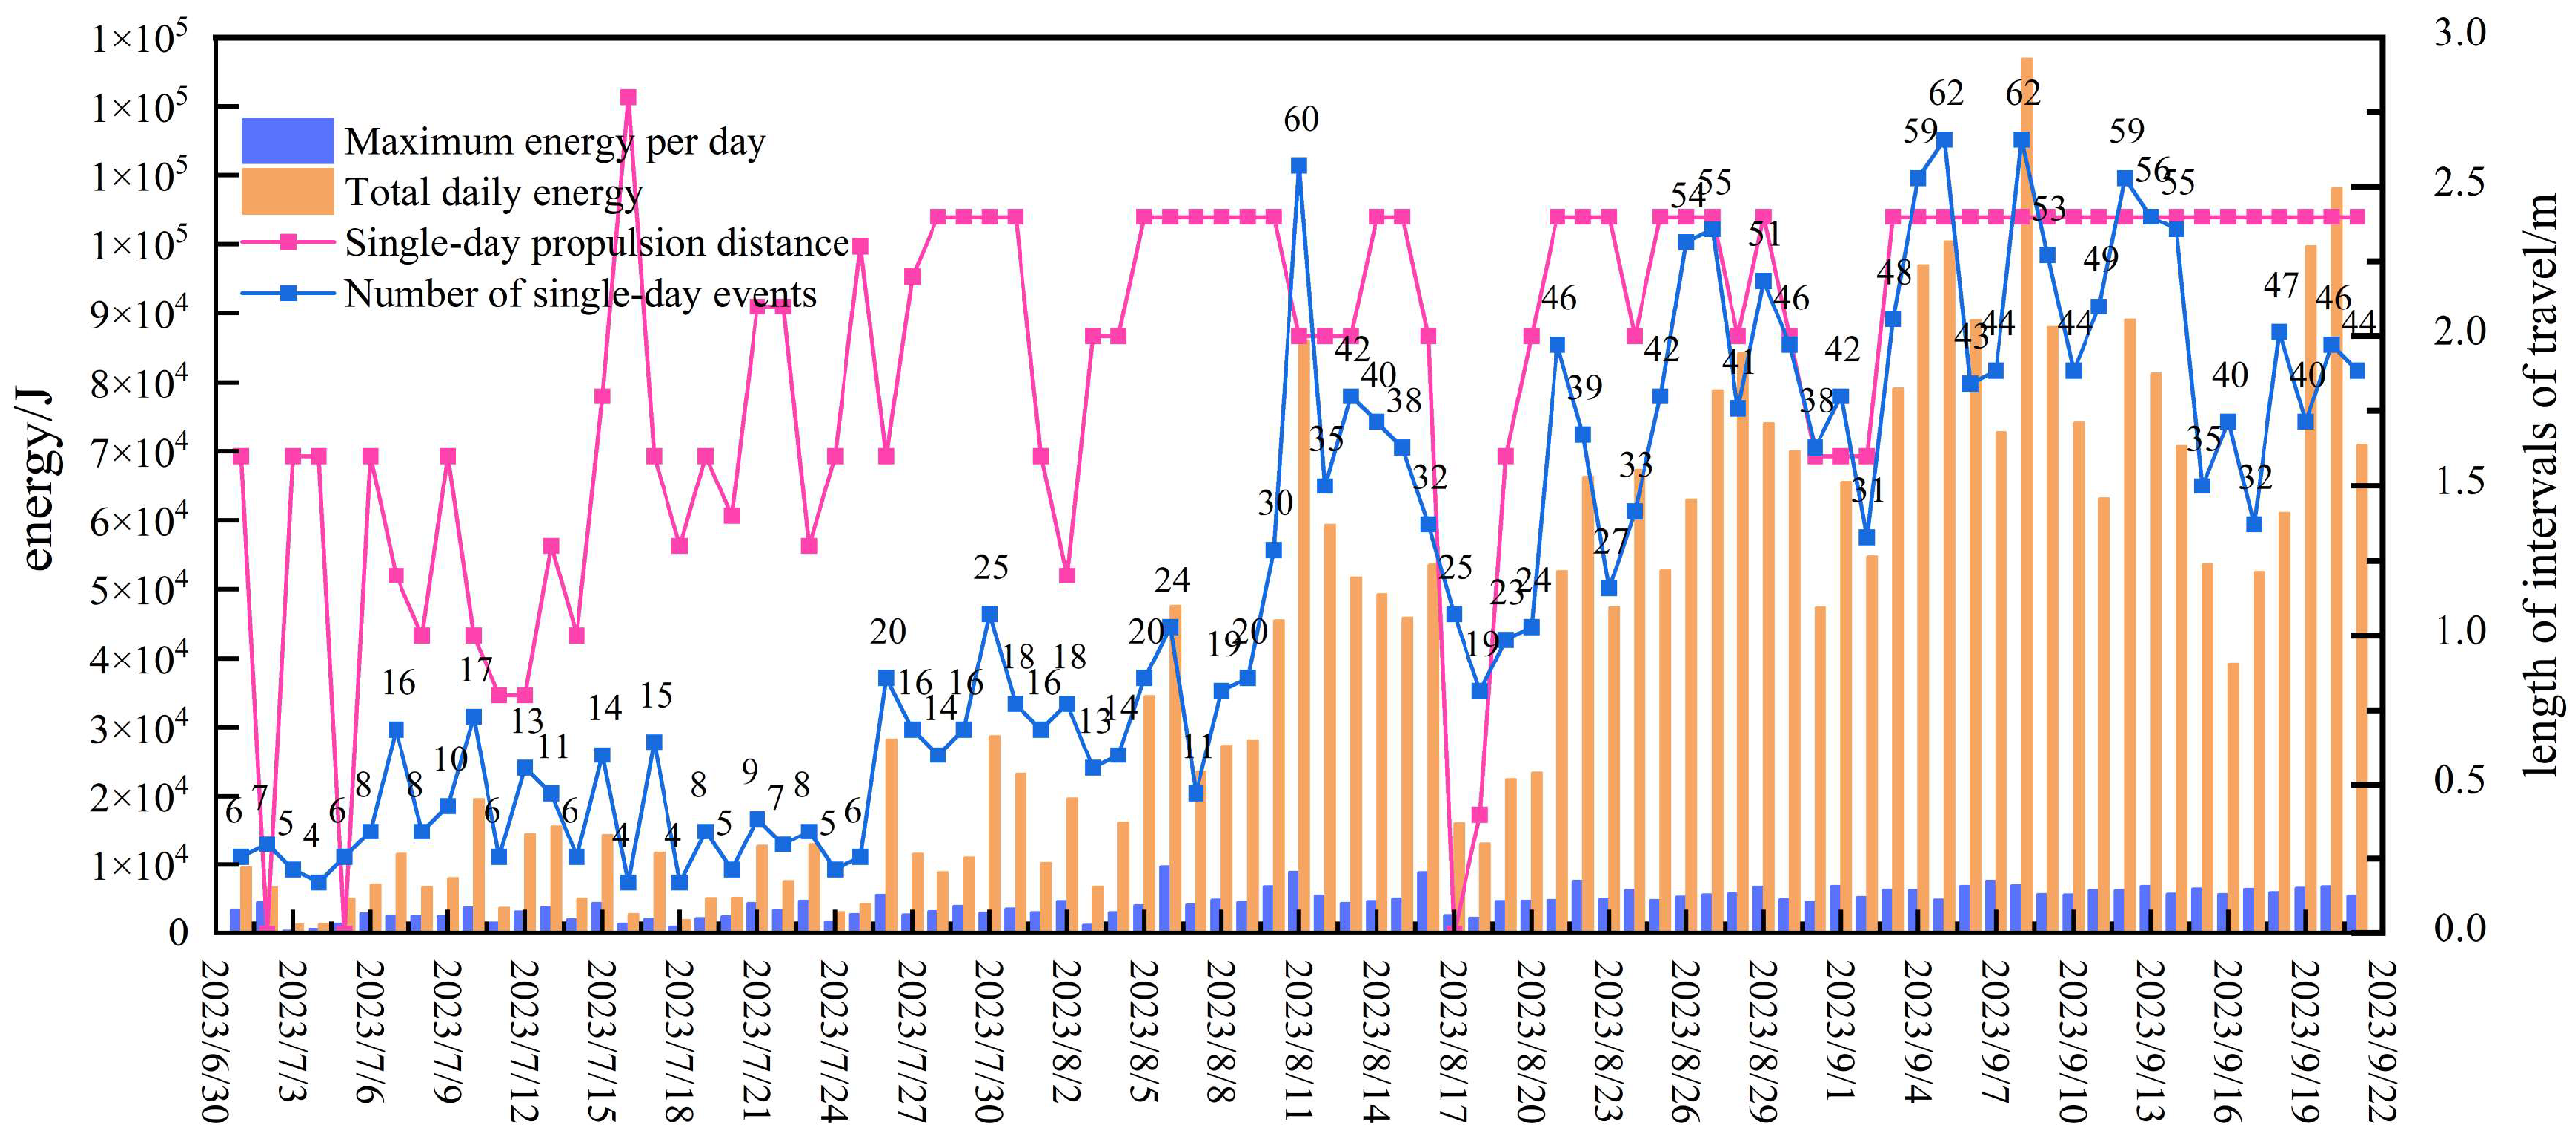
During the mining process, as the goaf gradually entered the first square period, significant mining pressure and dynamic phenomena emerged in the advanced mining-affected zone, accompanied by pronounced roof subsidence and intensified local rock burst monitoring indicators.
Microseismic Monitoring Results:
July 26–31:The number of microseismic events and cumulative energy showed a significant upward trend compared to the previous 25 days, indicating intense roof weighting.Field measurements confirmed the initial weighting of the main roof on July 31.
August 1–8:Daily cumulative microseismic energy exhibited a rising trend followed by a decline, with the first periodic weighting of the main roof completed on August 8.
August 9–21:As the working face approached an abandoned roadway and the XF2 fault, both the frequency and energy of microseismic events exceeded those observed during the first periodic weighting.Mining activities were suspended on August 17, leading to a temporary reduction in microseismic activity. However, the overall upward trend persisted, culminating in the second periodic weighting on August 21.
August 22–September 19:Proximity to the XF1 fault amplified microseismic activity, with daily energy levels surpassing those of the second periodic weighting.The third and fourth periodic weightings occurred on September 9 and September 19, respectively.Critical Observations During the Square Period:The peak microseismic event count and energy release coincided with intense overlying strata movement, reflecting substantial energy release from surrounding rock masses.This energy release correlated with a sharp increase in abutment pressure and elevated rock burst risks, driven by structural instability in the fractured overburden.
Figure 6.1.
Microseismic data during the square of working face
During the mining period of the 2301 working face, the KJ550 stress on-line monitoring system was used to monitor and warn the impact ground compaction, and the comprehensive analysis of the maximum value of the shallow hole and the deep hole of the rail and the skin was carried out. The stress monitoring data statistics during the square of the working face are shown in the diagram.
Figure 6.2.
On-line monitoring data of stress during the square of working face
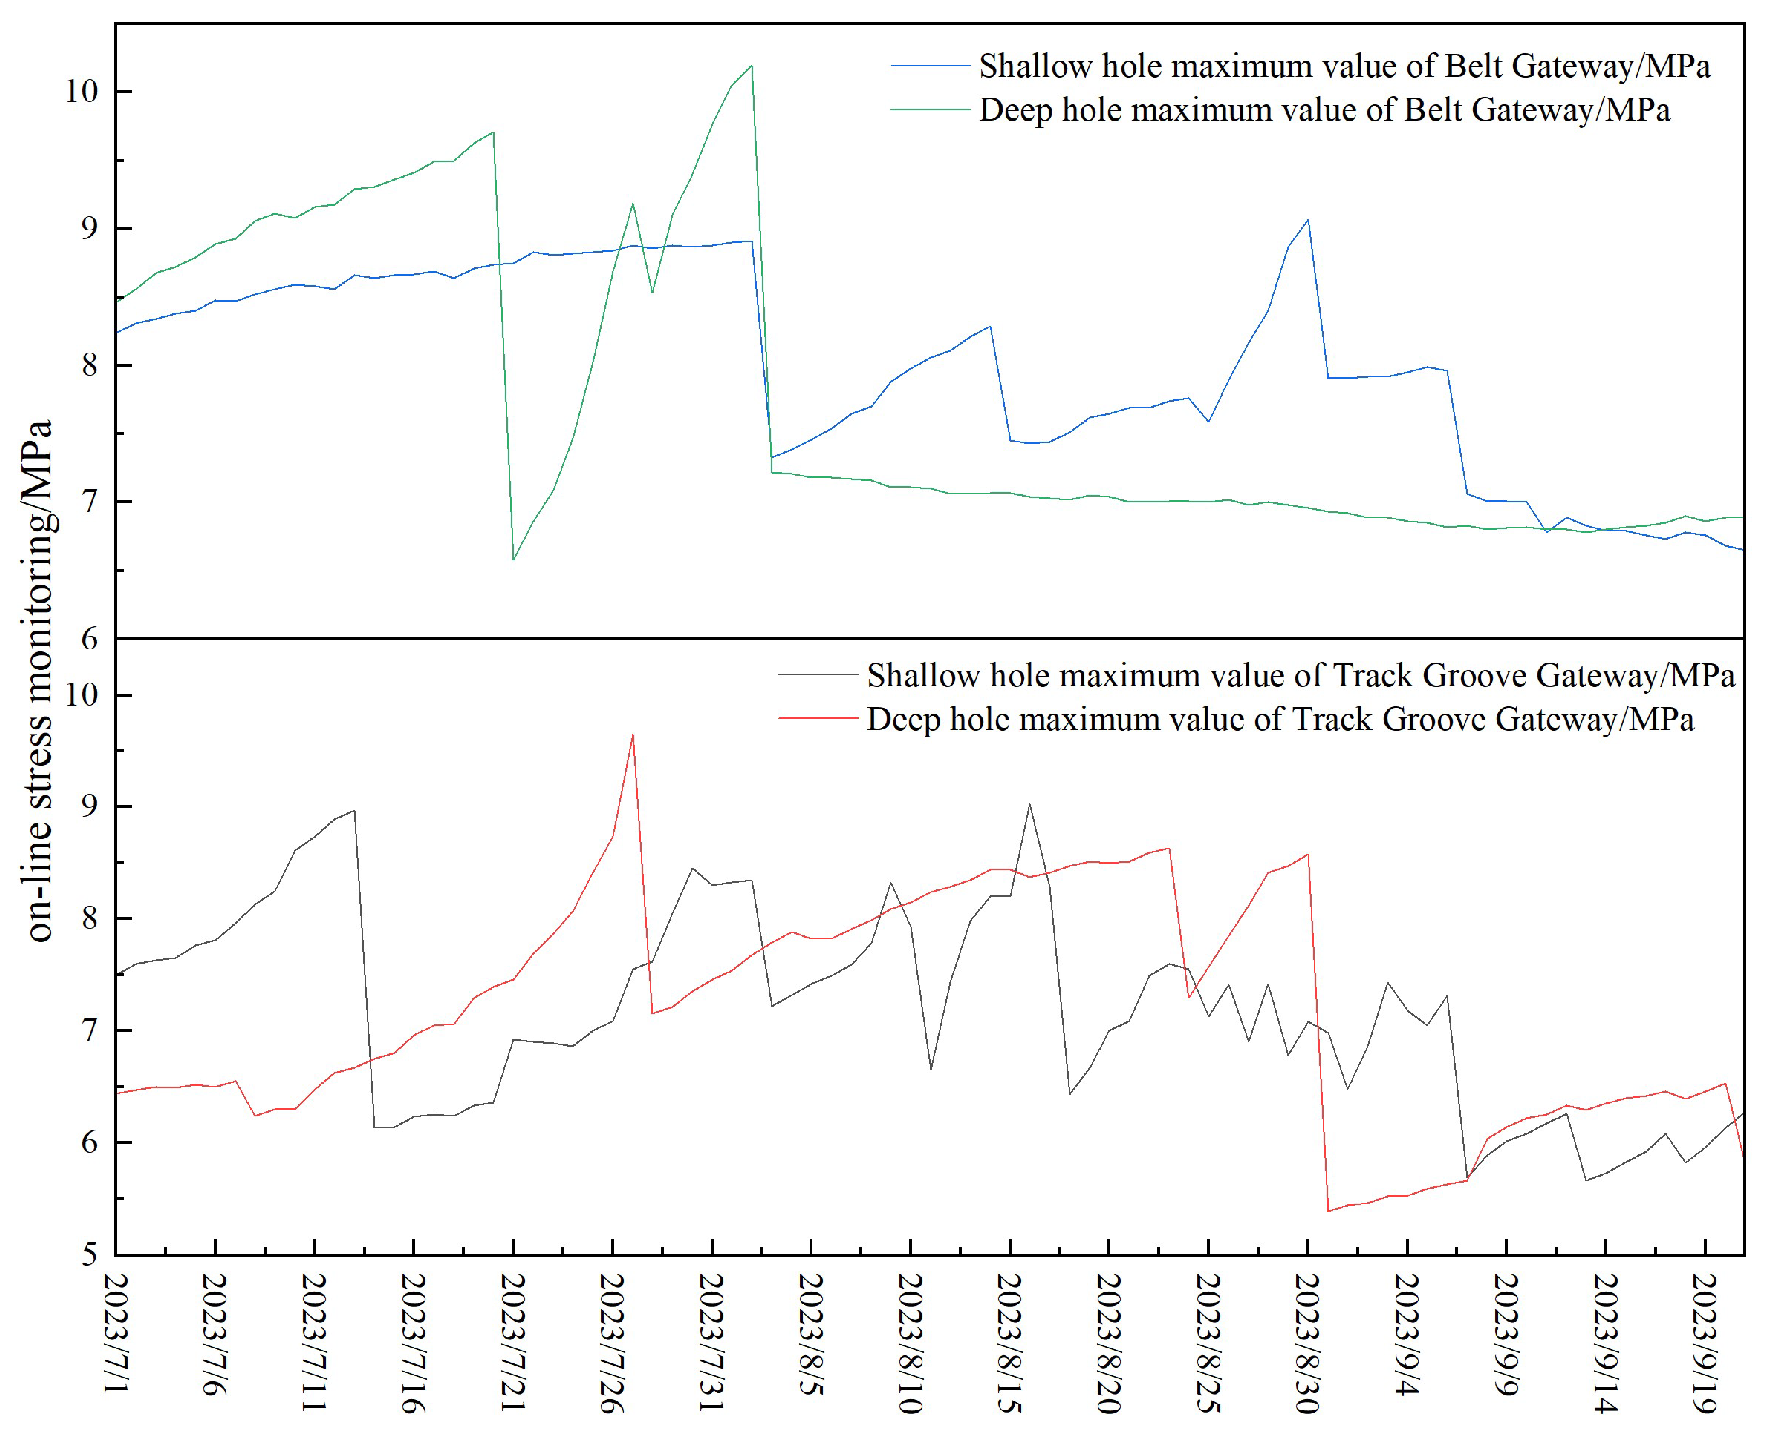
From July 21 to July 30, the stress monitoring values of shallow holes and deep holes in Pishun and Gongshun gradually increased. On July 31, the stress value decreased significantly. Combined with microseismic data, it can be concluded that the roof completed the initial weighting. From August 8 to August 5, the monitoring value of the rail compliance force and the monitoring value of the stress along the shallow hole gradually increased. From August 8 to August 10, the maximum stress value of the rail along the shallow hole decreased, and the roof completed the first periodic weighting. Similarly, according to the analysis of stress monitoring data, it can be concluded that the roof completed three periodic weightings on August 21, September 9 and September 19.
6.3. Comprehensive Analysis
As the working face advances and enters the square period, the movement of overlying strata leads to a significant increase in both ahead-of-face abutment pressure and lateral abutment pressure. During this period, the working face reaches a state of full mining influence, and the impact of the adjacent goaf on overburden movement becomes more pronounced.Key Observations:
Lateral Abutment Pressure:The lateral abutment pressure on the gob-side working face increases due to the combined effects of overburden movement and the adjacent goaf.The upper gate road exhibits more pronounced mining pressure manifestations compared to the lower gate road.Stress Distribution Along the Dip Direction:Due to the seam inclination, the lower gate road is situated at a greater depth than the upper gate road. Consequently, the surrounding rock stress in the lower gate road is higher, influenced by both overburden movement and increased burial depth.Overburden Movement and Dynamic Hazards:The height and extent of overburden movement during the square period are significantly greater, leading to:Increased microseismic activity.Elevated surrounding rock stress.Enhanced mining pressure manifestations.Higher rock burst risks.
6.4. Anti-Impact Measures of Working Face
Drilling pressure relief is carried out on the coal pillar along the goaf side of the working face, the working face and the solid coal side of the lower roadway. The diameter of the pressure relief drilling hole is Φ150 mm, the drilling distance from the bottom plate is 0.5 ~ 1.5 m, the inclination angle is consistent with the coal seam, and the drilling spacing is determined according to the specific monitoring situation. The depth of the pressure relief drilling hole is not less than 20 m ; during the mining period, according to the monitoring and analysis, the bottom coal is relieved by the pressure relief hole bottom breaking method.
7. Main Results
Analysis of Roof Weighting Intervals and Overburden Loads:Based on the key stratum theory, the load exerted by the main roof on the overlying strata was calculated, and the influence of strata movement on the working face load was evaluated.The initial weighting interval and periodic weighting interval of the working face were theoretically determined and validated against field monitoring data, providing a comprehensive understanding of the roof weighting behavior.
Strata Behavior and Rock Burst Risk Assessment During the Square Period:The mining pressure manifestation laws during the square period of the deep inclined coal seam working face were analyzed using field monitoring techniques.The causes of microseismic events, abnormal weighting, and increased mining pressure were investigated, leading to the development of a rock burst risk assessment method tailored to these conditions.The findings on the initial square period provide valuable guidance for managing subsequent second and third square periods during face advance.
Stress Superposition Model for Rock Burst Risk Calculation:A stress superposition model was established based on the working face conditions. The model's results were consistent with those obtained from the comprehensive index method and multi-factor coupling method, validating its reliability.
Pressure Relief and Prevention Measures:To mitigate rock burst risks during mining, measures such as large-diameter borehole pressure relief and bottom coal pressure relief were implemented.In areas crossing faults, advanced support was extended to 60 m behind the fault line to enhance stability.Field results confirmed that all early warning indicators remained below critical thresholds, ensuring safe and efficient face advance.
References
- Xu Rengui. Study on burst hazard of fully mechanized caving face in inclined coal seam [J].Coal engineering, 2020,52 (02) : 64-68.
- Wang Jinan, Zhang Jiwei, Gao Xiaoming, et al. Basic roof breaking mode and evolution process of longwall fully mechanized top coal caving mining in thick coal seam with large dip angle (I) -initial breaking [J]. Coal Journal, 2015,40 (06) : 1353-1360.
- Gao Xicai, Wu Yongping, Cao Peipei, etc. Law of overlying strata movement in fully mechanized caving face with variable angle in steeply dipping coal seam [J]. Journal of Mining and Safety Engineering, 2016,33 (03) : 381-386.
- Tan Yunliang, Hu Shanchao. Analysis and research on the occurrence conditions of roof pressure [J].Coal science and technology, 2015,43 ( 06 ) : 19-22 + 130.
- Luo Shenghu, Wang Tong, Tian Chengyang, etc. Inclination effect of roof stress transfer path in longwall mining of steeply dipping coal seam [J]. Coal Journal, 2022,47 (02): 623-633.
- Wang Hongwei, Wu Yongping, Cao Peipei, etc. Large-scale three-dimensional loading similar simulation test of large dip angle coal seam mining [J].Coal Journal, 2015,40 (07) : 1505-1511.
- Numerical simulation study on abutment pressure distribution characteristics of C-type stope [J].Geotechnical Mechanics, 2010,31 (12) : 4011-4015.
- Jiang Fuxing, Wang Jianchao, Sun Guangjing, et al. Engineering criterion for rockburst risk of gob-side entry in deep mining [J].Coal Journal, 2015,40 (08) : 1729-1736.
- Wang Cunwen, Jiang Fuxing, Sun Qingguo, et al. Prediction technology and application of rock burst based on spatial structure theory of overlying strata[J].Journal of Coal, 2009,34 (02) : 150-155.
- Cui Feng, Zong Cheng, Lai Xingping, etc. Coal Journal, 1-17[2024-09-12].Intelligent prediction of burst hazard time series and grade of roadway excavation in steeply inclined and extremely thick coal seam [ J / OL ].
- Wang Chao, Zhang Guangchao, Zhao Xipo, et al. Method and application of rock burst risk assessment based on roof structure characteristics[J]. Journal of Mining and Strata Control Engineering, 2024,6 (02): 125-135.
- Wang Chao, Kong Linghai, Wang Guangmin, et al. Research on prevention and control of rock burst in gob-side working face under incremental load[J].Coal Engineering, 2023,55 (12) : 108-113.
- Qi Qingxin, Li Xiaolu, Zhao Shankun. Theory and practice of coal mine rock burst stress control[J].Coal science and technology, 2013,41 (06) : 1-5.
- Sitao Zhu, Yu Feng, Fuxing Jiang, Jinhai Liu, Mechanism and risk assessment of overall-instability-induced rock bursts in deep island longwall panels, International Journal of Rock Mechanics and Mining Sciences, Volume 106,2018,Pages 342-349,ISSN 1365-1609.
- Zhang Xiang, Zhu Sitao, Zhang Xiufeng, et al. Study on rock burst mechanism of integral instability type of fault coal pillar in fully mechanized top coal caving mining face in deep alluvium[J].Rock mechanics and engineering, 2024,43 (03) : 713-727.
- Zhu Sitao, Zhang Xiang, Jiang Fuxing, etc. Study on mechanism and application of energy release modification and anti-impact of coal pillar in deep high stress roadway [J / OL].Coal Journal, 1-17[2024-08-27].
Disclaimer/Publisher’s Note: The statements, opinions and data contained in all publications are solely those of the individual author(s) and contributor(s) and not of MDPI and/or the editor(s). MDPI and/or the editor(s) disclaim responsibility for any injury to people or property resulting from any ideas, methods, instructions or products referred to in the content. |
© 2025 by the authors. Licensee MDPI, Basel, Switzerland. This article is an open access article distributed under the terms and conditions of the Creative Commons Attribution (CC BY) license (http://creativecommons.org/licenses/by/4.0/).
Copyright: This open access article is published under a Creative Commons CC BY 4.0 license, which permit the free download, distribution, and reuse, provided that the author and preprint are cited in any reuse.


