1. Introduction
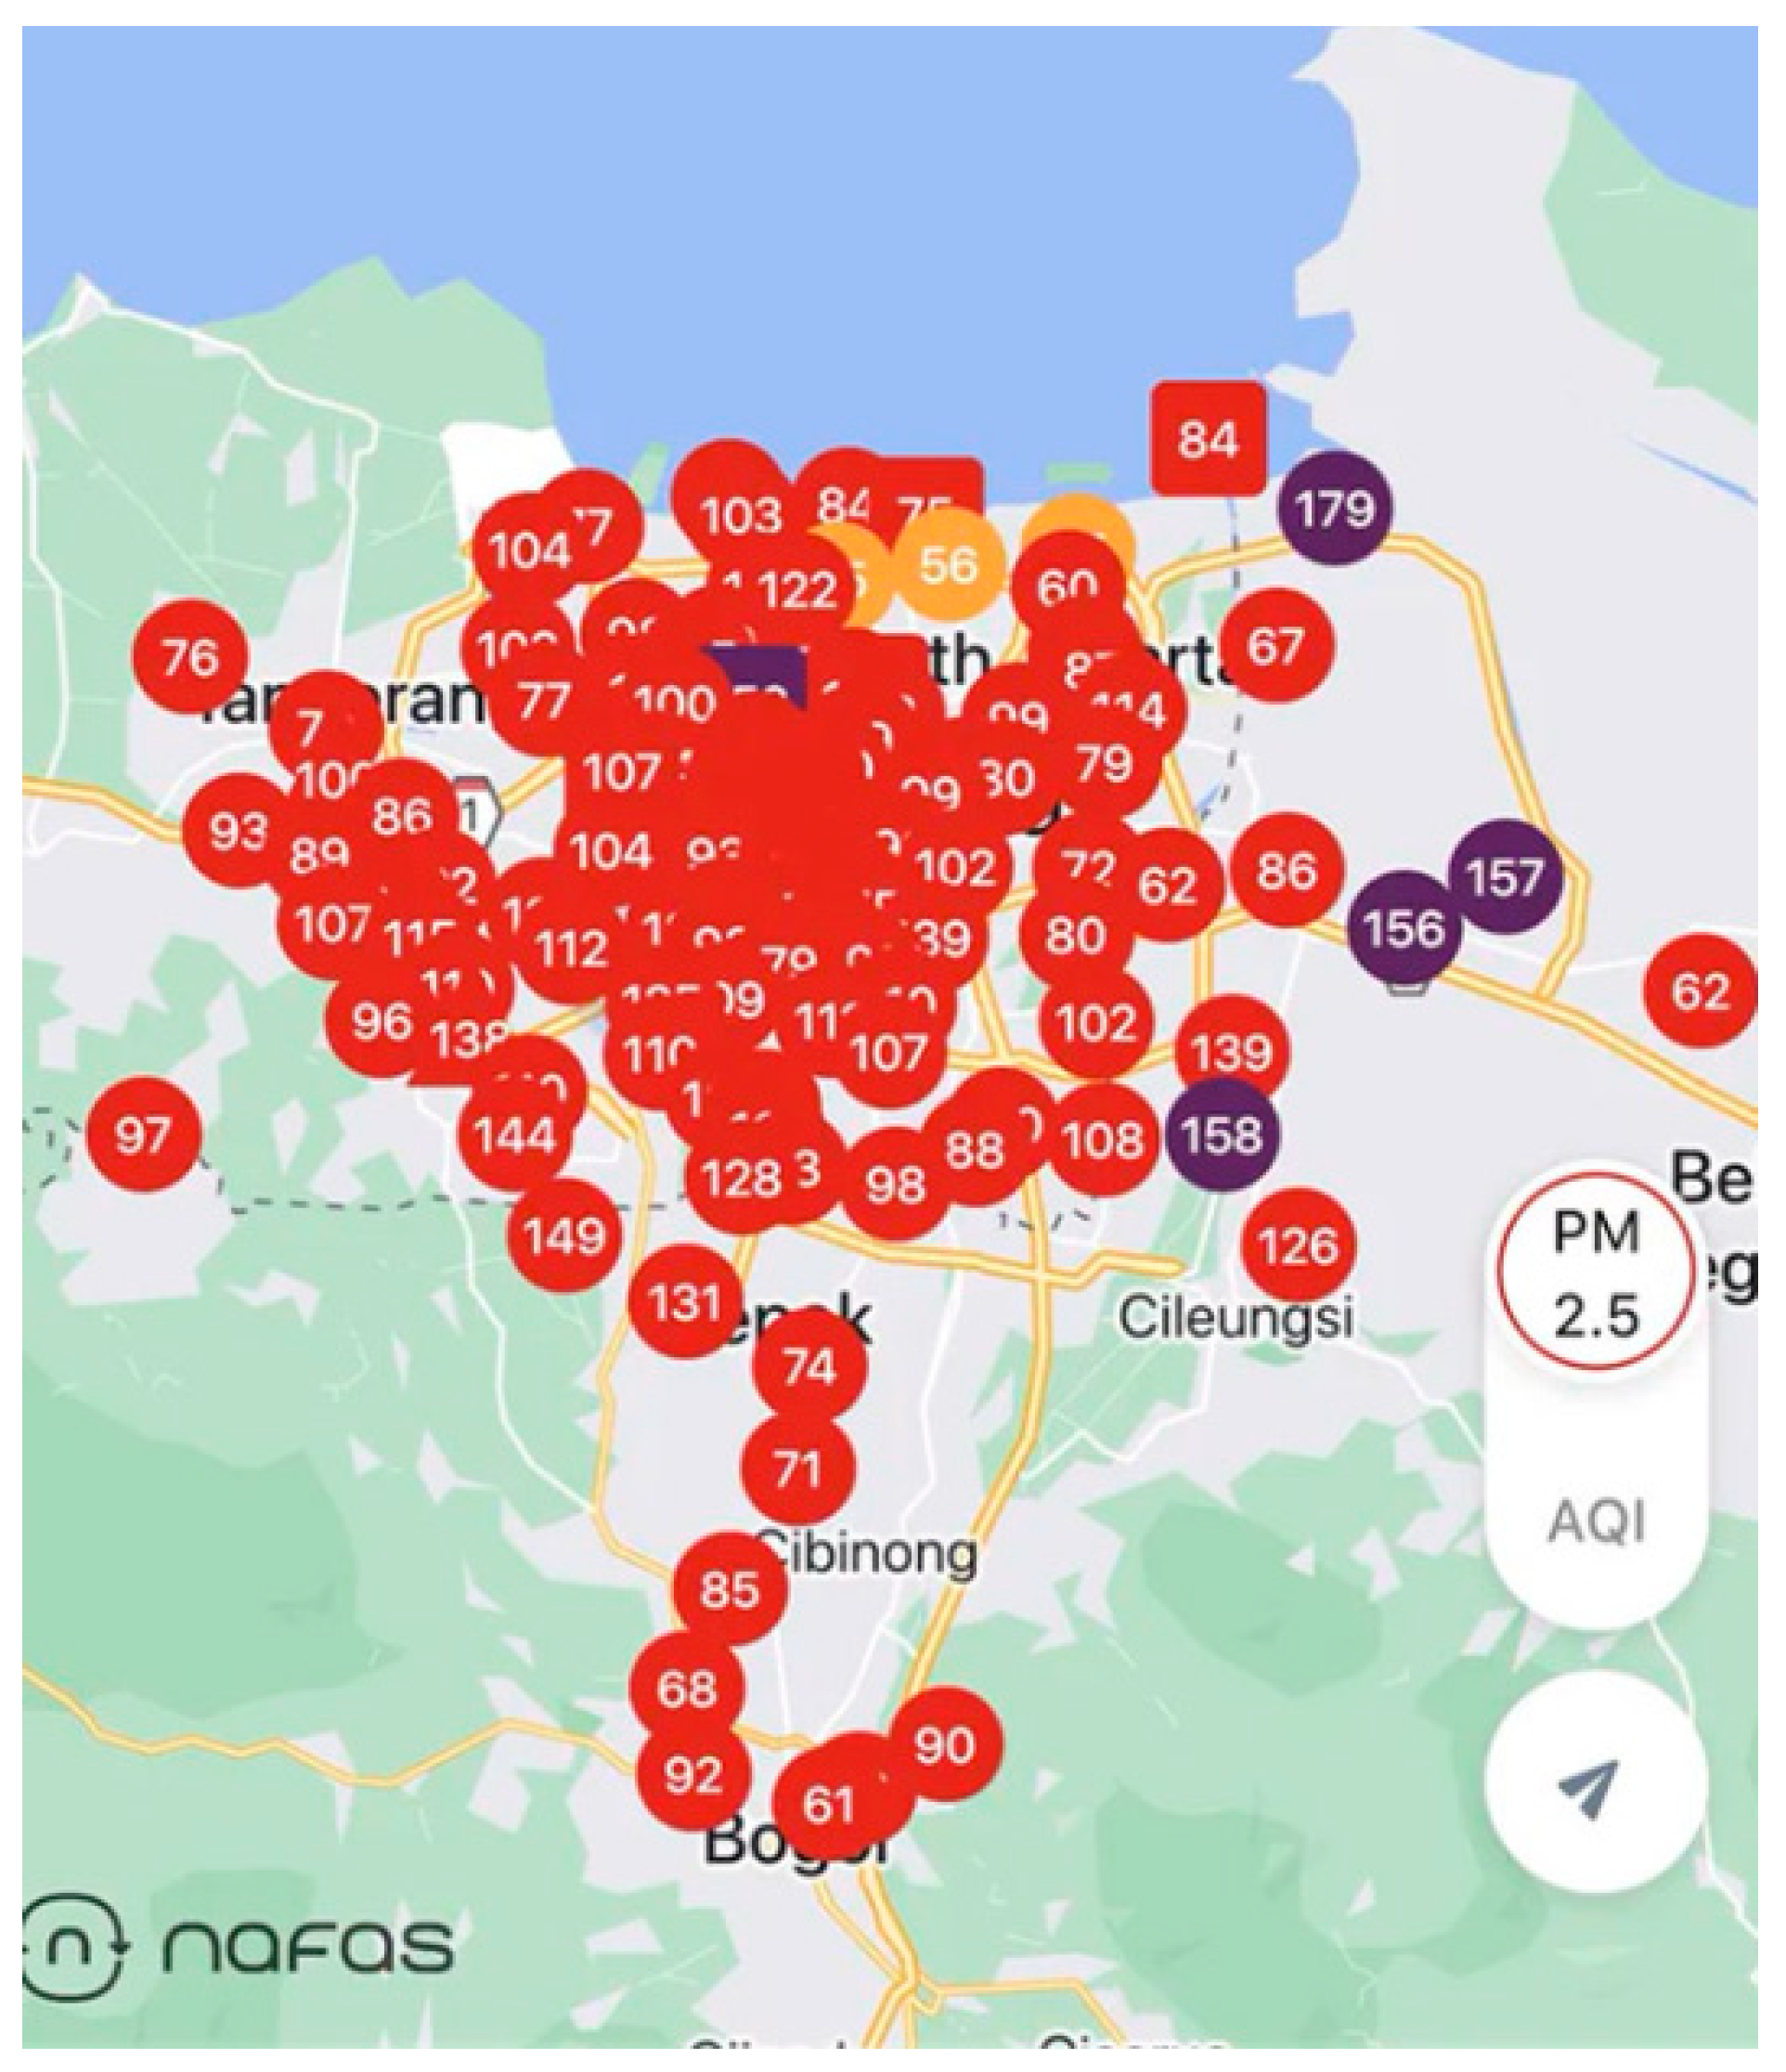
Jakarta and many other large cities in the world are currently facing a number of environmental challenges including air pollution, traffic congestion and the impact of climate change. Implementing a carbon tax in big cities can bring several benefits, including encouraging emission reduction. Jakarta is a city with a large population and intensive industrial activities, where by implementing a carbon tax the government can provide economic incentives for companies and individuals to reduce carbon emissions, especially from the transportation and industrial sectors. Greenhouse gas emissions are often related to air pollution, where by reducing carbon emissions you can reduce dangerous air pollutants such as fine particulates (PM2.5) and nitrogen dioxide (NO2) which can harm human health. In addition, by implementing a carbon tax, the government can allocate revenue from this tax to finance investment in more efficient and environmentally friendly public transportation as well as infrastructure for green mobility such as bicycle lanes and supporting infrastructure. Carbon tax can encourage investment in technology and innovation that is cleaner and more energy efficient, including renewable energy technology, electric transportation and more environmentally friendly production methods.
Jakarta is one of the cities that is vulnerable to flooding and sea level rise due to climate change. Reducing carbon emissions is one important step in global efforts to slow the rate of global warming and its impact on sea level rise. By implementing a carbon tax, the government can encourage sustainable economic development by allocating revenue from the carbon tax to support sectors that promote green growth such as renewable energy, environmentally friendly transportation, and green technology innovation. By implementing a carbon tax, Jakarta can be an example for other cities in Indonesia and around the world regarding its commitment to reducing carbon emissions and dealing with climate change. However, it is important to remember that implementing a carbon tax must also be carried out carefully and considering its impact on the economy and society as a whole, so a balanced approach and comprehensive strategy is needed to maximize the benefits of this policy. The implementation of a carbon tax has the potential to be a significant step in reducing carbon emissions [
1], and slowing the impacts of climate change [
2], such as flooding and sea level rise. This policy can support sustainable development through the allocation of tax revenues for the green sector [
3], but it needs to be implemented with a balanced strategy so that the benefits are optimal without burdening society and the economy [
4].
Figure 1.
Pollution mapping in Jakarta and its surroundings on 8 August 2023 (
www.nafas.co.id).
Figure 1.
Pollution mapping in Jakarta and its surroundings on 8 August 2023 (
www.nafas.co.id).
Carbon tax is a fiscal policy implemented by the government to set a price on carbon emissions from economic activities with the aim of providing economic incentives for companies and individuals to reduce greenhouse gas emissions as the main cause of climate change. By providing additional costs for carbon emissions, companies and individuals will look for ways to reduce emissions to avoid additional costs. These efforts encourage investment in cleaner technologies and more environmentally friendly production methods. Carbon taxes need to incorporate the external costs of carbon emissions into the prices of goods and services which helps to internalize the environmental costs of economic activities that produce emissions so as to take into account long-term impacts on the environment and human health. By providing economic incentives to reduce emissions, the implementation of a carbon tax can encourage the development and adoption of cleaner and environmentally friendly technologies, thereby creating new markets for innovation and green technology. Revenue from carbon tax can be used to support environmental programs such as investment in renewable energy, environmental conservation programs and incentives for sustainable mobility. Apart from that, revenue from the carbon tax can also be used to help groups who may be affected by the negative economic impact of this policy. Carbon taxes serve as an economic incentive to encourage carbon emission reductions [
5], while internalizing environmental costs into the prices of goods and services [
6]. In addition to encouraging green technology innovation [
7], carbon tax revenues can be used to support environmental programs [
8], and help groups economically impacted by the policy [
9].
By placing a price on carbon emissions, companies can better plan long-term investments by considering carbon impacts in business planning that encourages the use of greener technologies. Carbon taxes can also help accelerate the transition from fossil energy sources to renewable energy sources. By increasing the price of fossil energy, renewable energy becomes more economically competitive. Countries can demonstrate their commitment to reducing greenhouse gas emissions and combating climate change. This can be an example for other countries and help build international agreements to address climate change issues. However, it is important to remember that implementing a carbon tax also requires careful planning and monitoring so a balanced approach is needed to minimize negative economic impacts and ensure that this policy is truly effective in reducing carbon emissions. The aim of this research is to analyze carbon tax and estimate the amount of emissions produced by vehicles in order to reduce carbon emissions. Carbon taxes provide incentives for companies to invest in green technologies [
10], and support the transition to renewable energy [
11], making them more competitive with fossil fuels [
12]. They also reinforce international commitments to combat climate change [
13], but require careful planning to mitigate negative economic impacts [
14], and ensure their effectiveness in reducing carbon emissions [
15].
Several concepts developed in several literatures about carbon taxes are explained by Mikael Skou Andersen and Paul Ekins in the book Carbon Taxation: Lessons from Theory and Practice which discusses the theory and practice of implementing carbon taxes in various countries and provides insight into effective implementation [
16]. Apart from that, Lawrence H. Goulder in the book Carbon Pricing: Early Experience and Future Prospects provides an in-depth analysis of various carbon pricing approaches including carbon taxes and reviews the initial experience of countries that have implemented them [
17]. The development of insight into economic policy instruments to reduce carbon emissions, including carbon tax and emissions trading. Apart from that, the book entitled Carbon Pricing: Design, Experiences and Issues written by Stefano Verde discusses the design of carbon pricing policies including carbon taxes and provides an analysis of implementation throughout the world.
The carbon tax formula plays an important role in measuring and determining the amount of tax imposed on carbon emissions [
18]. The key role of the carbon tax formula is applied to assess the amount of carbon emissions produced by various human activities, especially in the transportation sector. In addition, it can provide economic value to carbon emissions where the carbon tax formula creates incentives for companies and individuals to reduce emissions. The higher the emissions, the higher the tax that must be paid. The government can create policies that direct behavioural changes towards more environmentally friendly practices and more efficient use of resources. Revenue from carbon taxes can be used to support environmental projects, renewable energy development, or other initiatives aimed at reducing greenhouse gas emissions. Carbon taxes also help reduce carbon emissions, which in turn can help address the impacts of climate change [
19]. This tax is a tool to reduce the carbon footprint of a country or region and the carbon tax formula provides a measurable and predictable framework and allows companies to plan long-term investments and integrate carbon costs into business strategies. Therefore, by using an economic approach, carbon taxes provide a solution that can be measured and implemented efficiently, utilizing market principles to achieve emission reductions. The effectiveness of a carbon tax depends heavily on careful policy design, including the right tax rate, how tax revenues are allocated, and supporting measures to ensure that the tax burden does not negatively impact certain sectors.
Table 1.
Previous research on carbon tax can be seen in the following table.
Table 1.
Previous research on carbon tax can be seen in the following table.
| Authors, Year |
Carbon Tax Concepts |
| [20] |
Carbon tax is a Pigouvian tax to change negative behaviour so as to increase revenue. |
| [21] |
Carbon tax reduced CO2 emissions and mitigate climate risks at the lowest economic cost. |
| [22] |
Carbon tax implies additional costs to obtain benefits that will mostly be enjoyed by future generations. |
| [23] |
One way to realize sustainable transportation is to implement a carbon tax to maintain harmony between humans and the surrounding environment. |
| [24] |
Carbon tax as an effective step in reducing CO2 emissions because it increases the efficiency of resources and business processes |
| [25] |
Carbon pricing instruments such as carbon taxes and emission trading schemes have fundamental relevance in internalizing the external costs of climate change for economic decision making and establishing economic incentives for clean energy development. |
| [26] |
Carbon tax as one of the solutions to overcome global climate change and as an effort to curb carbon emissions and encourage the widespread application of renewable energy. |
| The concept of carbon tax in this study |
Formulating a carbon tax calculation model in the transportation sector that is designed to achieve several objectives in the context of environmental protection and greenhouse gas emission reduction including efforts to reduce greenhouse gas emissions, encourage innovation and adoption of clean technology, direct changes in consumer and producer behaviour, generate revenue for environmental projects, provide certainty and predictability, deal with global climate change, align environmental and economic initiatives. The implementation of carbon tax must consider economic sustainability and social justice so as not to have a negative impact on vulnerable groups or certain sectors. Good and comprehensive policy design will help achieve goals effectively. |
This study aims to produce a formula for calculating carbon tax in the transportation sector. The carbon tax formula is designed to achieve goals in the context of environmental protection and reducing greenhouse gas emissions.
Based on the regulations issued by the government aimed at implementing carbon tax in Indonesia which refers to two main regulations including Law Number 7 of 2021 concerning harmonization of tax regulations and Presidential Regulation Number 98 of 2021 concerning the application of carbon economic value for achieving targets national contribution and greenhouse gas emission control in Indonesia, where in this regulation the amount of carbon tax is IDR 30 per kg CO2e. However, although the regulation has been issued, the implementation of carbon tax has not been implemented until now in various sectors including the transportation sector. Calculation The basis of reference in determining the amount of carbon tax in government regulations is allegedly not very clear in its calculation reference. For this reason, it is necessary to reformulate the basis of reference for calculating the amount of carbon tax that refers to social, economic and environmental conditions in Indonesia more accurately and accountably. The importance of this study is to highlight that even though Indonesia has issued regulations related to carbon tax, the implementation of this policy is still not effective in various sectors, including transportation. In addition, the unclear basis for calculating the carbon tax rate used emphasizes the need to reformulate the calculation method that is more appropriate to social, economic, and environmental conditions in Indonesia, so that the carbon tax policy can be more accurate and have a positive impact on controlling greenhouse gas emissions.
3. Results
Carbon tax knowledge plays an important role in various aspects of public policy, economy, environment, and social. Some important roles in understanding carbon tax include controlling greenhouse gas emissions, encouraging green technology innovation, establishing fair and efficient policies, increasing public awareness and education, collecting revenue for environmental projects, supporting international agreements, government transparency and accountability, reducing dependence on fossil fuels, addressing economic uncertainty, promoting social justice. Carbon taxes are designed to reduce greenhouse gas emissions by making emissions more expensive for companies and individuals. Therefore, by understanding how carbon taxes work, policymakers can design an effective system to achieve emission reduction targets.
Efforts made in calculating carbon taxes to understand global carbon emissions, the development of greenhouse gas emission data and CO2 emissions in Indonesia play a very important role because these three factors help assess the scale and impact of climate change and design effective policies in accordance with emission reduction targets. Efforts to understand global carbon emissions provide an important context in designing carbon tax policies because climate change is a global challenge today. Understanding global carbon emissions, the development of greenhouse gas emission data, and CO2 emissions in Indonesia is very important in designing and calculating effective carbon tax rates. This data not only helps the government determine which sectors to target but also allows for economic impact assessments, monitoring progress in reducing emissions and ensuring that carbon tax policies are designed in a fair and sustainable manner. This information also serves as a baseline for measuring Indonesia’s success in contributing to global efforts to address climate change.
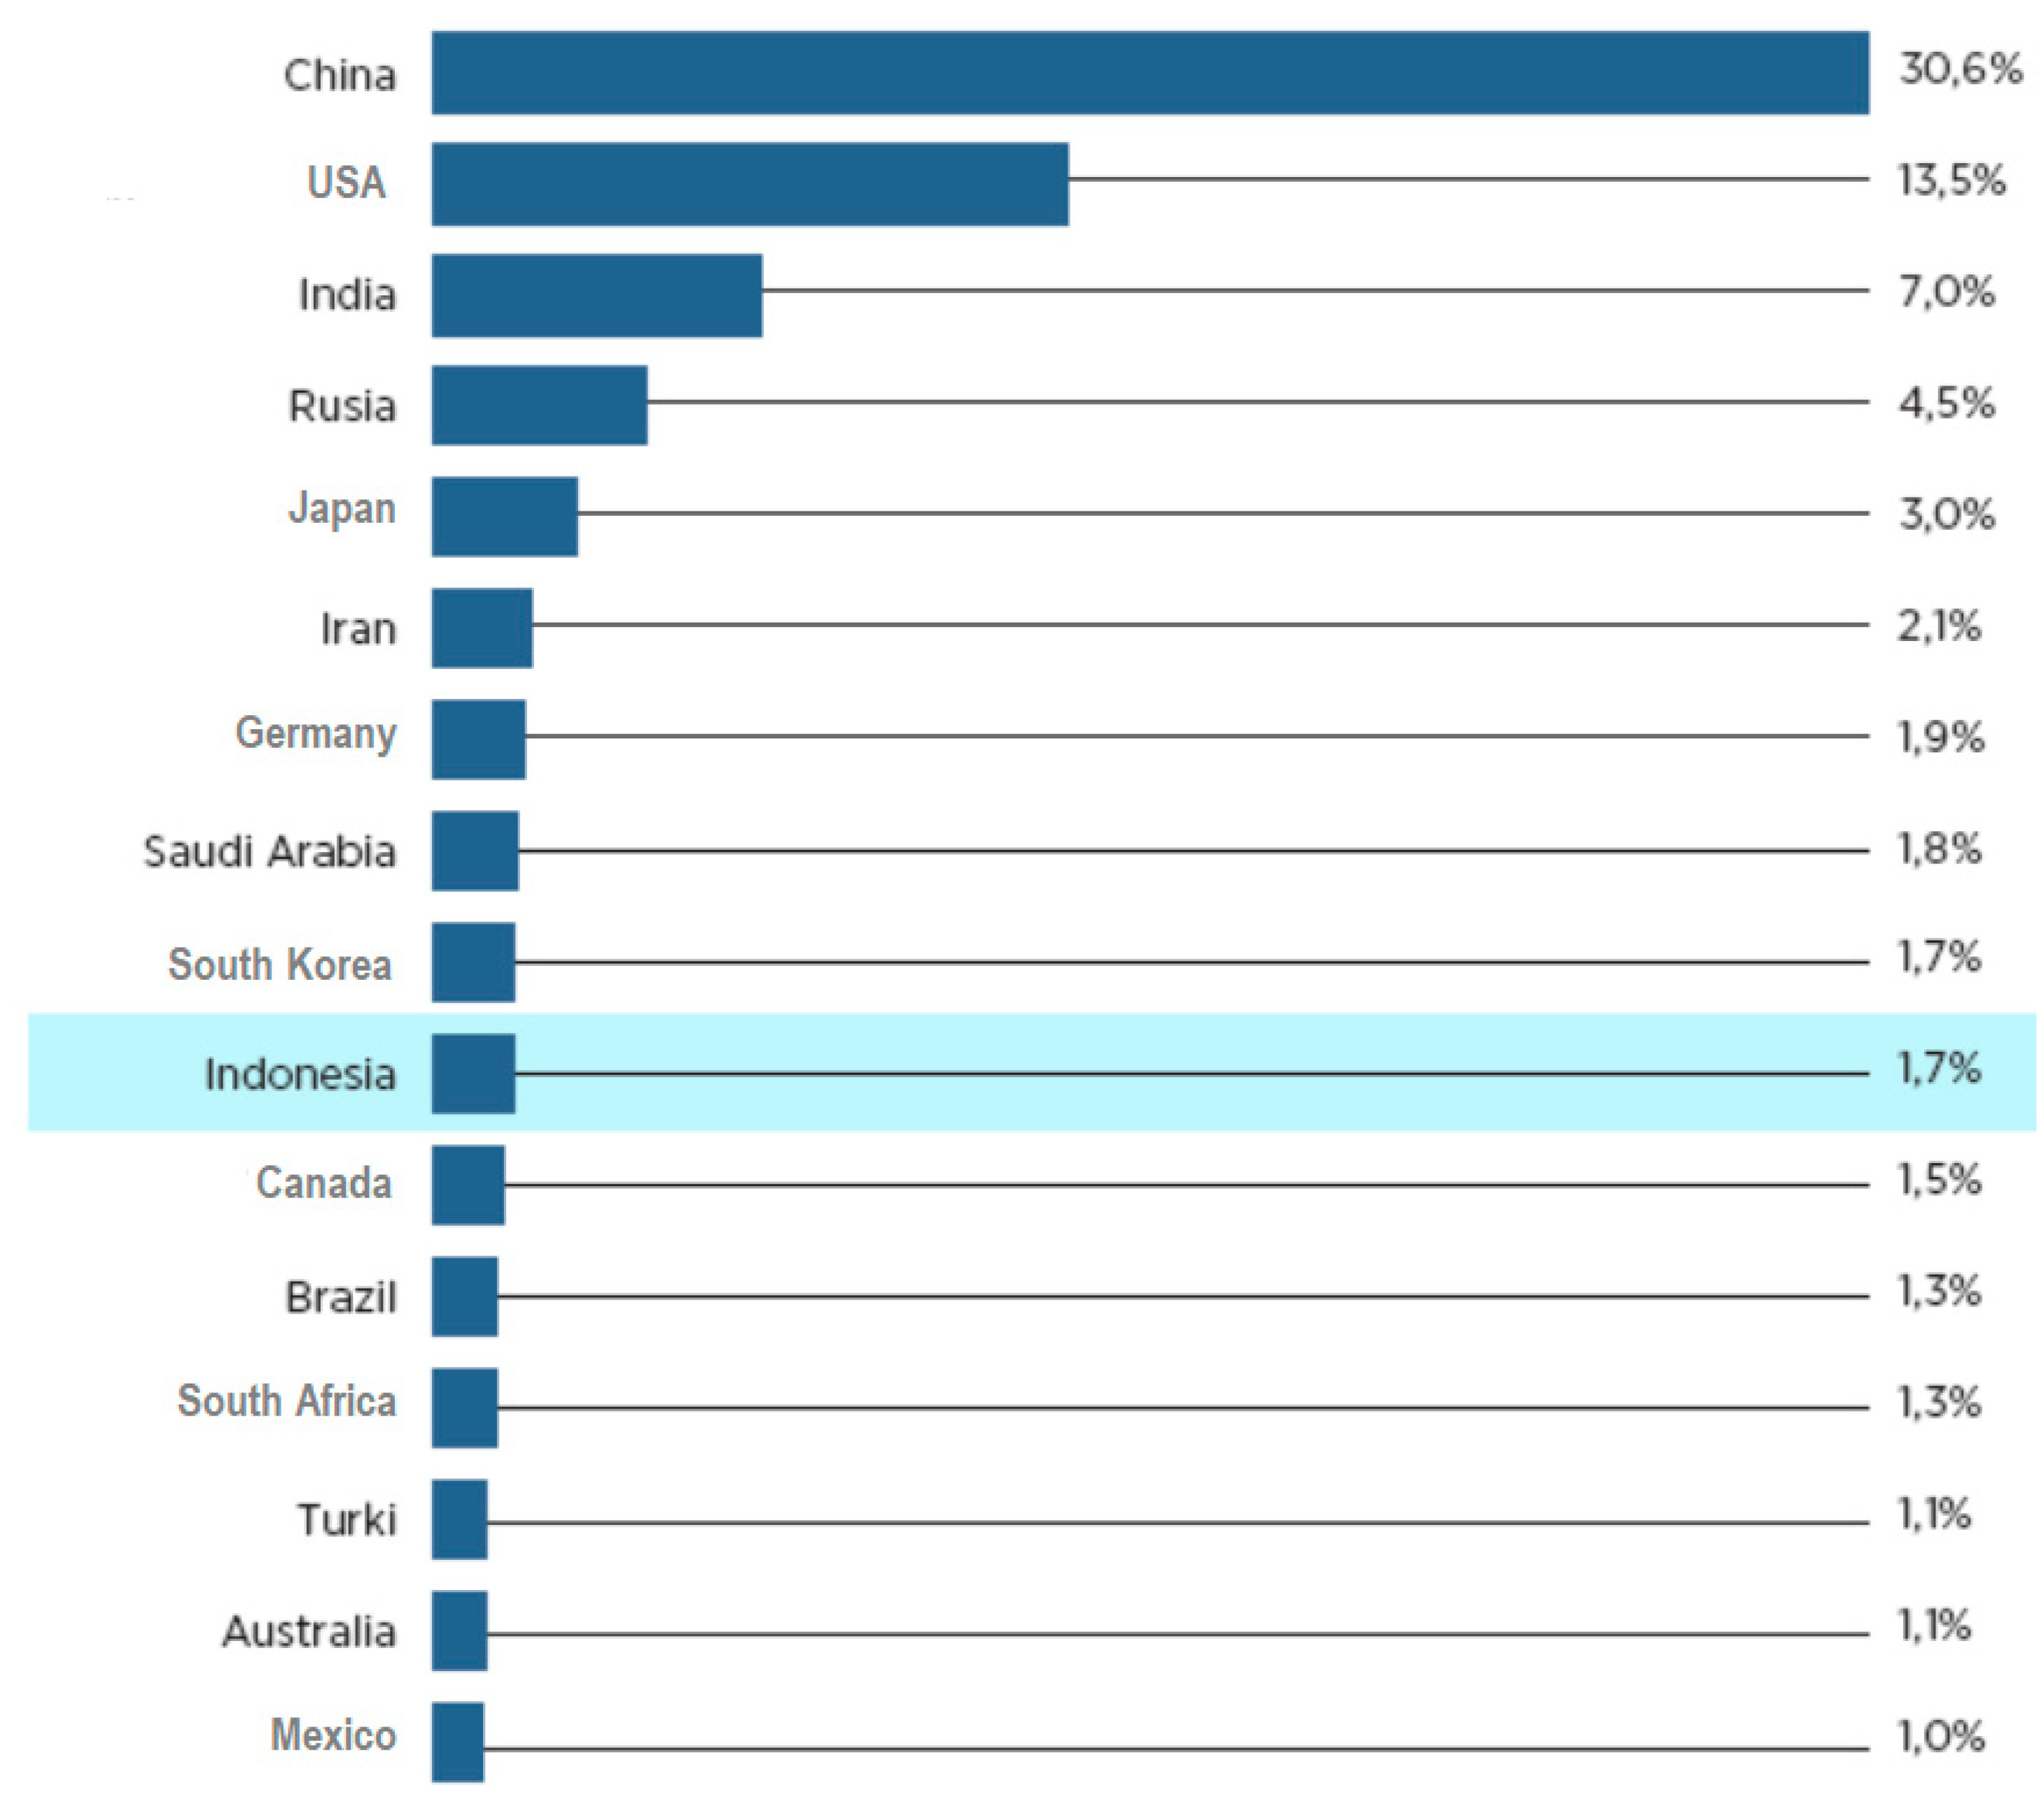
Therefore, efforts to identify global carbon emissions countries play an important role in providing in-depth insight into the contribution and responsibility of countries to climate change as presented in
Figure 3. The information obtained can help formulate fair, effective and efficient policies in global efforts to reduce carbon emissions. Countries that produce large amounts of carbon emissions, especially industrial countries, have a greater responsibility to reduce emissions. By identifying the countries that contribute the most emissions, global reduction targets can be focused on sectors and countries that need the most significant changes. This allows for the establishment of mitigation policies that are in accordance with each country's contribution to global carbon emissions. In addition, the importance of this data also reflects a greater moral responsibility for high-emitting countries to lead efforts to mitigate climate change, while ensuring fairness for countries that are more vulnerable to its impacts.
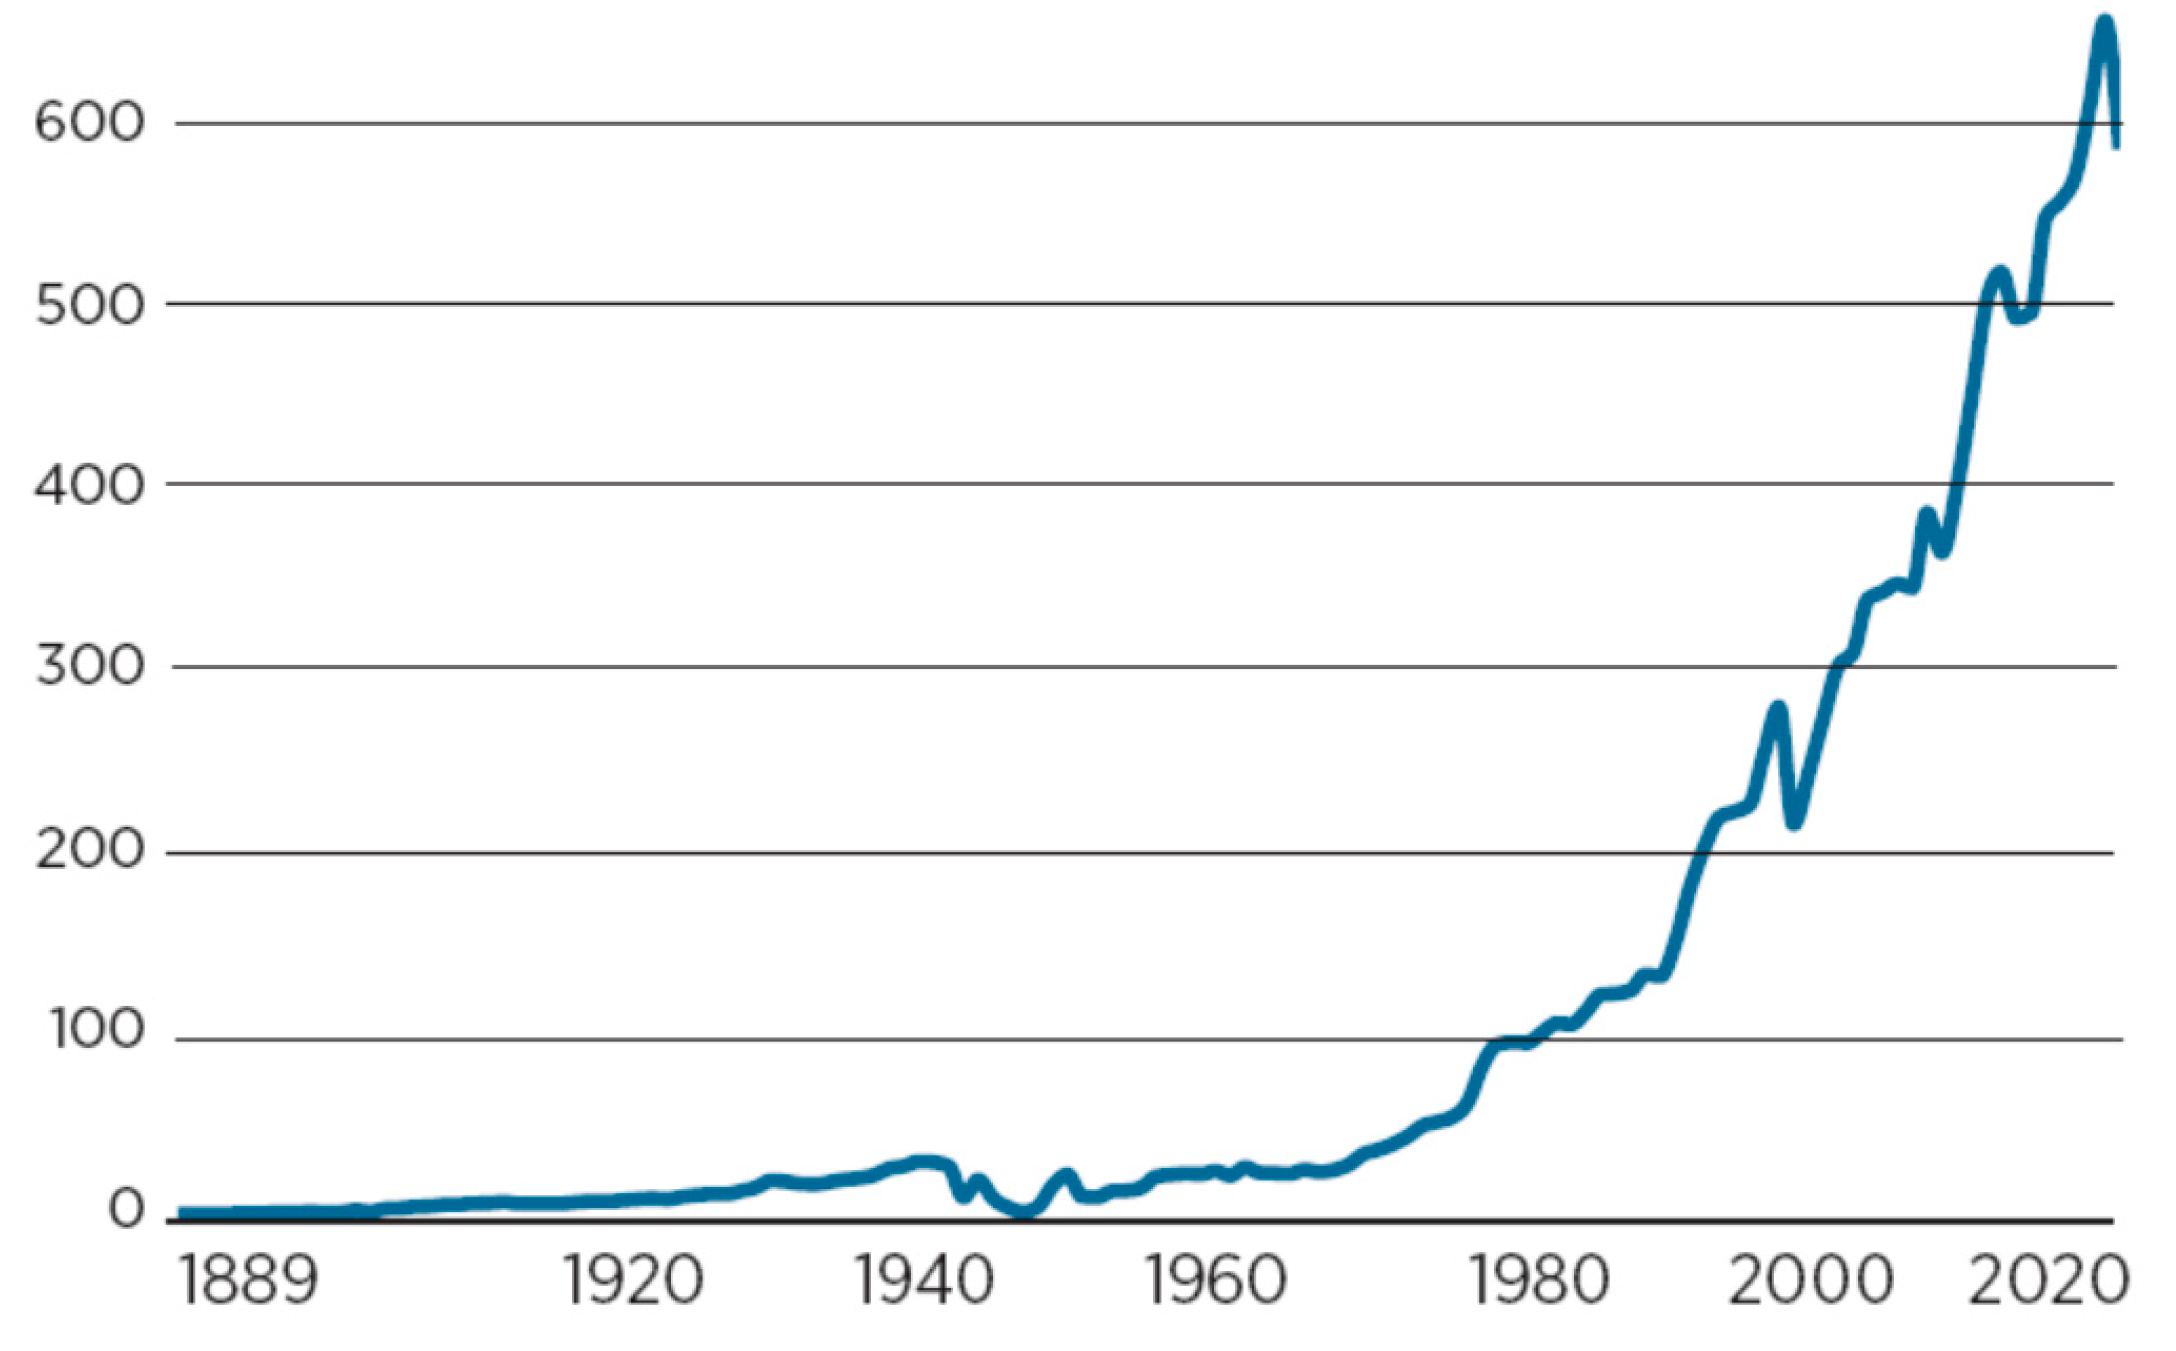
The steps to find out and understand Indonesia's CO₂ emission trend from 1889 to 2020 presented in
Figure 4 are very important because they provide a historical overview and in-depth context of Indonesia's role in global contributions to climate change and the challenges faced by the country in the transition to more environmentally friendly development. In addition, efforts to track Indonesia's CO₂ emission trend provide information on how carbon emissions have evolved along with economic development and industrialization. This understanding is essential for designing effective climate policies, measuring the impact of existing policies, meeting international commitments and planning future mitigation and adaptation measures. By utilizing this historical data, Indonesia can build a stronger and more sustainable strategy in facing the challenges of climate change while maintaining inclusive and green economic growth.
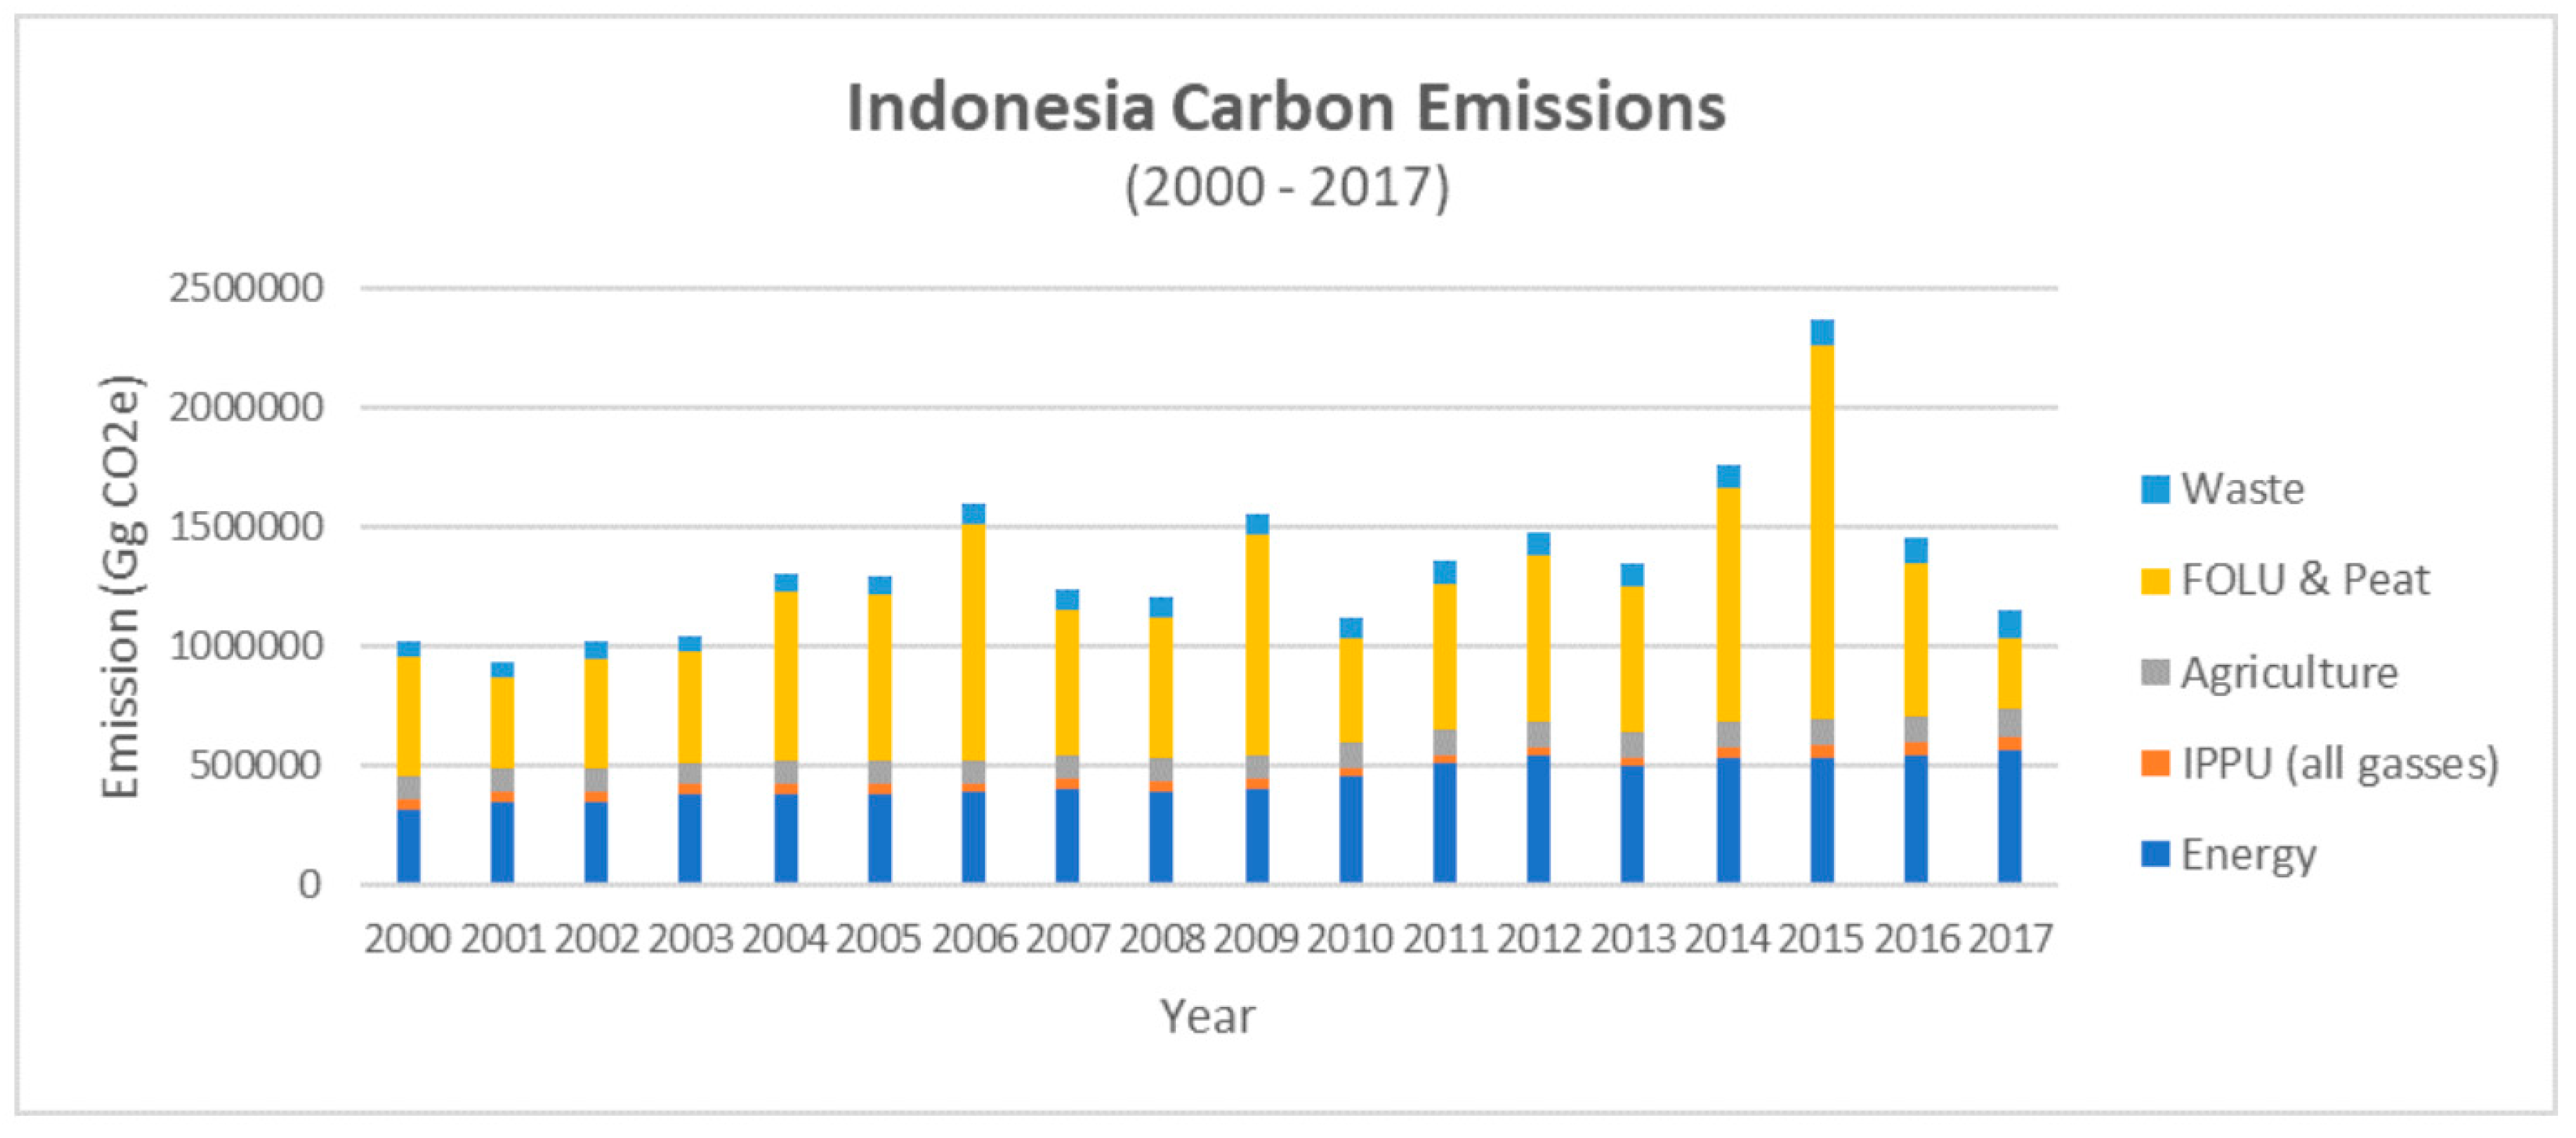
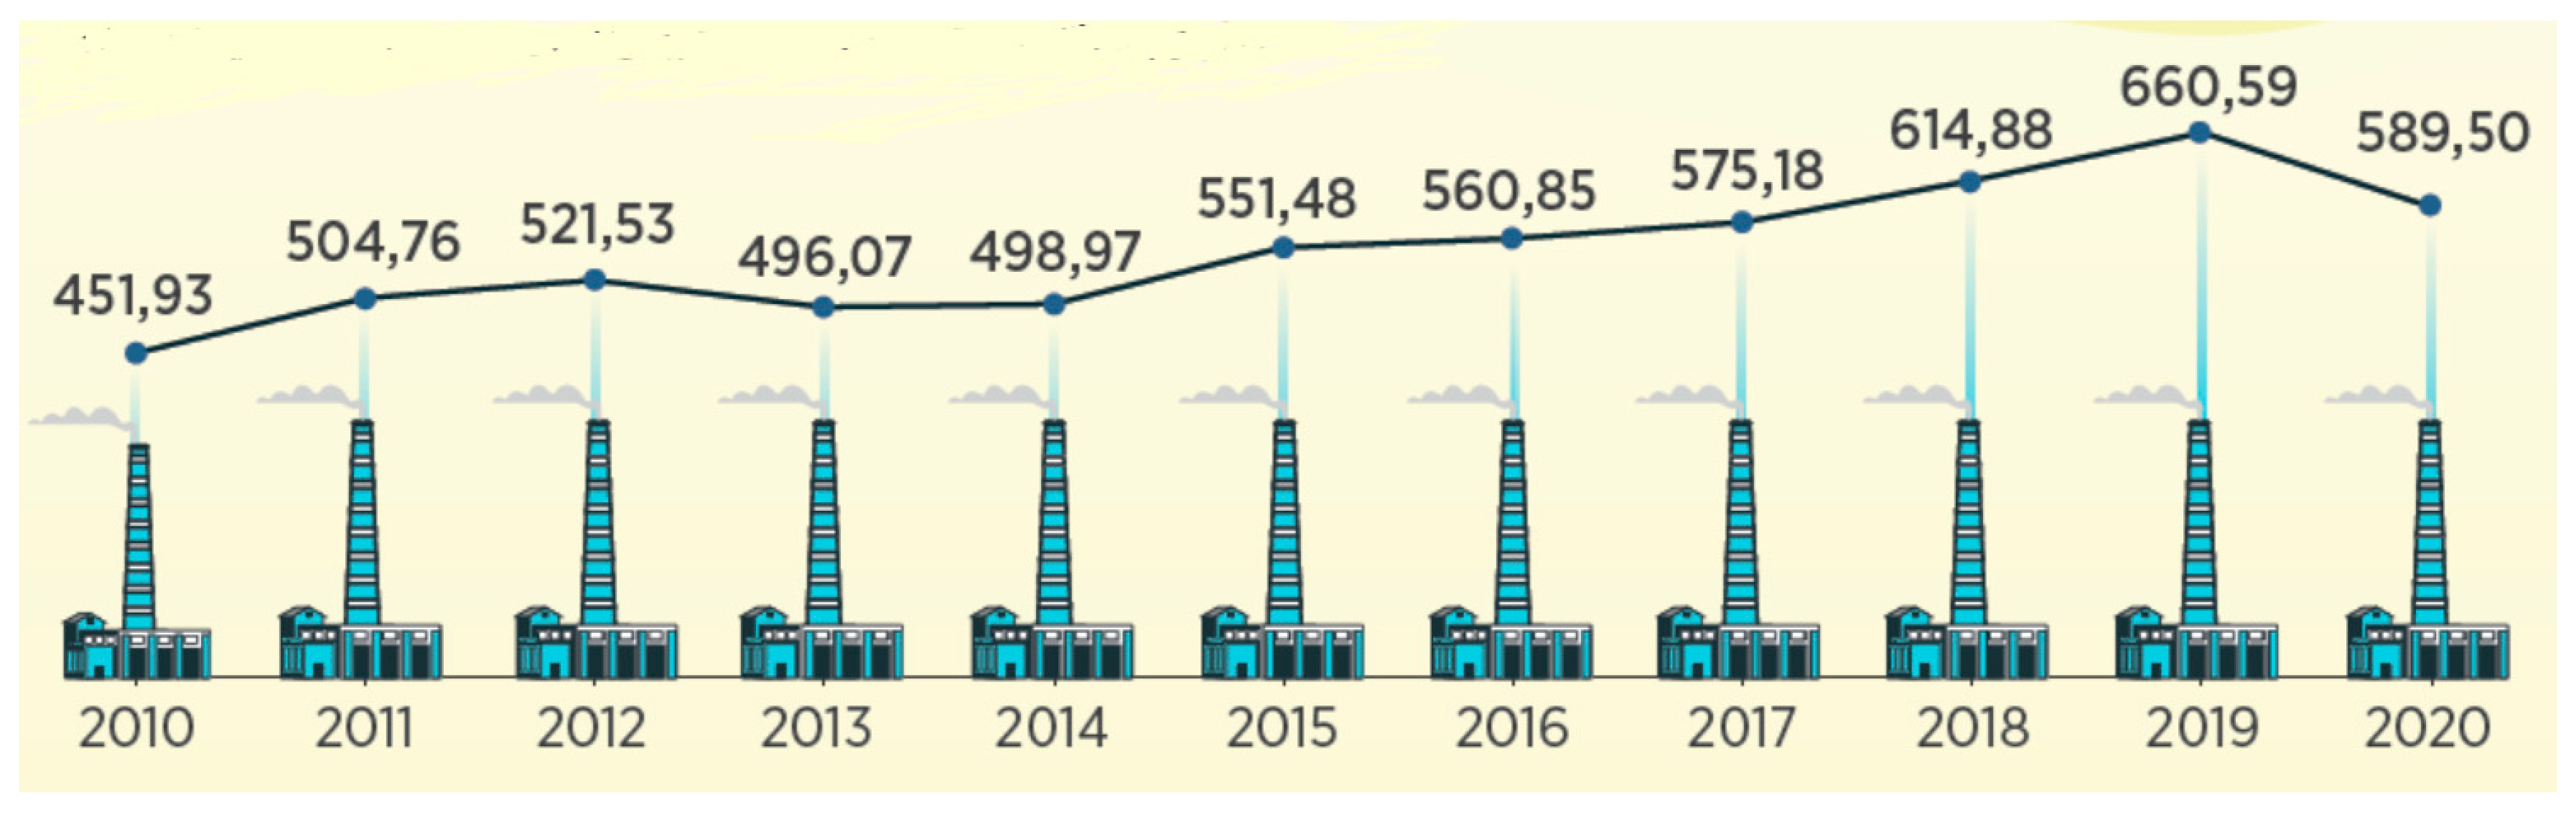
Information on Indonesia's greenhouse gas (GHG) emissions from 2010 to 2020 shown in
Figure 5 has great importance in the context of climate change mitigation, policy formulation and evaluation of the success of emission reduction efforts. GHG emission data for a decade provides an overview of the development of Indonesia's emissions over time. By monitoring trends from 2010 to 2020, see emission patterns from various sectors such as energy, transportation, forestry, agriculture and waste. Efforts to identify whether efforts that have been made such as greening, renewable energy and energy efficiency have succeeded in reducing emissions or failed [
28]. Steps to find out greenhouse gas emissions are an important tool in understanding emission developments, assessing the effectiveness of climate change mitigation policies and determining the next steps to achieve national and international emission reduction targets. This data helps ensure that Indonesia moves towards a low-carbon economy in an effective and equitable manner, while maintaining economic growth and public welfare.
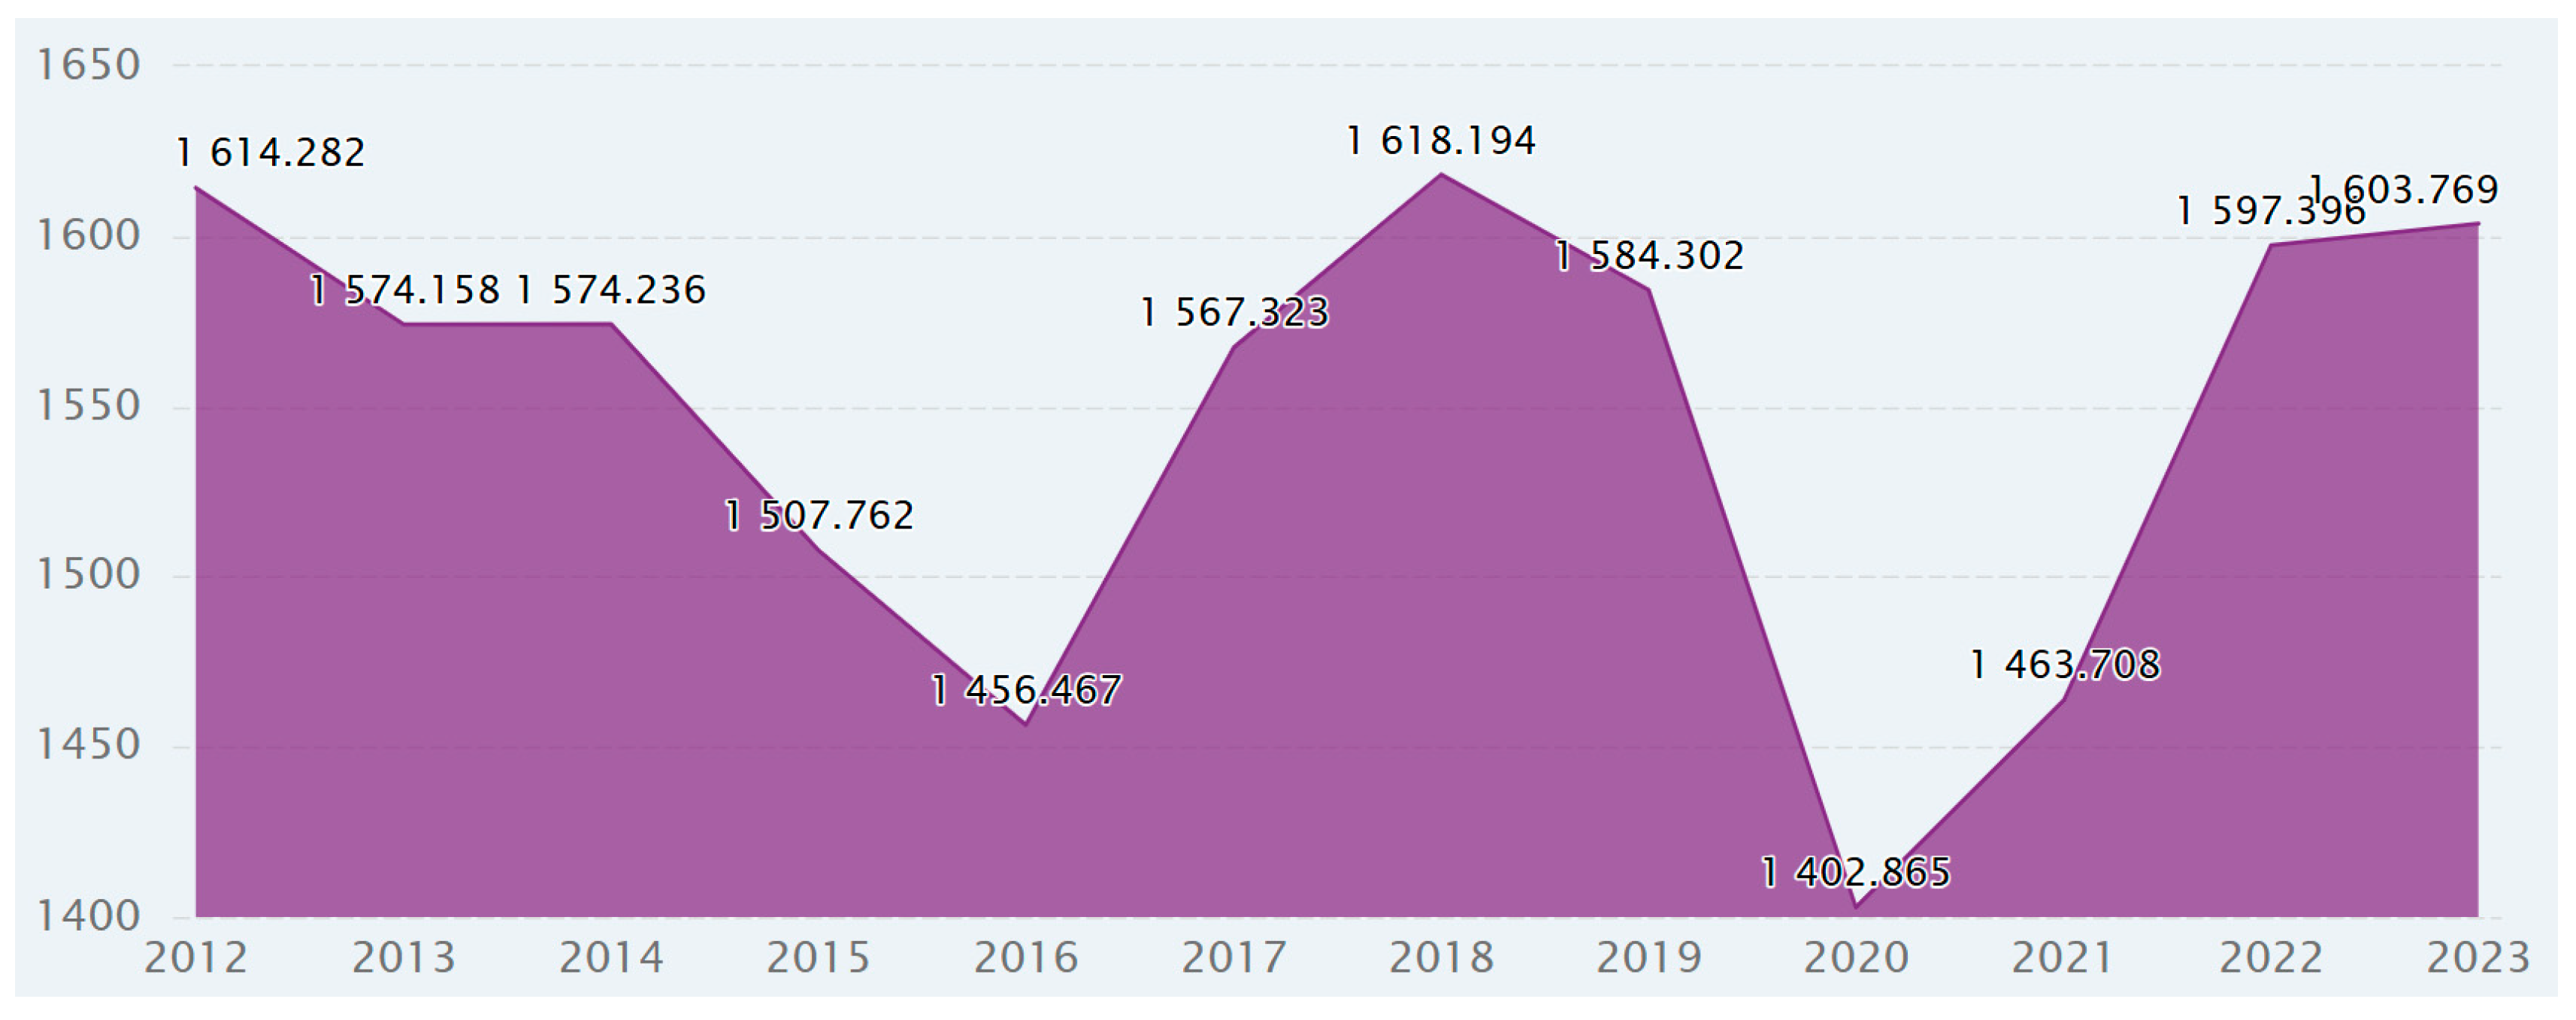
Indonesia's oil consumption data based on CEIC Data plays an important role in determining carbon tax rates as shown in
Figure 5. Carbon tax is based on the amount of greenhouse gas (GHG) emissions produced by the combustion of fossil fuels such as oil. Oil consumption is directly related to the amount of carbon emissions released into the atmosphere. Oil consumption data can be used to measure the total carbon emissions resulting from oil use in key sectors such as transportation, industry, and power generation. In addition, oil consumption data is used to determine the amount of carbon tax rates based on the amount of emissions resulting from oil use. This rate can be higher if the measured oil consumption produces large emissions. Oil consumption data provides an important foundation in determining fair and effective carbon tax rates. This data helps calculate emissions, adjust taxes per sector, assess economic impacts, support emission reduction targets and identify the necessary energy transitions. By using oil consumption data appropriately, carbon tax policies can be designed to minimize economic impacts while encouraging significant and sustainable emission reductions [
29].
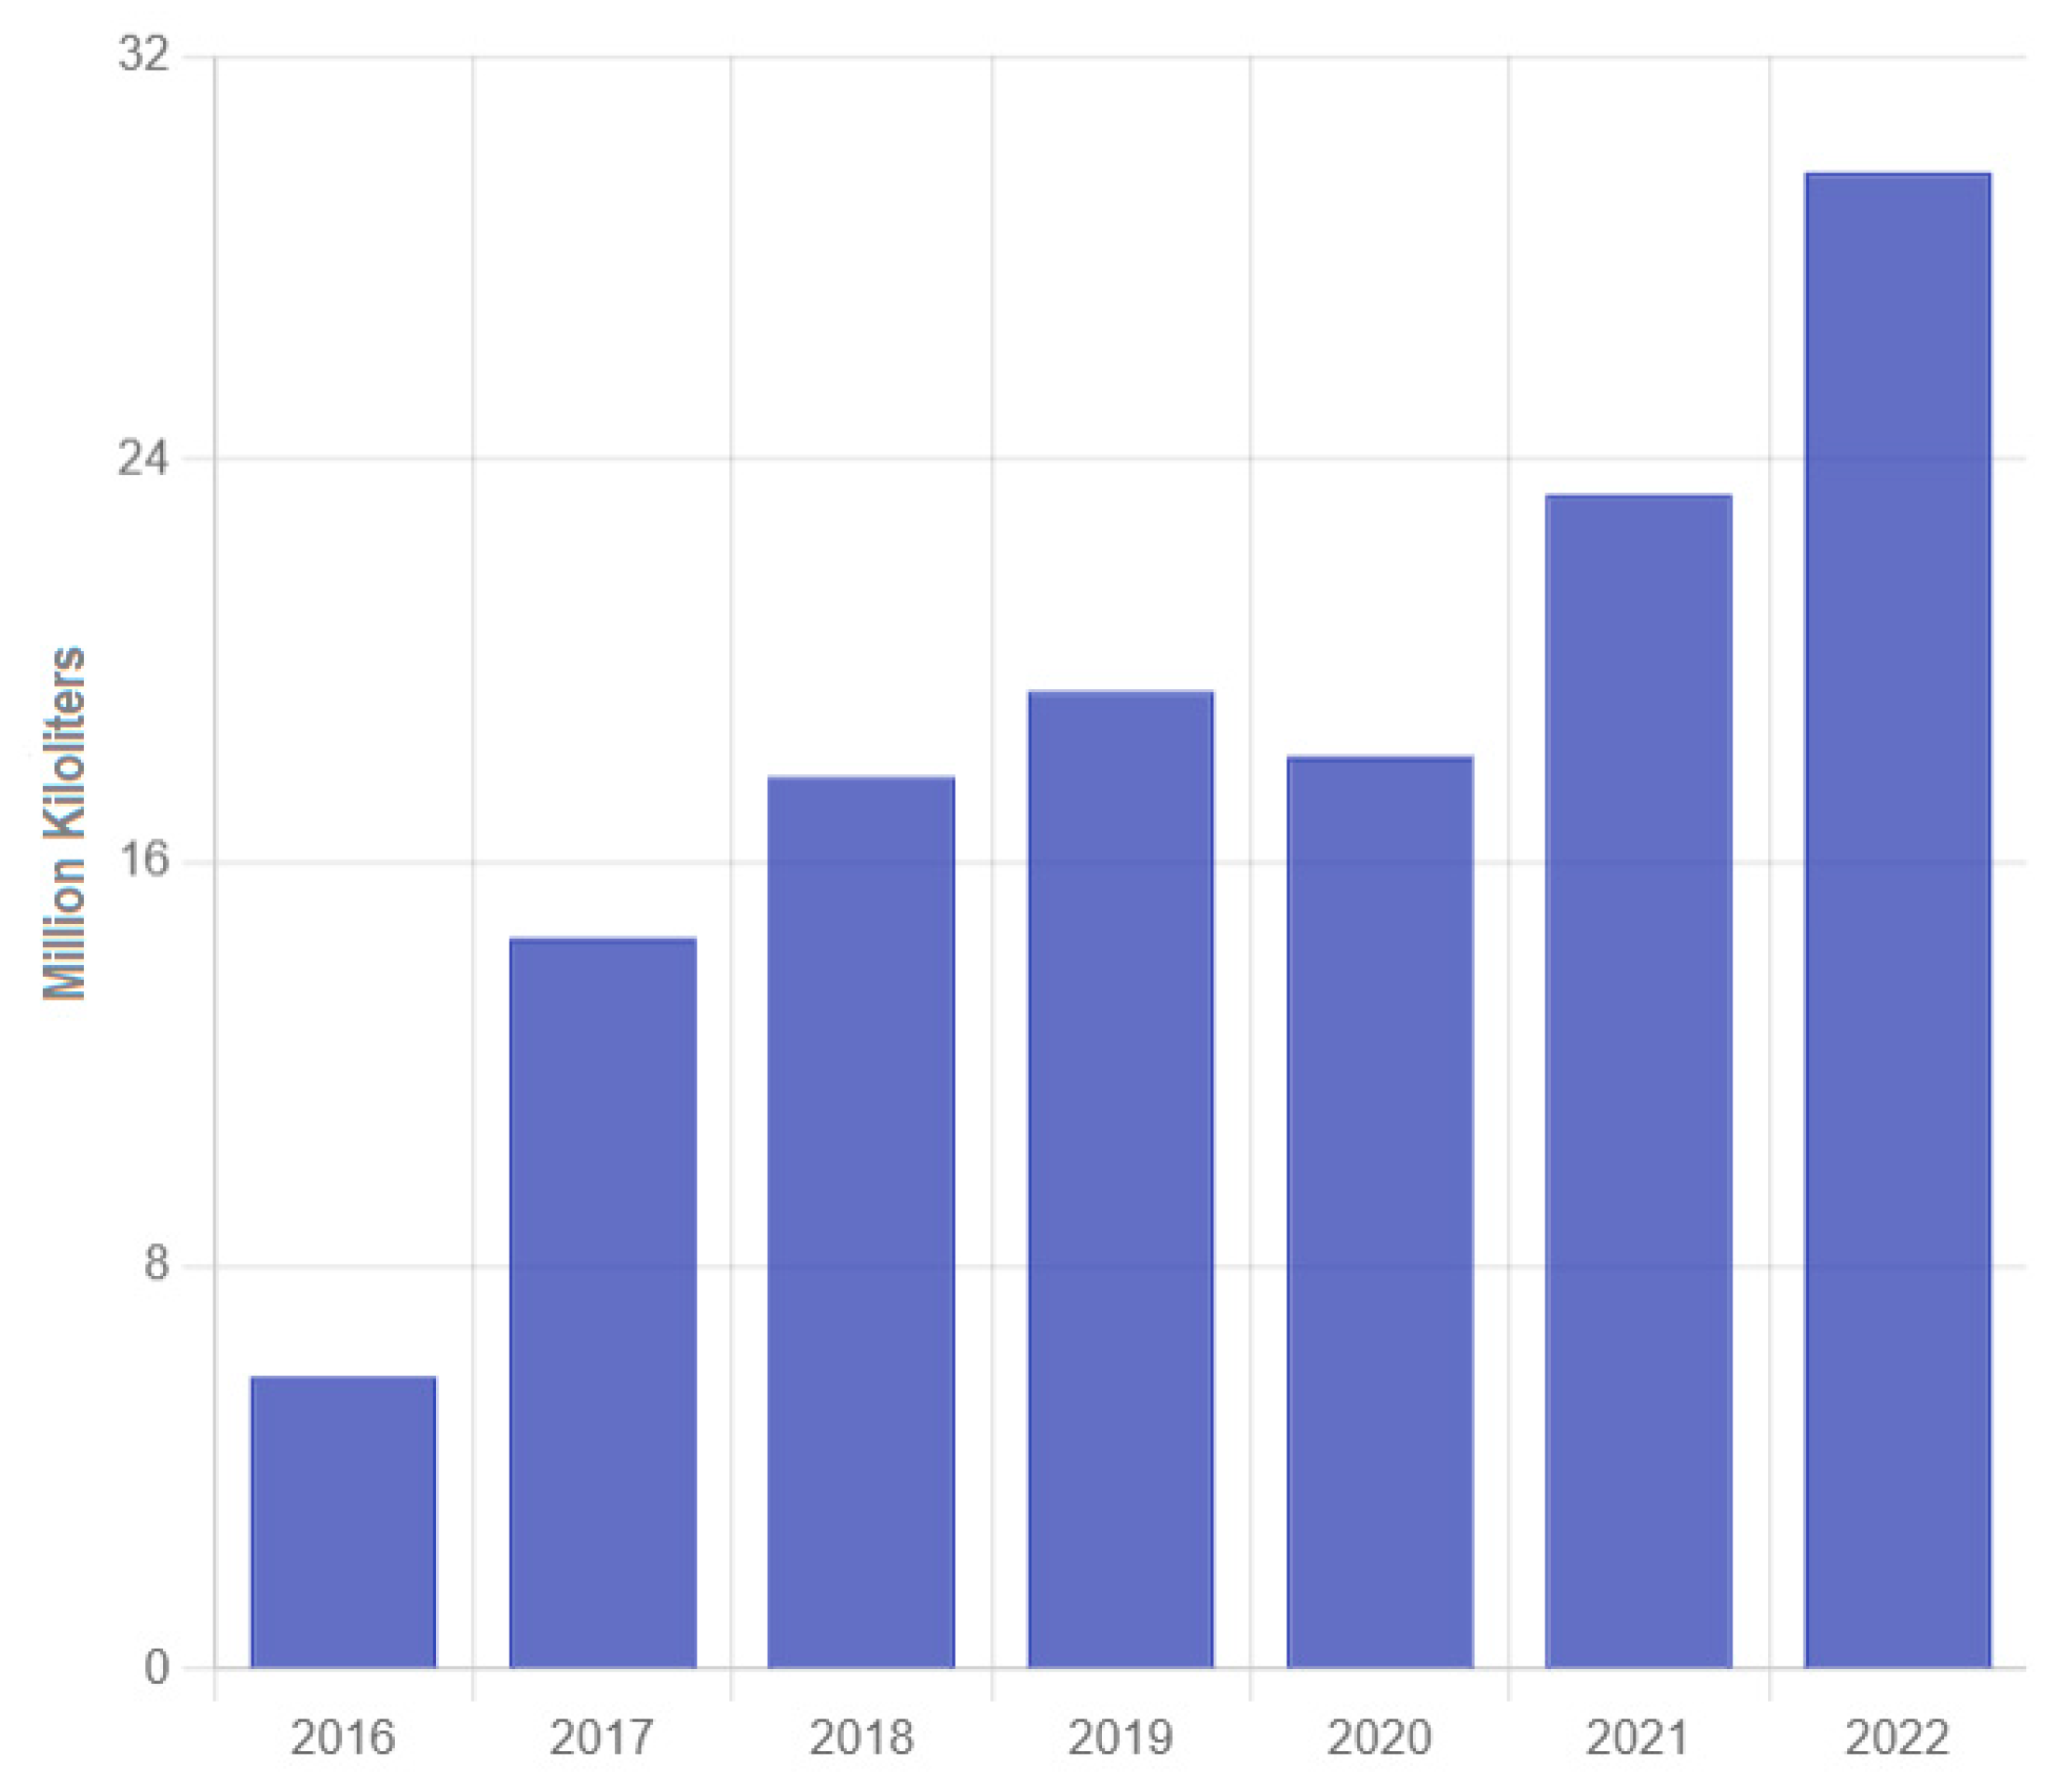
Figure 7.
Indonesia's Fuel Consumption Trend (Ministry of Energy and Mineral Resources).
Figure 7.
Indonesia's Fuel Consumption Trend (Ministry of Energy and Mineral Resources).
Indonesia's fuel consumption trend data based on data from the Ministry of Energy and Mineral Resources is very important in considering carbon tax rates. Carbon taxes are intended to reduce carbon emissions from the combustion of fossil fuels, including fuels. This trend data plays a role in determining effective and fair carbon tax rates. This data not only helps calculate carbon emissions from fuel combustion but also provides important information about the economic impact, consumption behaviour and potential emission reductions in various sectors. This information allows the government to measure carbon emissions, target key sectors, and reduce the economic burden of environmental policies. By understanding fuel consumption patterns, the government can formulate targeted carbon tax policies, encourage energy transitions, and ensure economic and environmental sustainability in Indonesia. Ultimately, fuel consumption trends can help encourage the transition to clean energy and achieve carbon emission reduction targets [
30].
Energy consumption data based on the industrial, household, commercial, transportation, and other sectors provided by the Ministry of Energy and Mineral Resources (ESDM) plays a very important role in considering the carbon tax rate shown in
Table 2. Carbon tax is a policy instrument that aims to reduce greenhouse gas (GHG) emissions by taxing activities that produce carbon, mainly through the use of fossil fuels. Energy consumption data plays a role in identifying the emission contribution of each sector. Energy consumption data per sector allows us to measure carbon emissions resulting from energy use in various sectors. Industry is usually one of the sectors with the largest energy consumption, especially in the form of fossil fuels such as coal, natural gas, and oil, making it an important target for emission reductions. Transportation is also a sector with significant emissions due to the use of fuels such as gasoline and diesel. Households contribute to emissions through the use of electricity and fuel for household needs such as cooking, heating, and lighting. The commercial sector including offices and shopping centers consume energy for electricity and air conditioning which contribute to emissions. Other sectors can include small or specific sectors such as agriculture or the informal sector. By knowing how much emissions are produced by each sector, carbon tax rates can be designed more accurately to target sectors that contribute greatly to carbon emissions. Energy consumption data based on industrial, household, commercial, transportation and other sectors provides a strong foundation in designing effective and fair carbon tax rates. This data allows the government to understand the emission contribution of each sector, adjust tax rates as needed, evaluate economic and social impacts and encourage energy transition and emission reduction. With the use of appropriate data, carbon tax policies can be designed to support sustainable economic growth [
31], and achieve Indonesia's climate targets.
The price per unit of energy issued by the Ministry of Energy and Mineral Resources for fuels such as gasoline RON 90 and 92, Avtur, kerosene, gasoil CN 48 and CN 51, and LPG are very important in various aspects of energy, economic and environmental policies as presented in
Table 2. The price per unit of energy provides a strong basis for determining carbon tax rates. Each type of fuel has a different carbon emission potential and fuel prices affect consumer behaviour and cost structures in various sectors. Gasoline RON 90 and 92, which are widely used in private transportation, contribute significantly to carbon emissions. Knowing the price per liter helps design a proportional tax rate to reduce consumption of these fuels. Avtur (aviation fuel) and kerosene (kerosene) are often used in the aviation and household sectors and require tariff settings that are in accordance with the volume of use and their environmental impact. Gasoil CN 48 and CN 51 used in diesel vehicles and the industrial sector have higher emission intensity so that the carbon tax imposed can be higher to encourage the use of more environmentally friendly energy. LPG (Liquefied Petroleum Gas) used in households and industry is a fossil fuel that is often a cleaner alternative to kerosene. Carbon tax rates need to consider the price per unit of LPG because if it is too high it can affect low-income households. Efforts to find out the price per unit of energy including gasoline, Avtur, kerosene, gasoil and LPG play an important role in designing effective, fair and sustainable carbon tax rates. This price data allows the government to calculate economic impacts, manage energy subsidies, ensure social justice and support the energy transition towards wider use of renewable energy. A deep understanding of energy prices helps in making balanced energy policies, reducing carbon emissions and protecting the interests of society and the environment [
32].
Energy consumption data in the transportation sector issued by the Ministry of Energy and Mineral Resources plays a very important role in considering the carbon tax rate shown in
Table 3. The transportation sector is one of the largest contributors to greenhouse gas emissions due to the intensive use of fossil fuels such as gasoline, gasoil (diesel) and Avtur (aviation fuel). The transportation sector has a high level of carbon emissions due to the significant use of fossil fuels. The volume of fuel use such as gasoline RON 90 and RON 92, gasoil CN 48 and CN 51, and Avtur which have a direct impact on the amount of carbon emissions produced. The transportation sector includes private vehicles, public transportation and air transportation, each contributing different amounts of emissions. By understanding the energy consumption of the transportation sector, carbon tax policies can be adjusted to target the fuels that are most widely used and have the greatest impact on carbon emissions. Energy consumption data in the transportation sector is very important in designing and implementing effective carbon tax rates. This data helps the government measure the contribution of carbon emissions from the transportation sector, determine the right tax rate, and understand the economic impact of the tax. In addition, this data also allows the formulation of policies that encourage energy efficiency [
33], support the transition to clean energy and maintain social justice [
34]. The use of appropriate data, carbon tax can be an efficient policy instrument in reducing carbon emissions [
35], and achieving climate targets in Indonesia.
Knowledge of carbon taxes can encourage investment in environmentally friendly technologies and energy efficiency where carbon taxes provide incentives for companies to develop and adopt technologies that reduce emissions. Understanding carbon taxes helps in designing fair and efficient policies that minimize the economic burden on society while still achieving environmental goals. Understanding carbon taxes includes identifying groups that may be disproportionately affected and designing appropriate compensation mechanisms. Knowledge related to carbon taxes can increase public awareness of climate change and the importance of reducing emissions in order to encourage more environmentally friendly behaviour at the individual and community levels. Carbon taxes can be a significant source of revenue for governments, which can be used to fund environmental projects such as nature conservation, climate change adaptation and renewable energy development. Knowledge of carbon taxes is important to support international commitments to climate change such as the Paris Agreement which helps countries demonstrate leadership in climate action and meet emission targets. By understanding how carbon taxes are calculated and applied, the public can demand transparency and accountability from the government in ensuring that carbon tax revenues are used effectively and in accordance with the intended purpose. Carbon taxes help reduce dependence on fossil fuels by making cleaner and renewable energy sources more economically competitive. A good understanding of carbon taxes allows companies to better plan for the future and reduce economic uncertainty caused by changes in climate policy. Carbon taxes can be designed to support social justice [
36], by allocating revenues to help groups most affected by climate change or to reduce the economic burden on low-income households. Therefore, knowing and understanding carbon taxes is an important step in creating effective, fair and sustainable policies to address the challenges of climate change and achieve sustainable development [
37].
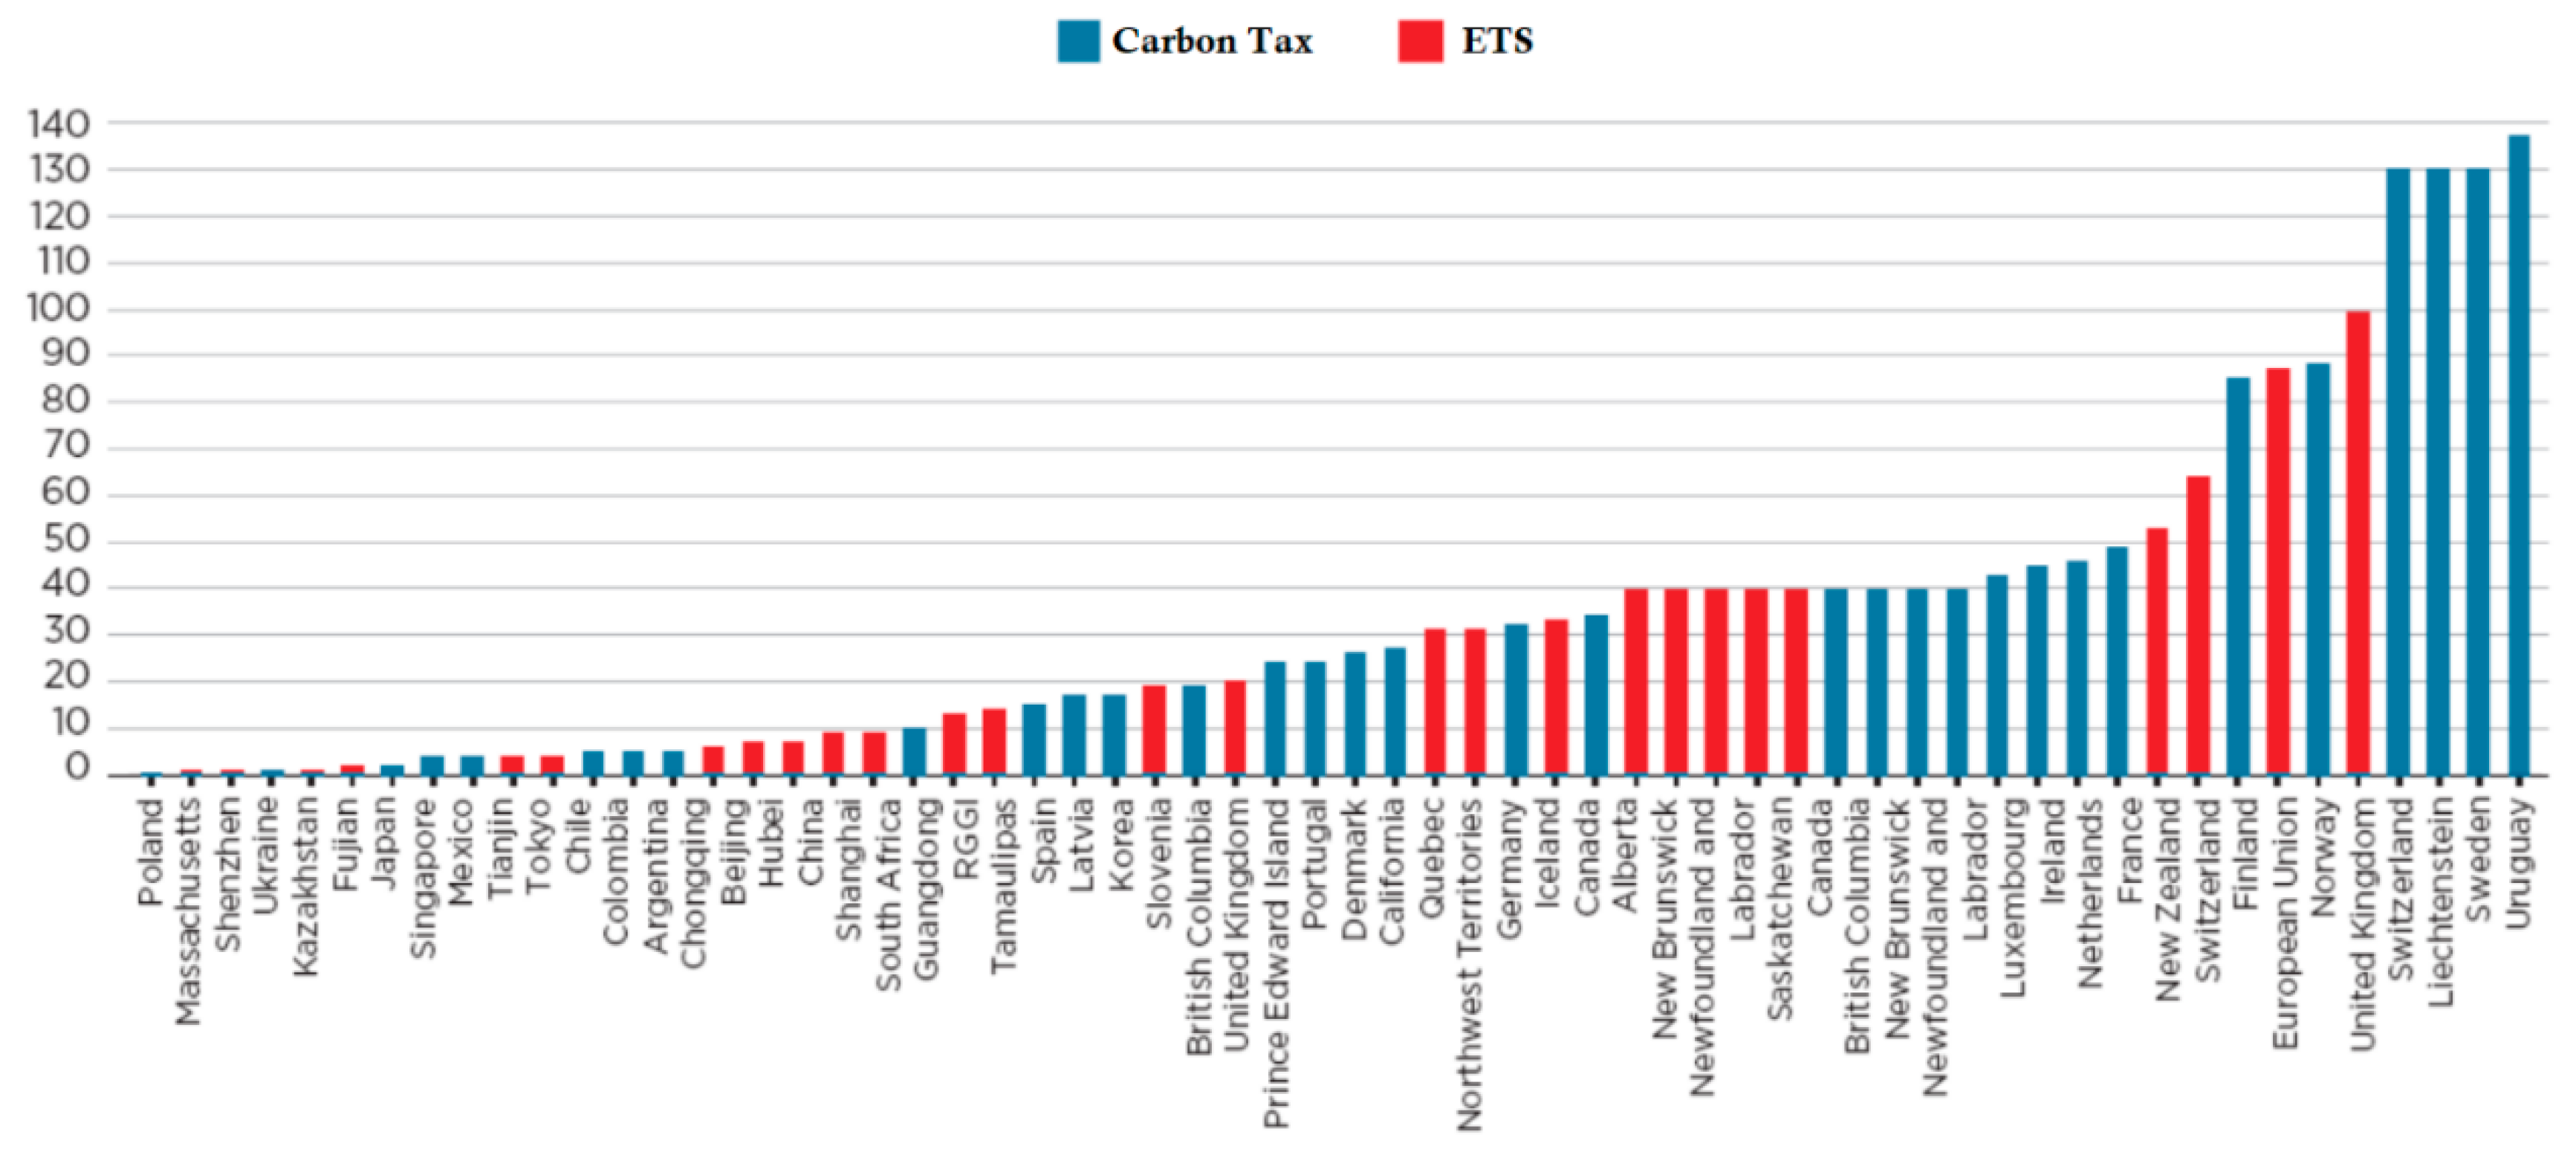
The comparative level of carbon prices based on the State and Trends of Carbon Pricing 2022 report plays an important role in designing effective and globally competitive carbon tax policies. This report provides insight into carbon price trends in various countries and jurisdictions that have implemented carbon pricing mechanisms such as carbon taxes and emission trading systems (ETS). This report presents a global picture of carbon prices applied by various countries where Indonesia's position is compared to other countries that have implemented carbon taxes or ETS. If the carbon price in Indonesia is much lower than other countries, this can reduce the incentive for companies to reduce emissions and can put Indonesia behind in global climate change commitments. Data to understand carbon prices in other countries can help Indonesia adjust carbon tax rates to remain competitive, especially in export-oriented industrial sectors that face cross-border carbon tariffs in trading partner countries. It is necessary to understand the comparative carbon prices in various countries so that the Indonesian government can set balanced rates. Carbon tax rates that are too low do not provide sufficient incentives to reduce emissions, while rates that are too high can burden industry and society. This data helps in determining the optimal price range that is sufficient to reduce emissions but does not harm the economy. Countries with mature carbon pricing mechanisms such as the European Union, Canada and Japan can provide guidance on effective tariffs and complementary policies needed to drive the energy transition without sacrificing economic growth. Understanding the comparative level of carbon prices is important in designing competitive, fair and effective carbon tax policies to help Indonesia assess its global position, determine optimal tariffs, measure potential revenues and maintain economic competitiveness in the face of international pressure to reduce carbon emissions. By following global trends in carbon pricing, Indonesia can play a bigger role in global efforts to address climate change while protecting the domestic economy and society.
Understanding the carbon tax formula is a very important matter that is useful for determining the right tariff, including understanding the formula for calculating carbon taxes to help governments and policymakers determine the right tax rate. Tariffs that are too low are ineffective in reducing emissions, while tariffs that are too high can burden the economy and society. In addition, transparency and accountability are needed that can be applied using clear and transparent formulas to increase accountability. Companies and individuals can understand how taxes are calculated to increase public trust in the policy. Economic impact measurement needs to be done by knowing the formula where policymakers can model the economic impact of a carbon tax that allows for evaluating potential effects on economic growth, jobs, and the cost of living, and adjusting policies if necessary. It is important to plan and predict by determining the carbon tax formula that allows governments and companies to plan ahead which is done by predicting the revenue that will be generated from the carbon tax and allocating the funds to environmental projects or social programs.
Furthermore, efforts to find out the carbon tax formula are directed towards evaluating the effectiveness of the policy where knowing the carbon tax formula allows for a better evaluation of the effectiveness of the policy so that the government can monitor changes in emissions and assess whether the tax has achieved the desired emission reduction goals. The next step requires policy adjustments that can be implemented if the carbon tax formula is based on accurate data and a solid model so that policies can be adjusted quickly to respond to changes in emissions or economic conditions that allow for more dynamic and responsive policies. In addition, knowing the carbon tax formula is related to efforts to provide incentives appropriately by applying the right formula to help provide better incentives for companies and individuals to reduce emissions in the form of tax credits for investment in green technology or tax deductions for environmentally friendly business practices. By understanding the carbon tax formula, various parties can work together more effectively to achieve better environmental and climate goals, while ensuring that the economic and social impacts of the policy are well managed. For this reason, efforts are needed to determine carbon tax rates that involve consideration of various economic, environmental and social factors. There are several bases that can be used to determine carbon tax rates, including the social cost of carbon, emission reduction targets, economic impacts, revenues needed for environmental programs, social justice and balance, carbon market prices and expert studies or recommendations. In determining carbon tax rates, it is necessary to involve consideration of various factors including economic, environmental and social. In determining carbon tax rates, it is necessary to involve consideration of various factors including economic, environmental and social. Some bases used to determine carbon tax rates include the social cost of carbon, emission reduction targets, economic impacts, revenues needed for environmental programs and social justice and balance. Efforts to determine carbon tax rates by involving economic, environmental and social considerations are important to ensure fair and balanced policies for all stakeholders including industry, the general public and vulnerable groups. In addition, it is necessary to meet national and global climate targets such as the Paris Agreement commitments, manage economic impacts to maintain industrial competitiveness and reduce negative impacts on low-income communities, support environmental programs that facilitate the energy transition and encourage green technology innovation, create structural changes needed in a more environmentally friendly and sustainable economy in the future. Comprehensive planning by considering all these factors can encourage the implementation of carbon taxes that are effective, fair and provide long-term benefits for the environment, economy and society.
3.1. Calculating the Social Cost of Carbon
The social cost of carbon (SCC) is a monetary estimate of the economic loss caused by one ton of CO2 emissions into the atmosphere, including climate change impacts such as agricultural damage, human health, and environmental damage. Carbon tax rates are often based on estimates of the social cost of carbon. Calculating the social cost of carbon is a complex process involving multiple disciplines, including economics, climate science, and public policy. Common steps in calculating the SCC include climate modelling, economic impact modelling, future discounting, and uncertainty analysis. Climate modelling aims to project climate change due to additional CO2 emissions, where methods are developed using climate models that link CO2 emissions to changes in global temperature, precipitation, sea level, and other climate phenomena that can be applied using Integrated Assessment Models (IAMs) such as DICE (Dynamic Integrated Climate-Economy), FUND (Climate Framework for Uncertainty, Negotiation and Distribution), and PAGE (Policy Analysis of the Greenhouse Effect). Meanwhile, economic impact modelling aims to estimate the economic impact of projected climate change where the method is carried out by assessing how climate change affects economic sectors such as agriculture, health, energy, and infrastructure which includes analysis of agricultural production losses, health costs due to climate-related diseases, infrastructure damage due to extreme weather and changes in energy consumption. Economic impact modelling as a tool that functions to detect damage that links climate change with economic impacts. Future discounting is one of the efforts in calculating the social cost of carbon aimed at calculating the present value of future economic impacts. The future discount method uses a discount rate to convert future economic losses into present values where the discount rate is a key factor in SCC because it is able to determine how much to value future losses compared to current costs. While uncertainty analysis aims to consider uncertainty in climate projections and economic impacts where the method uses sensitivity analysis and probability distribution to explore various scenarios and assumptions applied through Monte Carlo Simulation and other statistical techniques to handle uncertainty. An example of a calculation to calculate SCC in a climate model by projecting that one additional ton of CO2 will increase the average global temperature by 0.00001°C. The calculation of economic impacts is done by assessing that the increase in temperature will cause a global economic loss of $10. In calculating the discounted future, a discount rate of 3% is used to calculate the present value of this future loss. Calculating the SCC is a complex process and requires various assumptions and models. The final result is highly dependent on the assumptions used in the climate model, the economic impacts, and the discount rate. Therefore, the SCC is often presented in a range of values to reflect the uncertainty and variability in the calculation.
The basic formula for calculating the SCC involves calculating the present value of the future economic losses resulting from CO₂ emissions.
SCC: Social cost of carbon (in dollars or currency units per ton of CO₂).
Dₜ: Annual economic impact of emitting one additional ton of CO₂ in year t.
T: Time period of impact, often considered up to 100 years or more.
r: Discount rate used to calculate future value in today’s terms.
t: Specific year after emission, with t = 0 being the year of emission.
Economic impacts (Dₜ) include losses due to various climate change impacts such as Reduced agricultural yields, Flood losses, increased extreme weather events (hurricanes, heat waves), Increased health costs related to poorer air quality, Sea level rise affecting coastal areas. Impacts are calculated globally because carbon emissions have long-term and widespread effects, regardless of the location of emissions. Discount rate (r) where the discount rate is one of the most controversial factors in calculating SCC, low values (1-3%) emphasize the importance of future impacts, while higher discount rates (above 5%) reduce the value of future economic impacts. The lower the discount rate, the higher the SCC value because future impacts are considered more significant. Impact time horizon (T) includes the impact of CO₂ emissions can last for hundreds of years but most models limit the calculation of SCC to around 100 years or more, and being able to capture the long-term impacts of climate change is essential in calculating SCC accurately. Calculating the social cost of carbon is an important tool in environmental and climate change policy that provides the basis for setting carbon prices or carbon taxes by considering the long-term impacts of greenhouse gas emissions on the global economy and society.
The social cost of carbon can also be assumed as the monetary value of the economic, environmental and social losses due to one ton of carbon dioxide emissions. The social cost of carbon includes the impacts of climate change, human health and environmental degradation.
Total social cost is a component that includes all external costs caused by climate change including natural disasters, reduced agricultural productivity and health impacts. Total Emissions are calculated based on total carbon dioxide emissions in tons.
3.2. Emission Reduction Targets
Determining emission reduction targets needs to be a consideration for the government in setting carbon tax rates set in international agreements such as the Paris Agreement or national policies where tax rates are set to encourage significant emission reductions. Efforts to create emission reduction targets are an important step in efforts to reduce the impact of climate change with steps to create effective emission reduction targets through several steps including identifying emission sources, measuring emissions, determining emission reduction targets, setting time frames, developing strategies and action plans, calculating financial and social impacts, involving stakeholders, monitoring and reporting progress, adjusting and recalibrating targets. Identification of emission sources can be done by making a complete inventory of all greenhouse gas (GHG) emission sources in relevant organizations or regions. Identification of emission sources needs to use data from national emission inventories as well as energy, transportation, industry, and agriculture sectors in the form of emission reporting and assessment tools such as the Greenhouse Gas Protocol (GHG Protocol). In addition, efforts to measure emissions can be done by determining the base year in measuring emissions which is done by collecting GHG emission data from the selected base year which includes historical data and future emission projections that can be implemented using emission data management software. Furthermore, in determining emission reduction targets, it is necessary to set emission reduction targets based on a base year that refers to absolute reduction targets (reducing 100,000 tons of CO2e) or intensity reduction (reducing emissions per unit of product or per unit of GDP). Emission reduction targets need to set a time frame to achieve emission reduction targets that can be done by dividing the time frame into short-term, medium-term, and long-term targets.
Developing strategies and action plans to encourage emission reduction targets requires efforts through identifying and implementing steps to achieve emission reduction targets. Strategies that can be developed include increasing energy efficiency, using renewable energy, clean transportation, and sustainable agricultural practices by optimizing green technology, government policies and incentives, and sustainability initiatives. To calculate the financial and social impacts, a cost and benefit analysis of the proposed steps can be applied, including utilizing economic feasibility studies, social impact analysis, and cost-benefit assessments. Efforts to encourage emission reduction targets more effectively need to involve stakeholders involving the government, community and private sector which are carried out through meetings, workshops, and public consultations. The next step is to monitor and report progress towards emission reduction targets periodically related to emissions and progress of strategy implementation by utilizing emission data management systems, public reporting, and third-party audits. Emission reduction targets are important for adjusting and recalibrating targets by evaluating the effectiveness of the strategy and adjusting targets, if necessary, through periodic reviews and data analysis to assess progress and obstacles. Setting emission reduction targets requires a comprehensive approach, from baseline emission measurements to stakeholder engagement and ongoing monitoring. An effective strategy must be based on accurate data, comprehensive impact analysis and multi-stakeholder engagement to achieve sustainable results.
Factors that can measure the ability of carbon tax rates to achieve emission reduction targets where tax rates must be high enough to encourage behavioural change and investment in low-carbon technologies.
Emission reduction targets are the amount of emission reductions that you want to achieve, for example 30% reduction in CO₂ emissions. Emission elasticity is calculated based on the responsiveness of emissions to changes in carbon tax rates, for example how much emissions will decrease if carbon tax rate increases by 1%.
The formula for calculating emission reduction targets is based on the percentage or absolute amount of greenhouse gas emission reductions that are to be achieved in a given period. These targets are often used in the context of climate change policies to limit global temperature increases. The basic formula for emission reductions:
Baseline emissions are the amount of GHG emissions in the base year or reference year before there is an emission reduction policy and can be emission data in a particular year that is used as a reference point. Actual emissions are the amount of GHG emissions measured after a policy or action is implemented which is usually intended to evaluate target achievement. Target emissions are the amounts of emissions to be achieved at the end of the target period according to the emission reduction plan. Emission reduction targets can be carried out using an emission projection approach. Emission reduction targets are calculated based on future emission projections if there are no reduction actions which are usually called Business as Usual (BAU). The formula is:
BAU emissions are assumed to be emission projections if no emission reduction policies or actions are taken. While target emissions are planned emissions after the implementation of emission reduction actions. Several important factors that need to be considered in setting emission reduction targets include the baseline year by determining the selection of the base year which is very important because it determines the initial level of emissions that will be the reference for reduction. The BAU scenario is carried out by calculating future emission projections if there are no reduction actions as the key to setting realistic targets. The time period needs to be adjusted to short-term and long-term targets that can be used to map out a gradual reduction plan. Reduction actions need to involve the use of renewable energy, energy efficiency, technology replacement or changes in consumption and production patterns. Compliance with the global climate agreement by setting emission reduction targets that are in line with international commitments aimed at limiting global temperature increases to below 2°C or even 1.5°C. Calculating emission reduction targets needs to involve selecting a base year, calculating absolute or relative reductions and using emission projections if no action is taken as an important tool in climate change mitigation strategies and ensuring that targets are in accordance with global or national policies.
3.3. Economic Impact of Carbon Tax Tariff
Efforts to determine the economic impact in order to set carbon tax rates are a process that needs to involve in-depth analysis of how the tax will affect various sectors of the economy and society as a whole. The steps that need to be taken to determine the economic impact of determining carbon tax rates need to consider cost and benefit analysis, sector-specific impact analysis, macroeconomic models and mitigation policy considerations. Cost and benefit analysis requires the identification of direct costs and benefits with the aim of determining the costs that will be borne by industry, companies and consumers. In addition, it is also to assess the benefits obtained from reducing emissions such as improving air quality and health. This can be implemented through the development of an input-output economic model that calculates the impact of additional costs on various economic sectors and needs to use empirical data and case studies to measure the benefits of reducing emissions.
In developing a sector-specific impact analysis, it is important to consider the impact on industry and business, as well as the impact on consumers. This is used to assess how the carbon tax rate will affect the operating costs and competitiveness of the industry, and to determine how the carbon tax affects the prices of goods and services and the cost of living of consumers. Macroeconomic models can be applied using macroeconomic simulations to assess the overall impact of carbon taxes on national economies including GDP growth, employment, and inflation through the development of macroeconomic models such as Computable General Equilibrium (CGE) or Dynamic Stochastic General Equilibrium (DSGE). In addition, macroeconomic models are developed through income distribution analysis to assess the impact of carbon taxes on income distribution and economic inequality by simulating the impact of carbon taxes on various income groups. Mitigation policies are important to consider subsidies and incentives that aim to reduce the negative impacts on vulnerable and low-income sectors. Mitigation policies are also needed for investment in green technology to encourage innovation and adoption of low-carbon technologies in order to increase investment in green technology research and development. With this approach, countries can comprehensively assess the economic impacts of carbon tax implementation and design effective mitigation policies to minimize its negative impacts and maximize its benefits.
Economic impacts are targeted to measure the effects of carbon taxes on economic growth, energy costs, prices of goods and income distribution. Economic impacts can be positive or negative depending on the design of the policy and the use of tax revenues.
Net economic impacts are gains and losses to the economy, such as increased jobs in clean energy sectors or losses in carbon-intensive sectors. Meanwhile, the adjustment costs of economic sectors are calculated in the form of costs incurred by sectors that must adjust due to the carbon tax rate, for example the cost of investing in low-carbon technologies.
The economic impact of a carbon tax rate can be calculated using a formula that takes into account the costs imposed on carbon emissions, changes in economic behaviour, and the redistribution of income from tax revenues. This formula helps estimate the impact of a carbon tax rate on production, consumption, government revenues and the prices of goods and services that depend on carbon emissions. The economic impact of a carbon tax can be calculated based on the additional cost imposed on carbon emissions for each unit of fuel or product that produces emissions.
Economic impact is an additional cost imposed on sectors or companies that produce carbon emissions. While the carbon tax rate is the amount of tax imposed per ton of CO₂ emissions, for example $50/ton CO₂. The amount of CO₂ emissions is the total carbon emissions produced by a sector or company.
The carbon tax rate affects the price of goods and services, especially those related to fossil fuels. The following formula estimates the increase in the price of a product due to a carbon tax.
ΔP is the value of the increase in product price due to carbon tax. Emissions per unit of production are calculated based on the amount of CO₂ produced per unit of product, for example CO₂ produced per megawatt of electricity or per liter of fuel. While production output can be assumed to be the total amount of electricity produced or fuel sold.
Carbon tax generates revenue for the government. The formula for calculating government revenue is based on the amount of carbon tax as follows.
Government revenue is the total revenue obtained from carbon tax. The carbon tax rate is indicated by the amount of the carbon tax rate, for example $50 per ton of CO₂. While the total CO₂ emissions are calculated based on the total carbon emissions from all taxed sectors.
Revenue obtained from carbon tax can be used for redistribution purposes, such as renewable energy subsidies or direct cash assistance for vulnerable communities. To calculate redistribution, the government can use the following formula.
This formula is able to show the amount of subsidy or assistance that can be distributed per individual or sector from the carbon tax revenue obtained. The resulting formula is able to help estimate the economic impact of carbon tax rates in various economic sectors, including product prices, changes in consumption, impacts on GDP, government revenues, and income redistribution. More complex models, such as econometric models or macroeconomic simulations, are usually used to analyze the impact of carbon tax policies in more detail and consider the interactions between various economic sectors.
3.4. Revenue for Environmental Programs
Efforts to determine the revenue needed for environmental programs through the application of carbon tax rates, the basic reference used relates the carbon tax rate to the total greenhouse gas (CO₂) emissions, so that the revenue from the tax can be allocated to fund environmental programs. The carbon tax rate must consider how much revenue is needed to fund environmental programs.
Total environmental program cost is the amount of funds needed to fund climate change mitigation, renewable energy, or adaptation programs. Total taxable emissions are calculated based on the amount of carbon emissions generated from activities subject to carbon tax.
The revenue generated from the carbon tax can be calculated using the following formula.
Carbon tax revenue is the total amount of revenue generated by a government from the implementation of a carbon tax. The carbon tax rate can be calculated based on the amount of tax levied per ton of CO₂ emissions, for example $50 per ton of CO₂. The total emissions taxed can refer to the total amount of carbon emissions produced by the taxed source, for example 100 million tons of CO₂.
To determine whether carbon tax revenue is sufficient to fund environmental programs, it is necessary to know the funding needs of the environmental program.
If carbon tax revenues are used exclusively to fund environmental programs, then the carbon tax revenues must be at least equal to or greater than the costs of the environmental programs.
If there are other sources of revenue that can be used, such as grants, loans or revenue from other taxes, then the carbon tax revenue does not need to cover the entire cost of the program.
To ensure that the carbon tax revenue generated is sufficient to fund environmental programs, a formula can be used to determine the level of carbon tax required.
The cost of an environmental program is the total cost of running an environmental program, for example $500 million. The total emissions taxed are calculated based on the amount of carbon emissions produced and taxed in tonnes of CO₂, for example 10 million tonnes of CO₂.
Several factors that affect carbon tax revenue for environmental programs include the carbon tax rate which indicates that the higher the tax rate per ton of CO₂, the greater the revenue generated. The volume of emissions taxed can be known if the total emissions taxed decreases because companies or individuals reduce emissions and tax revenues will also decrease. Carbon tax revenues can be used for various purposes so that some of the revenues are not all allocated to environmental programs. The government can use carbon tax revenues flexibly to fund broader programs such as climate adaptation, clean energy development or compensation for affected households.
3.5. Social Justice and Balance in Carbon Tax Rates
Evaluating social justice and balance in the application of carbon tax rates is generally related to how carbon taxes affect different groups in society differently, especially the impact on income distribution, welfare and access to energy. The main principle is to avoid the regressive impact of carbon taxes, where low-income households are disproportionately affected than high-income households. There are several approaches to measuring the social justice and balance of carbon tax rates, using formulas that include income redistribution, the percentage of energy expenditure, and the impact on vulnerable groups in society.
The social justice and balance factor ensures that the carbon tax rate does not burden vulnerable or low-income groups in society. Carbon tax rates can be measured through income redistribution and compensation provided to disproportionately affected households.
The compensation given can be calculated based on the amount of financial assistance or energy subsidies given to low-income groups. Meanwhile, the impact of carbon taxes on vulnerable groups is the burden of additional costs that must be borne by vulnerable groups due to rising energy prices.
One way to ensure social equity is to measure the redistribution of income from a carbon tax. This formula estimates the amount of income that can be returned to low-income groups to compensate for the regressive impact of a carbon tax.
Redistribution is the amount of funds per low-income household or individual obtained from carbon tax revenue. Carbon tax revenue is the total income generated from carbon tax. While the number of low-income households is the total number of households in the low-income category, which are the target of compensation. Carbon taxes can be designed in such a way that they reduce the negative impact on low-income households and support social balance through income redistribution or direct compensation.
3.6. Carbon Tax Rate Formula
Determining the optimal carbon tax rate requires a formula that takes into account various factors, including the social cost of carbon, emission reduction targets, economic impacts, revenue for environmental programs, and social equity and balance. This comprehensive formula is able to combine the essential elements of each factor to produce a rate that meets various policy objectives. The basic formula for determining the carbon tax rate can be calculated as follows.
This formula provides a comprehensive approach to determining the carbon tax rate that takes into account five important factors including the social cost of carbon, emission reduction targets, economic impacts, revenue for environmental programs, and social equity. Each factor must be measured carefully to achieve a fair and effective balance in reducing carbon emissions and mitigating the impacts of climate change.
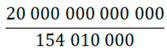
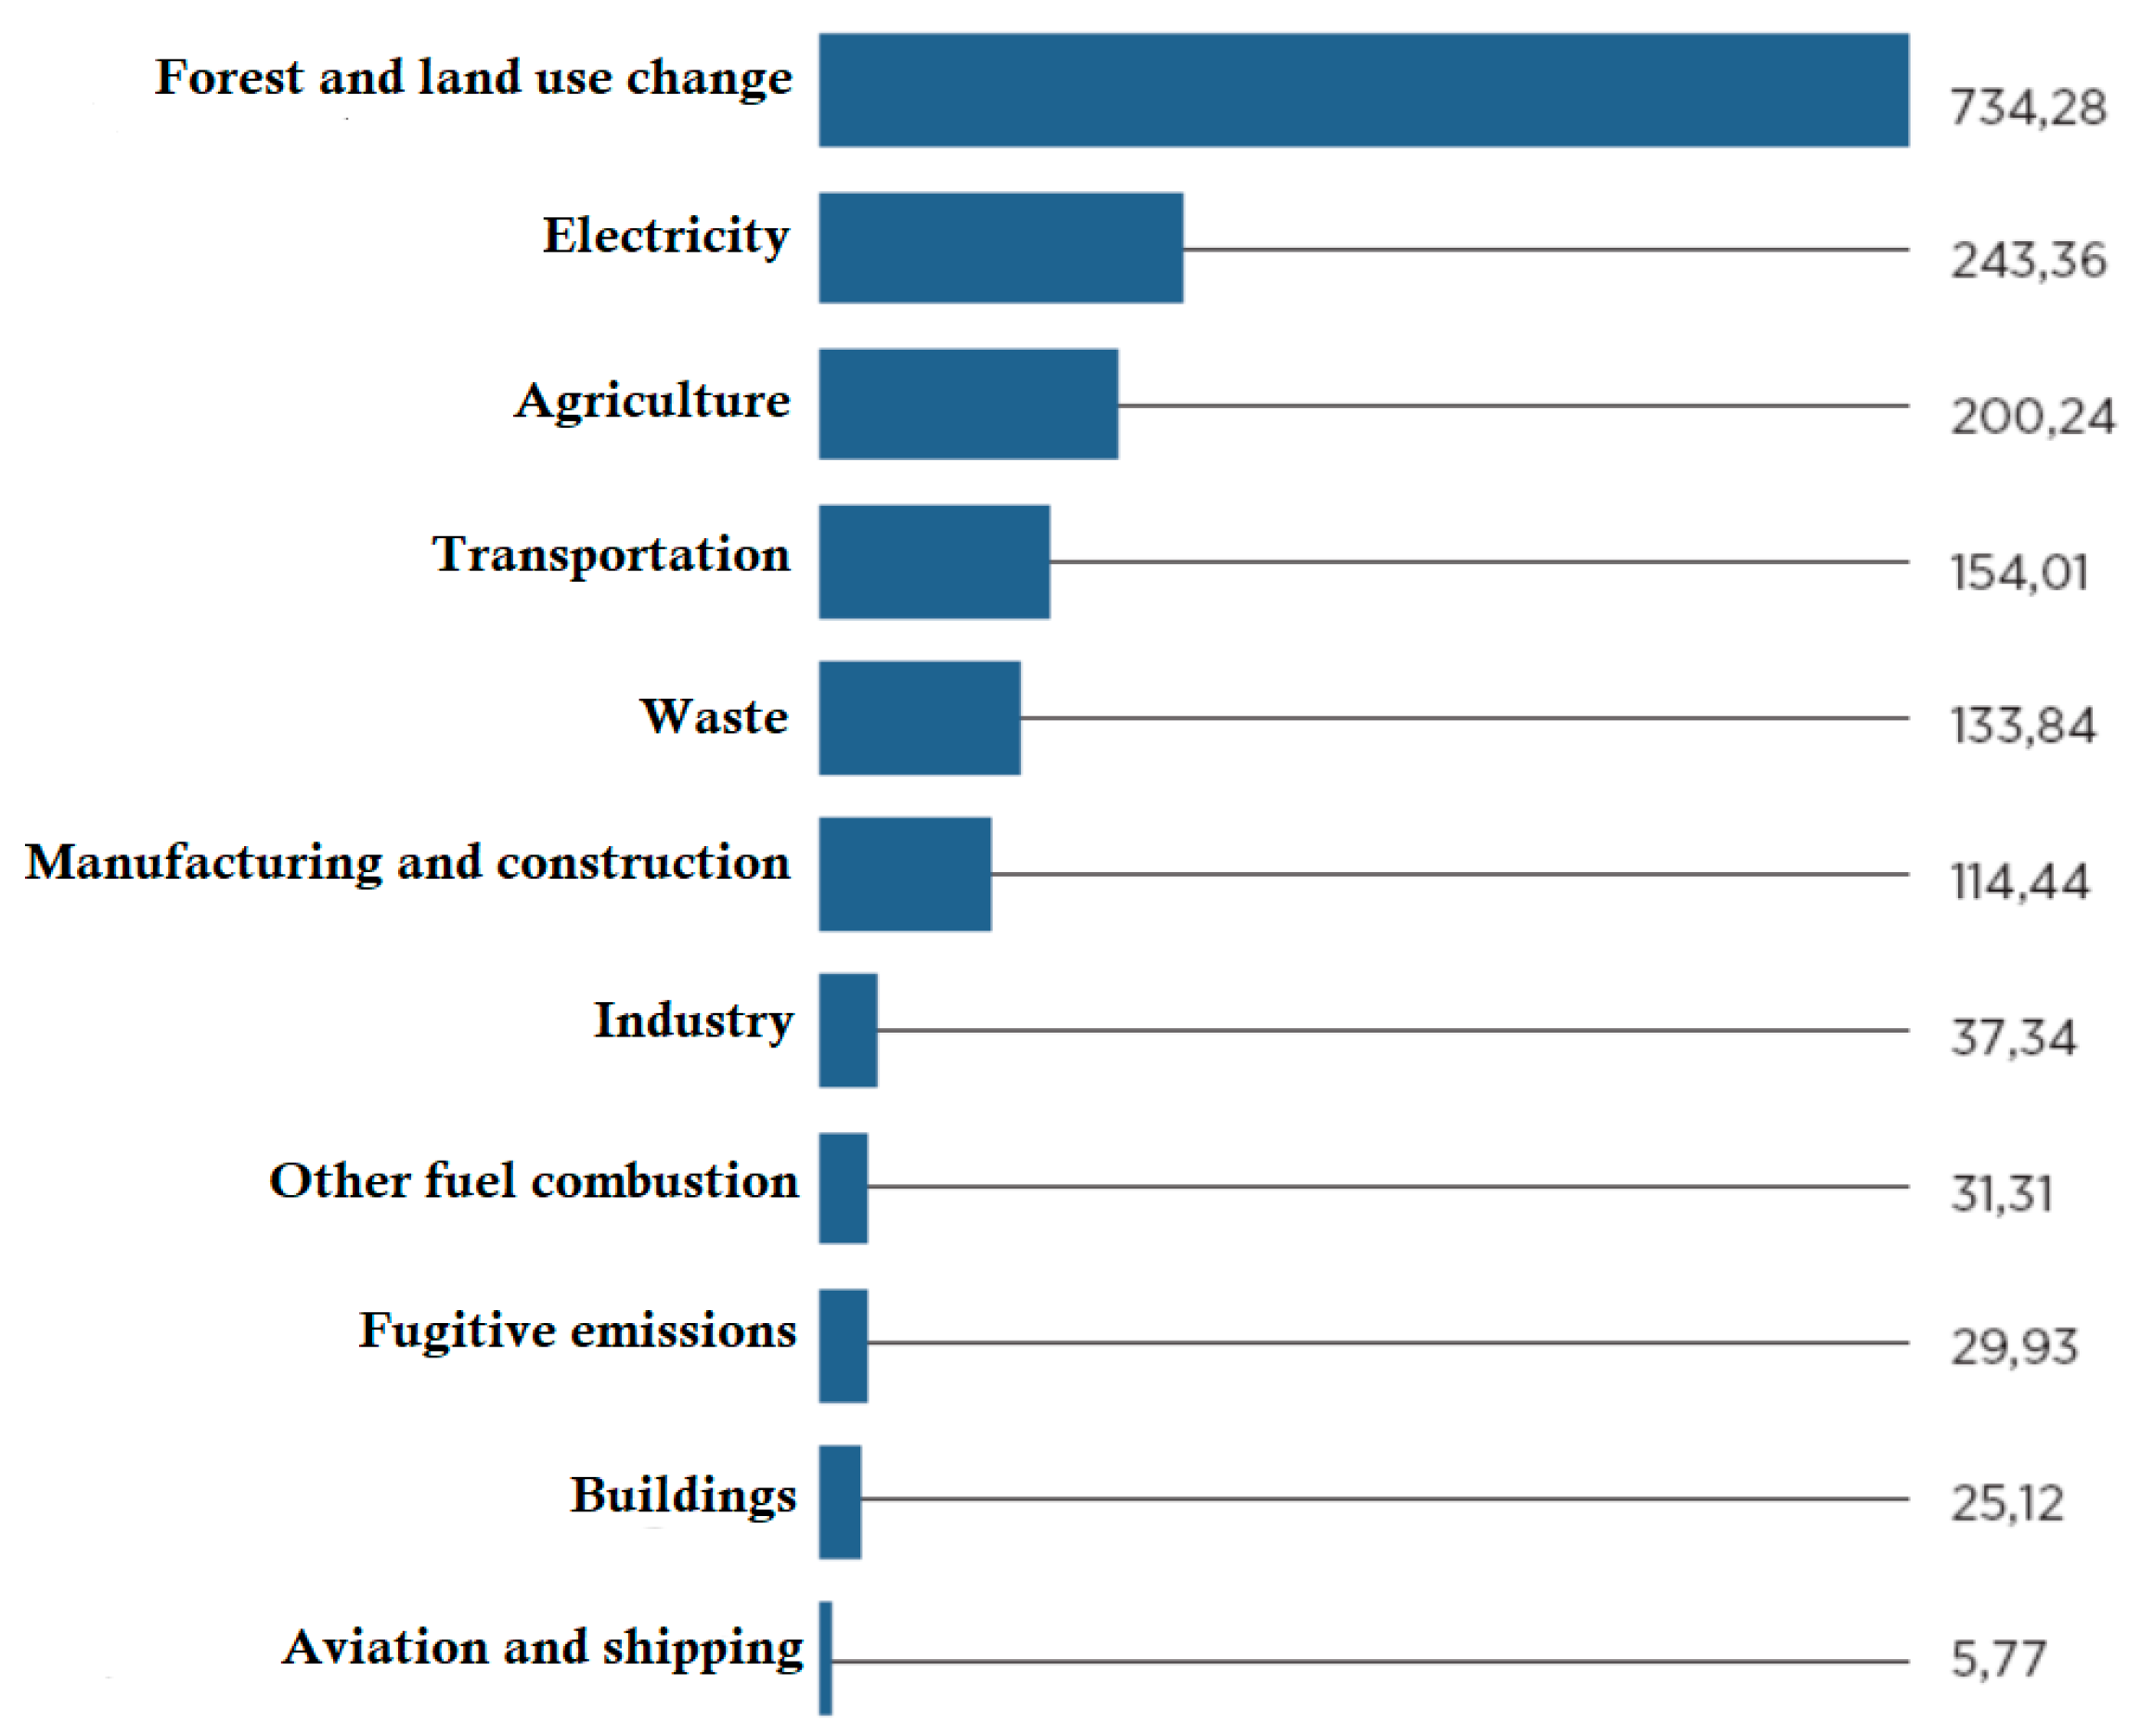
The data presented in
Figure 8 helps identify the main sectors contributing to greenhouse gas emissions in Indonesia, including forest and land use change (the largest), electricity, agriculture and transportation. With transportation ranked 4th, this data highlights the importance of this sector as one of the focuses of emission reduction, considering that the transportation sector produces 154.01 million tons of CO₂. The Transportation sector is a policy priority because of its significant role in contributing to emissions and has great potential for intervention through the transition to renewable energy, the implementation of low-carbon transportation technology (electric vehicles), and the development of public transportation infrastructure. This data strengthens the argument that the transportation sector requires the implementation of a carbon tax as an economic instrument to reduce fossil-based energy consumption, encourage the adoption of clean energy-based vehicles, and finance environmental programs, such as green public transportation. With measurable emission data, policy-making can be directed to reduce emissions strategically based on the sector's contribution. For the transportation sector, the figure of 154.01 million tons provides a basis for calculating carbon tax rates that can have an effect on behavioural and technological changes. The transportation sector, which contributes significantly to emissions, is a priority in allocating carbon tax revenues to encourage subsidies for electric vehicles and green fuels, improvements to low-carbon public transportation infrastructure, and investment in green technology research for transportation. The transportation sector interacts with other sectors such as electricity and industry, so reducing emissions in transportation also has an impact on other sectors. The use of renewable energy in transportation can help reduce emissions from the electricity sector. These data show the importance of the transportation sector in efforts to reduce emissions in Indonesia. These data provide a strong basis for integrating the transportation sector into climate change mitigation policies, including the implementation of carbon taxes, the development of sustainable transportation, and the allocation of resources for low-carbon technology innovation.
Table 5.
Basic assumptions for calculating carbon tax in Indonesia’s transportation sector.
Table 5.
Basic assumptions for calculating carbon tax in Indonesia’s transportation sector.
| Carbon tax calculation |
Results of calculation assumptions |
| Total Transportation Energy Consumption |
154.01 million tons of CO₂ per year |
| Social Cost of Carbon (SCC) |
IDR 300,000 per ton of CO₂ |
| Emission Reduction Target |
20% |
| Revenue Allocation |
IDR 20 trillion per year |
| Economic Impact |
Taxes should not increase transportation costs by more than 10% |
| Social Equity |
Subsidies are needed for 30% of public transportation users (e.g. IDR 5 trillion per year) |
SCC is a monetary estimate of the economic, social, and environmental losses from releasing one ton of carbon dioxide emissions into the atmosphere. This value includes long-term impacts on health, agricultural output, infrastructure, and global climate change. The U.S. Environmental Protection Agency (EPA) report or The Stern Review study estimates the global SCC in the range of
$50–
$150 per ton of CO₂, depending on the discount rate and risk assumptions. If the average SCC assumption is
$20–
$80 per ton of CO₂, with an exchange rate of IDR 15,000/USD, the SCC value for Indonesia is:
Considering Indonesia's status as a developing country with moderate emissions, the SCC can be assumed to be in the low range, at IDR 300,000/ton CO₂.
Indonesia is facing direct impacts of climate change such as rising sea levels, flooding and declining agricultural yields. Studies on the impacts of climate change in Indonesia show that the annual cost of climate change could reach 2–4% of GDP. With a GDP of around Rp 20,000 trillion, the annual loss reaches Rp 400–800 trillion. If annual transportation emissions reach 1,500 million tons of CO₂, then the cost per ton of CO₂ is equivalent to the estimated annual loss calculated at 600 trillion and compared to annual emissions in tons of CO₂, so that the SCC value (local) based on the results of the annual loss calculation is obtained at IDR 400,000/ton CO₂. In this study, the determination of SCC takes into account the amount of annual loss of Rp 300,000/ton CO₂ is a conservative estimate. The SCC rate must be adjusted to the purchasing power of the community, where IDR 300,000/ton CO₂ is a relatively moderate value and avoids severe economic impacts on the community. A lower SCC, IDR 300,000/ton CO₂ is designed to encourage initial investment in low-carbon technologies without triggering high resistance from industry players. The assumption of the SCC value based on the calculation of annual losses of IDR 300,000 per ton CO₂ refers to international standards adjusted for Indonesia, local impacts of climate change on the economy and society, social and economic considerations to ensure the sustainability of carbon policies, and regulations that are in harmony with sustainable development targets (SDGs) and national emission reductions (NDCs).
Table 6.
Calculating carbon tax tariff.
If the total revenue required for environmental programs is IDR 20 trillion per year, and the estimated emission reduction target that can be taxed is IDR 129,870 per ton of CO₂, then the calculation of this rate is based on the total carbon emissions that are taxed. The carbon tax rate of IDR 129,870 per ton of CO₂ is designed to collect revenue of IDR 20 trillion per year assuming all emissions from the taxed sector are approximately 154.01 million tons of CO₂. This rate can be integrated with other components in the carbon tax formula to ensure the financial sustainability of environmental programs, such as renewable energy investment, green technology subsidies or environmental conservation. The revenue generated from this rate is allocated for renewable energy development, environmentally friendly technology subsidies, environmental conservation, social and community. Renewable energy development can be carried out in the form of green energy infrastructure development such as solar panels or wind. Environmentally friendly technology subsidies can be provided through incentives for electric vehicles or low-carbon public transportation. Environmental conservation is implemented by protecting forests and ecosystems that can absorb carbon. Social and community is encouraged through the provision of assistance to households or economic sectors affected by carbon policies. The tariff of IDR 129,870 per ton of CO₂ ensures that the funding needs for environmental programs of IDR 20 trillion per year can be met. This value is calculated based on total taxable emissions that reflect a commitment to sustainability while considering the financial needs of the state and the social community.
Social equity subsidies in carbon tax rates are the allocation of funds to help vulnerable groups (low-income communities, workers in affected sectors, or rural communities) so that the carbon tax policy does not impose too great an economic burden. The figure of IDR 32,468 per ton of CO₂ is calculated based on the total allocated subsidy and the total carbon emissions taxed. The total annual social equity subsidy budget is assumed based on policy needs, for example IDR 5 trillion per year. The total carbon emissions taxed (tons of CO₂) of 154.01 million tons of CO₂ refers to the total energy consumption that produces carbon emissions in the transportation sector. Revenue from carbon taxes allocated for social equity subsidies is used for Direct Assistance, Job Training Programs, Increasing Access to Public Transportation and Reducing Basic Living Costs. Direct assistance is used as a form of energy subsidy for low-income households to reduce the impact of rising fuel prices. Job training programs play a role for workers in affected sectors, such as the fossil fuel industry, so that they can switch to jobs in the green sector. Increasing access to public transportation is intended to provide low-carbon public transportation subsidies for the community. Reducing basic living costs is used as assistance to offset the impact of carbon policies on the prices of goods and services. Social equity subsidies ensure that carbon tax policies not only fund environmental programs but also maintain the welfare of affected communities and create inclusive policies. The allocation of IDR 32,468 per ton of CO₂ is a moderate figure and can help vulnerable groups without burdening the entire carbon tax revenue system. The subsidy of IDR 32,468 per ton of CO₂ is determined based on the annual social subsidy requirement of IDR 5 trillion and the total carbon emissions subject to tax. This calculation ensures that carbon tax policies are not only effective in reducing emissions but also socially just.