Preprint
Article

This version is not peer-reviewed.

Thermo-Mechanical Identification of Orthotropic Engineering Constants of Composites Using an Extended Non-Destructive Impulse Excitation Technique

A peer-reviewed article of this preprint also exists.

Submitted:

21 February 2025

Posted:

21 February 2025

You are already at the latest version

Abstract

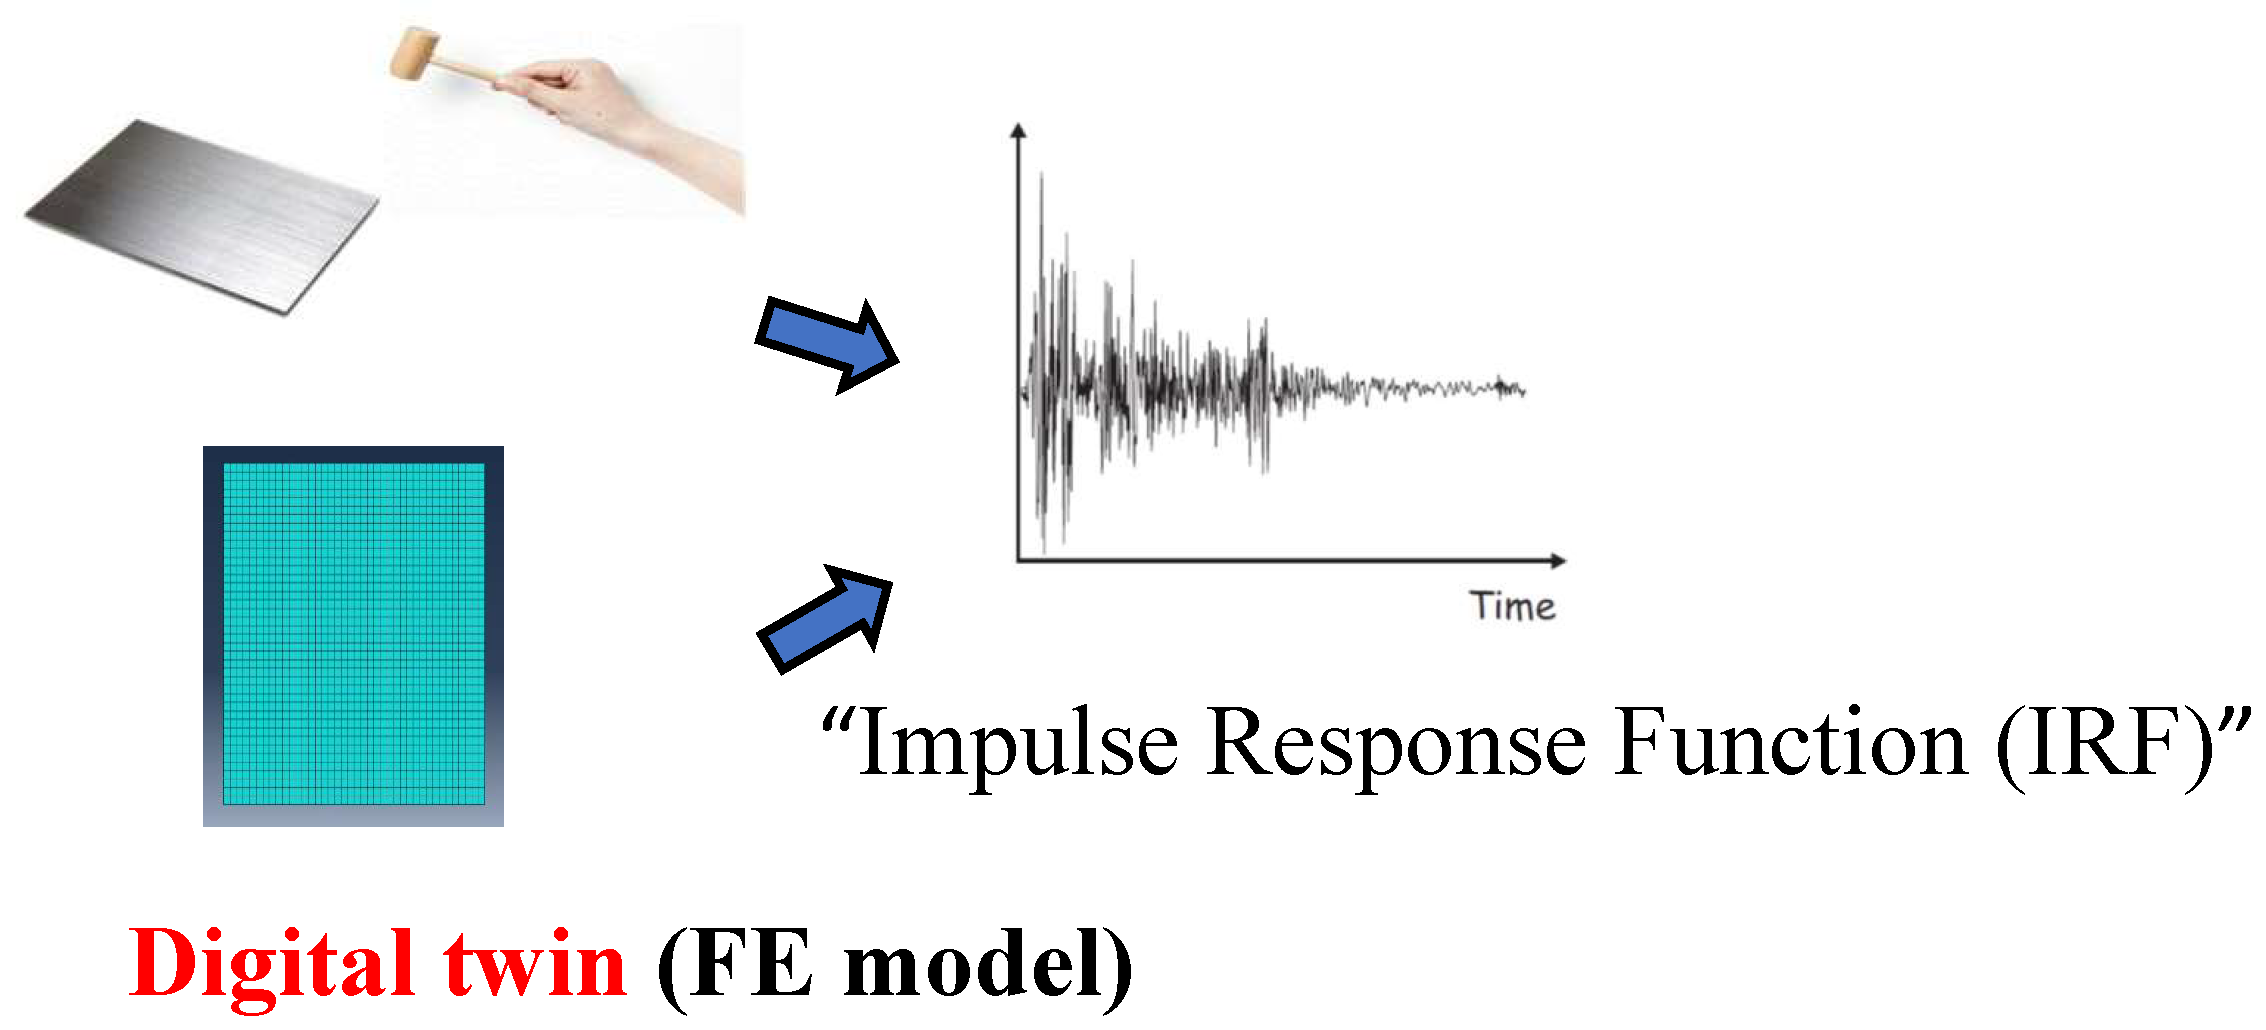
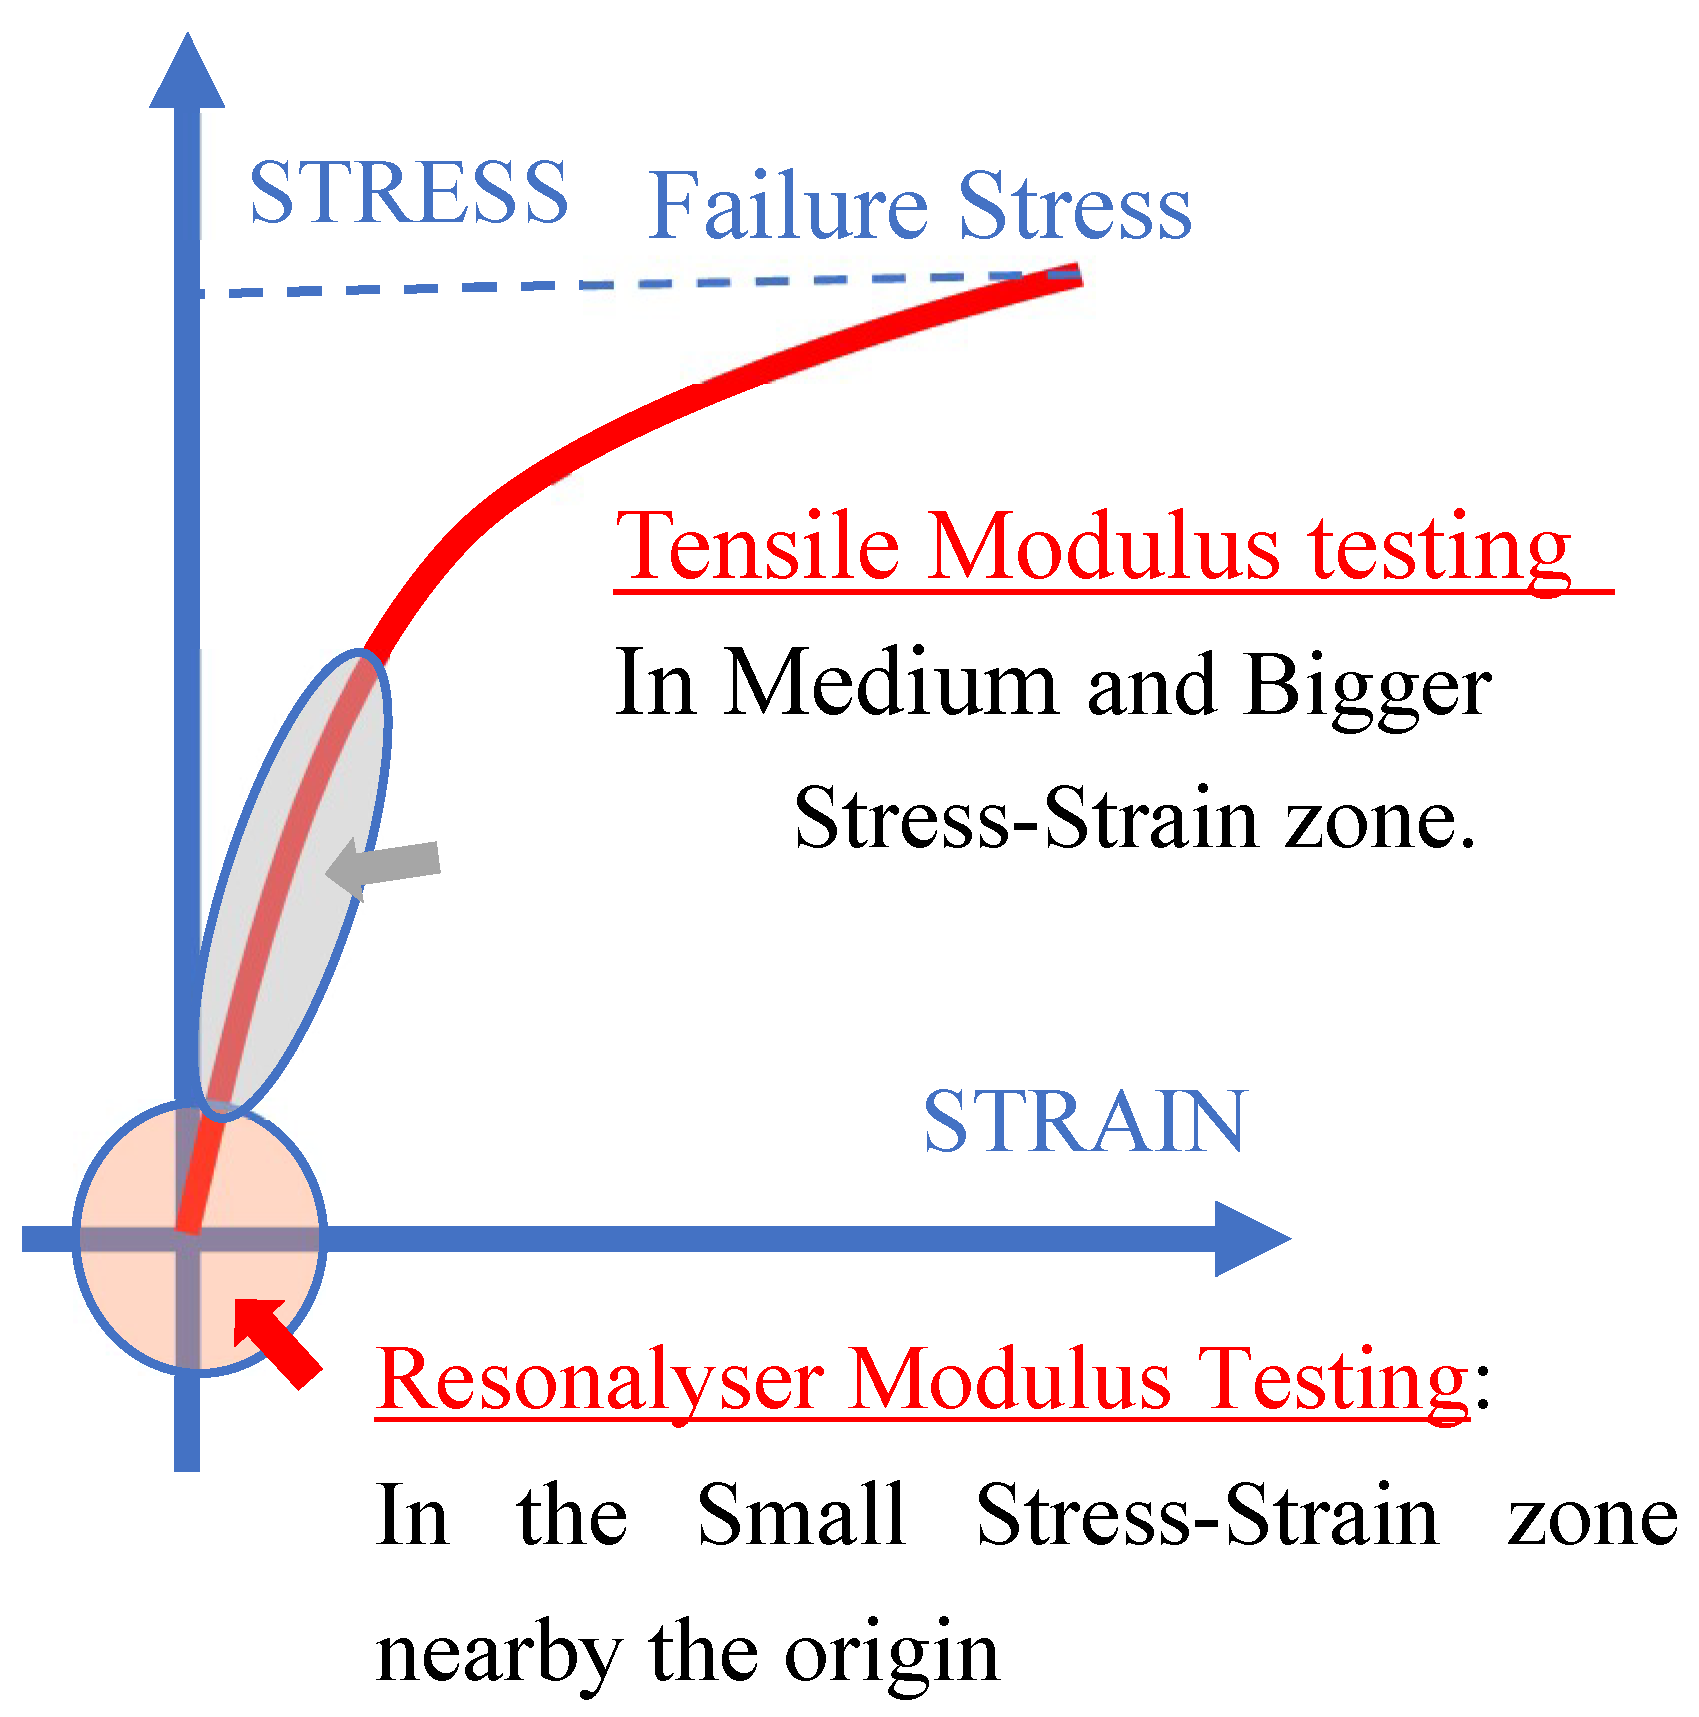
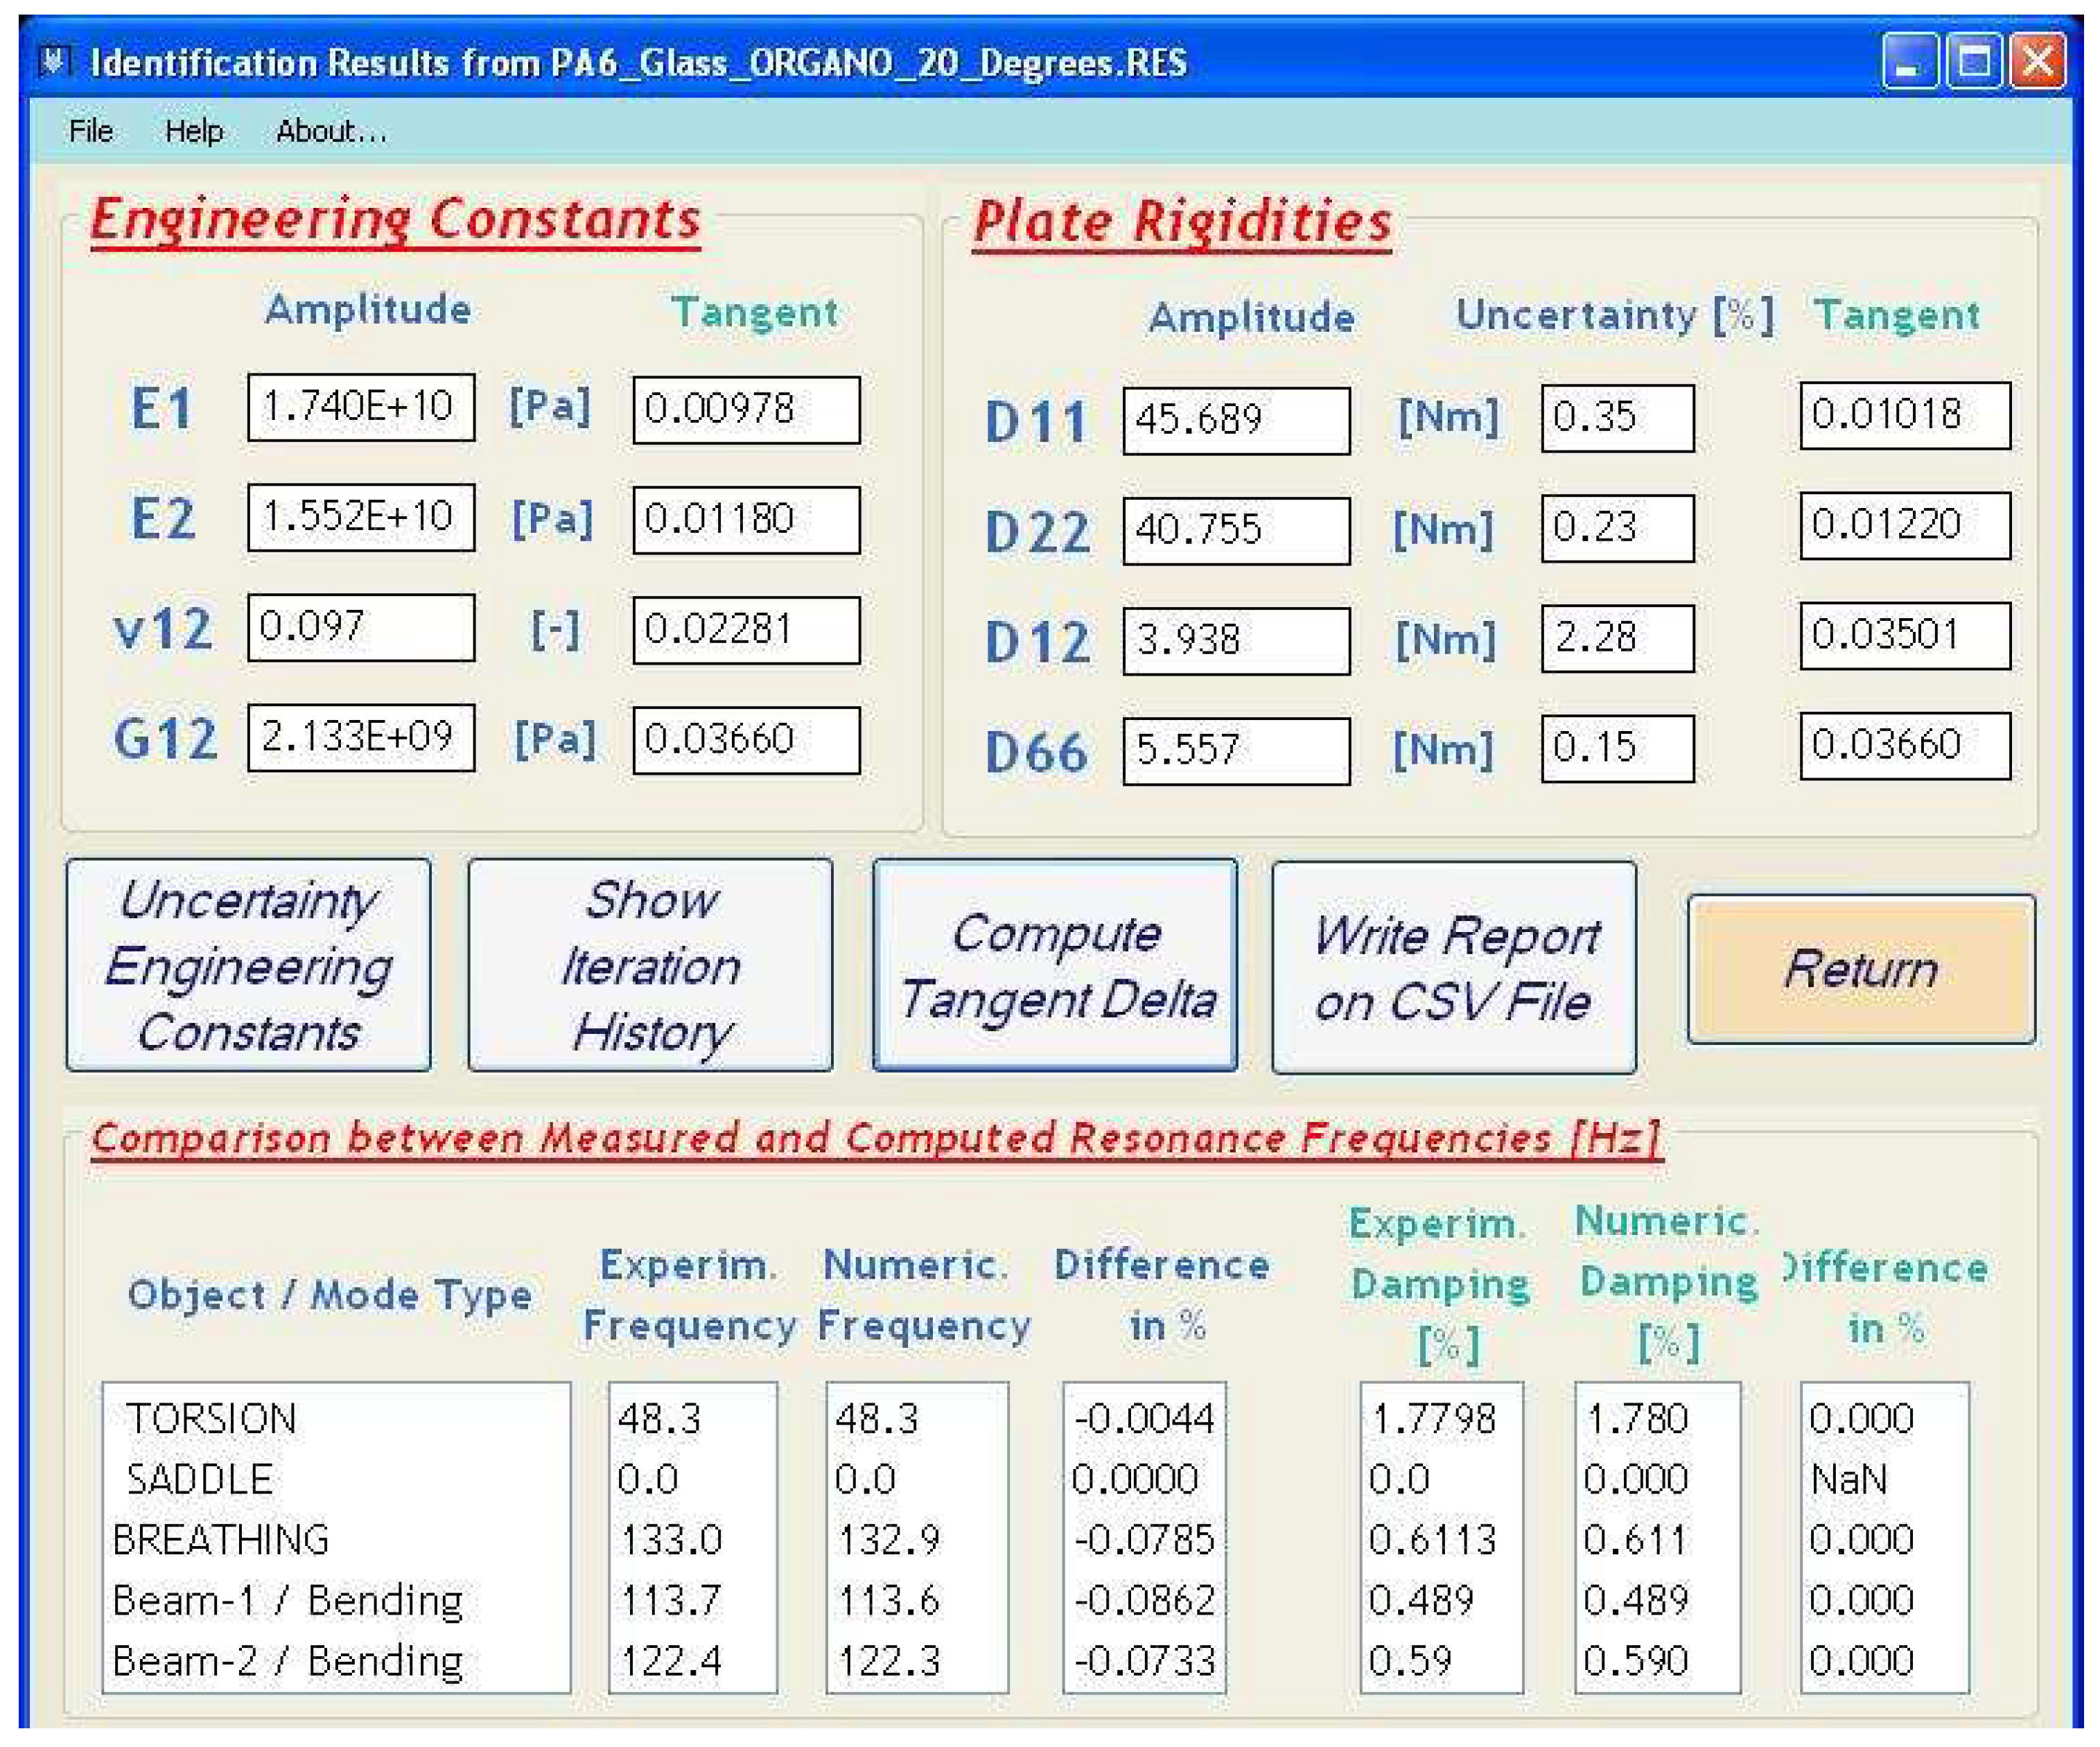
Composite materials are increasingly used in various vehicles and construction parts, necessitating a comprehensive understanding of their behavior under varying thermal conditions. Measuring the thermo-mechanical properties with traditional methods such as tensile testing or Dynamical Mechanical Analysis is often time-consuming and requires a costly apparatus. This paper introduces an innovative non-destructive method for identifying the orthotropic engineering constants of composite test sheets as a function of temperature. The proposed technique represents an advancement of the conventional Impulse Excitation Technique, incorporating an automated pendulum exciting mechanism and creating digital twins of the test sheets. The automated measurement of the impulse response function yields resonance frequencies and damping ratios at specified temperatures. These values are subsequently utilized in digital twins for identification of the engineering constants. The method works fully automated across predefined temperature intervals and can be seamlessly integrated into existing climate chambers equipped with remote control facilities.

Keywords: 
;  ;  ;  

1. Introduction

Composite materials have revolutionized the way vehicles, construction parts and consumer goods are designed. They are replacing more and more traditional materials like steel, wood and aluminum. Composite materials are utilized successfully in dynamically loaded structures like satellites, military aircraft, expensive cars, boats, sports and many consumer goods. The success of composites is attributed to their mechanical properties including a high stiffness-to-weight ratio, high strength-to-weight ratio, and good fatigue resistance. Additionally, they offer design flexibility, allowing for tailoring of mechanical properties and the creation of new shapes. However, composites also exhibit complex mechanical behavior, posing challenges for design and testing, like discussed by Jones [1].
The elastic material properties of composite components are crucial in determining how these parts deform under static and dynamic loads. Their vibration and acoustic behavior are influenced by the elastic and damping properties. Temperature variations modify the elastic and damping properties of these composite parts. This is especially relevant for modern recyclable thermoplastic composites, see e.g. Ozturk et al. [2]. Change of resonance frequencies, mode shapes, and the transient response of the structure can affect the functional behavior of vehicles, construction parts and consumer goods. Therefore, understanding the temperature-dependent elastic and damping properties is essential for reliable composite structure design.
Orthotropic materials have elastic properties symmetric with respect to a Cartesian coordinate system. Most composites exhibit orthotropic behavior due to stiffer fiber reinforcement compared to the matrix material, which is particularly evident in unidirectionally reinforced layers. Four engineering constants are required to describe the orthotropic in-plane stiffness behavior of thin sheets. In a plane with two perpendicular orthotropic material directions 1 and 2 (see e.g. Figure 1), the relation between stresses and strains is given by the stiffness matrix C
σ i * = C i j * ε j * i , j = 1,2 , 3
σ 1 * σ 2 * τ 12 * = E 1 * 1 υ 12 * υ 21 * υ 21 * E 1 * 1 υ 12 * υ 21 * 0 υ 12 * E 2 * 1 υ 12 * υ 21 * E 2 * 1 υ 12 * υ 21 * 0 0 0 G 12 * ε 1 * ε 2 * γ 12 *
The quantities in (1) are all complex numbers with real and imaginary parts. C* is the complex in-plane stiffness matrix, ε 1 * , ε 2 * are normal strains and σ 1 * , σ 2 * are normal stresses, respectively in the 1- and 2-direction. γ 12 * , τ 12 * are the in-plane shear strains and stresses. E 1 * , E 2 * are the complex dynamic Young’s moduli, υ 12 * , υ 21 * are the major and minor Poisson’s ratios and G 12 * is the complex in-plane shear modulus. For a given circular frequency ω and assumed linear behavior, the values E 1 * E 1 * υ 12 * υ 21 * G 12 * are constant and called the complex dynamic Engineering constants. Because of the symmetry of the relations υ 12 * E 2 * = υ 21 * E 1 * there are only 4 independent complex Engineering constants in C* shown in equations (2)
E 1 * = E 1 ' + i . E 1 " = E 1 ' 1 + i . tan δ E 1 E 2 * = E 2 ' + i . E 2 " = E 2 ' 1 + i . tan δ E 2 v 12 * = v 12 ' + i . v 12 " = v 12 ' ( 1 + i . tan δ ( υ 12 ) ) G 12 * = G 12 ' + i . G 12 " = G 12 ' ( 1 + i . tan δ ( G 12 ) )
The real parts in the equation (2) represent the elastic behavior while the imaginary “tangents delta” parts govern the damping contribution of the complex Engineering constants.
Engineering constants of composites are intrinsic material properties, critical for engineering design and materials development. They can be computed using micromechanical models or measured through experiments. Examples of micromechanical models can be found e.g. in Raju et al. [3]. However, the accuracy of micromechanical formulations depends on the prior knowledge of the properties and percentage of the constituent materials as well as the application of suitable numerical models. If possible, it is safer to measure the engineering constants with experiments on test samples. Various test methods exist for measuring engineering constants, divided into static and dynamic methods. Tensile testing, bending, shear and torsion tests are well-known static methods. The engineering constants are determined based on measured forces, longitudinal and transverse deformations, see e.g. ASTM D3039 [4], ASTM D70788 [5]. Traditionally, modulus based on tensile testing has been determined 'by eye' from a straight line drawn on the linear part of the stress-strain curve, but more recently automatic testing machines using computer control and data acquisition apply some form of curve fitting to get a best fit to the data, see e.g. ASTM D3039 [4]. Flexural testing in three or four-point bending is an alternative to tensile testing. Much smaller forces are applied, and larger displacements are achieved. Calculations are usually based on thin-beam flexure equations, such as those developed by Timoshenko [6].
Experimental results always come with a level of uncertainty. Factors that affect the uncertainty by static testing are discussed in e.g. Kostic [7]. The most influential source of uncertainty in the determination of the engineering constants of composite materials via static testing is the test system (dimensional measurement device, gauge determination system, extensometer type, alignment system, test machine stiffness, force measurement accuracy, extensometer accuracy), see e.g. Lord and Morrell [8]. Due to inevitable imperfections in the sensors, the force and displacements measurements at low stresses and strains values have high relative uncertainty bounds (theoretically nearly infinite for nearly zero values). Therefore, the found engineering constants near the origin of the stress-strain curve have high uncertainty values. The procedures for obtaining temperature dependent elastic properties by using tensile and flexural tests are complex and time consuming. A similar set of requirements as those for the room temperature modulus test is necessary, with the added complication of strain and displacements measurements at elevated temperatures.
Dynamic testing methods are indirect methods. The impulse excitation technique (IET), see e.g. ASTM C 1259–98 [9], experimental modal analysis (EMA) and operational modal analysis (OMA), see e.g. He and Fu [10], and dynamic measurement analysis (DMA), see e.g. Schalnak [11], are the most used dynamic methods. Dynamic testing methods are more difficult to understand intuitively but are easier to execute and provide more accurate engineering constants at low stress and strain amplitudes, see e.g. Lord and Morell [8]. DMA uses forced excitation to measure the elastic and damping properties of composite lamina within a limited frequency range. DMA allows the identification of temperature and frequency dependent elastic and damping properties. DMA is conducted using small beam samples. Peel stresses at the free boundaries, induced by machining the composite beam specimens, can have therefore considerable influence on the test results.
EMA, OMA and IET address this issue with larger test samples. IET is easy to perform and requires less complex equipment than EMA or OMA. Simply tapping the test sample causes a vibration response with low amplitude. This vibration response can be measured with a sensor and is called “The impulse response function” (IRF). The IRF is composed of the decaying excited modes of vibration of the test sample (see for visualization also Figure 5). Resonance frequencies and damping ratios can be extracted from the measured IRF, see e.g. Heritage [12]. Since IET is non-destructive, the method is suitable for testing at different temperatures, see e.g. Brebels [12]. IET was selected for the current study because of these advantages.
Standard IET uses analytical and empirical formulas to derive the elastic properties from measured vibration quantities. Unfortunately, there are no formulas available for freely suspended orthotropic plates. In 1986, Sol [14] demonstrated the possibility of replacing standard IET formulas with special purpose Finite Element (FE) models. He used a mixed numerical Experimental technique (MNET) for the identification of the engineering constants. The engineering constants in the numerical model were iteratively tuned in such a way that computed resonance frequencies match the measured frequencies. The resulting identification method, called the ‘Resonalyser’ procedure [9], can simultaneously identify the four engineering constants of an orthotropic material from measured resonance frequencies of a test plate by IET. Validation of the results obtained by the Resonalyser procedure was presented in several publications [15,16,17,18,19]. De Visscher [20] presented an extension of the Resonalyser procedure including the identification of the damping part of complex orthotropic engineering constants.
During the previous decades till today, various authors presented related MNET approaches for the identification of orthotropic elastic constants [21,22,23,24,25,26,27,28,29,30,31,32,33,34,35,36,37,38,39,40]. Most authors agreed that testing freely suspended samples provides better agreement with the numerical model than other types of boundary conditions. Clamping or simply supporting samples influences especially the damping behavior. Some studies worked with a large series of resonance frequencies on freely suspended test plates without special requirement for the aspect ratio of the test plates. However, these large series of frequencies on test plates with an arbitrary aspect ratio poses several problems. First, EMA or OMA are necessary to couple the measured frequencies with the correct sequence of computed resonance frequencies. Secondly, higher vibration modes are influenced more by transverse shear deformation, making thin plate theory increasingly inaccurate. Adapting a thick plate theory on the other hand requires knowledge of the transverse shear modulus, which is difficult to identify. The potential to run more complex numerical models on faster computers opened the way to develop more elaborate material identification methods. Among others, Ayorinde [23], Frederiksen [25] used thick plate models in which the transverse shear modulus was estimated using an empirical formula. Cunha [29] and Lauwagie [41] presented mixed numerical experimental techniques for identification of layered materials and laminates.
An early attempt to include temperature dependency of the engineering constants of thin orthotropic plates was published by M. Bottiglieri in 2010 [42]. He used IET with manual excitation of the test samples in a temperature-controlled cavity. The Resonalyser procedure was used for the identification of the elastic engineering constants. In a more recent paper, Chandra et al [43] investigated the dynamic behavior of several carbon-fiber epoxy laminated composite plates at different temperatures, using OMA. The modal contributions are selected as a function of the targeted frequency. The temperature-dependent elastic and damping parameters are estimated by a genetic algorithm-based parameter identification scheme for different sets of modal contribution.
This paper describes an extended IET procedure with automated excitation for continuous identification of engineering constants across different temperatures, aiming to make the process straightforward and cost-effective. The Resonalyser procedure was used for the identification of the complex engineering constants at each temperature step. The next paragraphs describe first the theory and background of the Resonalyser procedure. Next, the automated excitation procedure and execution in a climate chamber is highlighted. At the end of this paper an example of identification of a bidirectionally glass fiber reinforced thermoplastic PA6/Organo composite sample between -20°C and 60°C is given.

2. Experimental Methods

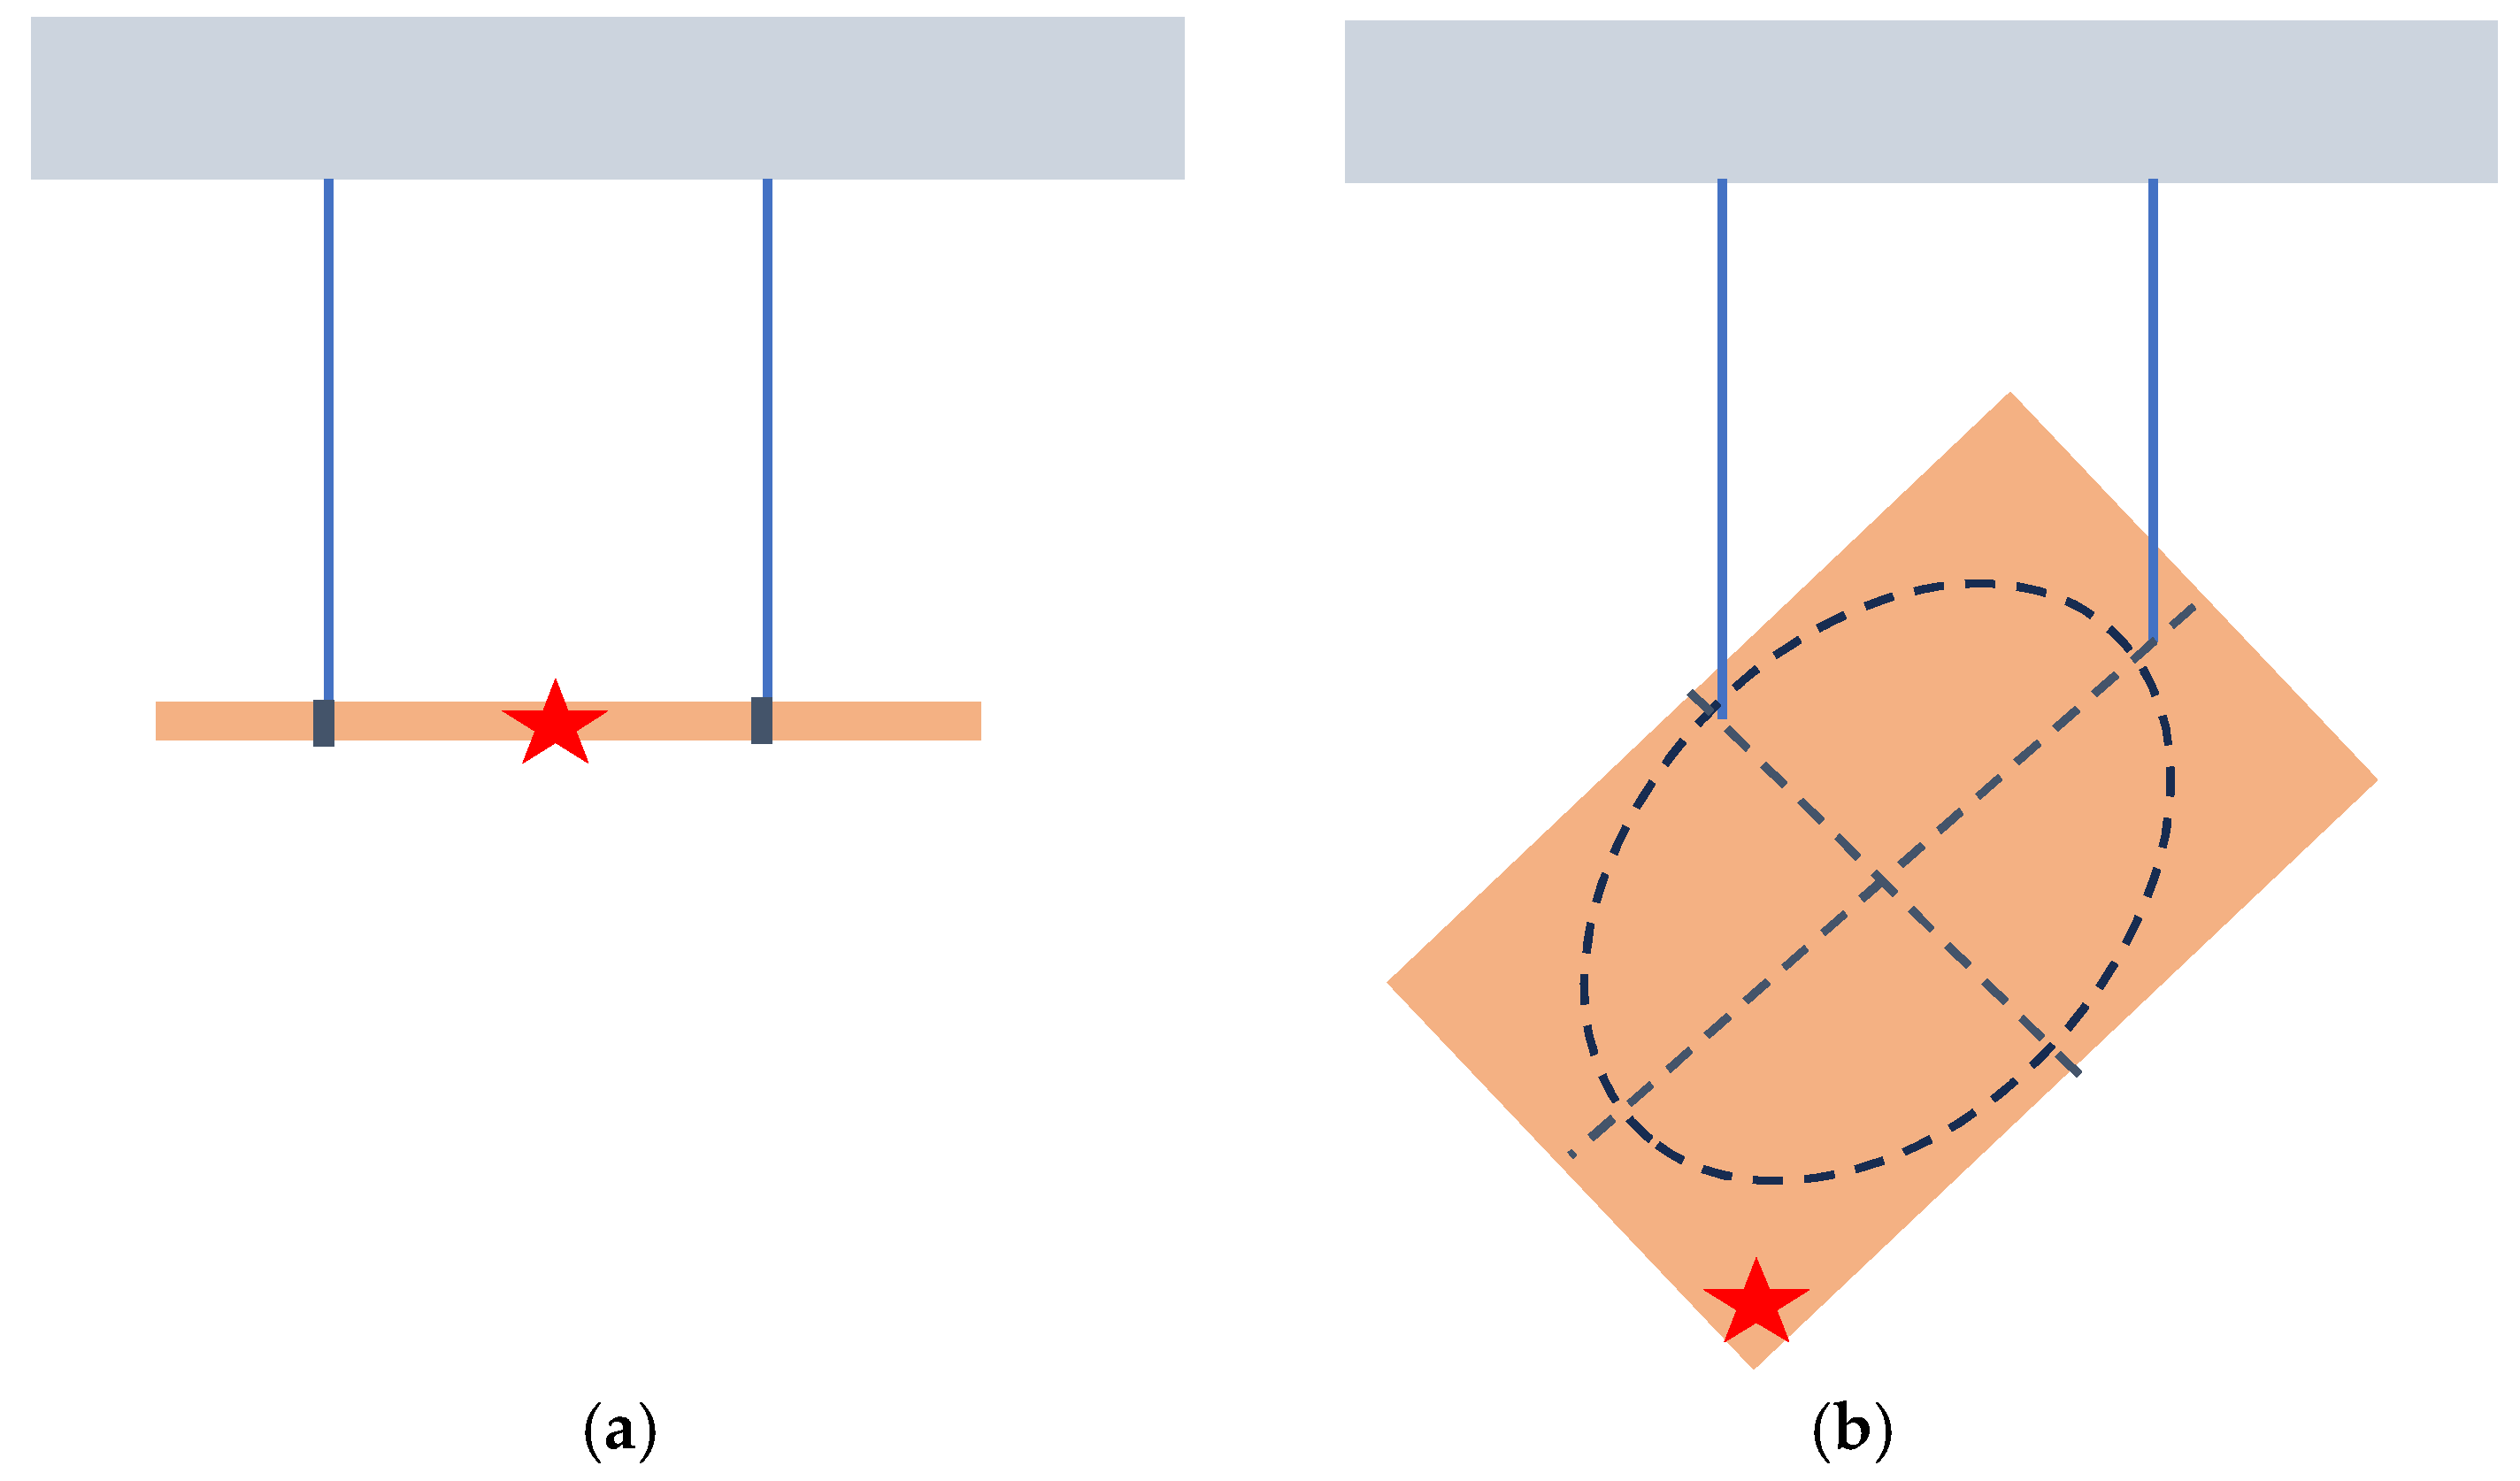
2.1. The Resonalyser Procedure

The Resonalyser procedure is a multi-sample IET that extracts the resonance frequencies and damping ratios from the IRF measured on a thin rectangular test plate and two test beams. The orthotropic engineering constants are parameters in numerical models. The parameters are iteratively updated till the numerical models become digital twins of the test samples. The test beams are cut along two in-plane orthotropic directions (Figure 1). The length/width aspect ratio of the actual test plate L/W is adjusted according to the next formula [3]:
L W = f 1 L 2 f 2 L 1 2
The frequencies f1 and f2 are associated with the fundamental bending vibration modes of the two test beams. L1 and L2 are the lengths of the beams. The aspect ratio L/W creates a so-called “Poisson” plate. The first three resonance frequencies of the Poisson plate are always associated with torsion, saddle and breathing vibration mode (see Figure 2).
If the length to thickness ratio of the plate is higher than 50, the vibration modes are nearly not influenced by transverse shear deformations. Since the vibration modes of the first three resonance frequencies are known, no OMA or EMA to identify the type of vibration mode sequence is necessary. An interesting property of a Poisson plate is that the saddle and breathing vibration modes are very sensitive to variations in Poisson’s ratio as shown by Lauwagie [44]. The knowledge of the type of vibration mode, together with the measured resonance frequencies, allows generating good starting values for the engineering constants G12 and v12 with the virtual field method, Pierron [45]. Detailed mathematical derivation can be found in Sol et al. [46]. Good starting values for E1 and E2 are obtained by applying IET on the two test beams. After obtaining good starting values, further convergence to the final values can be performed using a sensitivity based gradient method as shown by Sol et al. [15].
The same three test specimens (two beams and 1 Poisson plate) which are used for the identification of the elastic part of the Engineering constants, will be used for identification of the imaginary part. The IET provides the modal damping ratios associated with the fundamental bending vibration modes of the test beams and the modal damping ratios of the first three vibration modes of the Poisson plate. The decaying signal after impact (see Figure 3) is curve-fitted in the time domain with the formula:
x ( t ) = X sin ( ω t φ ) . e ξ ω t
with vibration amplitude X, circular frequency ω, phase φ and the modal damping ratio ξ .
The tangents δ of the Young’s moduli E1 and E2 are found from the measured damping ratios of the freely suspended beam bending modes.
2 ξ B e a m 1 2 ξ B e a m 2 = 1 0 0 1 tan δ ( E 1 ) tan δ ( E 2 )
A second set of equations (6) yields the tangents δ of the orthotropic stiffness matrix C i j * using the weighting coefficients G for the 3 first plate vibration modes.
2 ξ T o r s i o n 2 ξ S a d d l e 2 ξ B r e a t h i n g = G 11 G 12 G 13 G 14 G 21 G 22 G 23 G 24 G 31 G 32 G 33 G 34 tan δ ( C 11 ) tan δ ( C 22 ) tan δ ( C 12 ) tan δ ( C 66 )
The detailed mathematical derivation of components G can be found in Sol et al. [46]. The knowledge of tan δ ( E 1 ) and tan δ ( E 2 ) and relation (1) allows solving for tan δ ( v 12 ) and tan δ ( G 12 ) [33].
For room temperature measurements, the test plates and beams and beams are freely suspended on a frame. A small accelerometer fixed on the test samples with bee wax is connected to a signal conditioner box and a data acquisition card through a USB connection with a PC (see Figure 4).
The Resonalyser software guides the measurement of the IRF and the creation of the digital twins (see Figure 5).
Due to the low excitation level of the IET, the obtained values for the engineering constants of the Resonalyser are situated near the origine of the stress-strain curve (Figure 6).
The global uncertainty of the results for a mixed numerical experimental method (MNET) receives contributions from the measurement errors and inaccuracies of the numerical model (digital twin). Even with simple affordable equipment, the measured frequencies with the IET are typically accurate within 0.1%. The accuracy of a finite element model (FEM) of a thin beam or a thin plate can also be kept easily lower than 0.1%. The real source of uncertainties of a MNET for composite materials are the sample heterogeneities (thickness, material stiffness and density heterogeneity, local anisotropies). The Resonalyser is a multi-sample method and therefore can estimate the uncertainty caused by heterogeneities in the different samples. The digital twins use the same engineering constants for the computation of the resonance frequencies of the beams and the plate. Perfect sample homogeneity would lead to perfect agreement between experimental and computed resonance frequencies (within the limit of the 0.1% experiment and 0.1% model uncertainty). The software gives high confidence to the plate measurements and less to the beam measurements resulting in nearly perfect matches for the plate and – in case of heterogeneities – lesser good matches for the beams. The deviations for the beams in the Resonalyser software are used to estimate the uncertainties of the identified engineering constants using the sensitivity matrix method [17]. Identification with the Resonalyser procedure can be done with three plate frequencies (Torsion, saddle and breathing modal shapes) or with only two (Torsion and breathing). An example of an output screen of the Resonalyser software is given below (Figure 7). More examples and illustrations can be found on the Resonalyser website [47]. Processing three frequencies is recommended in case the heterogeneity of the plate is high. Two frequencies are sufficient for good quality plates (see Figure 7). Figure 7 shows the identification results of a PA6/Organo glass composite at 20° C using two plate frequencies and two beam frequencies.
The engineering constants obtained are averaged mainly over the plate area. Since the IET is non-destructive, the beam and plate samples can be used afterwards for additional tensile testing to measure failure stress, without the need of recording strains. This makes tensile tests faster and cheaper [48].
The problems and solutions for automated testing in a climate chamber are discussed in the next paragraph.

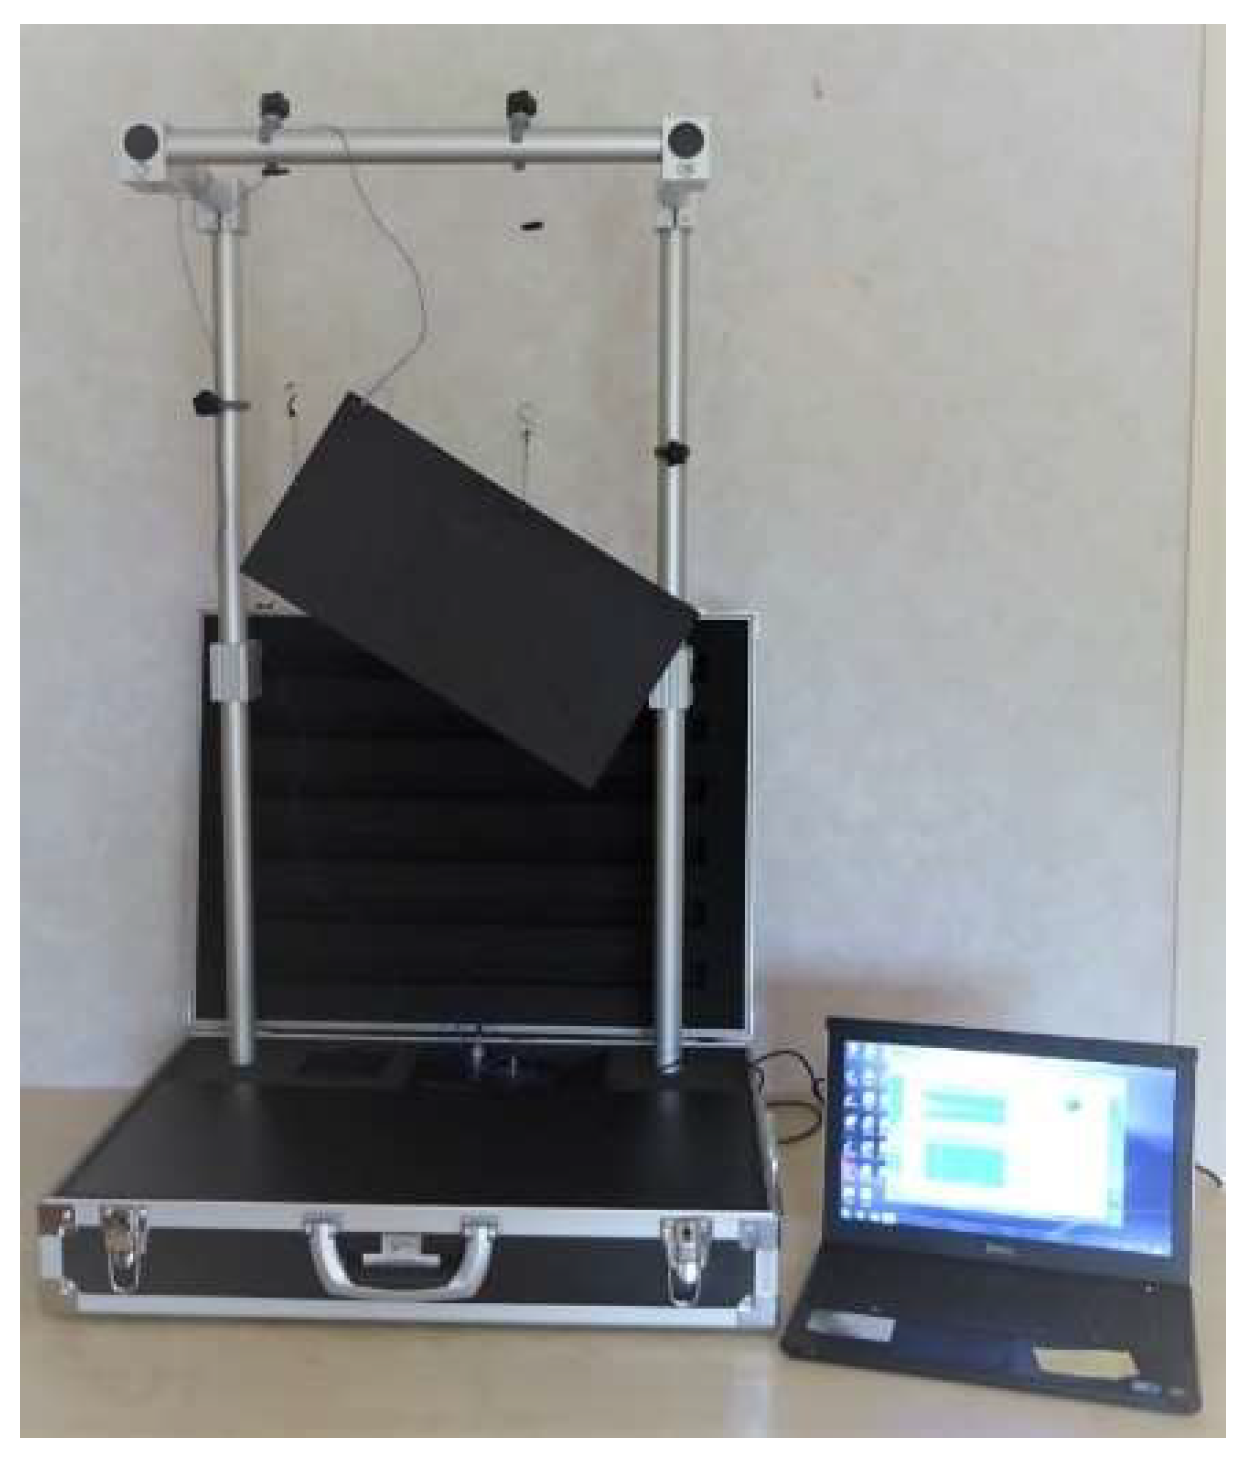
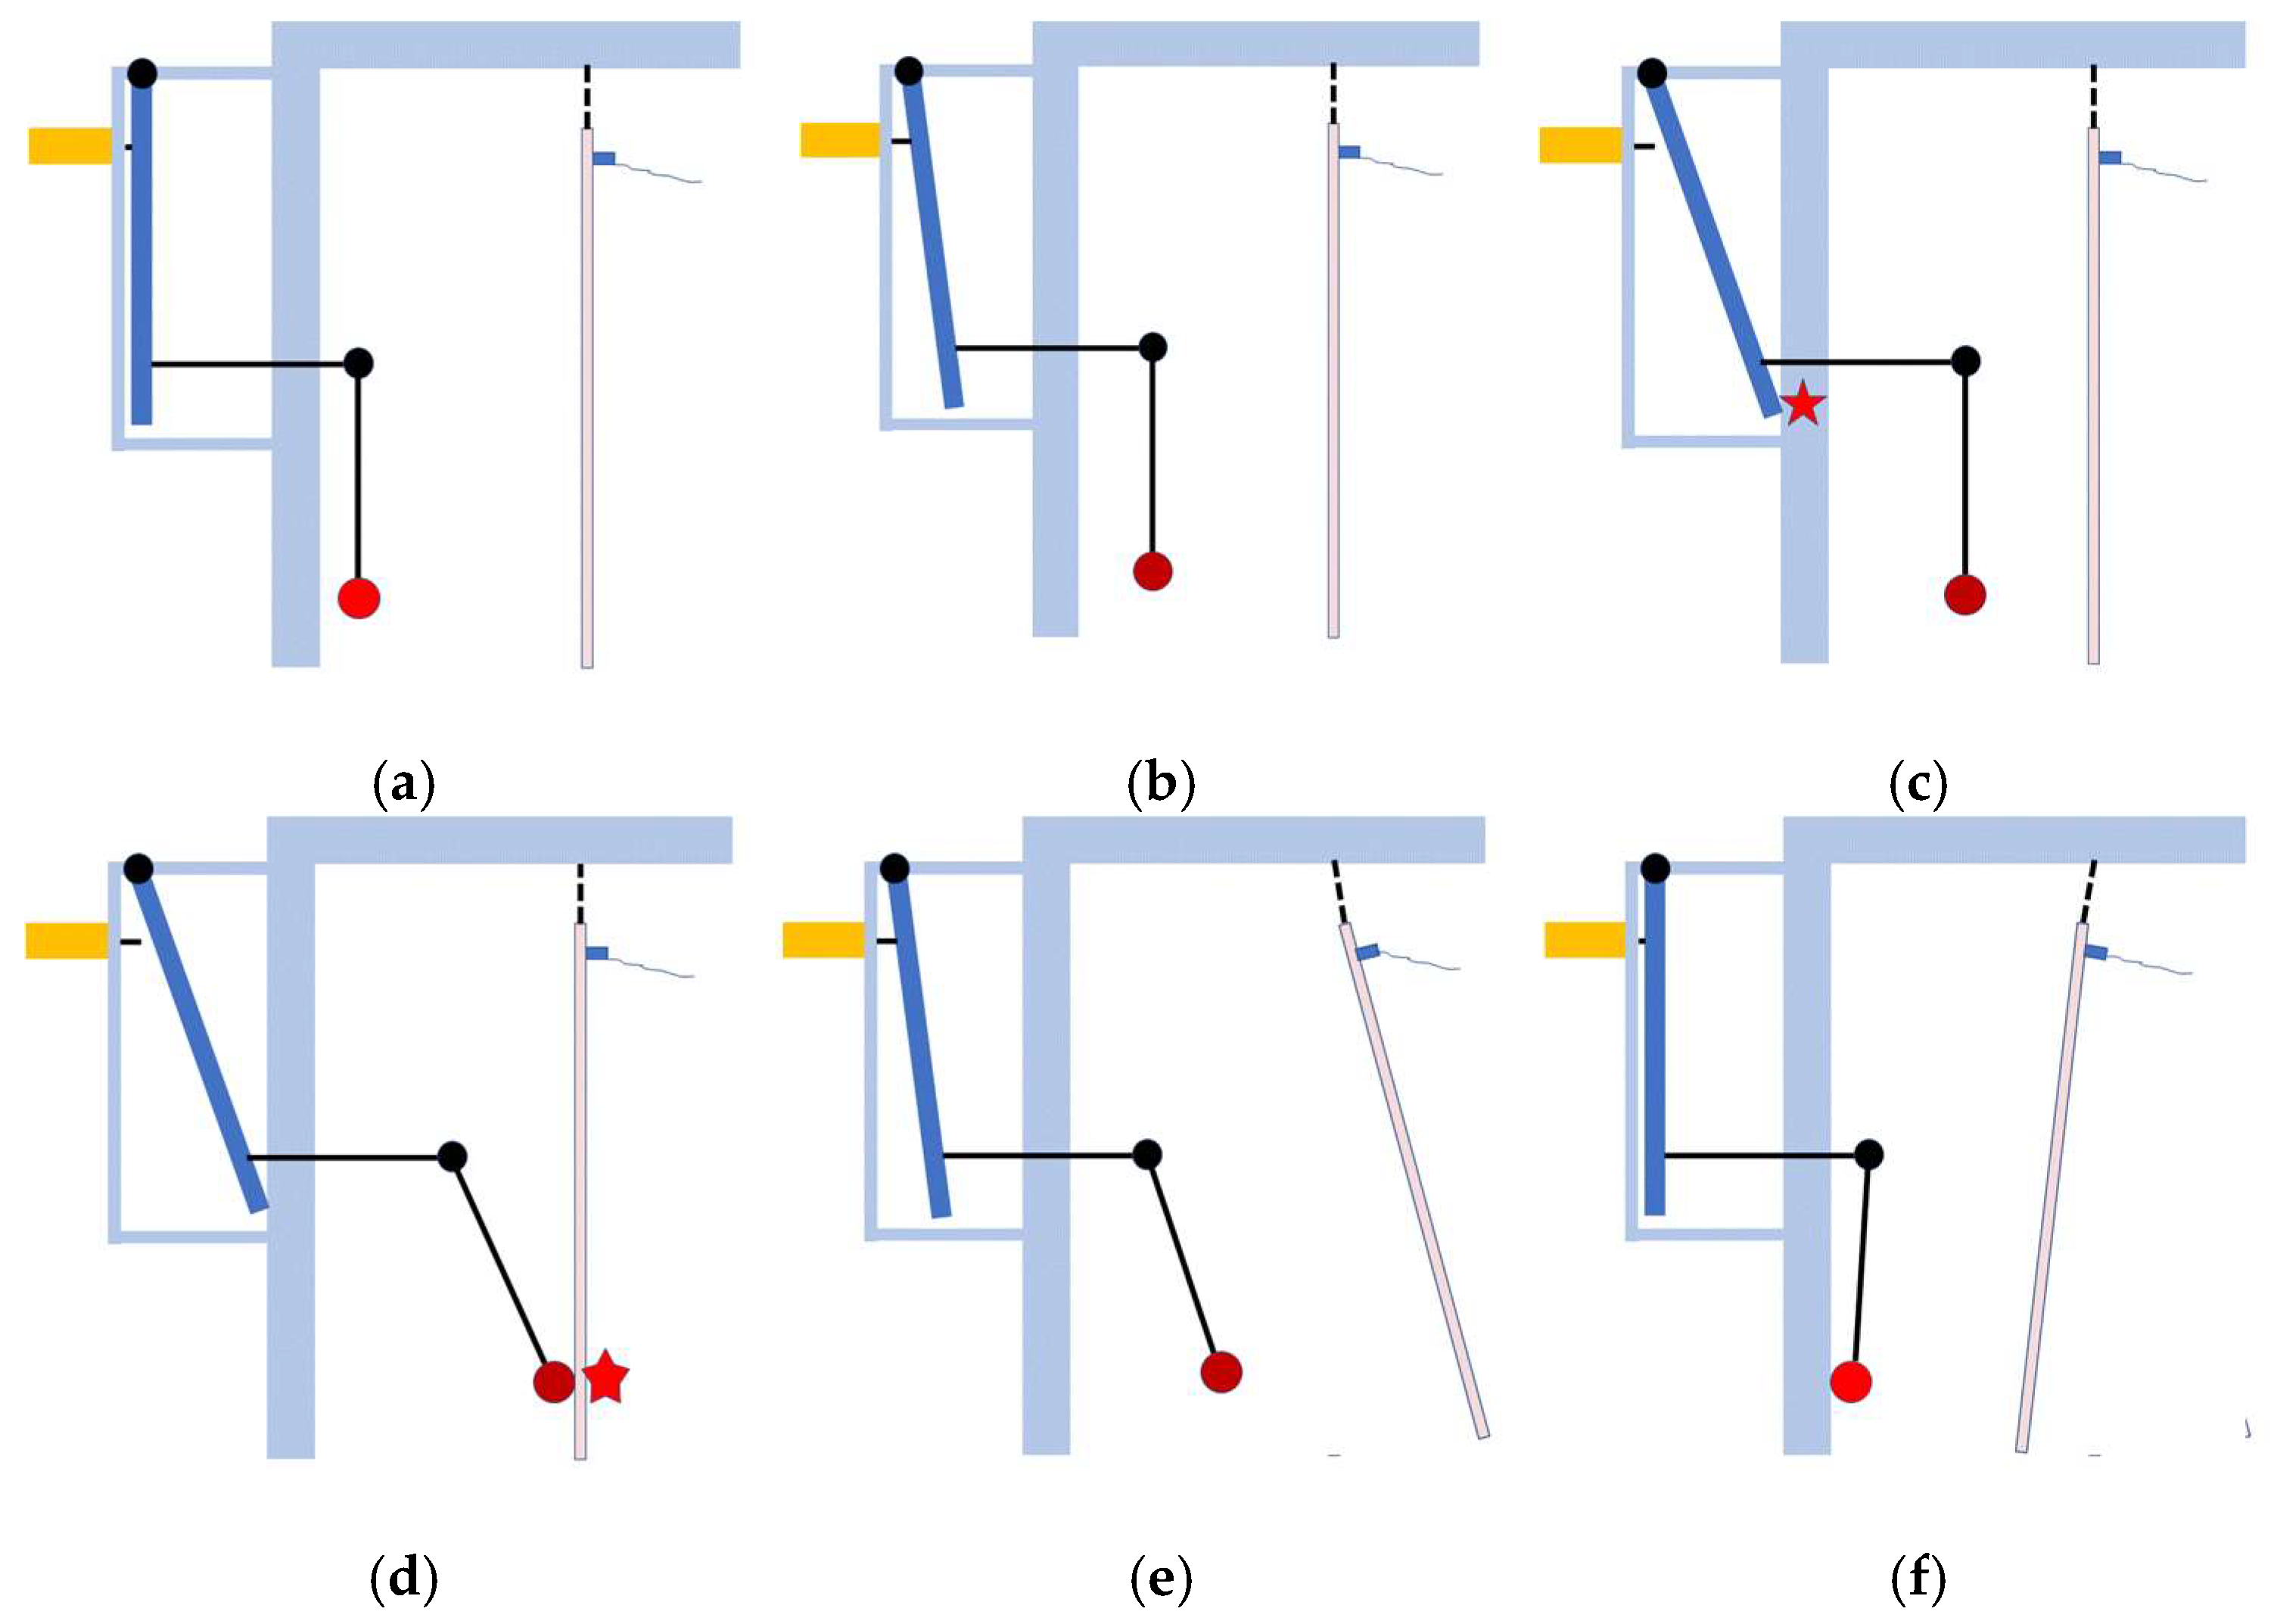
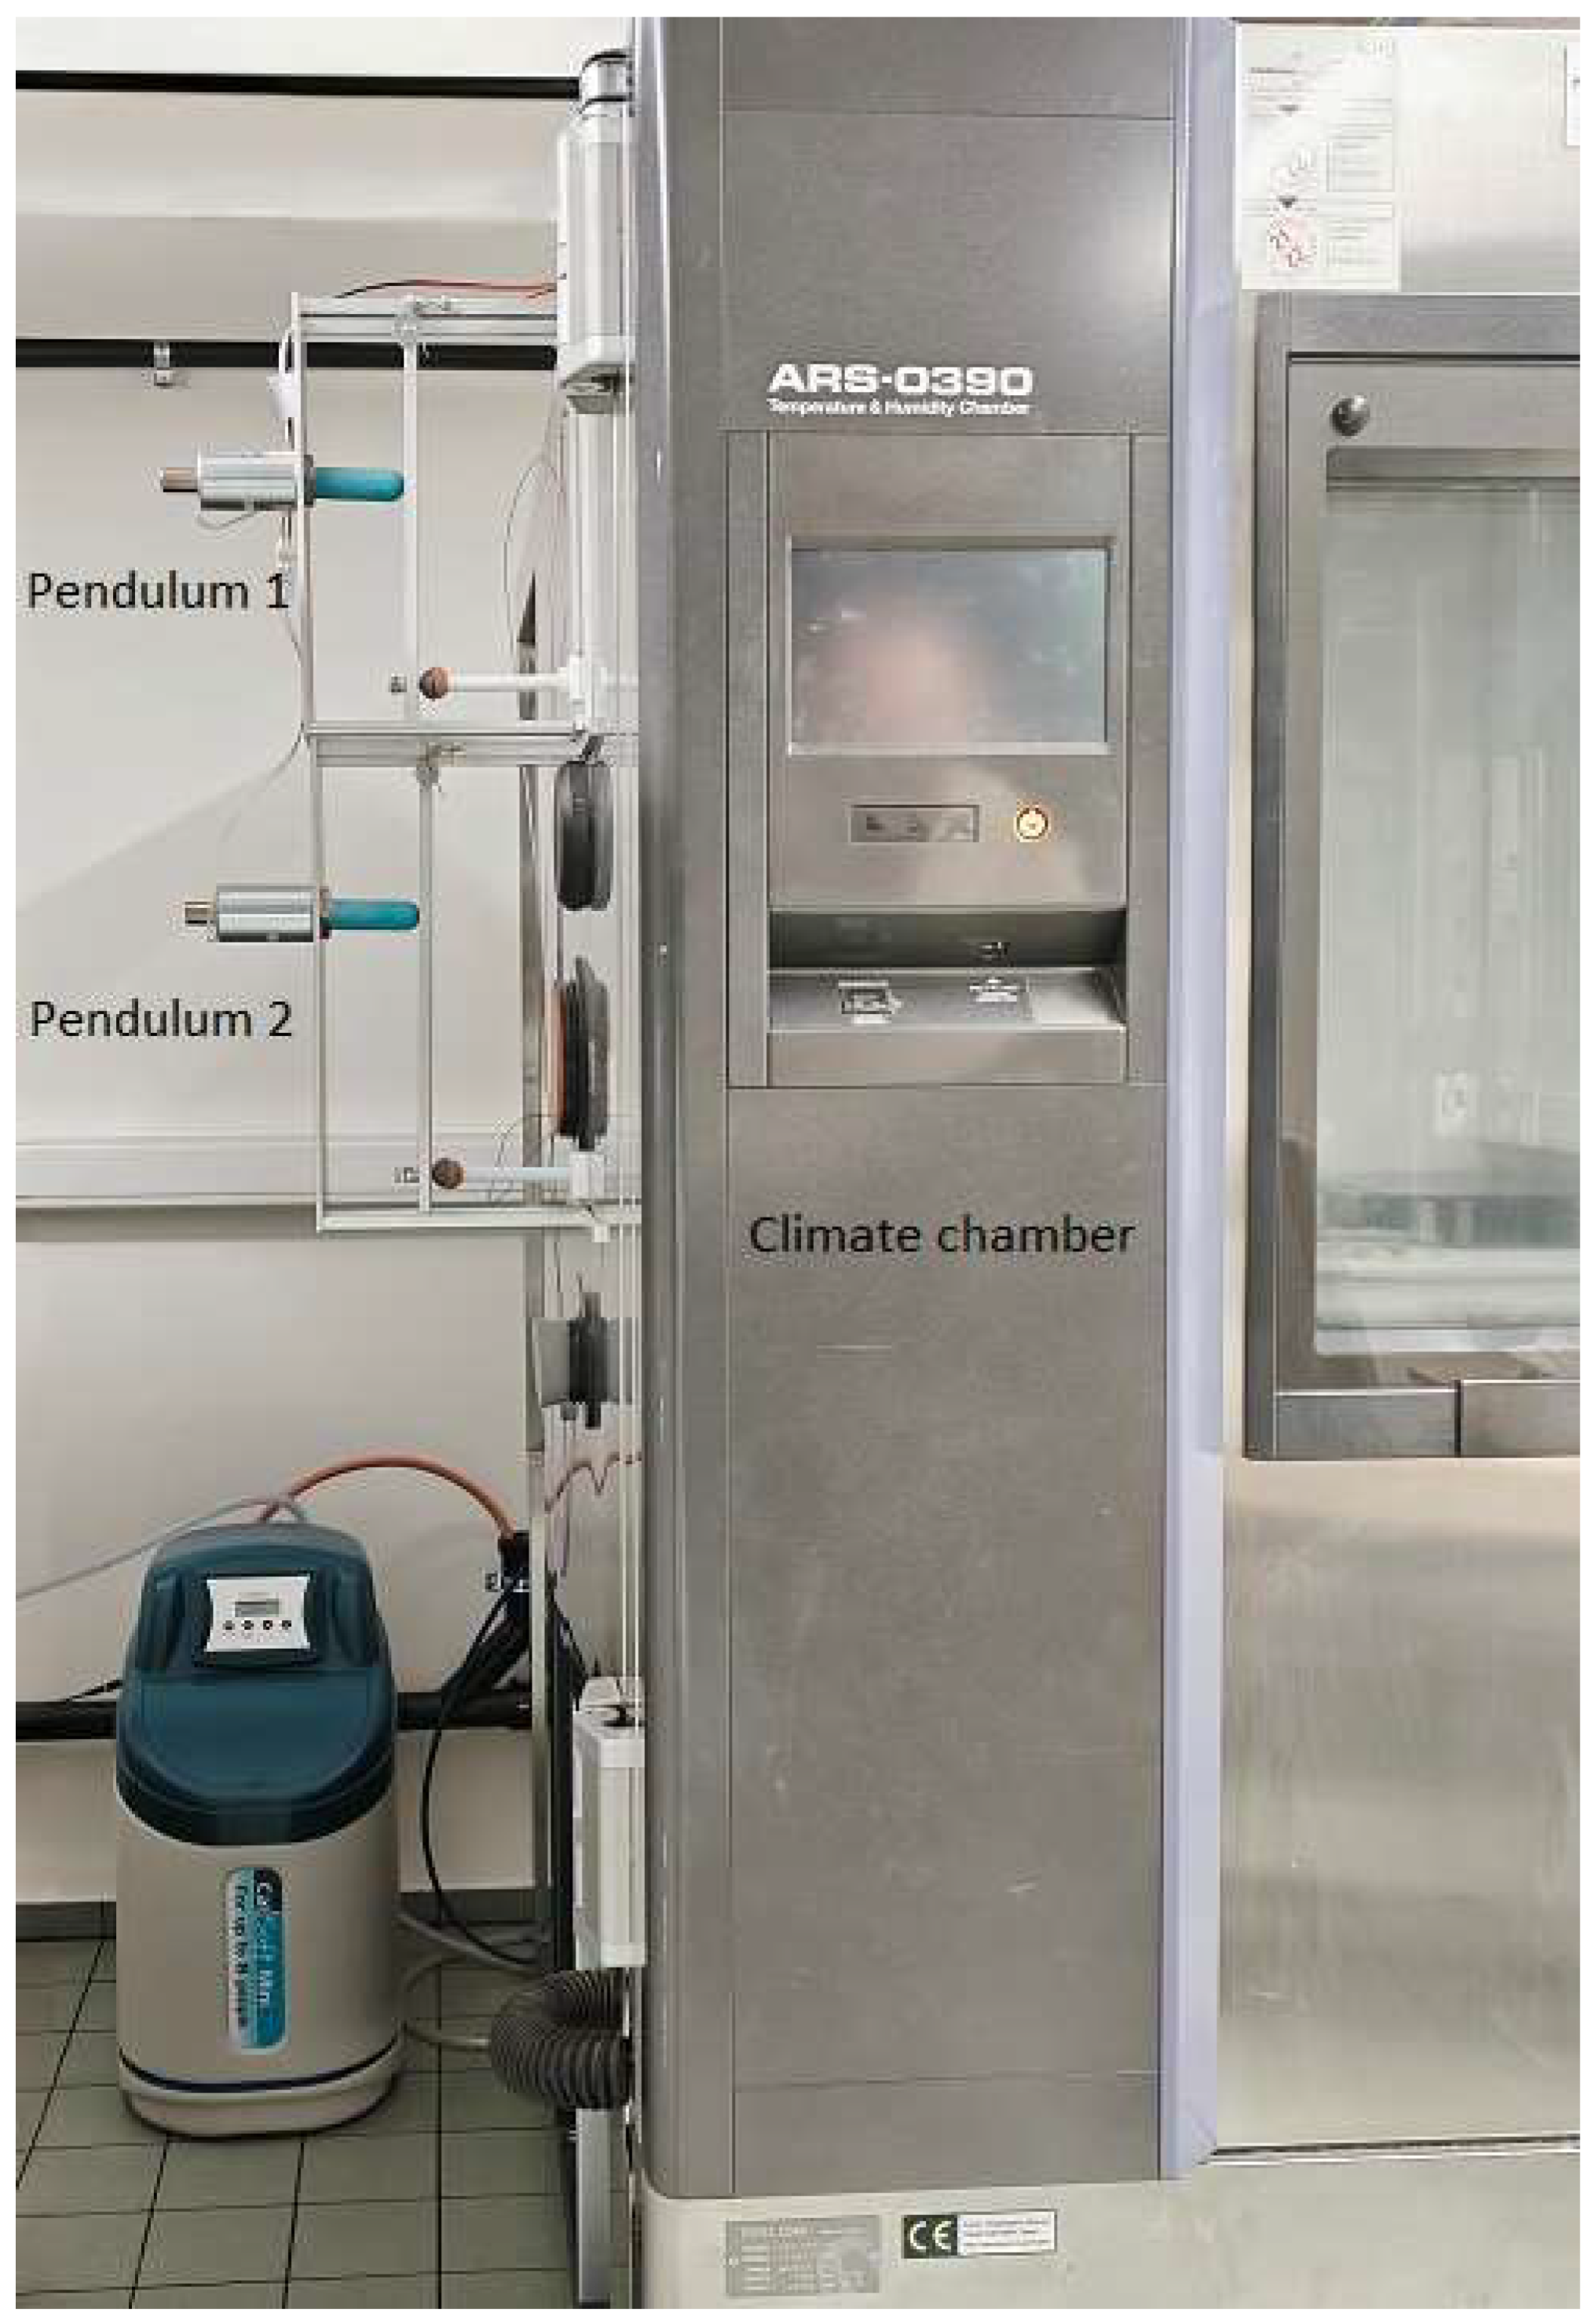
2.1. The Automated Pendulum Excitation

Applying an impact using a lateral stick driven by pneumatic or electromechanical force may seem straightforward. However, delivering a controlled impulse to a freely suspended sample is challenging due to rigid body oscillations of the suspended samples. These oscillations are inevitable in a climate chamber or temperature cavity, as air fans distribute air to achieve a uniform temperature. Consequently, the exact position of the sample is uncertain, leading to impacts that may occur too early or too late, with excessive or insufficient force. As a result of the impulse, the suspended sample oscillates considerably. To prevent multiple impacts, the lateral stick must be retracted swiftly immediately after the impulse, which is cumbersome to realize practically. A straightforward solution to these issues is pendulum excitation (Figure 8). Figure 8 shows a freely suspended sample inside a climate chamber, with the pendulum mechanism externally mounted on the chamber. The pendulum is connected through a small aperture in the chamber wall.
The pendulum mechanism is actuated by a solenoid (yellow in Figure 8a). Upon activation by a voltage, the solenoid propels a lever (dark blue in Figure 8b), which strikes the wall of the climate chamber (light blue in Figure 8c). Due to inertia, the pendulum is set in motion until it impacts the sample (Figure 8d). The sample receives an impulse and oscillates away, while the pendulum mass rebounds. Gravity pulls the lever back to the initial position (Figure 8e). All components of the pendulum mechanism return to their starting positions, while the sample continues to oscillate (Figure 8f). There is only a single impulse, with no multiple impacts.
The voltage on the solenoid can be adjusted to tune the launching force. The size of the ball on the pendulum can be chosen to ensure it rebounds after impact. The material of the ball can be chosen to achieve the desired spectrum of excited frequencies (hard materials excite higher frequencies while soft materials transfer more energy in lower frequencies). The length of the pendulum can be adapted to ensure the impulse occurs at the correct location.
The identification of the engineering constants can be performed using four measured frequencies and damping ratios: the two test beams and the torsion and breathing vibrations modes of the Poisson plate. To accurately measure the damping ratio, the suspension must not add external influences. Therefore, the beams are suspended at the location of their nodal lines (Figure 9a). The nodal line of the breathing vibration mode forms an ellipse while the nodal lines of the torsion form a cross. A suitable suspension position is at the intersection of these nodal lines (Figure 9b). The excitation position for the beams is at the center, while the excitation position for the plate is in the lower corner (see Figure 9b).

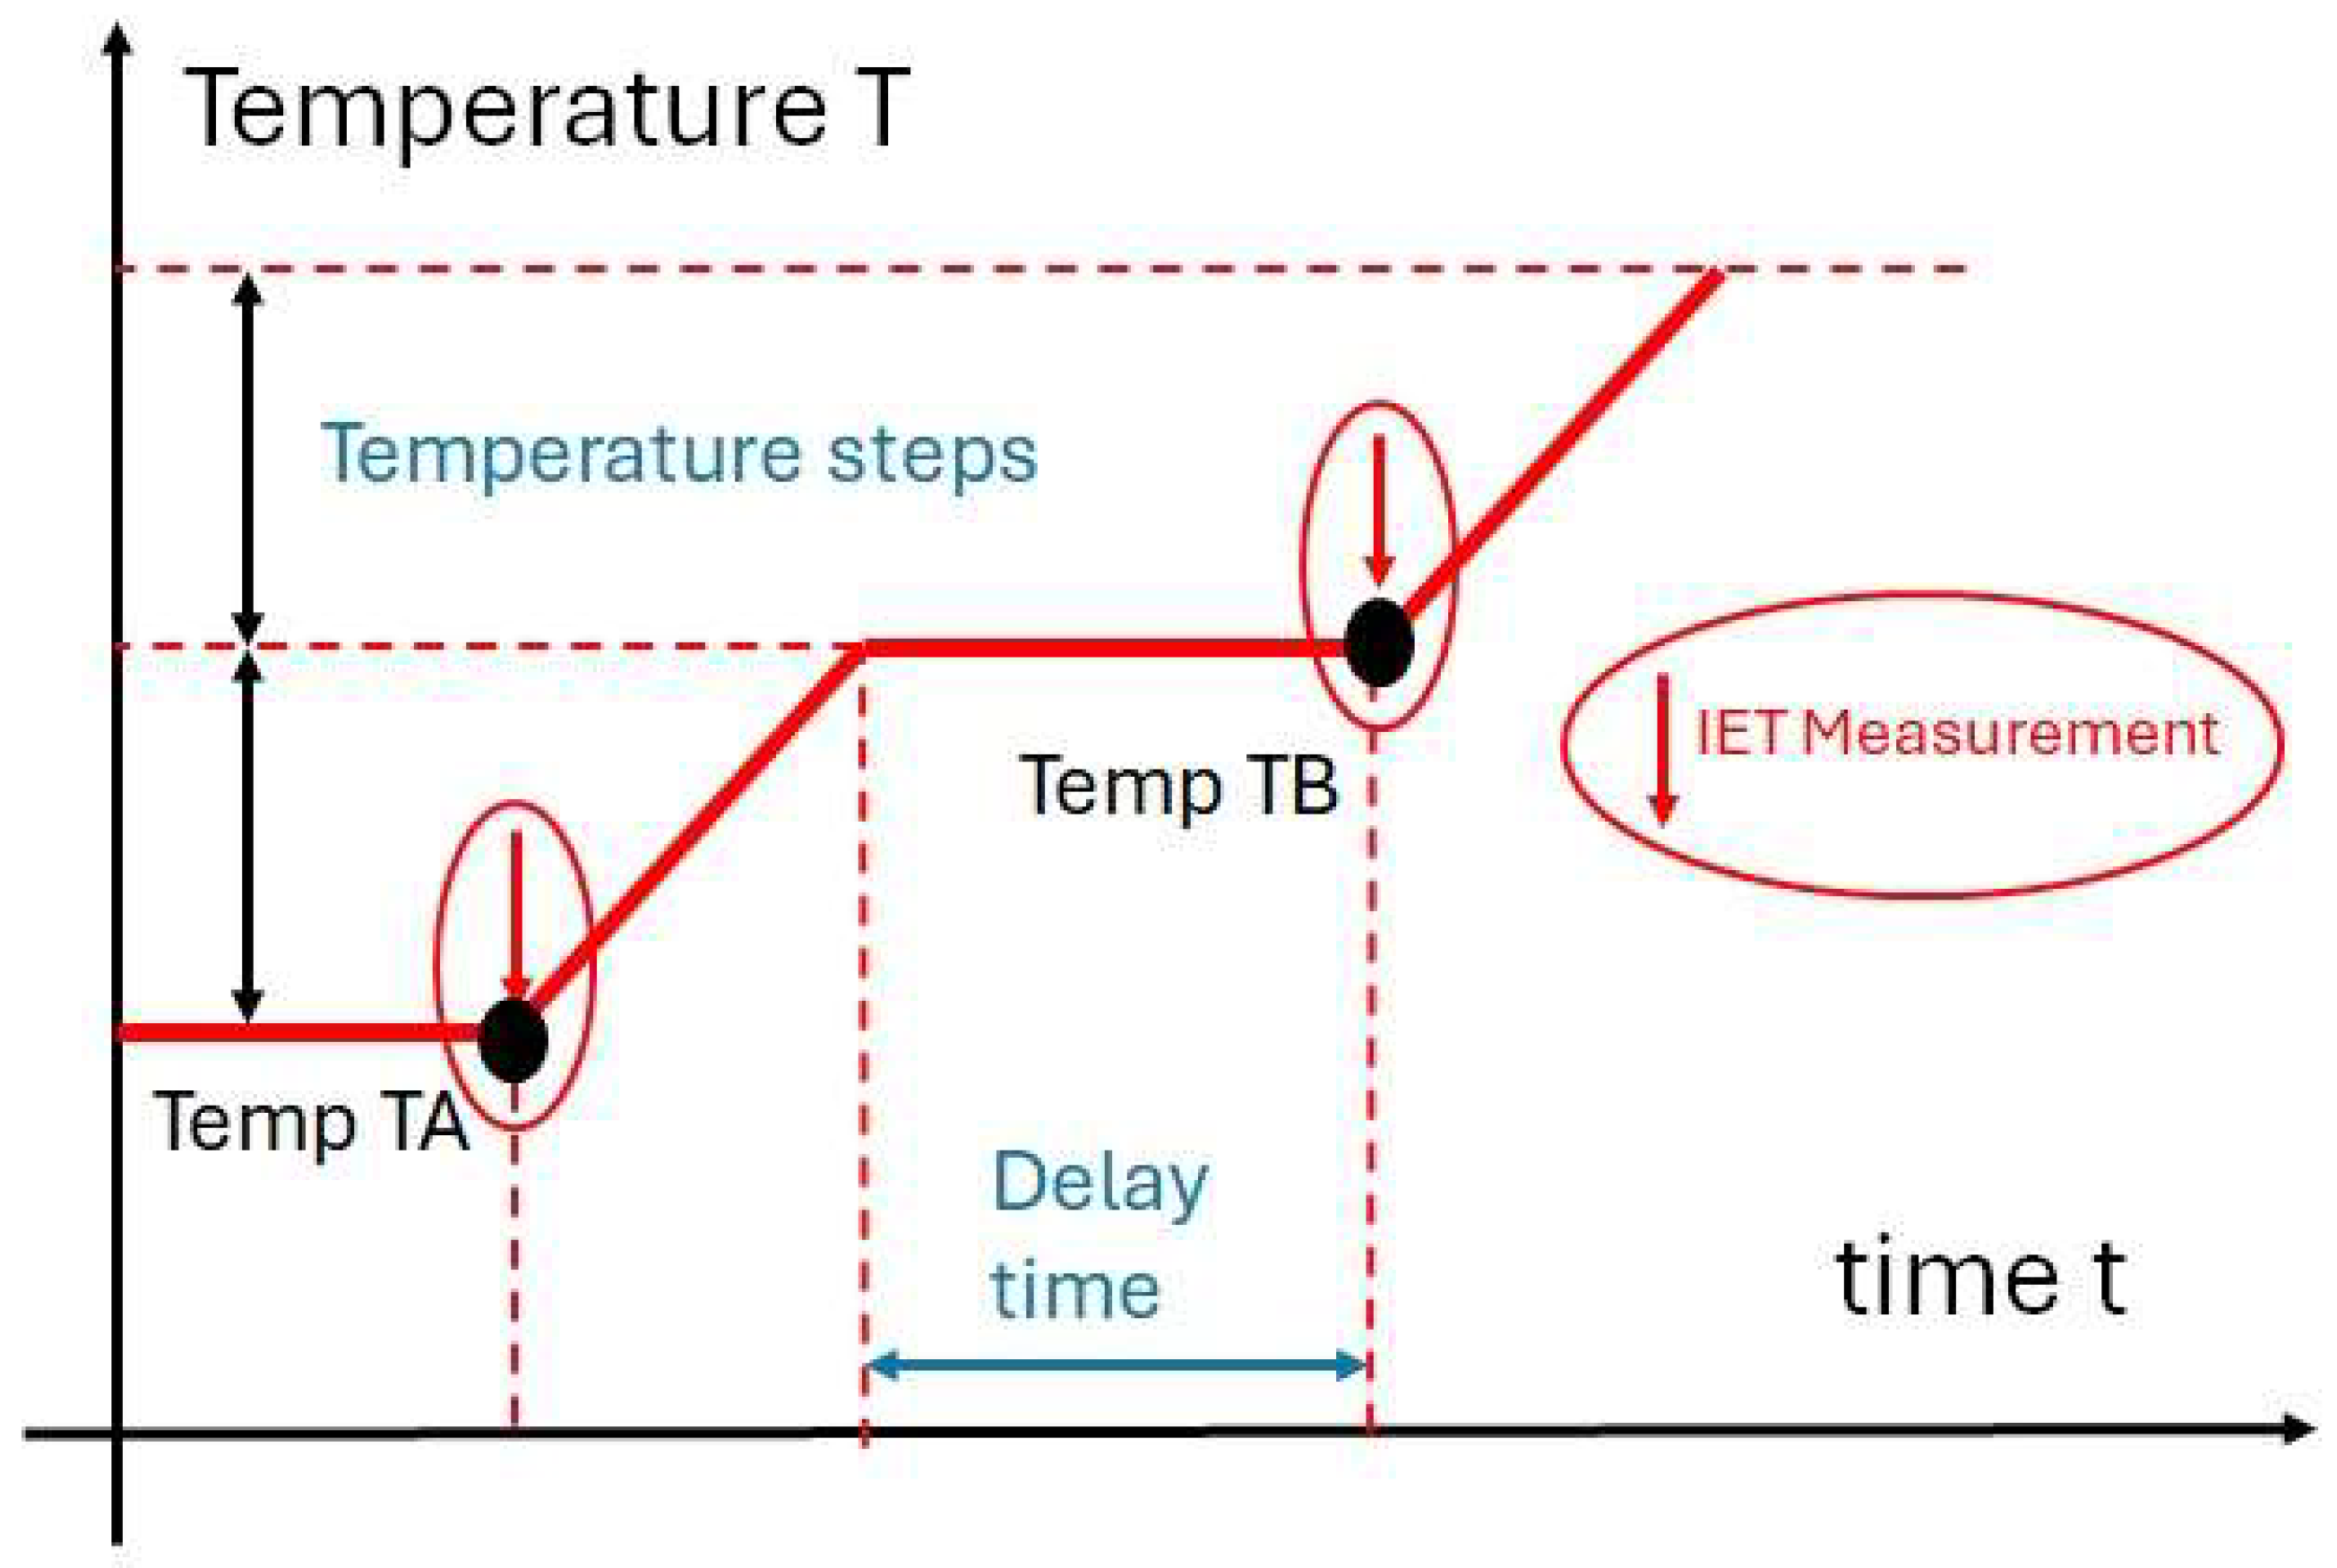
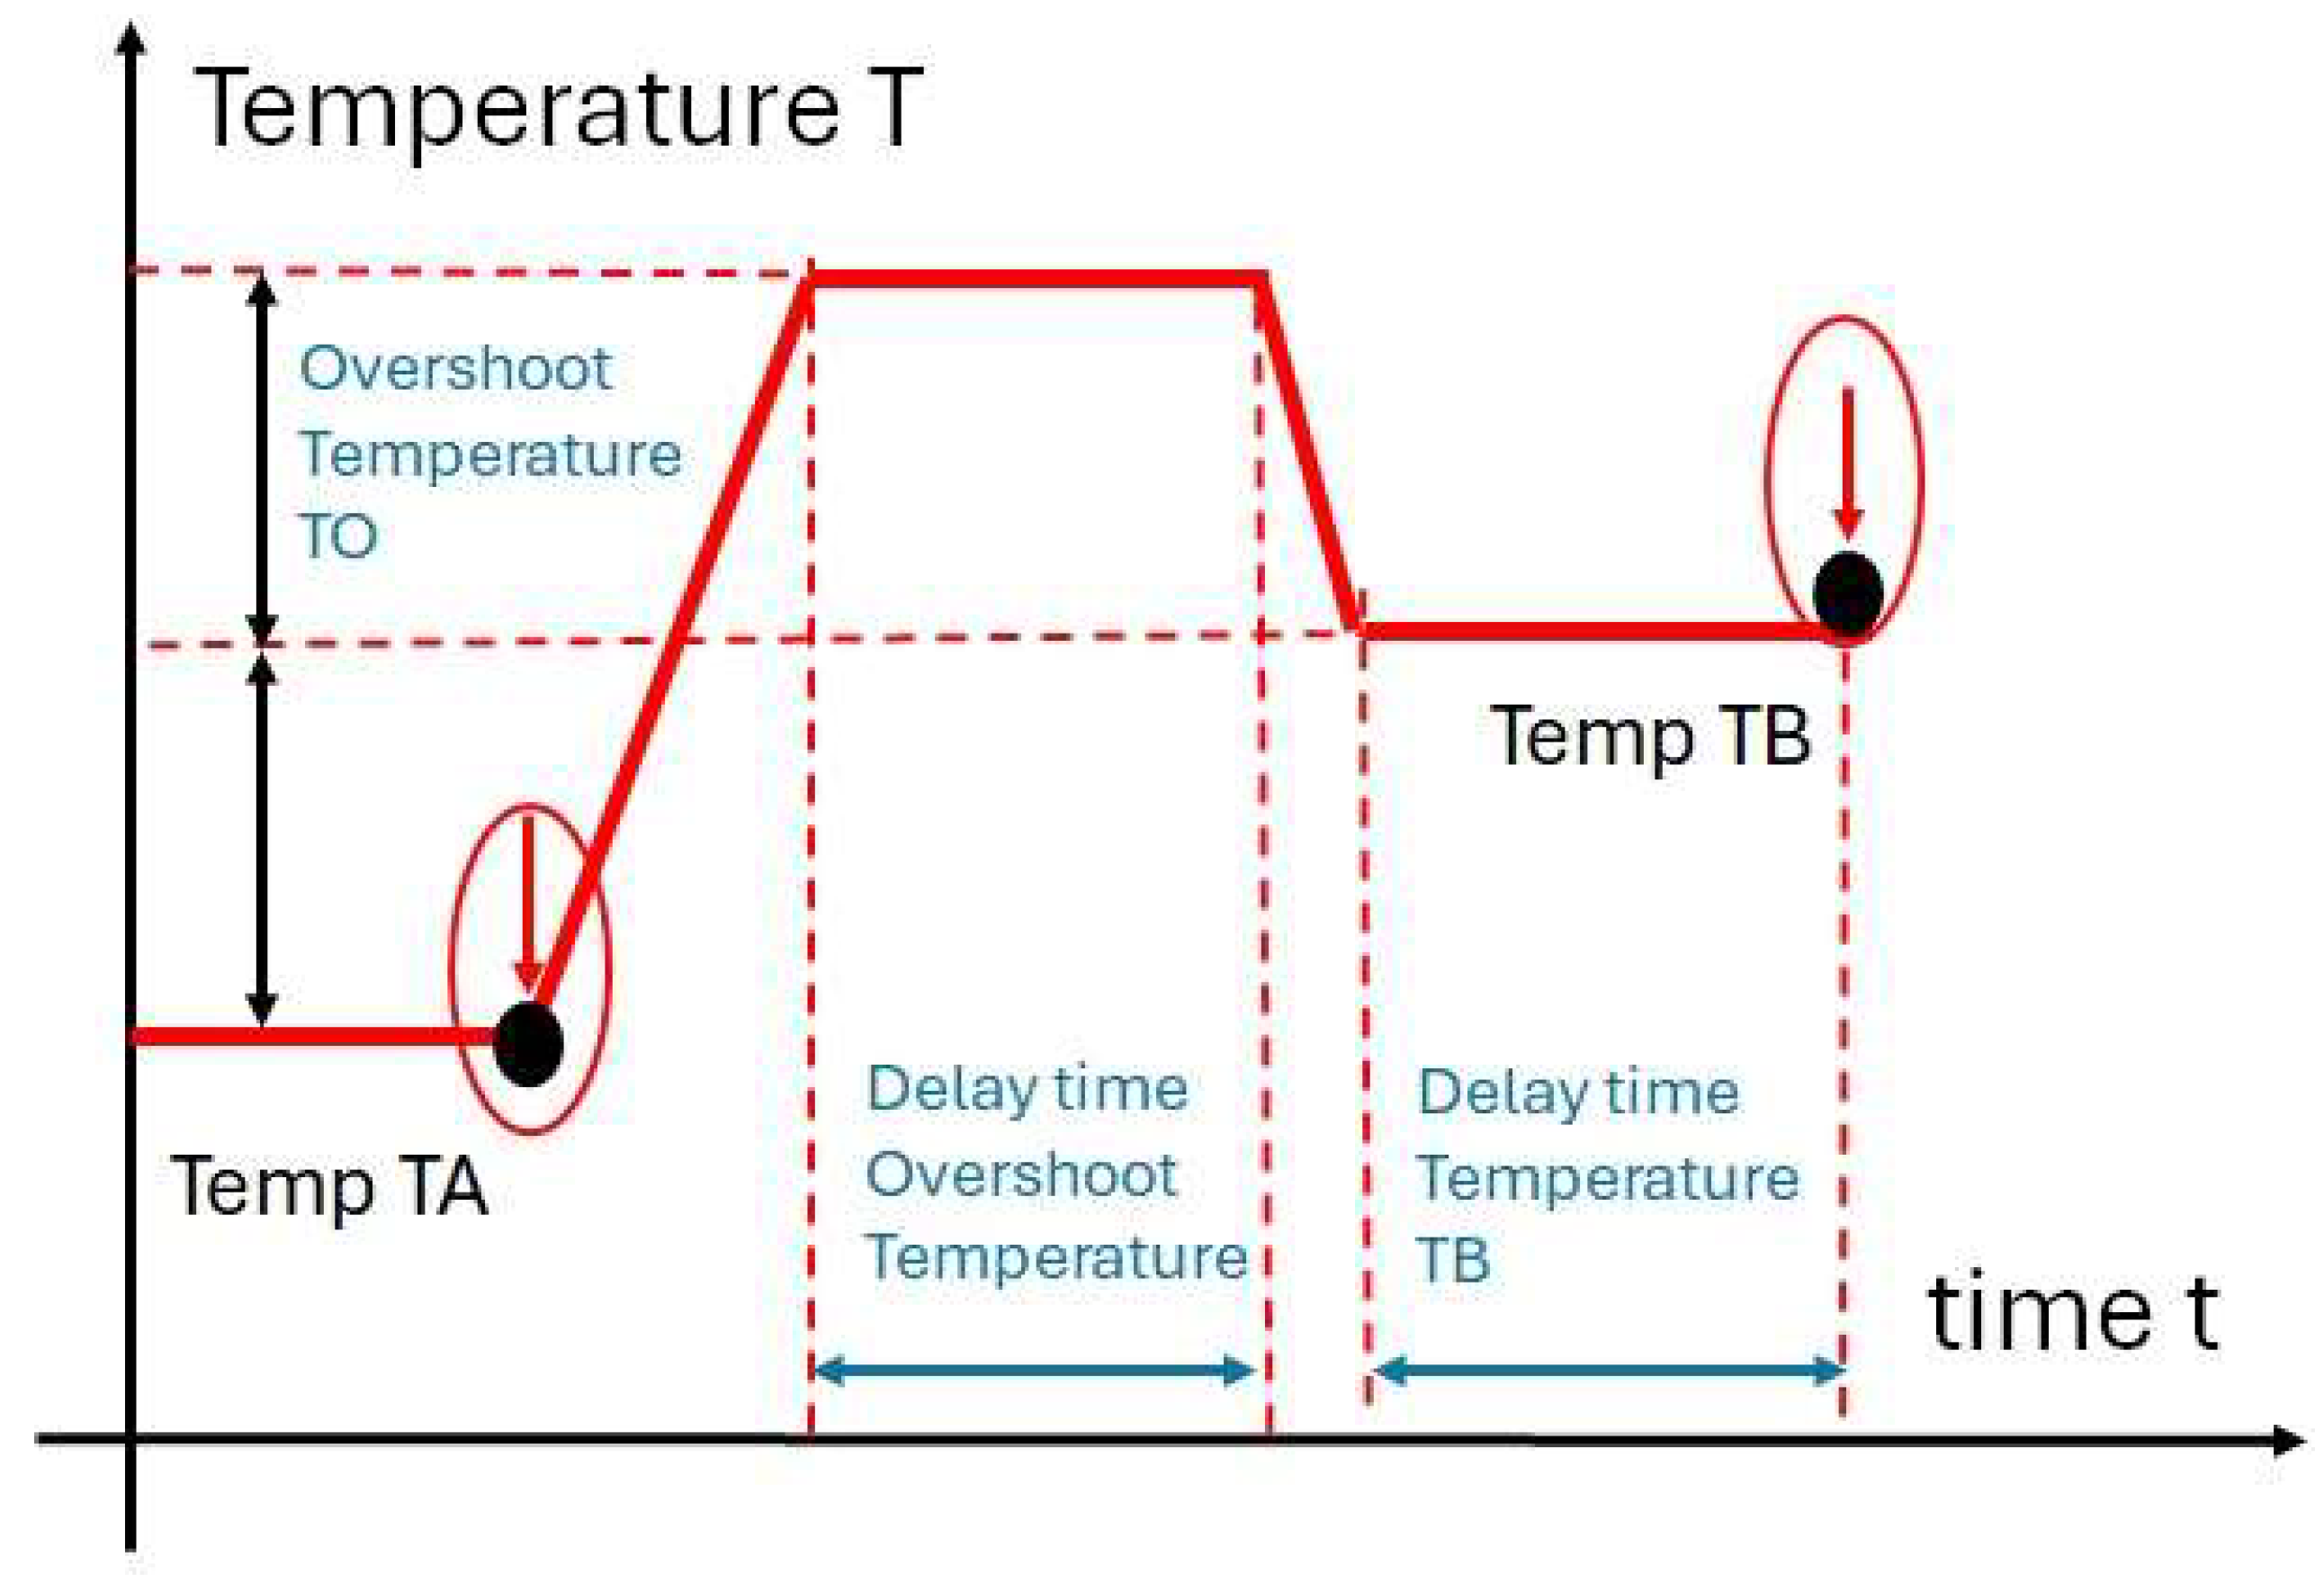
2.3. Temperature Control

The objective of the extended IET on beams and plates is to automatically measure the IRF at specified temperatures and programmed time intervals. It is essential that the temperature distribution within the sample remains homogeneous across all temperature steps. A challenge arises in transitioning the isothermal temperature distribution of a freely suspended sample from one value to another, as this process requires time. The transient heat conduction in a thin plate is influenced by the convection occurring at the surfaces. The temperature profile varies over time at different internal positions, with the surface temperature changing relatively quickly, while the temperature at the sample's mid-plane changes more slowly. Key control parameters include the convection heat transfer coefficient h, the thermal conductivity k, the specific heat capacity Cp and the density rho of the composite material of the sample [49]. The practical question is estimating the duration required to transition from an isothermal state at an initial temperature (Ti) to an isothermal state at another temperature (T).
The time evolution of the temperature T at the center of a sample exposed to a surface temperature TS is described by formula (7):
T = T S + T i T S A e 4 α λ 2 D 2 t
In (7), T represents the temperature at the center of the sample, t is time, D is the sample’s thickness, TS is the surface temperature and α is the thermal diffusivity. Coefficients A and λ are functions of the Biot number Bi:
B i = h D 2 k
α = k ρ C p
The coefficients A and λ for specific Biot number values can be found in tables or computed using numerical finite element models [49]. The Resonalyser software incorporates such thermal numerical models. When the value of center temperature T approaches TS, the sample can be considered isothermal. The resonance frequencies and damping ratios of the beams and plate can be measured by IET at the subsequent isothermal states. After measuring and identifying the engineering constants at this state, a new temperature step can be set. Before setting the temperature steps and timing values for the automated procedure, the delay time (see Figure 10) required to reach an isothermal state at different steps must be computed based on the assumed known thermal parameters of the sample. For given thermal properties of the test samples, the temperature in the climate chamber at different temperature steps and the time durations can be set by the automated control program. Figure 10 illustrates a simple temperature and time stepping program starting at an isothermal state with temperature TA and progressing towards temperature TB.
Theoretically, it takes an infinite amount of time to reach the new isothermal state. Therefore, a more elaborate approach with an overshoot temperature step is convenient (see Figure 11).
With an overshoot temperature (TO) at the sample surfaces, the temperature at the center T will reach more quickly or even surpass the desired temperature TB. Subsequently, with the desired temperature TB at the surface, the samples will evolve faster to an isothermal state at TB. The delay times for the overshoot and temperature TB together with the value of the temperature steps must be set before starting the automated measurement procedure.

2.4. Measurement Procedure

A climate chamber is outfitted with three pendulum excitation units corresponding to three measurement channels. The two test beams and the test plate are freely suspended within the climate chamber cavity. Each test sample is equipped with a 0.19-gram solid DJB company Micro Miniature Piezo-Tronic IEPE Accelerometer - A/128/V.
Pendulum unit 1 excites the suspended test plate on channel 1, while pendulum units 2 and 3 excite suspended Beam 1 and Beam 2 on channels 2 and 3, respectively. Figure 12 illustrates the left side of the climate chamber with pendulum units 1 and 2 attached. The frequencies and damping ratios of the torsion and breathing modal shapes are derived from the measured Impulse Response Function (IRF) of the test plate on channel 1. Similarly, the frequencies and damping ratios of Beams 1 and 2 are derived from the IRFs measured on channels 2 and 3. The measurement interval, including the initial and final temperatures, is set along with the required temperature steps and delay times. Following the measurement of the IRFs on the three channels, the identification of the engineering constants is performed using the Resonalyser software. The frequencies and damping ratios at each temperature step, along with the four engineering constants, can be monitored in real-time on graphs displayed on a computer screen.

3. Results

The above-described measurement procedure was applied on a plate composed of 6 layers of thermoplastic NeomeraTM Polyamide-6 reinforced with Organo glass fabric. Figure 13 shows the original plate. The test beams and test plate are cut out of this original plate.
The size and mass of the prepared test samples are given in Table 1.
The values for the parameters describing the heat transfer of PA6 are:
  • Convection heat transfer coefficient h = 30 W/m2 °C
  • Specific heat Cp = 1800 J/kg °C
  • Thermal conduction coefficient k = 0.29 W/m °C
  • Density rho = 1145 kg/m3
A temperature step of 1 °C and an overshoot temperature of 1 °C was selected. The delay time for each step was set equal to 2 minutes. These settings ensured an isothermal temperature distribution in the sample at each step within a 1% margin. The temperature interval had a starting value of -20 °C and a final temperature of 60 °C. Figure 14 shows the result for the measured resonance frequencies and the damping ratios.
It can be observed in figure 14 that the frequency curves (black lines) are smooth, while the damping curves (thin red lines) show more noise. The damping curves are therefore smoothed with cubic splines before the identification of the engineering constants (thick red lines).
Figure 15 shows the identification results.

4. Discussion

Measuring damping is more challenging compared to resonance frequencies. Damping is associated with energy dissipation during a vibration cycle, whereas frequency is related to potential energy. Since the amount of dissipative energy per cycle is significantly lower than the potential energy, the measurement uncertainty for damping is higher, as illustrated in graphs (a), (b), (c), and (d) in Figure 14. The noise at each temperature step is also influenced by variations in the temperature settings of the climate chamber. At each temperature step, the climate chamber must rapidly achieve and uniformly maintain the new temperature within the cavity. The graphs indicate that damping is more sensitive to temperature variations than resonance frequencies. The resonance frequencies of the torsional, breathing, and bending modal shapes of the two test beams peak at -20° C and decrease continuously to a minimum at 60 ° C, which is typical for composites with a thermoplastic matrix. The damping ratios of these modal shapes exhibit maximum values between 5 ° C and 20 ° C, related to physical phenomena in polymers such as the glass transition temperature.
After smoothing the damping ratio curves, the orthotropic engineering constants are identified using the Resonalyser procedure. The results are presented in the graphs of Figure 15. As the measured resonance frequencies decrease continuously with increasing temperature, and since modulus values E1, E2 and G12 are directly related to the frequencies, the modulus values also decrease continuously with increasing temperature. Young’s modulus E1 evolves from 20.5 GPa at -20 °C to 16.5 GPa at 60 °C (20% reduction). Young’s modulus E2 has comparable values typical for bidirectionally reinforced composites and evolves from 19 GPa to 14 GPa (26% reduction). The in-plane shear modulus in bidirectionally reinforced composites G12 is primarily dependent on the matrix, showing a dramatic reduction from 5 GPa at -20 °C to 1 GPa at 60 °C (divided by a factor 5!). Poisson's ratio remains low and nearly constant across all observed temperatures. The tangent deltas of the modulus values are mainly determined by the measured damping ratios of the test samples, with maximum values observed between 5 °C and 15 °C. Tangent delta measures the phase delay between the sinusoidally varying stresses and strains at each point of the sample. This value is averaged out over the area of the samples, similar as the obtained modulus values by the Resonalyser procedure. The tangent delta of Poisson's ratio represents the phase angle between the strains in the two orthotropic directions for a sinusoidal vibration at the associated frequency. The developed measurement instrument will enable us to study material behavior in future research on different composite material types.

5. Conclusions

The developed method aims automated identification of the orthotropic engineering constants of composite materials as a function of temperature. Relatively large thin plate and beam samples are suitable for analysis of composite materials. Only minimal preparation of the test sample is required (cutting beams and adjusting the sizes of the Poisson plate). The results are averaged over the area of the test samples. The simple yet accurate Impulse Excitation Technique (IET) was chosen for measuring resonance frequencies and damping ratios. IET is a non-destructive technique, allowing measurements at different temperature steps. The developed pendulum mechanism is easily implemented in existing climate chambers. Pendulum excitation avoids multiple hits, and the position and quality of the impact can be adjusted according to sample requirements. The Resonalyser procedure is a mixed numerical experimental method that requires only resonance frequencies and damping ratios. No modal shape values are required, thus full operational modal analysis or experimental modal analysis is unnecessary. Identification of the complex engineering constants with the Resonalyser procedure takes less than a second and can be executed in real-time after each completed measurement step. However, measurement of the damping ratios exhibit considerable noise, so identification is preferably done as post processing after smoothing with spline polynomials. An example on a bidirectionally glass reinforced composite material with a thermoplastic matrix PA6 revealed significant variation of all engineering constants within the tested temperature range of -20 °C to 60 °C.

Acknowledgments

The authors thank the Flemish government institute VLAIO for their financial support in the ICON research project HBC 2019.0120 (2020 – 2024) in which a functional prototype instrument was developed. VLAIO will also support the authors finding industrial partnerships for further development of the prototype.

Abbreviations

The following abbreviations are used in this manuscript:
IET Impulse Excitation Technique
IRF Impulse Response Function
DMA Dynamic Mechanical Analysis
EMA Experimental Modal Analysis
OMA Operational Modal Analysis
FE Finite Element
ASTM American Standard Testing Materials

References

  1. Jones, R. ; Mechanics of composite materials, McGraw-Hill 1975, ISBN 0-07-032790-40.
  2. Fahrettin Ozturk, Merve Cobanoglu, and Remzi Ecmel Ece, J. Thermoplastic Composite Materials, Sage Journals, December 22, 2023.
  3. Benjamin Raju, S.R. Hiremath, D. Roy Mahapatra; A review of micromechanics-based models for effective elastic properties of reinforced polymer matrix composites, Composite Structures, Volume 204, 15 November 2018, pp. 607-619.
  4. ASTM D3039; Standard test method for tensile properties of polymer matrix composite materials.
  5. ASTM D7078; Standard test method for shear properties of matrix composite materials.
  6. S. Timoshenko: Vibration Problems is Engineering, New York, USA, 1937.
  7. Sonja Kostic, Jasmina Miljojkovic, Goran Simunovic, Djordje Vukelic, Branko Tadic; Uncertainty in the determination of elastic modulus by tensile testing, Engineering Science and Technology, an International Journal 25 (2022).
  8. J.D. Lord, R.M. Morrell; Elastic Modulus Measurement, Good Practice Guide No.98, National Physical Laboratory, 2006, Elastic modulus measurement. | NPL Publications.
  9. ASTM C 1259–98; Standard test methods for dynamic Young’s modulus, shear modulus and Poisson’s ratio for advanced ceramics by impulse excitation of vibration.
  10. He, J.; Fu, Y. ; Modal Analysis, Butterworth-Heineman 2001, ISBN 0 7506 5079 6.
  11. Schalnat, J.; et al. Influencing parameters on measurement accuracy in dynamic mechanical analysis of thermoplastic polymers and their composites. Polymer testing 91, 106799 (2020).
  12. Heritage, K.; Frisby, C.; Wolfenden, A. ; Impulse excitation technique for dynamic flexural 740 measurements at moderate temperature, Review of Scientific Instruments 1988, Volume 59, pp. 973.
  13. Brebels Adriaan, Bollen Bart; Non-Destructive Evaluation of Material Properties as Function of Temperature by the Impulse Excitation Technique, Vol.20 No.6 (June 2015) - The e-Journal of Non-destructive Testing - ISSN 1435-4934.
  14. Sol H.; Identification of anisotropic plate rigidities using free vibration data, PhD. Thesis, Vrije Universiteit Brussel, October 1986.
  15. H. Sol, J. De Visscher, H. Hongxing, J. Vantomme, P.W. De Wilde ; La procedure Resonalyser, Revue des laboratoires d’essais 46, 1996.
  16. De Baer, I; Experimental and Numerical Study of Different Setups for Conducting and Monitoring Fatigue Experiments of Fibre-Reinforced Thermoplastics, PhD thesis University Ghent, Belgium, 2008.
  17. T. Lauwagie, H. Sol, W. Heylen; Handling uncertainties in mixed numerical-experimental techniques for vibration-based material identification, Journal of Sound and Vibration 291 (2006) pp. 723–739.
  18. Sol, H., De Visscher, J., De Wilde, W.P.; The Resonalyser method: a non-destructive method for stiffness identification of fiber reinforced composite materials, Non-Destructive Testing, Balkema 728 1996, pp. 237-242, ISBN 90 5410 595.
  19. Lauwagie T., Sol H., Roebben G., Heylen W., Shi Y.; Validation of the Resonalyser method: an inverse method for material identification, Proceedings of ISMA 2002, International Conference on 734 Noise and Vibration Engineering, Leuven, 16-18 Sept. 2002, pp. 687-694.
  20. De Visscher, J. ; Identification of the complex stiffness matrix of orthotropic materials by a mixed numerical experimental method, PhD. Thesis, Vrije Universiteit Brussel, Belgium, February 1995. [Google Scholar]
  21. Deobald, L.R. , Gibson R.F.; Determination of elastic constants of orthotropic plates by a modal 719 analysis/Rayleigh-Ritz technique, Journal of Sound and Vibration, Volume 124, Issue 2, 22 June 1988, pp. 269-283.
  22. P. Pederson, P.S. Frederiksen; Identification of orthotropic material moduli by a combined experimental/ numerical approach, Measurement 10 (1992) pp.113–118.
  23. E.O. Ayorinde, R.F. Gibson; Elastic constants of orthotropic composite materials using plate resonance frequencies, classical lamination theory and an optimized three mode Rayleigh formulation, Composite Engineering 3 (1993) pp. 395–407.
  24. F. Moussu, M. Nivoit; Determination of the elastic constants of orthotropic plates by a modal analysis method of superposition, Journal of Sound and Vibration 165 (1993) pp. 149–163.
  25. P.S. Frederiksen; Estimation of elastic moduli in thick composite plates by inversion of vibrational data, Proceedings of the Second International Symposium on Inverse Problems, Paris, 1994, pp. 111–118.
  26. E.O. Ayorinde; Elastic constants of thick orthotropic composite plates, Journal of Composite Materials 29 (1995) pp. 1025–1039.
  27. De Visscher, J., Sol, H., De Wilde, W.P., Vantomme, J.; Identification of the damping properties of 736 orthotropic composite materials using a mixed numerical experimental method, Applied Composite 737 Materials, Volume 4, Kluwer Academic Publishers 1997.
  28. H. Sol, H. Hua, J. De Visscher, J. Vantomme, W.P. De Wilde; A Mixed numerical/experimental technique for the non-destructive identification of the stiffness properties of fibre reinforced composite materials, Journal of NDT&E International 30 (2) (1997) pp. 85–91.
  29. J. Cunha ; Application des techniques de recalage en dynamique a l’identification des constantes elastiques des materiaux composites, Thèse PhD., Université de Franche-Comté, France, 1997.
  30. Guan-Liang Qian, Suong V. Hoa and Xinran Xiao; A vibration method for measuring mechanical properties of composite, theory and experiment, Composite Structures, Volume 39, Issues 1-2, September-October 1997, Pages 31-38.
  31. H. Sol, C. Oomens; Material Identification Using Mixed Numerical Experimental Methods, Kluwer Academic Publishers, Dordrecht, 1997.
  32. Sol, H. , De Visscher, J., De Wilde, W.P.; A mixed numerical/experimental technique for the nondestructive identification of the stiffness properties of fiber reinforced composite materials. NDT & E International, Volume 30, Issue 2, April 1997, pp. 85-91.
  33. De Visscher, J. , Sol, H., De Wilde, W.P., Vantomme, J.; Identification of the damping properties of orthotropic composite materials using a mixed numerical experimental method, Applied Composite Materials, Volume 4, Kluwer Academic Publishers 1997.
  34. Shun-Fa Hwang and Chao-Shui Chang; Determination of elastic constants of materials by vibration testing, Composite Structures, Volume 49, Issue 2, June 2000, pp. 183-190.
  35. G.R. Liu, K.Y. Lam, X. Han; Determination of elastic constants of anisotropic laminated plates using elastic waves and a progressive neural network, Journal of Sound and Vibration 52 (2) (2002) pp. 239–259.
  36. K. G. Muthurajan a, K. Sanakaranarayanasamy b and B. Nageswara Rao; Evaluation of elastic constants of specially orthotropic plates through vibration testing, Journal of Sound and Vibration, Volume 272, Issues 1-2, 22 April 2004, pp. 413-424.
  37. Emmanuel, O. Ayorinde and Lin Yu; On the elastic characterization of composite plates with vibration data, Journal of Sound and Vibration, Volume 283, Issues 1-2, 6 May 2005, pp. 243-262.
  38. Marco Alfano and Leonardo Pagnotta; Determining the elastic constants of isotropic materials by modal vibration testing of rectangular thin plates, Journal of Sound and Vibration, Volume 293, Issues 1-2, 30 May 2006, pp. 426-439.
  39. Julien Caillet, Jean Claude Carmona and Daniel Mazzoni; Estimation of plate elastic moduli through vibration testing, Applied Acoustics, Volume 68, Issue 3, March 2007, pp. 334-349.
  40. K. Bledzki, A. Kessler, R. Rikards and A. Chate; Determination of elastic constants of glass/epoxy unidirectional laminates by the vibration testing of plates, Composites Science and Technology, Volume 59, Issue 13, October 1999, pp. 2015-2024.
  41. T. Lauwagie, H. Sol, W. Heylen; Handling uncertainties in mixed numerical-experimental techniques for vibration-based material identification, Journal of Sound and Vibration, Volume 291, pp. 723-739 (2006).
  42. M. Bottiglieri and H. Sol; Identification of the elastic properties on composite materials as a function of temperature, Proceedings of PACAM XI 11th Pan-American Congress of Applied Mechanics, January 04-08, 2010, Foz do Iguaçu, PR, Brazil.
  43. S. Chandra, M. Maeder, J. Bienert, H. Beinersdorf, W. Jiang, V.A. Matsagar, S. Marburg; Identification of temperature-dependent elastic and damping parameters of carbon-epoxy composite plates based on experimental modal data, Mechanical Systems and Signal Processing, 1 March 2023.
  44. T. Lauwagie, K. Lambrinou, H. Sol, W. Heylen; Resonant-Based Identification of the Poisson’s Ratio of Orthotropic Materials, Experimental Mechanics, Volume 50, pp. 437–447, (2010).
  45. Pierron, F., Grediac, M.; The virtual fields method, Springer 2012, ISBN 978 1 7614 1825 8.
  46. Hugo Sol, Hubert Rahier, Jun Gu; Prediction and Measurement of the Damping Ratios of Laminated Polymer Composite Plates, MDPI, Materials (Basel), Materials, Volume 13, Issue 152020, 2020.
  47. Bytec, BV; Theoretical background and examples of the Resonalyser procedure.
  48. Hugo, J.B. Sol and Jun Gu; Combined tensile and dynamic testing for the accurate measurement of mechanical properties of composite materials, SAMPE Europe Conference 2022 Hamburg, Germany.
  49. Cengel, Y; Heat transfer, a practical approach, McGraw-Hill ISBN 0-07-011505-2, 1998.
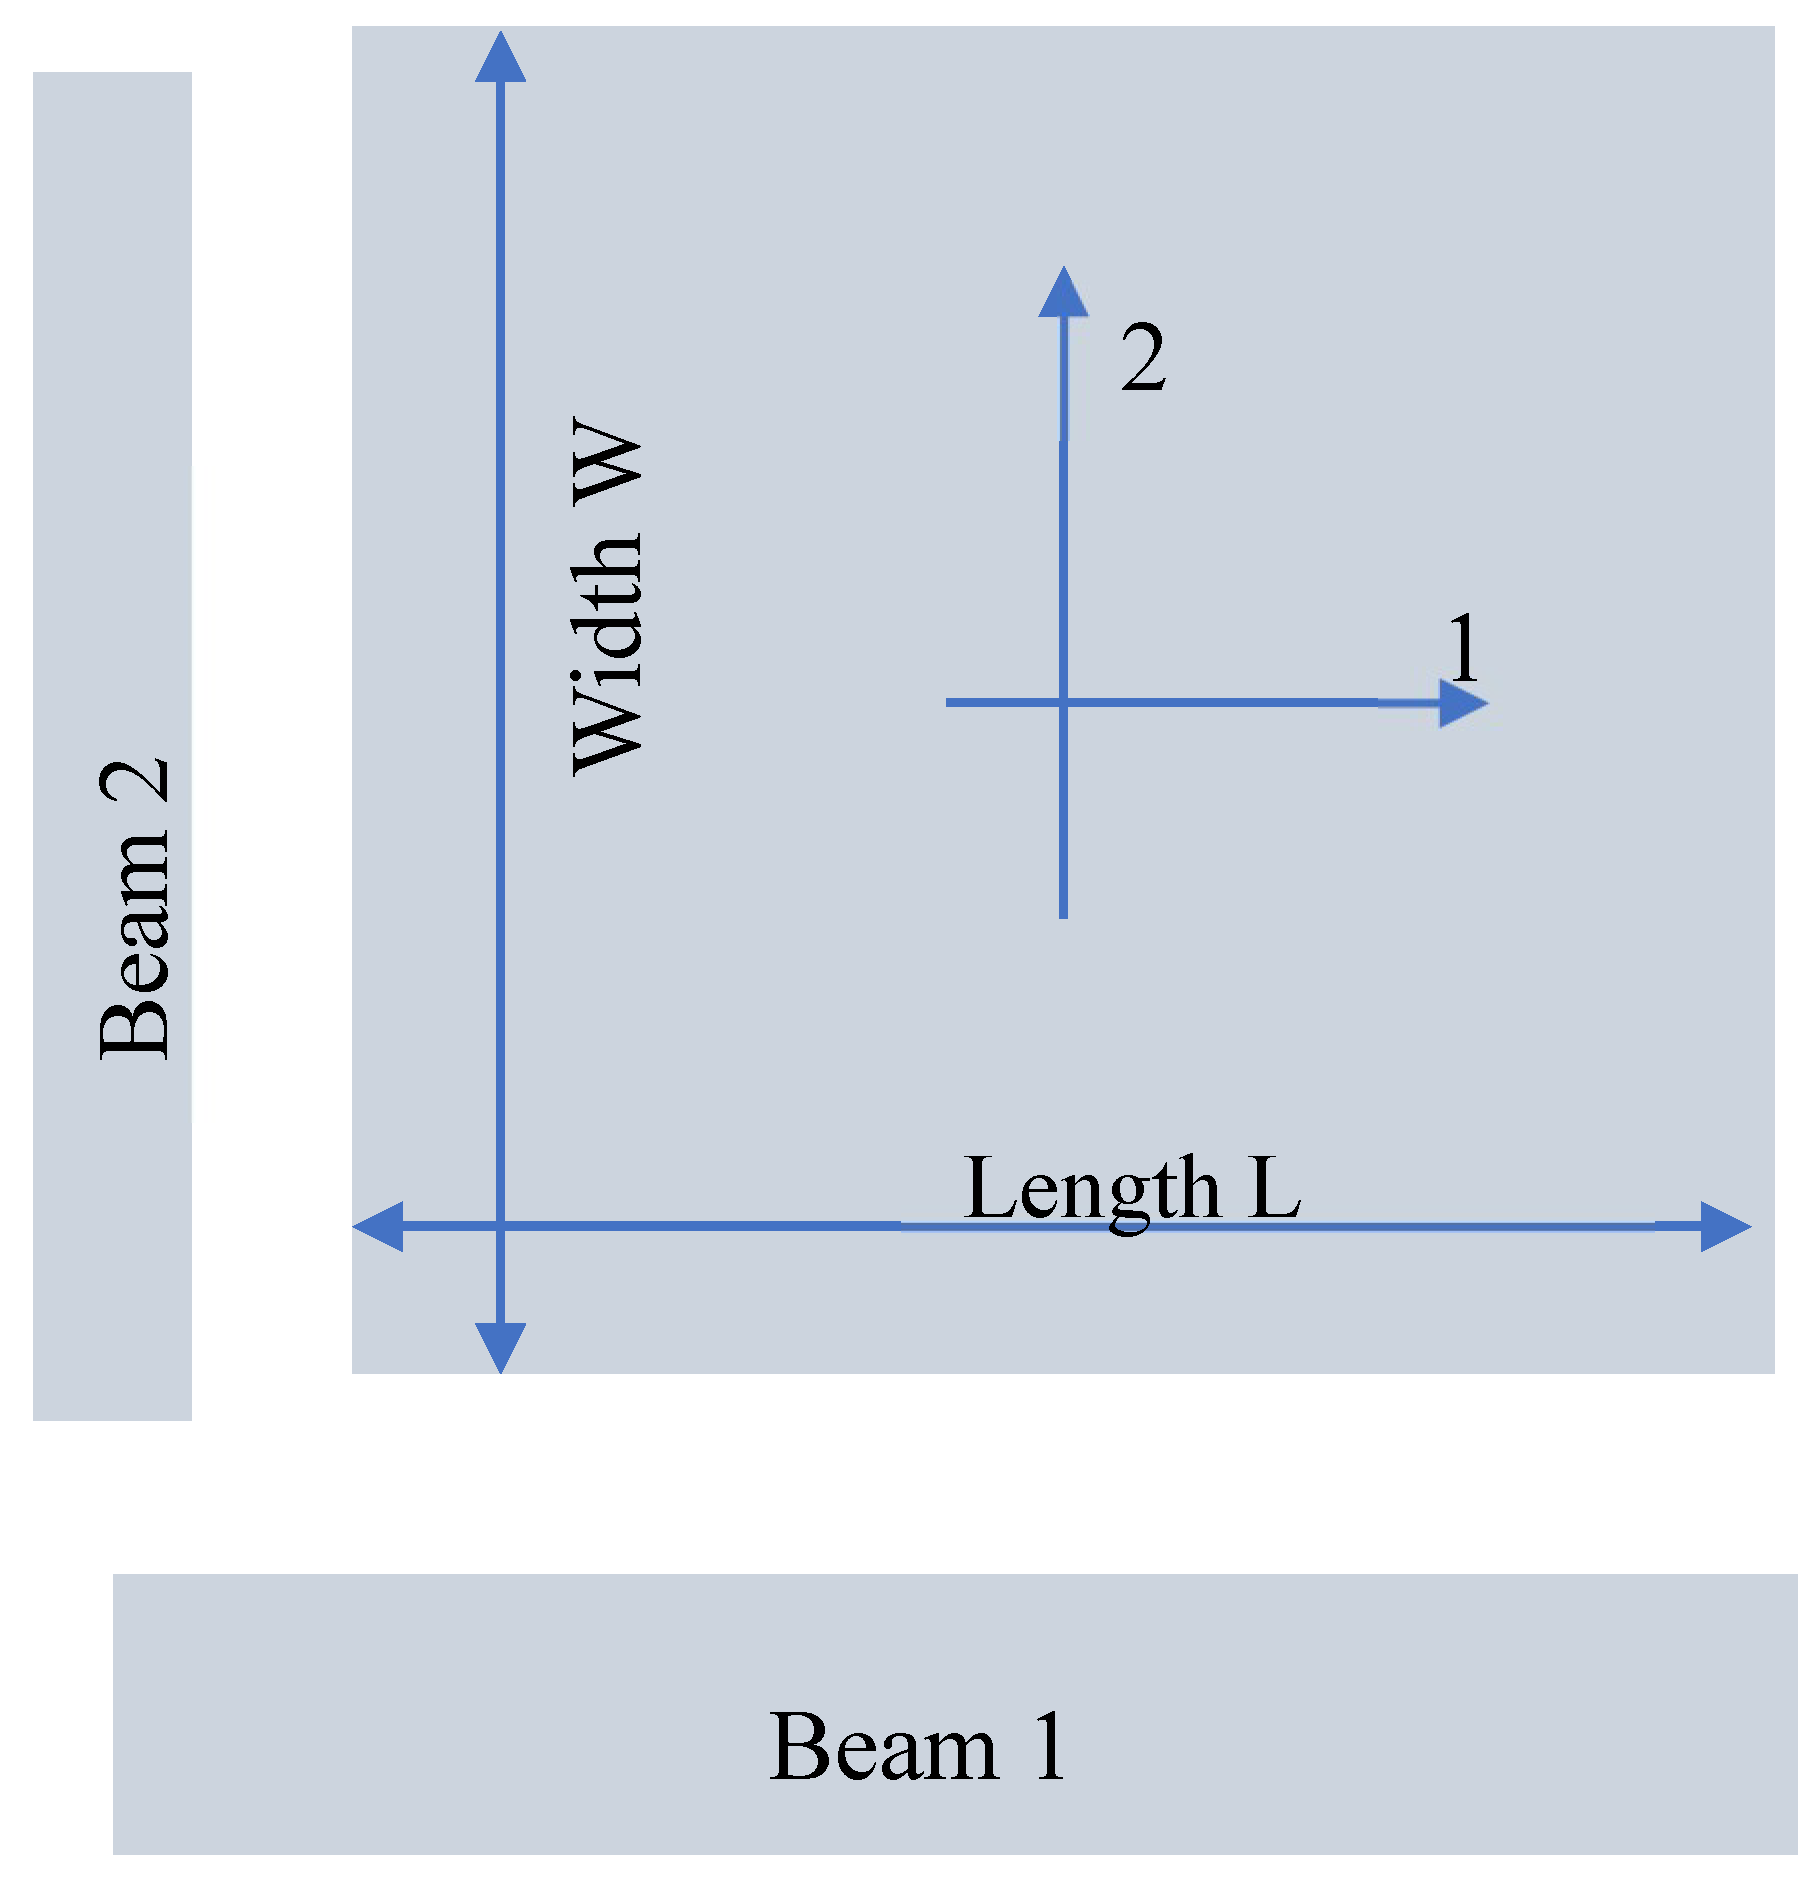
Figure 1. Two test beams cut along the two orthotropic directions 1 and 2, and a rectangular test plate with edges parallel to the orthotropic material directions.
Preprints 150163 g001
Figure 2. Torsion (a), Saddle (b) and Breathing (c) Vibration modes of a Poisson plate. The frequencies associated with these modes are mainly sensitive to the indicated engineering constants below the figures.
Preprints 150163 g002
Figure 3. Decaying sinusoidal time domain signal after impulse excitation.
Preprints 150163 g003
Figure 4. Resonalyser room temperature setup: Portable flight case with an adjustable aluminum suspension frame and a PC with automated measuring and identification software (USB connection with signal conditioning box).
Preprints 150163 g004
Figure 5. The created digital twin is capable to reproduce the IRF.
Preprints 150163 g005
Figure 6. Different stress-strain values for modulus testing with a tensile bench and with IET.
Preprints 150163 g006
Figure 7. Result screen shot of the Resonalyser software.
Preprints 150163 g007
Figure 8. Different stages of pendulum impact.
Preprints 150163 g008
Figure 9. position for suspension wires and excitation position for the flexural vibration of a beam and the torsion and breathing vibration modes of a Poisson plate.
Preprints 150163 g009
Figure 10. A simple temperature and time stepping program starting at an isothermal state with temperature TA towards temperature TB.
Preprints 150163 g010
Figure 11. A temperature and time stepping program with an overshoot temperature.
Preprints 150163 g011
Figure 12. Climate chamber with pendulum units on channels 1 and 2.
Preprints 150163 g012
Figure 13. The thermoplastic PA6 plate is bidirectionally reinforced with Organo glass fabric. The two in-plane orthotropic directions are indicated as 1 and 2.
Preprints 150163 g013
Figure 14. Measured resonance frequencies and damping ratios in a temperature interval starting at -20 °C and ending at 60 °C. (a) are the graphs for the torsion modal shapes, (b) for the breathing modal shape, (c) for Beam 1 and (d) for Beam 2.
Preprints 150163 g014
Figure 15. Orthotropic engineering constants as a function of temperature: (a) Young’s modulus E1 and tangents delta E1.
Preprints 150163 g015
Table 1. Sizes and mass of the tested test samples.
Length
[m]
Width
[m]
Thickness
[m]
Mass
[kg]
Plate 0.282 0.2760 0.00315 0.4198
Beam 1 0.300 0.0193 0.00315 0.0213
Beam 2 0.281 0.0206 0.00315 0.0313
Disclaimer/Publisher’s Note: The statements, opinions and data contained in all publications are solely those of the individual author(s) and contributor(s) and not of MDPI and/or the editor(s). MDPI and/or the editor(s) disclaim responsibility for any injury to people or property resulting from any ideas, methods, instructions or products referred to in the content.
Copyright: This open access article is published under a Creative Commons CC BY 4.0 license, which permit the free download, distribution, and reuse, provided that the author and preprint are cited in any reuse.
Prerpints.org logo

Preprints.org is a free preprint server supported by MDPI in Basel, Switzerland.

Subscribe

Disclaimer

Terms of Use

Privacy Policy

Privacy Settings

© 2025 MDPI (Basel, Switzerland) unless otherwise stated