Preprint
Article

This version is not peer-reviewed.

Health Risk Assessment of Date Palm Trees with Aerial Roots in Taiwan

A peer-reviewed article of this preprint also exists.

Submitted:

21 February 2025

Posted:

21 February 2025

You are already at the latest version

Abstract

This study assessed the health risks of date palms in Taiwan with aerial root growth using visual tree assessment and non-destructive testing. Key external defects included leaning and insect damage, while acoustic tomography confirmed internal structural variability but required accuracy improvements. Drilling resistance tests showed that healthy trees had the highest resistance near the bark, decreasing toward the center, while decayed trees exhibited significant amplitude reductions. The phenomenon of aerial root growth on the outer side of the trunk is presumed to be a growth response of the tree to adapt to environmental changes, while the distinct dark wood band between the decayed and sound wood in the cross-section is likely a result of wood variation. These findings highlight the need for comprehensive tree health assessments and provide a scientific basis for improved urban tree management and conservation.

Keywords: 
;  ;  ;  ;  ;  ;  

1. Introduction

The date palm (Phoenix dactylifera Linn.) is an important street tree in Taiwan, significantly enhancing the beautification of urban and rural landscapes. However, as an ornamental tree, it faces potential risks due to its unique structural characteristics. The stability of date palms differs from coniferous or broadleaf trees, increasing the risk of overturning during strong winds or extreme weather. Additionally, they are susceptible to pests and diseases that threaten their health and the surrounding environment. Regular inspection and maintenance are essential, and professional arborists can conduct health risk assessments to ensure the trees’ safety.
Despite their significance, comprehensive risk assessment information for date palms is lacking. Aerial roots, known as respiratory roots, extend from the trunk, allowing the tree to absorb moisture and nutrients from the air, which enhances survival under drought and high temperatures. Literature indicates that these roots typically do not affect the tree’s structural integrity [1,2]. However, the internal condition of the trunk remains unclear, necessitating assessments to better understand their health status.
The Visual Tree Assessment (VTA) is a systematic method for evaluating tree health and potential hazards through visual inspection of the trunk, crown, root system, and surrounding environment. This process allows arborists to identify signs of decay, pests, or other abnormalities quickly, facilitating timely management actions [3,4].
Advanced inspections utilize Non-Destructive Testing (NDT) techniques, such as Acoustic Tomography and Drilling Resistance, to assess a tree’s internal structure without causing damage [5,6,7]. Acoustic Tomography detects internal cavities by sending sound waves into the tree, providing a visual image of its internal structure [8]. This method is effective for decay detection in urban trees [9], though its accuracy can be influenced by various factors.
The Drilling Resistance method involves creating small drill holes to measure resistance at different depths, helping interpret tomographic images and assess wood structure [10,11,12,13]. Combining these techniques offers a comprehensive assessment of tree health, ensuring safety in urban and rural environments.
During inspections of date palm trees, noticeably inclined trees and the presence of aerial roots were observed (Figure 1). While surveying trees in the Pingtung area, we noted that aerial roots developed at varying heights (<1.3 m above ground) and quantities around the trunks. These roots extend from the bulbous base and aid in water absorption, enhancing stability. However, excessive growth may negatively impact health and lead to trunk deformation, posing safety challenges. Thus, professionals must pay special attention to aerial roots during inspections [14,15].
This study aimed to inspect the structural condition and hazards of Phoenix dactylifera trees with aerial roots. The VTA method was first employed to identify potential hazardous defects. Next, sonic tomography assessed the trunk’s cross-sectional condition based on lateral stress wave velocity, followed by the drilling resistance method to analyze the trunk’s cross-section. Finally, selected trees were felled for visual examination of cross-sectional discs. The collected data provide valuable references for arboricultural science in tree risk assessment.

2. Materials and Methods

2.1. Experimental Procedure

This experiment was conducted in the environment of Pinga Highway in Pingtung, Taiwan, targeting date palm (Phoenix dactylifera) street trees. First, the Visual Tree Assessment (VTA) method was used to inspect the trees, following the ISA basic tree risk assessment form to check for hazardous defects. A total of 372 date palm street trees underwent VTA inspection to identify visual defects. Subsequently, 30 trees without visible damage defects and 1 tree with decay and hollowness were selected for acoustic imaging to detect the cross-section of the trunk, obtaining 2D tomographic images of stress wave velocity.
Next, a drilling resistance instrument was used to conduct drilling resistance tests on 5 trees without visible damage defects, collecting drilling resistance amplitude data. With the consent of the tree management unit, one tree without visible damage defects and one tree with decay and hollowness were felled. Discs 15 cm thick were cut from their cross-sections and placed in the laboratory to air dry. The drilling resistance instrument was then used to test these discs, obtaining drilling resistance amplitude profile data from one undamaged disc and one decayed hollow disc, measured from the east, south, west, and north directions towards the center of the trunk along the bark.

2.2. Acoustic Tomography Testing

Acoustic tomography imaging was conducted using the Fakopp 3D stress wave detection system (Fakopp Enterprise Ltd., Hungary, v6.5 [16]), aiming to construct 2D tomographic images of the cross-sections of 30 date palms without visible damage defects and 1 tree with decay and hollowness. The operation of the instrument and software followed the user manual [16]). The method measures the transmission time and sound speed of stress waves to obtain raw data for 2D tomographic image processing. The Fakopp 3D tomograph consists of 8 sensors, which are evenly spaced around the circumference of the trunk cross-section on a horizontal plane.
Under the operation of ArborSonic 3D software (Fakopp Enterprise Ltd., Hungary), the 2D tomographic images of stress wave velocity across the tree cross-section were generated. By repeatedly striking each sensor with a steel hammer, sound transmission data was collected, resulting in a complete data matrix at each testing location. The software automatically calculates the stress wave velocity values to obtain the 2D tomographic images of lateral stress wave velocity. The Fakopp stress wave tomography system was used to conduct acoustic tomography tests on date palms, with the analysis method detailed in Figure 2.

2.3. Drilling Resistance Testing

In this study, a drilling resistance device (RESI PD500, IML Company, Kennesaw, Georgia, USA) was used to test 5 trees without visible damage defects during the standing tree phase. Additionally, one undamaged disc and one decayed hollow disc obtained after felling were used as test samples. Drilling tests were conducted on the cross-sections of the trunks in the east, south, west, and north directions. The drilling was performed from the bark towards the center of the tree to obtain drilling resistance amplitude profile data.
The aim was to compare and correlate these profile data with the 2D tomographic images and the surfaces of the trunk cross-section discs, thereby understanding the areas of undamaged decay, varying degrees of decay, and hollowness on the cross-section. The drilling resistance parameters were set to obtain one resistance amplitude value every 0.1 mm, with a feed rate of 100 cm/min and a drill speed of 3500 RPM.

2.4. Visual Inspection of Disc Cross-Sections

After inspecting the trees using the Visual Tree Assessment (VTA) method, 7 date palm street trees were identified as having immediate hazards and were subsequently felled for removal. Samples were taken from the felled trees in the form of discs. After surface treatment of the disc cross-sections, visual observations were made to check for undamaged defects, varying degrees of decay, hollowness, aerial roots, and other phenomena.

3. Results

3.1. Visual Tree Assessment

A total of 372 date palm street trees underwent Visual Tree Assessment (VTA), with an average tree height of 768.4 cm and a diameter at breast height (DBH) of 36.4 cm, having standard deviations of 24.4 cm and 5.0 cm, respectively. The inspection results indicated that the main external defects of the trees included: 1 tree with top dieback, 25 trees with leaning, 27 trees with bark beetle damage or decay on the trunk’s exterior, and 1 tree with hollowness, totaling 4 defect categories. In total, 40 trees exhibited one or more of these four hazardous defect categories, with individual trees potentially having multiple defects.

3.2. Aerial Root Observations

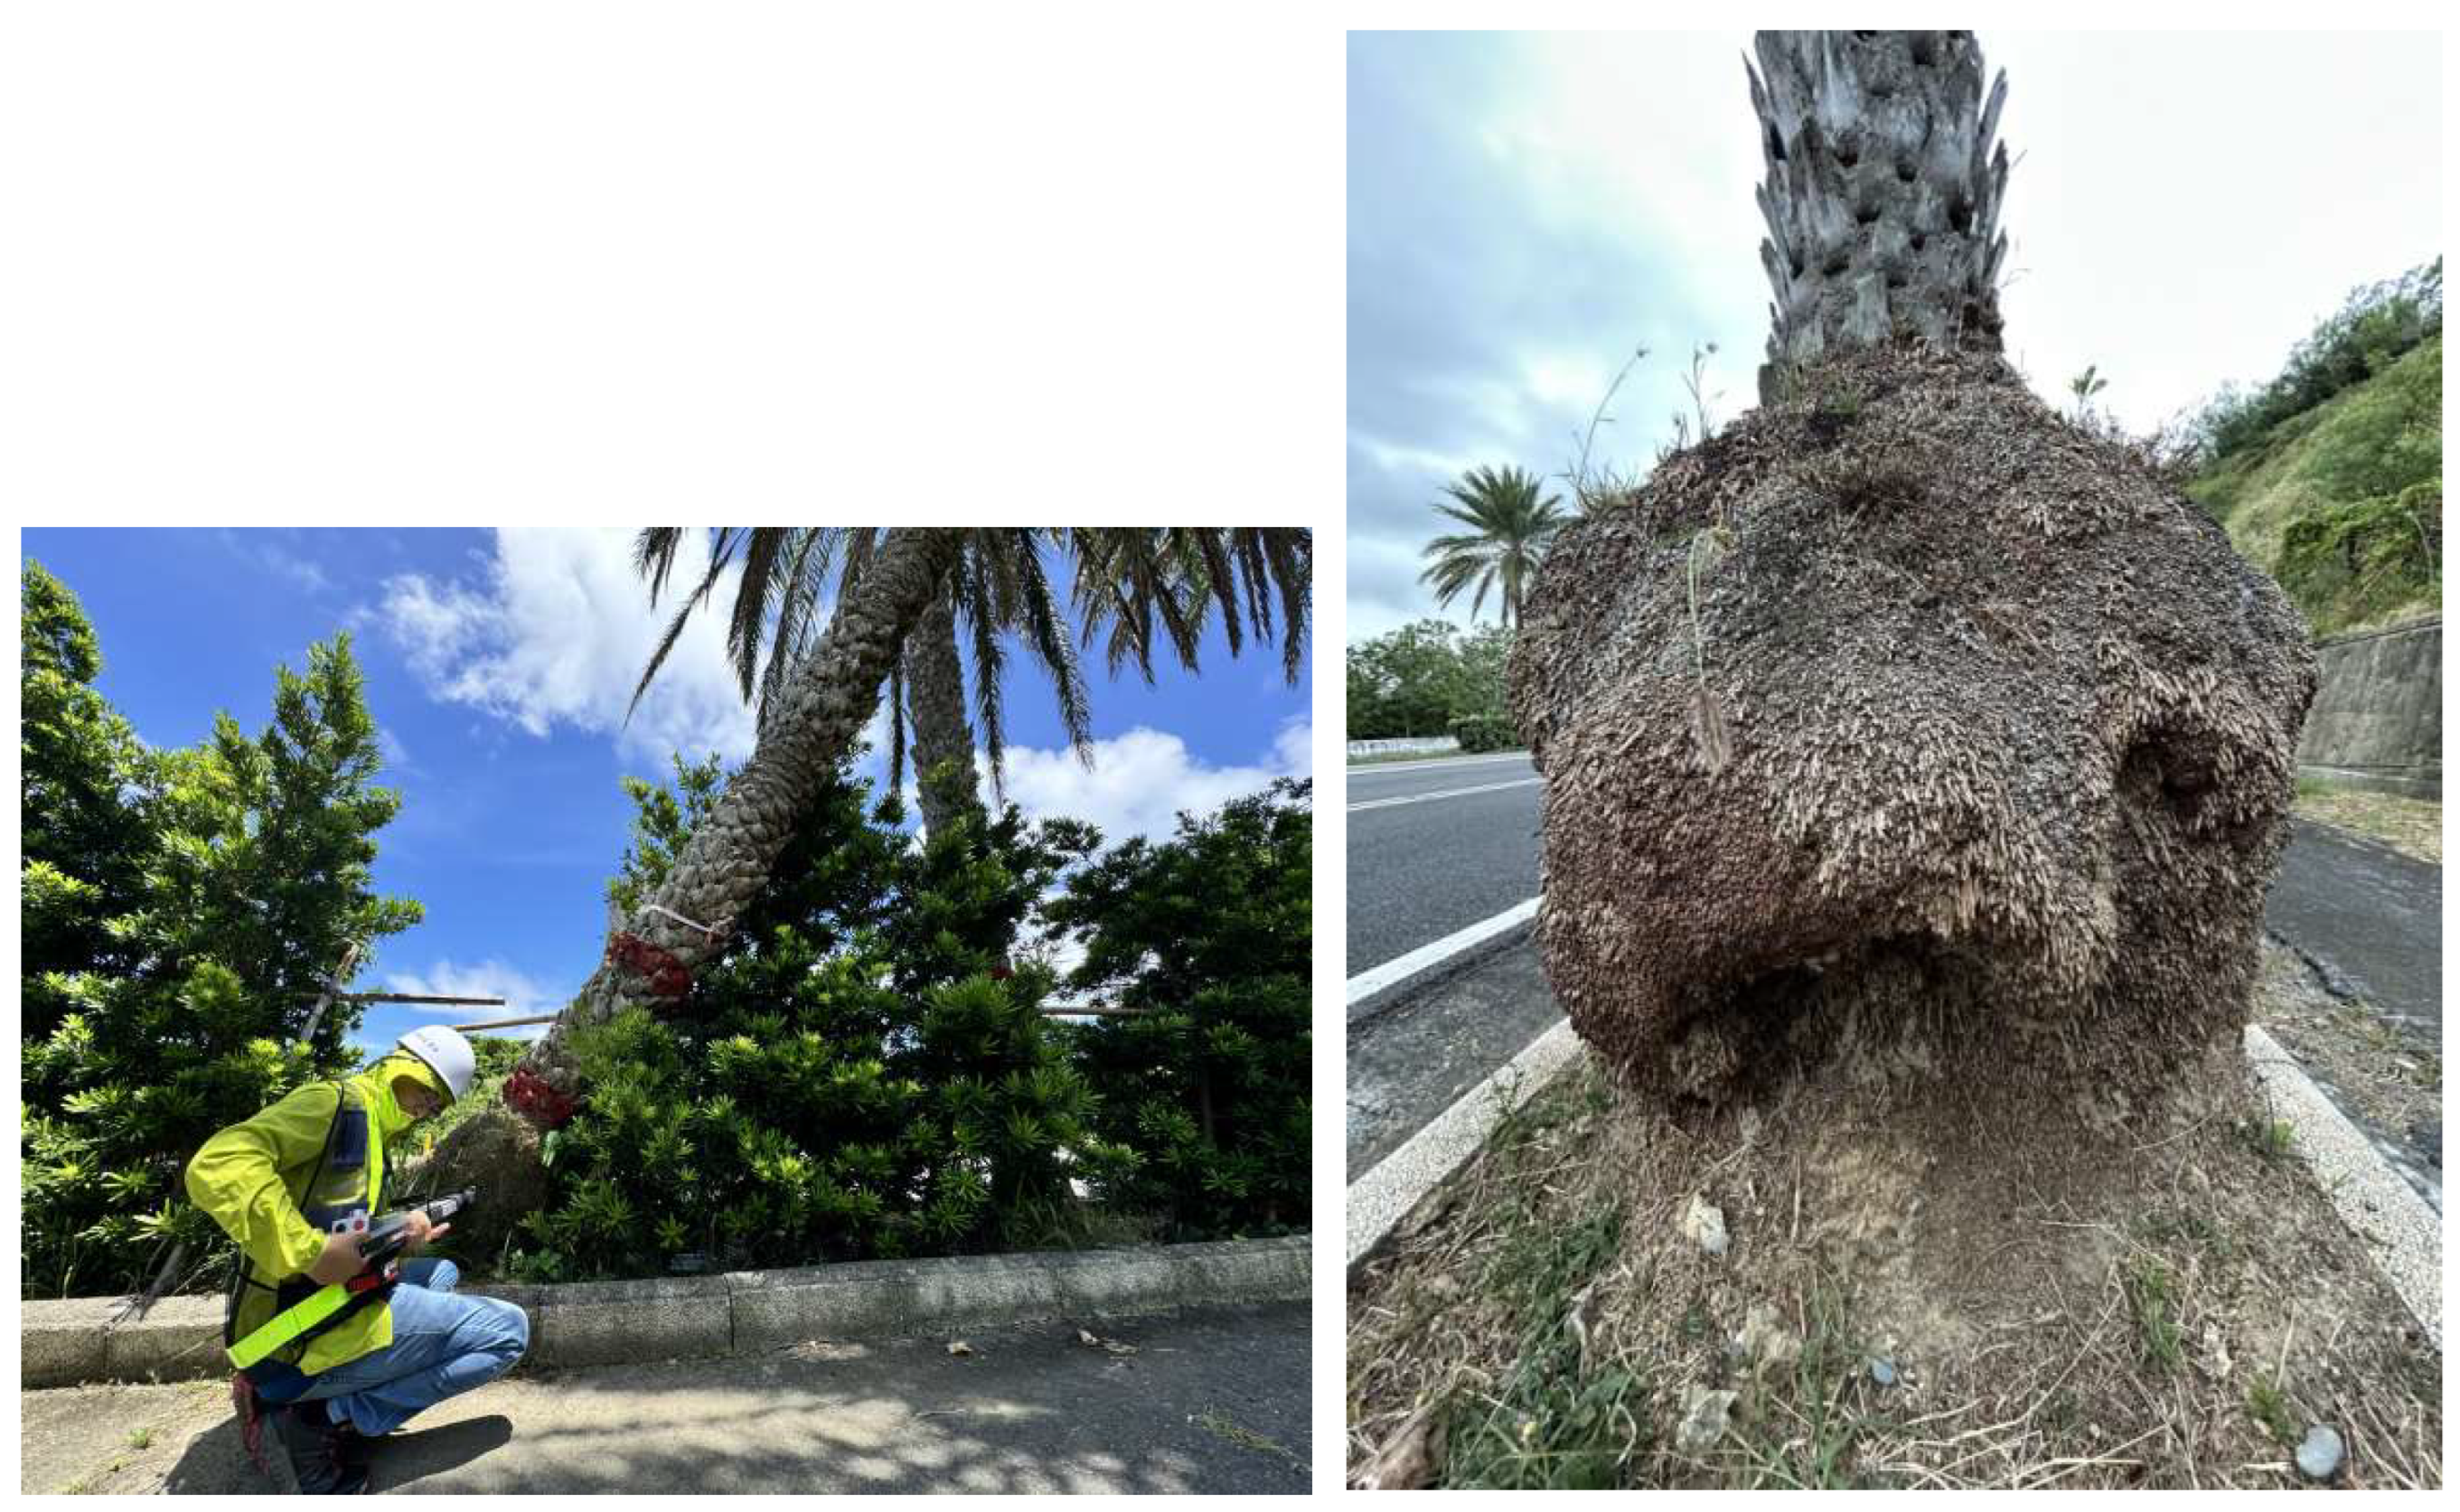
Additionally, among the 368 date palms, aerial root growth was observed around the trunk at various heights below approximately 1.3 meters from the ground, with an average growth height of 89.4 cm and a standard deviation of 3.6 cm. Only 4 trees did not exhibit aerial root growth. Therefore, the primary issues identified in the visual assessment of tree defects were the leaning of the trees and the bark beetle damage or decay on the trunk’s exterior. Following the inspection of these trees with visible defects, non-destructive testing and evaluation of the internal conditions will be conducted using other instruments.

3.3. Acoustic Tomography Analysis

After conducting acoustic tomography testing on 30 undamaged date palm trees, data on lateral stress wave velocities were collected. Table 1 presents the results of the lateral stress wave velocities (V) for these trees, including the maximum velocity (Vmax), average velocity (Vmean), and minimum velocity (Vmin). The data indicate that the stress wave velocities of the trees range from 770 m/s to 2159 m/s, demonstrating variability in the internal structure of the trees.
Specifically, the average stress wave velocity (Vmean) is 1651.7 m/s, suggesting that the overall health of these trees is good. However, the minimum stress wave velocity (Vmin) is 510 m/s, indicating that some trees may have weaknesses in their internal structure. The standard deviation (SD) is 236.7, reflecting the degree of variability in stress wave velocities among the trees.
Further analysis of the data reveals that the diameter of the trees has a certain impact on stress wave velocity. For trees with diameters ranging from 28.0 to 45.9 cm, the stress wave velocity varies with increasing diameter. Trees with diameters between 28.0 and 35.0 cm have an average stress wave velocity of approximately 1200 m/s, indicating relatively low structural stability. As the diameter increases to 35.1 to 40.0 cm, the average stress wave velocity rises to about 1500 m/s, indicating good structural health. For trees with diameters from 40.1 to 45.9 cm, the average stress wave velocity exceeds 1800 m/s, demonstrating superior structural strength and health.
These results indicate a relationship between tree diameter and stress wave velocity, with larger diameter trees typically showing higher stress wave velocities, reflecting their internal structural health and stability. This data provides important references for subsequent tree health assessments and management, particularly in identifying potential diseases and structural issues. By analyzing the stress wave velocities of trees with different diameters, more effective tree protection and management strategies can be developed.

3.4. Stress Wave Imaging of Decayed Date Palm

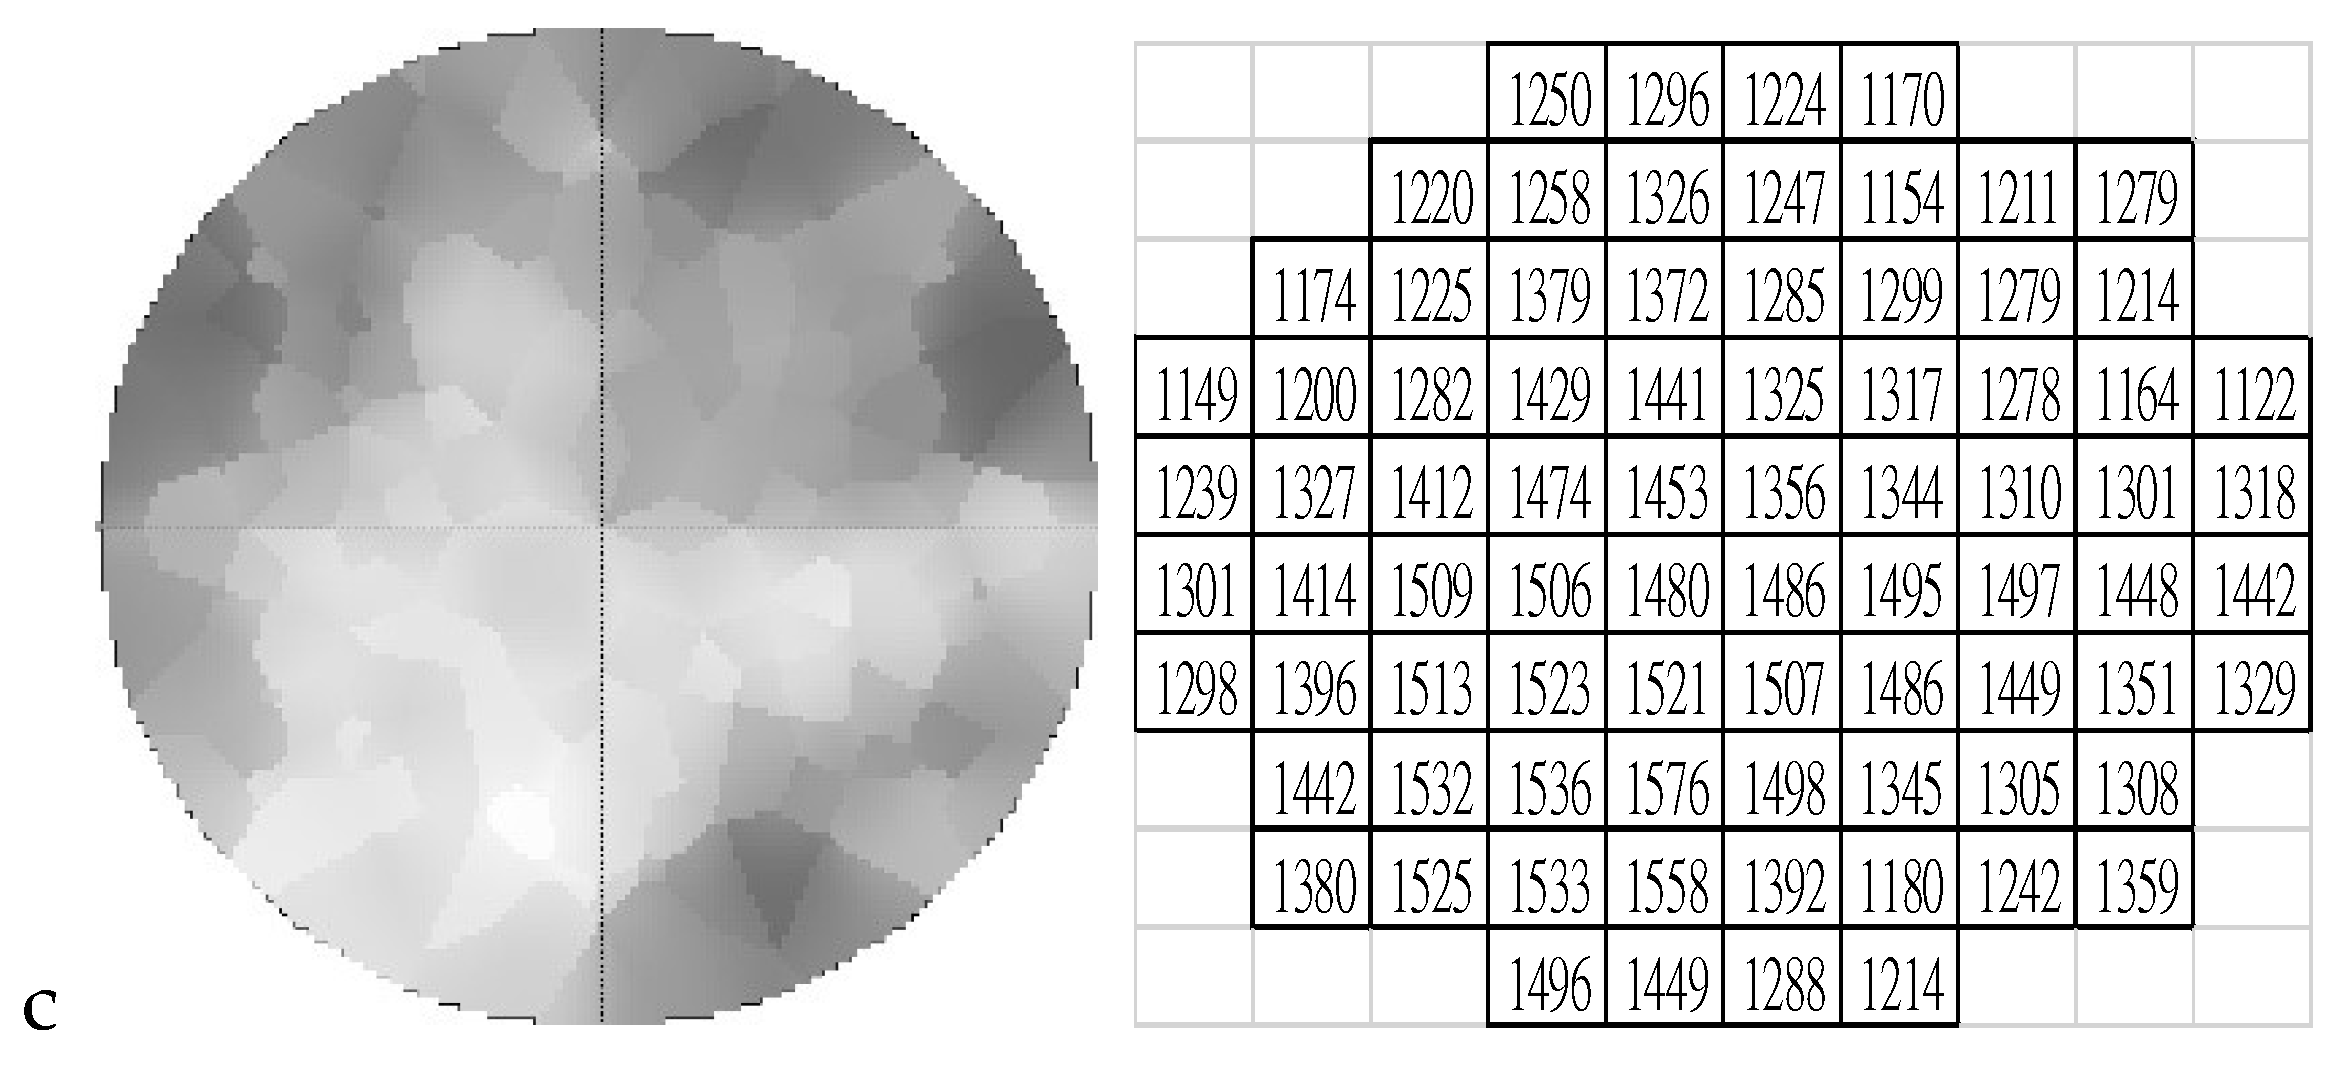
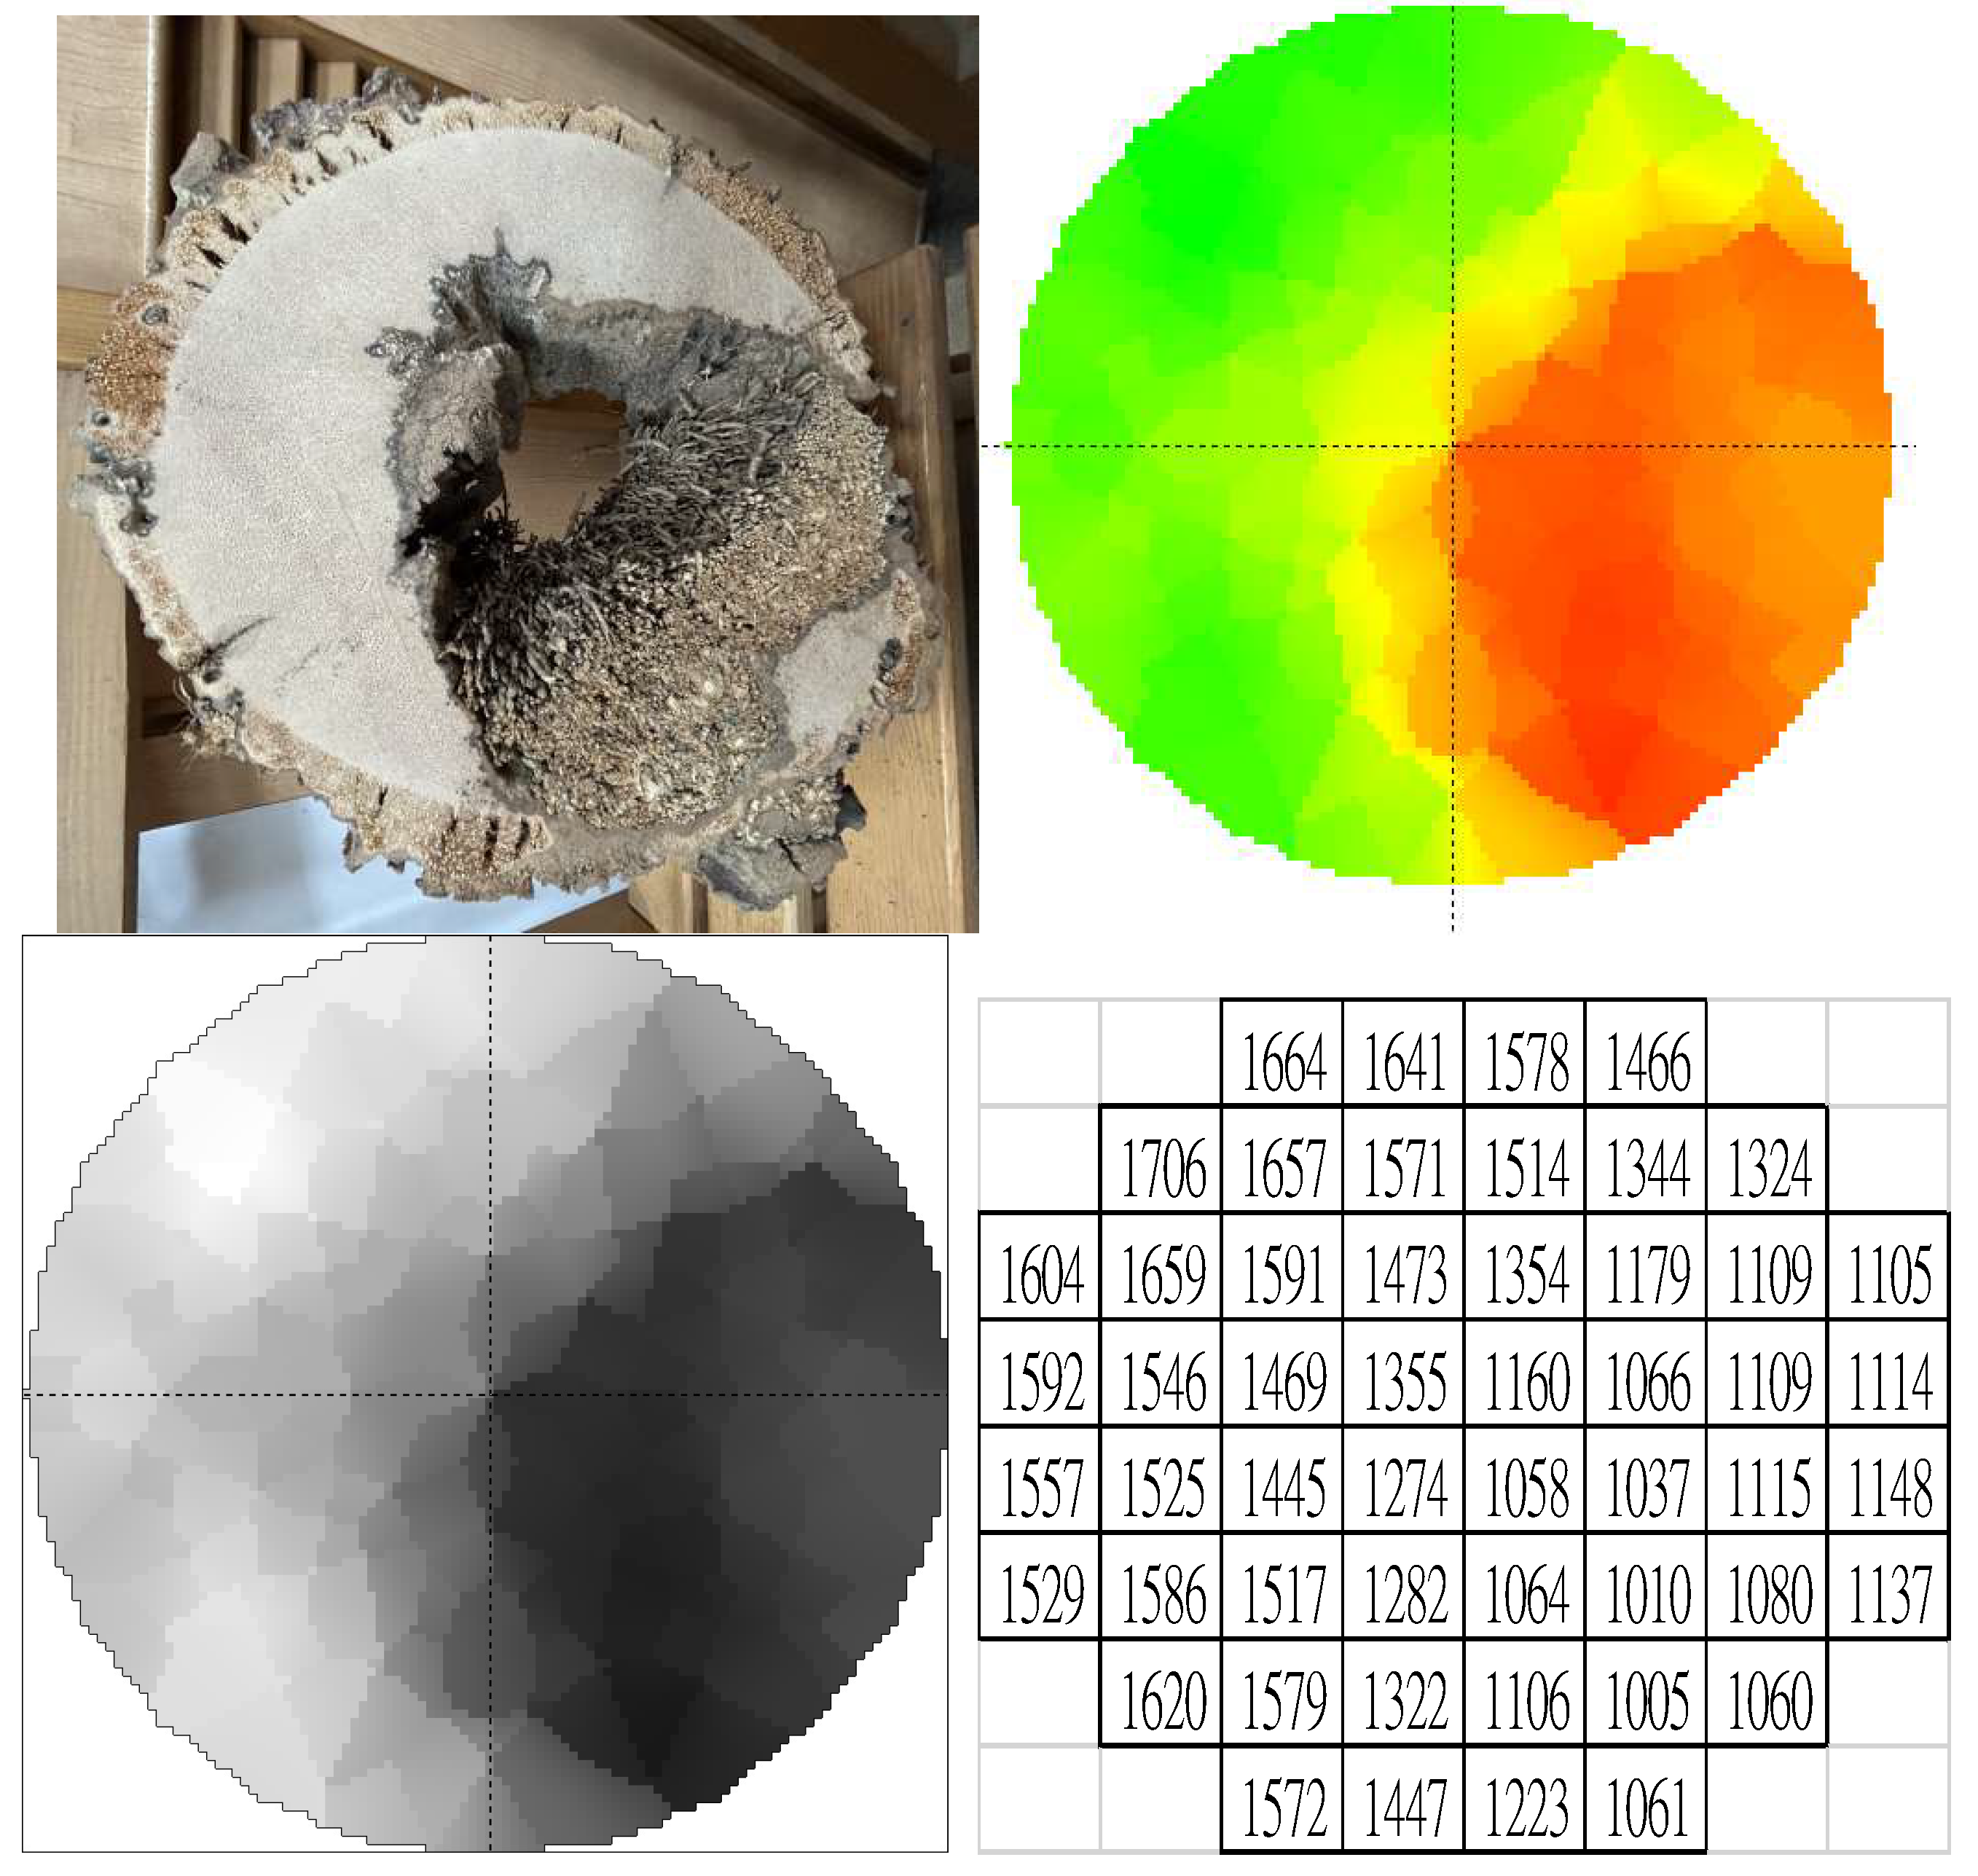
In this study, we conducted stress wave imaging testing on a date palm tree with decayed hollow damage. After completing the assessment, the tree was felled, and a cross-section was taken to observe the extent of the decay and hollow damage. Through this process, we were able to visually understand the internal structural condition of the tree and compare it with the results from the stress wave two-dimensional images.
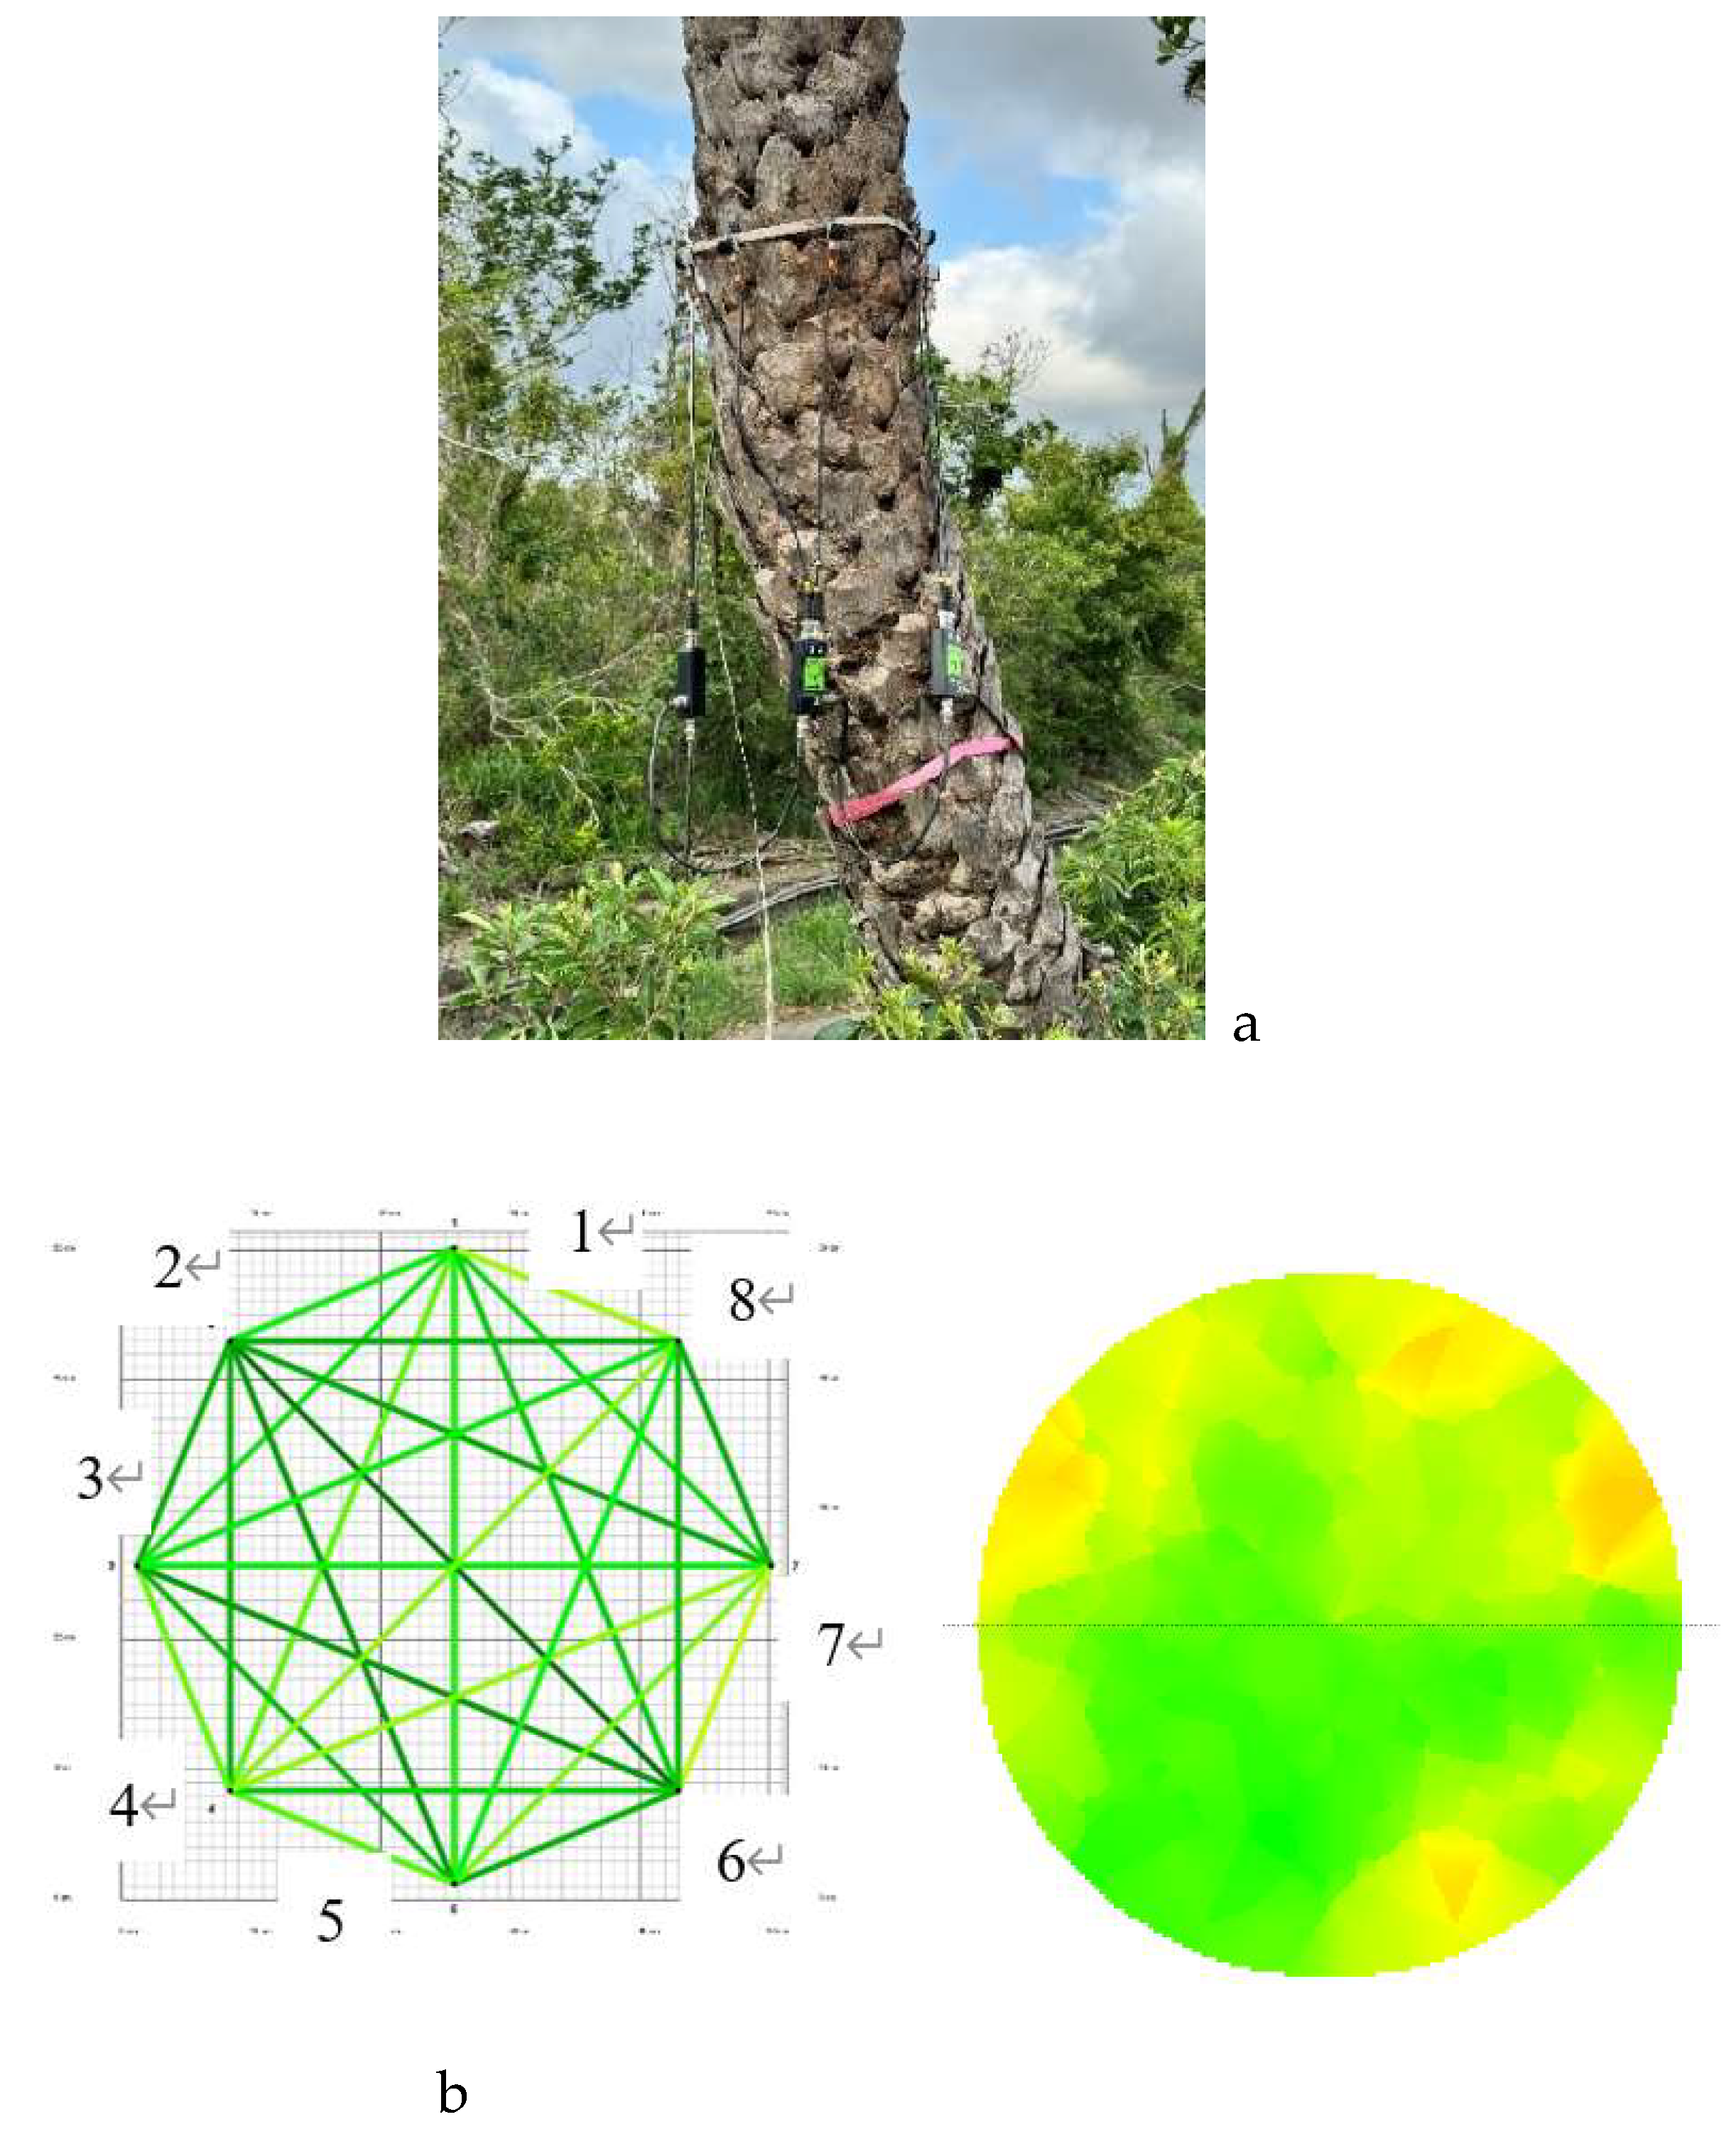
Firstly, the cross-section of the disc clearly displayed significant decay cavities, with the extent and location of the damage corresponding to the distribution of stress wave speeds shown in the 2D image grids (Figure 3). The two-dimensional image of stress wave speeds utilized a color scale of green, yellow, and red, indicating variations from the highest to the lowest speeds, ranging from 899 m/s to 1733 m/s. This data provided detailed information about the internal structure of the tree, allowing us to determine the specific locations of the decay cavities and their impact on the overall health of the tree.
Additionally, we created a grayscale diagram of stress wave speeds, which clearly illustrated the variations in stress wave speeds across the cross-section of the trunk, complemented by the corresponding stress wave speed image grid (30 x 30 mm). This made the assessment of internal damage and its location more accurate. These results not only validated the effectiveness of stress wave imaging in tree health assessment but also provided important references for subsequent tree management and protection. By comparing cross-sectional observations and stress wave imaging, a more comprehensive understanding of the tree’s decay condition can be gained, thereby facilitating the formulation of more effective management strategies.
When comparing the range of stress wave speeds for decayed hollow trees (899 m/s to 1733 m/s) with that of healthy trees (864 m/s to 1651.7 m/s), it was found that the speeds of the decayed trees did not exhibit significantly lower values. This phenomenon can be explained from multiple perspectives. Firstly, it may result from differences in the quantity (area) and distribution of different stress wave speeds. The internal structure of decayed trees shows greater variability, with certain areas still maintaining relatively high stress wave speeds, which could elevate the overall speed range. For example, the density of the wood in the center of a healthy trunk is significantly lower than that of the wood surrounding the bark, thus the attenuation of stress wave speeds in different regions of the cross-section can represent varying degrees and areas of decay, which is an important indicator.
Moreover, the distribution and variability of stress wave speeds are also crucial. Through the analysis of two-dimensional images and grid diagrams, we can more clearly observe the variations in stress wave speeds within the tree and reveal the health status of different areas. These illustrations help us understand the degree of decay in the tree and its impact on stress wave speeds, providing a more comprehensive assessment. However, relying solely on the numerical range of stress wave speeds to determine tree health is insufficient; it is essential to conduct a comprehensive analysis that combines data from two-dimensional images and grid diagrams to achieve more accurate conclusions. Furthermore, the results from acoustic 2D imaging may not be precise or practical enough, necessitating the use of other minimally destructive testing techniques to confirm the degree and location of decay.

3.5. Drilling Amplitude Analysis of Healthy Date Palms

In this study, Table 2 presents the drilling amplitude results of five healthy date palm trees at different orientations (North, South, West, East), including percentage data for Average Drilling Amplitude (ADA), Maximum Drilling Amplitude (MDA), and Minimum Drilling Amplitude (MIA). Overall, these data indicate that the trees exhibit a certain level of resistance during the drilling process, with an average drilling amplitude (ADA) of 25.90%, while the maximum drilling amplitude (MDA) is 57.19%. This suggests that the trees in certain locations have relatively strong resistance (amplitude), primarily observed near the xylem within the inner bark close to the trunk’s periphery.
Specifically, the ADA values for the North orientation (N) range from 18.65% to 32.97%, showing variability among different trees. The average ADA for the South orientation (S) is 25.95%, which is relatively high, indicating that trees in this direction demonstrate stronger resistance during drilling. In contrast, the ADA values for the West (W) and East (E) orientations are lower, at 25.84% and 22.47%, respectively, which may be related to the trees’ growing environment or structural characteristics.
Additionally, the standard deviation (SD) data indicate the degree of variation in each orientation, with an ADA standard deviation of 5.96%, an MDA standard deviation of 13.25%, and an MIA standard deviation of 4.17%. This suggests that the MDA data exhibit greater variability, potentially reflecting differences in the internal structure of the trees. Overall, these results not only reveal significant variability in the drilling amplitudes of healthy date palm trees across different orientations but also provide important references for future tree health assessments.
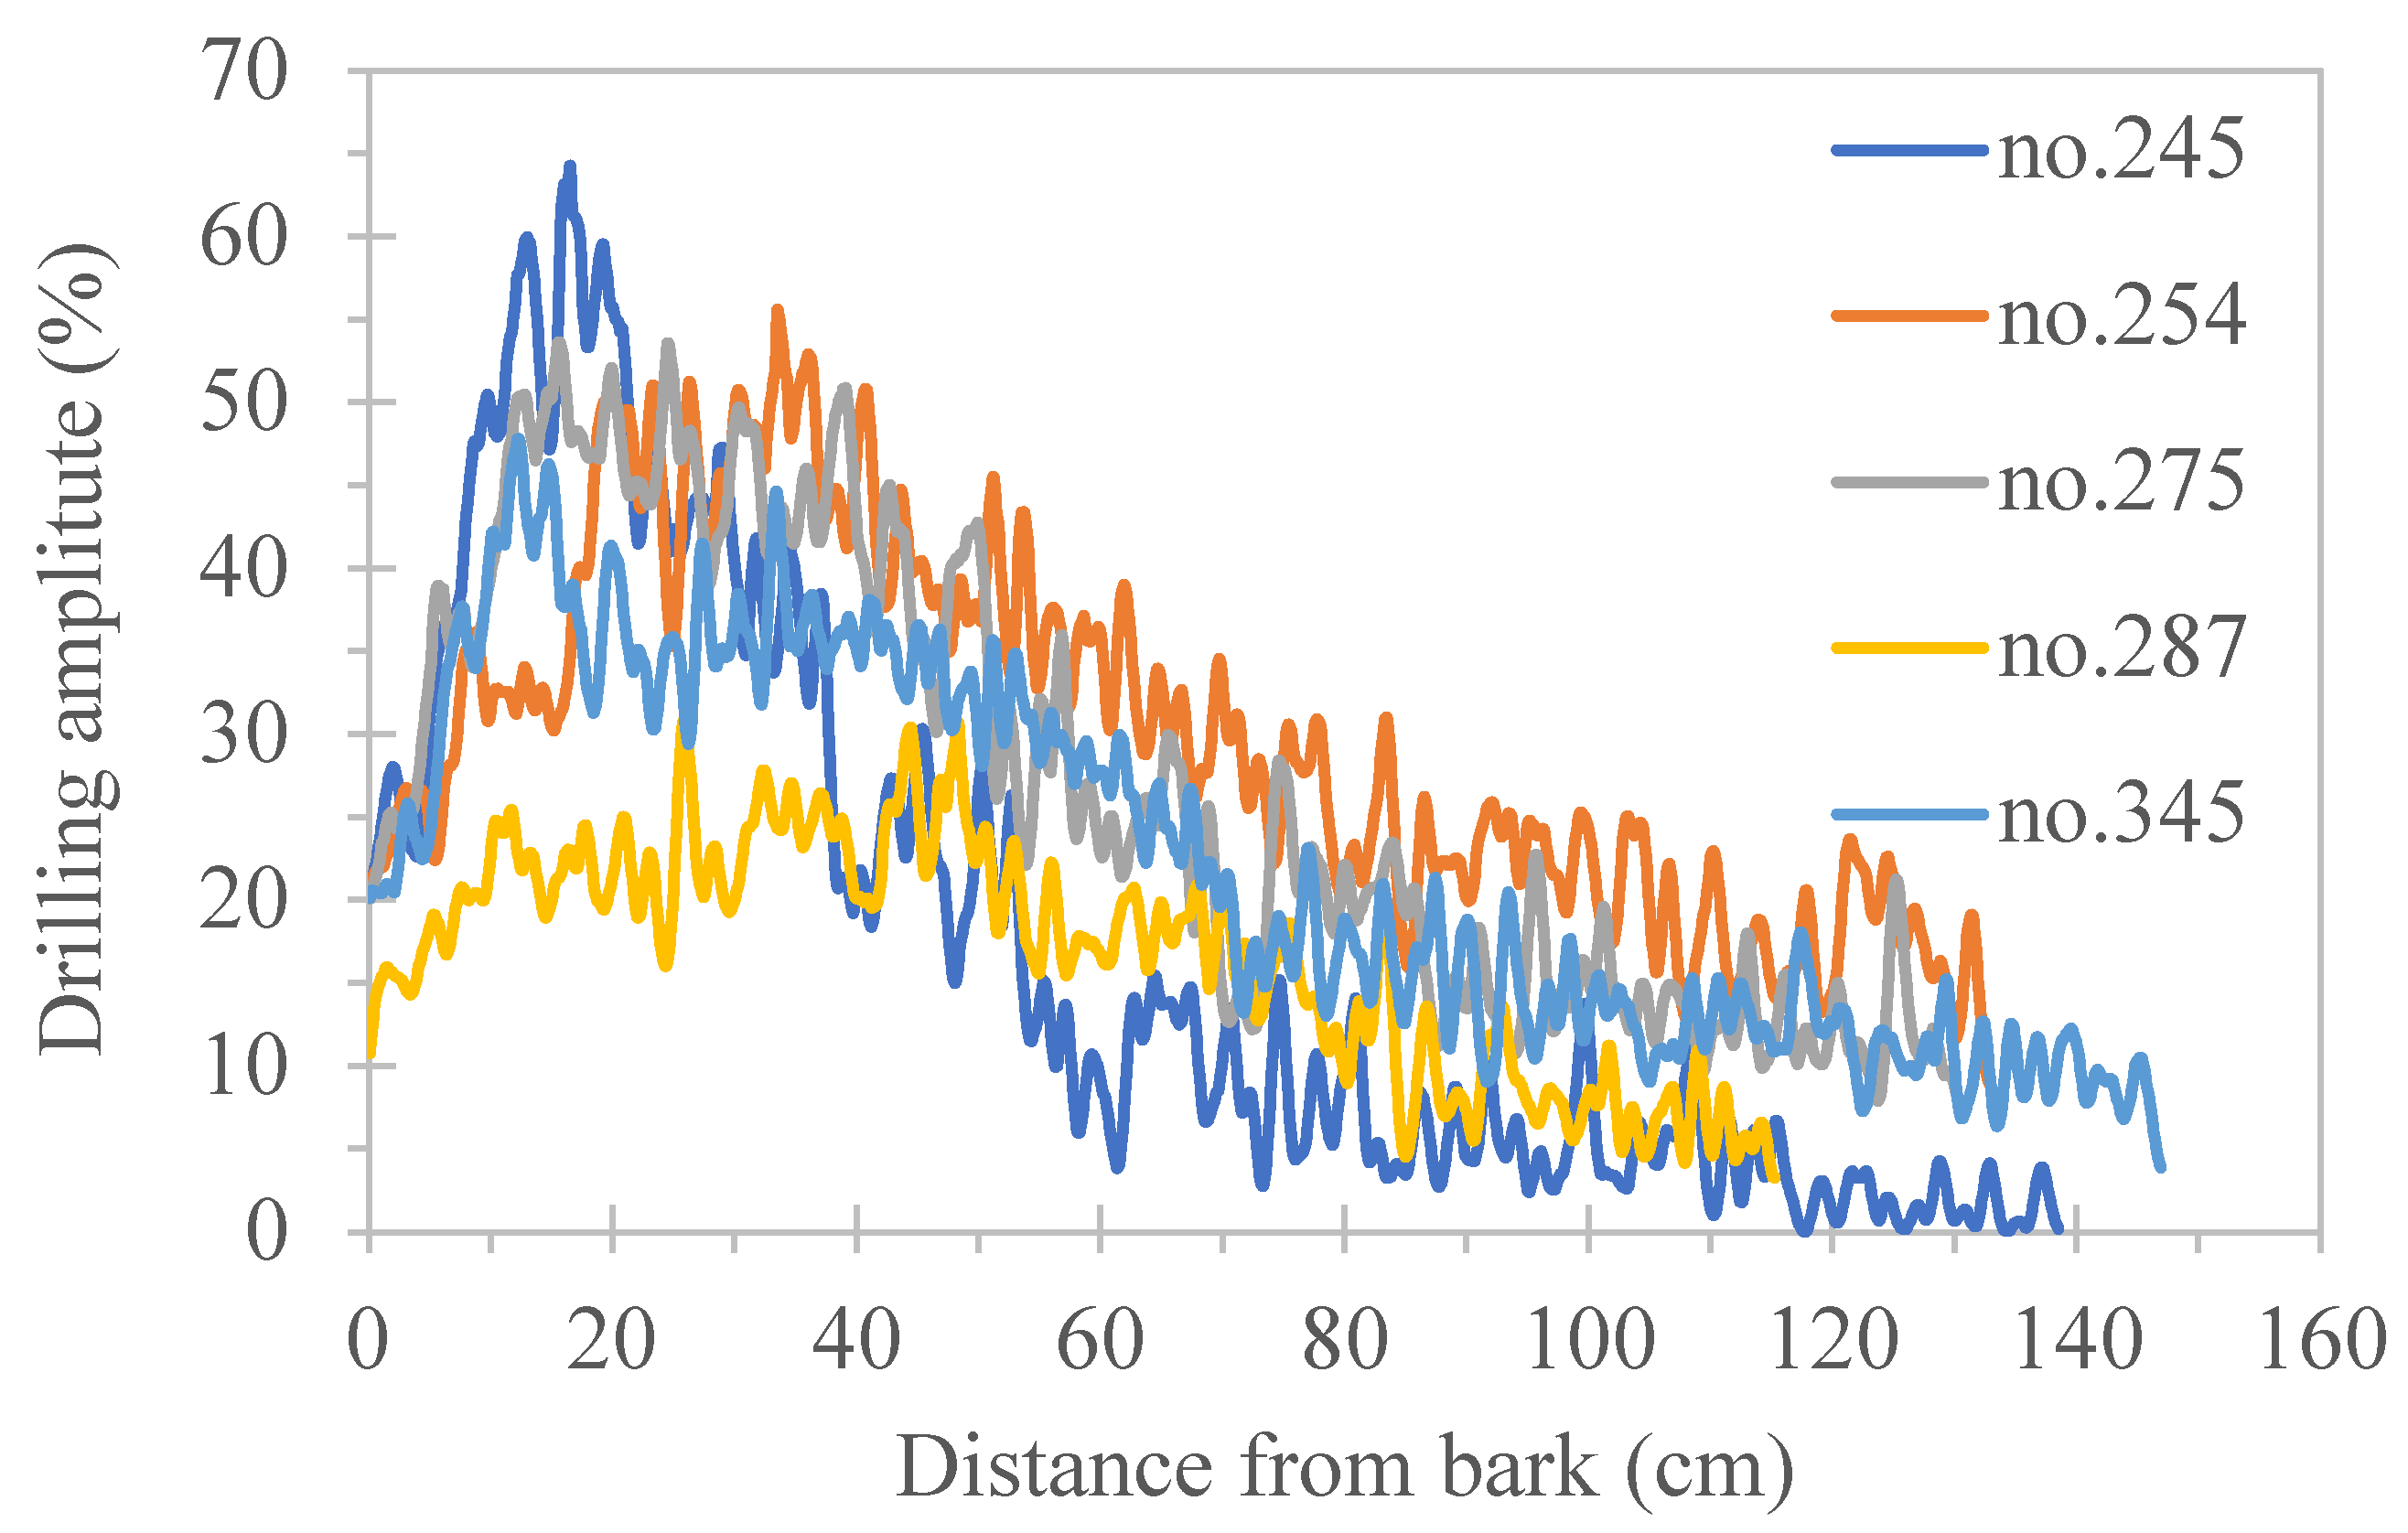
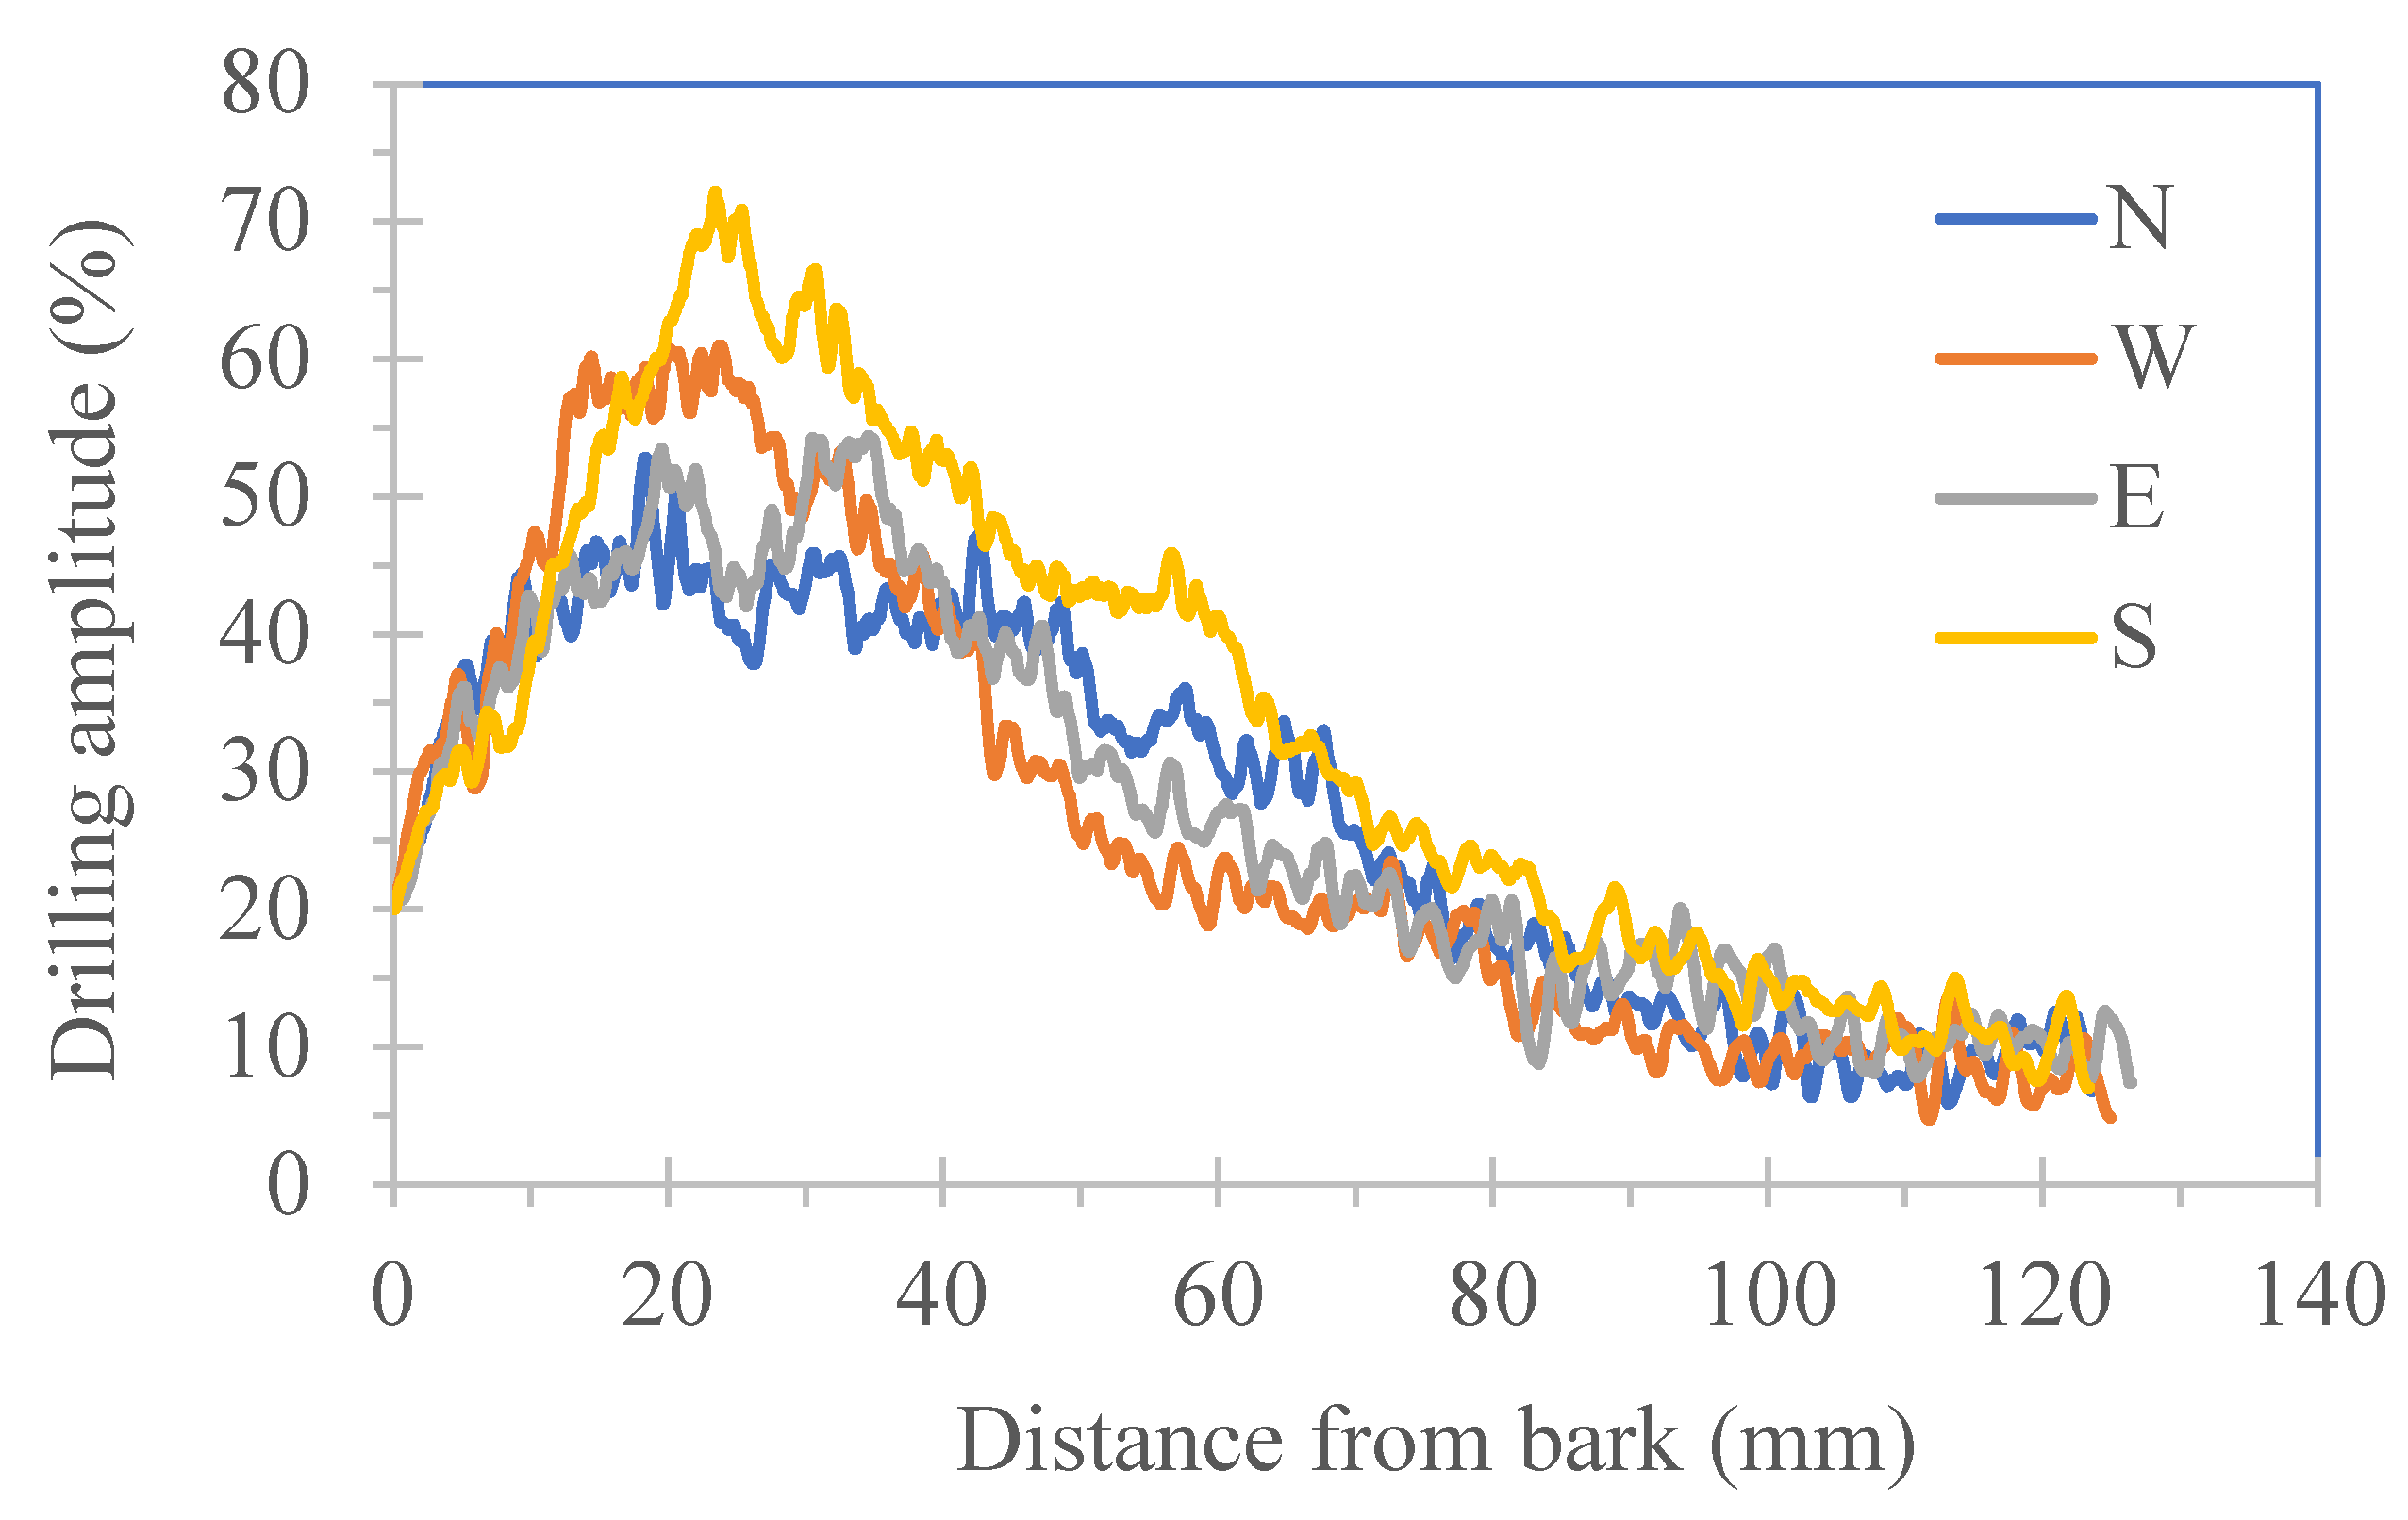
Figure 4 illustrates the variation in drilling resistance amplitude profiles from the bark to the center of the trunk in five healthy date palm trees. The results indicate a clear trend in amplitude changes between the bark layer and the interior of the trunk. Starting from the bark, the amplitude rapidly increases, reaching its peak in the outermost wood portion of the trunk, which suggests that this area exhibits the strongest resistance. As one moves deeper into the trunk, the amplitude gradually decreases, indicating that the internal structure has relatively lower resistance.
This pattern reflects the growth and structural characteristics of the tree. The outer wood of the trunk (i.e., near the xylem just inward from the bark) shows higher resistance due to its density and structural compactness. As one goes deeper into the trunk, the wood structure may become looser or less dense, leading to a decrease in amplitude. This finding is significant for understanding the health status of the tree and its growing environment, and it can serve as a reference for future tree assessments and management.

3.6. Drilling Resistance Amplitude Analysis of Disc Testing

Table 3 presents the drilling resistance amplitude data for a healthy air-dried disc (No. 27) at different orientations (North, South, West, East), including percentage data for Average Drilling Resistance Amplitude (ADA), Maximum Drilling Resistance Amplitude (MDA), and Minimum Drilling Resistance Amplitude (MIA). The data indicate that the ADA for the South orientation (S) is 33.68%, demonstrating that the trees in this direction exhibit the best resistance, while the ADA for the West (W) and East (E) orientations are 26.60% and 26.99%, respectively, which are relatively low.
Overall, the average drilling resistance amplitude (ADA) is 28.66%, while the average maximum drilling resistance amplitude (MDA) is 60.10%. These data show that the tree’s outer structure exhibits higher strength in resisting external pressure, particularly in the outer wood of the trunk (i.e., near the xylem just inward from the bark) in the South orientation. In contrast, the average minimum drilling resistance amplitude (MIA) is 6.29%, indicating that the tree’s resistance is relatively weak in certain orientations.
It is noteworthy that these results are similar to the trend observed in the drilling amplitudes of the five standing trees as they move from the bark toward the interior of the trunk, demonstrating the similarity between disc tests and standing tree tests. This suggests that the data from the disc can effectively reflect the structural characteristics and health status of the tree, providing valuable references for future tree health assessments. Additionally, the standard deviation (SD) data indicate the degree of variation among the orientations, with an ADA standard deviation of 3.36% and an MDA standard deviation of 8.81%, showing that there is a certain variability in resistance among different orientations, which may be related to the tree’s growing environment and structural characteristics.
Figure 5 presents the drilling resistance amplitude data for a healthy disc (No. 27) and a decayed disc (No. 78) in the trunk cross-section. The amplitude trend for the healthy disc (Figure 6) is similar to the results in Figure 4, showing a pattern where the amplitude rapidly increases from the bark to the center of the trunk and then gradually decreases. This indicates that the outer resistance of the tree is stronger, while the internal structure’s resistance decreases as one moves deeper into the trunk.
In contrast, the data for the decayed disc show a significant decline in amplitude at the center of the trunk (Figure 5), especially in the decayed hollow areas, reflecting structural weakening or lower wood density in that region, with resistance significantly lower than that of healthy wood. This phenomenon emphasizes the impact of decay on tree structure and highlights the clear differences in physical properties between decayed and healthy wood.
Additionally, at the junction between the decayed hollow and healthy wood, a dark wood band approximately 1-2 mm wide appears, accompanied by higher amplitude resistance. This may represent an adaptive growth phenomenon of the tree in response to the challenges posed by decay. Overall, the results in Figure 5 not only illustrate the significant differences in amplitude between healthy and decayed discs but also provide insights into how trees respond to external challenges through structural variations, which is crucial for understanding the health status and growth adaptability of trees.

3.7. Visual Inspection of Cross-Sectional Discs

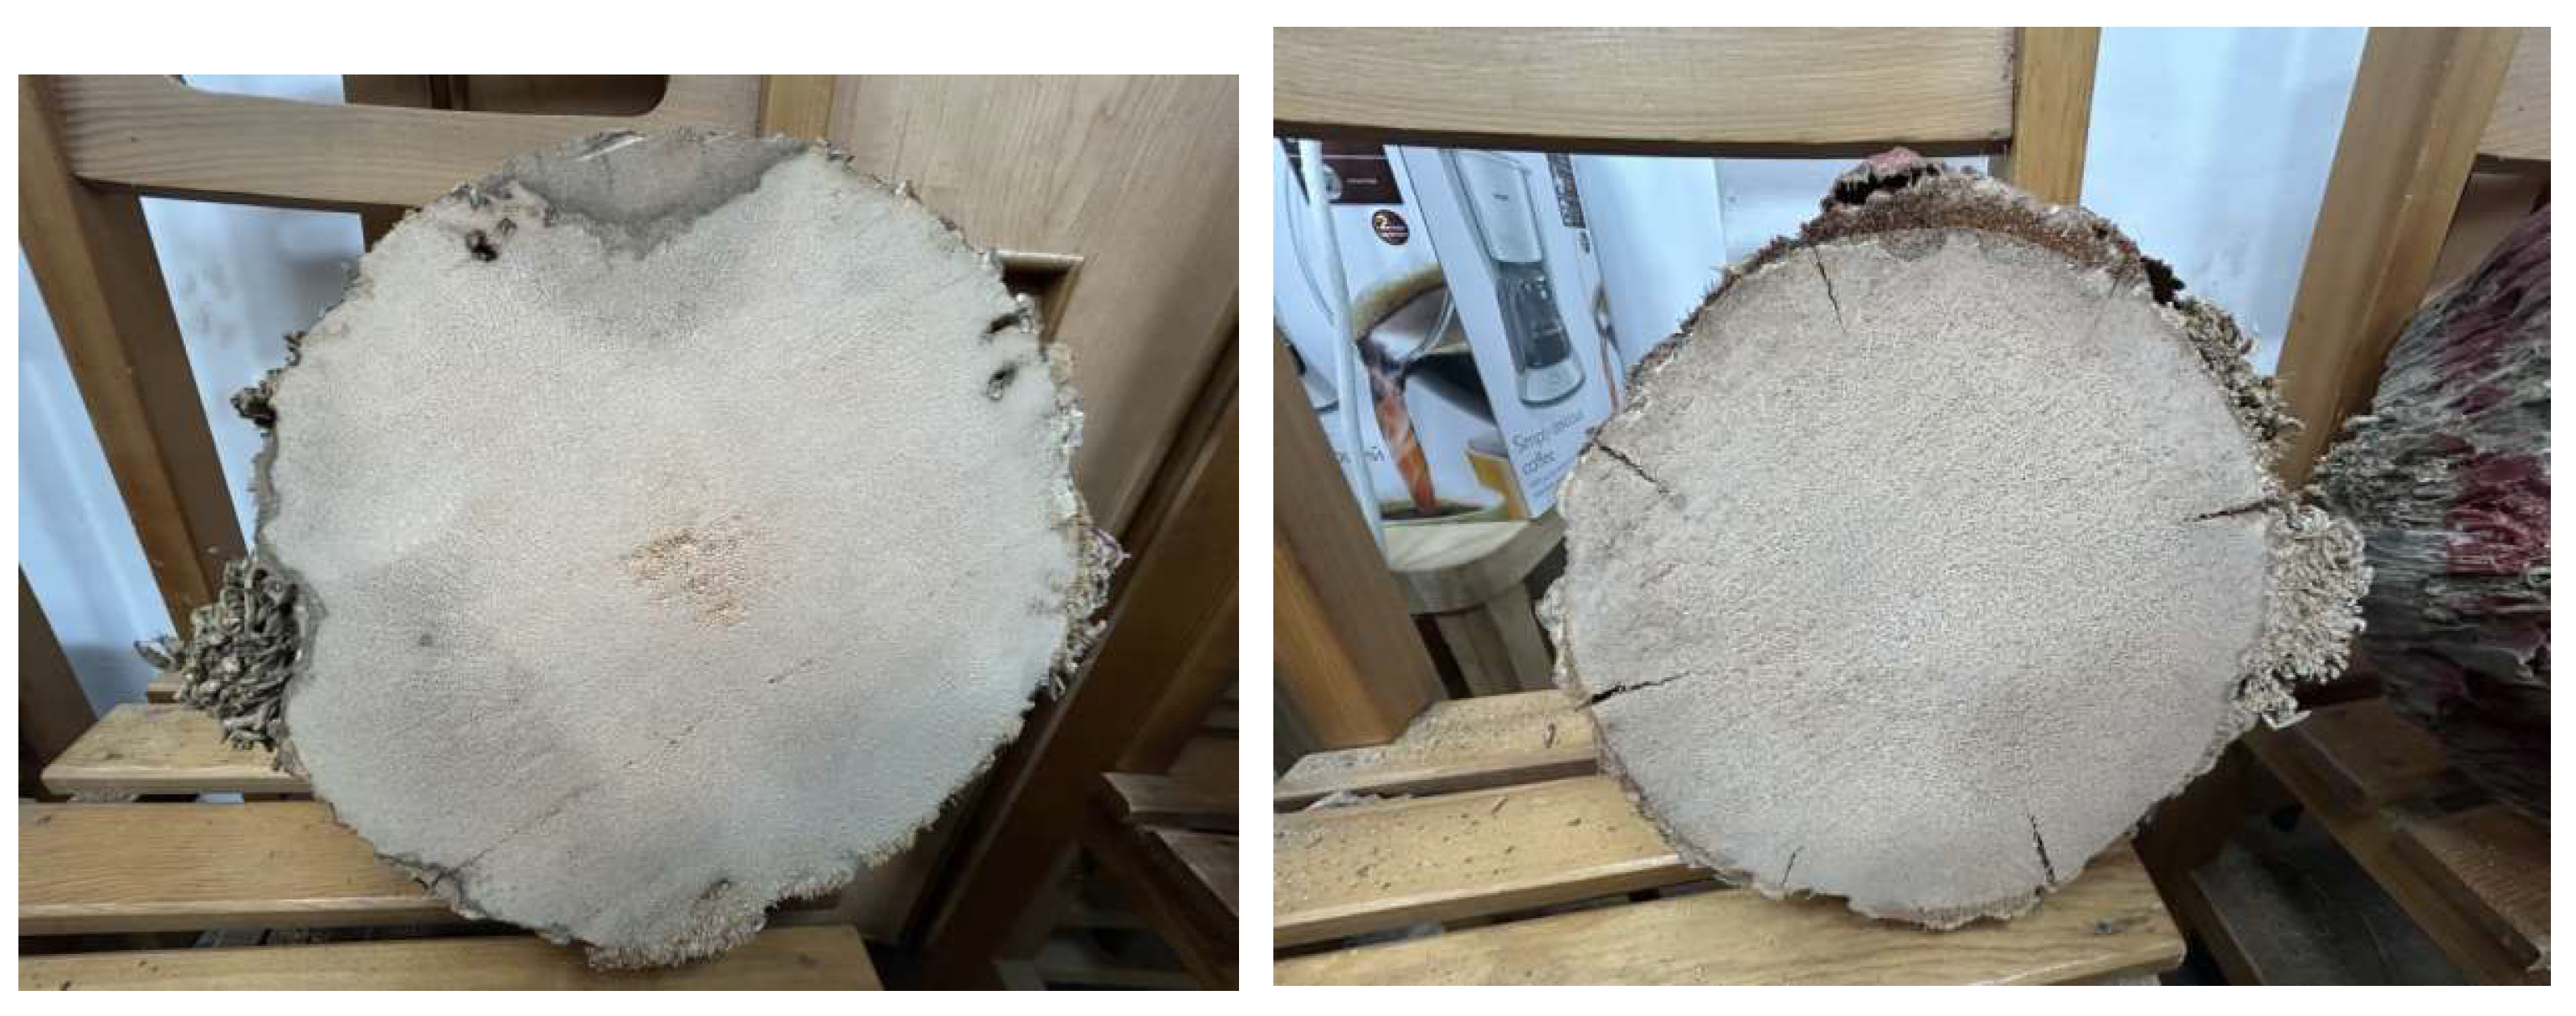
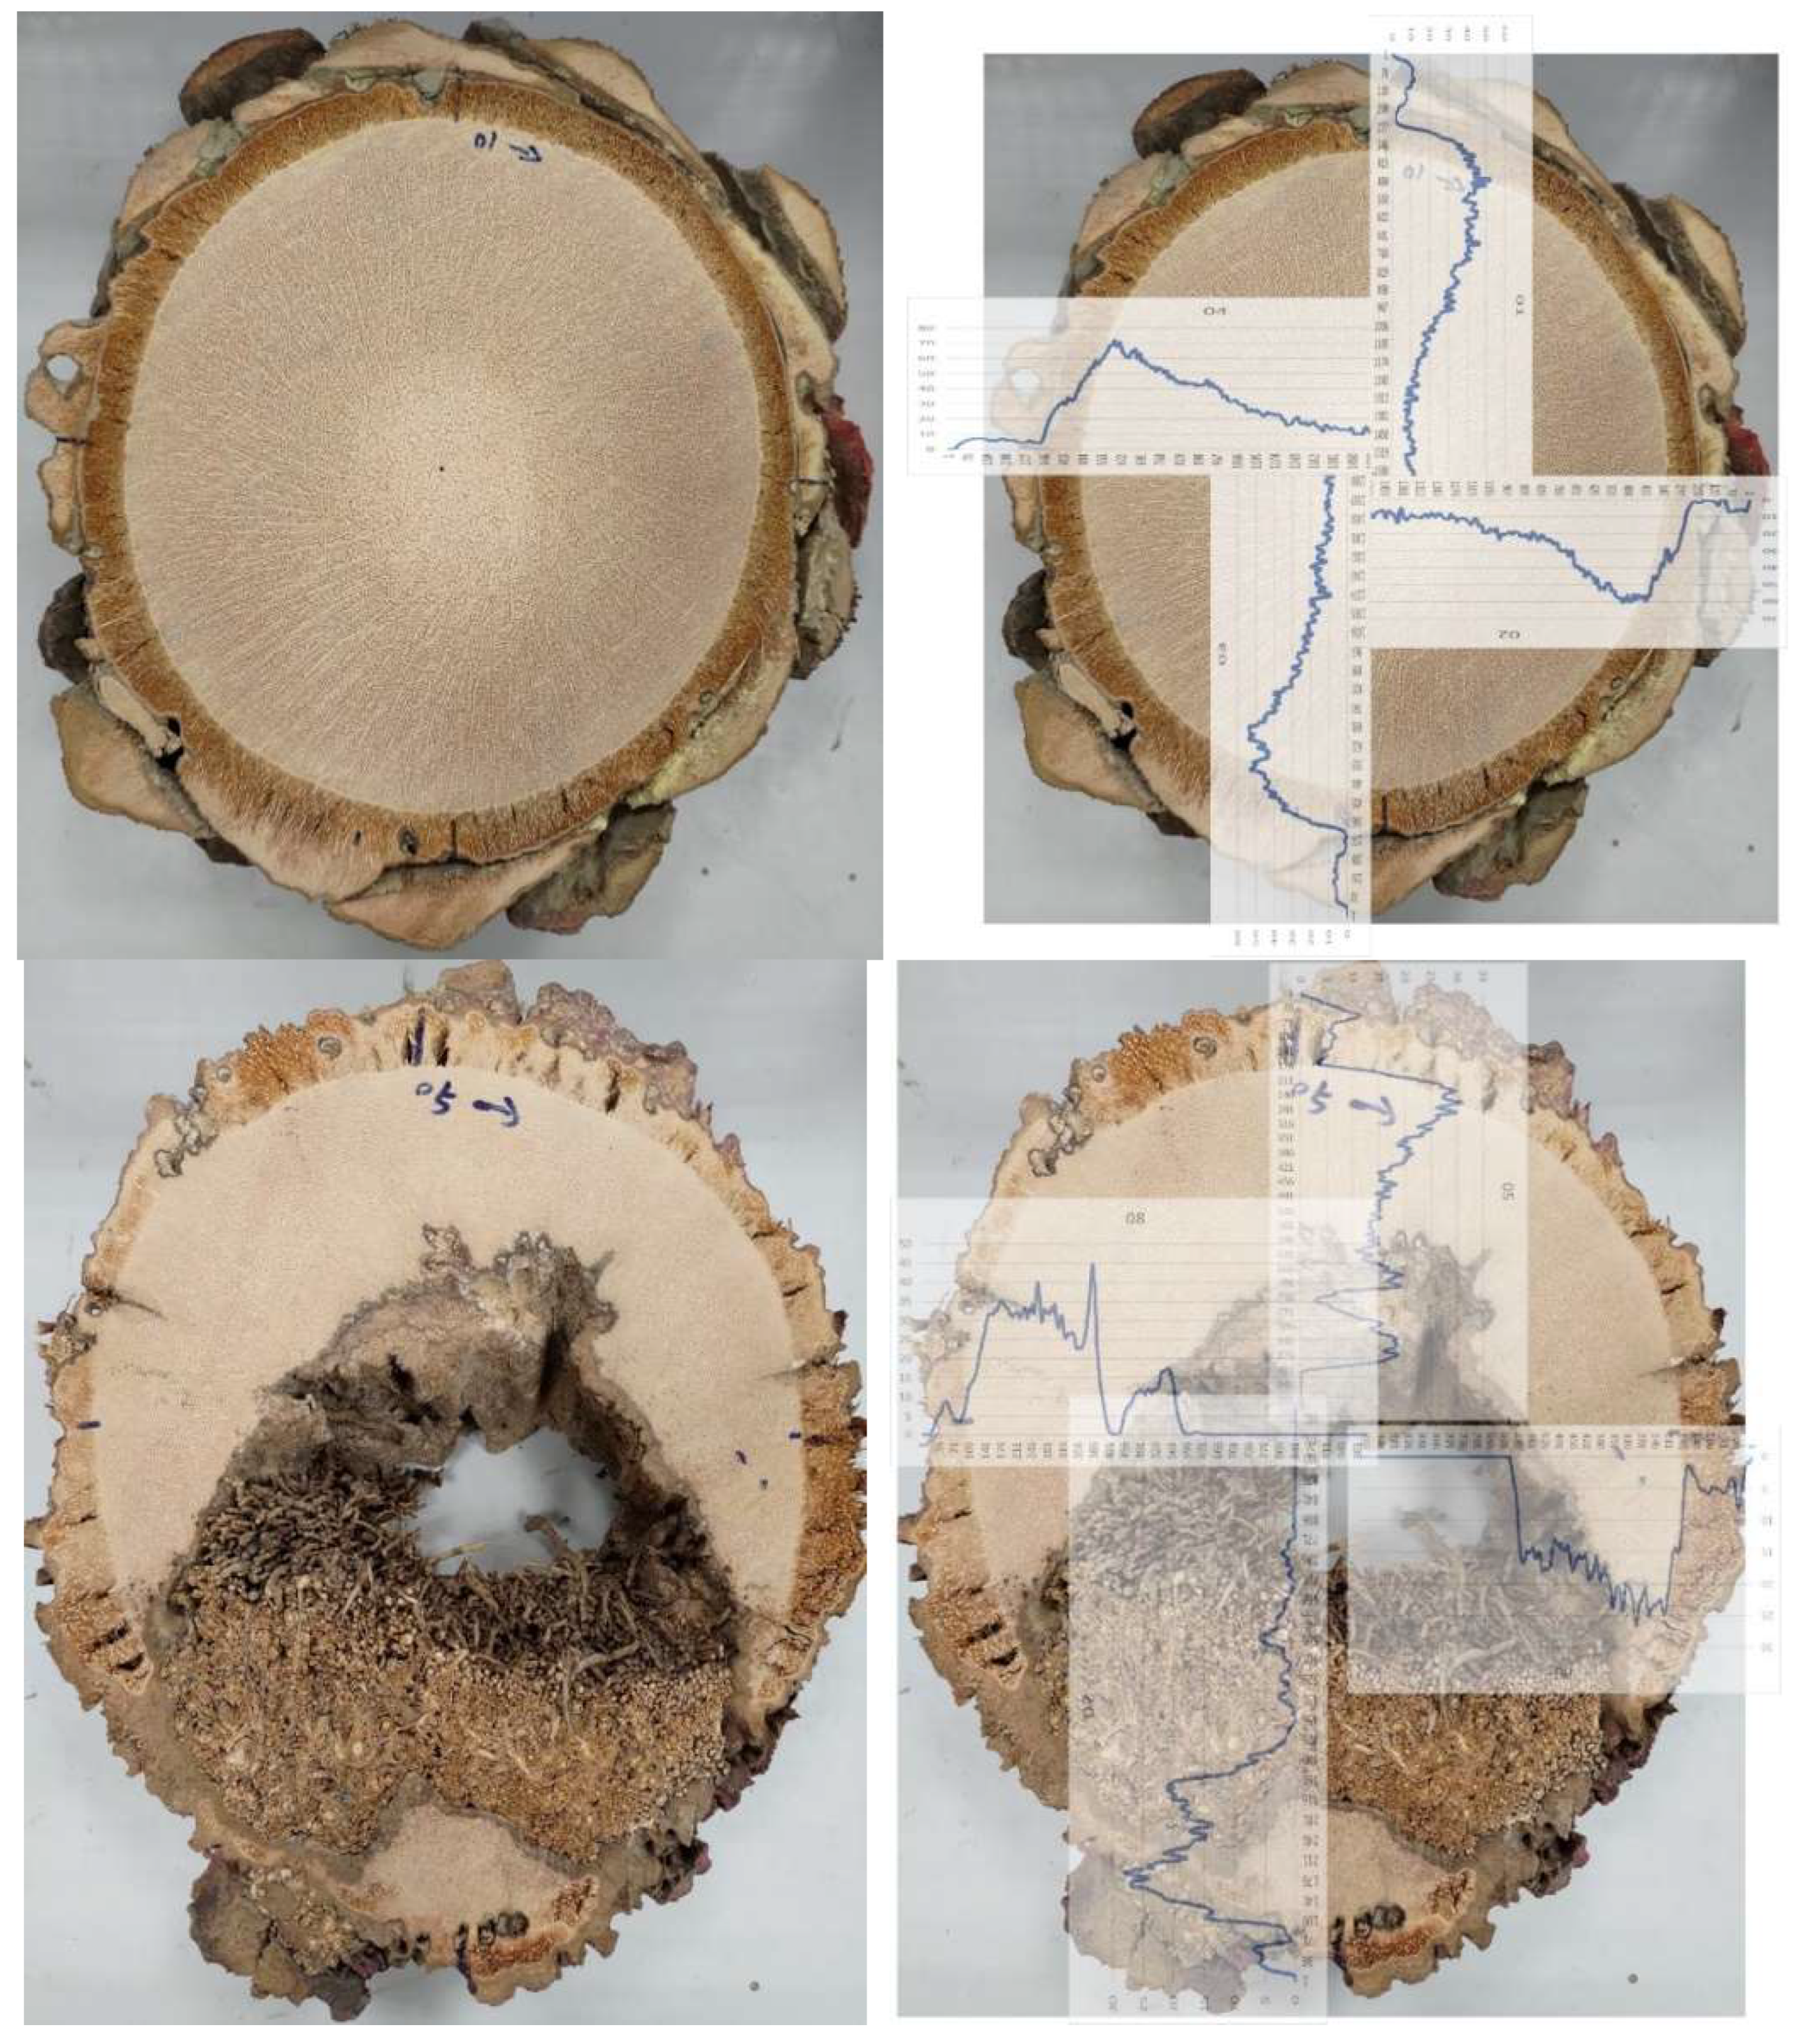
This study conducted a Visual Tree Assessment (VTA) on date palms (Phoenix dactylifera) to examine the health status of the trees and the impact of their surrounding environment on the trunk. After inspection, the date palm street trees were determined to pose an immediate risk and were subsequently removed. After felling, cross-sectional samples of the trunks were processed, and their surface characteristics were observed visually (Figure 7).
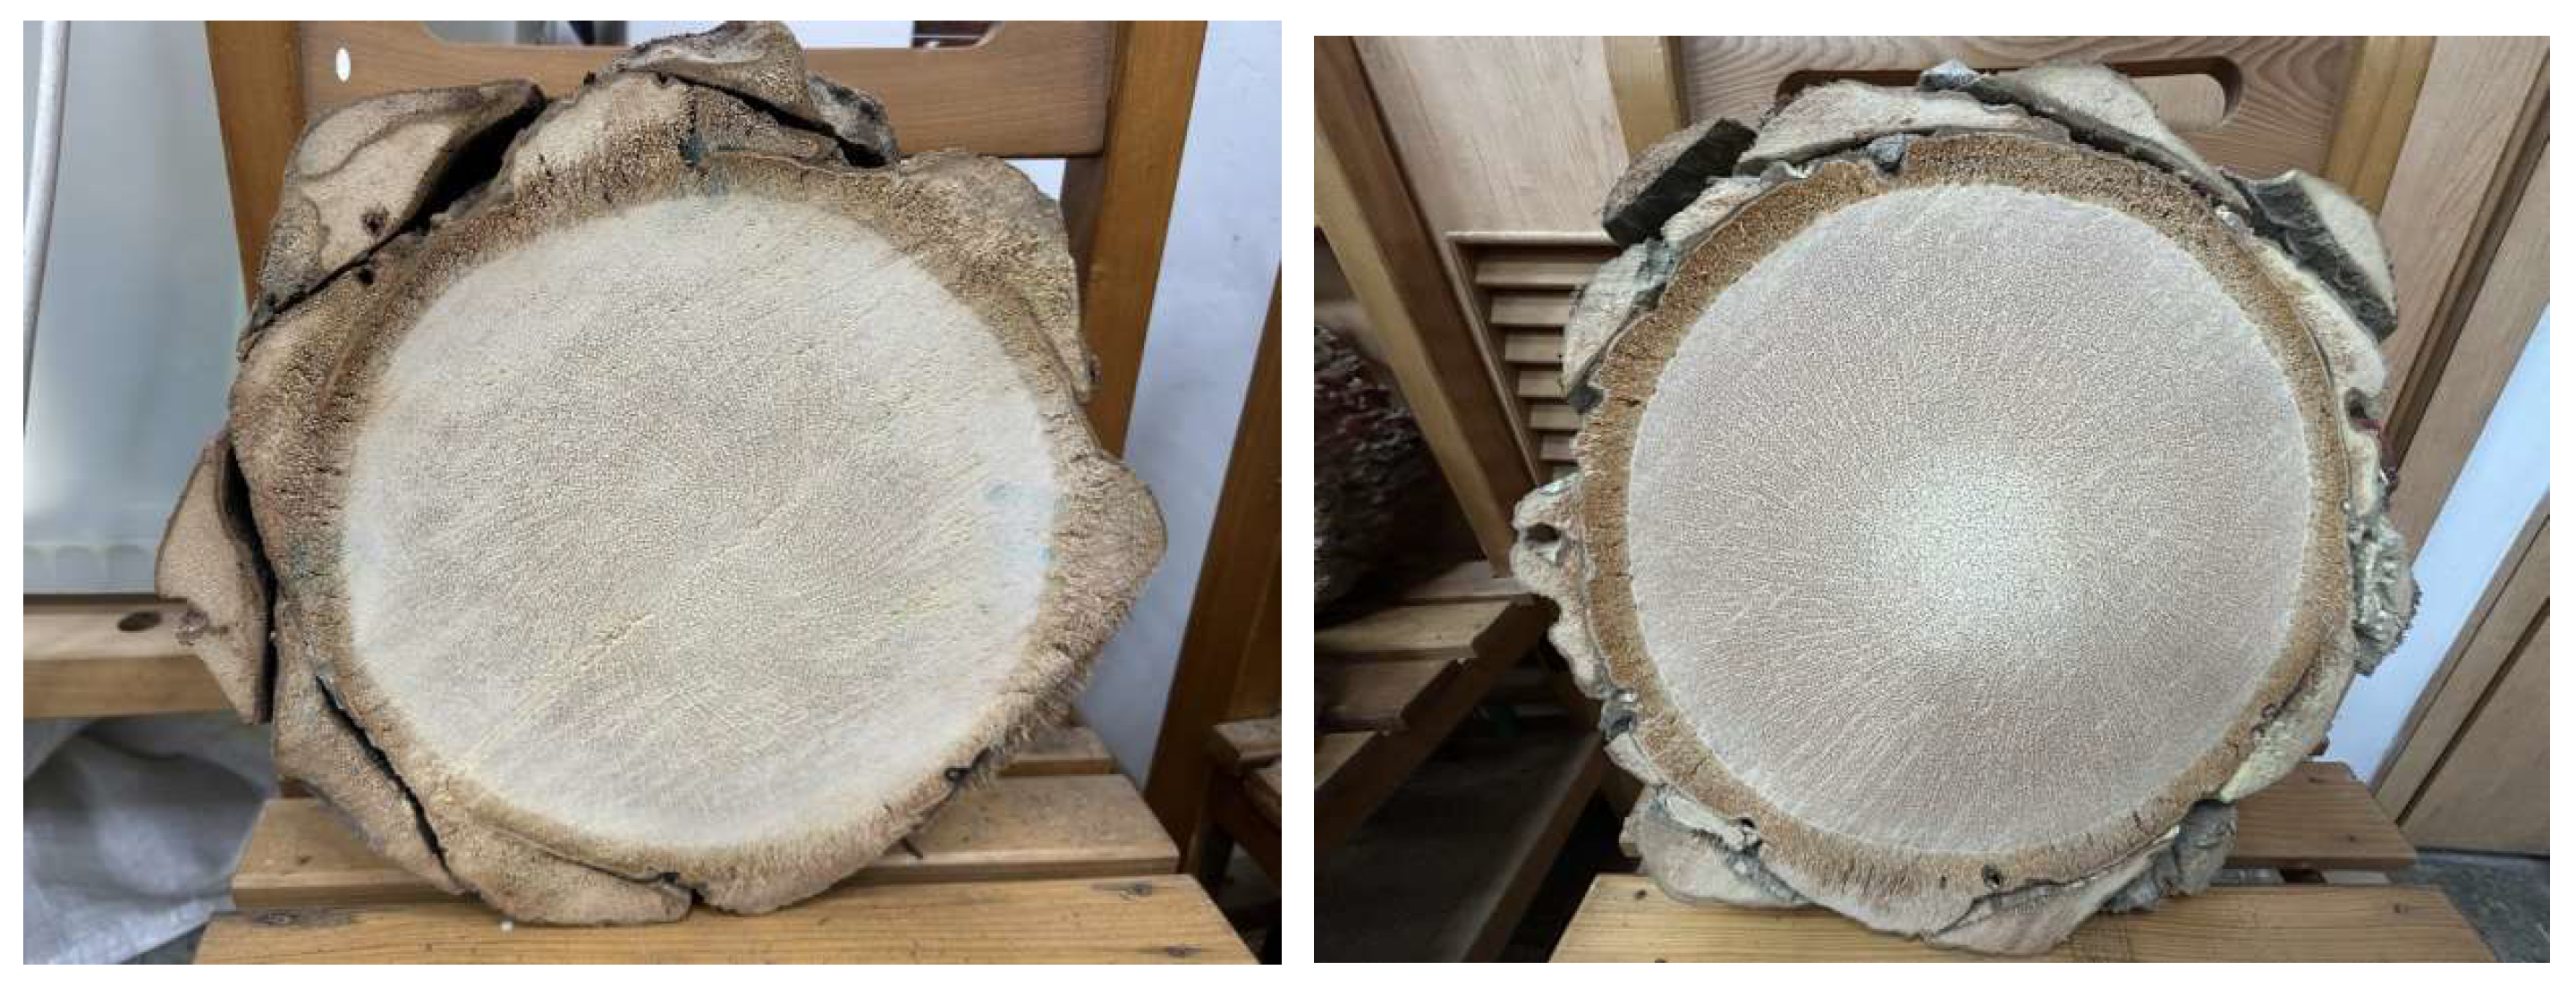
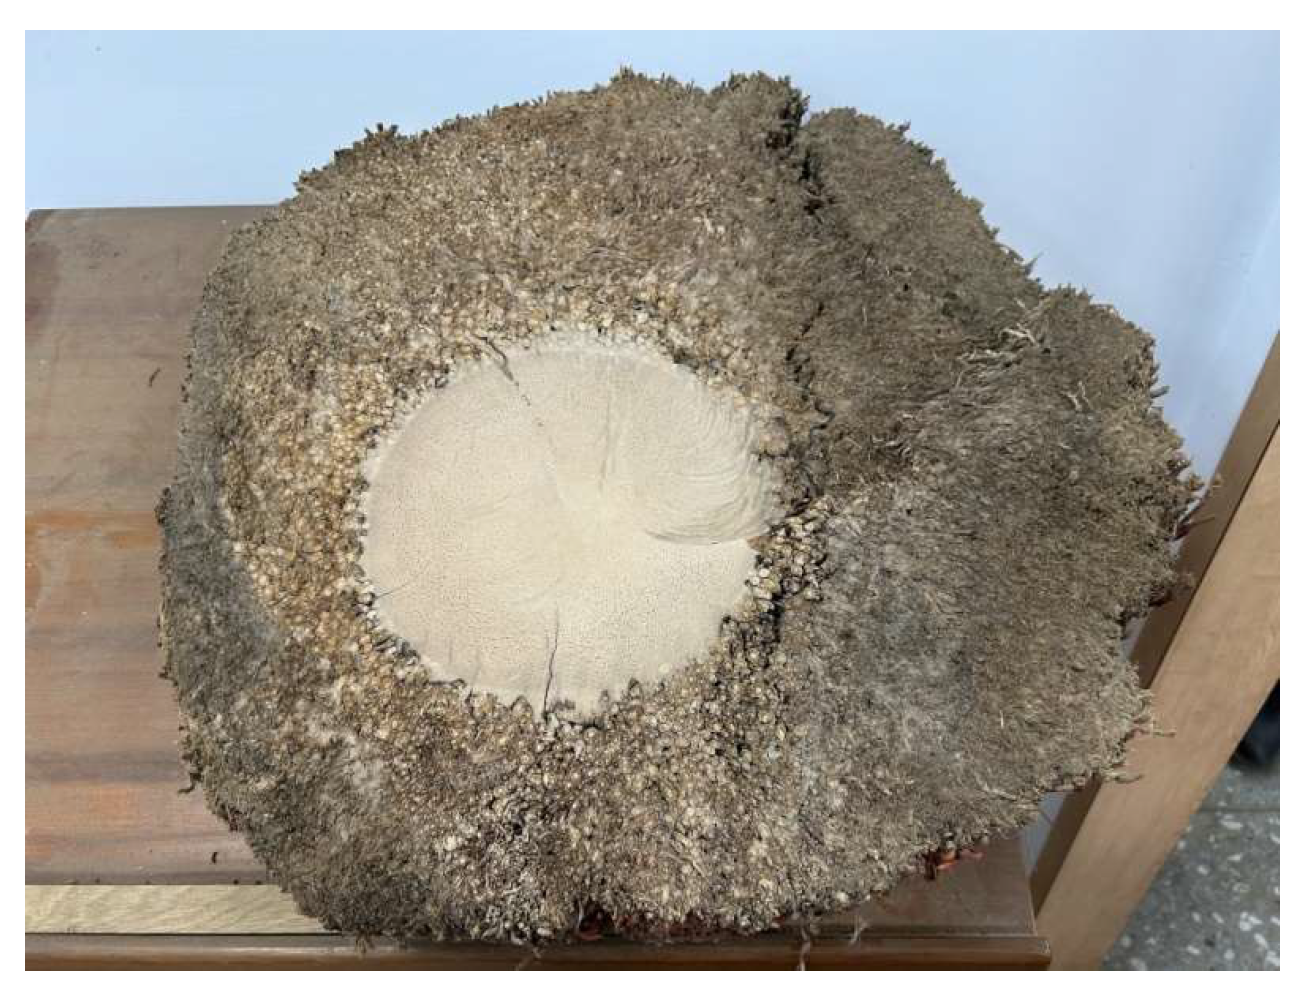
During the inspection, the condition of the bark and residual leaf sheaths on the outer side of the trunk was noted. Specifically, healthy trunks exhibited bark and residual leaf sheaths, with the vascular bundles in the trunk’s cross-section displaying spiral or radial patterns, indicating a healthy growth state (see Figure 7-1). However, in some trees, vigorous aerial roots were observed growing on the outer side of the trunk, with no bark or leaf sheaths present, suggesting that the tree’s growing environment may have been affected (see Figure 7-2). Among the 368 date palm street trees visually inspected, varying heights and quantities of aerial roots were found around the trunk below a height of 1.3 meters.
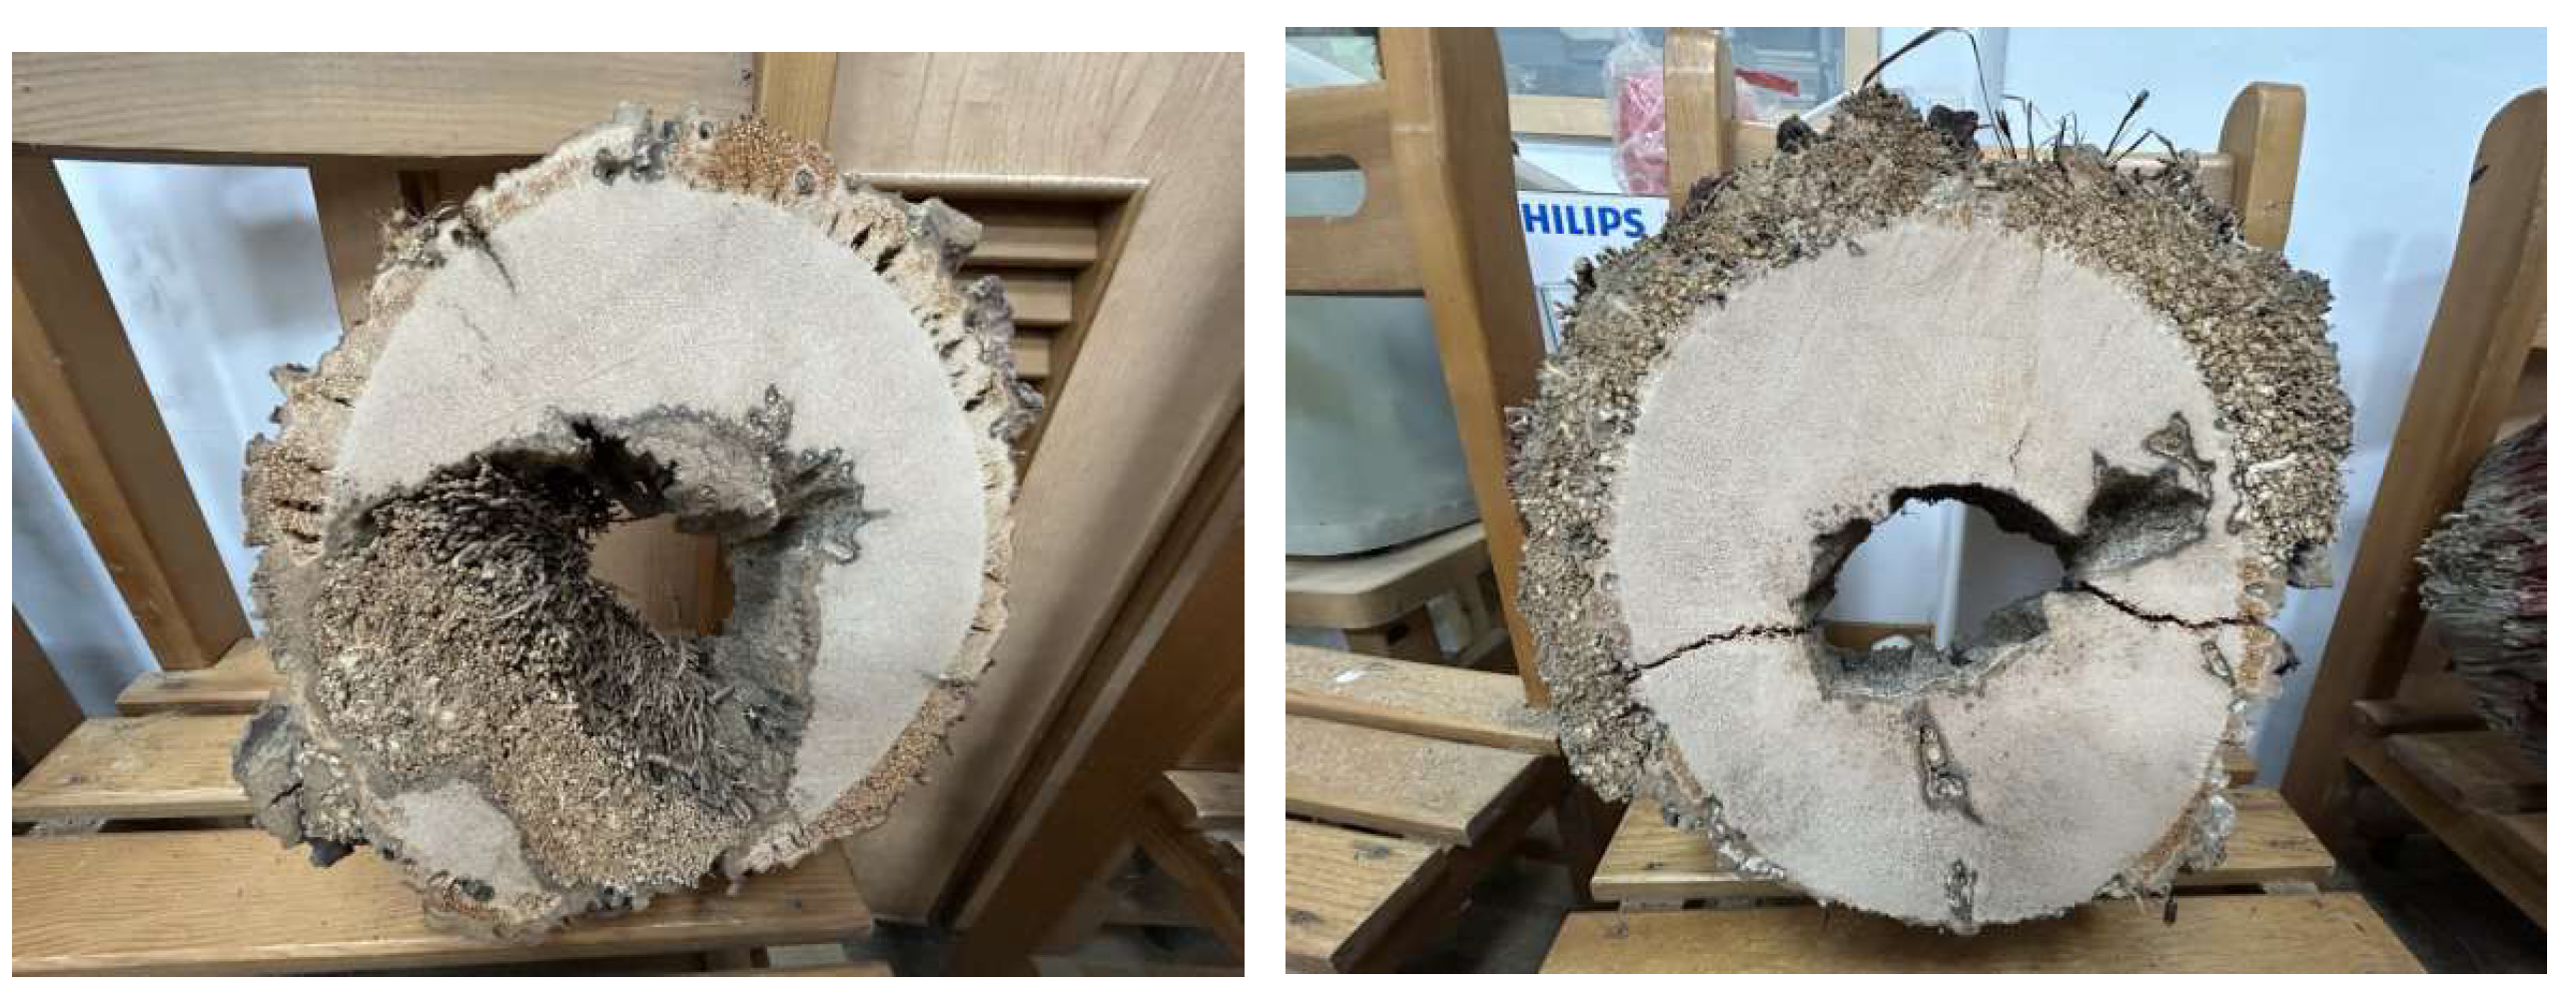
Additionally, some trunks exhibited decay and hollowness in their cross-sections, with aerial roots growing inside the hollows, and a dark wood band (boundary) present between the decayed hollow and healthy wood. This phenomenon may reflect the tree’s adaptive growth mechanisms and the resulting variations in wood structure. However, whether this represents a defensive mechanism of the tree still requires further research (see Figure 7-3). In other trunks, some aerial roots were found growing on the outer side of the trunk, with remnants of bark and leaf scars (see Figure 7-4). These phenomena indicate that trees may be influenced by various environmental factors during their growth, leading to changes in the structure surrounding their trunks.
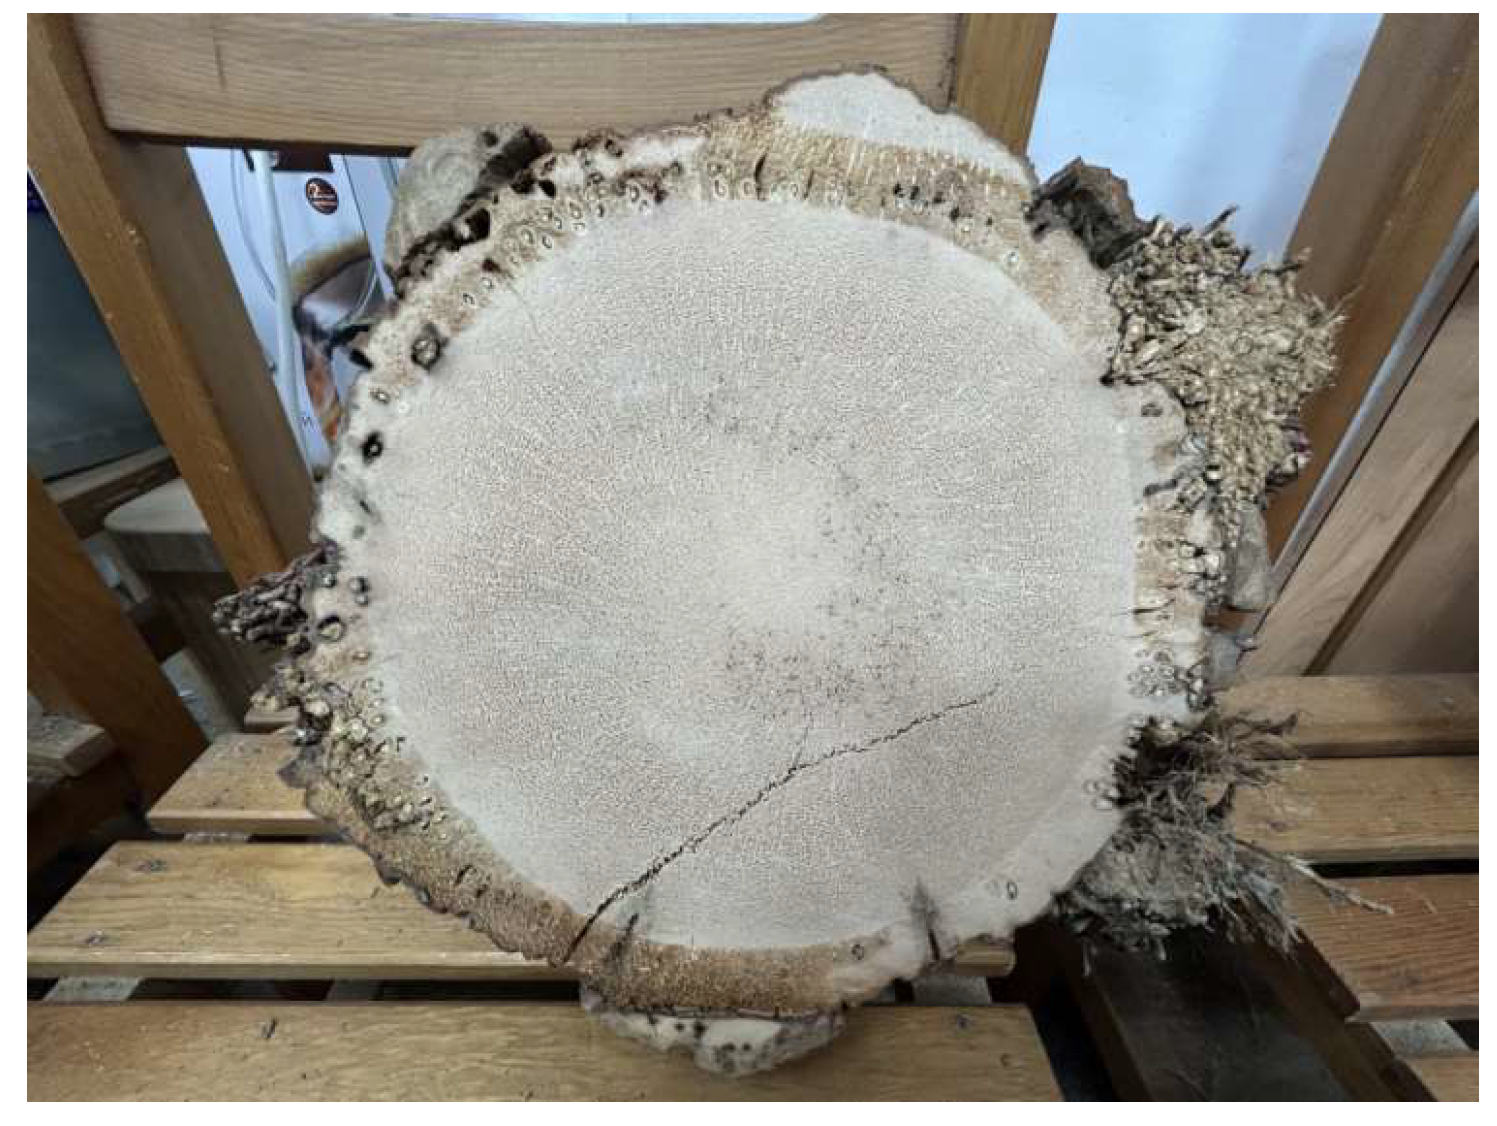
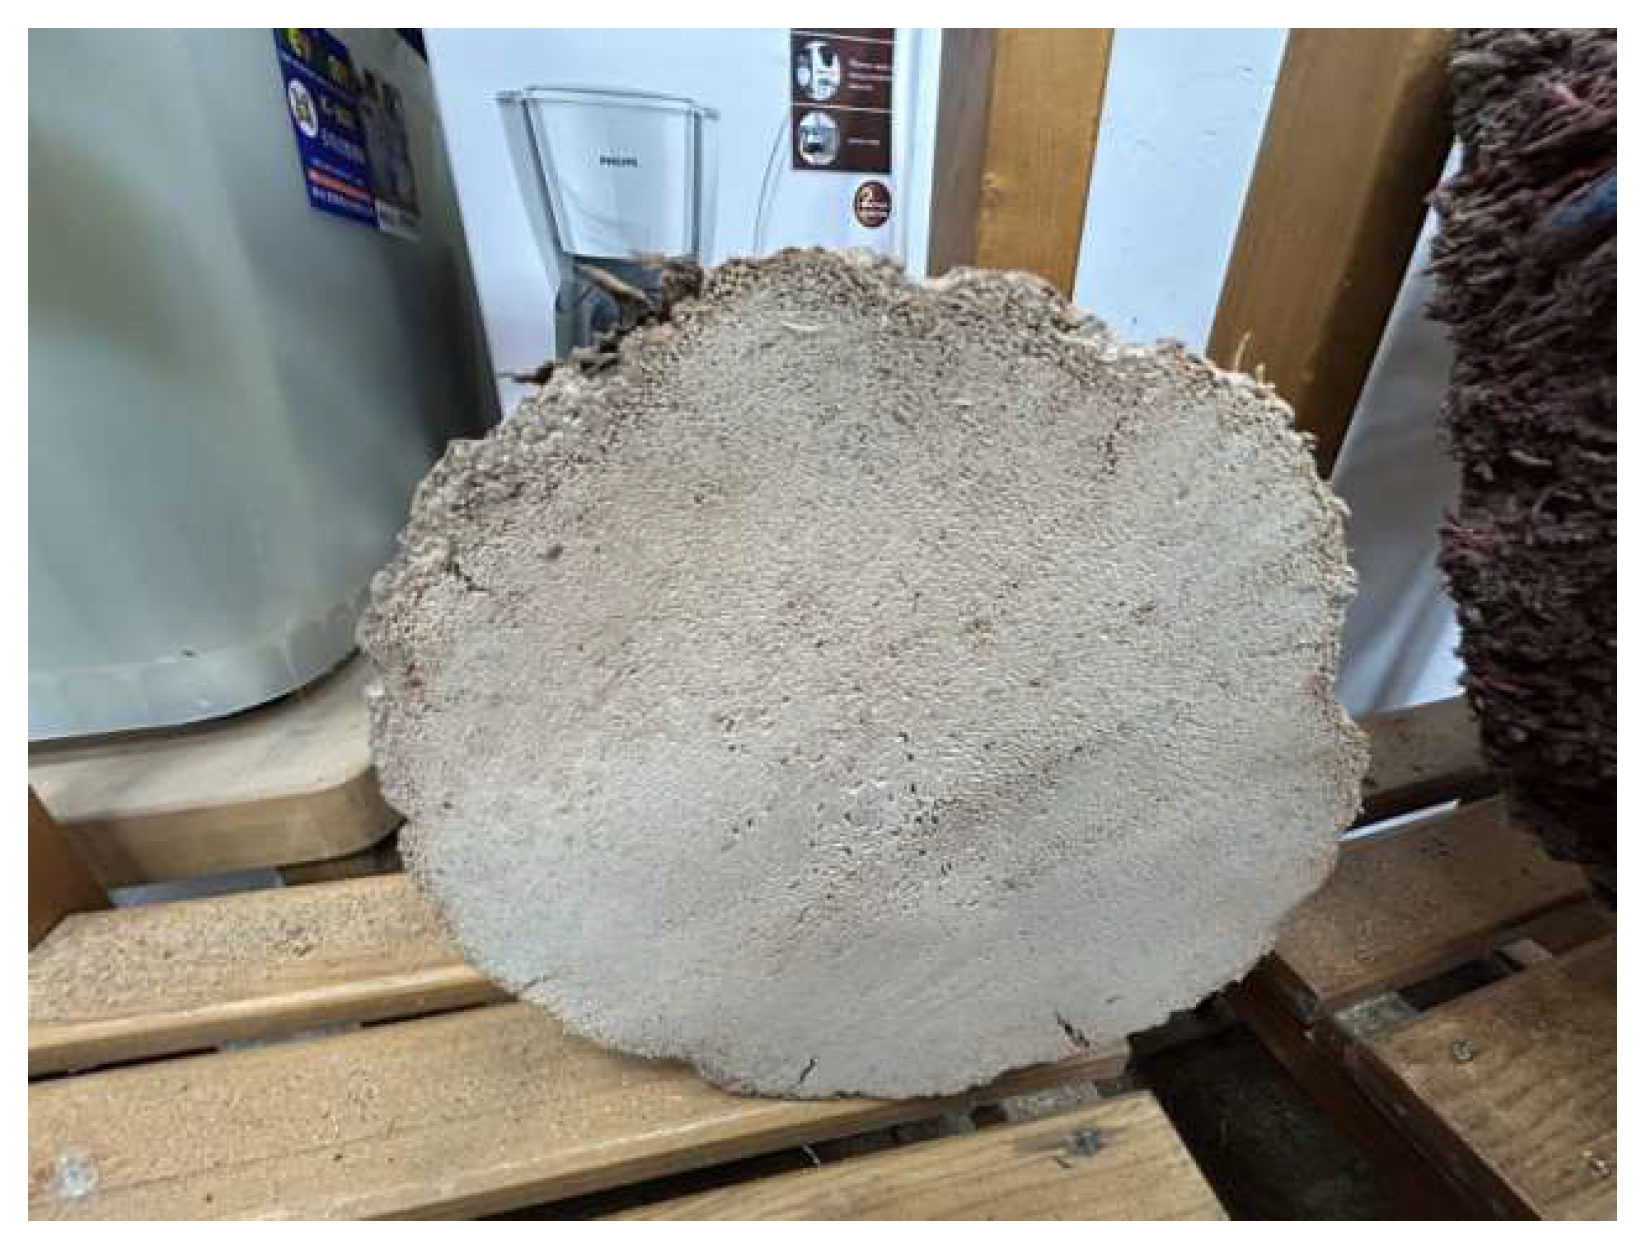
Further observations revealed that the growth of aerial roots on the outer side of the trunk was accompanied by wood degradation, developing from the outer trunk towards the interior. Additionally, damaged areas on the outer side of the trunk exhibited a dark wood band different from healthy wood, suggesting a phenomenon of wood variation related to the tree’s adaptive growth (see Figure 7-5). As the inspection progressed, it was found that the leaf sheaths and bark on the outer side of the trunk had fallen off, with wood degradation gradually extending into the interior of the trunk’s cross-section (see Figure 7-6).
Overall, the results of this study indicate that the health status of date palms in public landscapes is influenced by various factors, particularly environmental conditions and management practices. It also highlights the phenomenon of wood variation related to the adaptive growth of date palm trees. These findings provide important references for future tree management and conservation efforts.
Figure 7-1. The outer side of a normal trunk has bark and remnants of leaf sheaths, and the vascular bundles in the cross-section of the trunk exhibit a spiral or radial pattern.
Preprints 150143 g007
Figure 7-2. The outer side of the trunk of the date palm shows vigorous growth of aerial roots, with no bark or leaf sheaths visible on the outer side.
Preprints 150143 g008
Figure 7-3. The cross-section of the trunk shows decay and hollowness, with aerial roots growing inside the cavity. There is a dark wood boundary between the decayed hollow and the sound wood, indicating a phenomenon of wood variation due to the adaptive growth of the tree. Whether this is a defensive mechanism of the tree’s tissue remains to be confirmed through further research. The outer side of the trunk has remnants of bark and leaf sheaths.
Preprints 150143 g009
Figure 7-4. Some aerial roots grow on the outer side of the trunk, with remnants of bark and leaf sheaths remaining.
Preprints 150143 g010
Figure 7-5. Some aerial roots are located on the outer side of the trunk, where there is a dark wood boundary indicating damage. This is a phenomenon of wood variation due to the adaptive growth of the tree, and the bark and leaf sheaths have fallen off.
Preprints 150143 g011
Figure 7-6. The leaf sheaths and bark on the outer side of the trunk have fallen off, and the deterioration of the wood is gradually developing inward toward the cross-section of the trunk.
Preprints 150143 g012
Figure 7. Photos of aerial roots (AR), undamaged wood (UDW), decayed and hollow wood (DW), gradually deteriorating wood (GDW), and wood variation responses (WR) under the adaptive growth of discs in cross-sectional surfaces.

4. Discussion

This study examined date palm (Phoenix dactylifera) street trees in Pingtung, Taiwan, where nearly all exhibited aerial roots below 1.3 meters. These roots, linked to trunk deformation, may have resulted from improper irrigation, as excessive moisture can cause vertical trunk splitting, fungal infections, and pseudo-bark erosion [14].
Aerial roots aid root system expansion and water absorption, but their excessive growth - potentially extending up to ten feet - primarily affects appearance rather than structural integrity [1,2]). In Taiwan, date palms were watered twice weekly via overhead irrigation at 1.3 meters, possibly triggering aerial root development as a survival response to moisture stress or trunk damage. The phenomenon of aerial root growth on the outer side of the trunk is presumed to be a growth response of the tree to adapt to environmental changes.
Trunk deformation was observed in 97% of affected trees, mostly in the lower third (58%). Spray and drip irrigation were identified as key factors, causing trunk expansion rates of 3.5 cm and 3.3 cm per year, respectively. Such deformations impact aesthetics and may affect tree health. Proper irrigation management is crucial to minimizing damage and ensuring the healthy growth of date palms [15].
This study used grayscale 2D stress wave velocity imaging and grid maps to improve internal damage assessment in trees. While acoustic tomography helps detect basal stem rot in oil palms [8,17]), its accuracy is limited, especially with aerial roots affecting imaging. To address this, drilling resistance testing was combined with acoustic tomography to better identify decay and hollowness. Effective techniques, such as ultrasonic tomography and drilling resistance, have been used for royal palms (Roystonea regia) to assess wood density, moisture, and deterioration [5]). Similar methods have been applied to Acacia confusa to analyze stress wave velocity and drilling amplitude variations for decay detection [7].
The wood density of oil palm (Elaeis guineensis) decreases from the outer edge (222-404 kg/m³) to the center, as vascular bundle density declines from about 30% to 14% [18,19]). Similarly, royal palm (Roystonea regis) has a high-density outer cortex, while the inner trunk remains low-density [20,21,22]). Wood density peaks 5-10 mm from the bark, then gradually decreases towards the center [23]). These patterns align with the drilling resistance trends observed in this study.
A dark wood band forms at the junction of decayed and healthy wood, showing higher resistance amplitude, likely as an adaptive response to decay. The distinct dark wood band between the decayed and sound wood in the cross-section is likely a result of wood variation. Palms may resist decay through robust vascular bundles but lack CODIT-like compartmentalization [24]). Trees adapt structurally through reaction growth, producing new wood - such as reaction, flexure, and wound wood - to compensate for damage and stress [25]). Studies on the CODIT model at the microscopic level highlight a trade-off between tree defense and hydraulic function, primarily focusing on xylem. Further research is needed on bark immunity and endophytic fungi. Additionally, the role of radial and axial parenchyma (RAP) in fungal defense has been explored, showing that RAP’s compartmentalization and active response form a protective boundary, with living parenchyma and heartwood playing key roles [26,27].
In this study, a visual inspection for defects was conducted, and the internal condition of the trees was assessed using acoustic imaging and drilling resistance methods. The phenomena of aerial root growth and wood variation were investigated, providing references for assessing tree health risks. However, these assessments may still be influenced by multiple factors, including the tree’s own cellular structure, physiological characteristics, self-weight, gravity, moisture distribution, growth stress, environmental changes, and the limitations of the techniques used. Further exploration is still needed in the future.

5. Conclusions

This study conducted a health risk assessment of the date palm tree with aerial roots growing around its trunk. The results showed that the visual inspection revealed significant external defects in the tree, including leaning, insect damage, decay, and hollowness. The stress wave velocity 2D imaging of undamaged and decayed hollow trees confirmed the variability of the internal structure of the trunk and indicated the location of deteriorated wood through stress wave velocity grid chart. However, this method still requires further improvement in both accuracy and practicality. Coupled with drilling resistance tests, the results indicated significant variation in resistance amplitude of healthy trees in different orientations. From the bark to the center of the trunk, the drilling amplitude sharply increased to the xylem and then gradually decreased. The detection results for decayed hollow trunks reflected the degree of amplitude decrease and its location. The phenomenon of aerial root growth on the outer side of the trunk is presumed to be a growth response of the tree to adapt to environmental changes, while the distinct dark wood band between the decayed and sound wood in the cross-section is likely a result of wood variation. The findings provide a scientific basis for tree management.

Author Contributions

Peng BS and Cheng CY contributed to the preparation of experimental materials, conducted the experiments, and analyzed the data. Cheng-Jung Lin proposed the research idea and the experimental framework and wrote the manuscript. All authors read and approved the final manuscript.

Funding

This work was supported by the Taiwan Forestry Research Institute and Tung-Hai University Tree Inspection Project [No. 114GT744A01 and No. Q11300033].

Data Availability Statement

The date palm trees detection dataset used in this study is confidential but can be made available by the corresponding author upon reasonable request after the article is published online.

Acknowledgments

This study was financially supported by the Science and Technology Project of the Taiwan Forestry Research Institute, and we are gratefully acknowledged.

Conflicts of Interest

The authors declare that there are no competing interests.

References

  1. Kirschner, G.K.; Xiao, T.T.; Blilou, I. Rooting in the Desert: A Developmental Overview on Desert Plants. Genes 2021, 12, 709. [Google Scholar] [CrossRef] [PubMed]
  2. Schuch, U.K.; Quist, T.M. Arizona Landscape Palms and their Management. Cooperative Extension, University of Arizona. 2023, http://hdl.handle.net/10150/671215.
  3. Linhares, C.S.F.; Gonçalves, R.; Martins, L.M.; Knapic, S. Structural Stability of Urban Trees Using Visual and Instrumental Techniques: A Review. Forests 2021, 12, 1752. [Google Scholar] [CrossRef]
  4. Nocetti, M.; Brunetti, M. Advancements in Wood Quality Assessment: Standing Tree Visual Evaluation - A Review. Forests 2024, 15, 943. [Google Scholar] [CrossRef]
  5. Lin, C.J.; Chang, T.T.; Juan, M.Y.; Lin, T.T. Detection deterioration in royal palm (Roystonea regia) using ultrasonic tomographic and resistance microdrilling techniques. J. Trop. Forest Sci. 2011, 23, 230–270. [Google Scholar]
  6. Lin, C.J.; Chung, C.H.; Wu, M.L.; Cho, C.L. Detection of Phellinus noxius decay in Sterculia foetida tree. J. Trop. Forest Sci. 2013, 25, 487–496. [Google Scholar]
  7. Lin, C.J.; Lin, P.H.; Chang, C.Y.; Gong, Q.Z. Detection of Ganoderma australe Decay in Three Acacia confusa Trees: A Case Study. Arboric. Urban For. 2025, 1–14. [Google Scholar] [CrossRef]
  8. Ishaq, I.; Alias, M.S.; Kadir, J.; Kasawani, I. Detection of basal stem rot disease at oil palm plantations using sonic tomography. J. Sustain. Sci. Manag. 2014, 9, 52–57. [Google Scholar]
  9. Son, J.; Kim, S.; Shin, J.; Lee, G.; Kim, H. Reliability of nondestructive sonic tomography for detection of defects in old Zelkova serrata (Thunb.) Makino trees. Forest Sci. and Techno. 2021, 17, 110–118. [Google Scholar] [CrossRef]
  10. Downes, G.M.; Lausberg, M.; Potts, B.M.; Pilbeam, D.L.; Bird, M.; Bradshaw, B. Application of the IML Resistograph to the infield assessment of basic density in plantation eucalypts. Aust. For. 2018, 81, 177–185. [Google Scholar] [CrossRef]
  11. Fundova, I.; Funda, T.; Wu, H.X. Non-destructive wood density assessment of Scots pine (Pinus sylvestris L.) using resistograph and Pilodyn. PLoS One 2018, 13, e0204518. [Google Scholar] [CrossRef]
  12. Sharapov, E.; Brischke, C.; Militz, H.; Smirnova, E. Effects of white rot and brown rot on the drilling resistance measurements in wood. Holzforschung 2018, 72, 905–913. [Google Scholar] [CrossRef]
  13. Sharapov, E.; Brischke, C.; Militz, H. Assessment of preservative- treated wooden poles using drilling-resistance measurements. Forests 2020, 11, 20. [Google Scholar] [CrossRef]
  14. Al-Mana, F.A.; Ahmad, Y.A. Case study on the trunk’s deformity of date palm trees used in street landscape in Riyadh, Saudi Arabia. Am.-Eurasian J. Agric. Environ. Sci. 2010, 8, 67–72. [Google Scholar] [CrossRef]
  15. Al-Sulbi, A.O. Date palm (Phoenix dactylifera) trunk deformation in public landscaping: Causes and categorization. Landscape Online 2019, 65, 1–12. [Google Scholar] [CrossRef]
  16. FAKOPP Manual for the ArborSonic 3D Acoustic tomography. User’s manual v6.5. 2020, 63pp.
  17. Michael, M.L.; Cheong, S.Y.; Janaun, J.; Phin, C.K.; Dayou, J. A Short Report on Application of Acoustic Tomography for Basal Stem Rot Disease Severity Assessment in Oil Palm. The Planter, Kuala Lumpur 2021, 97, 465–476. [Google Scholar] [CrossRef]
  18. Srivaro, S.; Matan, N.; Lam, F. Property gradients in oil palm trunk (Elaeis guineensis). J. Wood Sci. 2018, 64, 709–719. [Google Scholar] [CrossRef]
  19. Ramle, S.F.M.; Sulaiman, O.; Hashim, R.; Arai, T.; Kosugi, A.; Abe, H.; Murata, Y.; Mori, Y. Parenchyma and vascular of Oil Palm. Lignocellulose 2012, 1, 33–44. [Google Scholar]
  20. Rinn, F. Detecting Fungal Decay in Palm Stems by Resistance Drilling. Florida Arborist, 2013a, Florida (Spring+Summer 2013).
  21. Rinn, F. Shell-wall thickness and breaking safety of mature trees. Western Arborist 2013b, 39 (3), 14–18 (Fall 2013).
  22. Lin, C.J.; Yang, T.H. Detection of acoustic velocity and electrical resistance tomographies for evaluation of peripheral-inner wood demarcation in urban royal palms. Urban For. Urban Greening 2015, 14, 583–589. [Google Scholar] [CrossRef]
  23. Huang, Y.H.; Chung, C.H.; Wu, M.L.; Lin, C.J. Stress Wave Tomogram and Wood Density Profile in a Royal Palm Tree: a Case Study. Taiwan J. Forest Sci. 2013, 28, 129–44. [Google Scholar]
  24. Lilly, S.; Bassett, C.G.; Komen, J.; Purcell, L. Arborists’ Certification Study Guide (4th ed.). Champaign, IL: International Society of Arboriculture (ISA). 2022, 200pp.
  25. Dunster, J.A.; Smiley, E.T.; Matheny, N.; Lilly, S. Tree risk assessment manual. International Society of Arboriculture. Second Edition. Champaign, Illinois, U.S. 2017, 200pp.
  26. Morris, H.; Brodersen, C.; Schwarze, F.W.M.R.; Jansen, S. The parenchyma of secondary xylem and Its critical role in tree defense against fungal decay in relation to the CODIT model. Front. Plant Sci. 2016, 7, 1665. [Google Scholar] [CrossRef]
  27. Morris1, H.; Hietala, A.M.; Jansen, S.; Ribera, J.; Rosner, S.; Salmeia, K.A.; Schwarze, F.W.M.R. Review: Part of the focus issueon plant defence and stress response. Using the CODIT model to explain secondary metabolites of xylem in defence systems of temperate trees against decay fungi. Annals Botany 2020, 125, 701–720. [Google Scholar] [CrossRef] [PubMed]
Figure 1. Inclined date palm tree and aerial roots growing around the trunk.
Preprints 150143 g001
Figure 2. Sonic tomography test on date palm using a Fakopp stress wave tomographic tool. a. Photo of the appearance of a date palm tree trunk. b. Sensor arrangement (1 to 8), sonic measurement paths, and stress wave velocity tomography with a green-yellow-red scale (highest to lowest velocity). c. Schematic of the stress wave velocity tomography with a gray scale (highest to lowest velocity) and the corresponding stress wave velocity grid map (30 x 30 mm) (no. 27).
Preprints 150143 g002aPreprints 150143 g002b
Figure 3. Sonic tomography test on a decay-damaged date palm using a Fakopp stress wave tomographic tool. a. Disc photo of the cross section appearance of a date palm tree trunk; b. Stress wave velocity tomography with a green-yellow-red scale (highest to lowest velocity); c. Schematic of the stress wave velocity tomography with a gray scale (highest to lowest velocity) and the corresponding stress wave velocity grid map (30 x 30 mm) (no. 78).
Preprints 150143 g003
Figure 4. The drilling amplitude profiles (east to west) to the center of the trunk of living date palm trees.
Preprints 150143 g004
Figure 5. The drilling resistance amplitude (%) of undamaged (No. 27) and decayed date palm discs (No. 78) in cross-sections.
Preprints 150143 g005
Figure 6. The drilling amplitude profiles to the center of the trunk of undamaged date palm discs (No. 27).
Preprints 150143 g006
Table 1. Transverse stress wave velocities (V, m/sec) in tomographies of undamaged living date palm trees (N=30).
No. H(cm) Dia of 2D (cm) V(m/s)
Vmax Vmean Vmin
s1 135 45.9 1329 1049 770
s2 140 36.0 1753 1348 943
s3 140 41.4 1424 967 510
s4 160 36.9 1841 1422 1003
s5 130 44.3 1493 1114 735
s6 140 38.5 1473 1153 833
s7 145 35.0 1617 1247 877
s8 145 39.5 1542 1231 920
s9 135 41.7 1402 1161 920
s10 150 40.1 1405 1062 719
s11 150 32.8 1766 1284 803
s12 150 36.9 1291 1078 865
s13 145 43.3 1479 1135 791
s14 145 39.2 1590 1263 937
s15 140 35.0 1876 1478 1080
s16 140 40.1 1696 1384 1072
s17 145 39.2 1611 1220 830
s18 150 34.4 1696 1351 1007
s19 135 35.7 2159 1663 1167
s20 150 44.6 1569 1243 917
s21 170 35.7 1673 1300 928
s22 150 36.3 1428 1021 614
s23 155 37.9 1463 1073 684
s24 185 35.4 1872 1366 861
s25 170 40.4 1376 1018 661
s26 140 34.1 2094 1547 1000
s27 135 38.5 1745 1243 741
s28 150 28.0 1847 1275 703
s29 145 37.6 1956 1466 977
s30 145 34.7 2084 1568 1053
Average 38.0 1651.7 1257.7 864.0
SD 3.8 236.7 177.7 152.4
Note: Vmax, maximum stress wave velocity; Vmean, mean stress wave velocity; Vmin, minimum stress wave velocity; Vmax-Vmin, SD, standard deviation.
Table 2. The drilling resistance amplitude (%) of undamaged living date palm trees (N = 5).
No. Position ADA (%) MIA (%) MDA (%)
245 N 23.10 2.34 77.20
W 17.22 2.10 62.24
E 17.97 0.02 64.26
S 21.75 2.18 69.90
254 N 32.97 11.54 53.47
W 33.42 16.85 53.09
E 30.00 9.03 55.55
S 37.82 10.87 63.30
275 N 30.68 3.93 56.16
W 30.41 1.80 60.63
E 27.11 7.87 53.65
S 27.55 3.70 51.48
287 N 18.65 2.69 33.05
W 22.94 1.47 53.91
E 16.74 3.31 30.88
S 27.36 3.06 54.39
345 N 31.25 4.91 78.89
W 25.84 3.87 80.26
E 22.47 3.87 47.79
S 22.74 4.91 43.66
Average 25.90 5.02 57.19
SD 5.96 4.17 13.25
Note: ADA, Average drilling resistance amplitude (%); MDA, Maximum drilling resistance amplitude (%); MIA. Minimum drilling resistance amplitude (%); SD, Standard deviation.
Table 3. The drilling resistance amplitude (%) to the center of the trunk of undamaged date palm discs (No. 27).
No. Position ADA (%) MIA (%) MDA (%)
27 N 27.38 5.90 52.81
W 26.60 4.73 61.00
E 26.99 7.42 54.38
S 33.68 7.10 72.19
Average 28.66 6.29 60.10
SD 3.36 1.23 8.81
Note: ADA, Average drilling resistance amplitude (%); MDA, Maximum drilling resistance amplitude (%); MIA. Minimum drilling resistance amplitude (%); SD, Standard deviation.
Disclaimer/Publisher’s Note: The statements, opinions and data contained in all publications are solely those of the individual author(s) and contributor(s) and not of MDPI and/or the editor(s). MDPI and/or the editor(s) disclaim responsibility for any injury to people or property resulting from any ideas, methods, instructions or products referred to in the content.
Copyright: This open access article is published under a Creative Commons CC BY 4.0 license, which permit the free download, distribution, and reuse, provided that the author and preprint are cited in any reuse.
Prerpints.org logo

Preprints.org is a free preprint server supported by MDPI in Basel, Switzerland.

Subscribe

Disclaimer

Terms of Use

Privacy Policy

Privacy Settings

© 2025 MDPI (Basel, Switzerland) unless otherwise stated