Submitted:
20 February 2025
Posted:
21 February 2025
You are already at the latest version
Abstract
This study proposes an innovative methodology that combines experimental microCT imaging with Monte Carlo irradiation simulations using the PENELOPE code aimed at enabling detailed analyses of different features involved in the irradiation processes along with elemental mapping, as required for X-ray fluorescence imaging of in vivo samples. By examining the relationship between signal-to-noise ratio (SNR) and absorbed dose (D), a mathematical approach was proposed to determine critical points where their rates of change are equal. Thus, allowing to identify optimal concentrations of gold dispersions to the specific simulated system of interest, where the signal quality efficiently improves as weighted in relation to the absorbed dose. The proposed methodology has been applied to a typical small animal (rat) microCT that was further used by the computationally implemented model to infuse the animal kidneys by different amounts of gold. For the K_(α_1 ), K_(α_2 ), and K_(β_1 ) lines, these critical concentrations were found to be 0.78 %, 1.32 %, and 0.32 % w/w, respectively, while no such behavior was identified for the K_(β_2 ) line under the given configuration considered as a representative/typical small animal infused with Au-based agents. The obtained results highlight the methodology's ability to optimize the balance between the absorbed dose and corresponding SNR, obtaining high-quality images without compromising in vivo samples due to excessive radiation exposure. Moreover, the proposed methodology provides high-resolution structural imaging and detailed elemental mapping, facilitating the analysis of detection limits along with the overall system performance. These findings confirm the robustness and reliability of the approach, offering a valuable tool for refining X-ray spectroscopy imaging processes and advancing X-ray fluorescence-based tomography techniques.
Keywords:
X-ray fluorescence imaging
; X-ray micro-tomography
; Gold nanoparticles
; Monte Carlo simulation
1. Introduction
In recent decades, biomedical imaging has experienced significant advances, establishing itself as a fundamental tool in diagnosis and clinical research [1,2]. Among the most prominent imaging techniques are those based on X-rays, which have evolved from traditional methods to more sophisticated approaches that combine detection precision with quantitative characterization capabilities [3,4,5]. These advances have enabled a more detailed exploration of biological tissues, revealing crucial information about their structure and composition at the micro and nanometric levels [6,7]. The ability to accurately quantify biomarkers is essential for assessing physiological and pathological states, underscoring the importance of optimizing imaging techniques to improve sensitivity and specificity in biomedical studies [8,9].
In this context, X-ray micro-computed tomography (microCT or μCT) and X-ray fluorescence computed tomography (XFCT) have emerged as prominent analytic techniques to characterize biological tissues [10,11]. MicroCT has proven to be a powerful tool for obtaining high-resolution morphological images [12,13]. However, despite its advantages, μCT faces significant limitations, including low contrast in soft tissues and the need for high radiation doses to enhance resolution, which can be detrimental to alive, biological, or delicate samples. On the other hand, the XFCT technique, especially when combined with agents based on high atomic number (Z), such as high Z nanoparticles, has shown great potential for detecting and mapping trace elements in tissues, providing functional and molecular information that complements the morphological data obtained by μCT [14,15]. Nonetheless, XFCT faces various challenges in terms of scanning time, spatial resolution, and detection limits, which still require improvements for its effective application in preclinical and clinical settings [16,17,18]. Enhancing the signal-to-noise ratio is crucial to improve the effectiveness of XFCT-based imaging in terms of sensitivity and the signal-to-noise ratio (SNR) [19,20]. This issue implies that a high dose of X-rays is needed to obtain an acceptable image quality, which is particularly concerning in vivo studies, where minimizing radiation exposure is critical [21,22]. Another drawback is due to the shallow penetration, affected by the attenuation of the incident beam and the X-ray fluorescence (XRF), which restricts the use of XFCT to superficial studies [23,24].
Besides the scope of optimizing the SNR, understanding the relationship between SNR and the absorbed dose D is key to improving XFCT imaging. This study explores this relationship using computational analysis to identify the critical points at which the rates of change of the SNR and D are equivalent, thereby balancing image quality and radiation exposure.
Maximizing the fluorescence signal as a function of (high Z-based) biomarker concentration and dose is essential to obtain precise and reproducible XFCT performance, which is crucial in diagnostic and therapeutic applications. Proper optimization of these variables allows more accurate biomarkers’ quantification, fundamental for assessing pathological processes and facilitating clinical decisions.
MC methods have long been a cornerstone in the simulation of radiation transport and collision processes. This technique, which relies on statistical sampling to model the complex interactions of particles with matter, offers a robust framework for addressing a wide range of problems in radiation physics. Historically, foundational works by Reynaert, et al. [25] laid the groundwork for MC techniques, demonstrating their potential in computational physics. More recently, advancements in computational power and algorithmic sophistication have significantly enhanced the accuracy and efficiency of MC simulations [26]. For instance, contemporary studies have refined the application of variance reduction techniques and parallel processing, further cementing the relevance of MC methods in modern research [27,28]. The application of MC methods to biomedical purposes has seen substantial growth, driven by their ability to model complex biological systems with high precision. Traditional applications include dosimetry and radiotherapy treatment planning, where MC simulations provide detailed insights into dose distribution and radiation interaction with tissues [29,30]. PENELOPE (Penetration and Energy Loss of Positrons and Electrons) is a well-established MC code designed specifically for the simulation of electron and photon transport [31]. Its suitability for medical physics stems from its detailed physical models and versatility in handling various interaction processes. Previous works have confirmed and validated PENELOPE’s accuracy in simulating radiation transport in medical imaging and therapy contexts. The continuous updates and validations against experimental data ensure that PENELOPE remains a reliable tool for medical physics’ general purposes [32,33]. However, the accuracy of the simulations is intrinsically linked to the level of detail of the computational model of the sample [34,35].
This study presents an innovative methodology that integrates DICOM images obtained from a typical small animal (Wistar rat) microCT into a MC simulation subroutine based on the PENELOPE main code aimed at achieving realistic and high-precision radiation transport modelling. This approach allows combining MC simulations with experimental images to build a robust model to further evaluate the X-ray fluorescence signal from high Z materials, according to different detection arrangements and/or irradiation setup, for instance. From simulations performed with representative samples, critical parameters such as SNR/dose ratio and detection limit have been characterized, demonstrating the potential of this methodology to optimize the accuracy and efficiency of XFCT applications in biomedical fields.
2. Materials and Methods
This section is structured to first provide an overview of the methods and materials used in the study, followed by a detailed analysis of each stage of the methodological process. It starts with a description of the data used to perform the simulations, then describes the setup used to perform the simulations, and continues with a subsection devoted to the implemented simulation process and the data processing, explained in more depth.
2.1. Data Acquisition
The μCT images used in this study were obtained from a Wistar rat using a home-made microCT system equipped with a bidimensional flat panel like detector and a conventional orthovoltage X-ray source [36,37]. As depicted in Figure 1, a typical cone-beam three-dimensional image reconstruction process was carried out in laboratory facilities, allowing access to detailed morphological information.
Further image processing techniques enabled the precise segmentation of organs and tissues using specialized pattern recognition, using the Insight Toolkit (ITK) provided by Python [38]. Thereby, special efforts were invested to kidneys’ segmentation, while other tissues/organs were assigned labels according to 3 classes/materials: air, soft tissue, and compact bone; as illustrated in Figure 1. It is worth remarking that image segmentation was carried out supervised by experts with several years of experience in small animals’ image processing, ensuring detailed and reliable analysis.
2.2. Simulation Approach: PENELOPE-PENEASY
Simulations for this study were performed using the MC software penEasy for PENELOPE v2018 [39,40,41] by inputting segmented DICOM images previously obtained from the Wistar rat μCT scan, as shown in Figure 1. For further analysis, seven independent simulations were performed using different near water-equivalent media made of gold-in-water dispersions to represent the gold-infused kidneys, while aiming at keeping original (no gold infusion) tissue segmentation. The different gold concentrations within the rat kidneys considered, are detailed in Table 1 and Table 2 along with the corresponding changes in mass density and mean excitation/ionization energy/potential (<I>). Although assessing reliable values for the mass density of dispersions might be accomplished by different models, equation 1 was used as an acceptable approximation to estimate the effective mass density of low concentration gold-infused water-equivalent media.
where and represent the concentrations of gold and water-equivalent medium; respectively. Similarly, and denote the corresponding mass densities.
It is important to note that most MC codes, such as PENELOPE, employ this approximation to evaluate the effective trends of compounds as a function of their elemental compositions. For example, molecular cross sections in PENELOPE are defined by grid-organised tables of tracking particle kinetic energies, suitably spaced to account for the rapid variation of the cross section near the absorption edges.
During the XFCT simulation, samples were subjected to an irradiation process using an incident X-ray beam rotating 360° by 2° increments. This allowed for uniform Au-infused organs irradiation, which implemented a 150 keV monoenergetic cone beam with geometric properties ensuring the complete coverage of the sample’s region of interest. A total of primary photons were used in all cases, while relevant simulation parameters used in the electron–positron transport algorithm were set according to the PENELOPE code manual, thus: C1 (multiple scattering mean angular deflection in elastic processes), C2 (maximum mean fractional energy loss between successive hard elastic events), WCR (cut-off energy loss for the Bremsstrahlung emission), and WCC (cut-off energy loss (in eV) for hard inelastic collisions), were: 0.2, 0.2, 1000, and 10000; respectively.
2.2.1. Phase Space
The proposed approach has been implemented to attain a reliable and suitable simulation model of the XFCT system based on physical characteristics of typical along with the corresponding essential stages aimed at simulation validation by comparisons against experimental measurements. Typical μCT and XFCT setups involve divergent X-ray beams exciting high Z agents within the sample to generate X-ray fluorescent photons that are further detected by specific spectrometry arrangements. Because only a small fraction of the secondary photons contribute to the detectable signal, performing full simulations may be impractical or very time-consuming. However, the well-known “phase space” technique, which is based on assessing the instantaneous state of all relevant phase state variables of the system, may be helpful and less time-consuming once critical issues, like sample’s emerging spectra are validated. Furthermore, the availability of the phase space state, typically accomplished in MC simulations by writing out the corresponding phase space file (PSF), can be largely useful to reduce the need to simulate the full system in each run. Hence, the PSF appears as particularly attractive for the purposes of the present study. In the PENELOPE-penEasy code, the implementation of PSF allows for assessing outputs containing detailed information about particle trajectories and interactions; while improving the computational efficiency of the developed subroutine that successfully captures the outgoing radiation according to the characteristics of the incident radiation and the irradiated sample, as illustrated in Figure 2.
Figure 2.
The position of the particles extracted from the phase space model representing the radiation emerging from the sample. Processing and graphical tools have been used to localize and visualize the emitted photons (denoted by orange points) restricted to an axial slice delimited according to specific position and propagation direction around the kidneys.
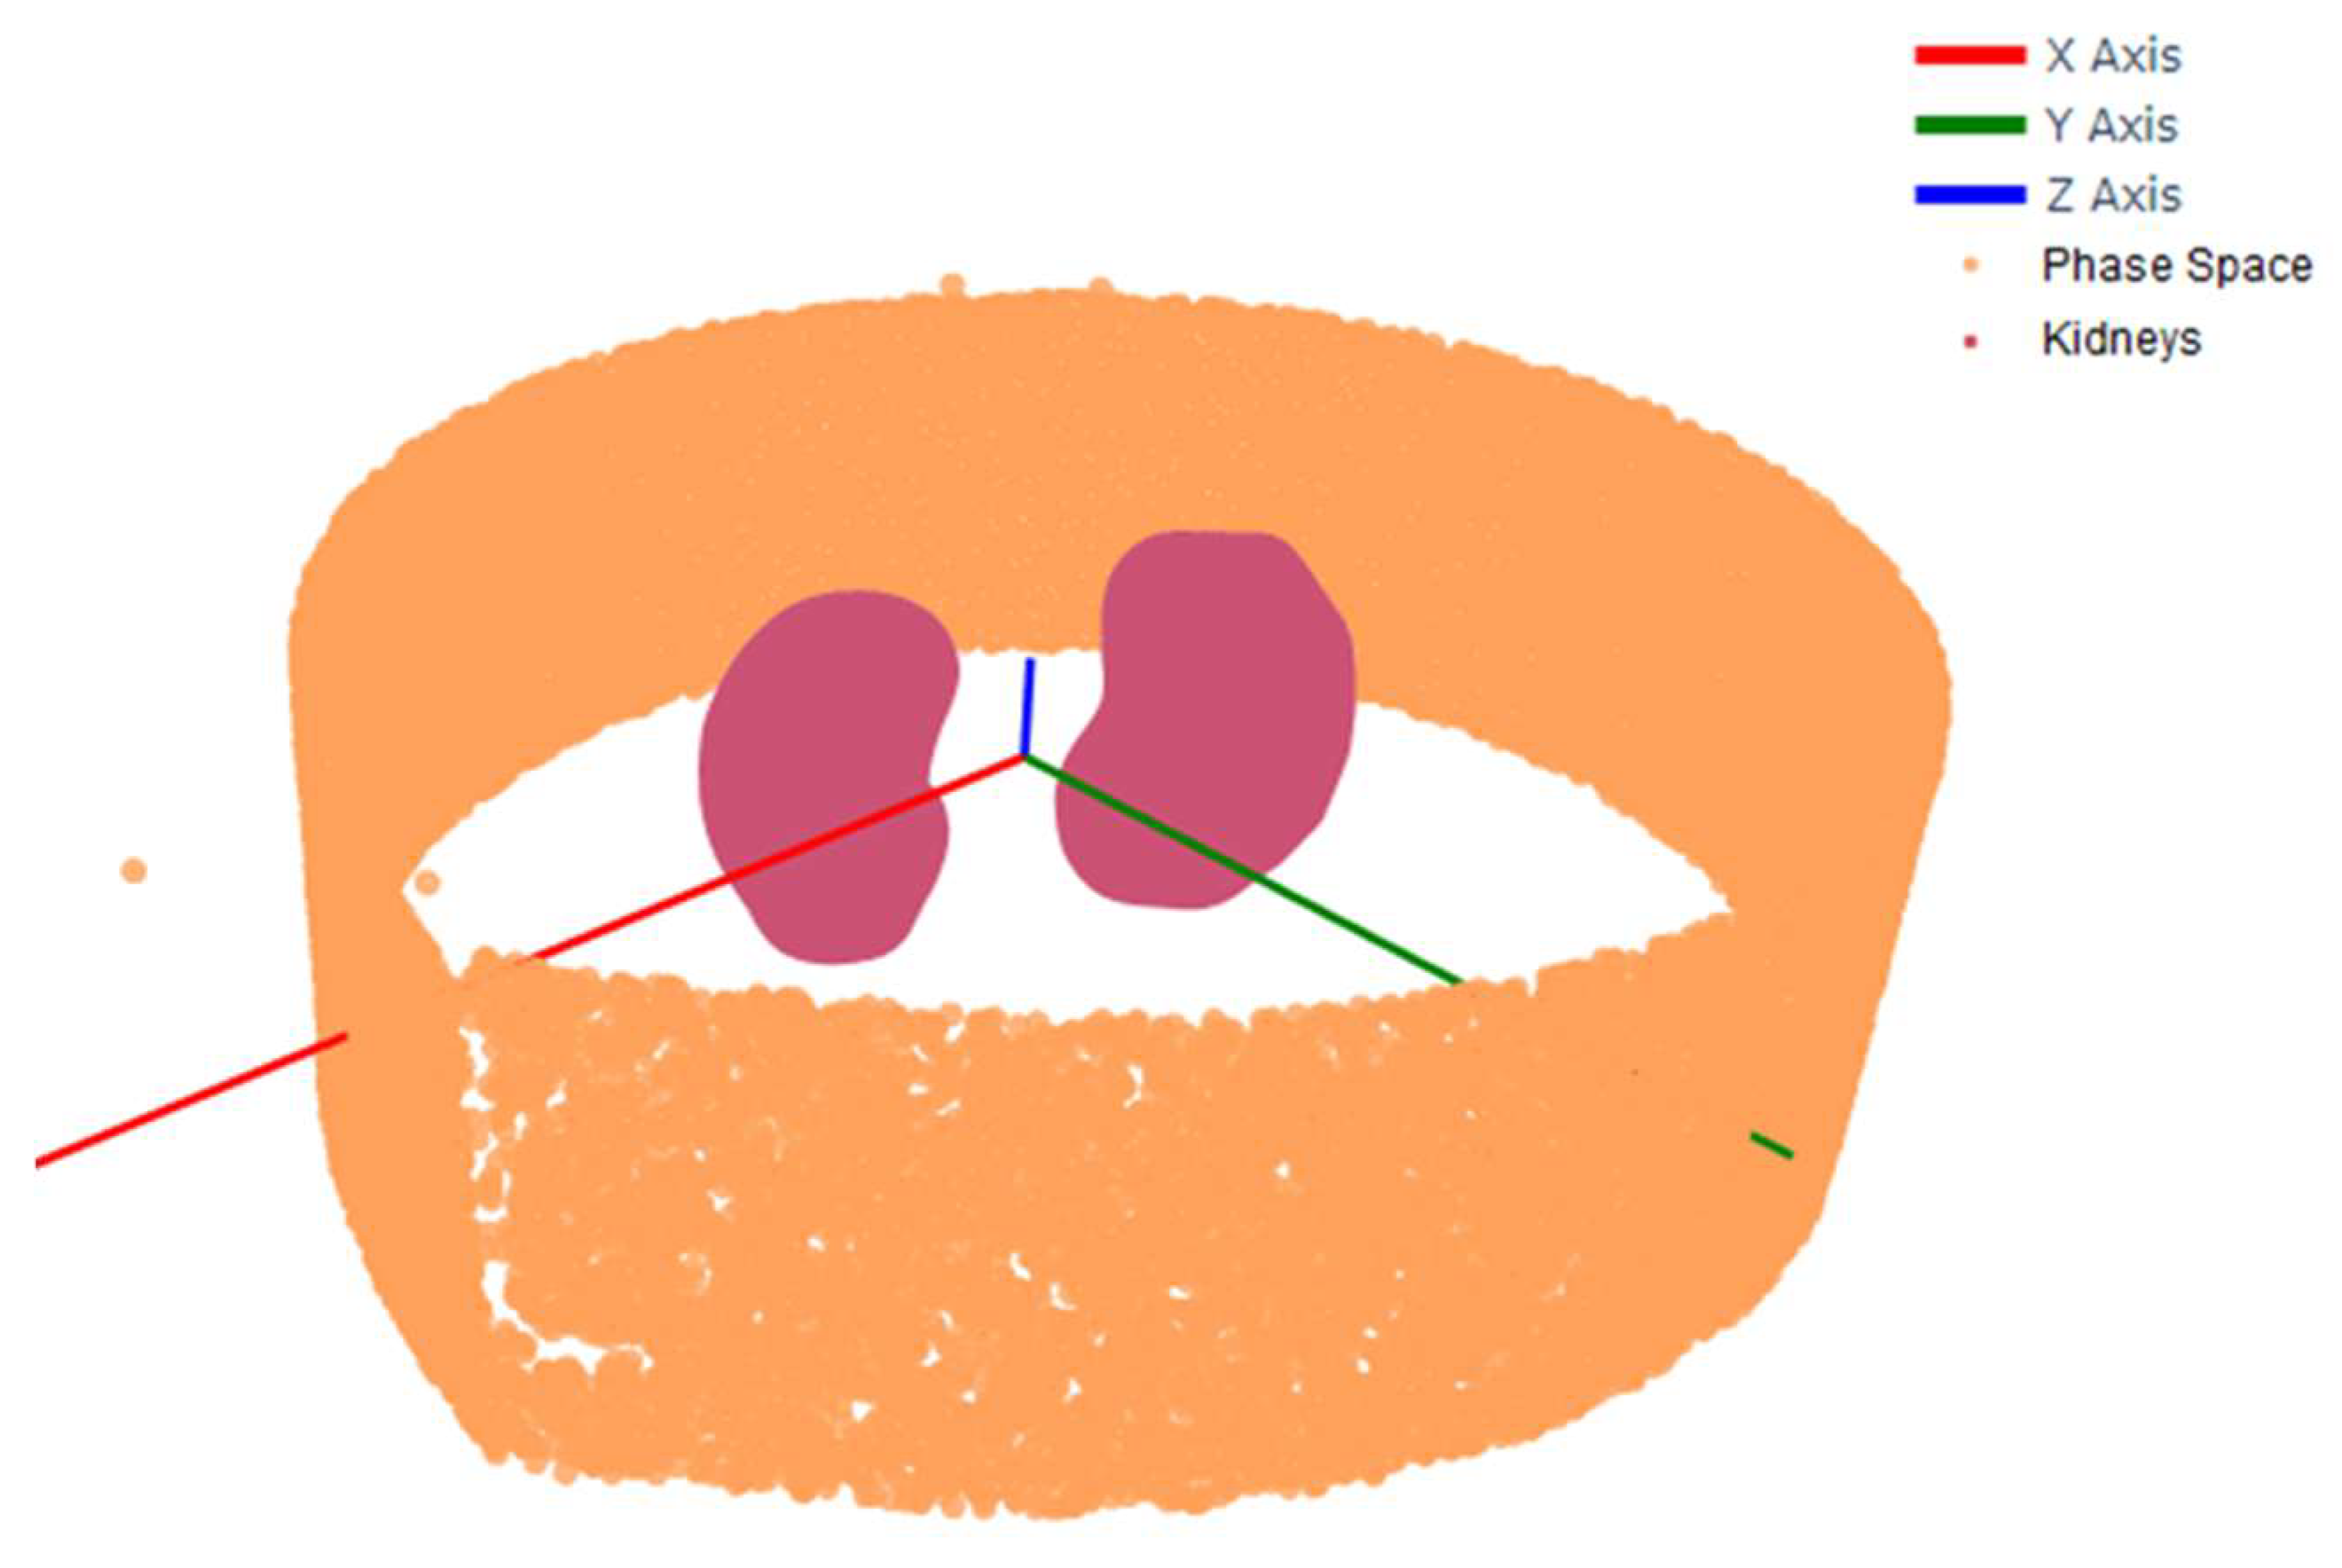
Figure 3.
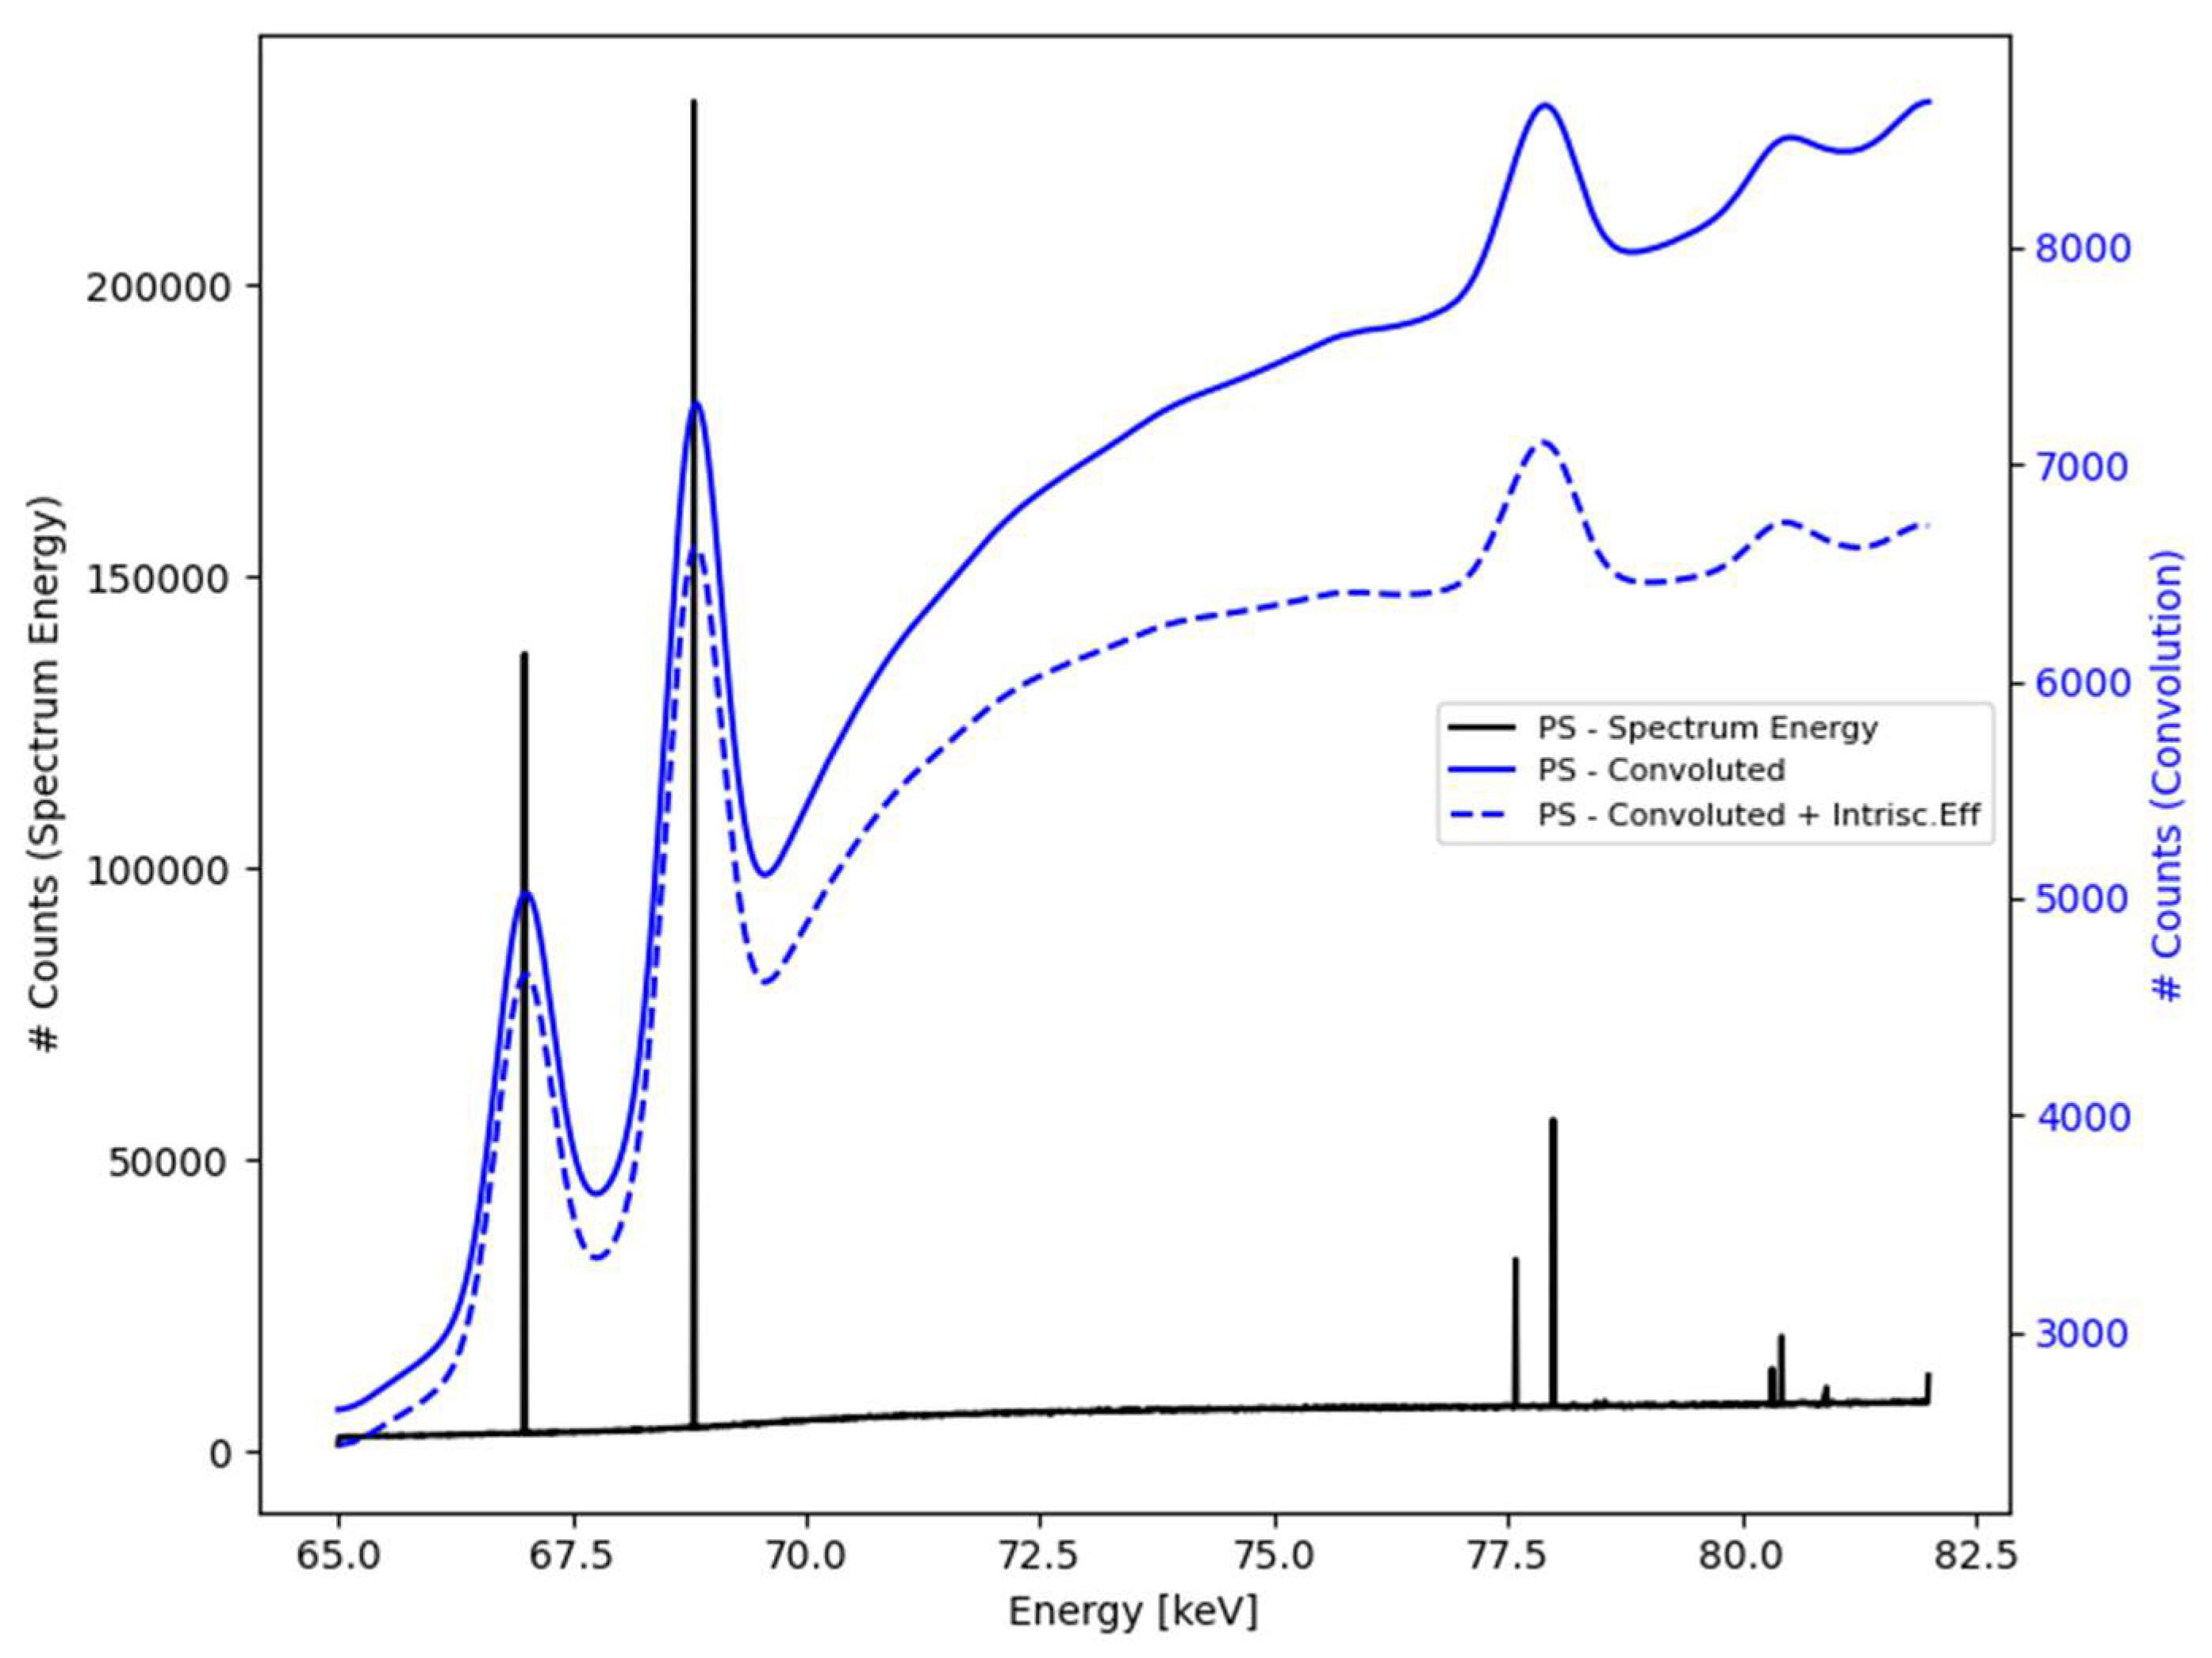
The spectroscopy signal (black) is extracted from the PSF and further convolved by a detector’s response function that includes the intrinsic energy efficiency (solid blue) and, finally, the intrinsic efficiency along with the Gaussian broadening effects (dashed blue).
Figure 3.
The spectroscopy signal (black) is extracted from the PSF and further convolved by a detector’s response function that includes the intrinsic energy efficiency (solid blue) and, finally, the intrinsic efficiency along with the Gaussian broadening effects (dashed blue).
2.2.2. Spectrum processing and detection system modeling
The capture of the outgoing radiation, as obtained from MC simulation by considering all interactions and energy depositions within the sample, allows the management of multiple complex scenarios that share the same irradiation process. This information makes it possible to project the outgoing radiation onto different detection system models/arrangements, eliminating the need for additional MC simulations. The developed subroutine facilitates this process by preprocessing the variables and features preserved in the output PSF, as illustrated in Figure 2, where only photons with propagation directions within a predefined acceptance are considered.
For the purposes of this study, it has been chosen as the initial approach to process the outgoing PSF without projecting it to any specific detector configuration, i.e., tio account for the whole emerging signal. This approach guarantees an accurate representation of the emerging radiation and it is equivalent to assuming an abstract spherical (4π-like) detector that encompasses the entire PSF, providing a maximum dimension for the analysis, thus representing the most favourable scenario.
The developed subroutine allows obtaining an energy spectrum of the outgoing photons and extracting the spectroscopic signal. To evaluate the XRF signal, the implemented method subtracts the broadband Compton scattering background by means of a polynomial fit, thus isolating the scattering background signal. In this way, the net XRF signal in any energy range of interest is obtained directly. This approach is particularly suitable for high-resolution detectors, although modelling low-resolution detectors can present additional challenges. For example, in high-energy detectors such as CdTe, the resolution is limited by an specific response function that depends on the photon energy and includes effects such as Gaussian broadening (caused by electronic noise and statistical fluctuations) and the full-tail effect, which generates an exponential tail towards lower energies.
To address these challenges, suitable binarization levels were determined to build histograms based on real spectrometer models, such as the Amptek CdTe [43], which offers an energy resolution between 0.6 and 2.0 keV depending on the photon energy. Within the 65 to 82 keV range, where the quantitative analysis is concentrated, the pre-processed emergent irradiance was sampled and convolved with a 0.8 keV FWHM Gaussian function resulting in an approximate FWHM of 0.75 keV (see Table 3 and Figure 4), comparable to the actual capability of CdTe semiconductor detectors in that energy range [44,45].
In addition, the convolution approach incorporates a model for the response function accounting for the intrinsic energy efficiency and Gaussian broadening effects due to energy resolution, as described in [46]. Thus, the proposed methodology allows for more reliable evaluations of the net XRF signal, as shown in Figure 3. Although it is important to note that for the illustration purposes of the selected application example the effects of extrinsic efficiency were not taken into account, if interests are focused on the performance of a specific case, the extrinsic efficiency of the corresponding detection system (detector along with collimators and accessories) can be taken into account, because the methodology has the capability to add those factors with the consequence of needing to increase the computation time.
2.3. Signal-to-Noise Ratio and Absorbed Dose: An Approach for Optimizing XRF Detection
As depicted, a proper assessment of the energy resolution is essential for determining the quality of the net XRF signal, which is typically expressed quantitatively as the signal-to-noise ratio (SNR), which was calculated as the ratio among the differences between the mean amplitude of the net XRF signal () and the corresponding mean background scaled by the square root of the corresponding signal components (background and net XRF), as indicated by expression (2):
It is worth pointing out that expression (2) holds assuming that both and have Poisson probability distributions. This relationship facilitates the determination of the detection limit, defined as the minimum concentration producing a signal that can be reliably identified in the presence of noise. Besides, the absorbed dose D is a critical parameter that represents the amount of energy deposited by the radiation in the material per unit of mass. Expressed in grays (Gy), where 1 Gy = 1 J/kg, the absorbed dose not only quantifies the radiation exposure but also plays a decisive role in signal quality. Higher doses typically increase the SNR due to enhanced photon statistics, although excessive dose levels can lead to sample damage or being actually impracticable for biomedical applications. For the purposes of this study, the absorbed dose was calculated using the same voxelized grid as the μCT, obtaining the mean value (D(i,j,k)) along with an estimation (3 standard deviations) for the corresponding uncertainty (σD(i,j,k)), as commonly provided by the PENELOPE MC code.
To better understand the interplay between signal quality and radiation exposure, it is useful to analyze the ratio between the SNR and the D. This ratio, SNR/D, implemented in the developed subroutine, serves as a figure of merit to evaluate the efficiency of the system. A high SNR/D value indicates that good signal quality is achieved with minimal radiation exposure, which is desirable in applications where dose minimization is critical. According to the model proposed in this study, both SNR and D may be expressed as linear relationships with respect to a variable such as exposure time or photon flux. For instance, SNR and D are proposed to be modelled as SNR=a⋅x, and D=b⋅x+c, where a, b, and c are constants experimentally determined, while x states for the independent variable, which consists of the Au concentration in this case. Thus, replacing the aforementioned into the SNR/D ratio, yields:
This expression highlights how the efficiency of the system evolves according to changing conditions -such as Au concentration- thus providing a valuable tool for optimizing both the signal quality and the radiation exposure during experiments. It is worth remarking that the proposed model, as expressed by equation (3), is based on the following main issues: i) The SNR should a be monotonically increasing function, while null SNR should correspond to the case of absent of XRF agent (high Z agent concentration =0), thus the proposed linear trend for the SNR represents the first-order approach according to the main model bases; and ii) similar issues apply to the sample absorbed dose (D) that should be monotonically increasing in accordance to the high Z agent concentration uniformly distributed inside the sample region/s of interests (kidneys, for instance), but the inclusion of the offset parameter c is required to represent the (baseline) absorbed dose in the case of no XRF agent present in the sample (D0=D(0))
3. Results
Below, the results obtained from the simulations carried out with different concentrations of gold uniformly infusing the Wistar rat’s kidneys. Additionally, detailed information is added for the different processing stages, when necessary.
3.1. Absorbed Dose Distribution
The total absorbed dose by the kidneys was calculated by adding up the dose values corresponding to all voxels identified as kidney tissue, i.e., D(i,j,k) for all (i,j,k) voxels being part of the kidneys as highlighted in yellow in the right part of Figure 1. The results for the absorbed dose in both kidneys indicate, as expected, that a higher Au concentration leads to a higher amount of absorbed dose, as summarized in Table 4.
3.2. Signal-to-Noise with XFCT
According to equation (1), the signal-to-noise ratio (SNR) of the net XRF signal was determined for the different gold concentrations uniformly distributed in the kidneys, obtaining the results reported in Figure 5.
As appreciated, the and XRF lines, having an average resolution of 0.8 keV, show SNR values greater than 3 (SNR=3 is considered as the detection limit) for concentrations of 0.1 %w/w; whereas harder emissions such as and correspond to SNR values greater than 3 for concentrations higher than 0.25 % and 1.15 % w/w, respectively. In all cases, a first-order linear fit was performed only as a first approximation, showing a promising performance.
3.3. Dose-Weighted SNR for XFCT
Incorporating the results of the total absorbed dose by both the kidneys to the SNR results shown in Figure 5, the obtained SNR/D trend is shown in Figure 6 and summarized in Table 5. Results highlight how the SNR weighed by dose varies for each one of the fluorescence emission lines according to the various gold concentrations.
In the results presented in Figure 6, a sigmoidal behavior can be appreciated for the SNR/D, regardless of the specific X-ray fluorescence emission line. As the gold concentration increases, the SNR maintains a lower rate of change as compared to the rate of change of the absorbed dose, since its slope is less than 1. However, when the gold concentration decreases, the SNR/D ratio starts to decrease rapidly, indicating a positive slope that eventually reaches values greater than 1, i.e., the rate of change of the absorbed dose is lower than the rate of change of the SNR.
In accordance with the proposed model and corresponding obtained results for the SNR/D ratio, Figure 6 depicts the methodological stage to assess the gold concentration optimizing the SNR/D figure of merit (position of dashed vertical lines). In this regard, the fitting trends reported in Figure 6 correspond to the proposed model, as described by expression (3). The obtained fitting parameters are summarized in Table 6. It is worth emphasizing that according to the proposed data fitting, gold concentration of about 0.50 and 0.78 %w/w represent suitable threshold values for and lines; respectively. In the case of the line, the optimal (threshold) concentration is found at 0.29%; whereas the line does not attain such a behavior, which is represented by the fitting model providing a (physically absurd) negative value. Finally, considering that X-ray spectra are acquired for the whole energy range of interest, i.e., without requiring any extra dose, Figure 7 depicts the SNR/D ratio corresponding to the use of all together the gold XRF K-lines.
4. Discussion
Among the different alternatives that might be considered to develop a novel methodology aimed at obtaining reliable characterization of the operative performance of different configurations of interest for μCT and XFCT, the methodology proposed in this study appears as promising sa well as preliminarily consistent. Moreover, the proposed strategy based on the phase space proves to significantly reduce the computation times avoiding to perform new MC simulations when some features of the detection systems are modified.
In terms of the results obtained for the SNR/D ratio for the different K-lines of the gold, along with the corresponding trend approximated by the functional relationship proposed in equation (2), several key observations emerge. The proposed approach allows identifying critical points where the behavior of the SNR weighted by the absorbed dose (SNR/D) changes significantly, providing insight into the efficiency of each line under the given experimental conditions. For the line, the maximum concentration at which the SNR/D exhibits a higher rate of change than the dose occurs at 0.50 % w/w. This concentration marks an efficient range where the improvements in signal quality outweigh the proportional increase in radiation dose. Beyond this concentration, the SNR/D ratio of change diminishes, and the dose grows disproportionately, indicating a reduction in dose efficiency. The line shows similar behavior, but at a higher optimal concentration (0.78 % w/w), suggesting that using spectroscopy for the imaging may require higher gold material concentrations to achieve the same favorable balance between SNR and the dose attained performing XFCT mapping using only signal. Despite this issue, the overall trend of the line remains comparable to the one observed for the case. Nevertheless, it should be remarked that the proposed model provided qualitative and quantitative support to preliminarily establish the performance of implementing or spectroscopy for gold mapping in the Wistar rat sample. Additionally, the line provides an additional point identifying 0.29 % w/w as the optimal concentration corresponding to the value where the growth rate of the dose begins to surpass the SNR rate of change. Thus, indicating that beyond this concentration, further increases in dose result in only marginal improvements in signal quality. This threshold highlights a region where the dose efficiency declines, making it a less favorable operating range, which represents a particularly relevant issue for biological, in vivo, and /or living samples.
On the contrary, no optimal concentration was identified for the line where the dose growth rate is lower than the SNR rate of change implying that for the tested concentrations, the dose always increases more rapidly than the SNR, reflecting a less efficient behavior for this spectroscopy line under the current experimental setup. Therefore, the reported results emphasize the importance of the availability of a model capable of characterizing the SNR/D ratio for each spectral line individually, as their optimal dose and concentration ranges may significantly differ. According to the obtained results for the investigated sample (Wistar rat) as a representative case of typical μCT and XFCT applications, along with the incident beam used, the Kα1 line appears to offer the most convenient/efficient balance, making it particularly advantageous for applications where dose minimization is crucial. Nonetheless, it should be highlighted that the spectroscopy by means of the line also provides useful information, albeit within a narrower range, while the line can be beneficial at higher concentrations. The line, however, may require reconsideration in terms of its practical use under the given conditions due to its less favorable trend. It is essential to quote and to note that these findings are specific to the experimental configuration described in this study. Changes in detector characteristics, sample composition, or incident radiation parameters could lead to variations in the identified critical points, highlighting the importance of system-specific analysis when applying these results to other contexts. In this regard, the proposed methodology along with the corresponding MC simulation and further particle tracking and post.-processing subroutine, appears as a valuable tool to assess a preliminarily performance of different experimental configurations potentially useful for an specific case of interest, which could offer additional insights to optimize the SNR in different experimental setups [47].
The study of the SNR/D ratio highlights a critical balance between signal quality and radiation exposure, optimizing the process to obtain high-quality images without compromising the integrity of the samples due to excessive doses. This balance is crucial to identify clear detection limits and optimize the performance of the detection system/arrangement/process in order to improve existing techniques and explore new applications [48]. Application of the proposed methodology to a typical XFCT system has demonstrated, through theoretical and experimental analysis, the upper limits achievable with semiconductor detectors such as CdTe. In this sense, the critical values identified for the spectral lines Kα1, Kα2, Kβ1, and Kβ2 allow a better understanding of the system capabilities and their relationship with signal efficiency and absorbed dose. Achieved results do not only validate the robustness of the proposed approaches, but also underline the importance of adjusting experimental setups to maximize performance according to the specific needs of each application. Thus, the proposed methodology may significantly expand its applicability in research fields and clinical applications. The developed methodology can facilitate new approaches to analysis and characterization, with the potential to set standards in combining Monte Carlo simulations with high-resolution experimental imaging. In conclusion, the main outcomes from this study highlight the transformative potential of integrating experimental images with numerical simulations, establishing a solid foundation for optimizing processes and advancing the accuracy of X-ray fluorescence computed tomography. The ability to balance the signal/dose ratio, together with the adaptability to diverse contexts, positions this system as an essential tool in the development of more efficient and versatile imaging technologies.
5. Conclusions
The proposed methodology, based on the integration of real microCT images with Monte Carlo irradiation simulations implemented by means of well-known tools, such as the PENELOPE main code, demonstrated remarkable versatility and accuracy to carry out advanced irradiation studies providing detailed information of the radiation emerging the sample as well as absorbed dose calculations. The subroutine implementing the post-processing models has demonstrated consistency and robustness. The results obtained by applying the proposed methodology to a typical case of μCT and XFCT to small animals confirm that the designed system meets the fundamental objectives, providing good resolution structural images and detailed elemental identification that may allow further complete three-dimensional analysis of the samples. The proposed methodology stands out not only for its accuracy, but also for its flexibility, allowing adaptation to different sample types and beam qualities, allowing in the future the adaptation of any kind of detection arrangements as well as mapping techniques based on X-ray fluorescence spectroscopy.
6. Patents
Official license of the PENELOPE Monte Carlo main code addressed to Dr. Mauro Valente, as NEA liaison officer, has been used.
Supplementary Materials
The following supporting information can be downloaded at the website of this paper posted on Preprints.org, Figure S1: title; Table S1: title; Video S1: title.
Author Contributions
Conceptualization, M.V. and F.M.; methodology, F.M., M.V., S.C. and N.M.; software, F.M., N.M., I.S., and P.P.; validation, N.M., F.M., I.S. and P.P.; formal analysis, N.M., F.M., and A.L.; investigation, N.M., F.M., S.C., M.S-H., A.L., and M.V.; resources, M.V., and F.M.; data curation, N.M., F.M., I.S., and P.P.; writing—original draft preparation, N.M., M.V., M.S-H.; writing—review and editing, M.V., M.S-H., A.L., F.M., S.C., and P.P.; visualization, N.M.; supervision, M.V., M.S-H., and P.P.; project administration, M.V., and F.M.; funding acquisition, M.V., and F.M. All authors have read and agreed to the published version of the manuscript.
Funding
This research was partially funded by SeCyT-Universidad Nacional de Córdoba, grant ID 33620230101110CB, CONICET, grant ID 11220200100751CO, and Universidad de La Frontera, grants’ ID DI21-0068 and ID PF24-0012. The APC was funded by DIUFRO-Universidad de La Frontera.
Institutional Review Board Statement
Not applicable
Informed Consent Statement
Not applicable.
Data Availability Statement
Data will be available upon request to the authors.
Acknowledgments
This work used computational resources from CCAD—Universidad Nacional de Córdoba (https://ccad.unc.edu.ar/), which are part of SNCAD—MinCyT, República Argentina.
Conflicts of Interest
The authors declare no conflicts of interest.
References
- R. Weissleder and M. Nahrendorf, “Advancing biomedical imaging,” Proceedings of the National Academy of Sciences, vol. 112, no. 47. Proceedings of the National Academy of Sciences, pp. 14424–14428, 23-Nov-2015.
- J. Rong and Y. Liu, “Advances in medical imaging techniques,” BMC Methods, vol. 1, no. 1. Springer Science and Business Media LLC, 01-Aug-2024.
- L.A. Feldkamp, undefined., et al. "Practical cone-beam algorithm," in Journal of The Optical Society of America A-optics Image Science and Vision, 1984.
- Flannery BP, Deckman HW, Roberg WG, D'Amico K. 2. 1987. Three-dimensional X-ray microtomography. Science 237:1439–44.
- Adrian Sheppard, Shane Latham, Jill Middleton, Andrew Kingston, Glenn Myers, Trond Varslot, Andrew Fogden, Tim Sawkins, Ron Cruikshank, Mohammad Saadatfar, Nicolas Francois, Christoph Arns, Tim Senden, Techniques in helical scanning, dynamic imaging and image segmentation for improved quantitative analysis with X-ray micro-CT, Nuclear Instruments and Methods in Physics Research Section B: Beam Interactions with Materials and Atoms, Volume 324, 2014, Pages 49-56, ISSN 0168-583X. [CrossRef]
- Till Dreier, Niccolò Peruzzi, Ulf Lundström, and Martin Bech, "Improved resolution in x-ray tomography by super-resolution," Appl. Opt. 60, 5783-5794 (2021).
- Valente, M. , Mattea, F., Martín, G., Moyano, T., & Pérez, P. (2021). Adaptation of a microCT facility for automatic recognition of bioceramic-based sealers in molar root canals aimed at endodontic treatment quality control. In X-Ray Spectrometry (Vol. 51, Issue 3, pp. 241–250). Wiley. [CrossRef]
- R. Cesáreo, et al. "A new tomographic device based on the detection of fluorescent x-rays," in Nuclear Instruments & Methods in Physics Research Section A-accelerators Spectrometers Detectors and Associated Equipment, 1989.
- J. F. Dorsey et al., “Gold nanoparticles in radiation research: potential applications for imaging and radiosensitization,” Transl. Cancer Res. 2 (4), 280 –291, 2013. [CrossRef]
- Cheong, S.-K. , Jones, B. L., K Siddiqi, A., Liu, F., Manohar, N., & Cho, S. H. (2010). X-ray fluorescence computed tomography (XFCT) imaging of gold nanoparticle-loaded objects using 110 kVp x-rays. In Physics in Medicine and Biology (Vol. 55, Issue 3, pp. 647–662). IOP Publishing. [CrossRef]
- Martín, N. E. , Haro, M. S., & Valente, N. (2024). Processing of the Signal Obtained from X-Ray Fluorescence Emissions to Estimate Localization in Biomedical Applications. In 2024 Argentine Conference on Electronics (CAE). 2024 Argentine Conference on Electronics (CAE). IEEE. [CrossRef]
- Kumar, K. , Fachet, M., Al-Maatoq, M., Chakraborty, A., Khismatrao, R. S., Oka, S. V., Staufer, T., Grüner, F., Michel, T., Walles, H., & Hoeschen, C. (2023). Characterization of a polychromatic microfocus X-ray fluorescence imaging setup with metallic contrast agents in a microphysiological tumor model. In Frontiers in Physics (Vol. 11). Frontiers Media SA. [CrossRef]
- Aime Guarda, Mauro Valente, Rodolfo Figueroa, Development and characterisation of a confocal detection array for K-lines of heavy metals in big light matrix, Radiation Physics and Chemistry, Volume 179, 2021, 109116, ISSN 0969-806X. [CrossRef]
- N. Manohar, F. J. Reynoso, y S. H. Cho, “Technical note: A benchtop cone-beam X-ray fluorescence computed tomography (XFCT) system with a high-power X-ray source and transmission CT imaging capability”, Med. Phys., vol. 45, no. 10, pp. 4652–4659, Oct. 2018.
- H. DeBrosse et al., “Comparing X-ray fluorescence emission tomography and computed tomography: contrast-to-noise ratios in a numerical mouse phantom”, Proc. SPIE, vol. 12930, 1293011, 2024.
- H. DeBrosse et al., “Joint estimation of metal density and attenuation maps with pencil beam XFET,” IEEE Trans. Radiat. Plasma Med. Sci. 7(2), 191–202 (2023).
- L. Li et al., “Full-field in vivo imaging of nanoparticles using benchtop cone-beam XFCT system with pixelated photon counting detector,” Phys. Med. Biol. 68(3), 035020 (2023).
- S. Zhang et al., “Quantitative imaging of Gd nanoparticles in mice using benchtop cone-beam X-ray fluorescence computed tomography system,” Int. J. Mol. Sci. 20(9), 2315 (2019).
- S.-K. Cheong, B. L. Jones, A. K. Siddiqi, F. Liu, N. Manohar, y S. H. Cho, “X-ray fluorescence computed tomography (XFCT) imaging of gold nanoparticle-loaded objects using 110 kVp X-rays”, Phys. Med. Biol., vol. 55, no. 3, pp. 647–662, Feb. 2010.
- H. A. DeBrosse, G. Jadick, L. J. Meng, and P. J. La Riviere, “Comparing x-ray fluorescence emission tomography and computed tomography: contrast-to-noise ratios in a numerical mouse phantom,” Medical Imaging 2024: Clinical and Biomedical Imaging. SPIE, p. 35, 02-Apr-2024.
- T. Yuasa et al., “Reconstruction method for fluorescent X-ray computed tomography by least-squares method using singular value decomposition”, IEEE Trans. Nucl. Sci., vol. 44, no. 1, pp. 54–62, Feb. 1997.
- M. Ahmad, M. Bazalova-Carter, R. Fahrig, y L. Xing, “Optimized detector angular configuration increases the sensitivity of X-ray fluorescence computed tomography (XFCT)”, IEEE Trans. Med. Imag., vol. 34, no. 5, pp. 1140–1147, May 2015.
- H. DeBrosse, G. Jadick, L. J. Meng, and P. La Rivière, “Contrast-to-noise ratio comparison between X-ray fluorescence emission tomography and computed tomography,” Journal of Medical Imaging, vol. 11, no. S1. SPIE-Intl Soc Optical Eng, 15-Oct-2024.
- S. Mandot, E. M. Zannoni, L. Cai, X. Nie, P. J. L. Rivière, M. D. Wilson, and L. J. Meng, “A High-Sensitivity Benchtop X-Ray Fluorescence Emission Tomography (XFET) System With a Full-Ring of X-Ray Imaging-Spectrometers and a Compound-Eye Collimation Aperture,” IEEE Transactions on Medical Imaging, vol. 43, no. 5. Institute of Electrical and Electronics Engineers (IEEE), pp. 1782–1791, May-2024.
- Reynaert, N. , et al. (2007). "Monte Carlo Treatment Planning for Photon and Electron Beams." Physics in Medicine & Biology, 52(21), R287-R301.
- Metropolis, Nicholas, and S. Ulam. “The Monte Carlo Method.” Journal of the American Statistical Association, vol. 44, no. 247, 1949, pp. 335–41. JSTOR. [CrossRef]
- Carter, L L, and Cashwell, E D. Particle-transport simulation with the Monte Carlo method. United States: N. p., 1975. Web. [CrossRef]
- David Sarrut, Nicolas Arbor., et al. "The OpenGATE ecosystem for Monte Carlo simulation in medical physics," in Physics in Medicine & Biology, vol. 67, no. 18, pp. 184001, 2022.
- Vasileios Eleftheriadis, Georgios Savvidis., et al. "A framework for prediction of personalized pediatric nuclear medical dosimetry based on machine learning and Monte Carlo techniques," in Physics in Medicine & Biology, vol. 68, no. 8, pp. 084004, 2023.
- Malano F, Mattea F, Geser FA, Pérez P, Barraco D, Santibáñez M, Figueroa R, Valente M. Assessment of FLUKA, PENELOPE and MCNP6 Monte Carlo codes for estimating gold fluorescence applied to the detection of gold-infused tumoral volumes. Appl Radiat Isot. 2019 Sep;151:280-288. [CrossRef] [PubMed]
- NEA (2019), PENELOPE 2018: A code system for Monte Carlo simulation of electron and photon transport: Workshop Proceedings, Barcelona, Spain, 28 January – 1 February 2019, OECD Publishing, Paris. [CrossRef]
- Mergen Knoll, I. , Quevedo, A., & Salomón Alva Sánchez, M. (2022). Applications of Simulation Codes Based on Monte Carlo Method for Radiotherapy. IntechOpen. [CrossRef]
- Asai Makoto, Cortés-Giraldo Miguel A., Giménez-Alventosa Vicent, Giménez Gómez Vicent, Salvat Francesc. The PENELOPE Physics Models and Transport Mechanics. Implementation into Geant4. Frontiers in Physics. Volume 9, 2021. [CrossRef]
- Giménez-Alventosa, V. , Giménez Gómez, V., & Oliver, S. (2021). PenRed: An extensible and parallel Monte-Carlo framework for radiation transport based on PENELOPE. Computer Physics Communications, 267, 108065.
- Sterpin E, Salvat F, Cravens R, Ruchala K, Olivera GH, Vynckier S. Monte Carlo simulation of helical tomotherapy with PENELOPE. Phys Med Biol. 2008 Apr 21;53(8):2161-80. [CrossRef] [PubMed]
- Pérez, P et al. Non-Destructive Structural Testing Using X-Ray Microtomography for Estimation of Mass Density Differences in Rabbit Bone Specimens. Int. J. Morphol. [online]. 2016, vol.34, n.4 [citado 2024-12-13], pp.1232-1238. ISSN 0717-9502. [CrossRef]
- Gilli, R; Mattera, F, Martin, G and Valente, M. X-ray microtomography to characterize the volume of the extracted root canal in endodontic instrumentation.. An. AFA [online]. 2022, vol.33, n.3 pp.70-76. ISSN 0327-358X. [CrossRef]
- McCormick M, Liu X, Jomier J, Marion C, Ibanez L. ITK: enabling reproducible research and open science. Front Neuroinform. 2014;8:13. Published 2014 Feb 20. [CrossRef]
- J. Sempau, A. Badal, & L. Brualla (2011). A PENELOPE-based system for the automated Monte Carlosimulation of clinacs and voxelized geometries–-application to far-from-axis fields. Med. Phys., 38, 5887 - 5895.
- J. Sempau, E. Acosta, J. Bar´o, & J.M. Fern´andez-Vareaand F. Salvat (1997). An algorithm for Monte Carlo simulation of coupled electron-photon transport. Nucl. Instrum. Meth. B, 132.
- J. Bar´o, J. Sempau, J. M. Fernandez-Varea, & F. Salvat (1995). PENELOPE: An algorithm for Monte Carlo simulation of the penetration and energy loss of electrons and positrons in matter. Nucl. Instrum. Meth. B, 100.
- Lawrence Berkeley National Laboratory. (n.d.). X-ray Data Booklet: Section 1 - X-ray Elements. Retrieved from https://xdb.lbl.gov/Section1/Periodic_Table/X-ray_Elements.html.
- RH Redus, JA Pantazis, TJ Pantazis, AC Huber y BJ Cross, “Caracterización de detectores de CdTe para espectroscopia cuantitativa de rayos X”, IEEE Transactions on Nuclear Science, vol. 56, n.º 4, págs. 2524-2532, agosto de 2009.
- Amptek, User Operating Manual XR-100CdTe X-Ray Detector Preamplifier. United States 2017.
- Aime Guarda, Mauro Valente, Rodolfo Figueroa, Development and characterisation of a confocal detection array for K-lines of heavy metals in big light matrix, Radiation Physics and Chemistry, Volume 179, 2021, 109116, ISSN 0969-806X. [CrossRef]
- Figueroa, Rodolfo & Valente, Mauro & Guarda, Jaime & Leiva, Jorge & Quilaguilque, Eduardo & Casanelli, Bryan & Leyton, Fernando. (2021). OXIRIS project: Development of a new XRF device for the simultaneous detection and treatment of cancer. X-Ray Spectrometry. 51. 10.1002/xrs.3272.
- M. Valente et al., "Development and characterization of a microCT facility," in IEEE Latin America Transactions, vol. 14, no. 9, pp. 3967-3973, Sept. 2016. [CrossRef]
- da Silva, J. Improved compact representation method for Monte Carlo phase spaces. Phys Med. 2023 Sep;113:102667. [CrossRef] [PubMed]
- Mahmoodian, N.; Rezapourian, M.; Inamdar, A.A.; Kumar, K.; Fachet, M.; Hoeschen, C. Enabling Low-Dose In Vivo Benchtop X-ray Fluorescence Computed Tomography through Deep-Learning-Based Denoising. J. Imaging 2024, 10, 127. [Google Scholar] [CrossRef] [PubMed]
Figure 1.
Original (left) and organ segmented (right) μCT of a small animal performed at the LIIFAMIRx microCT facility. Voxels identified as kidneys tissue after segmentation are highlighted in red and overimposed to μCT image (left), while they are represented in yellow in the 4-materials segmentation (right) aiming at a facilitated visualization. The μCT image was reconstructed using 800 image projections acquired by a 200 μm pixel side flat panel and using a 65 kVp (W anode) X-ray beam.
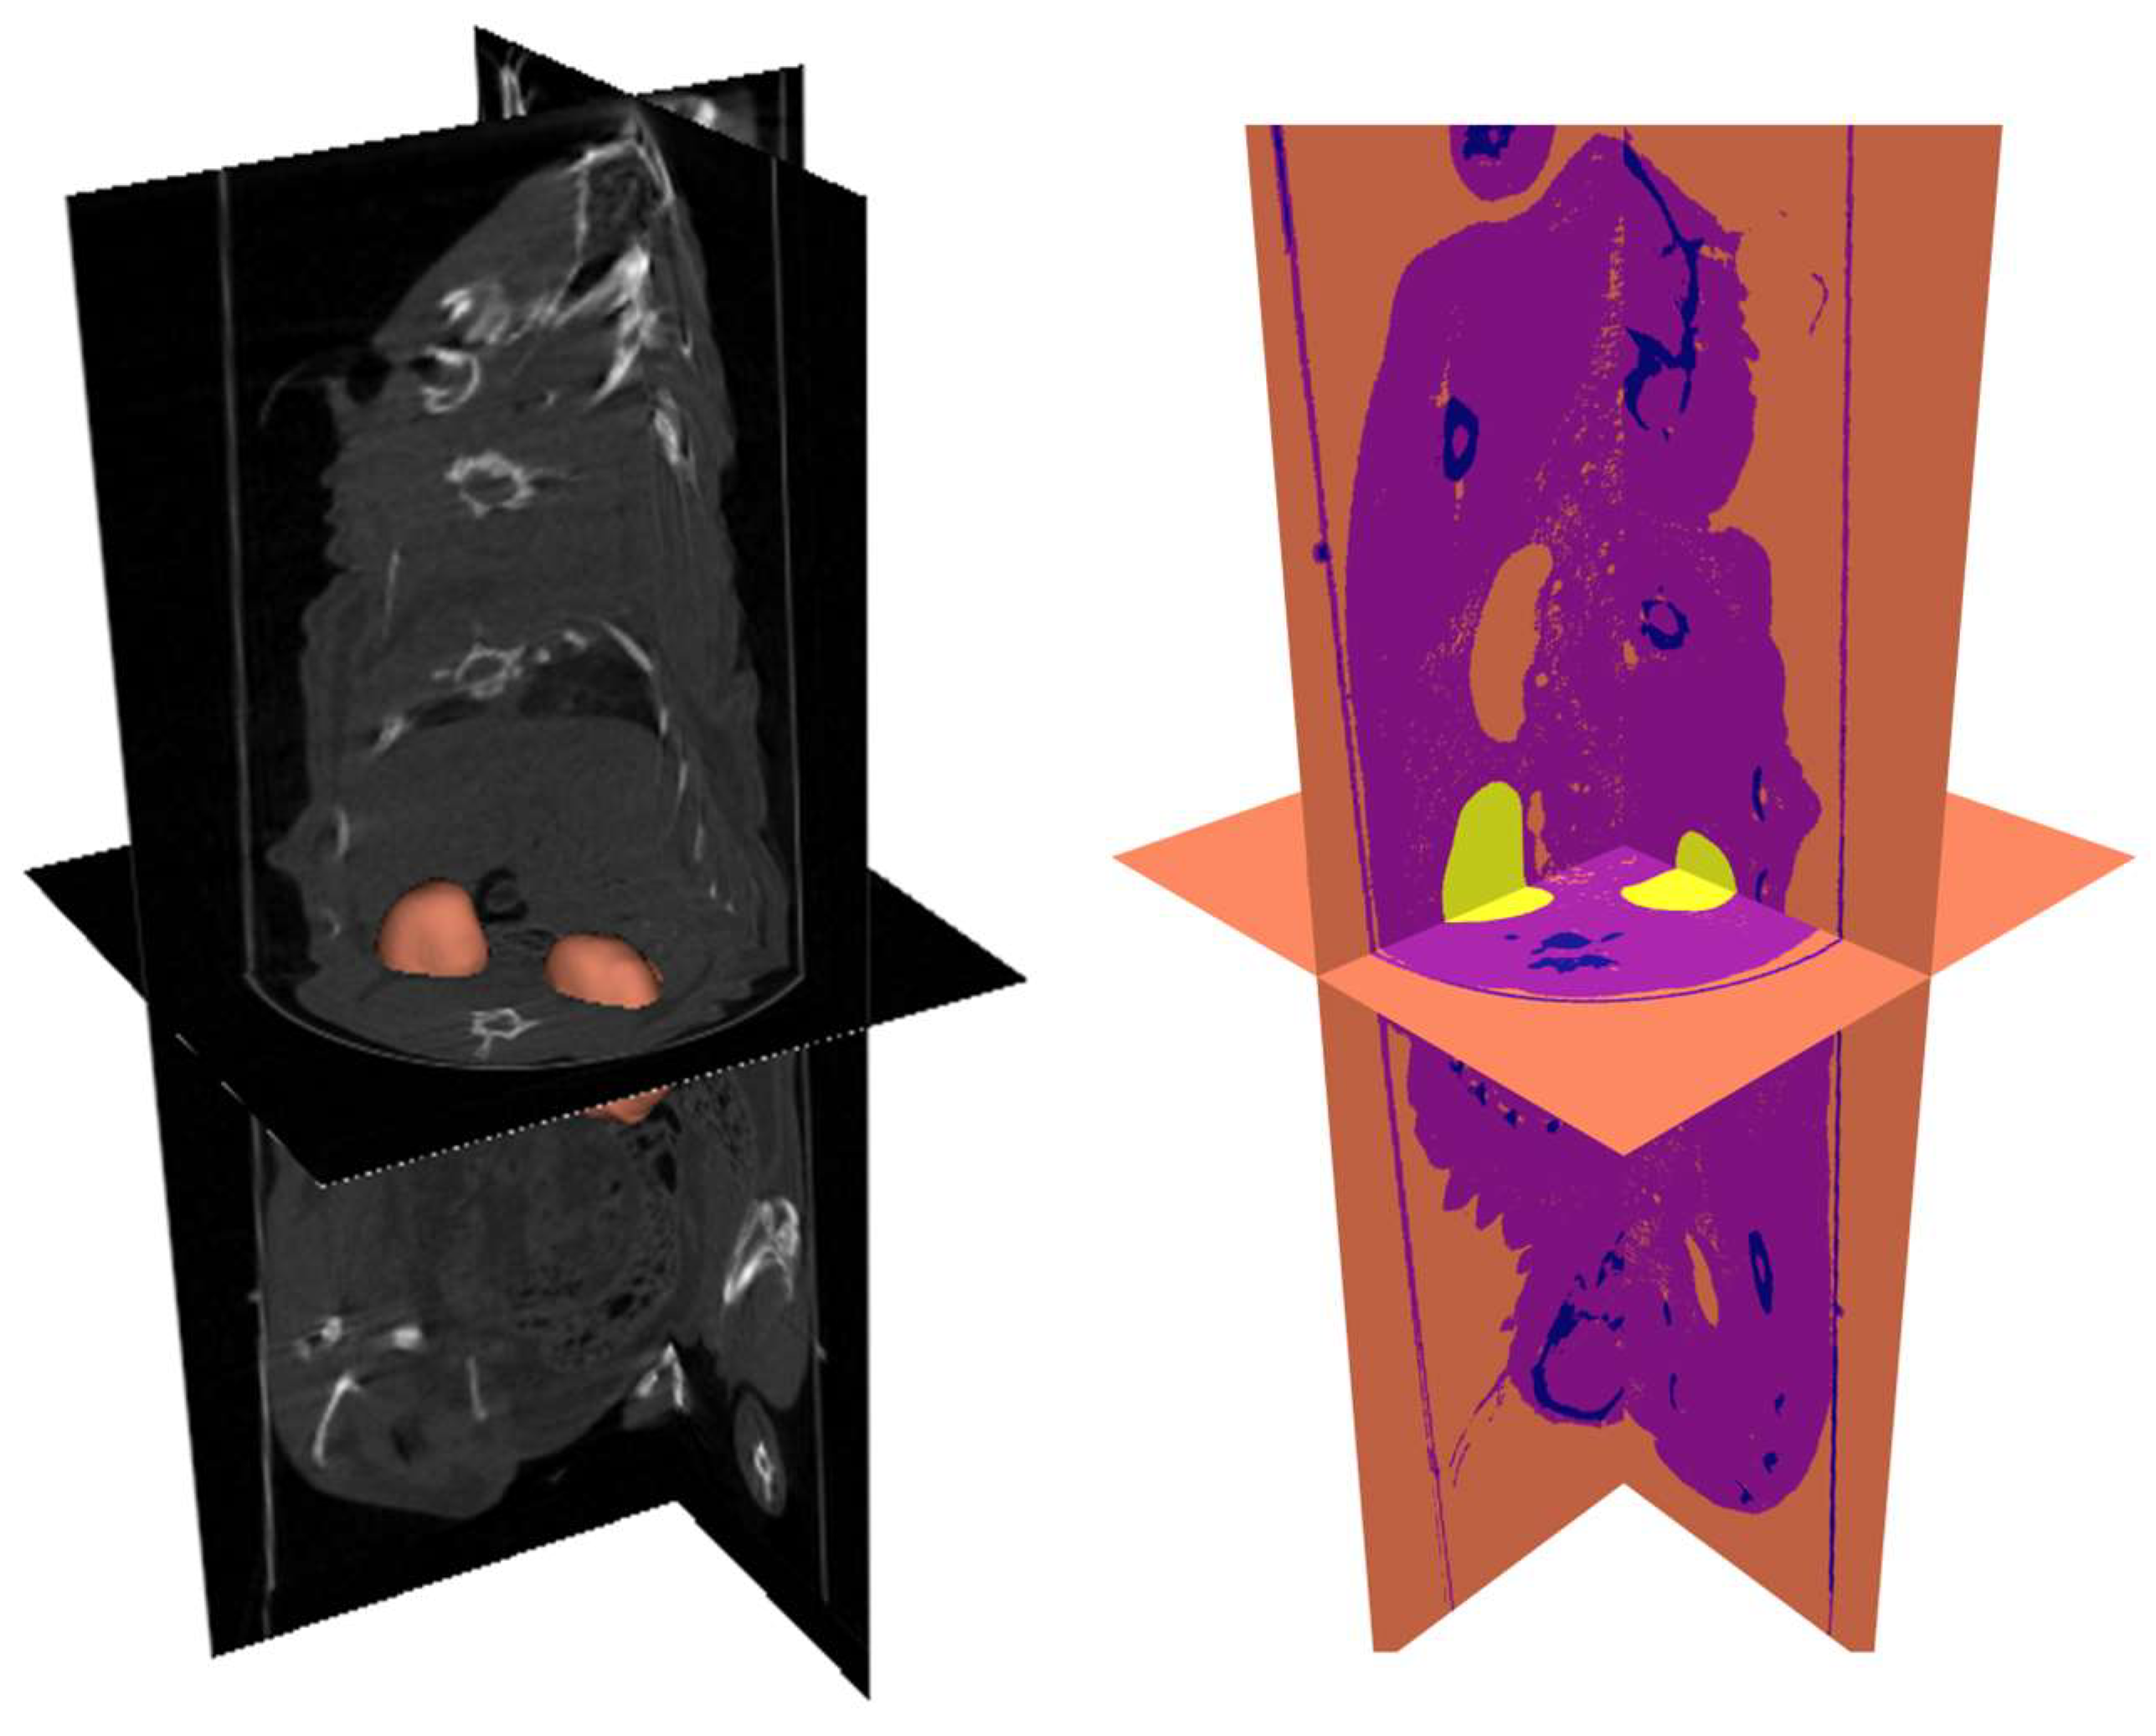
Figure 4.
Phase space photon energy distribution representing the emerging radiation from the sample (blue) together with the Compton background baseline (green) and the net XRF signal (orange) highlighting the corresponding XRF emission peaks of the gold and in purple the FWHM of the net XRF signal. Corresponding FWHM values are depicted by the horizontal dashed lines (magenta).
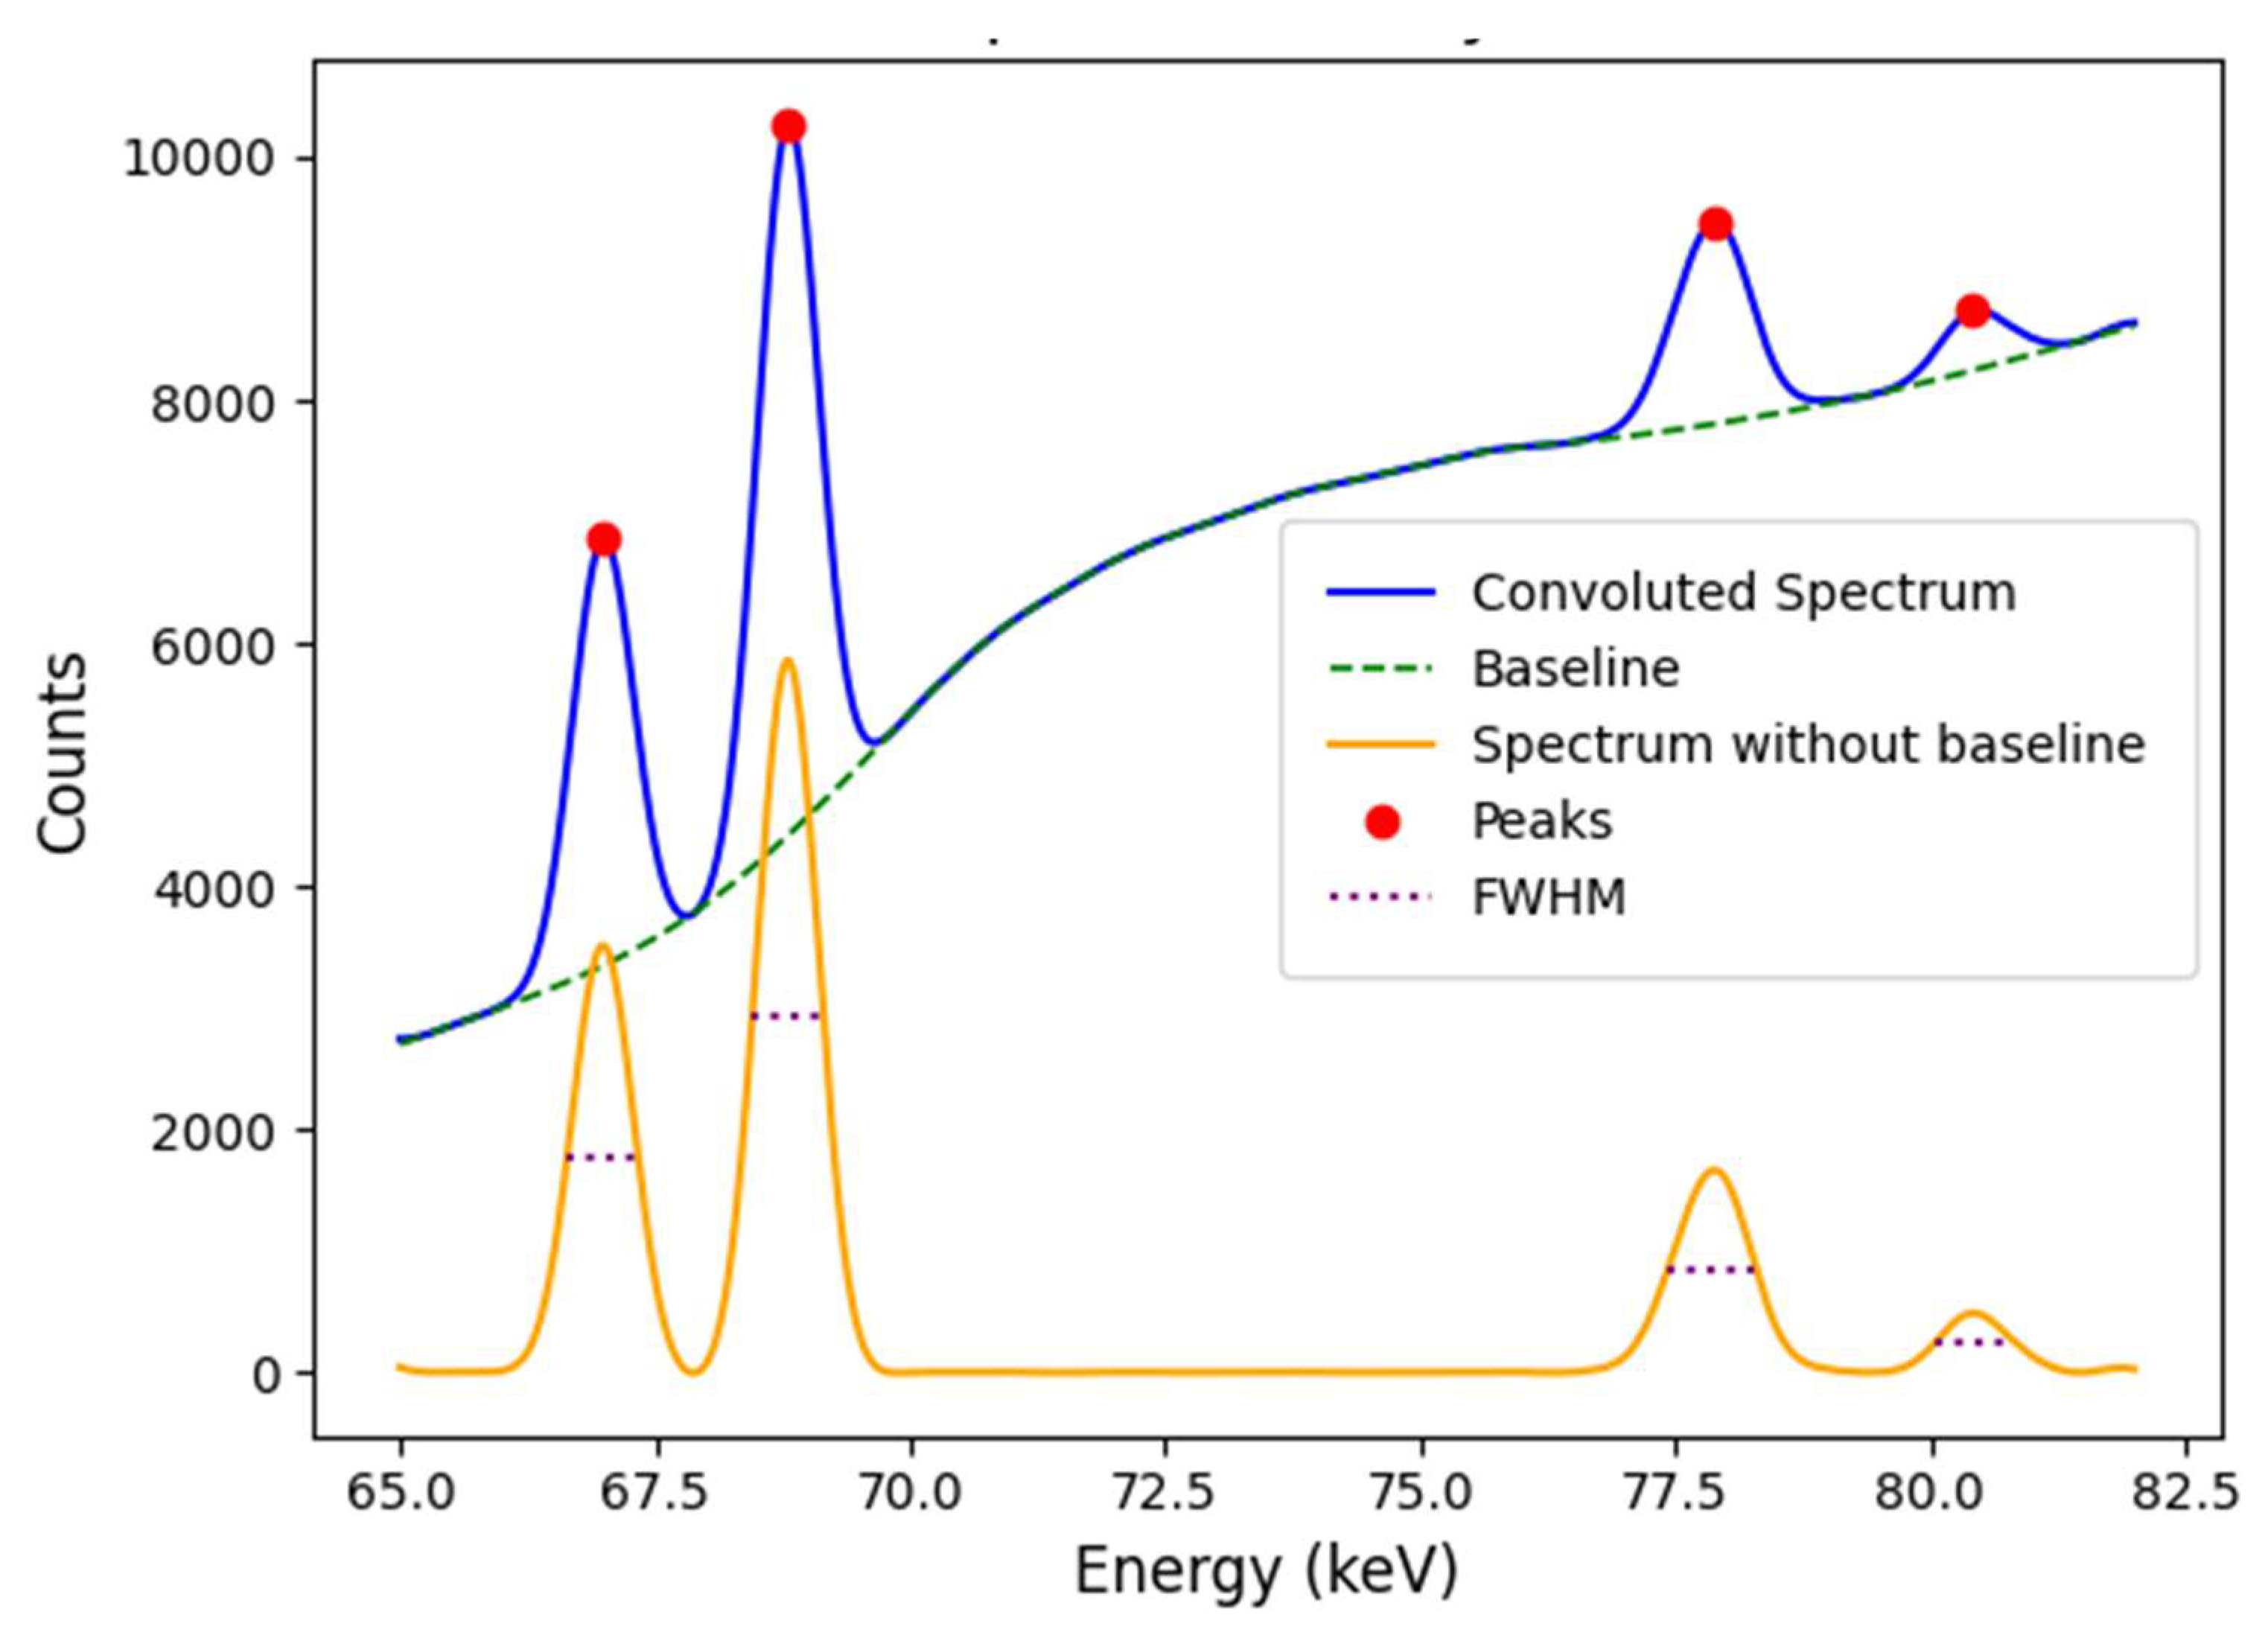
Figure 5.
SNR for the different uniform %w/w gold concentrations within the kidneys for the different gold fluorescence emissions lines. The black solid line depicts the case SNR=3, usually considered as the threshold. The dashed lines correspond to the fit of a function considered linear for the concentration range worked out in first approximation. The correlation fit parameters (R2) are included in the legends.
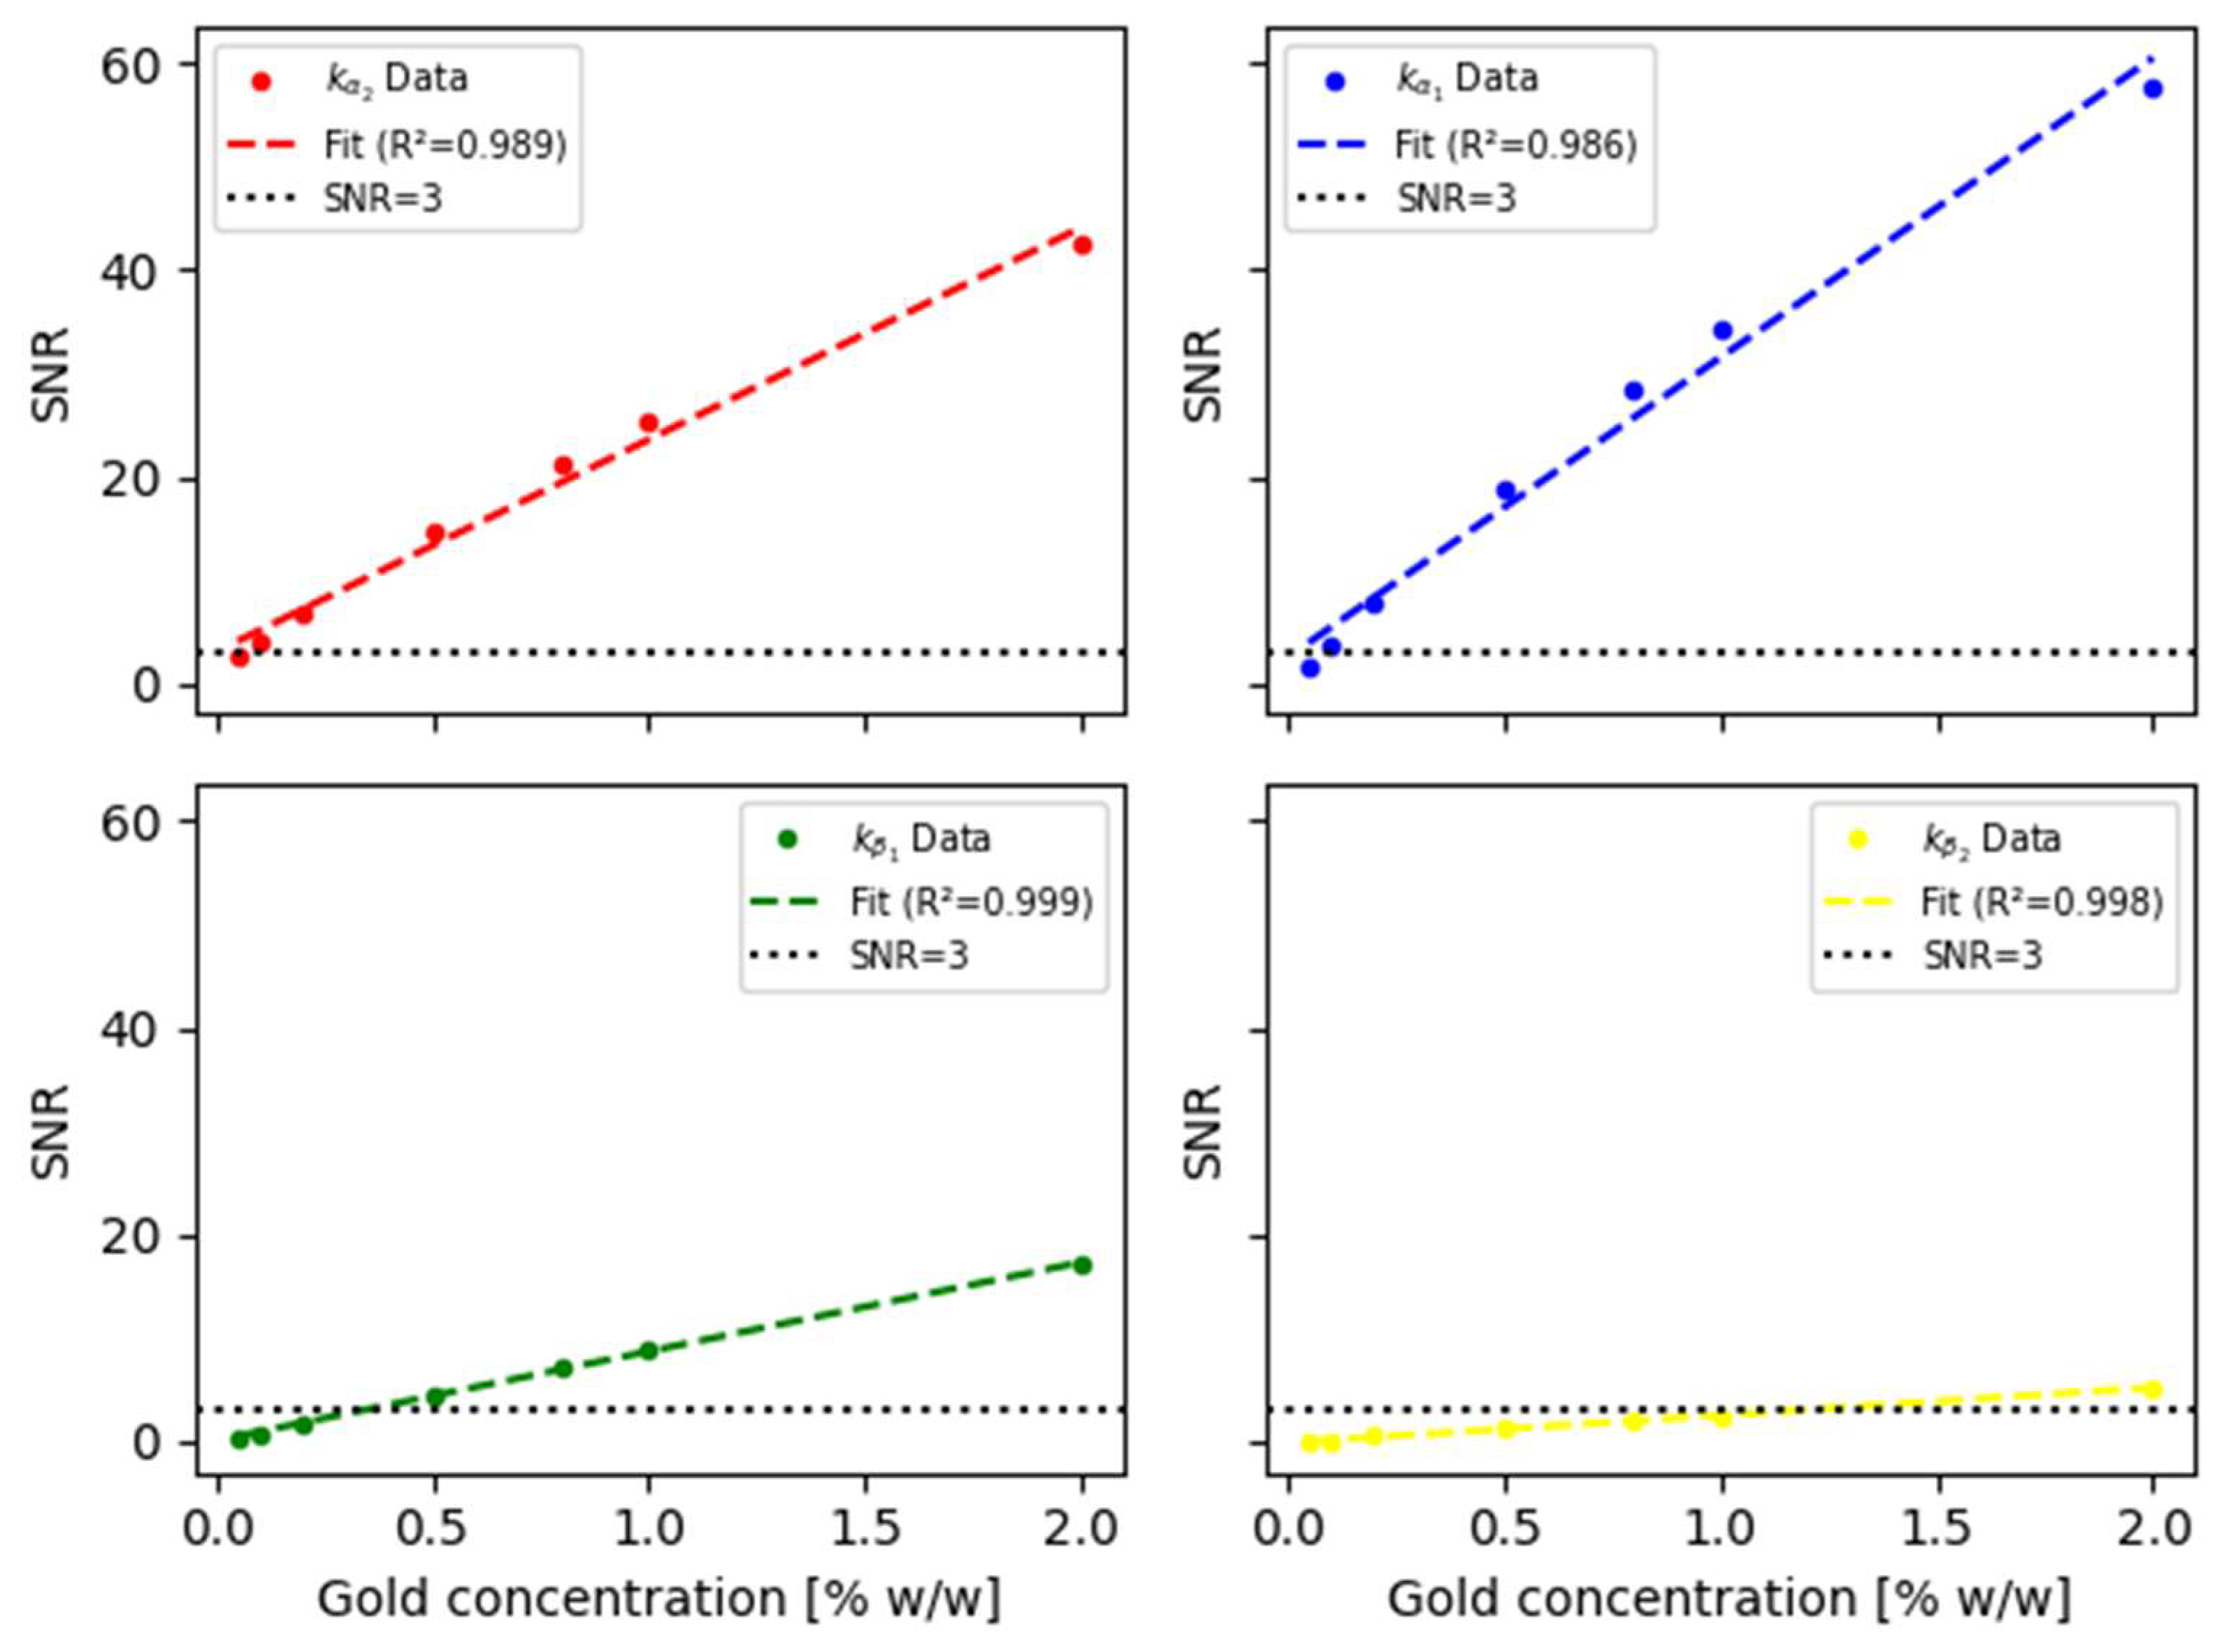
Figure 6.
SNR weighted by absorbed dose (SNR/D) for the different uniform gold concentrations in %w/w within the kidneys and for each one of the gold fluorescence emission lines. Error bars indicate the corresponding uncertainties, while fitting correlation parameters (R2) are included in legends.
Figure 6.
SNR weighted by absorbed dose (SNR/D) for the different uniform gold concentrations in %w/w within the kidneys and for each one of the gold fluorescence emission lines. Error bars indicate the corresponding uncertainties, while fitting correlation parameters (R2) are included in legends.
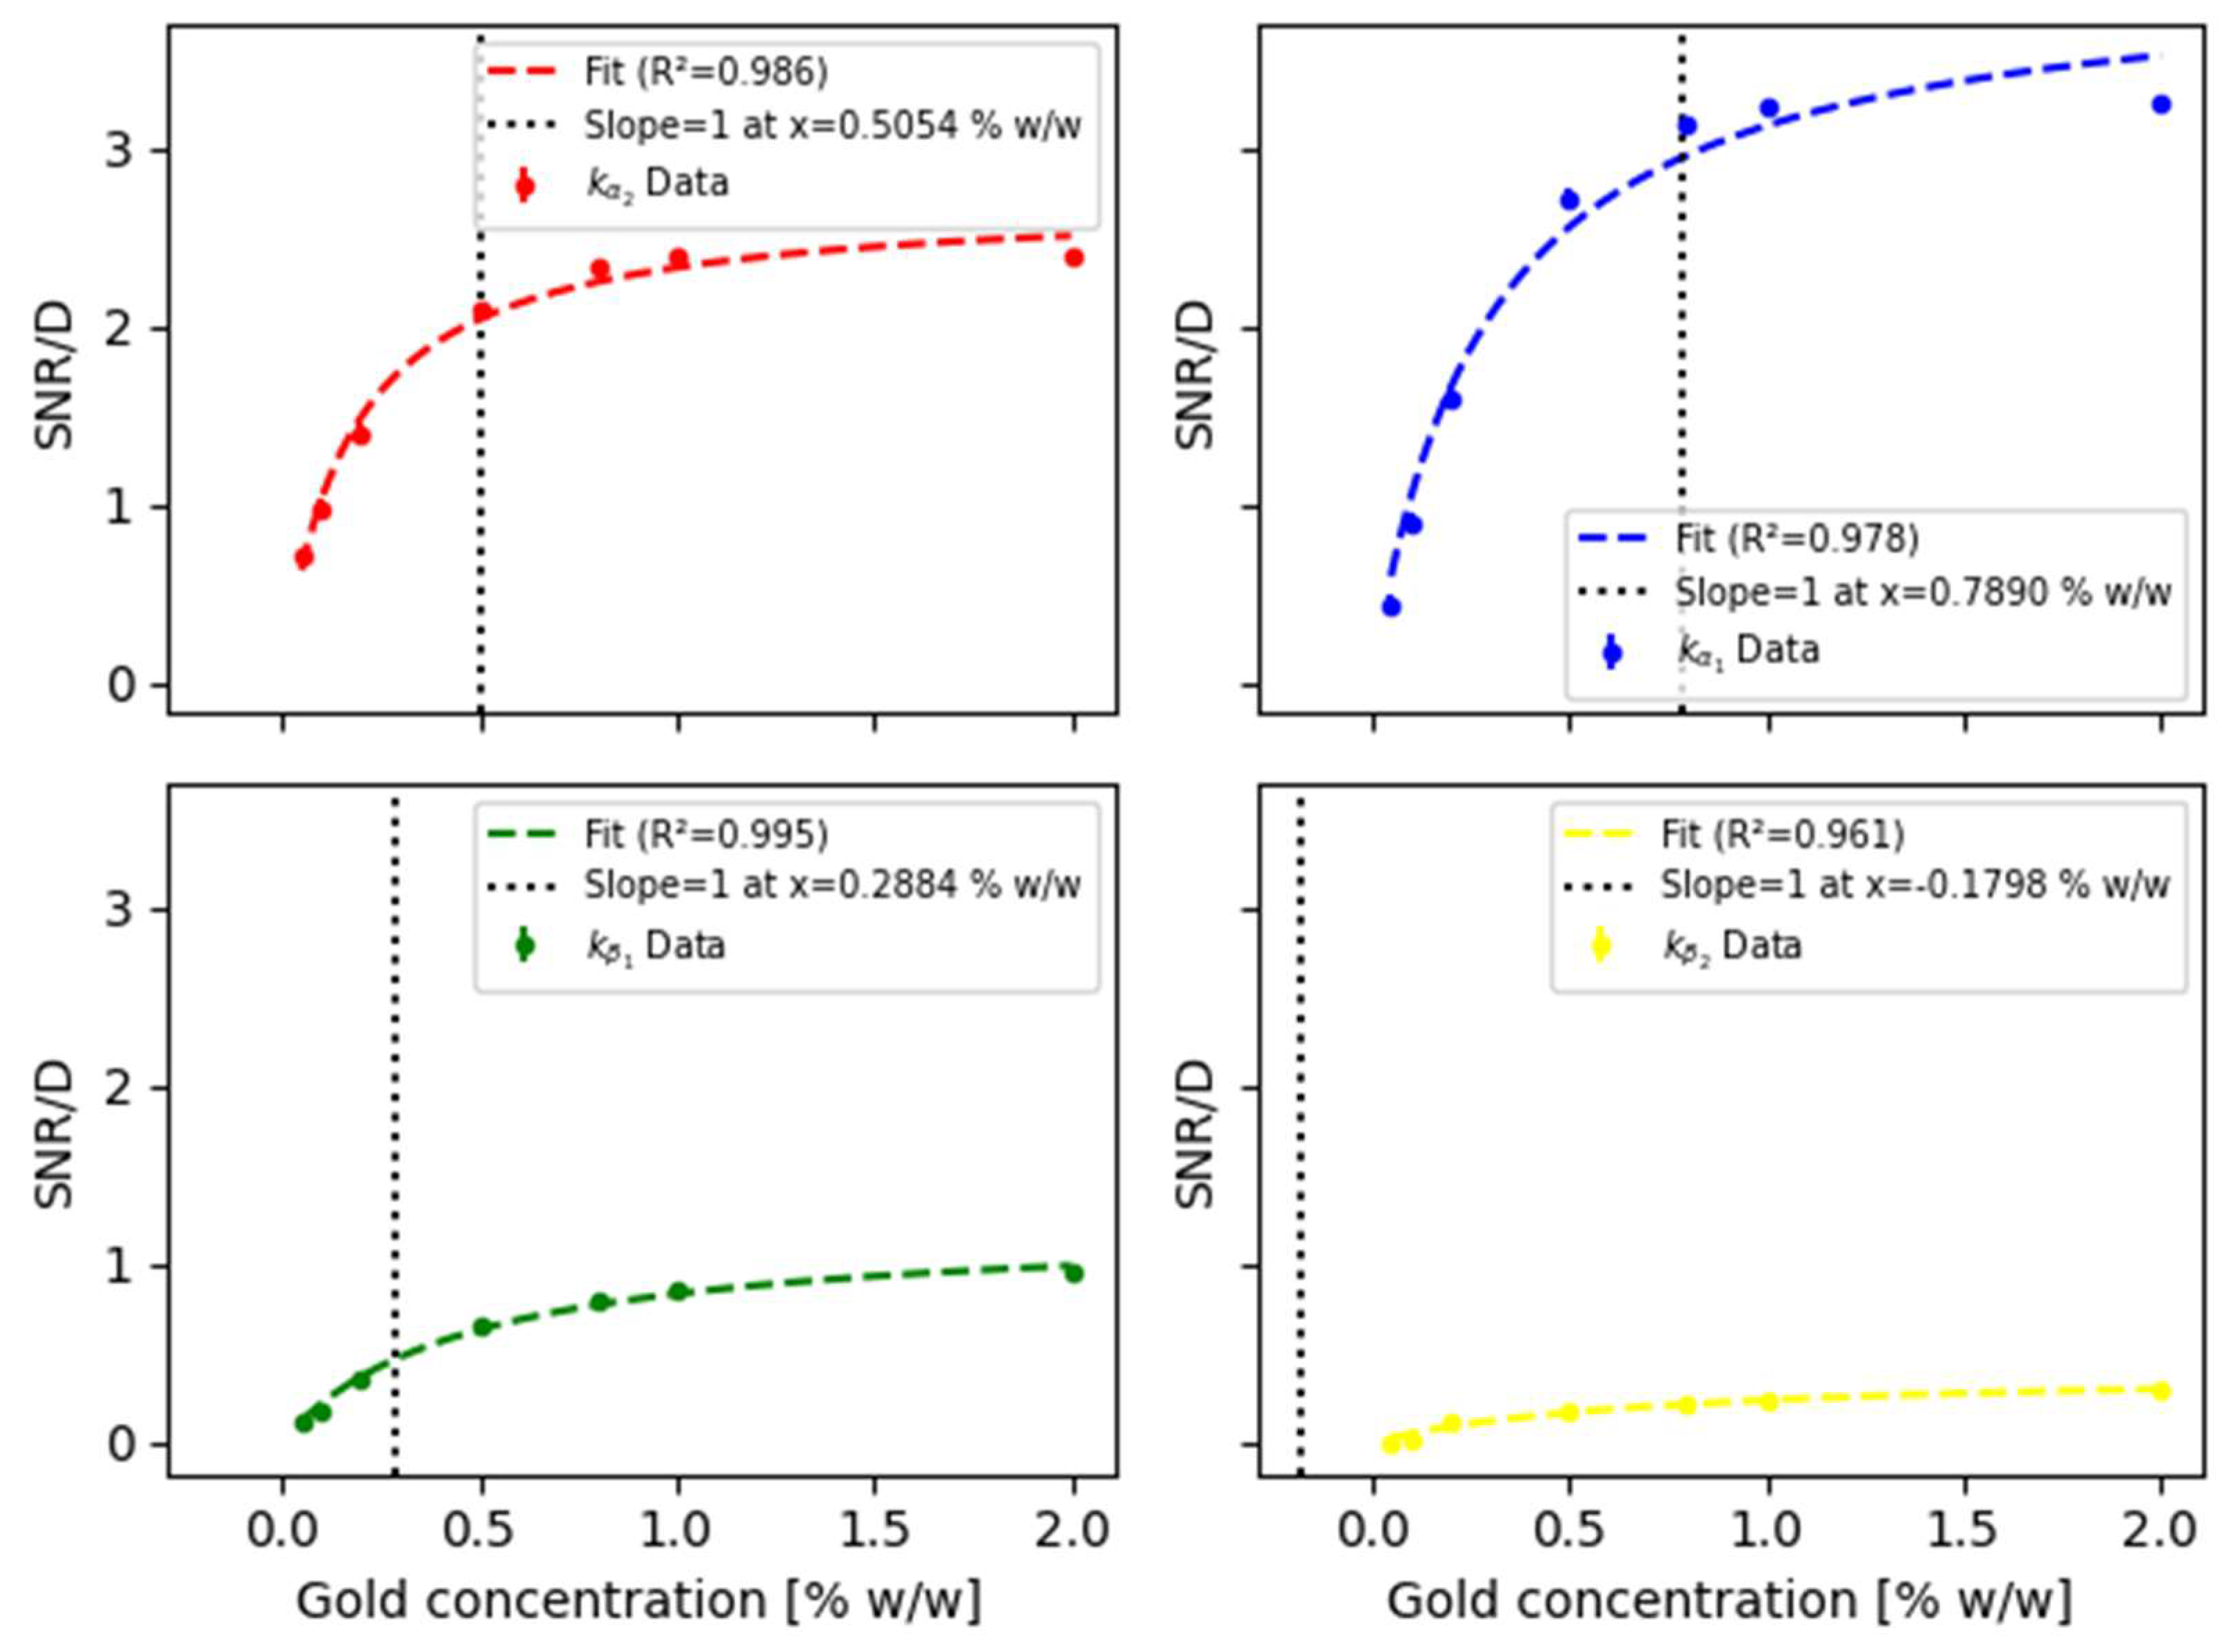
Figure 7.
SNR weighted by absorbed dose (SNR/D) for the different uniform gold concentrations in %w/w within the kidneys using all together the gold XRF K-lines. Error bars indicate the corresponding uncertainties, while fitting correlation parameters (R2) are included in legends.
Figure 7.
SNR weighted by absorbed dose (SNR/D) for the different uniform gold concentrations in %w/w within the kidneys using all together the gold XRF K-lines. Error bars indicate the corresponding uncertainties, while fitting correlation parameters (R2) are included in legends.
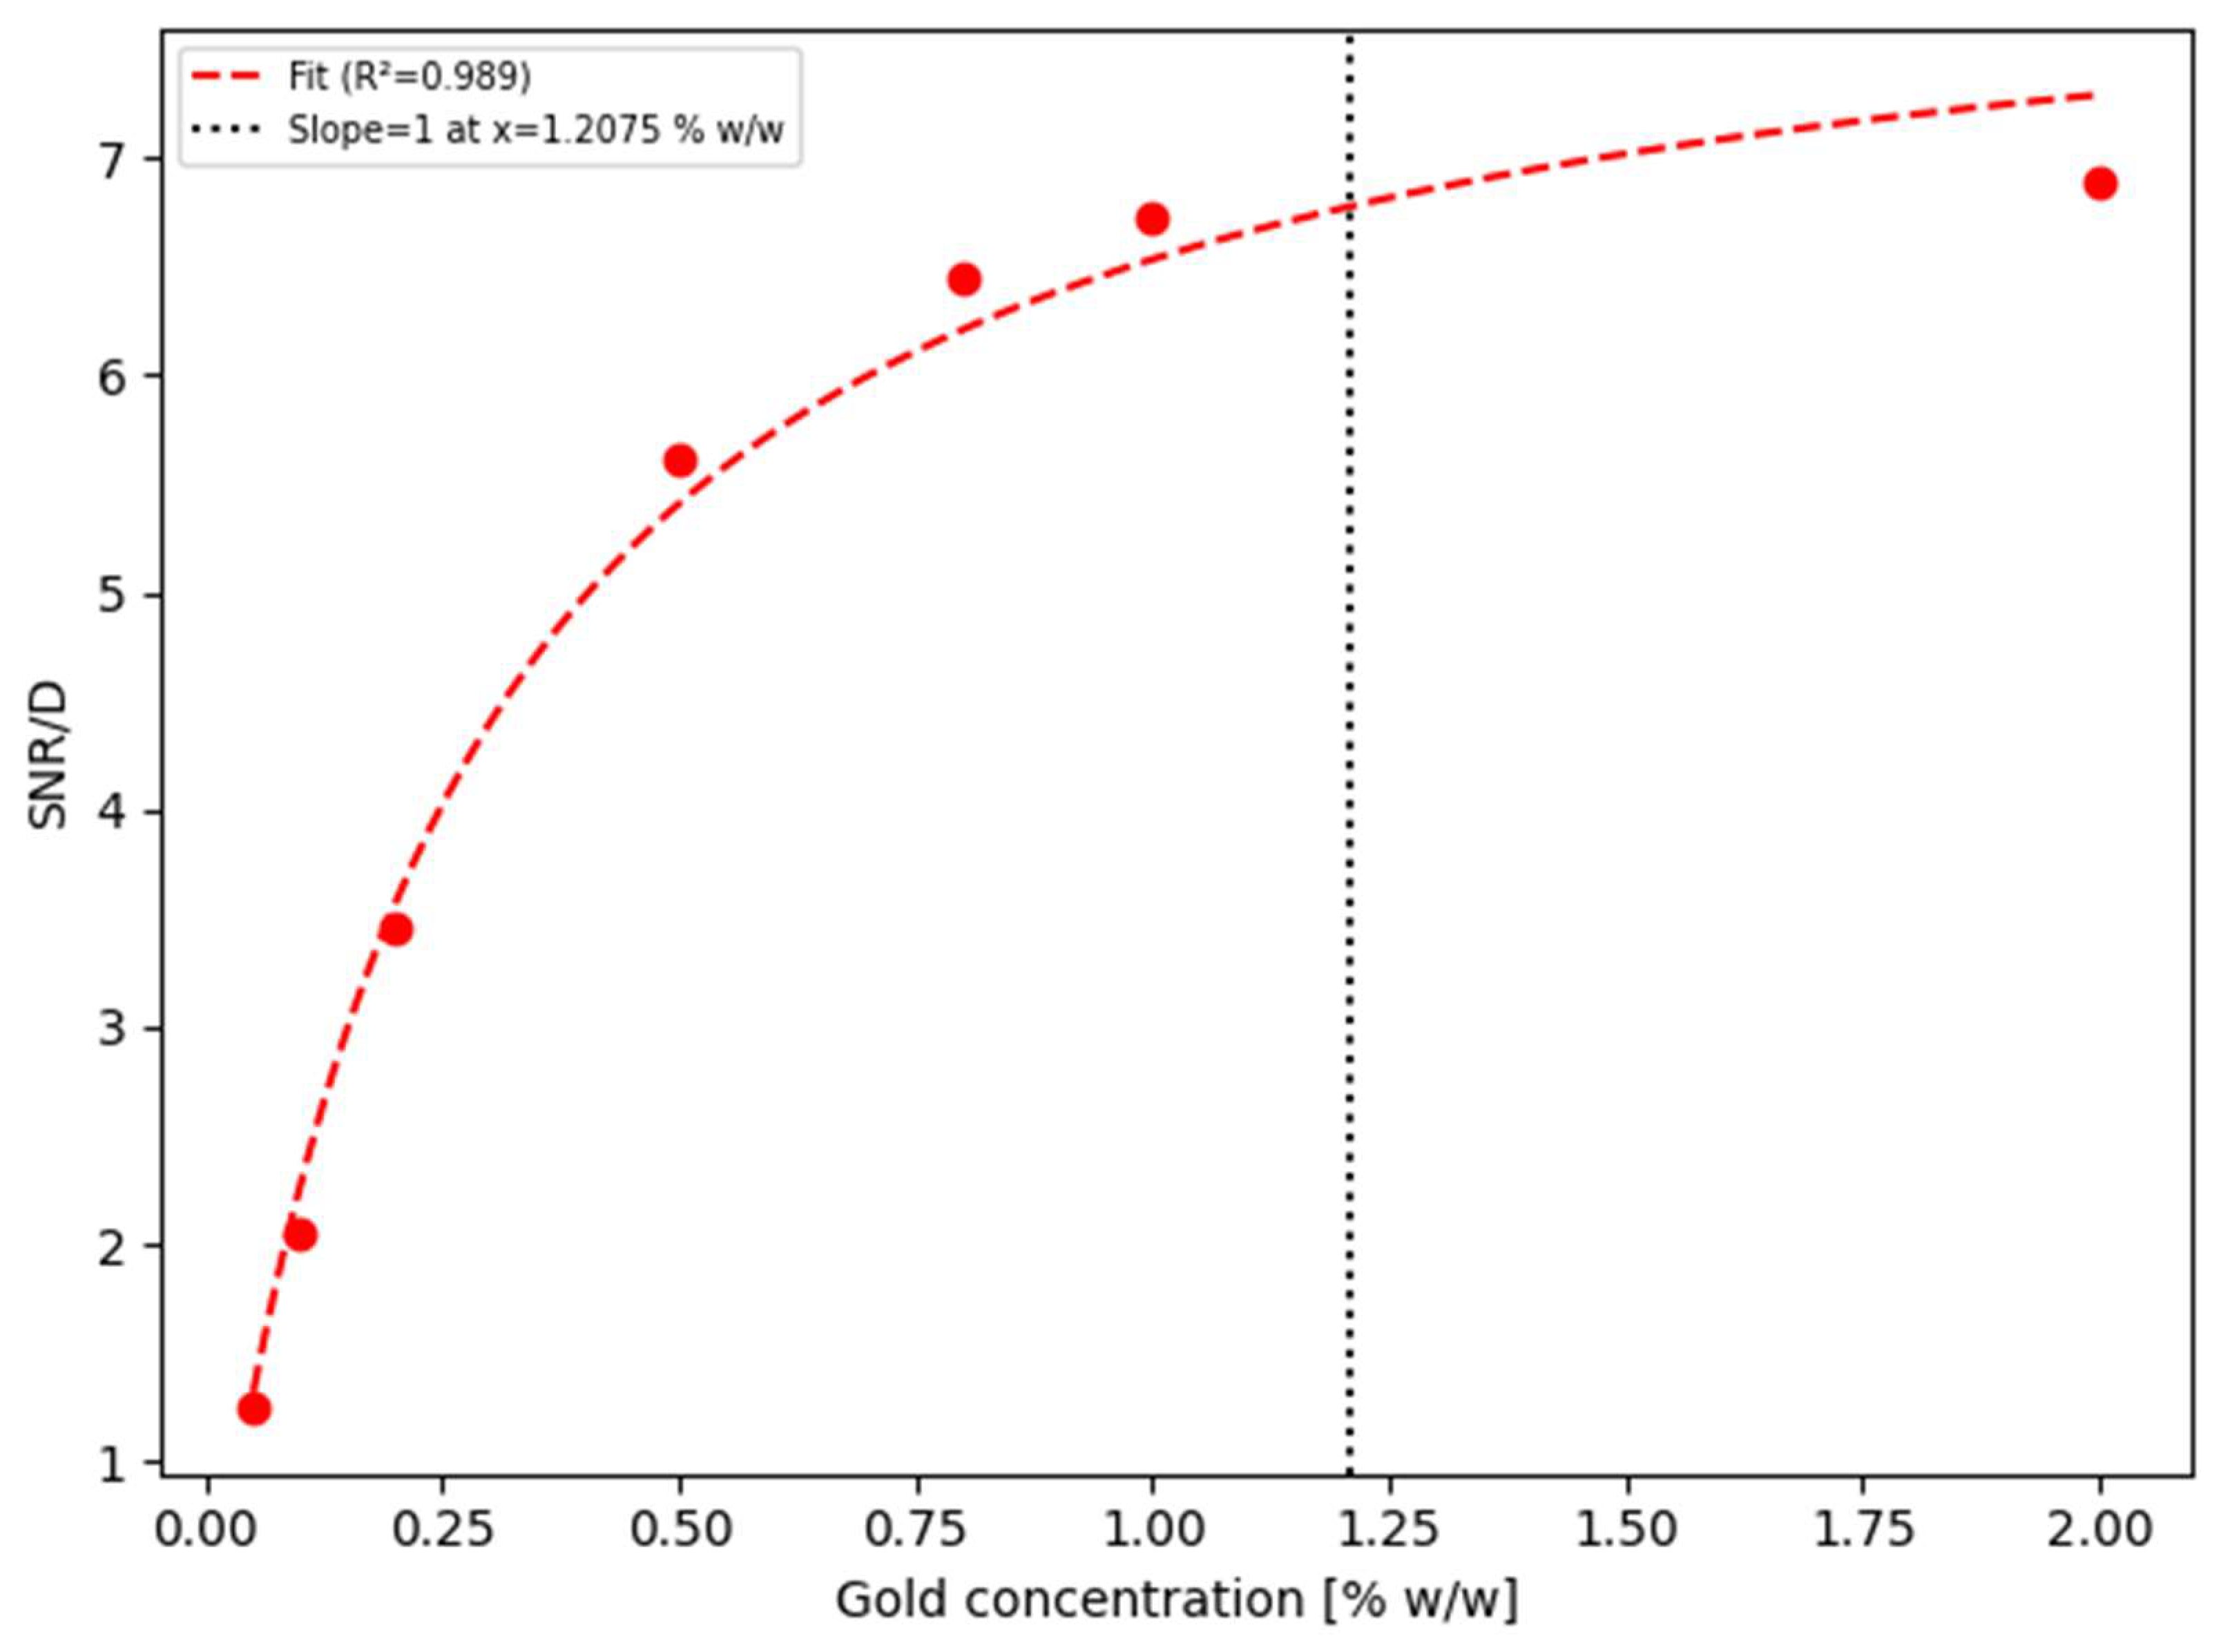

Table 1.
Parameters (mass density, ρ, and mean excitacion/ionization potential/energy, <I>) used to define the simulation gold-infused media that model soft tissues biomarked by gold-based agents.
Table 1.
Parameters (mass density, ρ, and mean excitacion/ionization potential/energy, <I>) used to define the simulation gold-infused media that model soft tissues biomarked by gold-based agents.
| Gold concentration [% w/w] | ] | <I> [eV] |
|---|---|---|
| 2% | 1.01933 | 71.631 |
| 1% | 1.00957 | 70.024 |
| 0.8% | 1.00764 | 70.122 |
| 0.5% | 1.00470 | 69.632 |
| 0.2% | 1.00199 | 69.383 |
| 0.1% | 1.00095 | 69.151 |
| 0.05% | 1.00045 | 69.207 |
Table 2.
Gold de-excitation probability of K-edge ionization [42].
Table 2.
Gold de-excitation probability of K-edge ionization [42].
| K-Lines | Energy [keV] | Probability Emission |
|---|---|---|
| 66,9895 | 0.288 | |
| 68,8037 | 0.493 | |
| 77,984 | 0.11 | |
| 80,082 | 0.046 |
Table 3.
Energy resolution applying the Gaussian broadening convolution.
| Tissue | FWHM [keV] |
|---|---|
| Kα2 | 0.719 ± 0.025 |
| Kα1 | 0.688 ± 0.012 |
| Kβ1 | 0.774 ± 0.016 |
| Kβ2 | 0.777 ± 0.288 |
Table 4.
Mean absorbed dose (D) to the kidneys of the Wistar rat along with corresponding uncertainties (σ) according to the Au concentration. Uncertainties of the total dose absorbed by all voxels belonging to both the kidneys have been estimated by error propagation.
Table 4.
Mean absorbed dose (D) to the kidneys of the Wistar rat along with corresponding uncertainties (σ) according to the Au concentration. Uncertainties of the total dose absorbed by all voxels belonging to both the kidneys have been estimated by error propagation.
| Gold Concentration [% wt] | 2.0 | 1.0 | 0.8 | 0.5 | 0.2 | 0.1 | 0.05 |
|
Mean dose [eV/g] |
17.78 | 10.54 | 9.10 | 6.96 | 4.83 | 4.12 | 3.77 |
|
Dose uncertainty [eV/g] |
0.12 | 0.06 | 0.06 | 0.05 | 0.03 | 0.03 | 0.02 |
Table 5.
Dose-weighted signal-to-noise ratio (SNR/D) for different gold concentrations.
| Gold Concentration [% w/w.] | Dose [eV/g.prim] | SNR | |||
|---|---|---|---|---|---|
| 2 | 17.78 | 42.41 | 57.79 | 17.11 | 5.22 |
| 1 | 10.54 | 25.24 | 34.10 | 8.98 | 2.54 |
| 0.8 | 9.10 | 21.15 | 28.42 | 7.17 | 1.96 |
| 0.5 | 6.96 | 14.50 | 18.86 | 4.53 | 1.21 |
| 0.2 | 4.83 | 6.73 | 7.68 | 1.72 | 0.54 |
| 0.1 | 4.12 | 3.98 | 3.69 | 0.73 | 0.031 |
| 0.05 | 3.77 | 2.65 | 1.62 | 0.42 | 0.008 |
Table 6.
Optimal gold concentration in terms of the dose-weighted signal-to-noise ratio (SNR/D) for the different XRF lines.
Table 6.
Optimal gold concentration in terms of the dose-weighted signal-to-noise ratio (SNR/D) for the different XRF lines.
| Gold fluorescence emission lines | Optimal concentration %w/w | Fit parameters | ||
|---|---|---|---|---|
| a | ||||
| 0.50 | 4.78 | 1.76 | 0.29 | |
| 0.79 | 0.97 | 0.24 | 0.07 | |
| 0.29 | 0.04 | 0.04 | 0.01 | |
| - | 0.27 | 0.66 | 0.48 | |
Disclaimer/Publisher’s Note: The statements, opinions and data contained in all publications are solely those of the individual author(s) and contributor(s) and not of MDPI and/or the editor(s). MDPI and/or the editor(s) disclaim responsibility for any injury to people or property resulting from any ideas, methods, instructions or products referred to in the content. |
© 2025 by the authors. Licensee MDPI, Basel, Switzerland. This article is an open access article distributed under the terms and conditions of the Creative Commons Attribution (CC BY) license (http://creativecommons.org/licenses/by/4.0/).
Copyright: This open access article is published under a Creative Commons CC BY 4.0 license, which permit the free download, distribution, and reuse, provided that the author and preprint are cited in any reuse.


