Preprint
Article

This version is not peer-reviewed.

Characteristics of Wheat Noodle “Kitanokaori” Using Weakly Acidic Hard Water in Terms of Functional Qualities, Such as Inhibiting Postprandial Abrupt Increase of Blood Glucose

A peer-reviewed article of this preprint also exists.

Submitted:

20 February 2025

Posted:

21 February 2025

You are already at the latest version

Abstract

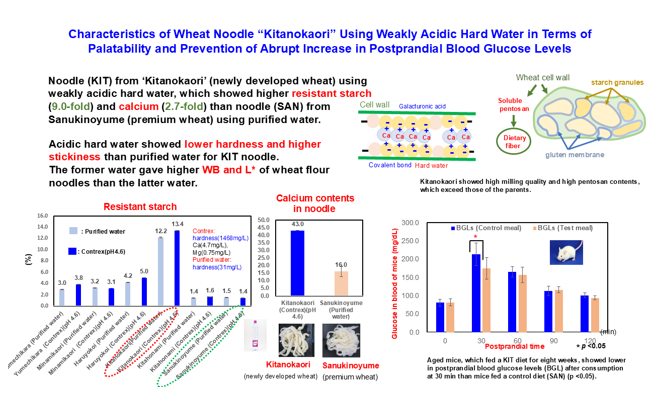
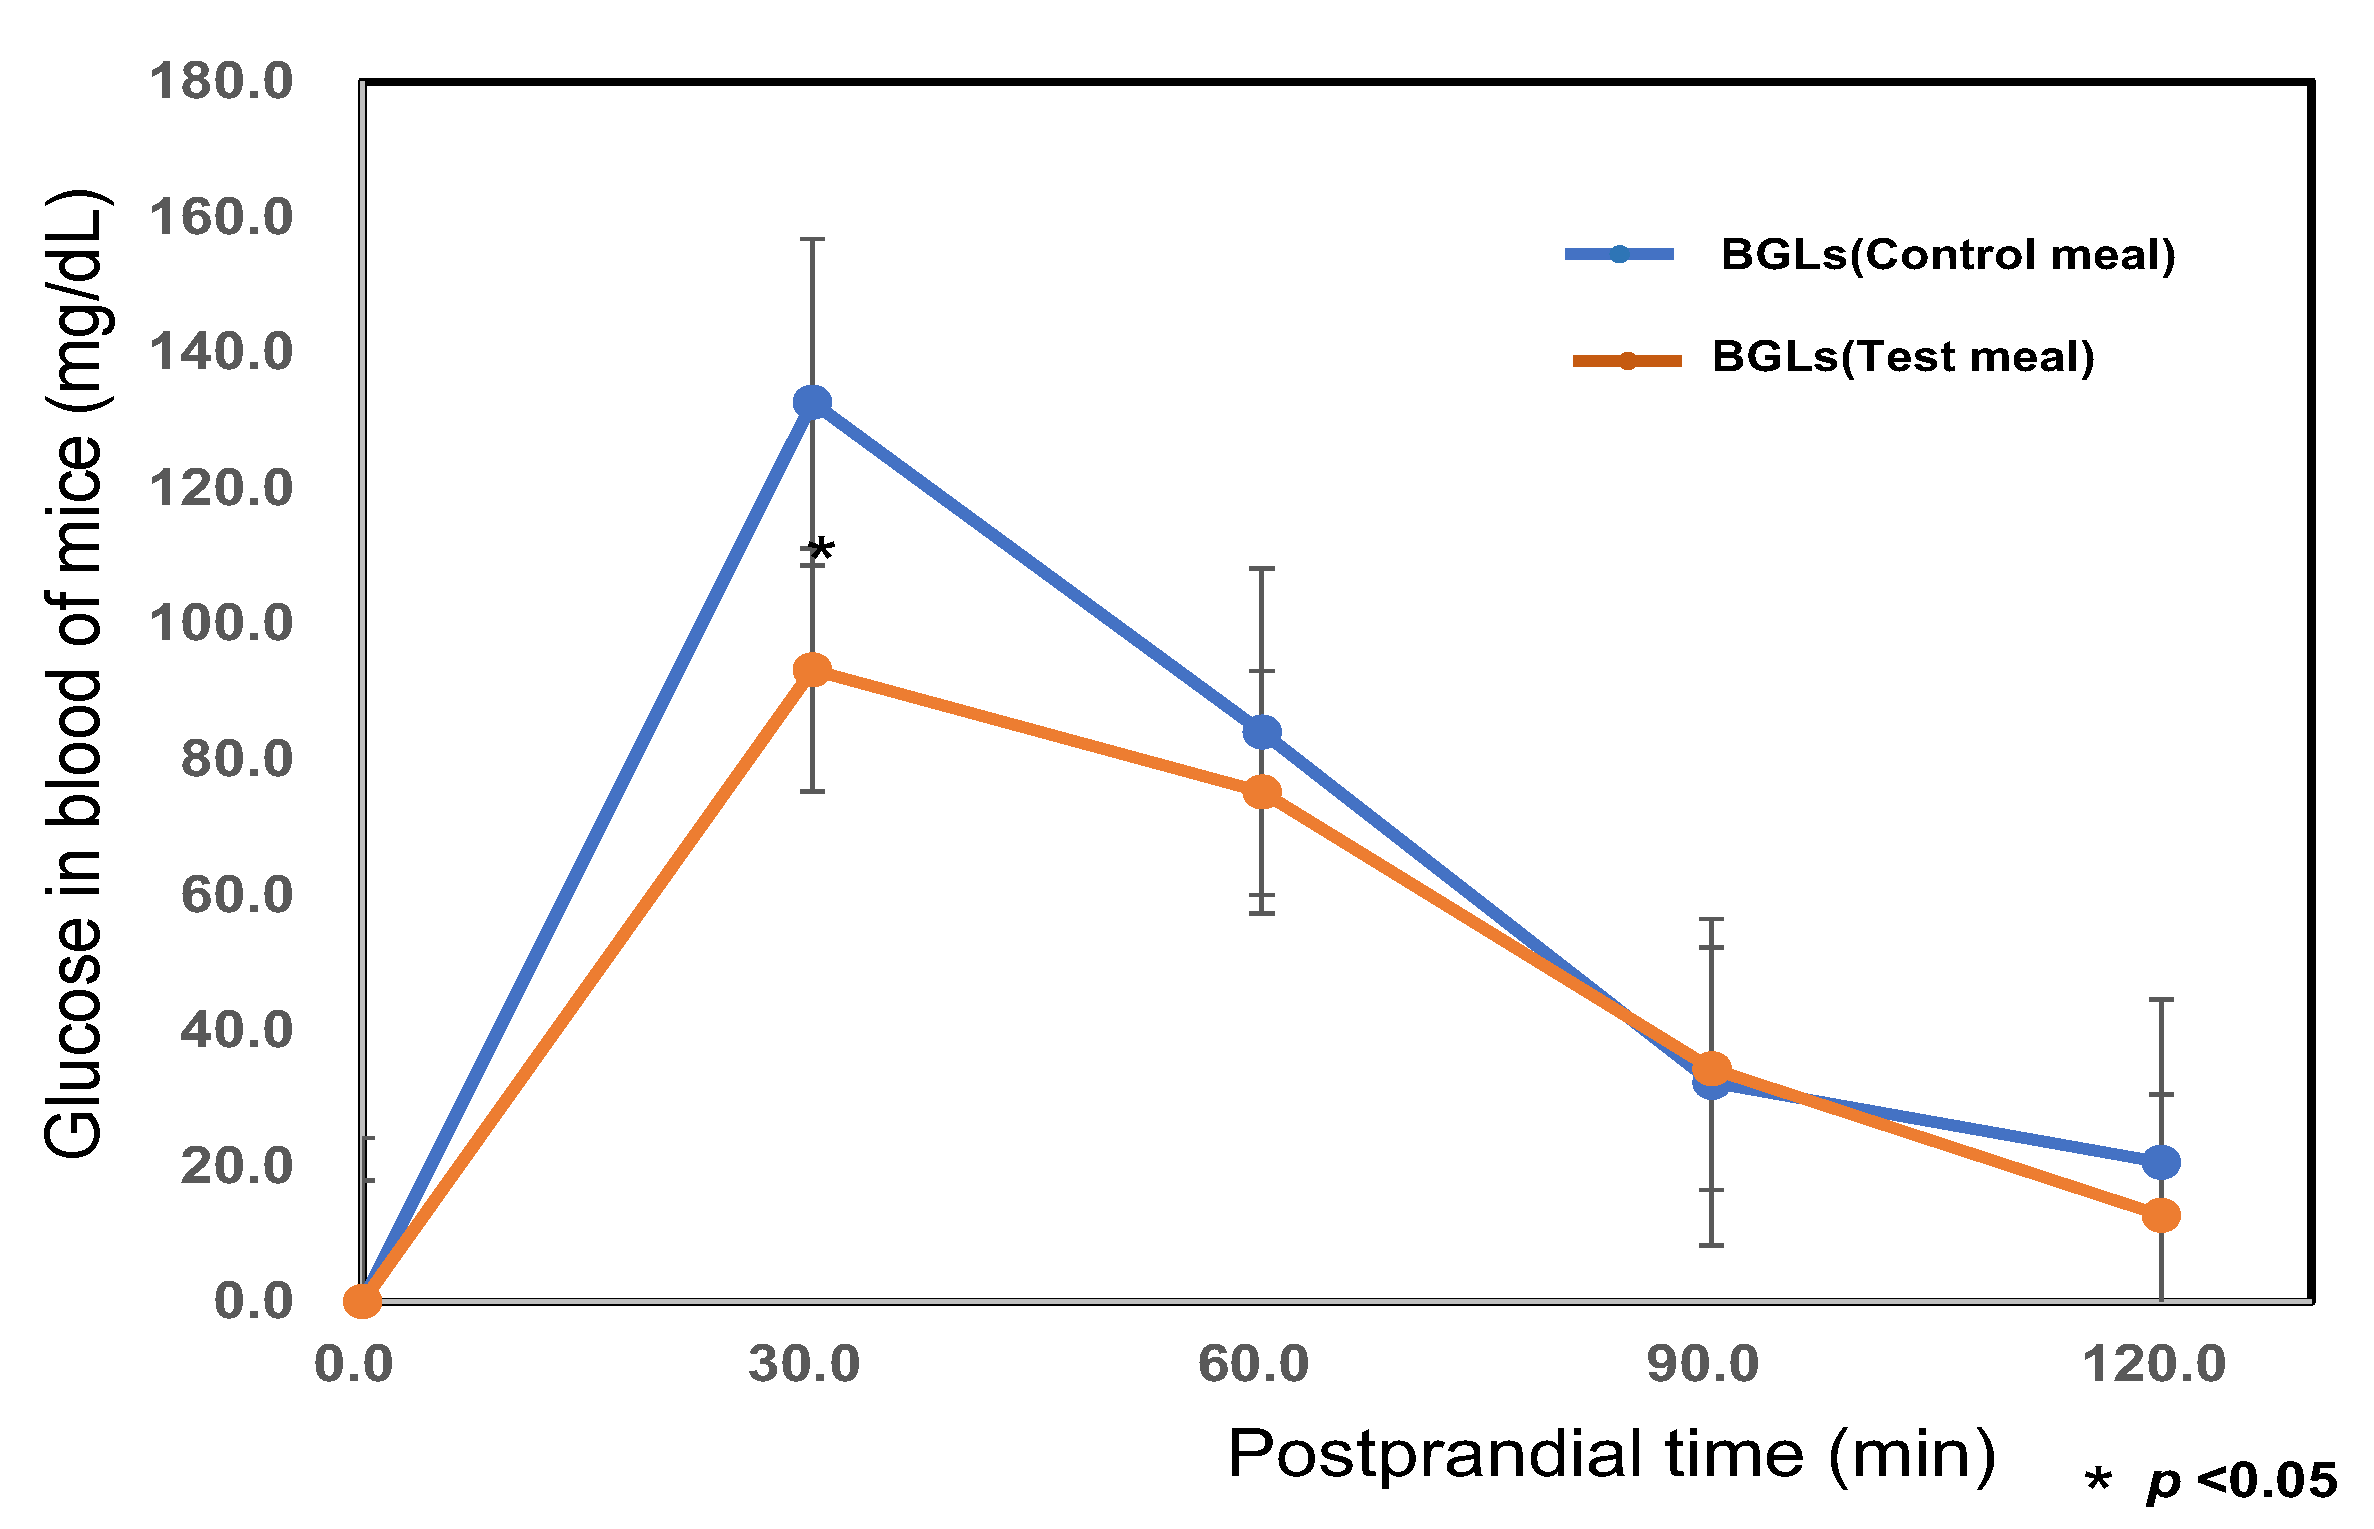
Type-2 diabetes and osteoporosis are very serious diseases all over the world. We prepared noodle (KIT) from ‘Kitanokaori’ (newly developed wheat) using weakly acidic hard water, which showed higher amount of resistant starch (9.0-fold) and calcium (2.7-fold) than noodle (SAN) from Sanukinoyume (premium wheat) using purified water. Furthermore, aged mice, which were fed a KIT diet for eight weeks, showed lower postprandial blood glucose levels (BGL) at 30 min after consumption than mice fed a control diet (SAN) (p <0.05). Additionally, whiteness (WB) and brightness (L*) of wheat noodles using weakly acidic hard water showed higher values than ones using purified water. The texture of KIT noodle using weakly acidic hard water showed little textural differences with one by purified water. The KIT noodle using weakly acidic hard water would be acceptable in terms of palatability and bio-functionality in terms of delaying digestion.

Keywords: 
;  ;  ;  ;  

1. Introduction

According to the report by IDF (International Diabetes Federation), about 537 million people were the candidates or the patients of diabetes in 2021 and the number of the patients of dementia is about 57 million in the world in 2019 [1,2]. As it has been reported that type-2 diabetes increased the risk of Alzheimer disease, it is necessary to prevent diabetes and dementia by the bio-functional foods [3]. WHO and FAO recommend foods with low glycemic index (GI) to prevent diabetes. It was reported that the cognitive decline was prevented by the food components, such as minerals, polyphenols, flavonoids and omega-3 PUFAs (polyunsaturated fatty acids), etc [4,5,6,7,8]. Diabetes is more common in western pacific region because South Asian people’s bodies don’t produce as much insulin as other people. It is well known that calcium is an essential mineral for humans, nevertheless dietary intake as calcium is insufficient for Asian people [9,10].
Wheat, maize, and rice are grown as staple foods around the world. Wheat protein content is an important consideration in baking and in the production of pasta and noodles. High-protein wheat has higher water-absorbing capacity, greater loaf volume and higher quality potential [11]. Friablin is a surface protein complex occurring on the surface of starch granules. It is abundant in soft wheats, scarce in hard wheats, and absent in durum wheat [12,13].
The total dietary fiber content of wheat is reported by the USDA and Health Canada to range from 11 to 12.7 % and is composed of both soluble and insoluble fibers. Silano et al [14]. showed that the 0.19 family protein albumin from the kernels of hexaploid wheat was a strong inhibitor of α-amylases from human sativa. Moreover, Morimoto et al [15]. showed that wheat albumin has inhibitory activity against human pancreatic and salivary amylases, delays carbohydrate digestion and suppresses postprandial hyperglycemia.
The phenolics are located mainly in the outer bran layers of the kernel. As part of the human diet, phenolics contribute to the beneficial effects derived from consumption of cereal bran. This function has been attributed especially to ferulic acids, which has a high antioxidative activity and that of cross-linking of arabinoxylans produce soluble dietary fiber [16]. Phytic acid has six phosphate groups with double charge and builds highly insoluble compounds, especially with bivalent metal cations [16]. Zhao et al. [17] reported that phytic acid can effectively improve the appearance of yellow alkaline noodles and which can reduce the formation of browning products.
Pittas et al. [18] and Yamada and Aoe [19] showed that a combined daily intake of Vitamin D and calcium lead to a potential benefit to reduce the risk of type-2 diabetes.
We had reported, in our previous paper, that the hard water, rich in Ca, is useful for the quality improvement of high-temperature-damaged rice grains, due to various enzyme (α, and β- amylase, proteinase, xylanase) activities were inhibited by soaking in hard water, moreover, calcium intake through the meal with the boiled rice soaked and cooked using hard water [20,21].
In Japan, most of the wheat cultivars are used as materials for white noodle (Udon) and confectionery making. There are not so many wheat varieties with high protein content suitable for bread making. For that reason, it is very important task to improve the taste, functionality, and processing suitability of domestic wheat varieties [22,23]. ‘Sanukinoyume’ is representative variety for Japanese wheat noodles, and ‘Kitanokaori’ is a newly bred Japanese/Hungarian hybrid variety.
In this work, we evaluated palatability and bio-functionality of noodles by various Japanese wheat flours using weakly acidic hard water.

2. Materials and Methods

2.1. Materials

Various Japanese wheat flour samples, harvested in 2023, were purchased in 2024 at a local market. Yumechikara (Hokkaido, hard flour), Minaminokaori (Kumamoto pref., hard flour), Haruyokoi (Hokkaido, hard flour), Kitanokaori (Hokkaido, hard flour), Kitahonami (Hokkaido, medium flour), and Sanukinoyume (Kagawa pref., medium flour) (n = 6).

2.2. Measurement of the Moisture Contents of 6 Kinds of Wheat Flour

The moisture contents of the flours were measured using an oven-drying method by drying 2 g flour samples for 1 h at 135 °C.

2.3. Analysis of Phosphorus Contents of 6 Kinds of Wheat Flour

The phosphorus contents of 6 kinds of wheat flours were analyzed by molybdenum blue method [24]. The absorbance was measured at 823 nm, and those of measurements were carried out by General Incorporated Association Ken ou Research Laboratories.

2.4. Preparation of Wheat Starch

Starch granules were prepared from 6 various flours using the cold alkaline method [25].

2.5. Iodine Absorption Spectrum

The AACs (apparent amylose content) of alkali-treated flour were measured using the iodine colorimetric method of Juliano [26]. The absorbance was measured at 620 nm (followed to Juliano’s method), λmax (peak wavelength on iodine staining of starch, which shows high correlation with the length of glucan chain; molecular size of amylose and super-long chain (SLC)), and absorbance at λmax (Aλmax) [27].
A degree of polymerization higher than 37 % (Fb3) was estimated using the following equation [27] (1).
Fb3 (DP ≧ 37) % = 44.691 × Aλmax – 0.774

2.6. Pasting Properties

The pasting properties of 6 kinds of wheat flour samples were measured using a Rapid Visco Analyzer (RVA) (model Super 4 and novel high-pressure-type RVA 4800; Newport Scientific Pty Ltd, Warriewood, Australia). Thereafter, we measured pasting properties of flour samples using the condition reported by Toyoshima et al; 1 min of heating at 50 °C, 4.0 min of heating from 50 to 93 °C, maintenance for 7.0 min at 93 °C, 4.0 min of cooling from 93 °C to 50 °C, and 3.0 min at 50° C [28].
Novel indices such as the ratio of setback to consistency (Set/Cons) (positive indices of proportion of amylopectin (DP ≧ 13)) and the ratio of maximum viscosity to final viscosity (Max/Fin) (negative indices of proportion of amylopectin (DP ≧ 13)) were reported to be correlated very strongly with the proportion of intermediate and long chains of amylopectin: Fb1+2+3 (DP ≧ 13) [29].

2.7. Preparation of Wheat Noodles

Based on the preparation method for rice noodles [30], 6 kinds of wheat flour samples (150 g, each) were added with 90 g of purified water, or weakly acidic hard water (Contrex pH 4.6) at 90 °C, followed by kneading for 20 min with hands respectively. Thereafter, the dough was stood overnight in a refrigerator. The dough was then put through the roll (100 mm in width and 2 mm of clearance) twice and finally cut by the blade to a width of 2.2 mm. The noodles were heated for 2 min in boiling water and then cooled for 1 min in water at 20 °C [30]. These noodle flour samples were prepared by pulverizing after lyophilization.

2.8. Measurement of Physical Properties of Various Boiled Noodles Using Weakly Acidic Hard Water or Purified Water

The physical properties of wheat noodles were measured by the continuous progressive compression method (CPC) using a Tensipresser (My Boy System, Taketomo Electric Co., Tokyo, Japan) under the following conditions: according to our previous papers [31,32]. Tenderness is shown as compression stress of apex A. Toughness is shown as area of curve surface (AEBC), Pliability is shown as the ratio (area of ABC)/ (area of AEBC), Brittleness is shown as the ratio (sample thickness)/maximum length), hardness is shown as elastic limit compression force (apex A), and maximum length means elastic limit length as shown in Figure S1.

2.9. Measurement of Color Difference of Various Boiled Flour Noodles Using Weakly Acidic Hard Water or Purified Water

The color differences of boiled wheat needles by using weakly acidic hard water (Contrex; pH 4.6) or purified water were measured using a color difference meter (Color Meter NW-11, Nippon Denshoku Co., Tokyo, Japan).

2.10. Analysis of Calcium Contents and Dietary Fiber of Various Boiled Flour Noodles

The calcium contents of the boiled noodles using weakly acidic hard water (Contrex; pH 4.6) or purified water were analyzed by an ICP (Inductively Coupled Plasma) emission spectrometry [33], and those of dietary fiber were measured by microbiological assays and high-performance liquid chromatography-mass spectrometry. These measurements were carried out by General Incorporated Association Ken ou Research Laboratories.

2.11. Noodle-Making for Feed

The noodle from Kitanokaori using weakly acidic hard water (Contrex; pH 4.6) was used as test meal (KIT), and that of control meal (SAN) was noodle by Sanukinoyume using purified water. These noodle flour samples were prepared by pulverizing after lyophilization.

2.12. Animal Feed Test and Diets

Seven-week-old ICR mice were obtained from Japan SLC Co. Ltd. The mice were housed individually in an air-conditioned room at 20–26°C under a 12-h light cycle. After acclimatization with commercial rodent diet (CRF-1, Oriental Yeast, Tokyo) for 4 days, the mice were divided into two groups of six mice each (Test meal: KIT 50% and starch solution 50 %; Control meal: SAN 50% and starch solution 50 %). After 20 hours fasting, each food was administered 20 mL/kg liquid volume to mice single oral administration using a gastric tube. The BGL (blood glucose levels) was measured at 0, 30, 60, 90 and 120 min after feeding, using an ACCU-CHEK AVIVA (Roche DC Co., Ltd. Japan). The animal feeding test was conducted with the formal approval on Animal Care according to the “Guide for the Care and Use of Laboratory Animals” of the Animal Experimentation Committee, Chitose Research Institute. Measurements of inhibition of abrupt increase in postprandial blood glucose levels in mice were carried out by the Japan Food Research Laboratories in Chitose.

2.13. Statistical Analyses

We used Excel Statics (ver. 2006; Microsoft Corp., Tokyo, Japan) for the statistical analysis of the significance of regression coefficients using Student’s t-test, one-way analysis of variance, and Tukey’s test. And the method of Tukey’s multiple comparison was statistically analyzed using Excel NAG Statistics add in 2.0 (The Numerical Algorithms Group Ltd., Tokyo, Japan).

3. Results and Discussion

3.1. Phosphorus Contents of 6 Kinds of Wheat Flour

Wheat is a rich source of many minerals and trace elements, and those of variation is caused by genotype, wheat class, and cultivar as well as the growing location and year [34].Balint et al. [35] and Akman and Kara [36] reported that the diploids had higher mineral and trace elements contents than the hexaploids. Minerals and trace elements of wheat are mostly situated in the outer part of the grain. American hard wheat has clearly higher contents of most minerals and trace elements than soft wheat cultivats, and that of durum wheat was lower [34]. Whereas, ‘Spelt’ was reported to have clearly higher mineral and trace element contents than many other wheat classes[34]. Blennow et al. [37] showed that wheat starch contains a low level of phosphates covalently attached to the C-3 and C-6 positions of glucose, largely covalently attached to the amylopectin fraction. Most starches of cereals, roots, tubers, and legumes, contain 0.02-0.06 % of phosphorus in the form of phospholipid [38].
As shown in Table 1, the phosphorus contents of 4 Japasese hard wheat flour in 2023 were 123.5 ± 10.0 mg/100g (n=4), and those of Japanese medium wheat flour (n=2) were 83.5 ± 12.0 mg/100g (n=2). Particularly Sanukinoyume showed the lowest value.

3.2. Iodine Absorption Spectrum for the Survey of Wheat Starch Microstructure

Amylose is one component of starch which greatly affects the quality and gelatinization properties of wheat [39]. Amylose in starches was reported to be ranged from 23.4 % to 27.6 %, and that of durum wheat showed slightly higher tendency [40] , it was considered that these cultivars were often influenced by numerous stress from the environment. Global warming impairs grain filling in rice and leads to chalky-appearing grains, which were damaged in their physicochemical and cooking qualities and those of AAC (apparent amylose content; AAC contains a lot of amylose and a little SLC (super-long chains) in amylopectin)) showed lower values [20]. Although, components of amylose and amylopectin in principal wheats depend on genetic origin, which are almost unaffected by the environmental conditions [39]. Inouchi et al. [41]. and Hirano et al. [42] showed a high positive correlation between the amount of waxy (Wx) protein and SLC contents of starch. The waxy (Wx) protein has been identified as granule-bound starch synthase, which is involved in amylose synthesis in plants. However common wheat (Triticum aestivum L.) has three Wx proteins, and those lacking one or two of the three proteins have been found, which showed a lower tendency in amylose contents [43]. Takeda et al. [44] showed that cereal amylopectin had a larger number of chains in a cluster than those of root and tuber. Duffus et al.[45] showed that the amylose content of endosperm starch increases during grain development in wheat. Regira et al.[46] developed high-amylose wheat by RNA interference relating branching enzyme (SBEⅡa, SBEⅡb), and those wheat grains was fed to rats in a diet. As a result, this high-amylose wheat has positive effects on indices of gastrointestinal health in rats.
As shown in Table 2, AAC of Minaminokaori was slightly higher values, and those of Haruyokoi, Kitahonami and Sanukinoyume were higher next to Minaminokaori, whereas those of Kitanokaori and Yumechikara were intermediate. As a result, there were almost no significant varietal difference in amylose contents.
The difference of λmax values tends to reflect amylose molecular sizes (the length of the glucan chain; molecular size of amylose and SLC of amylopectin) [41]. There were almost no significant varietal difference inλmax values. The λmax value showed a negative correlation with phosphorus contents (r = - 0.60; p < 0.05).
The Aλmax values reflects not only the properties of amylose but also those of the amylopectin chain length [47]. The Aλmax values of Minaminokaori and Haruyokoi were slightly higher, and those of Kitahonami and Sanukinoyume were higher next to Minaminokaori, and those of Kitanokaori and Yumechikara showed intermediate values. The Aλmax value showed a positive correlation with AAC (r = 0.99; p < 0.01).
In our previous study, we showed that theλmax /Aλmax ratios in iodine colorilative measurements were negatively correlated with apparent amylose contents (AAC) [48], and those ratios of low-amylose rice and glutinous rice starches were higher. Therefore, rice cultivars which showed high ratios of λmax /Aλmax were estimated to be palatable and high-quality. Theλmax /Aλmax ratios of Kitanokaori and Yumechikara were very high, and those of Kitahonami and Sanukinoyume were high, whereas Haruyokoi showed an intermediate value, and Minaminokaori showed the lowest value. Theλmax /Aλmax ratios showed negative correlation with AAC (r = - 0.97; p < 0.05).
In the previous study, we developed the novel estimation formulae for the ratio of amylopectin chain lengths Fb3 (degree of polymerization, DP ≧ 37) % on the basis of the iodine absorption curve [27]. The Fb3 of Minaminokaori and Haruyokoi were slightly higher, and those of Kitahonami and Sanukinoyume were higher next to Minaminokaori, and those of Kitanokaori and Yumechikara were intermediate values. The Fb3 (DP ≧ 37) %, ratios of proportion of longer amylopectin chains, showed a positive correlation with AAC (r = 0.99; p < 0.01).
As a result, Kitanokaori showed very high ratio of λmax /Aλmax, which showed to be low amylose wheat. On the other hand, Sanukinoyume showed slightly higher AAC, Aλmax value and Fb3, ratio of long glucan chains in amylopectin.

3.3. Pasting Properties of 6 Kinds of Wheat Flours in Purified Water or in Weakly Acidic Hard Water with an RVA

Physicochemical properties of the starches were often evaluated as pasting characteristics using an RVA, of which analysis was very useful to characterize the starch digestion properties [29,49]. Many investigations have shown that the rheological properties of starch, such as gelatinization, retrogradation, and pasting properties, are affected by amylopectin molecular structure and various amylase activities.
The Final viscosity (Fin. vis) of high-amylose cultivars have been shown to be higher than those of low-amylose cultivars, and Fin. vis are closely related to the degree of starch retrogradation after cooling [29]. A highly positive relationship was observed between SLC content and consistency (Cons) (= Fin. vis - Mini. vis) [29].
In our previous papers, we reported that it is possible to estimate amylose content, the proportion of intermediate-and long-chains of amylopectin, resistant starch content, and fatty acid[50].composision based upon the pasting properties measured by an RVA [29].
Takeda et al. [51] reported that wheat starch granules contain about 1 % lipid, and the phosphorus is in the form of lysolecithin, some of which are complexed with amylose or outer chains of amylopectin as helical complexes [52,53,54]. Some of the phosphate esters on adjacent amylopectin chains are naturally found as cross-linked with various cations, such as calcium and magnesium [55,56]. Substitution of cations from hydrogen ions etc. to calcium bound to the phosphate was carried out for the purpose of changing the physical properties of starch [57,58].
As we found that the phosphorus contents showed positive correlations with amylose and long chains of amylopectin, we estimate that the effects are mainly due to binding of calcium, in hard water, and phosphorus, in starch.
As shown in Figure 1, we measured the pasting properties of wheat flour using the same rice samples for investigating the relationship between phosphorus contents of the starch and calcium included in weakly acidic hard water. Therefore, we used weakly acidic Contrex pH 4.6 (hardness: 1468 mg/L) or the purified water for the pasting property test and compared the results.
As shown in Table 3 and Table 4, the Max. vis (maximum viscosity) of Sanukinoyume was the highest, and that of Minaminokaori was the lowest value. Max. vis of wheat flour using weakly acidic hard water showed 1.0 ~ 1.2 times higher than those in purified water, especially Minaminokaori showed the highest values. The Max. vis showed a positive correlation with the Fin. vis (final viscosity) (r = 0.90; p < 0.01) and Cons (consistency) (r = 0.92; p < 0.01), indicators of retrogradation.
The Min. vis (minimum viscosity) of wheat flour using weakly acidic hard water showed lower values than those in purified water, for examples, Haruyokoi showed 0.9 times, Kitanokaori; 0.9 times, and Sanukinoyume showed 0.5 times, however that of Minaminokaori showed higher 1.2 times compared with the values in purified water. The Min. vis showed significant positive correlations with the Fin. vis (r = 0.98; p < 0.01), Cons (r = 0.98; p < 0.01) and Max. vis (r = 0.85; p < 0.01).
The BD (break down; Max. vis – Min. vis) indicates the easiness with which the starch granules are disintegrated [20,29,59], and that of Sanukinoyume was the highest, and that of Minaminokaori was the lowest. The BD of wheat flour using weakly acidic hard water showed 1.0 ~ 1.3 times higher than those in purified water, especially Kitanokaori and Kitahonami showed the highest values. The BD showed significant positive correlation with the Fin. vis (r = 0.81; p < 0.01) and Cons (r = 0.87; p < 0.01).
The Fin. vis (final viscosity), indicator of retrogradation, of Sanukinoyume was the highest, and that of Kitahonami was the next highest, and that of Minaminokaori showed the lowest value. The Fin. vis of wheat flour using weakly acidic hard water showed lower values than those in purified water, for examples, Haruyokoi showed 0.9 times and Sanukinoyume; 0.9 times, however that of Minaminokaori showed higher 1.2 times, and that of Yumechikara, Kitanokaorimi and Kitahonami showed almost the same value. The Fin. vis showed significant positive correlation with the Cons (r = 0.96; p < 0.01) and significant negative correlation with SB (set back) (r = - 0.74; p < 0.01), and P (phosphorus contents) (r = - 0.60; p < 0.05). Generally, high-amylose cereal starches tend to retrograde more rapidly after gelatinization than the ordinary rice and low-amylose rice [21].
The different peak viscosities (Fin. vis – Max. vis) was shown as “SB” (set back) in this paper according to the measurements using an RVA. The SB of Sanukinoyume was the lowest, and that of Kitanokaori was the highest. The SB of wheat flour using weakly acidic hard water showed 1.3 ~ 3.2 times higher than those in purified water, especially Kitanokaori showed 3.2 times higher values. The SB showed significant negative correlation with Max. vis (r = - 0.96; p < 0.01), BD (r = - 0.99; p < 0.01), Cons (r = - 0.80; p < 0.01), Fin. vis (r = - 0.74; p < 0.01) and Min. vis (r = - 0.66; p < 0.05).
The chain length distribution of amylopectin molecules determines the gelatinization temperature of starch, enthalpy changes, and pasting properties, and the gelatinization temperature of starch increases with increasing of chain length [60].
The Pt of wheat flour using weakly hard water showed 1.0 ~ 1.2 times higher than those in purified water. The Pt showed significant positive correlation with the Ca (calcium content) (r = 0.76; p < 0.01).
The Cons (consistency; Fin. vis – Min. vis), indicator of retrogradation, of wheat flour using weakly acidic hard water or purified water showed almost the same values. The Cons showed negative correlation with P (r = - 0.59; p < 0.05).
In our previous paper, we reported that the novel index of the ratios of SB/Cons, Max/Fin and Max/Min had higher correlations with RS content, because Fb1+2+3(DP≧13) had a significant positive correlation with SB/Cons, and negative correlation with Max/Fin and Max/Min [29]. The SB/Cons ratios of Kitanokaori showed the highest values, and that of Sanukinoyume was the lowest value. The SB/Cons ratios of wheat flour using weakly acidic hard water showed 1.3 ~ 3.2 times higher than those in purified water, especially Kitanokaori showed the highest value. The SB/Cons ratios showed a significant negative correlation with Max/Min (r = - 0.94; p < 0.01) and Max/Fin (r = - 1.00; p < 0.01).
In our previous study, we showed that phosphorus contents of rice samples revealed significant correlation with sunlight hours. The high ripening temperature have a strong influence on the regulation of genes for starch synthases and branching enzymeⅡb , which lead to decrease in the amylose content, in contrast, increase of long chain-enriched amylopectin [20].
In the present study, all noodle samples in weakly acidic hard water showed a little higher Pt values than those in the purified water due to binding of calcium, in hard water, and phosphorus in starch. Therefore, it seemed that the Pt showed a positive correlation with the calcium content. Moreover, we showed that phosphorus contents of wheat flour samples revealed significant negative correlation with Fin. vis and Cons., which means that wheat noodles using weakly acidic hard water tend to prevent retrogradation. Furthermore, the BD value of Kitanokaori using weakly acidic hard water were higher than that in purified water, which means the improvement of pasting properties by using weakly acidic hard water.

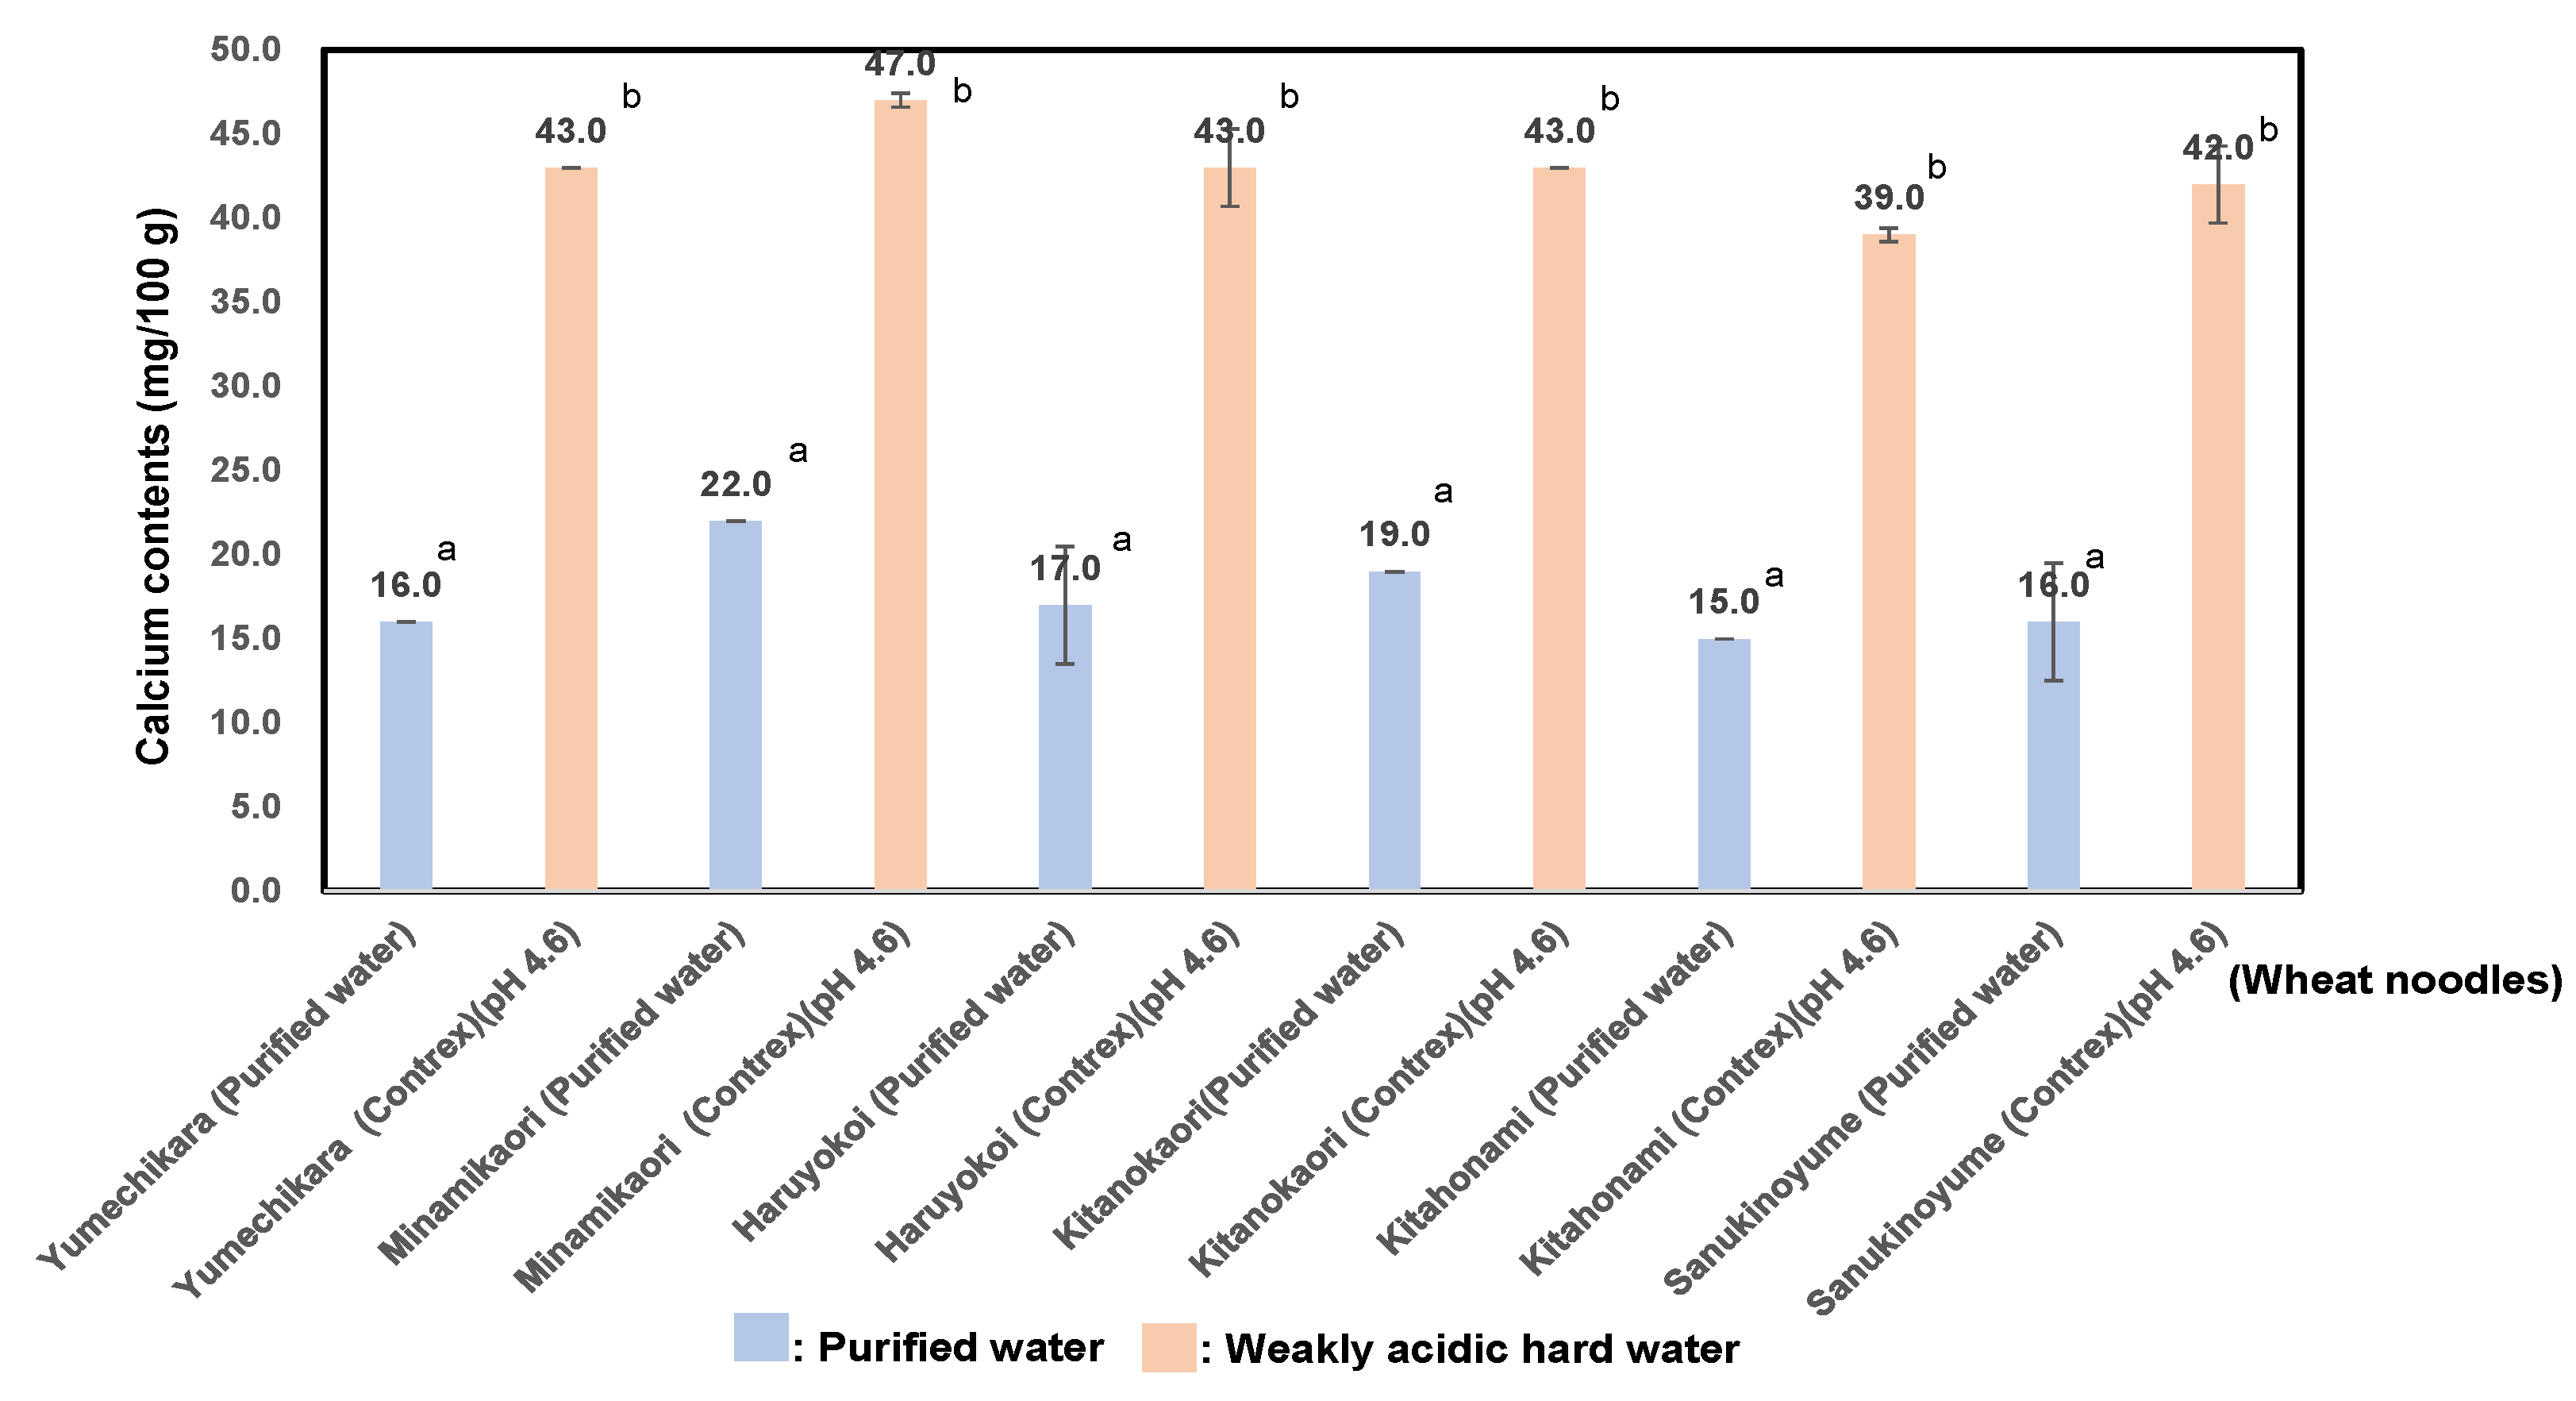
3.4. Calcium Contents in 6 Kinds of Wheat Flour Noodles Using Weakly Acidic Hard Water (pH 4.6) or the Purified Water

Mineral and trace elements of wheat are mostly situated in the outer part of the grain. The difference in mineral or trace element contents between whole grains and white flour is in most cases two- to fourfold (potassium 2.7-fold, calcium 2.3-fold, copper 2.4-fold) [61]. The ability of dietary fiber to bind (especially) divalent cations such as Ca2+, Mg2+, Zn2+, Cu2+, and Fe2+ is well known [35].
As shown in Figure 1, the calcium contents of 6 various kinds of wheat flour noodles using purified water showed value of 17.5 ± 2.6 (mg/100g), particularly, Minaminokaori showed the highest value, 22.0 ± 0.0 (mg/100g), and those of wheat noodles using wheat flour noodles using purified water showed weakly acidic hard water showed value of 42.8 ± 2.6 (mg/100g), especially Minaminokaori showed the highest value, 47.0 ± 0.4 (mg/100g),. The calcium contents of wheat flour noodles using weakly acidic hard water showed 2.1 ~ 2.7 times higher than those in purified water, especially Yumechikara showed the highest ratio.
As a result, it seemed that the calcium contents of wheat noodles using weakly acidic hard water showed a similar tendency as ones of using purified water. Perhaps the characteristics of wheat grains using weakly acidic hard water were caused by the difference in the fine structure of amylopectin with enriched long chains within a cluster. In the present study, hard wheat cultivars showed a little higher calcium contents than those of medium ones. The wheat noodles using weakly acidic hard water are useful for increasing the calcium intake through the meal.
Figure 1. Calcium contents in 6 kinds of wheat flour noodles using weakly acidic hard water (pH 4.6) or the purified water. As results of the comparison between purified water and weakly hard water for producing wheat noodles, for the same wheat sample, different letters (a, b) denote statistically significantly differences. Values are shown as mean ± standard deviation.
Preprints 150048 g001

3.5. Textural Properties of 6 Kinds of Domestic Wheat Flour Noodles Using Weakly Acidic Hard Water (pH 4.6) or the Purified Water

Previous studies reported that physical properties of Japanese wheat dough and boiled noodles have a tendency to be weakerr compared with Australian standard white (ASW), because Japanese domestic wheat flour showed rather low amylose and protein contents than those of ASW [49,63]. Toyokawa et al. [64] showed that the important quality attributes of wheat flour noodle are color, taste, surface appearance upon cooking, and eating quality comes principally from characteristics of starch [65]. Crosbie et al. [66] showed that the swelling volume of Japanese wheat flour shows a positive correlation with the total texture score and its attributes, namely balance of softness to hardness, elasticity and smoothness [66,67].
We reported that the boiled rice grains boiled in hard water showed slightly higher hardness, toughness, stickiness, and cohesiveness compared with ones boiled in purified water, because various hydrolytic enzymes were inhibited by boiling in hard water [20].
We measured and compared the textural properties of 6 kinds of wheat noodles using weakly acidic hard water (pH 4.6) or using purified water. Measurement of the physical properties of the wheat flour noodles by CPC with the Tensipresser is shown in Figure S1.
Noda et al. [68,69] reported that the calcium-fortified potato starch showed a strong ionically binding with starch phosphate, therefore that of characteristics showed a similar tendency to modified starch of phosphate cross-linked starch.
As shown in Table 5, in the Tenderness (softness) of wheat noodles using purified water, the highest was Sanukinoyume, followed in order by Kitahonami, Yumechikara, Kitanokaori, Minaminokaori and Haruyokoi, and in the Toughness (strength), the highest was Sanukinoyume, followed in order by Yumechikara, Minaminokaori, Kitanokaori, Kitahonami and Haruyokoi. The Tenderness and Toughness of wheat noodles prepared using weakly acidic hard water showed a little lower than those by purified water. As shown in Table 4, the Tenderness showed a positive correlation with Toughness (r = 0.91; p < 0.01), Min. vis (r = 0.66; p < 0.05), Fin. vis (r = 0.69; p < 0.05), and negative correlation with P (phosphorus contents) (r = - 0.78; p < 0.01).
In the Hardness of wheat noodle using weakly acidic hard water or purified water showed little difference. The Hardness showed negative correlation with Max. vis (r = - 0.63; p < 0.05), Min. vis (r = - 0.66; p < 0.05), Fin. vis (r = - 0.72; p < 0.01) and Cons (r = - 0.75; p < 0.01).
In the Pliability (flexibility) and Brittleness of wheat noodles using weakly acidic hard water showed almost the same values with ones using purified water. The Pliability showed negative correlation with RS (resistant starch) (r = - 0.78; p < 0.01). And The Brittleness showed negative correlation with Hardness (r = - 0.69; p < 0.05).
In this study, physical properties of wheat flour noodles using purified water or weakly acidic hard water showed no significant difference.

3.6. Improvement of the Color of 6 Kinds of Wheat Noodles Using Weakly Acidic Hard Water, Contrex (pH 4.6)

Color is an important quality criterion for Japanese noodles [70]. Lutein, one of carotenoid, contribute principally to the color of noodles (whiteness, brightness, yellowness) [71]. Hou et al. [72] and Ito et al. [73] showed that each noodle type has its own unique color and texture characteristics due to flour color, protein content, ash content, yellow pigment and polyphenol oxidase activity.
As shown in Table 6, we evaluated color difference of domestic wheat flour noodles using weakly acidic hard water (pH 4.6) or purified water. The WB (whiteness) of wheat flour noodles using weakly acidic hard water showed 1.04 ~ 1.25 times higher than those in purified water, especially Yumechikara showed the highest values, and L*(brightness) showed a similar tendency.
Moreover, a ratio of the color difference (ΔE*(ab)) of wheat noodles using weakly acidic hard water showed 0.88 ~ 0.98 times lower than those in purified water, and those of b* showed a similar tendency.
Also, reddish degree (ratio of color difference a*) of wheat noodles using weakly acidic hard water showed slightly lower compared to the wheat noodles by purified water.

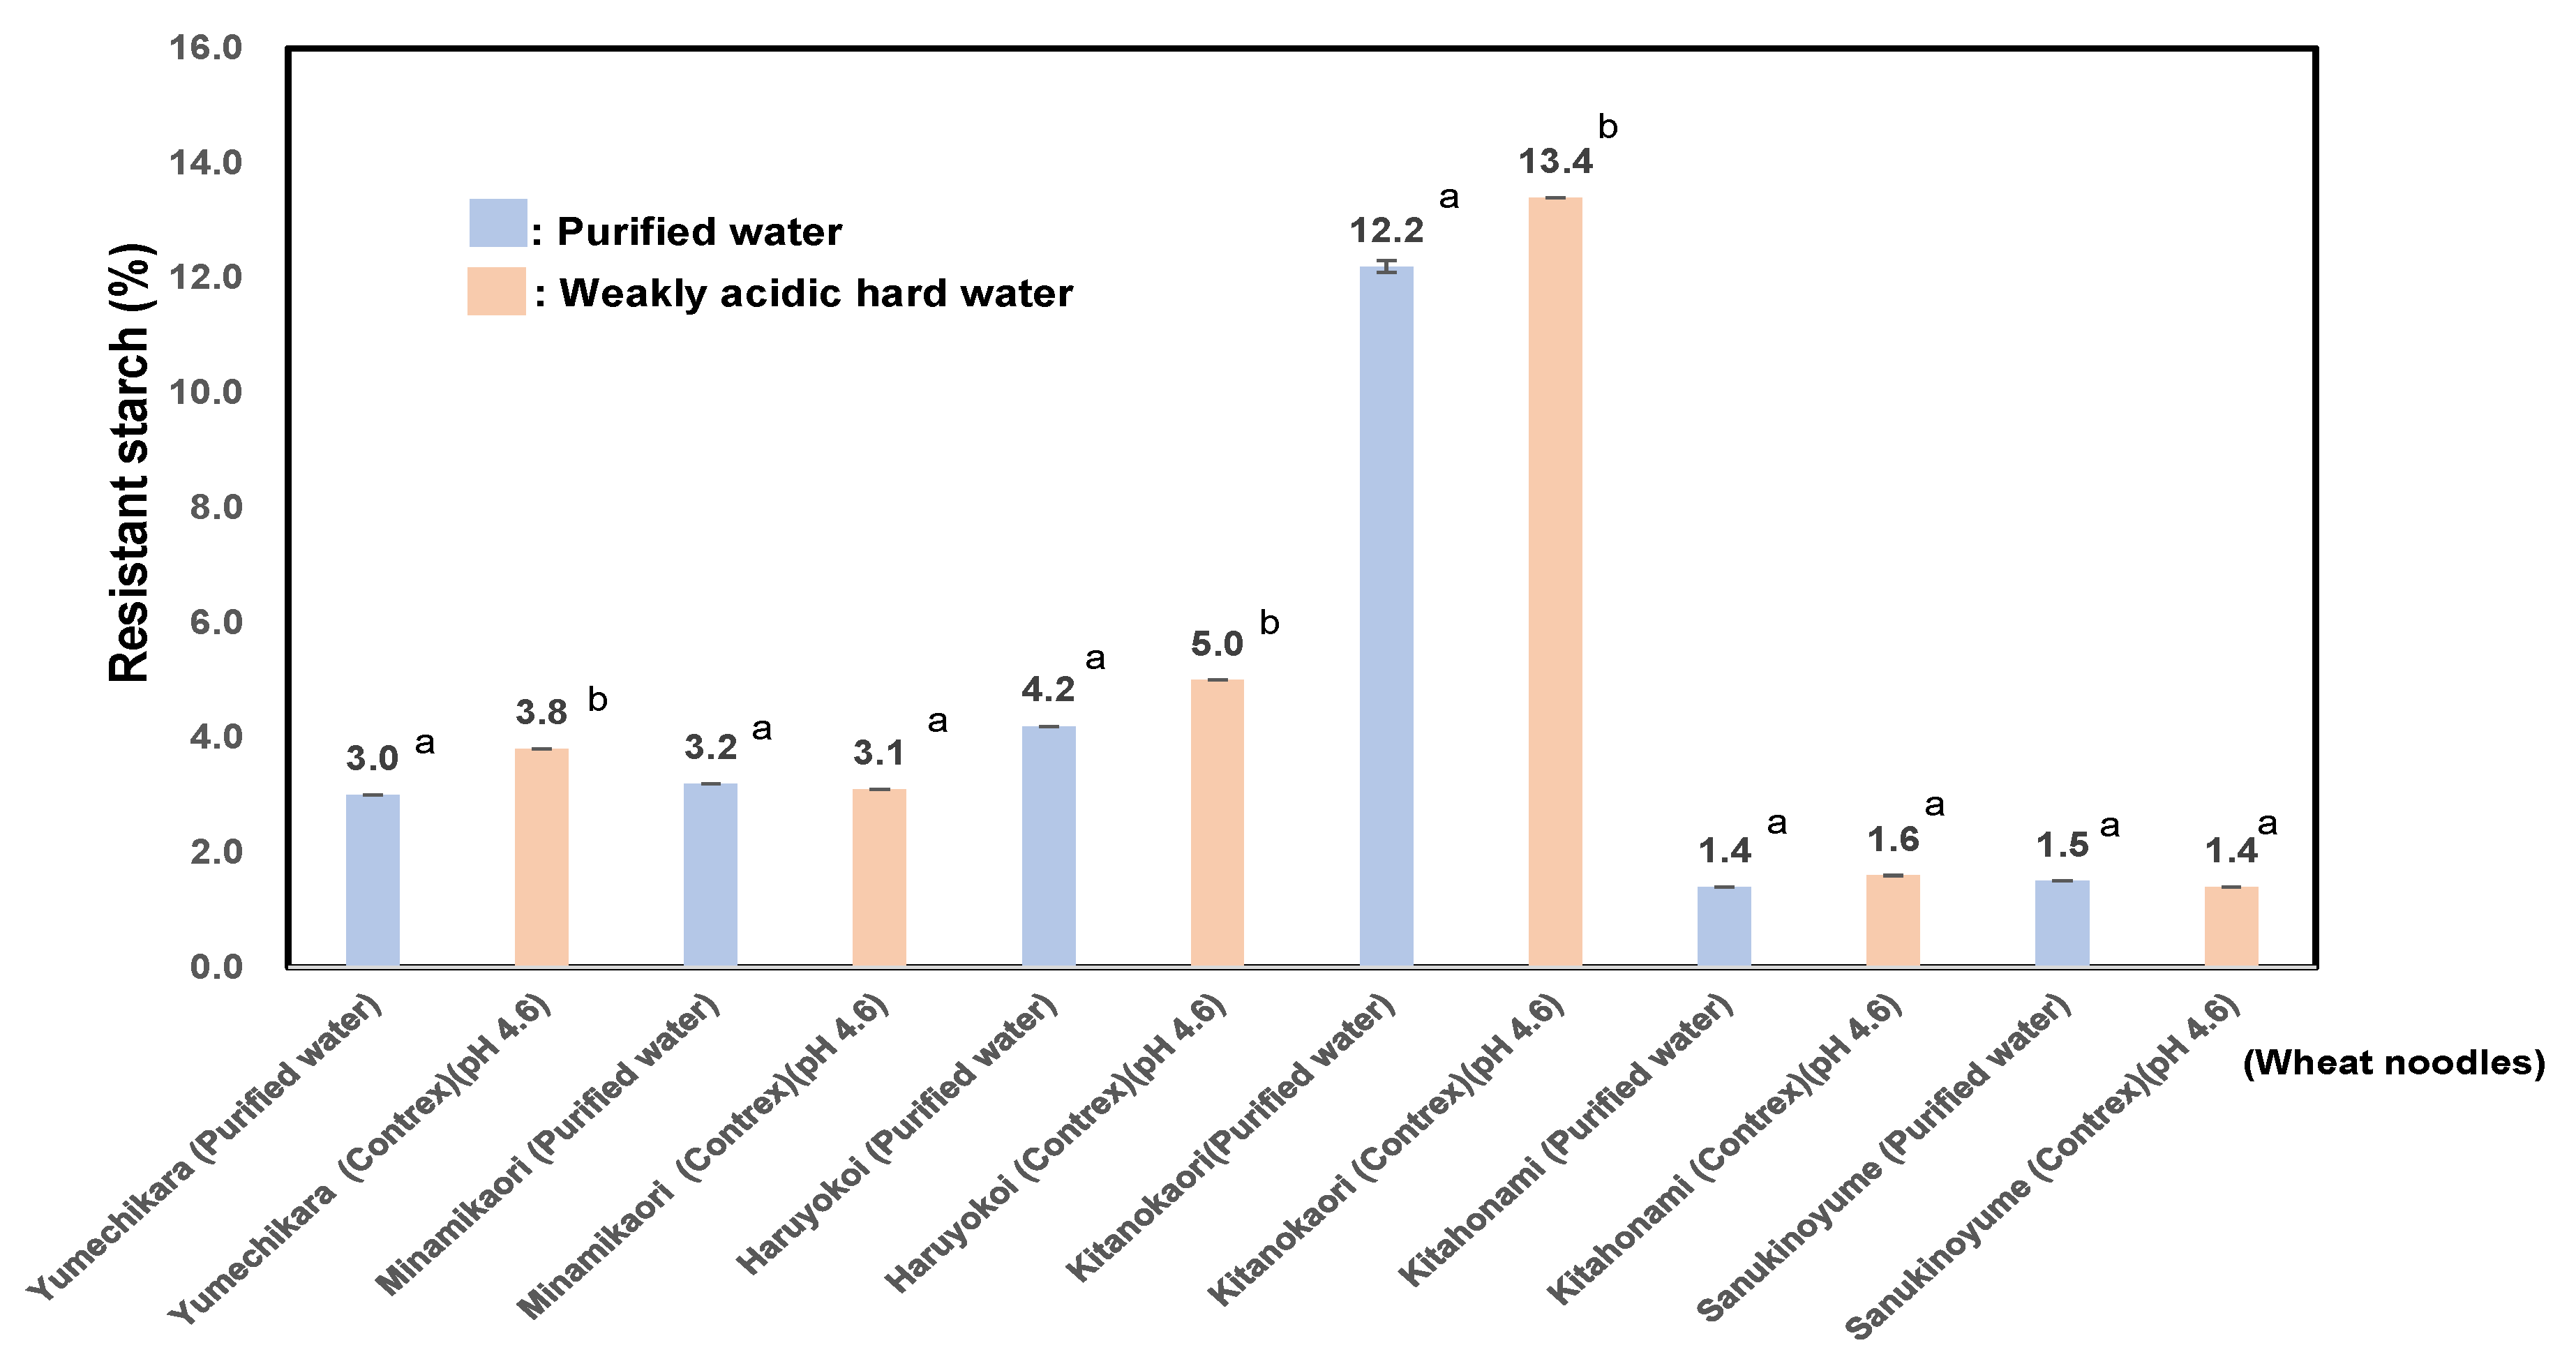
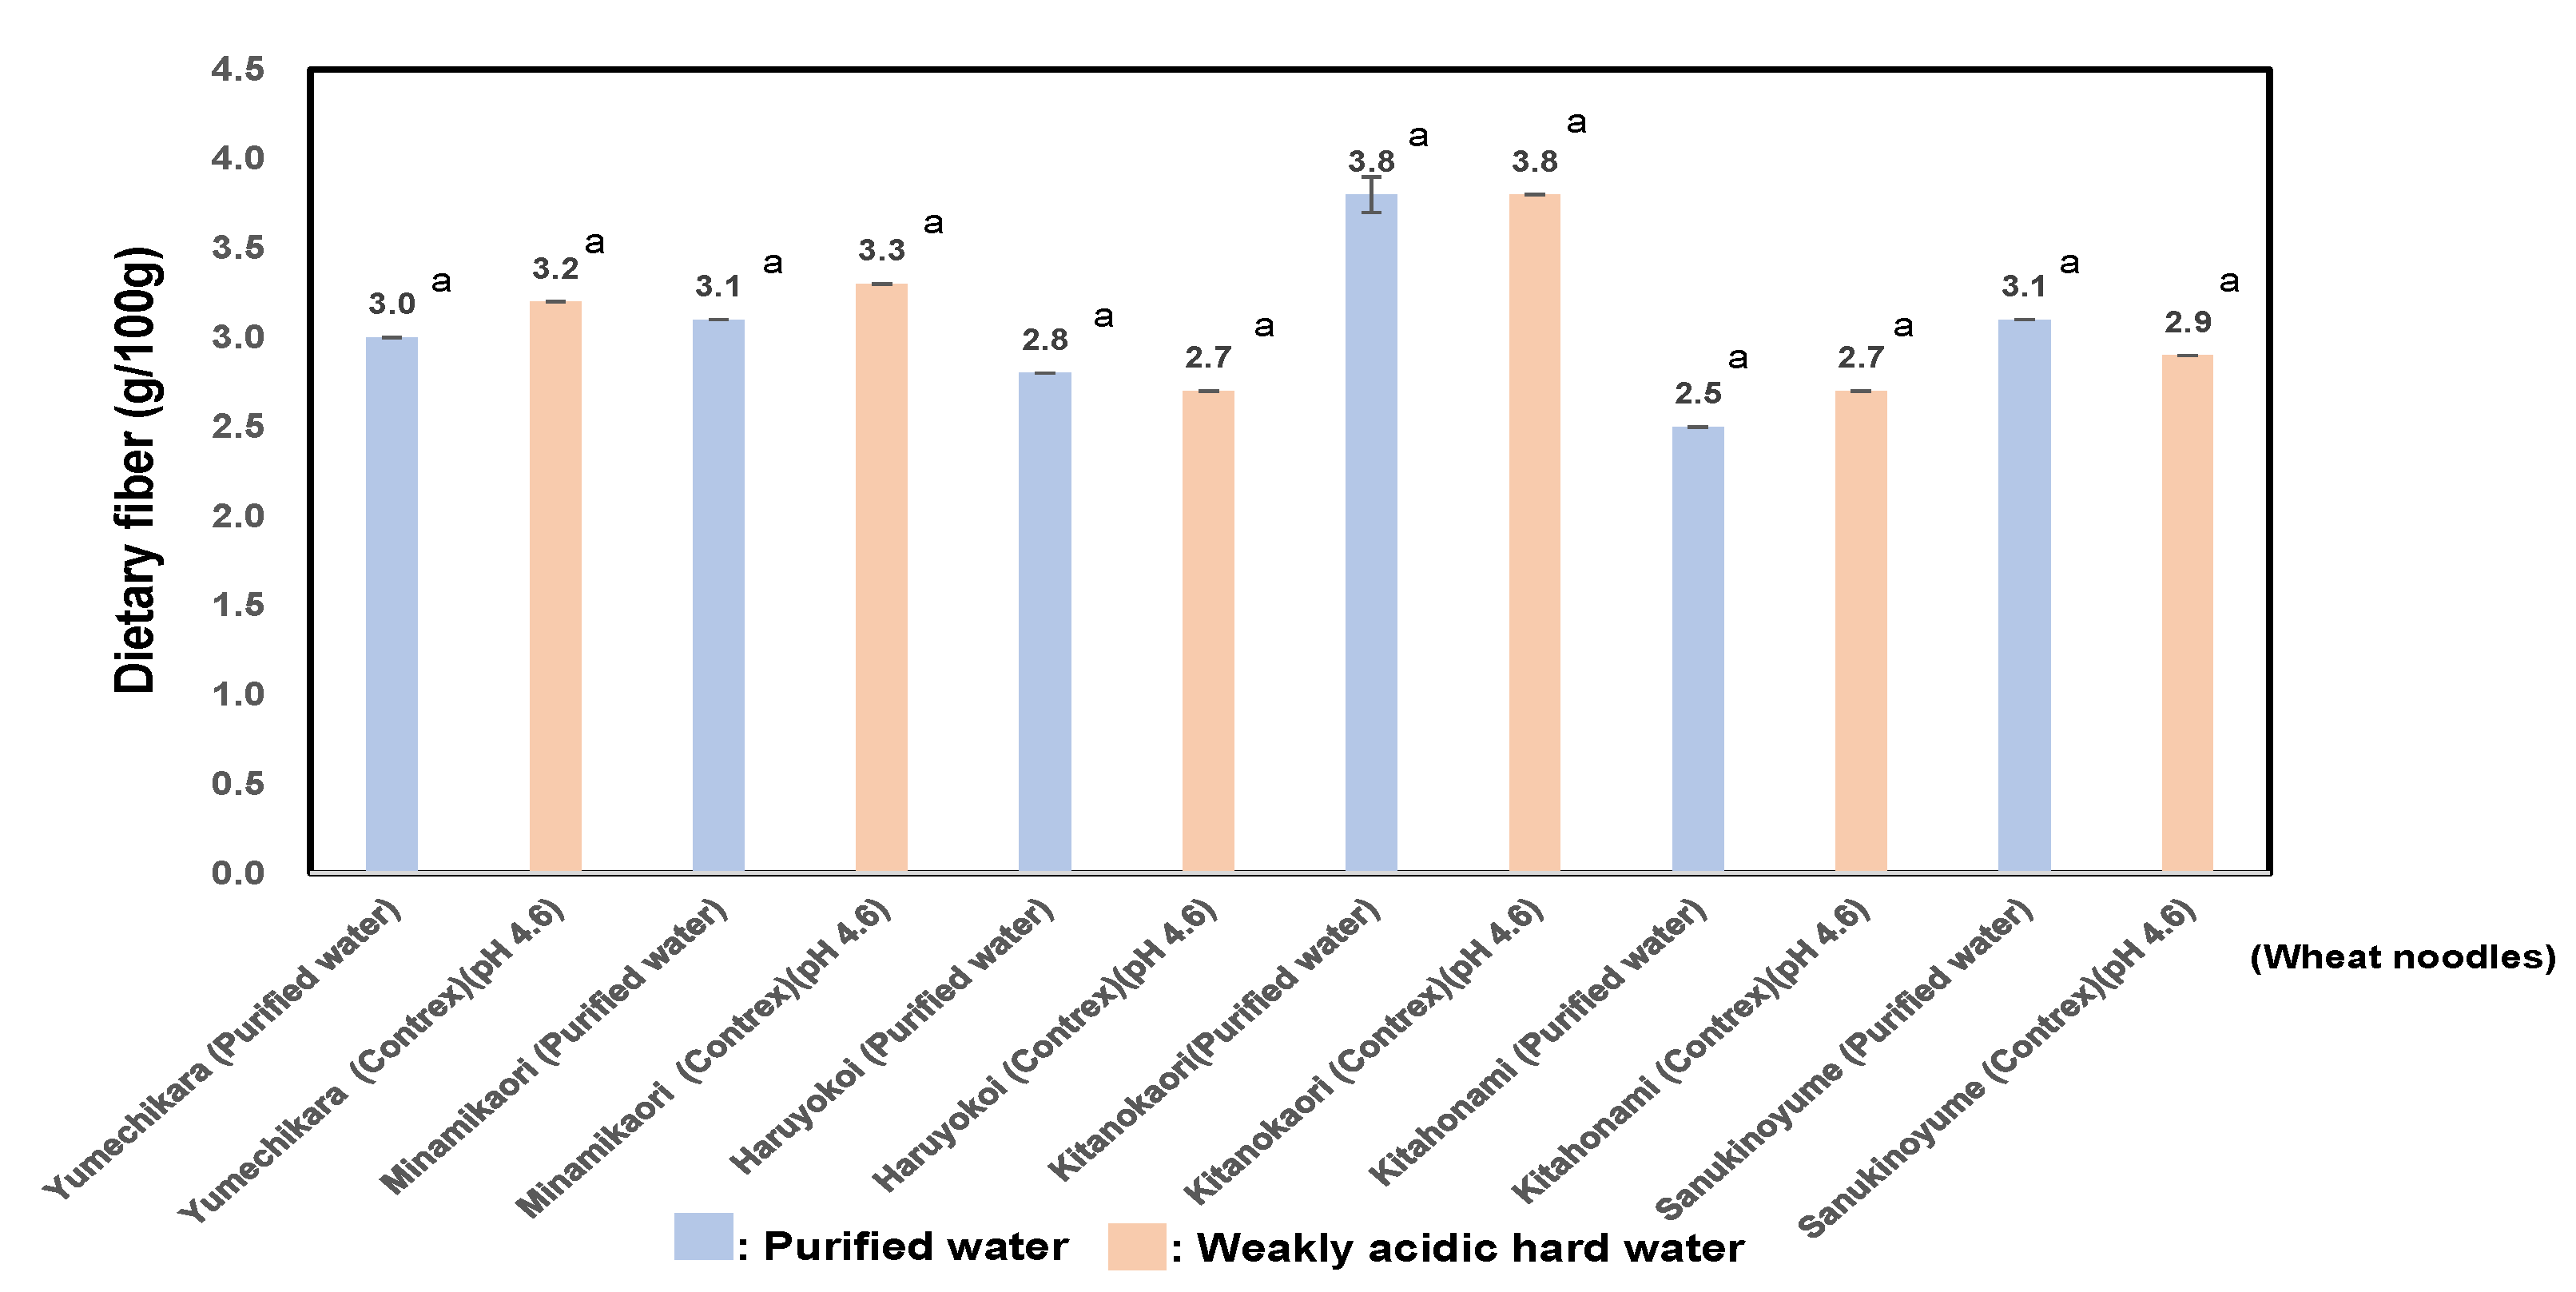
3.7. Measurement of Biofunctional Properties of RS(Resistant Starch) and Dietary Fiber of 6 Kinds of Wheat Flour Noodles Using Weakly Acidic Hard Water or the Purified Water

Sajilate et al. [74] showed that it become possible to classify RS (resistant starch) into four types. Type-4 is chemically modified starch which interferes with enzymatic digestion [75] . The disstarch phosphate potato starch, and that of rice, tapioka starch, sweet potato starch and wheat starch are sources for RS Type-4 [76].
As shown in Figure 2, the RS contents of 6 various kinds of wheat noodles using purified water showed value of 4.3 ± 4.0 (%), particularly, Kitanokaori showed the highest value 12.2 ± 0.1 (%), and those of wheat noodles using weakly acidic hard water showed value of 4.7 ± 4.4 (%), especially Kitanokaori showed the highest values 13.4 ± 0.0 (%). The RS contents of wheat noodles using weakly acidic hard water showed 0.9 ~ 1.3 times higher than those prepared in purified water. As shown in Table 4, RS contents showed a significant positive correlation with the P (r = 0.58; p < 0.05).
It was shown that the calcium contents in the noodles effectively increased by using weakly acidic hard water, and also RS contents of wheat noodles using weakly acidic hard water tended to be higher than those prepared in the purified water.
Tabiki et al. [77] reported that the pedigree of “Kitanokaori” is “Horoshiri komugi”/ “GK Szemes.” GK Szemes is Hungarian wheat variety, which has good bread-making quality and Kitanokaori showed high milling quality, bread making quality and high pentosan contents, which exceed those of the parents.
As a result, the RS contents of noodles from Kitanokaori using weakly acidic hard water showed 2.9 ~ 8.4 times higher than those other cultivars using weakly acidic hard water.
Pentosans are the major non-starch polysaccharides of wheat flours [78]. Wheat flour contains water-soluble and water-insoluble pentosans. The soluble pentosans are composed of arabinoxylans, which produce some short-chain fatty acids by the gut microbial fermentation. Therefore, they are one of the main components of dietary fiber in cereals [79,80]. Shogren et al. [81] showed that water-soluble and water-insoluble pentosans improve breadmaking properties of wheat flours. It seemed that various cell wall components from different parts of wheat grains, and their compositions and sugar linkages for these cell walls are different among the various kinds of wheat cultivars [82].
As shown in Figure 3, the dietary fiber of 6 various kinds of wheat noodles using purified water showed values of 2.5 ± 3.8 (g/100g), particularly, Kitanokaori showed the highest value, 3.8 ± 0.1 (g/100g), and those of wheat noodles using weakly acidic hard water showed value of 2.7 ± 3.3 (g/100g), especially Kitanokaori showed the highest values, 3.8 ± 0.0 (g/100g). The dietary fiber of wheat noodles using weakly acidic hard water showed almost the same values with ones using purified water. As shown in Table 4, the dietary fiber showed a significant positive correlation with the RS (r = 0.82; p < 0.01).
Among the six wheat culrtivars, Kitanokaori was shown that it is a characteristic wheat cultivar in terms of bio-functionality, because it contains most amount of resistant starch and dietary fiber.

3.8. Determination of the Initial BGL of Aged Mice Fed with Noodle Flours Kept for 8 Weeks

Yamanaka and Aoe reported that KK Mice fed a diet low in calcium, and their pancreas induced inflammation, and their insulin secretion showed a lower tendency [19]. Ogata et al. [83] and Farlay et al. [84] reported that the osteoporosis is one of the complications of diabetes. Moreover, Oei et al. [85] showed that poor glycemic control in type 2 diabetes is associated with fracture risk of bones. Villegas et al. [9] and Liu et al. [10] reported that it is important to consume adequate amounts of calcium for also diabetes prevention.
RS and dietary fiber are the same undigestible polysaccharide, which derived from starch or non-starch polysaccharide, and which have similar nutritional physiology, for example, inhibition for blood sugar elevation and cholesterol-lowering effect.
As shown in Figure 4, we prepared noodle (KIT) from Kitanokaori (newly developed Japanese wheat flour) using weakly acidic hard water, which showed greater resistant starch (9.0-fold), dietary fiber (1.2-fold) and calcium (2.7-fold) contents than noodle (SAN) from Sanukinoyume (Japanese premium wheat flour) using purified water. Furthermore, aged mice, which fed a KIT diet for eight weeks, showed lower in postprandial blood glucose levels (BGL) after consumption at 30 min than mice fed a control diet (SAN) (p <0.05).
Furthermore, Kitanokaori has superior characteristics, such as, resistance to leaf rust and powdery mildew, good bread making quality, and high lodging resistance compared to other wheat cultivars in Hokkaido [77]. For this reason, we recommended Kitanokaori as a material for the development of palatable and functional wheat noodle.

4. Conclusions

Type-2 diabetes and osteoporosis are very serious diseases all over the world. In this pa per, we reported that newly developed wheat cultivar, Kitanokaori, contains more resistant starch than the other wheat cultivars. In terms of pasting properties of wheat flour and textural properties of the noodle from Kitanokaori (KIT), they are not inferior to those of the traditional premium wheat cultivar, Sanukinoyume. Furthermore, we found that KIT using weakly acidic hard water contained remarkably high amount of resistant starch, dietary fiber and calcium content. We proved that KIT inhibits postprandial abrupt increase of blood glucose in mice. Therefore, KIT seems to be promising as a functional food by which type-2 diabetes and osteoporosis could be prevented.

Supplementary Materials

The following supporting information can be downloaded at the website of this paper posted on Preprints.org., Figure S1: The physical properties of wheat noodles were measured by the continuous progressive compression method (CPC). Continuous progressive compression test (CPC-test).

Author Contributions

S.N. and K.O. designed; S.N. did the experiments; S.N and K.O. wrote the manuscript. All authors have read and agreed to the published version of the manuscript.

Funding

A part of this research was supported by Toyo Suisan Foundation.

Data Availability Statement

The datasets generated for this study are available on request to the corresponding author.

Ethical Statement

The animal feeding test was conducted with the formal approval on Animal Care according to the “Guide for the Care and Use of Laboratory Animals” of the Animal Experimentation Committee, Chitose Research Institute.

Conflicts of Interest

The authors declare no conflict of interest.

Abbreviations

AAC: apparent amylose content; RS, resistant starch; SLC, super-long chains; DP, degree of polymerization; RVA, rapid visco analyser; SB, setback; BD, breakdown; Max. vis., maximum viscosity; Mini. vis., minimum viscosity; Pt, pasting temperature; Cons, consistency; Fin vis., final viscosity; KIT, noodle from ‘kitanokaori’; SAN, noodle from ‘Sanukinoyume’.

References

  1. The IDF (International Diabetes Federation) Diabetes Atlas 10th. Available online: https://diabetesatlas.org/date/en/(accessed on 7 February 2024).
  2. ADI (Alzheimer’s Disease International) Report. 2015. Available online: https://www.alzint.org/resource/world-alzheimer report-2015/ (accessed on 5 February 2024).
  3. Nakamura, S.; Ikeuchi, T.; Araki, A.; Kasuga, K.; Watanabe, K.; Hirayama, M.; Ito, M.; Ohtsubo, K. Possibility for prevention of type 2 diabetes mellitus and dementia using three kinds of brown rice blends after high-pressure treatment. Foods. 2022, 11, 818. [CrossRef]
  4. Tomaru, M.; Takano, H.; Osakabe, N.; Yasuda, A.; Inoue, K.; Yanagisawa, R.; Ohwatari, T.; Uematsu, H. Dietary supplementation with cacao liquor proanthocyanidins prevents elevation of blood glucose levels in diabetic obese mice. Nutrition. 2007. 23, 351-5.
  5. Kanamoto, Y.; Yamashita, Y.; Nanba, F.; Yoshida, T.; Tsuda, T.; Fukuda, I.; Nakamura-Tsuruta, S.; Ashida, H. A black soybean seed coat extract prevents obesity and glucose intolerance by up-regulating uncoupling proteins and down-regulating inflammatory cytokines in high-fat diet-fed mice. J Agric Food Chem. 2011, 59, 8985-93.
  6. Vestergaard, P. Discrepancies in bone mineral density and fracture risk in patients with type 1 and type 2 diabetes—a meta-analysis. Osteoporos 1nt. 2007, 18, 427-444. [CrossRef]
  7. Parthasarathy, S.; Khoo, JC.; Miller, E.; Barnett, J.; Witztum, JL.; Steinberg, D. Low density lipoprotein rich in oleic acid is protected against oxidative modification: implications for dietary prevention of atherosclerosis. Proc. Natl. Acad. Sci. USA. 1990, 87, 3894-3898.
  8. Nakajima, M.; Cooney, MJ.; Tu, AH.; Chang, KY.; Cao, J.; Ando, A.; An, GJ.; Melia, M.; de Juan, E jr. Normalization of retinal vascular permeability in experimental diabetes with genistein. Invest Ophthalmol Vis Sci. 2001, 42(9), 2110-2114.
  9. Villegas, R.; Gao, YT.; Dai, Q.; Yang, G.; Cai, H.; Li, H.; Zheng, W.; Shu, XO. Dietary calcium and magnesium intakes and the risk of type 2 diabetes. The Shanghai women’s health study. Am J Clin Nutr. 2009, 89, 1-9.
  10. Liu, S.; Choi, HK.; Ford, E.; Song, Y.; Klevak, A.; Buring, J.; Manson, JE. A prospective study of dairy intake and the risk of type 2 diabetes in women. Diabetes Care. 2006, 29(7): 1579-84. [CrossRef]
  11. Carson, GR.; Edwards, NM. Chapter 4: Criteria of wheat and flour quality. In WHEAT: Chemistry and Technology, Scientific Societies: St. Paul, MN, USA, 2009; 97-118.
  12. Oda, S.; Schofield, JD. Characterisation of friabilin polypeptides. J. Cereal Sci. 1997, 26(1),29-36. [CrossRef]
  13. Morris, C. Puroindolines: the molecular genetic basis of wheat grain hardness. Plant Mol Biol. 2002, 48(5-6): 633-47. [CrossRef]
  14. Silano, V.; Pocchiari, F.; Kasarda, DD. Physical characterization of alpha-amylase inhibitors from wheat. Biochim Biophys Acta. 1973, 317:139. [CrossRef]
  15. Morimoto, T.; Miyazaki, T.; Murayama, R.; Kodama, T.; Kitamura, I.; Inoue, S. Wheat album with amylase-inhibitory activity suppresses glycemic rise after rice loading in Human subjects. Japan Society of Nutrition and Food Science. 1999, 52(5)285-291.
  16. Piironen, V.; Lampi, AM.; Ekholm, P. Chapter 7: Micronutrients and phytochemicals in wheat grain. In WHEAT: Chemistry and Technology, Scientific Societies: St. Paul, MN, USA, 2009; 179-222.
  17. Zhao, J.; Na Guo, X.; Zhu, KX. Effect of phytic acid on the appearance of yellow alkaline noodles: Color and dark spots. J. Cereal Sci. 2024, 16, 103853. [CrossRef]
  18. Pittas, AG.; Dawson-Hughes, B.; Li, T.; Dam, RM.; Willett, WC. Vitamin D and calcium intake in relation to type 2 diabetes in women. Diabetes Care. 2006, 29(3): 650-6. [CrossRef]
  19. Yamanaka, C.; Aoe, S. The effects of dietary calcium levels on pancreatic function in KK Mice. J Jpn Soc Nutr Food Sci.2018, 71, 75-82.
  20. Nakamura, S.; Hasegawa, M.; Kobayashi, Y.; Komata, C.; Katsura, J.; Maruyama, Y.; Ohtsubo, K. Palatability and bio-functionality of chalky grains generated by high-temperature ripening and development of formulae for estimating the degree of damage using a rapid visco analyzer of Japonica unpolished rice. Foods. 2022, 11, 3422. [CrossRef]
  21. Nakamura, S. and Ohtsubo, K. Effects of hard water boiling on chalky rice in term of texture improvement and Ca fortification. Foods. 2023, 12, 2510. [CrossRef]
  22. Nagao, S.; Imai, S.; Sato, T.; Kaneko, Y.; Otsubo, H. Quality characteristics of soft wheats and their use in Japan.Ⅰ. Methods of assessing wheat suitability for Japanese products. Cereal Chem. 1976, 53(6), 988-997.
  23. Toyokawa, H.; Rubenthaler, GL.; Powers, JR.; Schanus, EG. Japanese noodle qualities.Ⅰ. Flour components. 1989, Cereal Chem. 66(5), 382-386.
  24. Pulliainen, TK; Wallin, HC. Determination of total phosphorus in foods by colorimetric measurement of phosphorus as molybdenum blue after dry-ashing: NMKL interlaboratory study. J AOAC Int. 1994;77(6):1557-61.
  25. Yamamoto, K.; Sawada, S.; Onogaki, I. Effects of quality and quantity of alkali solution on the properties of rice starch. Denpun Kagaku. 1981, 28, 241-244.
  26. Juliano, B. O.; Onate, L. M.; Mundo, A. M. A simplified assay for milled rice amylose. Food Technol. 1965, 19, 1006-1011.
  27. Nakamura, S.; Satoh, H.; Ohtsubo, K. Development of formulae for estimating amylose content, amylopectin chain length distribution, and resistant starch content based on the iodine absorption curve of rice starch. Biosci. Biotechnol. Biochem. 2015, 79 (3), 443-455.
  28. Toyoshima H.; Okadome H.; Ohtsubo K.; Suto M.; Horisue N.; Inatsu O.; Narizuka A.; Aizaki M.; Inouchi N.; Fuwa H. Cooperative test on the small-scale rapid method for the gelatinization properties test of rice flours with a rapid visco analyser. Nippon Shokuhin Kogakukaishi 1997, 44, 579-584.
  29. Nakamura, S.; Katsura, J.; Kato, K.; Ohtsubo, K. Development of formulae for estimating amylose content and resistant starch content based on the pasting properties measured by RVA of Japonica polished rice and starch. Biosci. Biotechnol. Biochem. 2016, 2, 329-340.
  30. Li, Y.; Suzuki, K.; Kohyama, K.; Hu, Y.; Ohtsubo, K.; Intabon, K.; Satake, T. Quality evaluation of rice noodles made from different rice varieties. Nippon Shokuhin Kagaku Kogaku Kaishi. 2007, 8(3): 147–154.
  31. Okadome, H.; Toyoshima, H.; Sudo, M.; Ando, I.; Numaguchi, K.; Ohtsubo, K. Palatability evaluation for Japonica rice grains based on multiple physical measurements of individual cooked rice grain (In Japanese). J. Jpn. Soc. Food Sci. Technol. 1998, 45,398–407.
  32. Nakamura, S.; Satoh, H.; Ohtsubo, K. Characteristics of pregelatinized ae mutant rice flours prepared by boiling after preroasting. J. Agric. Food Chem. 2011, 59, 10665-10676.
  33. Borkowska-Burnecka, J.; Le´sniewicz, A.; Zyrnicki, W. Comparison of pneumatic and ultrasonic nebulizations in inductively coupled plasma atomic emission spectrometry–matrix effects and plasma parameters. Spectrochim. Acta B 2006, 61, 579–587.
  34. Carson, GR.; Edwards, NM. Chapter 4: Criteria of wheat and flour quality. In WHEAT: Chemistry and Technology, Scientific Societies: St. Paul, MN, USA, 2009; 193.
  35. Balint, AF.; Kovacs, G.; Erdei, L.; Sutka, J. Comparison of the Cu, Zn, Fe, Ca and Mg contents of the grains of wild, ancient and cultivated wheat species. Cereal Res. Commun. 2001, 29, 375-382.
  36. Akman, Z.; Kara, B. Genotypic variations for mineral content at different growth stages in wheat (Triticum aestivum L.). Cereal Res. Commun. 2003, 31, 459-466.
  37. Blennow, A.; Nielsen, TH.; Baunsgaard, L.; Mikkelsen, R.; Engelsen, SB. Starch phosphorylation: A new front line in starch research. Trends Plant Sci. 2002, 7, 445-450.
  38. Hizukuri, S.; Takeda, Y.; Matsubayashi, T. The effect of phosphorus in starch granules on raw starch digestion by bacterial alpha-amylase. J. Jap. Soc. Starch Sci. 1979, 26 (2), 112-116.
  39. Zeng, M.; Morris, CF.; Batey, IL.; Wrigley, CW. Sources of variation for starch gelatinization, pasting, and gelation properties in wheat. Cereal Chem. 1997,74, 63.
  40. Medcalf, DG.; Gilles, KA. Wheat starches 1. Comparison of physicochemical properties. Cereal Chem. 1965, 42, 558-568.
  41. Inouchi, N.; Hibiu, H.; Horibata T.; Fuwa, H.; Itami, T. Structure and properties of endosperm starches from cultivated rice of Asia and other countries. J.Appl. Glycoscience. 2005, 52, 239-246.
  42. Hirano, H.; Sano, Y. Enhancement of Wx gene expression and the accumulation of amylose in response to cool temperature during seed development in rice. Plant Cell Physiol. 1998, 39, 807-812.
  43. Yamamori, M.; Fufita, S.; Hayakawa, K.; Matsuki, J.; Yasui, T. Genetic elimination of a starch granule protein, SGP-1, of wheat generates an altered starch with apparent high amylose. T. Heor. Appl. Genet. 2000, 101, 21-29.
  44. Takeda, Y.; Hizukuri, S.; Juliano, B. O. Structures of rice amylopectins with low and high affinities for iodine. Carbohydr. Res. 1987, 168, 79-88.
  45. Duffus, CM.; Murdoch, SM. Variation in starch granule size distribution and amylose content during wheat endosperm development. Cereal Chem. 1979, 56(5), 427-429.
  46. Regina, A.; Bird, A., Topping, D.; Bowden, S.; Freeman, J.; Barsby, T.; Kosar-Hashemi, B.; Li, Z.; Rahman, S.; Morell, M. High-amylose wheat generated by RNA interference improves indices of large-bowel health in rats. Proc. Natl. Acad. Sci. U.S.A. 2006, 103, 3546-3551.
  47. Igarashi, T.; Yanagihara, T.; Kanda, H.; Kawamoto, K.; Masaki, K. Development of new eating quality evaluation method based on iodine adsorption multispectral analysis of rice flour. J. Crop Sci. 2009, 78, 66–73.
  48. Nakamura S, Yamaguchi H, Benitani Y and Ohtsubo K. Development of a novel formula for estimating the amylose content of starch using Japonica milled rice flours based on the iodine absorption curve. Biosci. Biotechnol. Biochem. 2020, 84(11), 2347–2359. [CrossRef]
  49. Zeng, M.; Morris, CF.; Batey, IL.; Wrigley, CW. Sources of variation for starch gelatinization, pasting, and gelation properties in wheat. Cereal Chem. 1997, 74, 63.
  50. Nakamura, S.; Katsura, J.; Maruyama, Y.; Ohtsubo, K. Relationship between fatty acid composition and starch properties of 30 japonica rice cultivars. Cereal Chem. 2018, 1-15. [CrossRef]
  51. Takeda, T.; Hizukuri, S. Location of phosphate groups in potato amylopectin. Carbohydrate Research. 1982, 102, 321-327.
  52. Wren, J. J.; Merryfield, D. S. Firmly-bound’ lysolecithin of wheat starch. J. Sci. Food Agric. 1970, 21, 254.
  53. Fujino, Y. Complex Lipid in Food. Food Hyg. Saf. Sci. 1972, 13 (4), 257-271.
  54. Kim, H. O.; Hill, R. D. Physical characteristics of wheat starch granule gelatinization in the presence of cyclohepta-amylose. Cereal Chemistry. 1984, 61(5), 432-435.
  55. Lin Jane, J. Current understanding on starch granule structures. J. Appl. Glycosci. 2006, 53. 205-213.
  56. Kaneko, K.; Ota, K.; Sumino, T.; Maeda, Y. Effect of anions on binding between calcium and pectic substance. J. Nutr. Sci.Vitaminol.1989, 42 (5), 391-395.
  57. Kainuma, K.; Yamamoto, K.; Suzuki, S.; Takaya, K.; Fuwa, H. Studies on structure and physico-chemical properties of starch. Part Ⅳ. Structural, chemical and rheological properties of air classified small-and large granule potato starch. J. Jap. Soc. Starch Sci. 1978, 25 (1) 3-11.
  58. Kainuma, K.; Miyamoto, S.; Yoshioka, S.; Suzuki, S. Studies on structure and physico-chemical properties of starch. J. Jap. Soc. Starch Sci. 1976, 23 (1) 59-66.
  59. Nakamura, S.; Satoh, Ayaka.; Aizawa, M.; Ohtsubo, K. Characteristics of physicochemical properties of chalky grains of Japonica rice generated by high temperature during ripening. Foods. 2022, 11,97. [CrossRef]
  60. Nakamura, S.; Katsura, J.; Maruyama, Y.; Ohtsubo, K. Evaluation of hardness and retrogradation of cooked rice based on its pasting properties using a novel RVA testing. Foods. 2021, 10, 987. [CrossRef]
  61. Nakamura, S.; Katsura, J.; Suda, A.; Maruyama, Y. Ohtsubo, K. Effects of binding between Ca in hard water and phosphorus in amylopectin on the qualities of boiled rice and rice noodles prepared by soaking and boiling in hard water. Foods. 2024, 13, 2094. [CrossRef]
  62. Carson, GR.; Edwards, NM. Chapter 4: Criteria of wheat and flour quality. In WHEAT: Chemistry and Technology, Scientific Societies: St. Paul, MN, USA, 2009; 195.
  63. Yanaka, M.; Takata, K.; Funatsuki, W.; Ishikawa, N.; Takahashi, T. Effects of the composition of glutenin subunits controlled by the Glu-A1 and Glu-D1and protein content on the noodle quality in Japanese soft wheat. Jpn. J. Crop Sci. 2017, 86(2), 169-176.
  64. Toyokawa, H.; Rubenthaler, GL.; Powers, JR.; Schanus, EG. Japanese noodle qualities. Ⅰ. Flour components. Cereal Chem. 1989, 66, 382-386.
  65. Oda, M.; Yasuda, Y.; Okazaki, S.; Yamauchi, Y.; Yokohama, Y. A method of flour quality assessment for Japanese noodles. Cereal Chem. 1980, 57, 253-254.
  66. Crosbie, GB.; Lambe, WJ.; Tsutsui, H.; Gilmour, RF. Further evaluation of the flour swelling volume test for identifying wheats potentially suitable for Japanese noodles. J. Cereal Sci. 1992, 15, 271-280.
  67. Crosbie, GB. The relationship between starch swelling properties, paste viscosity and boiled noodle quality in wheat flours. J. Cereal Sci. 1991, 13, 145-150.
  68. Noda, T. The preparation and food applications of divalent cation-substituted potato starch. J. Biorheol. 2021, 35(1) 2-9. doi.10.17106/jbr.35.2.
  69. Noda, T.; Takigawa, S.; Matsuura-Endo, C.; Ishiguro, K.; Nagasawa, K.; Jinno, M. Properties of Calcium-fortified potato starch prepared by immersion in natural mineral water and its food application. J. Appl. Glycosci. 2015, 62. 159-164.
  70. KeeBaik, B.; Czuchajowska, Z.; Pomeranz, Y. Discoloration of dough for oriental noodles. Cereal Chem. 1995, 72(2), 198-205.
  71. Paznocht, L.; Kotikova, Z.; Orsak, M.; Lachman, J. Carotenoid changes of colored-grain wheat flours during bun-making. Food Chem. 2019, 277(30)725-734.
  72. Hou, G. Oriental noodles. Adv. Food Nutr. 2001, 43, 141-193.
  73. Ito, M.; Ohta, K.; Nishio, Z.; Tabiki, T.; Hashimoto, N.; Funatsuki, W.; Miura, H.; Yamauchi, H. Quality evaluation of yellow alkaline noodles made from the KItanokaori wheat cultivar. Food Sci Technol. Res. 2007, 13(3), 253-260.
  74. Sajilate, MG.; Singhal RS.; Kulkarni, PR. Resistant starch: a review. Compr. Rev. Food Sci. Food Saf. 2006, 5, 1-17.
  75. Nagahata, Y.; Kobayashi, I.; Goto, M.; Nakaura, Y.; Inouchi, N. The formation of resistant starch during acid hydrolysis of high-amylose corn starch. J. Appl. Glycosci.2013, 60, 123-130.
  76. Shimada, R.; Yoshimura, M. Effect of resistant starch type 4 from different starch sources on the physical properties and palatability of bread. J Biorheol. 2021, 35(1), 10-17.
  77. Tabiki, T.; Takata, K.; Nishio, Z.; Kuwabara, T.; Ozeki, S.; Tabaya, S.; Iriki, N.; Yamauchi, H.; Ichinose, Y. “Kitanokaori”: A new winter wheat variety. Res. Bull. Nalt. Agric. Res. Cent. For Hokkaido Reg. 2006, 185, 1-12.
  78. Rouau, X.; Moreau, D. Modification of some physicochemical properties of wheat flour pentosans by an enzyme complex recommended for baking. Cereal Chem. 1993, 70(6), 626-632.
  79. Michniewicz, J.; Biliaderis, GG.; Bushuk, W. Effect of added pentosans on some properties of wheat bread. Food Res Technol. 2001, 212, 374-376.
  80. Hashimoto, S.; Hino, A.; Yamaguchi, Y.; Kai, T. Isolation and characterization of pentosans from some species of wheat flour. Bulletin of Nakamura Gakuen University. 1999, 31, 157-162.
  81. Shogren, MD.; Hashimoto, S.; Pomeranz, Y. Cereal pentosans: Their estimation and significance. Ⅱ. Pentosans and breadmaking characteristics of hard red winter wheat flours. Cereal Chem. 1987, 64(1), 35-38.
  82. Shibuya, N. and Misaki, A. Structure of hemicellulose isolated from rice endosperm cell wall: Mode of linkages and sequences in xyloglucan, β-glucan and arabinoxylan. Agric. Biol. Chem. 1978, 42 (12), 2267-2274.
  83. Ogata, M.; Iwasaki, N.; Uchigata, Y. Osteoporosis as a complication of diabetes. Society of Tokyo Women’s Medical University. 2017, an extra edition No.2. E142-147. [CrossRef]
  84. Farlay, D.; Armas, LAG.; Gineys, E.; Akhter, MP.; Recker, RR.; Boivin, G. Nonenzymatic glycation and degree of mineralization are higher in bone from fractured patients with type 1 diabetes mellitus. J. Bone Miner Res. 31. 2016, 190-195. [CrossRef]
  85. Oei, L.; Zillikens, M C.; Dehghan, A.; Buitendijk, GHS.; Castano-Betancourt, MC.; Estrada, K.; Stolk, L.; Oei, EHG.; Meurs, JBJ.; Janssen, JAMJL.; Hofman, A.; Leeuwen, JPTM.; Witteman, JCM.; Pols, HAP.; Uitterlinden, AG.; Klaver, CCW/; Franco, OH.; Rivadeneira, F. High bone mineral density and fracture risk in type 2 diabetes as skeletal comolications of inadequate glucose control: the Rotterdam Study. Diabetes Care. 2013, 36(6):1619-28. Pub Med. [CrossRef]
Figure 2. RS contents of 6 kinds of wheat noodles using weakly acidic hard water (pH 4.6) or the purified water. As results of the comparison between purified water and weakly hard water for producing wheat noodles, for the same wheat sample, respectively, different letters (a, b) denote statistically significant differences. Values are shown as mean ± standard deviation.
Preprints 150048 g002
Figure 3. Dietary fiber of 6 kinds of wheat noodles using weakly acidic hard water (pH 4.6) or the purified water. As results of the comparison between purified water and weakly hard water for producing wheat noodles, for the same wheat sample, different letters (a, b) denote statistically significant differences. Values are shown as mean ± standard deviation.
Preprints 150048 g003
Figure 4. The initial blood glucose level after the fasting period of 20 h of aged mice after 8 weeks. Control meal; SAN 50% and starch solution 50 %: SAN noodle by Sanukinoyume (Japnese premium wheat flour) using purified water. Test meal: KIT 50% and starch solution 50 %: KIT noodle by Kitanokaori (newly developed Japanese wheat flour) using weakly acid hard water. The mice group size (n = 6).
Preprints 150048 g004
Table 1. Phosphorus contents of 6 kinds of Japonica wheat flour.
  Phosphorus
contents
  (mg/100g)
Yumechikara 132.0 ± 2.6 a
Minaminokaori 109.0 ± 1.5 c
Haruyokoi 126.0 ± 3.2 b
Kitanokaori 127.0 ± 3.0 b
Kitahonami 92.0 ± 2.1 d
Sanukinoyume 75.0 ± 1.8 e
Different letters (a, b) denote statistically significant difference. Values are shown as mean ± standard deviation.
Table 2. The iodine absorption curve of starch of 6 various kinds of domestic wheat flours.
Cultivars AAC λmax Aλmax λmax/ Fb3
(%) Aλmax (DP≧37)(%)
Yumechikara 25.6 ± 0.5 c 598.0 ± 2.8 a 0.440 ± 0.003 c 1359.1 ± 2.3 a 18.9 ± 0.1 b
Minamnoikaori 28.0 ± 0.6 a 601.0 ± 2.8 a 0.469 ± 0.004 a 1282.8 ± 3.6 d 20.2 ± 0.2 a
Haruyokoi 27.2 ± 0.1 b 599.0 ± 1.4 a 0.461 ± 0.001 a 1300.8 ± 5.1 c 19.8 ± 0.0 a
Kitanokaori 25.9 ± 0.3 c 600.0 ± 0.0 a 0.441 ± 0.004 c 1360.6 ± 13.1 a 18.9 ± 0.2 b
Kitahonami 26.7 ± 0.3 b 601.5 ± 0.7 a 0.450 ± 0.005 b 1338.2 ± 16.3 b 19.3 ± 0.2 b
Sanukinoyume 26.6 ± 0.7 b 600.0 ± 2.8 a 0.450 ± 0.006 b 1333.4 ± 10.5 b 19.3 ± 0.3 b
Within each value (AAC,λmax, Aλmax etc.) in the same column and in each sample, different letters (a, b) denote statistically significant difference. Values are shown as mean ± standard deviation.
Table 3. Pasting properties of 6 kinds of domestic wheat flour using purified water or weakly acidic hard water with an RVA.
  Max. vis Mini. vis BD Fin. vis SB
  (cP) (cP) (cP) (cP) (cP)
Yumechikara (Purified water) 2868.0 ± 25.5 a 1263.5 ± 10.6 a 1604.5 ± 14.8 b 2609.5 ± 7.8 a - 258.5 ± 17.7 a
Yumechikara (Contrex) (pH 4.6) 3165.0 ± 227.7 a 1206.5 ± 46.0 b 1958.5 ± 181.7 a 2528.0 ± 113.1a - 637.0 ± 114.6 b
Minamikaori (Purified water) 1781.5 ± 36.1 b 844.5 ± 26.2 a 937.0 ± 9.9 a 1991.0 ± 62.2 b - 209.5 ± 26.2 a
Minamikaori (Contrex) (pH 4.6) 2098.0 ± 4.2 a 1173.0 ± 5.7 b 925.0 ± 9.9 a 2369.0 ± 5.7 a - 271.0 ± 1.4 b
Haruyokoi (Purified water) 3139.0 ± 7.1 b 1304.0 ± 17.0 a 1835.0 ± 9.9 b 2662.0 ± 25.5 a - 477.0 ± 18.4 a
Haruyokoi (Contrex) (pH 4.6) 3230.5 ± 2.1 a 1181.5 ± 13.4 b 2049.0 ± 15.6 a 2486.5 ± 16.3 b - 744.0 ± 18.4 b
Kitanokaori (Purified water) 2772.0 ± 38.2 b 1214.5 ± 10.6 a 1557.5 ± 27.6 b 2589.5 ±23.3 a - 182.5 ± 14.8 a
Kitanokaori (Contrex) (pH 4.6) 3091.0 ± 26.9 a 1115.0 ± 7.1 b 1976.0 ± 19.8 a 2513.5 ± 13.4 b - 577.5 ± 13.4 b
Kitahonami (Purified water) 3177.0 ± 19.8 b 1381.5 ± 4.9 a 1795.5 ± 14.8 b 2834.5 ± 6.4 a - 342.5 ± 13.4 a
Kitahonami (Contrex) (pH 4.6) 3642.5 ± 244.0 a 1386.5 ± 47.4 a 2256.0 ± 196.6 a 2856.0 ± 93.3 a - 786.5 ± 150.6 b
Sanukinoyume (Purified water) 4068.0 ± 9.9 b 1580.5 ± 19.1 a 2487.5 ± 9.2 b 3163.0 ± 32.5 a - 905.0 ± 22.6 a
Sanukinoyume (Contrex) (pH 4.6) 4107.0 ± 1.4 a 868.8 ± 0.4 b 2706.0 ± 14.1 a 2905.5 ± 2.1 b - 1201.5 ± 3.5 b
  Pt Cons Set/Cons Max/Min Max/Fin
  (℃) (℃)
Yumechikara (Purified water) 50.5 ± 0.3 b 1346.0 ± 2.8 a - 0.19 ± 0.01 a 2.27 ± 0.00 b 1.10 ± 0.01 b
Yumechikara (Contrex) (pH 4.6) 59.7 ± 0.5 a 1321.5 ± 67.2 a - 0.48 ± 0.06 b 2.62 ± 0.09 a 1.25 ± 0.03 a
Minamikaori (Purified water) 53.5 ± 4.7 a 1146.5 ± 36.1 b - 0.18 ± 0.02 a 2.11 ± 0.02 a 0.89 ± 0.01 a
Minamikaori (Contrex)(pH 4.6) 59.5 ± 0.6 a 1196.0 ± 11.3 a - 0.23 ± 0.00 b 1.79 ± 0.01 b 0.89 ± 0.00 a
Haruyokoi (Purified water) 50.7 ± 0.0 b 1358.0 ± 8.5 a - 0.35 ± 0.02 a 2.41 ± 0.03 b 1.18 ± 0.01 b
Haruyokoi (Contrex) (pH 4.6) 59.5 ± 0.3 a 1305.0 ± 2.8 b - 0.57 ± 0.02 b 2.73 ± 0.03 a 1.30 ± 0.01 a
Kitanokaori (Purified water) 55.7 ± 0.1 a 1375.0 ± 12.7 a - 0.13 ± 0.01 a 2.28 ± 0.01 b 1.07 ± 0.01 b
Kitanokaori (Contrex) (pH 4.6) 58.0 ± 1.3 b 1398.5 ± 6.4 a - 0.41 ± 0.01 b 2.77 ± 0.01 a 1.23 ± 0.00 a
Kitahonami (Purified water) 51.2 ± 0.9 b 1453.0 ± 1.4 a - 0.24 ± 0.01 a 2.30 ± 0.01 b 1.12 ± 0.00 b
Kitahonami (Contrex) (pH 4.6) 59.7 ± 0.6 a 1469.5 ± 46.0 a - 0.53 ± 0.09 b 2.63 ± 0.09 a 1.27 ± 0.04 a
Sanukinoyume (Purified water) 50.2 ± 0.0 b 1582.5 ± 13.4 a - 0.57 ± 0.02 a 2.57 ± 0.02 b 1.29 ± 0.01 b
Sanukinoyume (Contrex) (pH 4.6) 59.4 ± 0.6 a 1504.5 ± 10.6 b - 0.80 ± 0.00b 2.93 ± 0.03 a 1.41 ± 0.00 a
Within each value (Max. vis, Min. vis, BD etc.) in the same column and different between using purified water and weakly acidic hard water in each sample, different letters (a, b) denote statistically significantly differences. Values are shown as mean ± standard deviation.
Table 4. Correlation between the RS contents, phosphorus contents, calcium contents, textural properties of noodles, pasting properties and iodine absorption curve of 6 kinds of domestic wheat flour samples.
  DF RS P Ca Tende Pliab Tough Britt Hard Max.vis Mini.vis BD Fin.vis
Dietary fiber 1.00
RS 0.82 ** 1.00
P 0.38 0.58 * 1.00
Ca 0.15 0.11 0.06 1.00
Tenderness -0.14 -0.38 -0.78 ** -0.35 1.00
Pliability -0.51 -0.71 ** -0.39 0.04 0.08 1.00
Toughness 0.02 -0.32 -0.57 -0.32 0.91 ** 0.05 1.00
Brittleness -0.30 -0.19 -0.37 0.18 -0.06 0.01 -0.28 1.00
Hardness 0.18 -0.04 0.44 0.04 -0.24 0.29 0.13 -0.69* 1.00
Max.vis -0.30 -0.23 -0.52 0.04 0.57 -0.25 0.39 0.39 -0.63* 1.00
Mini.vis -0.35 -0.39 -0.57 -0.20 0.66 * -0.21 0.46 0.37 -0.66* 0.85 ** 1.00
BD -0.27 -0.16 -0.46 0.12 0.50 -0.25 0.34 0.37 -0.57 0.98 ** 0.74 ** 1.00
Fin.vis -0.29 -0.29 -0.60 * -0.20 0.69 * -0.27 0.48 0.40 -0.72** 0.90 ** 0.98 ** 0.81 ** 1.00
SB 0.28 0.16 0.41 -0.21 -0.42 0.22 -0.29 -0.34 0.50 -0.96 ** -0.66 * -0.99 ** -0.74 **
Pt 0.19 -0.17 -0.06 0.76 ** -0.28 0.24 -0.23 0.29 -0.01 0.03 -0.09 0.07 -0.14
Cons -0.18 -0.13 -0.59 * -0.19 0.69 * -0.33 0.47 0.42 -0.75** 0.92 ** 0.89 ** 0.87 ** 0.96 **
Set/cons 0.28 0.12 0.32 -0.22 -0.34 0.26 -0.22 -0.33 0.48 -0.94 ** -0.63* -0.98 ** -0.70 *
Max/Min -0.11 0.09 -0.19 0.30 0.20 -0.29 0.11 0.27 -0.39 0.80 ** 0.37 0.89 ** 0.49
Max/Fin -0.26 -0.09 -0.29 0.24 0.32 -0.28 0.20 0.32 -0.49 0.93 ** 0.62 * 0.97 ** 0.69 *
AAC -0.31 -0.36 -0.26 0.10 -0.15 0.56 -0.15 -0.06 0.24 -0.45 -0.32 -0.46 -0.40
λmax -0.11 -0.14 -0.60 * 0.01 0.17 0.30 -0.06 0.47 -0.42 -0.13 0.00 -0.17 0.02
Aλmax -0.32 -0.36 -0.17 0.10 -0.19 0.56 -0.15 -0.15 0.34 -0.46 -0.35 -0.46 -0.44
λmax/Aλmax 0.33 0.37 0.13 -0.10 0.21 -0.55 0.15 0.19 -0.38 0.45 0.35 0.45 0.44
Fb3 -0.32 -0.36 -0.17 0.10 -0.19 0.56 -0.15 -0.15 0.34 -0.46 -0.35 -0.46 -0.44
SB Pt Cons Set/cons Max/Min Max/Fin AAC λmax Aλmax λmax/Aλmax Fb3
SB 1.00
Pt -0.15 1.00
Cons -0.80 ** -0.21 1.00
Set/cons 0.99 ** -0.16 -0.76 ** 1.00
Max/Min -0.93 ** 0.13 0.63 * -0.94 ** 1.00
Max/Fin -0.99 ** 0.16 0.75 ** -1.00** 0.95 ** 1.00
AAC 0.42 0.17 -0.49 0.46 -0.47 -0.47 1.00
λmax 0.23 0.06 0.06 0.29 -0.28 -0.30 0.53 1.00
Aλmax 0.42 0.18 -0.54 0.45 -0.46 -0.46 0.99 ** 0.39 1.00
λmax/Aλmax -0.40 -0.18 0.55 -0.42 0.44 0.44 -0.97 ** -0.32 -1.00 ** 1.00
Fb3 0.42 0.18 -0.54 0.45 -0.46 -0.46 0.99 ** 0.39 1.00 -1.00 ** 1.00
Correlation is significant at 5 % (*) or 1 % (**) by the method of t-test.
Table 5. Textural properties of 6 kinds of domestic wheat flour noodles using weakly acidic hard water (pH 4.6) and purified water.
  Tenderness Pliability Toughness Brittleness Hardness
(N/cm2) (N/cm2) (N/cm2)
Yumechikara (Purified water) 910.9 ± 142.7 a 1.02 ± 0.11 a 357.2 ± 61.4 a 1.75 ± 0.17 a 17.33 ± 2.52 a
Yumechikara (Contrex) (pH 4.6) 691.6 ± 108.4 b 0.99 ± 0.01 a 268.6 ±49.1 b 1.73 ± 0.07 a 16.67 ± 0.58 a
Minamikaori (Purified water) 762.7 ± 48.4 a 1.12 ± 0.02 a 304.8 ± 2.8 a 1.53 ± 0.03 a 19.33 ± 1.15 a
Minamikaori (Contrex) (pH 4.6) 744.0 ± 63.7 a 1.06 ± 0.06 a 266.3 ± 63.4 a 1.79 ± 0.28 a 16.33 ± 3.51 a
Haruyokoi (Purified water) 611.4 ± 62.9 a 1.00 ± 0.04 a 184.3 ± 18.9 b 2.05 ± 0.06 a 13.33 ± 0.58 a
Haruyokoi (Contrex) (pH 4.6) 675.7 ± 58.1 a 0.97 ± 0.04 a 268.2 ± 37.6 a 1.76 ± 0.16 a 16.67 ± 1.53 a
Kitanokaori (Purified water) 841.1 ± 218.8 a 0.92 ± 0.06 a 302.0 ± 117.9 a 2.09 ± 0.41 a 14.00 ± 3.61 a
Kitanokaori (Contrex) (pH 4.6) 714.6 ± 91.8 a 0.91 ± 0.02 a 229.7 ± 26.8 a 2.15 ± 0.19 a 13.00 ± 2.00 a
Kitahonami (Purified water) 1106.4 ± 457.0 a 1.04 ± 0.03 a 289.5 ± 149.6 a 2.42 ± 0.67 a 11.33 ± 3.51 a
Kitahonami (Contrex) (pH 4.6) 727.8 ± 447.8 b 1.02 ± 0.06 a 212.9 ± 146.9 b 5.35 ± 4.70 a 10.67 ± 7.51 a
Sanukinoyume (Purified water) 1530.8 ± 329.3 a 0.96 ± 0.03 a 539.1 ± 181.2 a 1.94 ± 0.31 a 14.00 ± 3.00 a
Sanukinoyume (Contrex) (pH 4.6) 1250.5 ± 638.0 a 1.10 ± 0.10 a 392.2 ± 226.1 b 2.37 ± 1.05 a 13.33 ± 6.11 a
Within each value (Tenderness, Pliability, etc.) in the same column and different between using purified water and weakly hard water in each sample, different letters (a, b) denote statistically significantly differences. Values are shown as mean ± standard deviation.
Table 6. Color difference of 6 kinds of wheat noodles using weakly acidic hard water (pH 4.6) or purified water.
  WB ΔE(ab) a* b*
Yumechikara (Purified water) 19.6 ± 2.0 b 42.0 ± 2.0 a -1.1 ± 0.1 a 13.2 ± 0.7 a
Yumechikara (Contrex)(pH 4.6) 24.5 ± 3.2 a 37.2 ± 2.9 b -1.4 ± 0.3 a 12.8 ± 0.8 b
Minamikaori (Purified water) 17.3 ± 1.1 b 44.3 ± 1.2 a -1.2 ± 0.0 a 14.5 ± 0.3 a
Minamikaori (Contrex)(pH 4.6) 21.3 ± 0.9 a 40.1 ± 1.0 b -1.2 ± 0.0 a 13.8 ± 0.2 b
Haruyokoi (Purified water) 21.4 ± 1.2 a 40.4 ± 0.1 a -1.3 ± 0.0 a 12.1 ± 0.2 a
Haruyokoi (Contrex)(pH 4.6) 22.3 ± 1.0 a 39.6 ± 0.1 a -1.1 ± 0.0 a 11.6 ± 0.1 b
Kitanokaori(Purified water) 22.2 ± 0.0 a 39.1 ± 0.0 a -1.3 ± 0.1 a 14.1 ± 0.3 a
Kitanokaori (Contrex)(pH 4.6) 22.3 ± 0.1 a 38.0 ± 0.1 b -1.4 ± 0.1 a 14.7 ± 0.8 a
Kitahonami (Purified water) 21.5 ± 1.5 b 40.8 ± 2.1 a -2.1 ± 0.1 a 10.6 ± 1.8 a
Kitahonami (Contrex)(pH 4.6) 26.2 ± 1.0 a 36.1 ± 0.7 b -2.0 ± 0.1 a 10.8 ± 0.8 a
Sanukinoyume (Purified water) 24.2 ± 1.7 b 34.7 ± 1.4 a -2.3 ± 0.1 a 13.6 ± 0.3 a
Sanukinoyume (Contrex)(pH 4.6) 29.8 ± 1.6 a 33.0 ± 1.2 b -2.5 ± 0.0 a 11.3 ± 0.3 b
Within each value (WB, ΔE*(ab) etc.) in the same column and different between using purified water and weakly hard water in each sample, different letters (a, b) denote statistically significantly differences. Values are shown as mean ± standard deviation.
Disclaimer/Publisher’s Note: The statements, opinions and data contained in all publications are solely those of the individual author(s) and contributor(s) and not of MDPI and/or the editor(s). MDPI and/or the editor(s) disclaim responsibility for any injury to people or property resulting from any ideas, methods, instructions or products referred to in the content.
Copyright: This open access article is published under a Creative Commons CC BY 4.0 license, which permit the free download, distribution, and reuse, provided that the author and preprint are cited in any reuse.
Prerpints.org logo

Preprints.org is a free preprint server supported by MDPI in Basel, Switzerland.

Subscribe

Disclaimer

Terms of Use

Privacy Policy

Privacy Settings

© 2025 MDPI (Basel, Switzerland) unless otherwise stated