Submitted:
24 February 2026
Posted:
26 February 2026
You are already at the latest version
Abstract
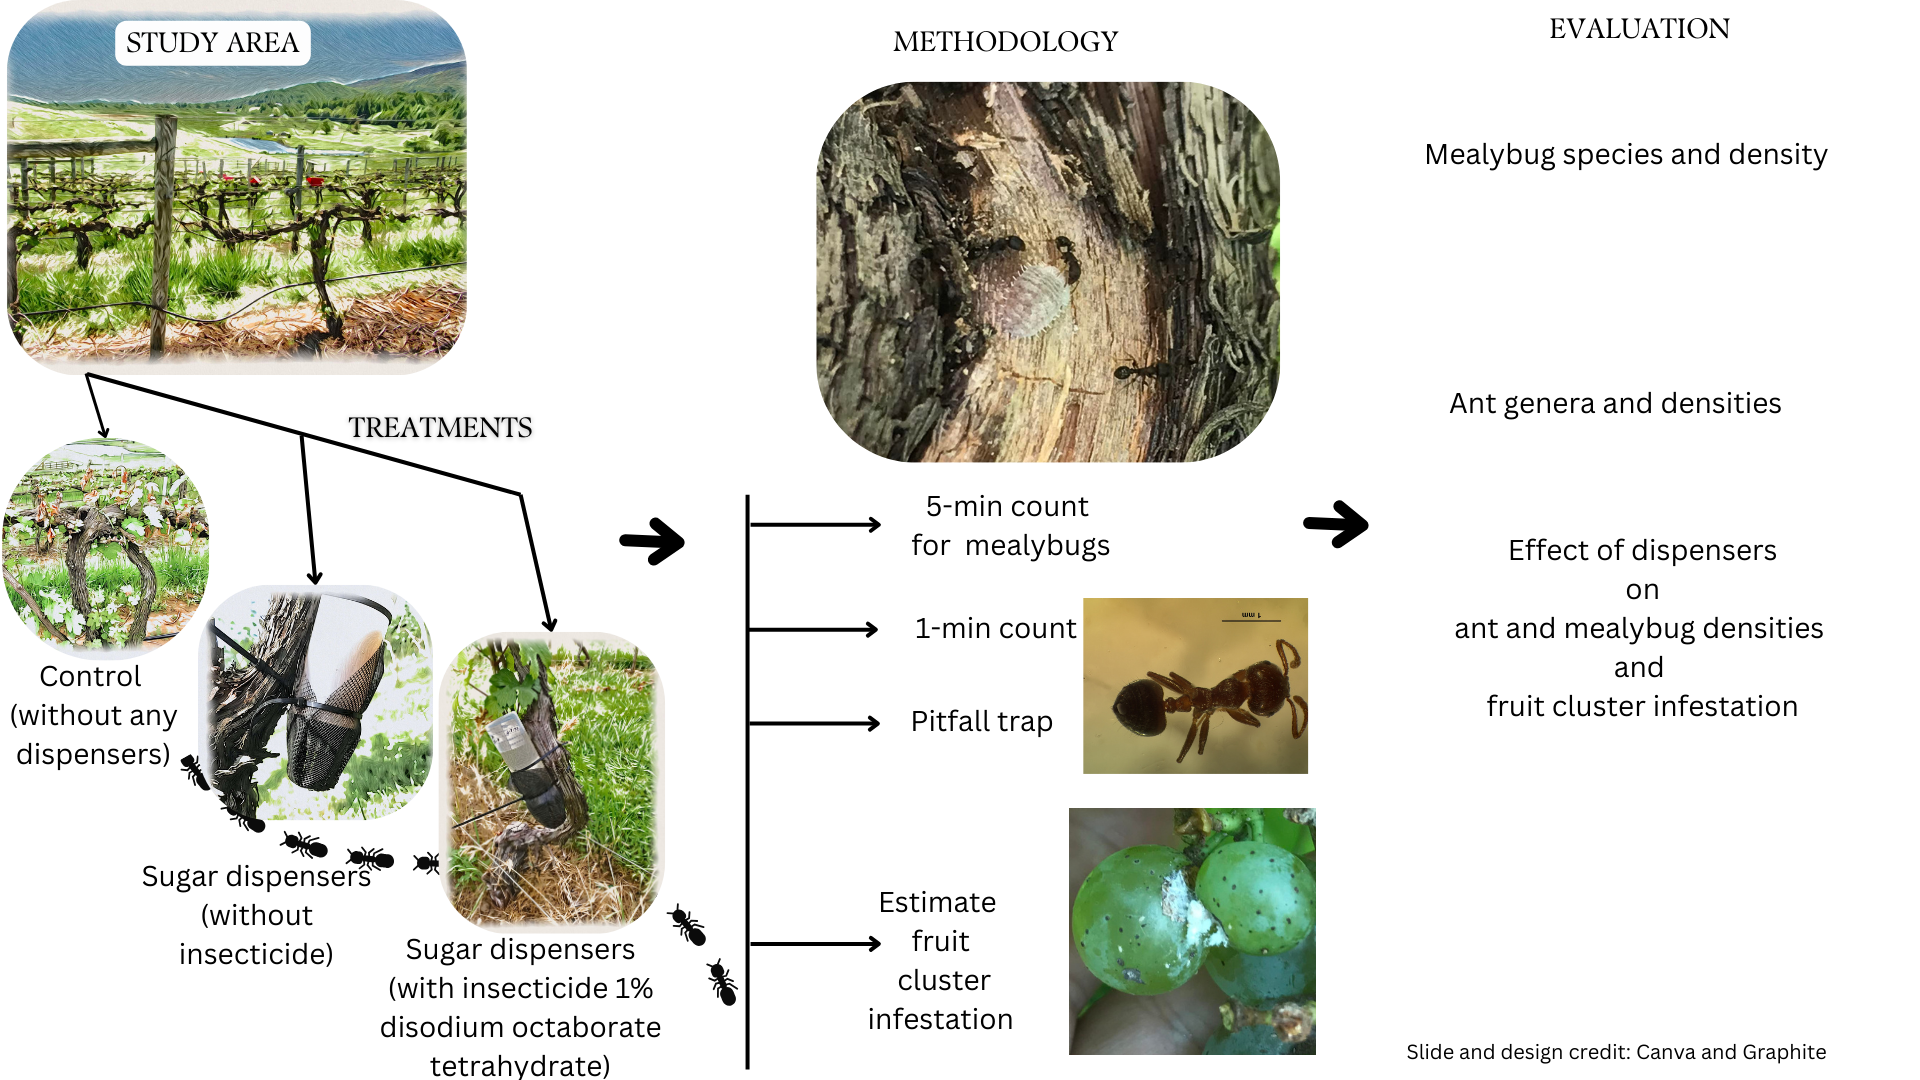
Mealybugs (Hemiptera: Pseudococcidae) are one of the prevalent pests infesting wine grapes in the eastern United States. Their close association with ants (Hymenoptera: Formicidae) provides them with protection against natural enemies. The study examines mealybug species identification, dominant ant genera present in vineyards, and the impact of sugar dispensers on ant and mealybug populations, as well as fruit cluster infestations. Field trials were conducted in two commercial vineyards in Virginia, USA, both with a history of mealybug infestations. Sampling plots with or without sugar dispensers were compared to assess differences in mealybug and ant population densities and fruit cluster infestation levels. Two mealybug species, Pseudococcus maritimus (Ehrhorn) and Ferrisia gilli Gullan were recorded from both sites. Some dominant ant genera, including Tetramorium Mayr, Lasius Fabricius, Solenopsis molesta (Say), Crematogaster Lund, and Pheidole Westwood were found in close association with mealybugs. Ant populations remained consistently low in the untreated plots throughout the sampling season. While sugar dispensers containing insecticide initially attracted a higher number of ants, the population subsequently declined. Fruit cluster infestation was also highest in the untreated plots lacking sugar dispensers.
Keywords:
Pseudococcus maritimus
; Ferrisia gilli
; ants
; mealybug
; pest management
; vineyard
; sugar dispensers
; Lasius
; Tetramorium
; Crematogaster
1. Introduction
Mealybugs (Hemiptera: Pseudococcidae) are prevalent pests present in the grape growing regions around the world [1]. They are phloem feeders that use their piercing and sucking mouthparts to feed on different parts of grapevine including roots. Phloem sap contains sugar in a relatively higher proportion than needed by these insects and hence a large amount of sticky, sugary fluid is excreted by these insects. This excreted fluid is called honeydew, and it contains sugars, amino acids, proteins, minerals, and vitamins.
Pseudococcus maritimus (Ehrhorn) has been the predominant mealybug pest of grapes in Virginia [2]. An earlier research project on grapevine leafroll-associated viruses in wine grape varieties and native grape species has identified P. maritimus, P. viburni (Signoret), and Ferrisia gilli (Gullan) (Hemiptera: Pseudococcidae) in Virginia vineyards (USA) [3]. The density, feeding locations, and movement patterns of various mealybug species fluctuate with the seasons, influenced by regional temperatures and vineyard management strategies [4,5]. One of the primary managements of grape pests including mealybugs is chemical control [6]; often the repetitive use of synthetic chemicals ([7]). The presence of waxy covering on the body and their habit of hiding in the concealed locations within the vine often complicates management of mealybugs with conventional insecticides [7,8]. Systemic insecticides demonstrate significant efficacy in mealybug management [9]; however, further investigation into alternative control strategies remains essential to ensure sustainable and comprehensive pest mitigation.
Ants (Hymenoptera: Formicidae) belonging to subfamilies Myrmicinae, Dolichoderinae, and Formicinae are often found in close association with honeydew-producing hemipterans. There is a trophobiotic relation between these insects [10]. In trophobiosis, ants receive honeydew from mealybugs (and other honeydew-producing hemipterans), and in return clean mealybug colonies, provide protection against the natural enemies and transport them to new feeding sites [10,11,12]. Initially considered as the only reason for sooty mold growth in grape vines, honeydew also serves as a food source for natural enemies [13].
Research has been conducted utilizing association between ants and mealybugs to control ants and its subsequent effect on mealybug populations in the vineyard [14,15,16,17]. Granular insecticides, liquid baits, and insecticide-laced sugar provisioning have been tested in the field to control ant activity [14,15,16,17,18] and have provided effective control of ants and mealybugs. Artificial sugar dispensers have been deployed in the field with or without insecticide. Notably, the use of dispensers targets both the forager ants and the entire nest, as food is shared among the colony members through trophallaxis [19,20,21]. Trophallaxis is a nutritive fluid-exchange observed in social insects and some nonsocial insects. When forager ants consume insecticide-laced sugar, the toxicant is not immediately lethal but is gradually disseminated throughout the colony, ensuring widespread exposure [19,20]. It helps baits with a low concentration of toxicants to reach from vines to ant nests and recruit more ants to the bait [20,21]. This indirect mechanism provides low-concentration toxicants to travel from vines to ant nests, recruiting additional ants to baits and hence facilitating large-scale control.
Therefore, our study aimed at identifying the species and monitoring the distribution of populations of ants and mealybugs before and after deploying dispensers in the vineyard. During the harvest season, we also assess the level of mealybug infestations in the sampled area with and without the dispensers. The analysis reported here has shed some light on important ant genera in the vicinity of mealybugs and the potential of sugar dispensers in controlling ants and mealybugs infestations in the vineyard.
2. Materials and Methods
2.1. Field Sites and Experimental Design
The ant-mealybug experiment was carried out on two vineyard sites: Orange County (vineyard HV) (38° 13’ N, 78° 6’ W), and Fauquier County (vineyard PC) (38° 47’ N, 77° 44’ W), Virginia, USA. Vineyards were selected based on the availability and pest pressure recorded by the researcher in previous years. These are conventional vineyards, relying on synthetic insecticides for pest management. Each vineyard block was more than 10 years old and had a previous history of mealybug infestations.
The research trial was carried out in an area of 0.283 to 0.081 hectares inside each vineyard. Each experimental area was divided into three plots: control plots, sugar dispenser plots (SD), and sugar dispenser with insecticide (SDI) plots (Figure 1). The control plots were separated from other treatment plots by 10 to 20 meters. Two to three vine rows of distance were maintained between the SD and SDI plots.
2.2. Sugar Dispensers
The sugar dispensers used in the field is based on earlier research by Daane, et al. [22] and repeated by Parrilli, et al. [16]. 250 ml HDPE narrow mouth bottles, assembled with white polypropylene closure were modified into dispensers (The Lab Depot, Dawsonville, GA). A 1 cm circular hole was drilled in the cap of the tube, and a permeable mesh was placed between the tube and the cap. A 5.08 cm garden slotted mesh net cup was placed outside the cap with a plastic mesh outside to allow the entry of ants, but not bees (Figure 1). Sugar dispensers, if improperly set up, could have a detrimental effect on bees in the vineyard.
We deployed 12-16 dispensers (Figure 1) in four rows of vines, evenly placing them after every 5-10 plant through the experimental plots. They were deployed at the beginning of June and removed in the third week of September. A gap of 2-rows of grapevines was maintained between each of the two treatments. Each of the dispensers was refilled and cleaned every one to two weeks. The insecticide used for ant control was Greenway liquid ant-killing bait with the active ingredient 1% disodium octaborate tetrahydrate. As per the manufacturer’s instruction, the Gourmet liquid ant bait could either be used in full strength or diluted with an equal amount of distilled water. During the first one and half months of the research, we used liquid bait in full concentrations and after that, they were diluted to 50% strength.
2.3. Mealybug Species
Most of the mealybug species were identified and photographed in the field based on morphology. Some representatives were taken back to the laboratory for identification. Some of the samples were pooled out and identified by multiplex PCR using mitochondrial cytochrome oxidase subunit one gene based on Daane, et al. [23]. The mealybug numbers were also counted in the vineyard by using a 5-minute visual count.
2.4. Ant Activity
Ant populations in the vineyard were monitored and sampled weekly in all three treatment plots by both 1. Pitfall trapping 2. 1-minute visual count. 50 ml falcon centrifuge tubes were used for pitfall trapping, with 75% alcohol and a few drops of ethylene glycol as the preservative [24,25]. The advantage of using ethanol is that it does not attract ant species differentially. A total of 5-8 pitfall traps were placed randomly per experimental plot per site. The pitfall traps were set up at the field sites in the morning between 8:00 and 9:00 a.m. and retrieved after approximately one hour.
Ant activity was also monitored by counting the number of ants crossing an imaginary line of 20 cm in length and between the vine canopy and above the dispensers on the trunk for 1-minute. The vines for the visual count and pitfall trap placement were selected randomly to represent the whole plot. The ants were collected in 70% ethanol and taken back to the lab for identification using the identification keys [26].
2.5. Fruit Cluster Infestation
During the harvest season, 15 grape clusters per treatment were examined for the presence of mealybugs in the field. 10 grape clusters per treatment were taken back to the laboratory to examine the presence of mealybugs.
2.6. Data Analysis
The foraging activity of each ant species was quantified by calculating the mean number of individuals collected throughout the season. Ant population data from the vineyard was analyzed separately for pitfall trap collections and 1-minute visual counts using two-way ANOVA. To allow for more flexible comparisons across vineyards, sampling dates were converted to weeks after treatment. The model assessed the number of ants per treatment per sampling date as a function of treatment, sampling date, their interaction (treatment × sampling date) and the vineyard site. Post hoc analyses were conducted using Tukey’s HSD for all pairwise comparisons.
Before the commercial harvest, 25 fruit clusters per treatment in each replicate were evaluated using the following scoring system: 0= no mealybug or honeydew, 1=honeydew and five or fewer mealybugs, 2=honeydew and six to nine mealybugs, 3=honeydew and more than ten mealybugs, and 3=honeydew and egg mass). Fruit clusters with a score of 2 and 3 were considered unmarketable or extremely infested. Fruit cluster infestation was analyzed using Wilcoxon paired test [27].
Multivariate analysis was used to analyze the relation between the number of ants per minute, the number of mealybugs per vine, and the percentage of cluster damage for each of the sites. The multivariate analysis on JMP® 18 was performed under default setting, that uses Pearson Correlation to calculate relationships between variables.
Data analysis was carried out using software JMP® 18 student edition [28].
3. Results
3.1. Mealybug Species in the Vineyard
Two species of mealybugs were identified in the field and confirmed by multiplex PCR as Pseudococcus maritimus and Ferrisia gilli (Figure 2).
In general, Pseudococcus maritimus remains the predominant species throughout our survey. The exact proportion of each species will vary seasonally with changes in proportion of the less common of the two species, i.e., Ferrisia gilli. However, the population of Ferrisia gilli reaches up to 47% in the peak season (July-August) in our study.
3.2. Ant Species in the Vineyard
A total number of 1131 specimens of ants were collected in total (674 samples from HV vineyard and 457 from PC vineyard) over the whole field season, representing 12 genera of ants. Ants were identified up to a genus level due to time constraint. The top five leading foragers in the vineyards include Tetramorium Mayr, Lasius Fabricius, Solenopsis molesta (Say), Pheidole Westwood, and Crematogaster Lund based on 1-minute count and pitfall trap data (Figure 3).
Ant densities in the field with or without sugar dispensers
3.2.1. Pitfall Trap Data
Fewer ants were observed and captured in the untreated control treatment throughout the season. The sugar dispensers with insecticide bait (SDI) initially attracted a higher number of ants during the initial few weeks of deployment and started decreasing throughout the season. In comparison to the other treatments, sugar dispensers (SD) attracted a higher number of ants throughout the season (Figure 4).
Field analysis of the mean number of ants was calculated as the average value for the entire season as well as per sampling dates. Pooling the data from all vineyards, the pitfall trap revealed significant effect of the placement of dispensers on the ant abundance on the vines (F=5.885, p<0.0001, α=0.05), explaining 30.9% of the variance (R2=0.309). Ant activity was also different on different weeks after treatment (F=9.28, p<0.0001, α=0.05), in different treatments (F=20.52, p<0.0001, α=0.05), in different vineyards (F=16.198, p<0.0001, α=0.05) and the interaction between weeks after treatment and treatment (F=3.34, p<0.0001, α=0.05) and between vineyard and weeks after treatment (F=2.94, p=0.0008, α=0.05) (Table 1).
The mean number of ants among treatments were analyzed further using Tukey HSD for all pairwise comparisons (Table 2). The mean number of ants per pitfall trap remains consistently lower in the undisturbed vines lacking any dispensers (control: mean= 1.61±0.175). In comparison to the control, sites with dispensers (SD and SDI) had significantly higher number of ants (Control-SDI: t=-2.89, p=0.0112, α=0.05; Control-SD: t=-6.38, p<0.0001, α=0.05; SD-SDI: t=3.58, p=0.0011, α=0.05) (Table 2).
When data were examined separately for two vineyards, the pitfall trap revealed significant effect of the placement of dispensers on the ant abundance on both vineyards (vineyard HV: F=6.32, p<0.0001, α=0.05; vineyard PC: F=7.005, p<0.0001, α=0.05). In both of the vineyards, ant activity was also different among on different weeks after treatment (vineyard HV: F=6.93, p<0.0001, α=0.05; vineyard PC: F=5.86, p<0.0001, α=0.05), in different treatments (vineyard HV: F=7.5, p=0.0007, α=0.05; vineyard PC: F=26.66, p<0.0001, α=0.05), and the interaction between weeks after treatment and treatment (vineyard HV: F=4.9, p<0.0001, α=0.05; vineyard PC: F=4.58, p<0.0001, α=0.05).
The mean number of ants among treatments were analyzed further using Tukey HSD all pairwise comparison (Table 3). In data analysis of individual vineyards as well, the mean number of ants per pitfall trap remains consistently lower in the control (Figure 5). In vineyard HV, sites with dispensers had a significantly higher number of ants (Table 3). While in vineyard PC, the ant populations between control and treatment containing SDI were not significantly different. While the treatment plot containing SD had a significantly higher number of ants than in control and SDI (Table 3).
Data were analyzed separately for each of the weeks after the sugar dispensers were placed on the vineyard. The first week after the sugar dispensers were deployed, the ant populations were not significantly different among different treatments (Figure 6).
In vineyard HV, the second week after deploying dispensers, a significant increase in number of ants around the treatment areas having SD and SDI were seen. Compared to the control treatment, the number of ants remained significantly higher in dispensers until the sixth week. In the seventh week, there was a significant decrease in the number of ants in treatments having SD and SDI (Figure 6). Although the number of ants in the SD treatment remains significantly higher compared to the control, there was no significant difference in ant numbers between control and SDI treatment. When ant populations in the SDI treatment were analyzed, a general trend of population decline was observed. An initial surge in ant numbers occurred in the vineyard during the second week following dispenser placement. This was followed by a decrease in the third and fourth weeks. In the fifth week, a secondary increase in ant numbers was recorded, after which the population declined again (Figure 6).
In vineyard PC, in the second week of sugar dispenser placement, although not significantly different, there was an increase in pitfall trap capture of ant populations. However, in the third week, a significant reduction in the number of pitfall trap captures was observed in the SDI treatment area. After the third week, SD treatment had significantly higher number of ants captured, while the ant numbers in the control and the SDI treatment were consistently lower in number (Figure 6).
3.2.2. One-Minute Visual Count Data
Like the pitfall trap data count, one-minute visual count data also revealed a higher number of ants during the initial few weeks of deployment of sugar dispensers and starts decreasing throughout the season (Figure 7).
Like the pitfall trap data, field analysis of the mean number of ants was calculated as average value for the entire season as well as per sampling dates. Pooling the data from all vineyards, the 1-minute count data revealed significant effect of the placement of dispensers on the ant abundance on the vines (F=5.51, p<0.0001, α=0.05), explaining 21.9% of the variance (R2=0.219). Ant activity was also different among vineyards (F=11.23, p=0.0008, α=0.05), on different weeks after treatment (F=9.71, p<0.0001, α=0.05), in different treatments (F=13.45, p<0.0001, α=0.05), and the interaction between weeks after treatment and treatment (F=3.10, p<0.0001, α=0.05) and between vineyard and weeks after treatment (F=3.82, p<0.0001, α=0.05) (Table 4).
The mean numbers of ants among treatments were analyzed further using Tukey HSD for all pairwise comparisons (Table 5). The treatment sites without dispensers (control) and with sugar dispensers without insecticide had higher numbers of ants and were not significantly different from each other (Table 5). However, compared to the control and treatment with sugar dispensers without insecticide, the treatment plots with sugar dispensers with insecticide had a significantly lower number of ants (Table 5).
When data were examined separately for two vineyards, the 1-minute visual count revealed significant effect of the placement of dispensers on the ant abundance on both vineyards (vineyard HV: F=4.64, p<0.0001, α=0.05; vineyard PC: F=3.79, p<0.0001, α=0.05). In both of the vineyards, ant activity was also different among on different weeks after treatment (vineyard HV: F=6.66, p<0.0001, α=0.05; vineyard PC: F=6.24, p<0.0001, α=0.05), and in different treatments (vineyard HV: F=5.09, p=0.0066, α=0.05; vineyard PC: F=6.82, p<0.0012, α=0.05), and not significant for the interaction between weeks after treatment and treatment for one of the vineyard (vineyard HV: F=3.4, p<0.0001, α=0.05; vineyard PC: F=1.5, p=0.0671, α=0.05).
The mean number of ants among treatments were analyzed further using Tukey HSD for all pairwise comparisons (Table 6). In data analysis of individual vineyards, the mean number of ants per minute remains consistently lower in the SDI treatment (Figure 8). In vineyard HV, in comparison to the control and SD treatment, sites with SDI treatment had a significantly lower number of ants (Table 6). While in vineyard PC, the ant populations between control and SD treatment were not significantly different. While the SD treatment plot had a significantly higher number of ants than in SDI treatment plots (Table 6).
Data were analyzed separately for each of the weeks after the sugar dispensers were placed on the vineyard. The first week after the sugar dispensers were deployed, the ant populations were not significantly different among different treatments (Figure 9).
In vineyard HV, the second week after deploying dispensers, an increase in number of ants around the treatment areas having sugar dispensers were observed. Although numerically higher, the ant populations between control and SDI treatment were not significantly different, but significantly different with SD treatments. From the third to the sixth week, although not statistically significant, compared to the control, the number of ants remained significantly lower in dispensers. Apart from a few days when the population is lower, the SD treatment area had a higher number of ants compared to the control. However, in the SDI treatment, the ant population was significantly lower compared to the control in the 9th and 10th week after deploying the dispensers. However, there was a trend of increase of ant population initially, followed by a decrease for few weeks, and again a surge of ant population in the vineyard again before decreasing. A similar trend was observed in the vineyard PC (Figure 9).
3.2.4. Fruit Cluster Injury Due to the Presence of Mealybugs
In vineyard HV, 50% of the infested clusters evaluated were from the control treatment, while 33% were from the SD treatment and 17% from the SDI treatment. In vineyard PC, 42% of the infested clusters evaluated were from the control treatment, while 37% were from the SD treatment and 21% from the SDI treatment (Figure 10). The nonparametric test for the fruit cluster infestation had similar results in both vineyards. The cluster infestation level was significantly different for sugar-toxicant bait in comparison to the control for both sites (vineyard PC: Z=2.034, p=0.0419; and vineyard HV: Z=3.005, p=0.0027 for SDI: control). On the other hand, the cluster infestation level between SD treatment in comparison to the control in both vineyards were not significantly different (vineyard PC: Z= -1.634, p=0.1023; vineyard H: Z=-1.863, p=0.0624 for SD: control).
3.2.5. Relation Between Ants, Mealybugs and Cluster Infestation
For the multivariate data analysis, we compared the data of ant densities, mealybug densities, and cluster injury data for the whole sampling season. For vineyard PC, the correlation coefficient between the number of ants per minute and the number of mealybugs per vine is low, positive, and not significant (r=0.158; p=0.097) in the control treatment (Figure 11). In the same treatment, the correlation coefficient between both the number of ants per minute as well as the number of mealybugs per vine and cluster damage is low, positive, and not significant (r=0.0641; p=0.76 for ant number; r=0.06; p=0.77 for mealybugs number). These weak-to-low correlation coefficient values imply that changes in one domain are not correlated strongly with changes in the related domain.
For the SDI treatment in vineyard PC, the correlation coefficient between the number of ants per minute and the number of mealybugs per vine is low, positive, and significant (r=0.1882; p=0.0489). In the same treatment, the correlation coefficient between both the number of ants per minute and the cluster damage is weak, positive, and not significant (r=0.326; p=0.11). The number of mealybugs per vine and cluster damage has a moderate correlation coefficient with a highly significant effect (r=0.768, p<0.0001).
For the SD treatment in vineyard PC, the correlation coefficient between the number of ants per minute and the number of mealybugs per vine is low, positive, and not significant (r=0.037; p=0.69). In the same treatment, the correlation coefficient between both the number of ants per minute as well as the number of mealybugs per vine and cluster damage is low, positive, and not significant (r=0.175; p=0.401 for ant number; r=0.077; p=0.71 for mealybugs number).
For vineyard HV, the correlation coefficient between the number of ants per minute and the number of mealybugs per vine is weak, positive, and significant (r=0.2524; p=0.0239) in the control treatment (Figure 12). In the same treatment, the correlation coefficient between both the number of ants per minute as well as the number of mealybugs per vine and cluster damage is weak, positive, and not significant (r=0.177; p=0.397 for ant number; r=0.261; p=0.206 for mealybugs number).
For the SDI treatment in vineyard HV, the correlation coefficient between the number of ants per minute and the number of mealybugs per vine is weak, positive, and significant (r=0.337; p=0.0022). In the same treatment, the correlation coefficient between the number of ants per minute and the cluster damage is weak, positive, and not significant (r=0.0773; p=0.713). The number of mealybugs per vine and cluster damage has a moderate correlation coefficient with a highly significant effect (r=0.595, p=0.0017).
For the SD treatment in vineyard HV, the correlation coefficient between the number of ants per minute and the number of mealybugs per vine is weak, positive, and not significant (r=0.119; p=0.291). In the same treatment, the correlation coefficient between the number of ants per minute and the cluster damage is weak, positive, and not significant (r=0.1035; p=0.47). The number of mealybugs per vine and cluster damage has a moderate correlation coefficient with a highly significant effect (r=0.779, p<0.0001).
4. Discussion
This study has explored the diversity of ants and mealybug populations in the vineyard setting and identified some of the important ant genera in close association with mealybugs. When most of the available control methods for mealybugs available on the market heavily rely on chemical spray, our findings have highlighted the potential of sugar dispensers as an alternative.
Dispensers containing sugar solution as well as ant insecticide i.e., Greenway Liquid Ant Killing Bait (1% disodium octaborate tetrahydrate) were deployed from the first week of June until the second week of September. This is a commercially available low-toxicity liquid bait, approved by United States Environmental Protection Agency (EPA) for both agricultural and non-agricultural use. This is a broad spectrum insecticide, which can be harmful to pollinators [29]. To mitigate unintended harm, we incorporated permeable mesh inside the dispensers and a garden-slotted mesh net over the cap, allowing ant access while preventing unnecessary liquid drips.
The dispensers were deployed coinciding with the peak ant activity and mealybugs- Pseudococcus maritimus and Ferrisia gilli infestations in the vineyard [16]. Grapevine infesting mealybugs usually overwinter under the bark as egg mass or first instars and move from the trunk and start infesting new buds next spring [30]. Our timed-visual count results showed significant reduction in ant activities due to the provisioning of areas with dispensers containing insecticide.
One of the first important aspects of the study is the consistently lower number of ants in the control plots throughout the sampling period in comparison to the plots containing dispensers. The pitfall trap data revealed significantly higher number of ants compared to the control, while according to the 1-minute visual count revealed significantly lower number of ants. The methods we used to survey the relative presence of ants in the vineyard may not accurately describe the local ant activity and densities around the vineyard. The data analyzed for weekly population densities of ants in the treatment was consistent with ant activities observed in the vineyard. During the initial days of dispenser deployment, ant densities were numerically higher in plots with sugar dispensers containing insecticide, likely due to attraction before toxicity effects took hold. However, by mid-July, most ant nests in treated areas had disappeared, with only a few wandering ants remaining or appearance of few new nests.
The data evaluation for the entire sampling period for timed-visual count data revealed a significant reduction in ant densities in plots having dispensers compared to the control. This result is consistent with the previous study by Beltrà, et al. [14], Daane, et al. [22], Perez-Rodriguez, et al. [17], and Parrilli, et al. [16] where control of ants in association with mealybugs was achieved by the use of liquid baits.
Contrary to the treatment with sugar dispensers containing insecticide, sugar dispensers lacking insecticide treatment had lower densities of ants during the initial days of dispenser deployment and slowly the ant number starts increasing in a few weeks. By the third week of August, even in the trunk containing dispensers, more ants were seen around mealybugs than on the dispensers. The number of ant foragers at ant baits increasing over time can be explained by pheromone recruitment and the establishment of foraging trails [31]. In the meantime, lower number of ants were observed in the plots having sugar dispensers with insecticide. Our study suggested the sugar dispensers equipped with insecticide is more effective to lower the ant colony densities as much lower ant colonies were observed by the middle of the whole chemical trial.
Parrilli, et al. [16] demonstrated that the use of liquid sugar dispensers decreased the percentage of infested grapes bunches in comparison to control. Beltrà, et al. [14],Perez-Rodriguez, et al. [17,22] also demonstrated that sugar provisioning decreases mealybug infestation.
Fifteen genera of ants were recorded foraging around commercial vineyards in Virginia in 2022. Among those ants, Tetramorium ant remains the dominant ant in both vineyards followed by the thief ant, the Lasius genus (garden ant), the odorous house ant (Tapinoma sessile), and the Pheidole genus (big-headed ants). During the field research, some of the ant species seen in close association to and tending after the mealybugs include genus like Crematogaster- the acrobat ant, especially species C. ashmeadi Emery and C. pilosa Emery, Tetramorium- the pavement ant, Lasius- the garden ant, and Solenopsis molesta- the thief ant.
Crematogaster ashmeadi and C. pilosa are arboreal ants native to the southeastern United States [32,33,34] They are commonly known as acrobat ants because of the way the workers hold up their abdomen over the rest of the body when disturbed. They mostly nest in trees, logs, fallen branches, and in hollow stems of plants. These ants were seen in the grapevine under the bark, actively tending mealybugs and raising their abdomen up when alarmed or disturbed. As seen in the field, they also pick mealybugs up and transfer them to safe places when disturbed. Tetramorium and Lasius have been two of the dominant genera seen in association with mealybugs, the former is subterranean, and the latter is arboreal [35]. Like Crematogaster, they were seen actively defending and moving mealybugs around to safer sections of the grapevines. Among the common genera of ants in the vineyard, Pheidole, and S. molesta are widespread generalists [36,37]. One of the drawbacks of using pitfall traps is the underrepresentation of subterranean ants and the high representation of epigeic ants. Some of the arboreal ants (e.g. Crematogaster and Lasius) included in the sample are also active on the surface. Some of the epigeic and subterranean ants are underrepresented in the one-minute visual count for ants in the trunk [25,38]. The pitfall traps were installed as soon as they reached the field early in the morning and taken back when leaving the field, the same day. In addition, the vineyards are mostly surrounded by wooded areas and hence may have contained ant species present in the forests as well.
The use of sugar/ant dispensers has often been combined with other methods of biological control like the use of predators or parasitoids [14,16]. The parasitization rate and predation rates on different treatments were not included in our study due to time constraints. Previous studies have recorded a significant increase in the predation pressure and parasitization rates in mealybugs when sugar dispensers were deployed [14,16].
While studying the relationship between ant and mealybug population densities and fruit cluster infestation rate, a strong correlation between the number of ants per minute, and the number of mealybugs per vine with the cluster infestation was lacking in our data. Although there is a weak correlation, the field observation after the use of dispensers led to numerically lesser ant activities and lesser number of ant nests, mealybugs numbers and cluster injury in the treatment area having sugar dispensers with insecticide.
A further study might be needed to study the effect of multiple years of placement of dispensers on ant activity, mealybug levels and cluster infestation rate on the vineyard. The dispensers should be continuously deployed for more than two consecutive years for increasing their efficacy against vineyard-dwelling ant populations [39].
One major drawback encountered during the research was the significant amount of time required to assemble and deploy the dispensers. This limitation made the process labor-intensive and potentially less practical for larger-scale applications. The existing dispensers, however, demonstrated functionality and effectiveness when utilized in vineyards of small to medium sizes, suggesting their potential suitability for more localized or moderately scaled settings. Optimization of the assembly and deployment process could enhance their usability for larger operations in the future. For small- to medium-sized vineyards, management of ants and mealybugs can be achieved via dispenser-based control method.
5. Conclusions
Our research emphasizes the use of sugar dispensers in managing ants and mealybug population in the vineyard. It also highlights important mealybug species and ant genera in close association with mealybugs. The ants and mealybug populations in the field can be managed effectively using sugar dispensers, especially the one having an insecticide as reported from previous similar studies [14,15,16,22]. One of the time-consuming aspects of the dispensers used in the field started from the assembling of all the tiny pieces of the sugar dispenser and its delivery. The current dispenser is more suitable for small- to medium-sized vineyards, which require a limited number of dispensers. More research should be carried out to optimize and improve the installation and maintenance to make it more friendly for vineyards of varying sizes. Further study should focus on use of sugar dispensers for multiple years to study its long-term effect on managing mealybug population in various conditions in vineyards.
Author Contributions
Conceptualization, P.C., D.G.P., T.K., M.N., C.B. and T.J.; methodology, P.C., D.G.P., T.K., M.N., C.B. and T.J.; software, P.C.; validation, P.C., D.G.P., T.K., M.N., C.B. and T.J.; formal analysis, P.C.; investigation, P.C., D.G.P., T.K., M.N., C.B. and T.J.; resources, P.C., R.M.; data curation, P.C.; writing—original draft preparation, P.C.; writing—review and editing, P.C., D.G.P., T.K., M.N., C.B. and T.J.; visualization, P.C.; supervision, P.C., D.G.P., T.K., M.N., C.B. and T.J.; project administration, R. M.; funding acquisition, D.G.P. All authors have read and agreed to the published version of the manuscript.
Funding
This research was funded by Virginia Wine Board (Virginia, United States).
Data Availability Statement
Our data are available online at MDPI page.
Acknowledgments
We would like to thank Dr. Donald Mullins, and Sandra Gabbert for allowing us to use their laboratory. We would also like to thank Dr. Chin-Cheng Scotty Yang and Virginia Tech Insect ID lab for help in ant identification.
Conflicts of Interest
The authors declare no conflicts of interest. The funders had no role in the design of the study; in the collection, analyses, or interpretation of data; in the writing of the manuscript; or in the decision to publish the results.
References
- Mani, M.; Amala, U. Fruit crops: grapevine. In Mealybugs and their Management in Agricultural and Horticultural Crops, Mani, M., Shivaraju, C., Eds.; Springer India: New Delhi, 2016; pp. 329-351.
- Pfeiffer, D.G. Major insect and mite pests of grape in eastern North America. In Wine Grape Production Guide for Eastern North America, Wolf, T.K., Ed.; Natural Resource, Agriculture, and Engineering Service (NRAES): Ithaca, New York, 2008; pp. 241-261.
- Jones, T.J. Grapevine viruses and associated vectors in Virginia: Survey, vector management, and development of efficient grapevine virus testing methods. Virginia Polytechnic Institute and State University, Blacksburg, Virginia, 2016.
- Geiger, C.A.; Daane, K.M. Seasonal movement and distribution of the grape mealybug (Homoptera: Pseudococcidae): developing a sampling program for San Joaquin valley vineyards. Journal of Economic Entomology 2001, 94, 291-301. [CrossRef]
- Grasswitz, T.R.; James, D.G. Movement of grape mealybug, Pseudococcus maritimus, on and between host plants. Entomologia Experimentalis et Applicata 2008, 129, 268-275. [CrossRef]
- Franco, J.C.; Zada, A.; Mendel, Z. Novel approaches for the management of mealybug pests. In Biorational Control of Arthropod Pests: Application and Resistance Management, Ishaaya, I., Horowitz, A.R., Eds.; Springer Netherlands: Dordrecht, 2009; pp. 233-278.
- Daane, K.; Almeida, b.; Bell, V.; Walker, b.; Botton, M.; Fallahzadeh, M.; Mani, M.; Daane, K.; Almeida, R.; Bell, V.; et al. Biology and management of mealybugs in vineyards. In Arthropod Management in Vineyards: Pests, Approaches, and Future Directions, Bostanian, N.J., Vincent, C., Issacs, R., Eds.; Springer Dordrecht, Heidelberg, New York, London, 2012; pp. 271-307.
- Mani, M.; Krishnamoorthy, A.; Shivaraju, C. Biological suppression of major mealybug species on horticultural crops in India. Journal of Horticultural Sciences 2011, 6, 85-100. [CrossRef]
- Mansour, R.; Belzunces, L.P.; Suma, P.; Zappalà, L.; Mazzeo, G.; Grissa-Lebdi, K.; Russo, A.; Biondi, A. Vine and citrus mealybug pest control based on synthetic chemicals. A review. Agronomy for Sustainable Development 2018, 38, 1-20. [CrossRef]
- Styrsky, J.D.; Eubanks, M.D. Ecological consequences of interactions between ants and honeydew-producing insects. Proceedings of Biological sciences / The Royal Society 2006, 274, 151-164. [CrossRef]
- Xu, C.; Su, J.; Qu, X.; Zhou, A. Ant-mealybug mutualism modulates the performance of co-occurring herbivores. Scientific Reports 2019, 9, 13004. [CrossRef]
- Wilder, S.M.; Holway, D.A.; Suarez, A.V.; LeBrun, E.G.; Eubanks, M.D. Intercontinental differences in resource use reveal the importance of mutualisms in fire ant invasions. Proc Natl Acad Sci U S A 2011, 108, 20639-20644. [CrossRef]
- Fernández de Bobadilla, M.; Ramírez, N.M.; Calvo-Agudo, M.; Dicke, M.; Tena, A. Honeydew management to promote biological control. Current Opinion in Insect Science 2024, 61, 101151. [CrossRef]
- Beltrà, A.; Navarro-Campos, C.; Calabuig, A.; Estopà, L.; Wäckers, F.L.; Pekas, A.; Soto, A. Association between ants (Hymenoptera: Formicidae) and the vine mealybug (Hemiptera: Pseudococcidae) in table-grape vineyards in Eastern Spain. Pest Manag Sci 2017, 73, 2473-2480. [CrossRef]
- Daane, K.M.; Sime, K.R.; Hogg, B.N.; Bianchi, M.L.; Cooper, M.L.; Rust, M.K.; Klotz, J.H. Effects of liquid insecticide baits on Argentine ants in California's coastal vineyards. Crop Protection 2006, 25, 592-603. [CrossRef]
- Parrilli, M.; Profeta, M.; Casoli, L.; Gambirasio, F.; Masetti, A.; Burgio, G. Use of sugar dispensers to disrupt ant attendance and improve biological control of mealybugs in vineyard. Insects 2021, 12, 330.
- Perez-Rodriguez, J.; Pekas, A.; Tena, A.; Wäckers, F. Sugar provisioning for ants enhances biological control of mealybugs in citrus. Biological Control 2021, 157, 104573. [CrossRef]
- Nondillo, A.; Andzeiewski, S.; Bello Fialho, F.; Bueno, O.C.; Botton, M. Control of Linepithema micans (Hymenoptera: Formicidae) and Eurhizococcus brasiliensis (Hemiptera: Margarodidae) in vineyards using toxic baits. Journal of Economic Entomology 2016, 109, 1660-1666. [CrossRef]
- Klimes, P.; Borovanska, M.; Plowman, N.S.; Leponce, M. How common is trophobiosis with hoppers (Hemiptera: Auchenorrhyncha) inside ant nests (Hymenoptera: Formicidae)? Novel interactions from New Guinea and a worldwide overview. Myrmecological News 2018, 26, 31-45.
- Rust, M.K.; Reierson, D.A.; Klotz, J.H. Delayed toxicity as a critical factor in the efficacy of aqueous baits for controlling Argentine ants (Hymenoptera: Formicidae). J Econ Entomol 2004, 97, 1017-1024. [CrossRef]
- Wcislo, W.T. Trophallaxis in weakly social bees (Apoidea). Ecological Entomology 2015, 41, 37-39. [CrossRef]
- Daane, K.M.; Cooper, M.L.; Sime, K.R.; Nelson, E.H.; Battany, M.C.; Rust, M.K. Testing baits to control Argentine ants (Hymenoptera: Formicidae) in vineyards. J Econ Entomol 2008, 101, 699-709. [CrossRef]
- Daane, K.M.; Middleton, M.C.; Sforza, R.; Cooper, M.L.; Walton, V.M.; Walsh, D.B.; Zaviezo, T.; Almeida, R.P. Development of a multiplex PCR for identification of vineyard mealybugs. Environ Entomol 2011, 40, 1595-1603. [CrossRef]
- Calixto, A.; Marvin, K.; Dean, A. Sampling ants with pitfall traps using either propylene glycol or water as a preservative. Southwestern Entomologist 2007, 32, 87-91. [CrossRef]
- Ward, D.F.; New, T.R.; Yen, A.L. Effects of pitfall trap spacing on the abundance, richness and composition of invertebrate catches. Journal of Insect Conservation 2001, 5, 47-53. [CrossRef]
- Fisher, B.L.; Cover, S.P.; Kirsch, G.; Kane, J.; Nobile, A. Ants of North America: A guide to the genera, 1 ed.; University of California Press: 2007.
- Beatty, W. Decision support using nonparametric statistics; 2018.
- JMP® 18 JMP Statistical Discovery LLC, Cary, NC, USA, 2024.
- AntPro, K. AntPro Insect Control System ™. Available online: (accessed on.
- Varela, L.G. Grape mealybug (Pseudococcus maritimus) life cycle in the North Coast. University of California Cooperative Extension 2005.
- Greenberg, L.; Klotz, J.H. Argentine Ant (Hymenoptera: Formicidae) trail pheromone enhances consumption of liquid sucrose solution. Journal of Economic Entomology 2000, 93, 119-122. [CrossRef]
- Saarinen, E.V. Acrobat ant Crematogaster ashmeadi Emery (Insecta: Hymenoptera: Formicidae: Myrmicinae); IFAS/University of Florida: Gainsville, Florida, 2021.
- Tschinkel, W. The natural history of the arboreal ant, Crematogaster ashmeadi. Journal of Insect Science 2002, 2, 1-12. [CrossRef]
- MacGown, J.A. Ants (Formicidae) of the southeastern United States. Available online: (accessed on.
- Stock, T.; Gouge, D. Integrated pest management for ants in schools; Pacific Northwest Extension: 2022; p. 10.
- Wilson, E.O. Pheidole in the New World: A dominant, hyperdiverse ant genus; Harvard University Press: 2003.
- Delabie, J.H.C.; Fowler, H.G. Soil and litter cryptic ant assemblages of Bahian cocoa plantations. Pedobiologia 1995, 39, 423-433. [CrossRef]
- Sheikh, A.; Ganaie, G.; Thomas, M.; Bhandari, R.; Rather, Y.A. Ant pitfall trap sampling: An overview. Journal of Entomological Research 2018, 42, 421-436. [CrossRef]
- Daane, K.M.; Sime, K.R.; Fallon, J.; Cooper, M.L. Impacts of Argentine ants on mealybugs and their natural enemies in California’s coastal vineyards. Ecological Entomology 2007, 32, 583-596. [CrossRef]
Figure 1.
a. Dispensers containing a. 25% sugar solution (sugar dispensers) and b. 1% disodium octaborate tetrahydrate bait (sugar dispensers with insecticide bait) deployed in the field.
Figure 1.
a. Dispensers containing a. 25% sugar solution (sugar dispensers) and b. 1% disodium octaborate tetrahydrate bait (sugar dispensers with insecticide bait) deployed in the field.
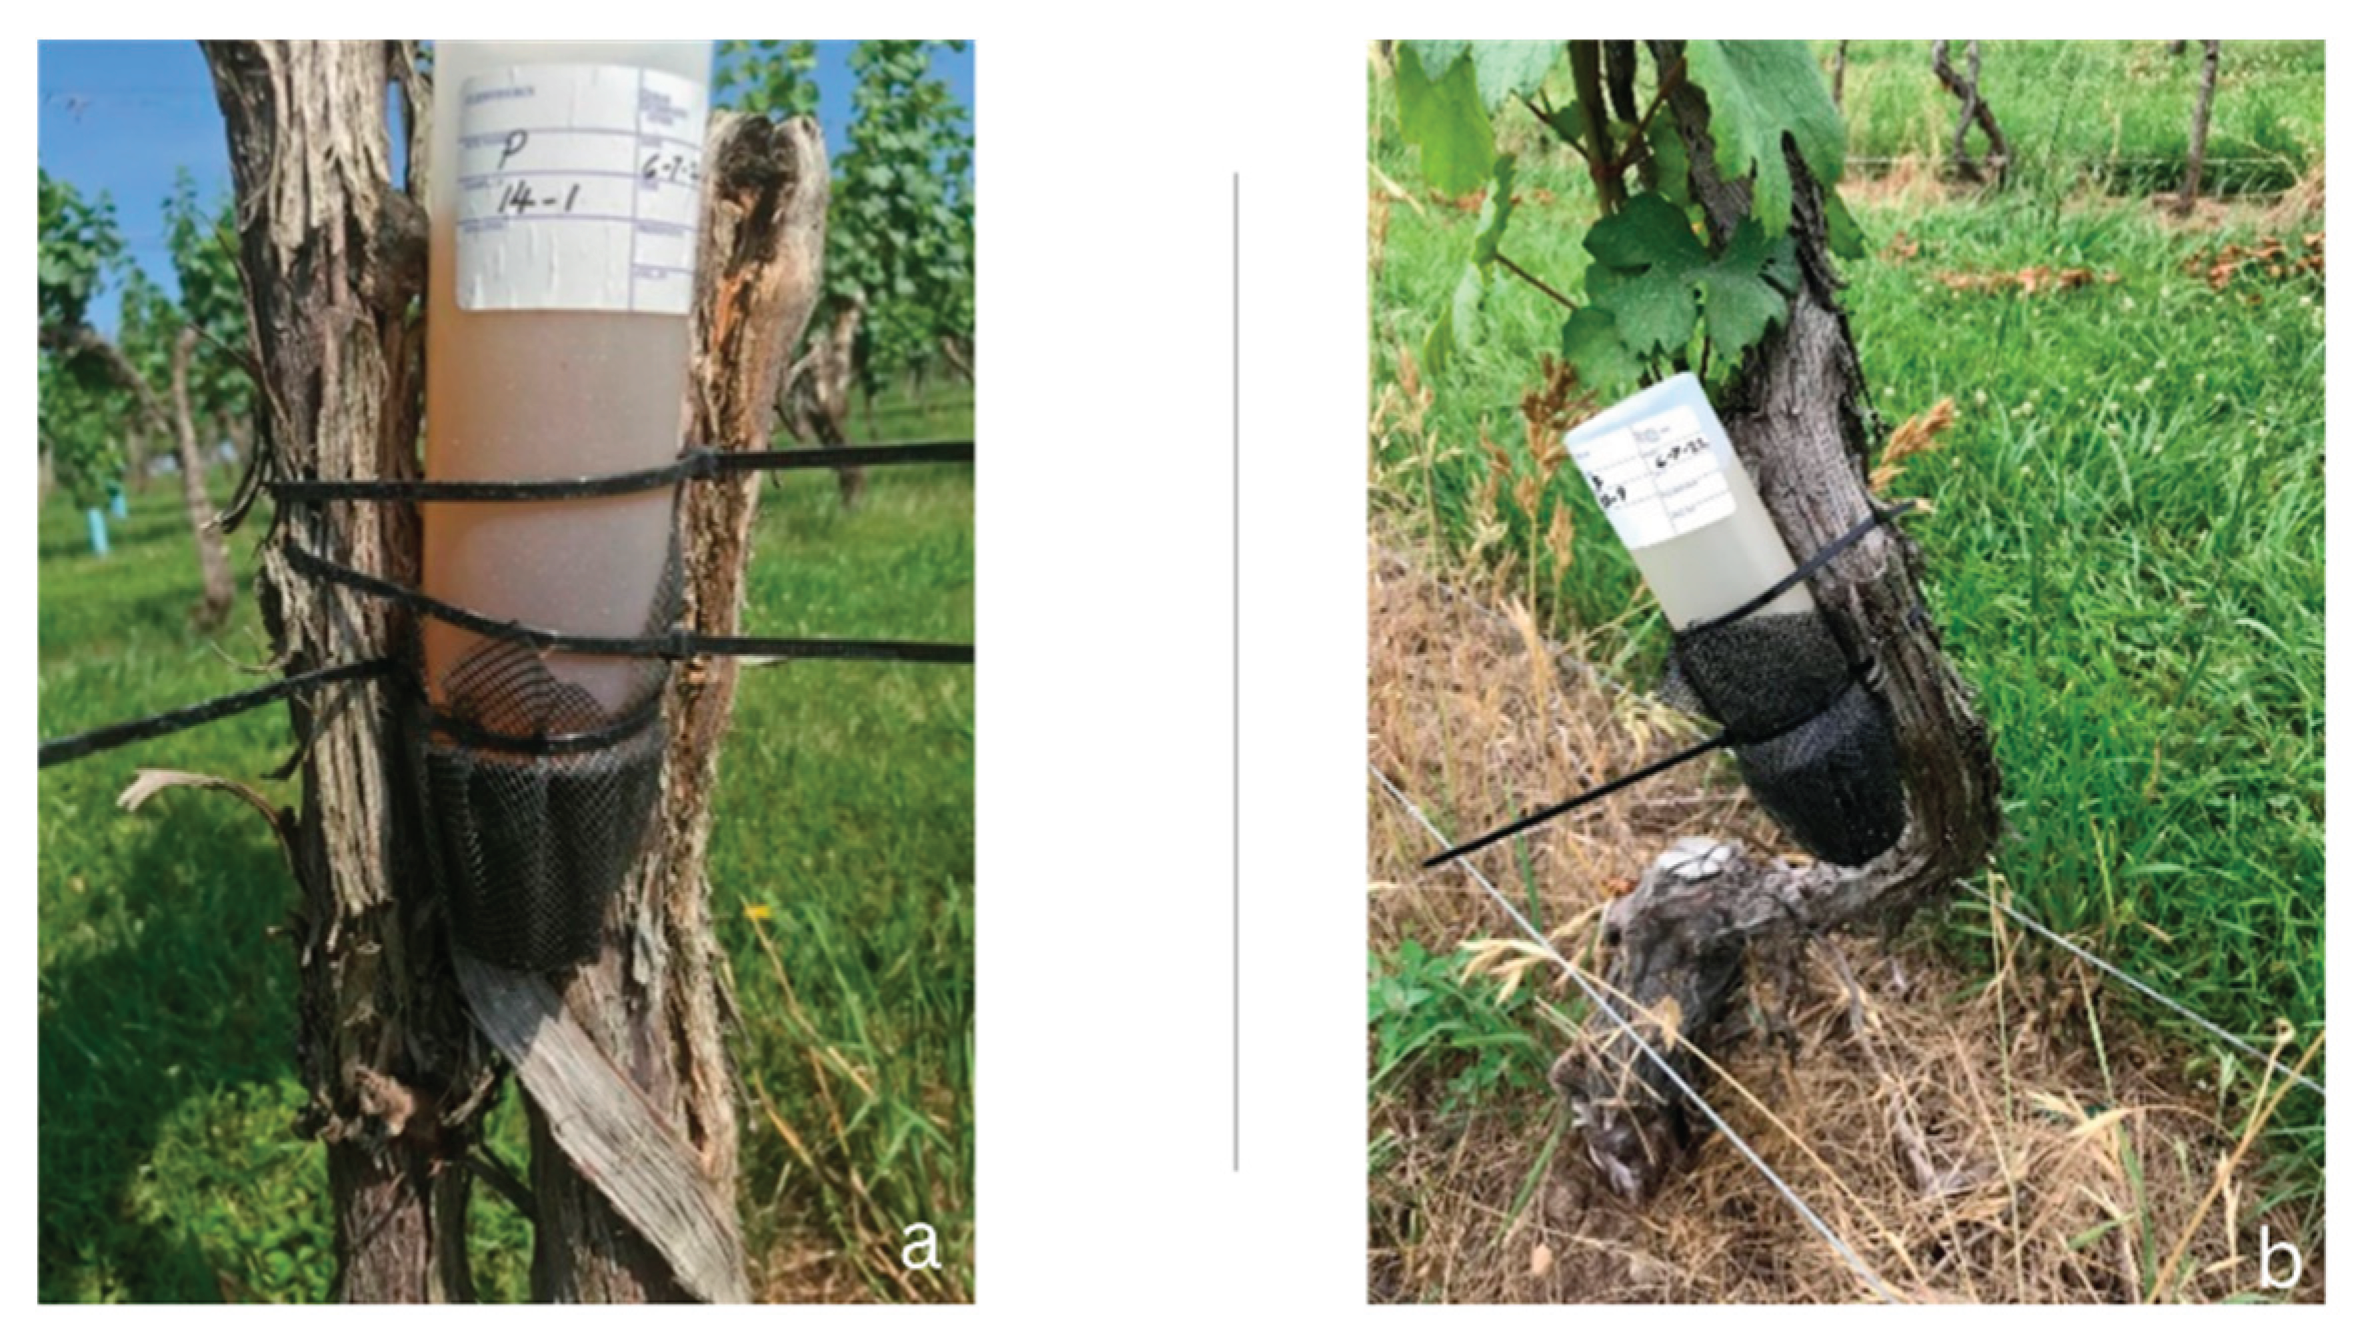
Figure 2.
An electrophoresis profile obtained with QIAGEN DNeasy® Blood & Tissue Kit for each PCR product. Each lane corresponds to one sample, and each band to a DNA fragment. The last two lanes correspond to control without any DNA and previously identified samples as Control DNA.
Figure 2.
An electrophoresis profile obtained with QIAGEN DNeasy® Blood & Tissue Kit for each PCR product. Each lane corresponds to one sample, and each band to a DNA fragment. The last two lanes correspond to control without any DNA and previously identified samples as Control DNA.
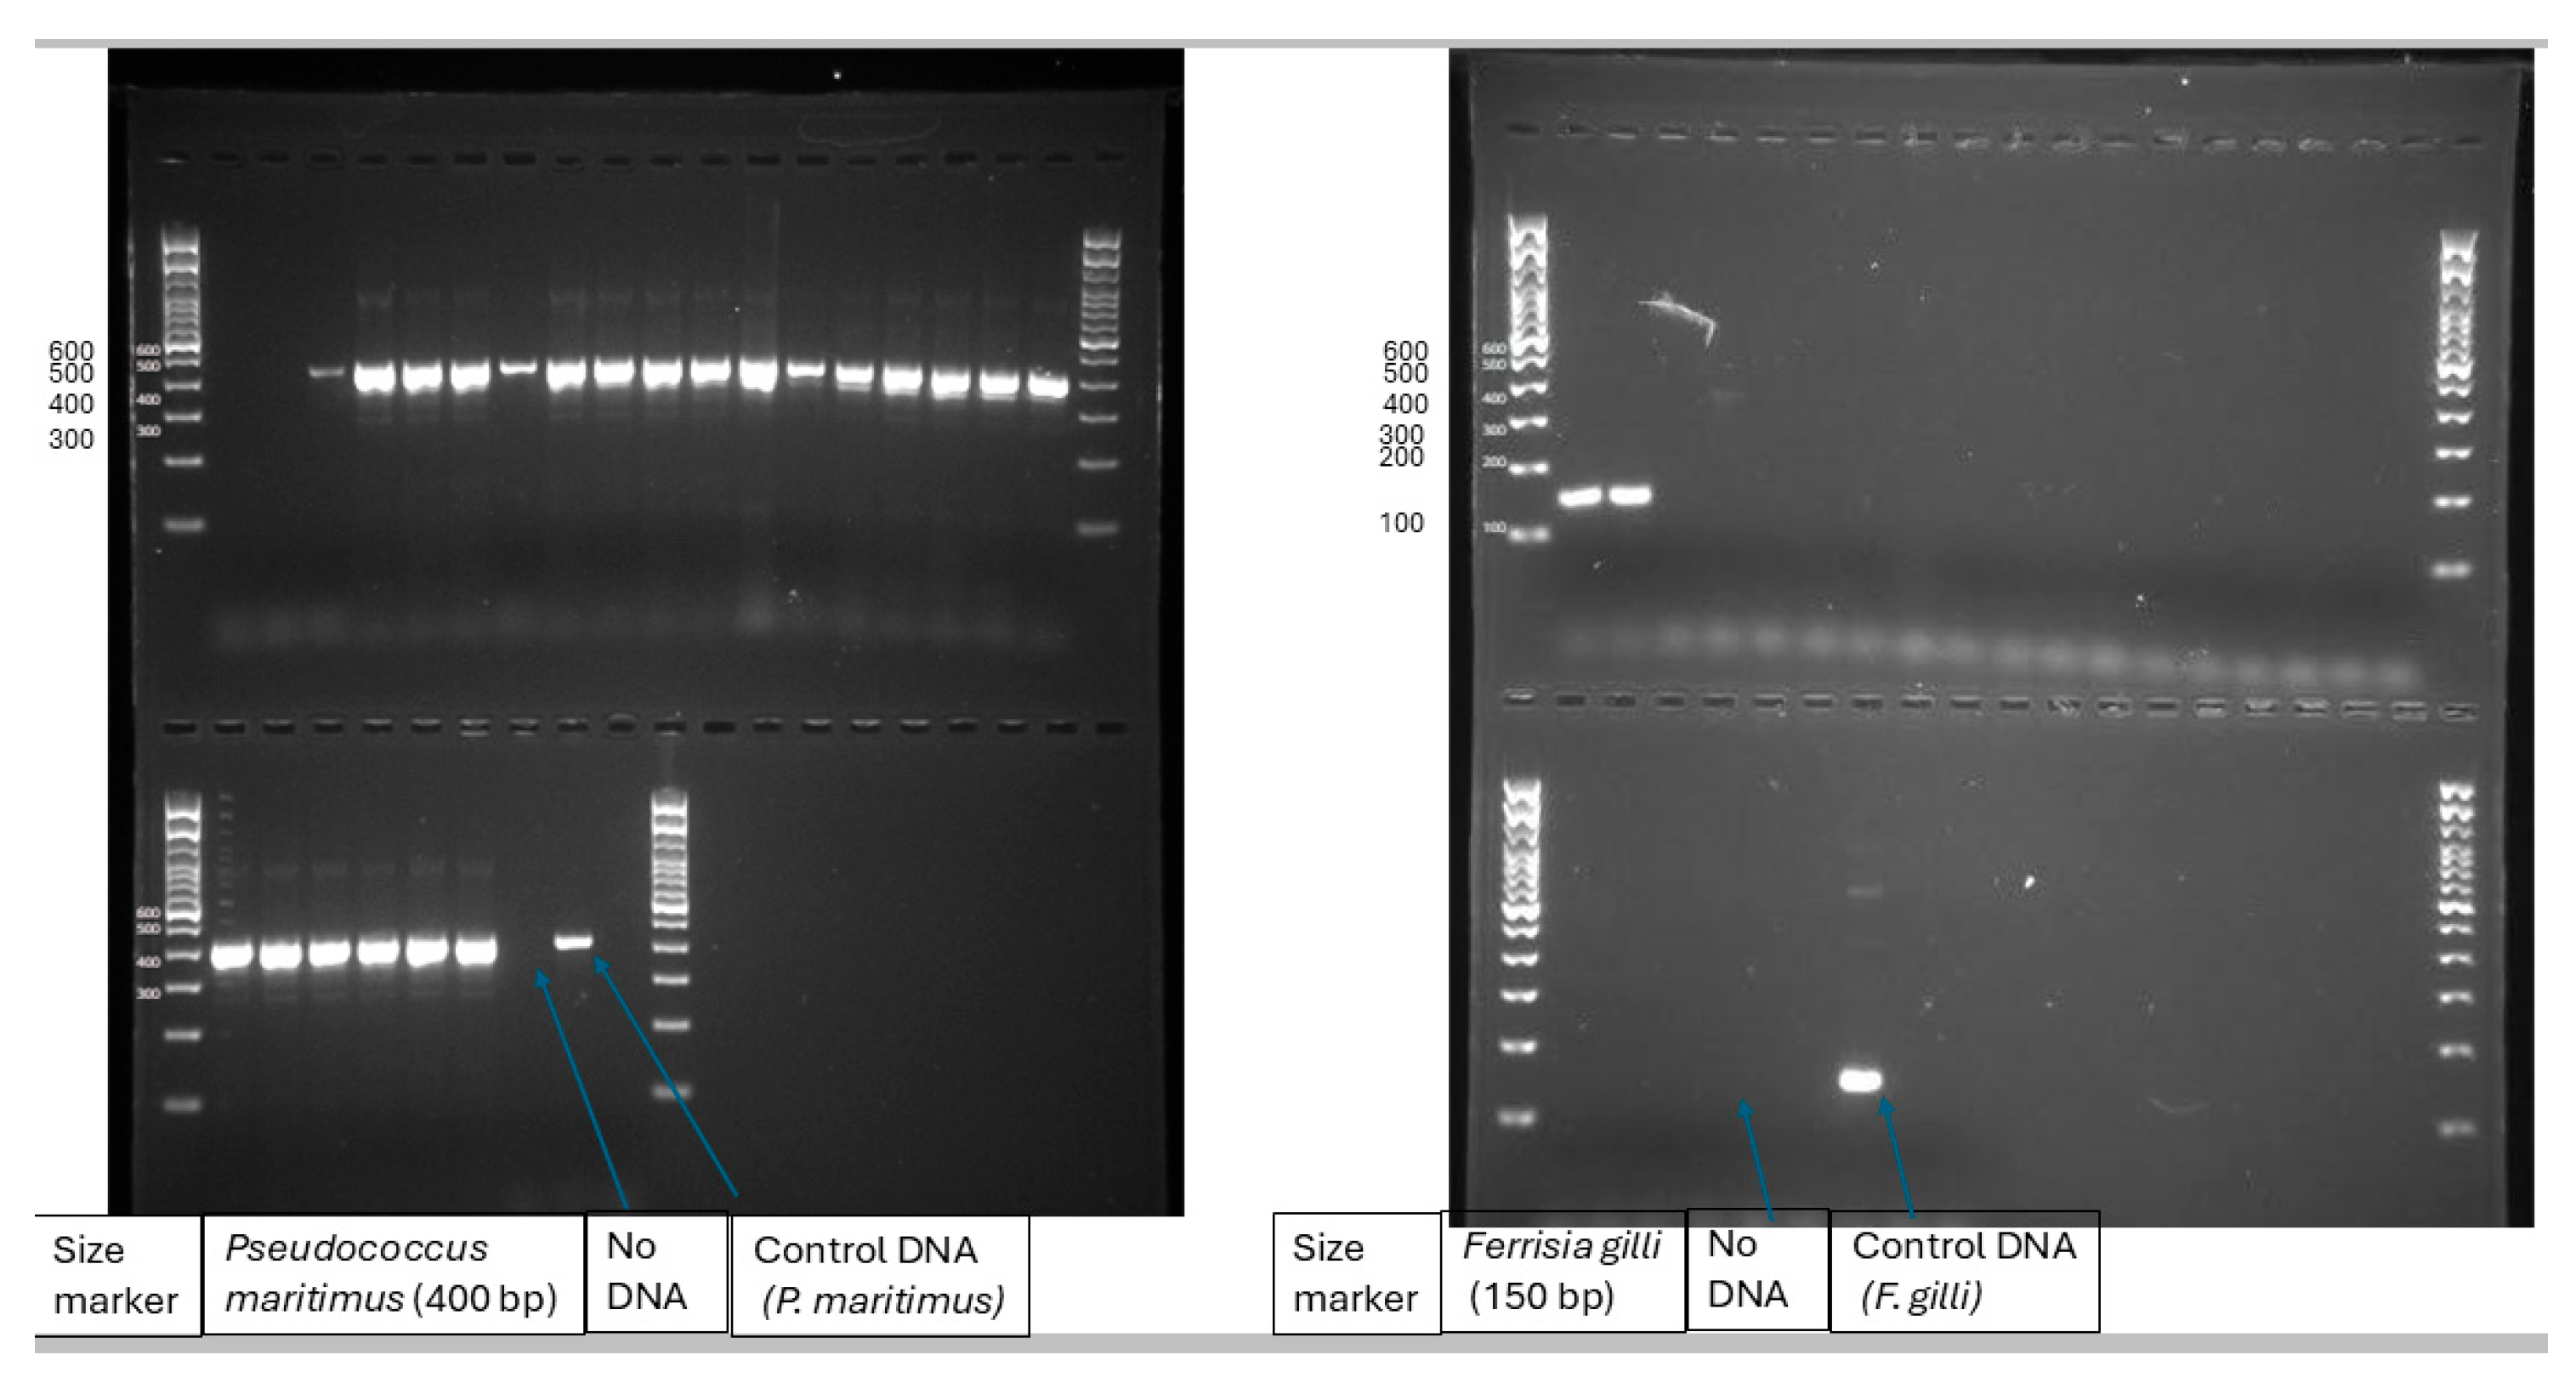
Figure 3.
Relative abundance of ants captured in the pitfall trap throughout the sampling period (June-September 2022) in sites HV (Orange County, Virginia) and PC (Fauquier County, Virginia) via a. pitfall trap and b. 1-minute-timed count.
Figure 3.
Relative abundance of ants captured in the pitfall trap throughout the sampling period (June-September 2022) in sites HV (Orange County, Virginia) and PC (Fauquier County, Virginia) via a. pitfall trap and b. 1-minute-timed count.
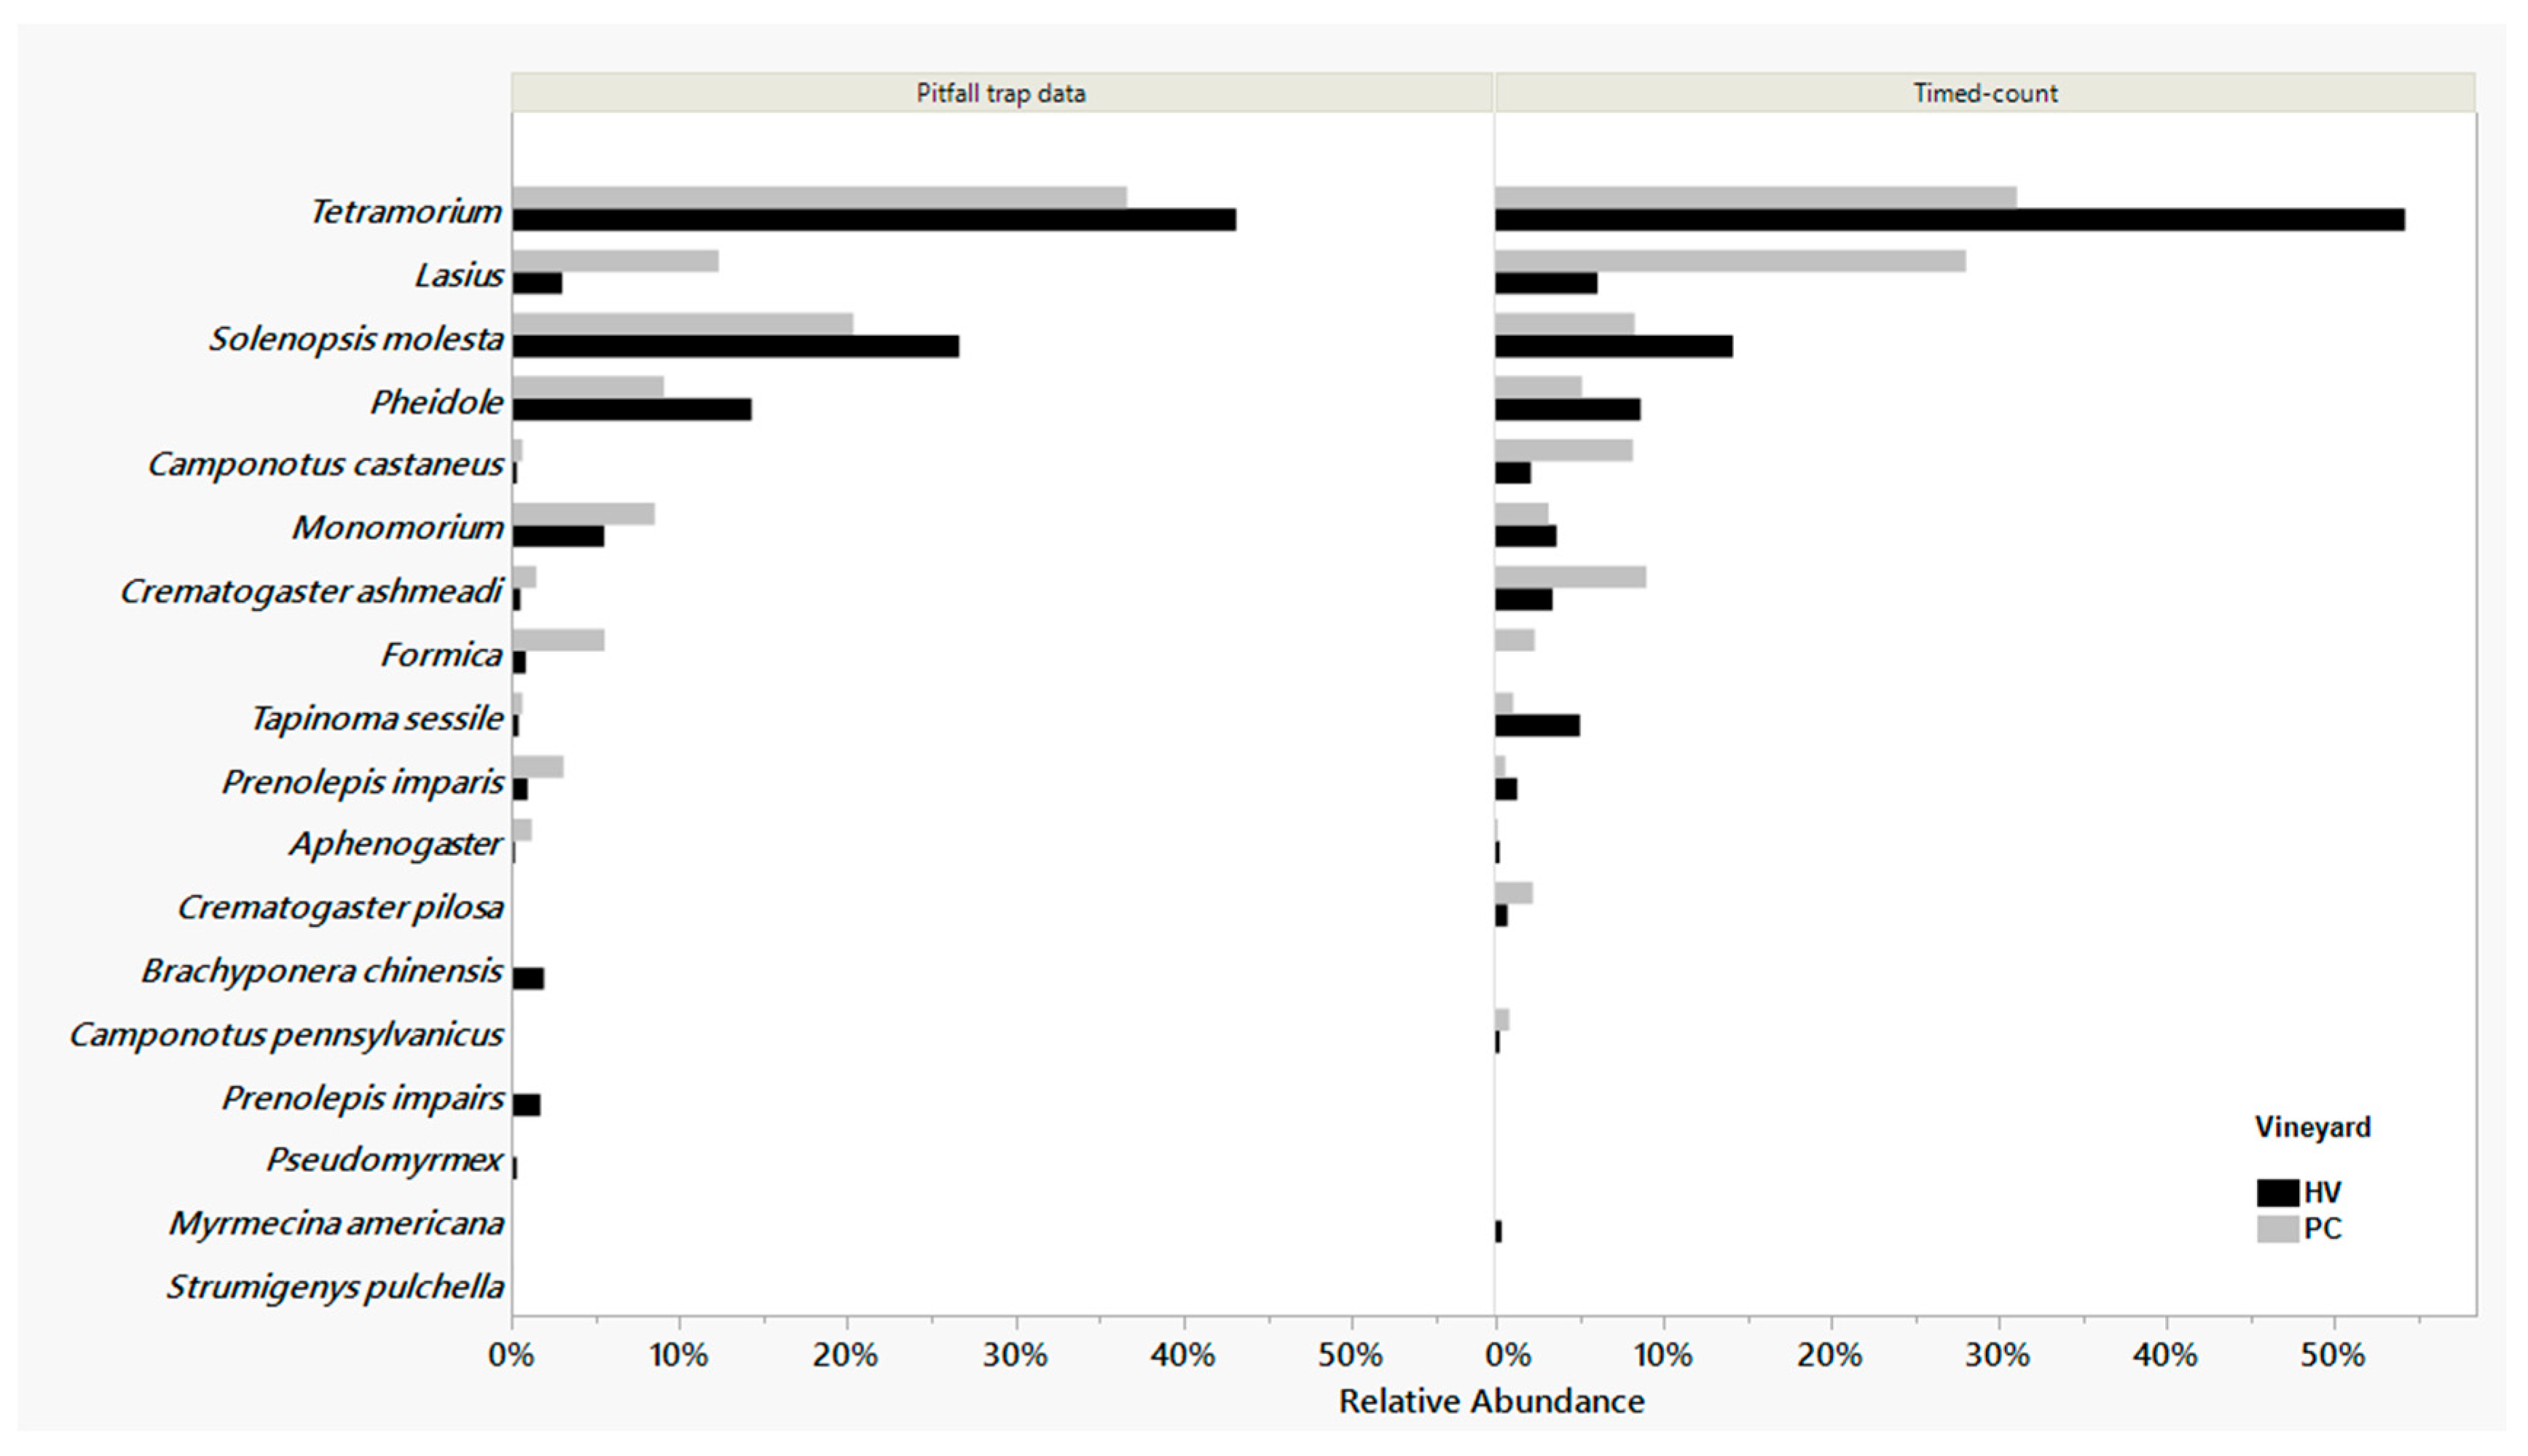
Figure 4.
Mean (+SEM) number of ants captured per pitfall trap in different treatments (Treatment: control= untreated check, SDI=sugar dispenser with insecticide (1% disodium octaborate tetrahydrate), SD=sugar dispenser with 25% sucrose solution) throughout the sampling season in vineyards HV (Orange County, Virginia) and PC (Fauquier County, VA). Dates on X-axis labelled as WAT= weeks after treatment (number of weeks after placement of treatment or dispensers).
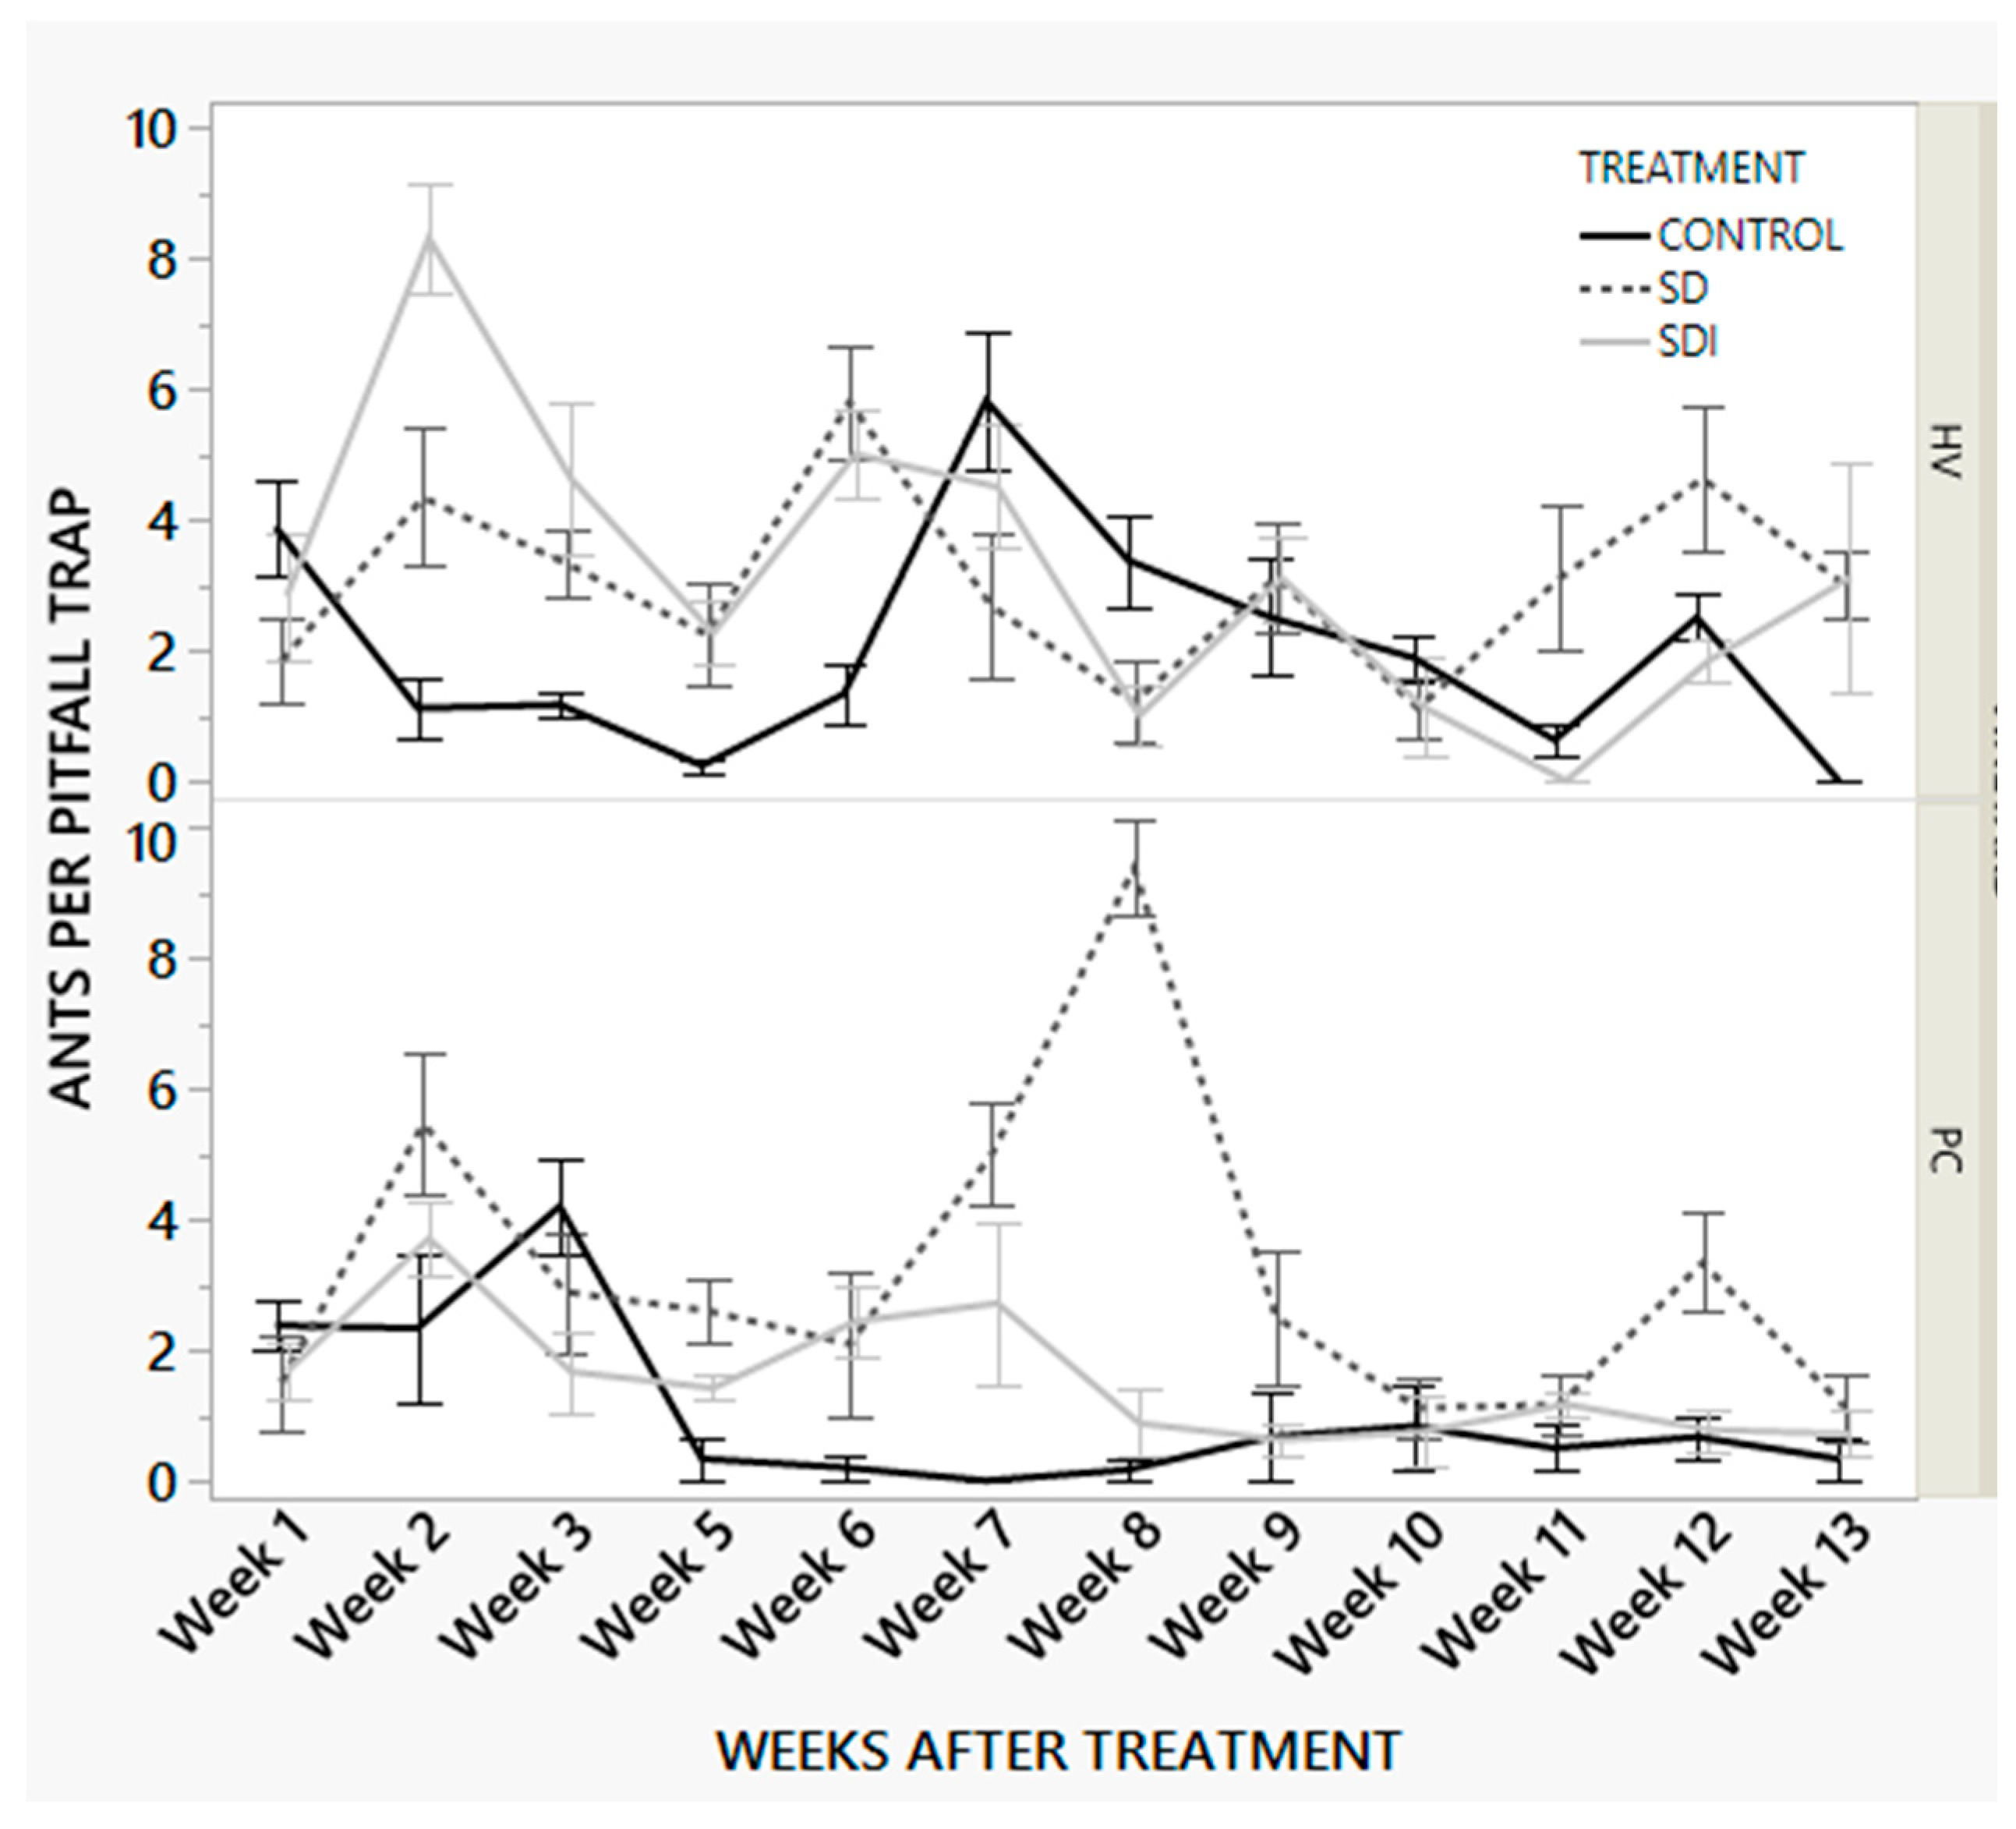
Figure 5.
Mean number of ants captured per pitfall trap in different treatments (Treatment: control=untreated check, SDI=sugar dispenser with insecticide, SD=sugar dispenser with 25% sucrose solution) throughout the sampling season in vineyards HV (Orange County, Virginia) and PC (Fauquier County, VA). * Indicates significant differences in data in comparison to the control.
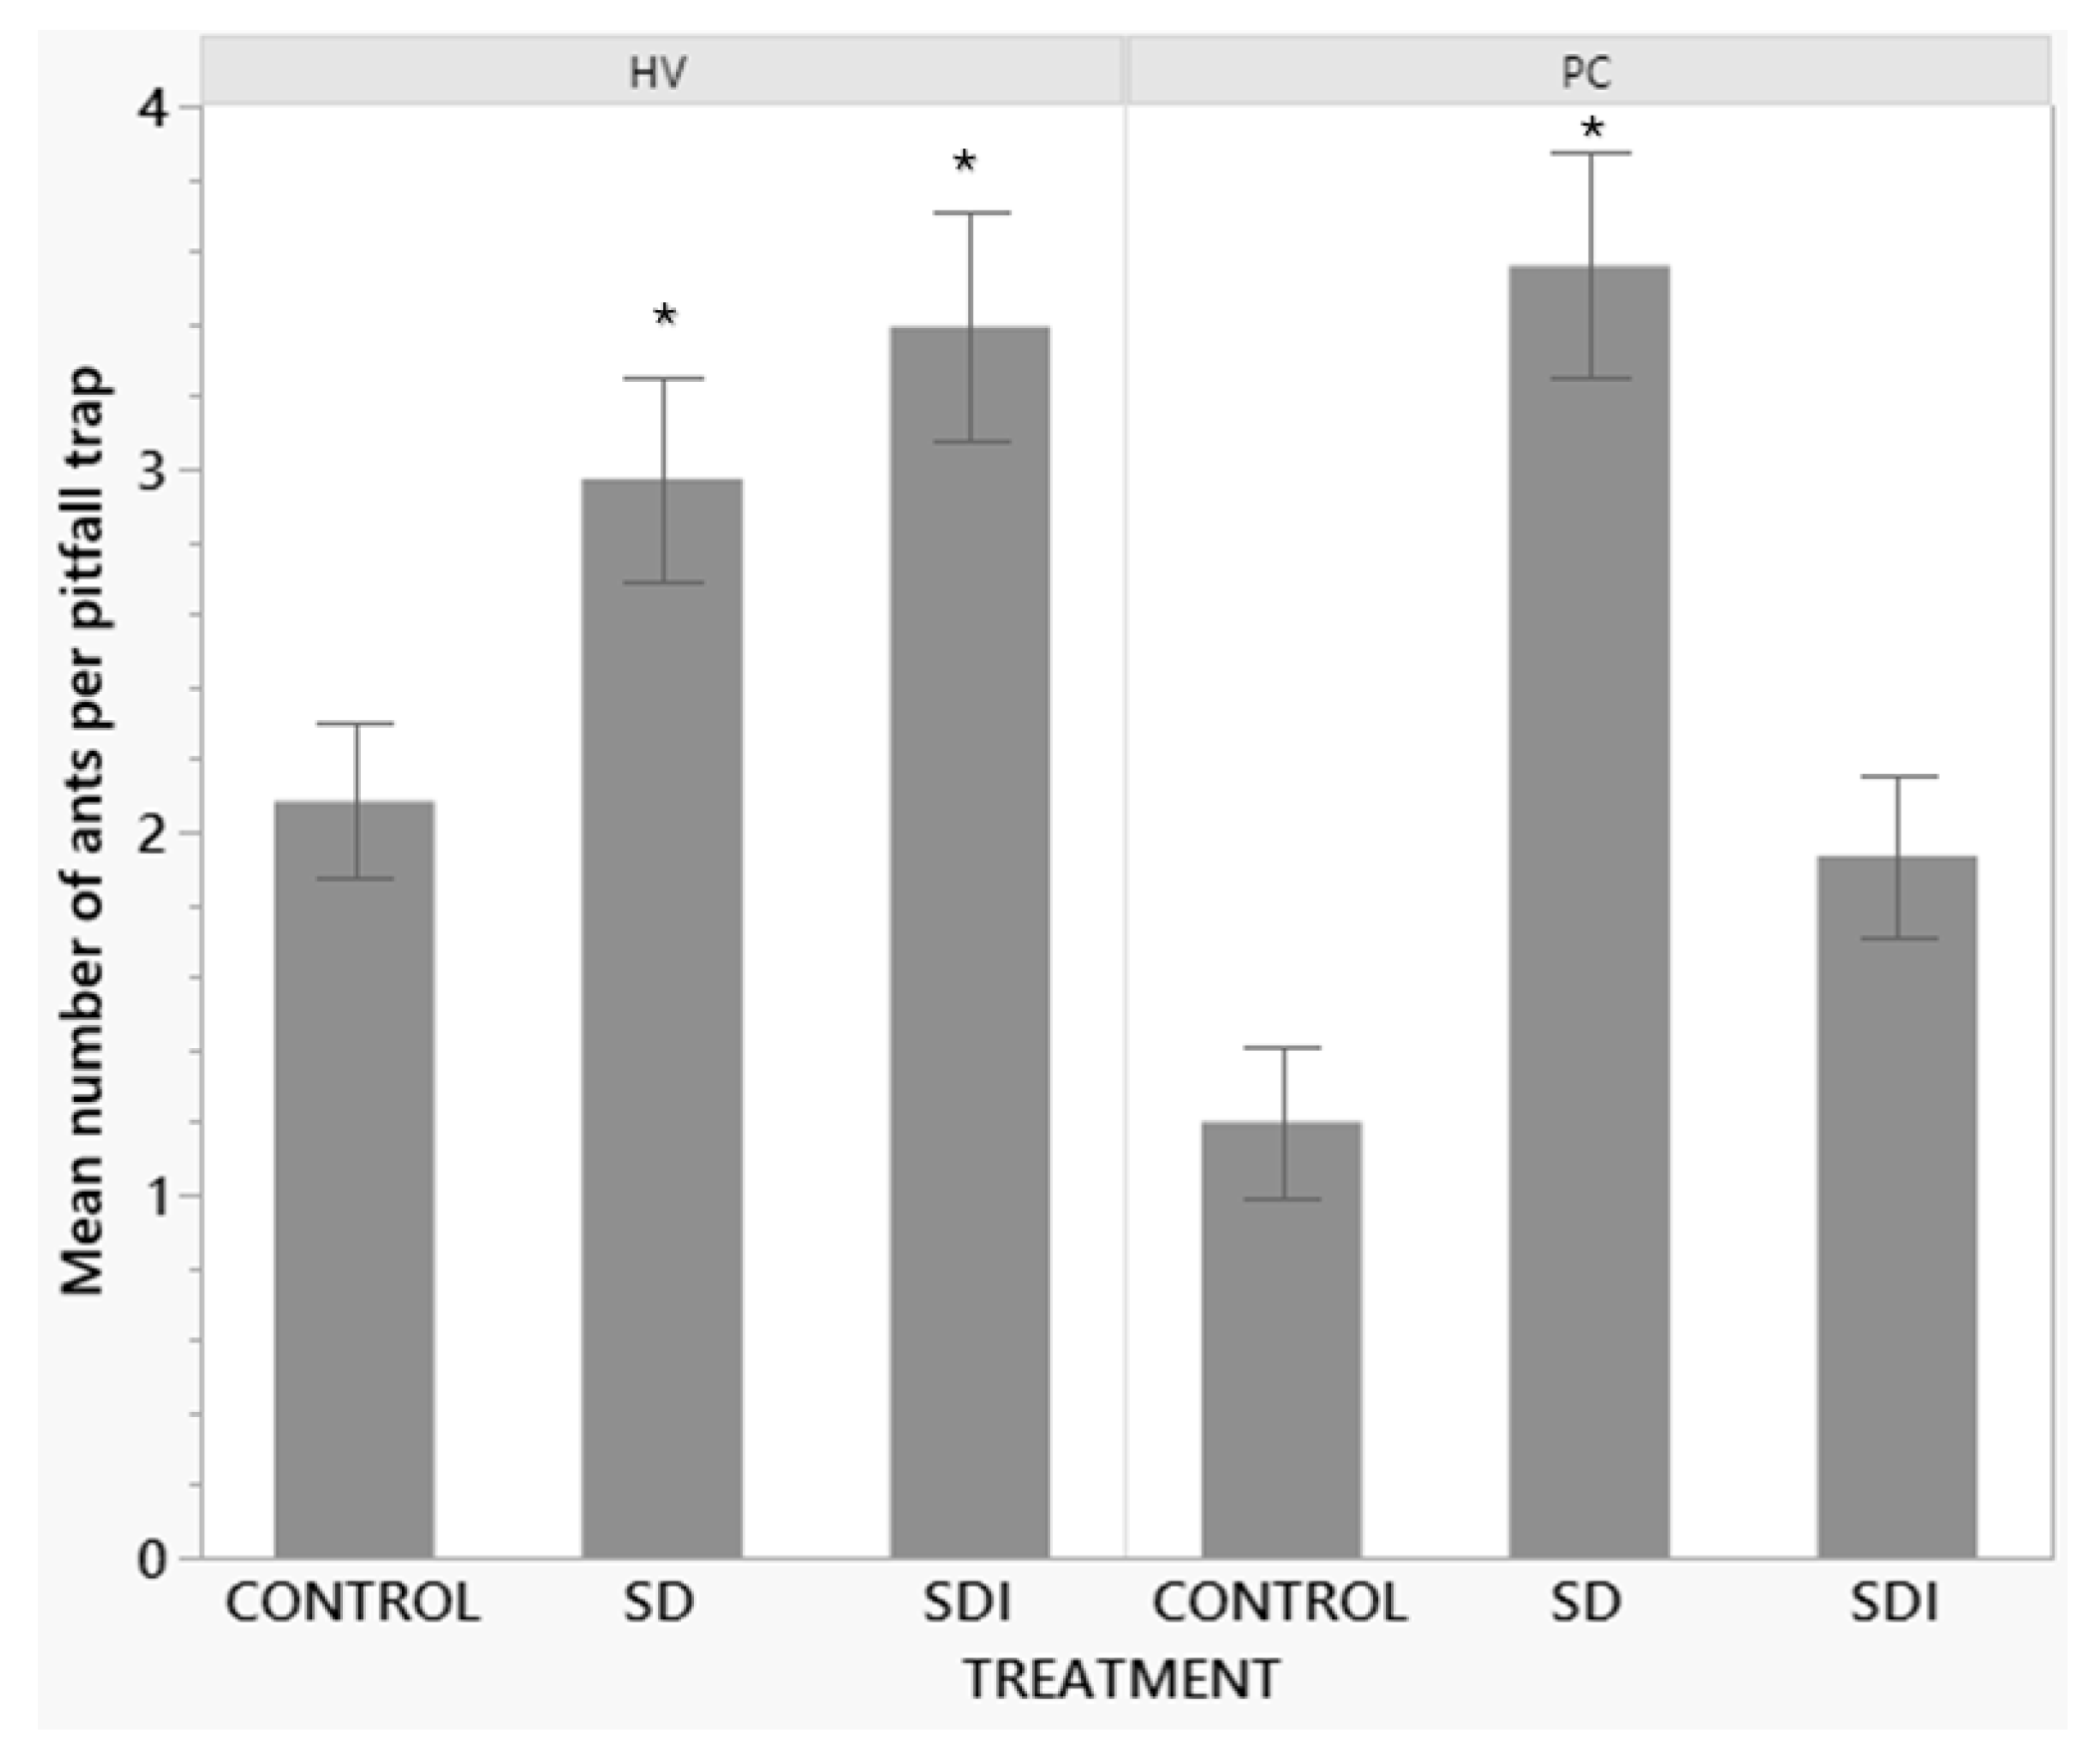
Figure 6.
Weekly mean numbers of ants captured per pitfall trap in different treatments (Treatment: control= untreated check, SDI=sugar dispenser with insecticide, SD=sugar dispenser with 25% sucrose solution) throughout the sampling season in vineyards HV (Orange County, Virginia) and PC (Fauquier County, VA). * Indicates significant differences in data in comparison to the control.
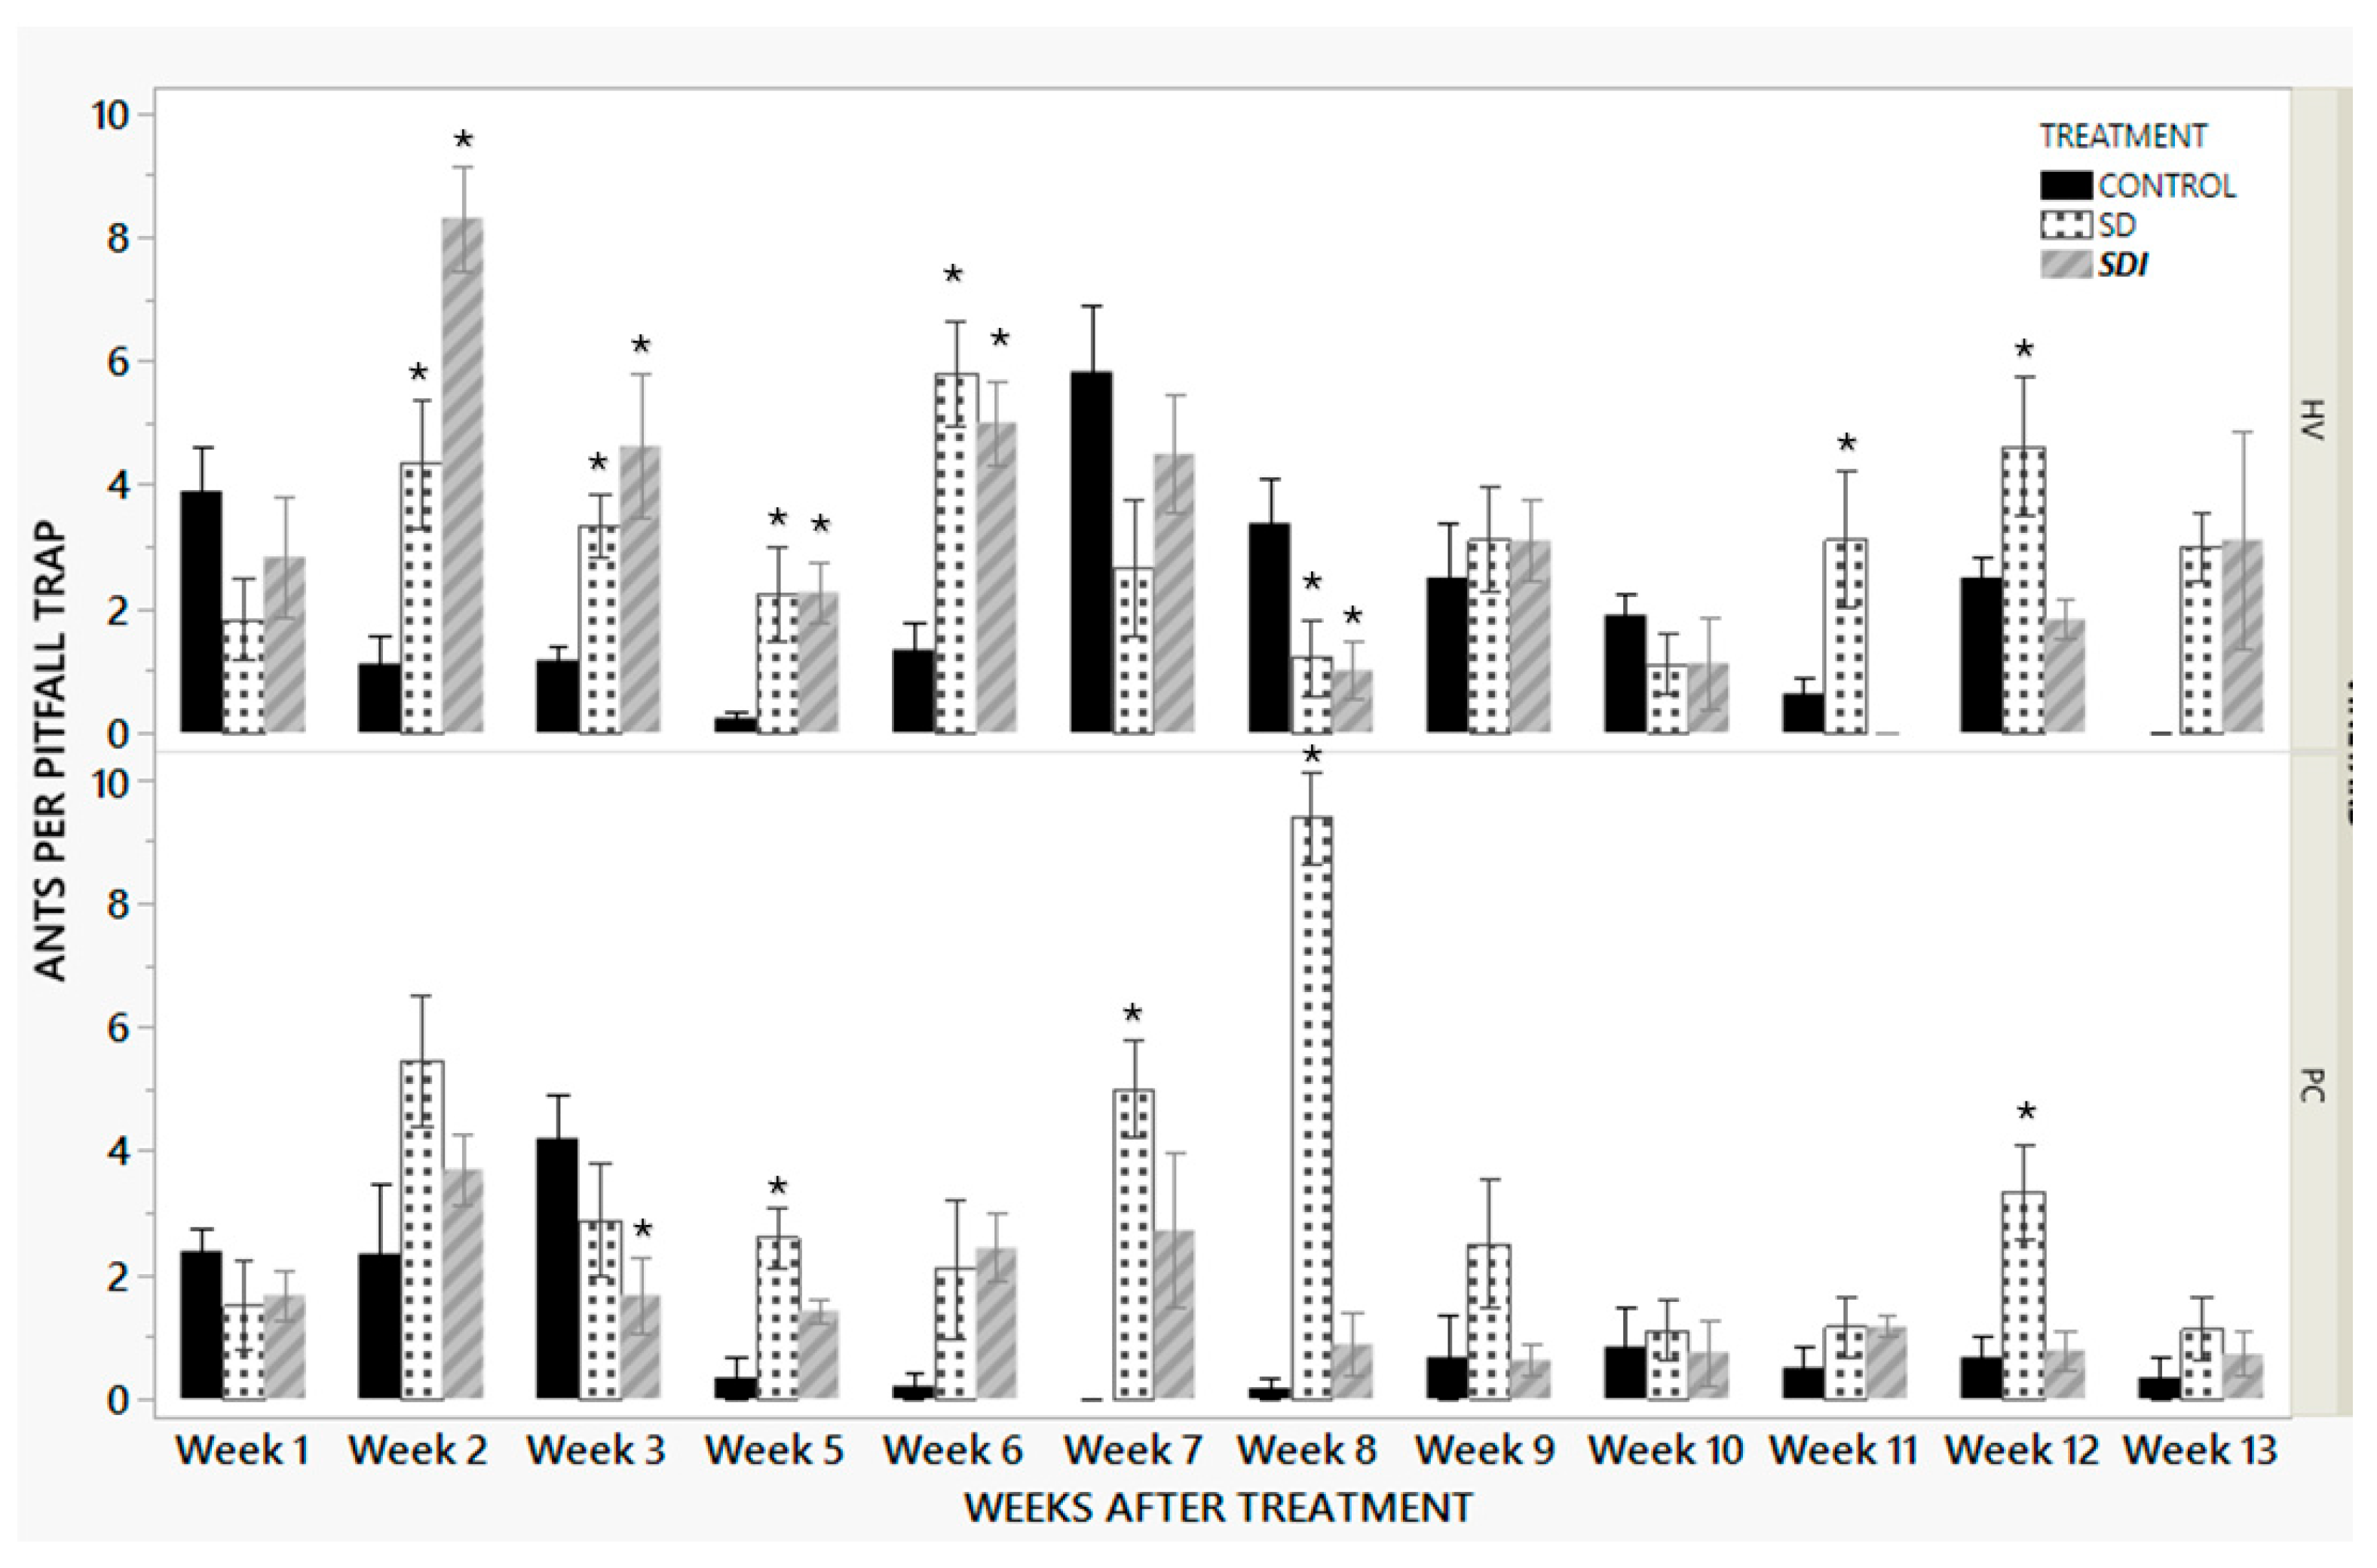
Figure 7.
Mean (+SEM) number of ants captured per minute in different treatments (Treatment: control= untreated check, SDI=sugar dispenser with insecticide (1% disodium octaborate tetrahydrate), SD=sugar dispenser with 25% sucrose solution) throughout the sampling season in vineyards HV (Orange County, Virginia) and PC (Fauquier County, VA). Dates on X-axis are weeks after treatment (number of weeks after placement of treatment or dispensers).
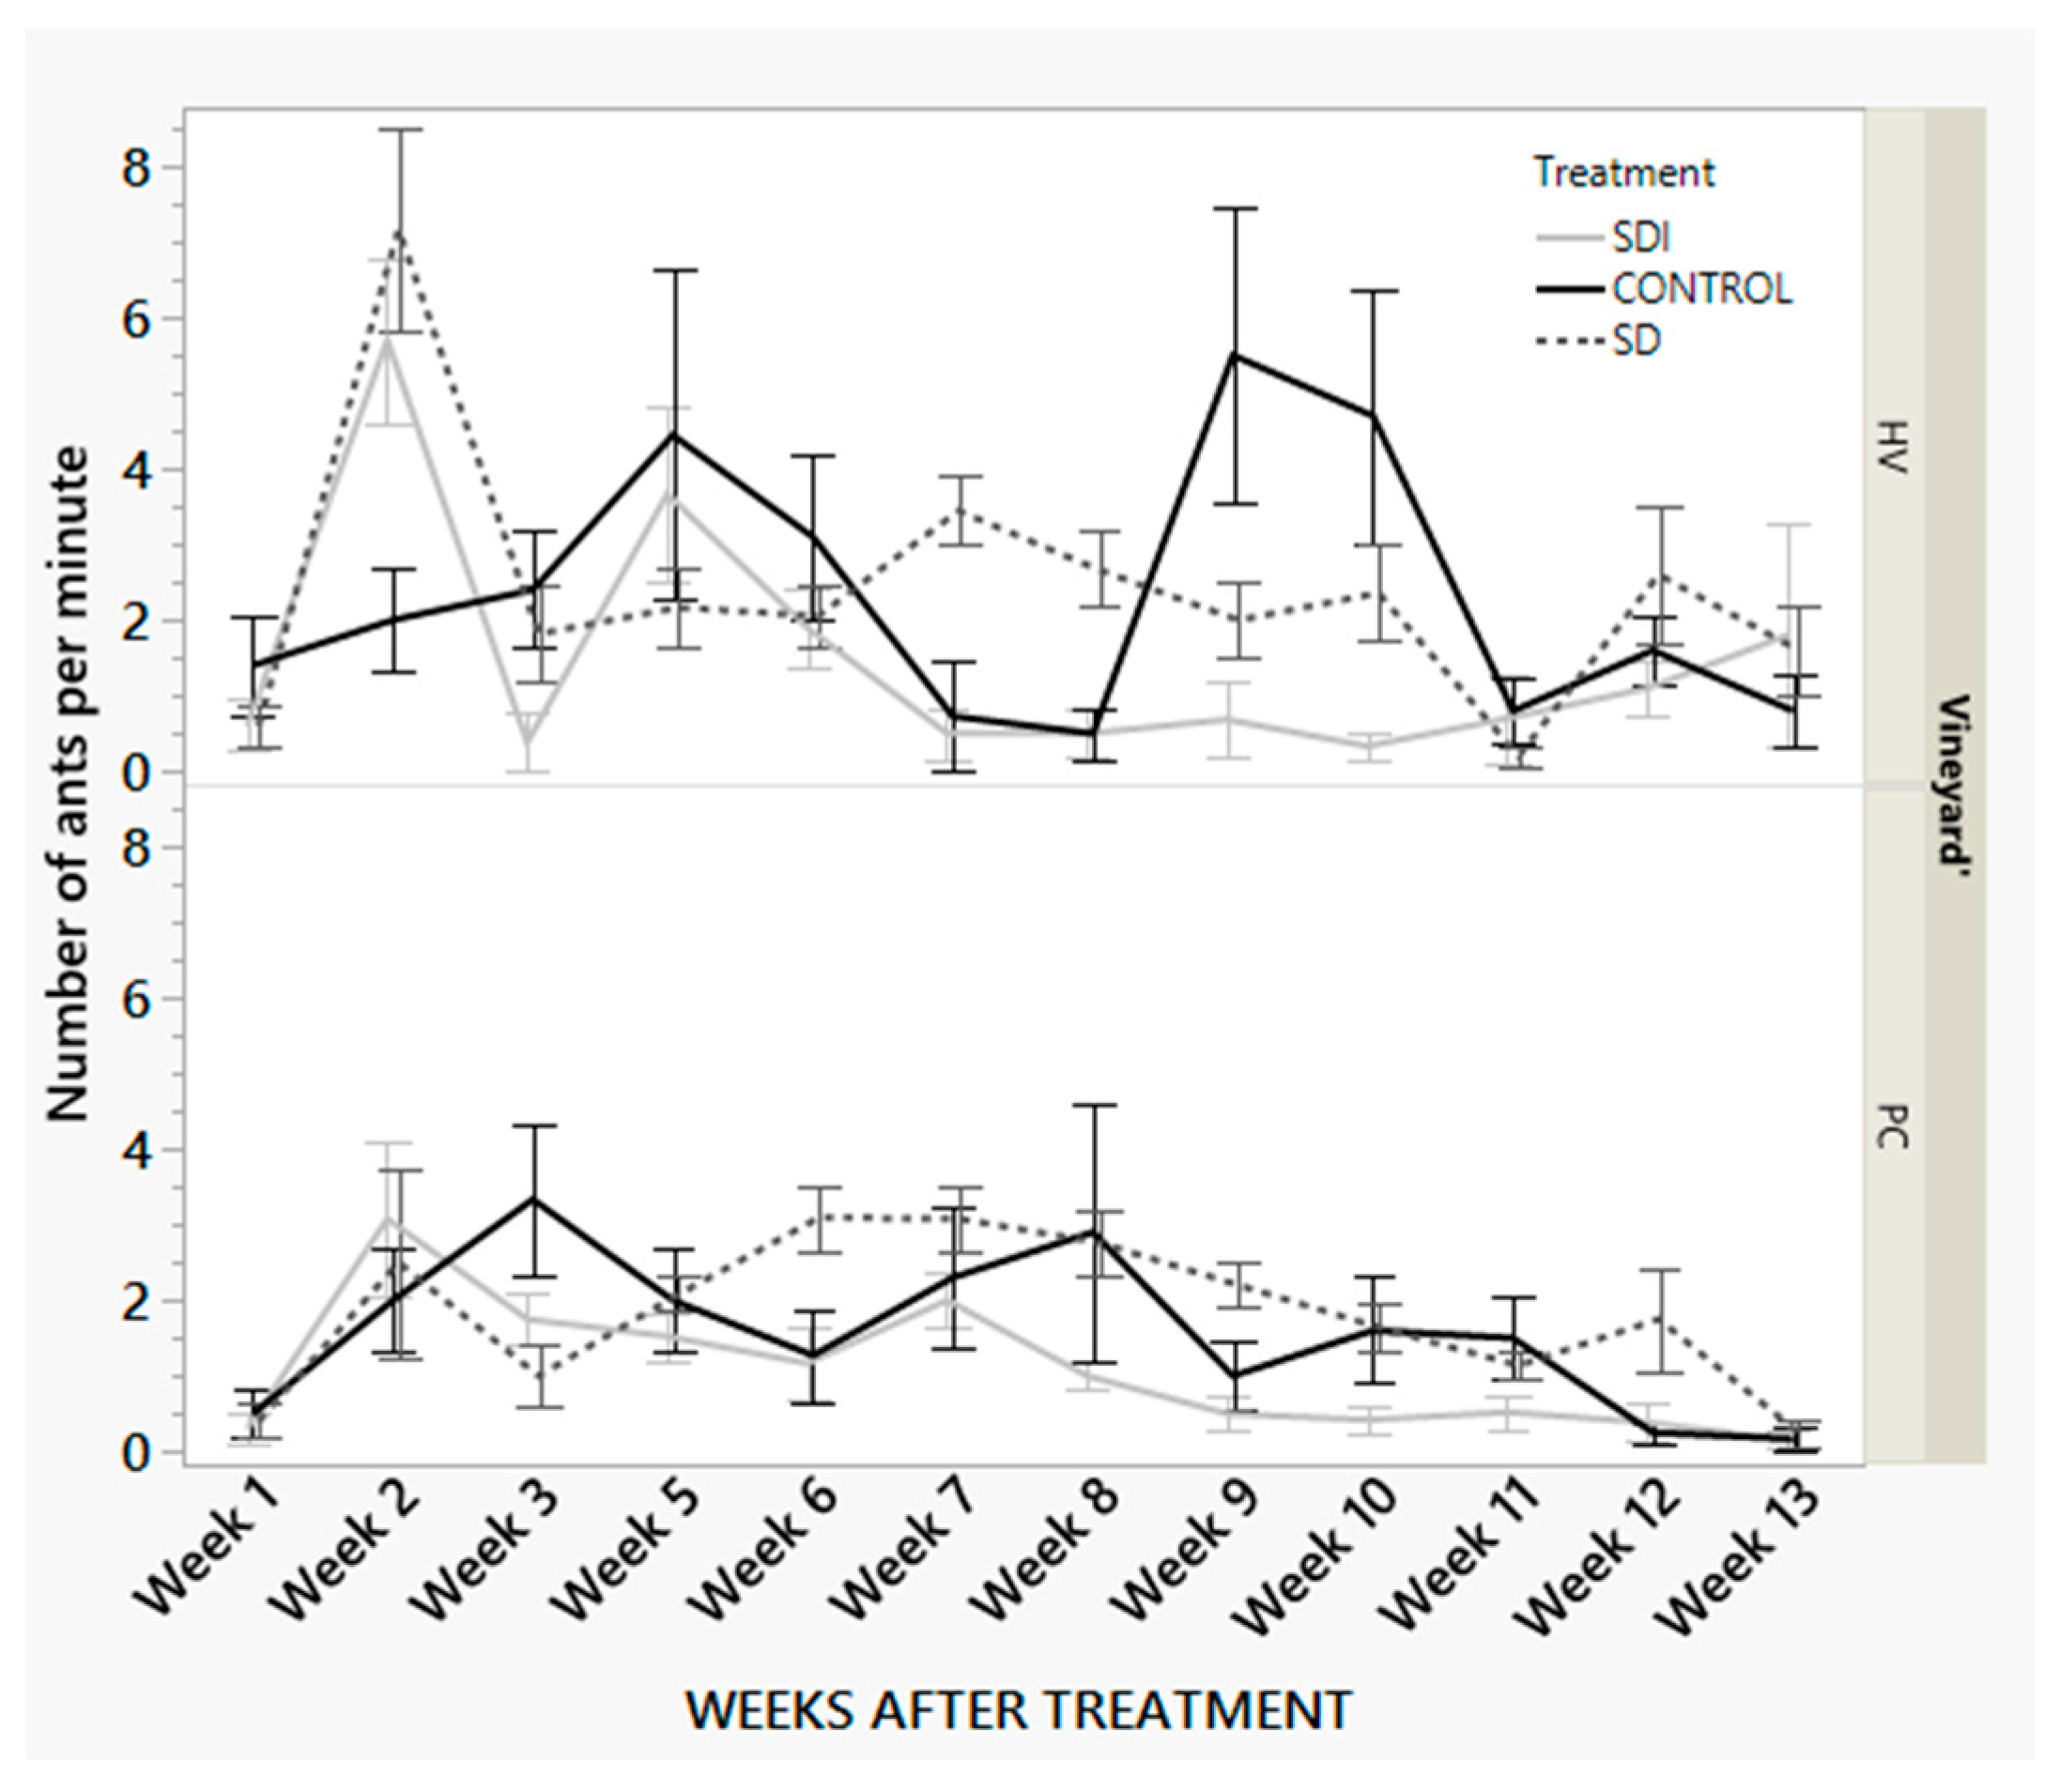
Figure 8.
Mean number of ants captured per minute in different treatments (Treatment: control= untreated check, SDI=sugar dispenser with insecticide, SD=sugar dispenser with 25% sucrose solution) throughout the sampling season in vineyards HV (Orange County, Virginia) and PC (Fauquier County, VA). * Indicates significant difference in data in comparison to the control.
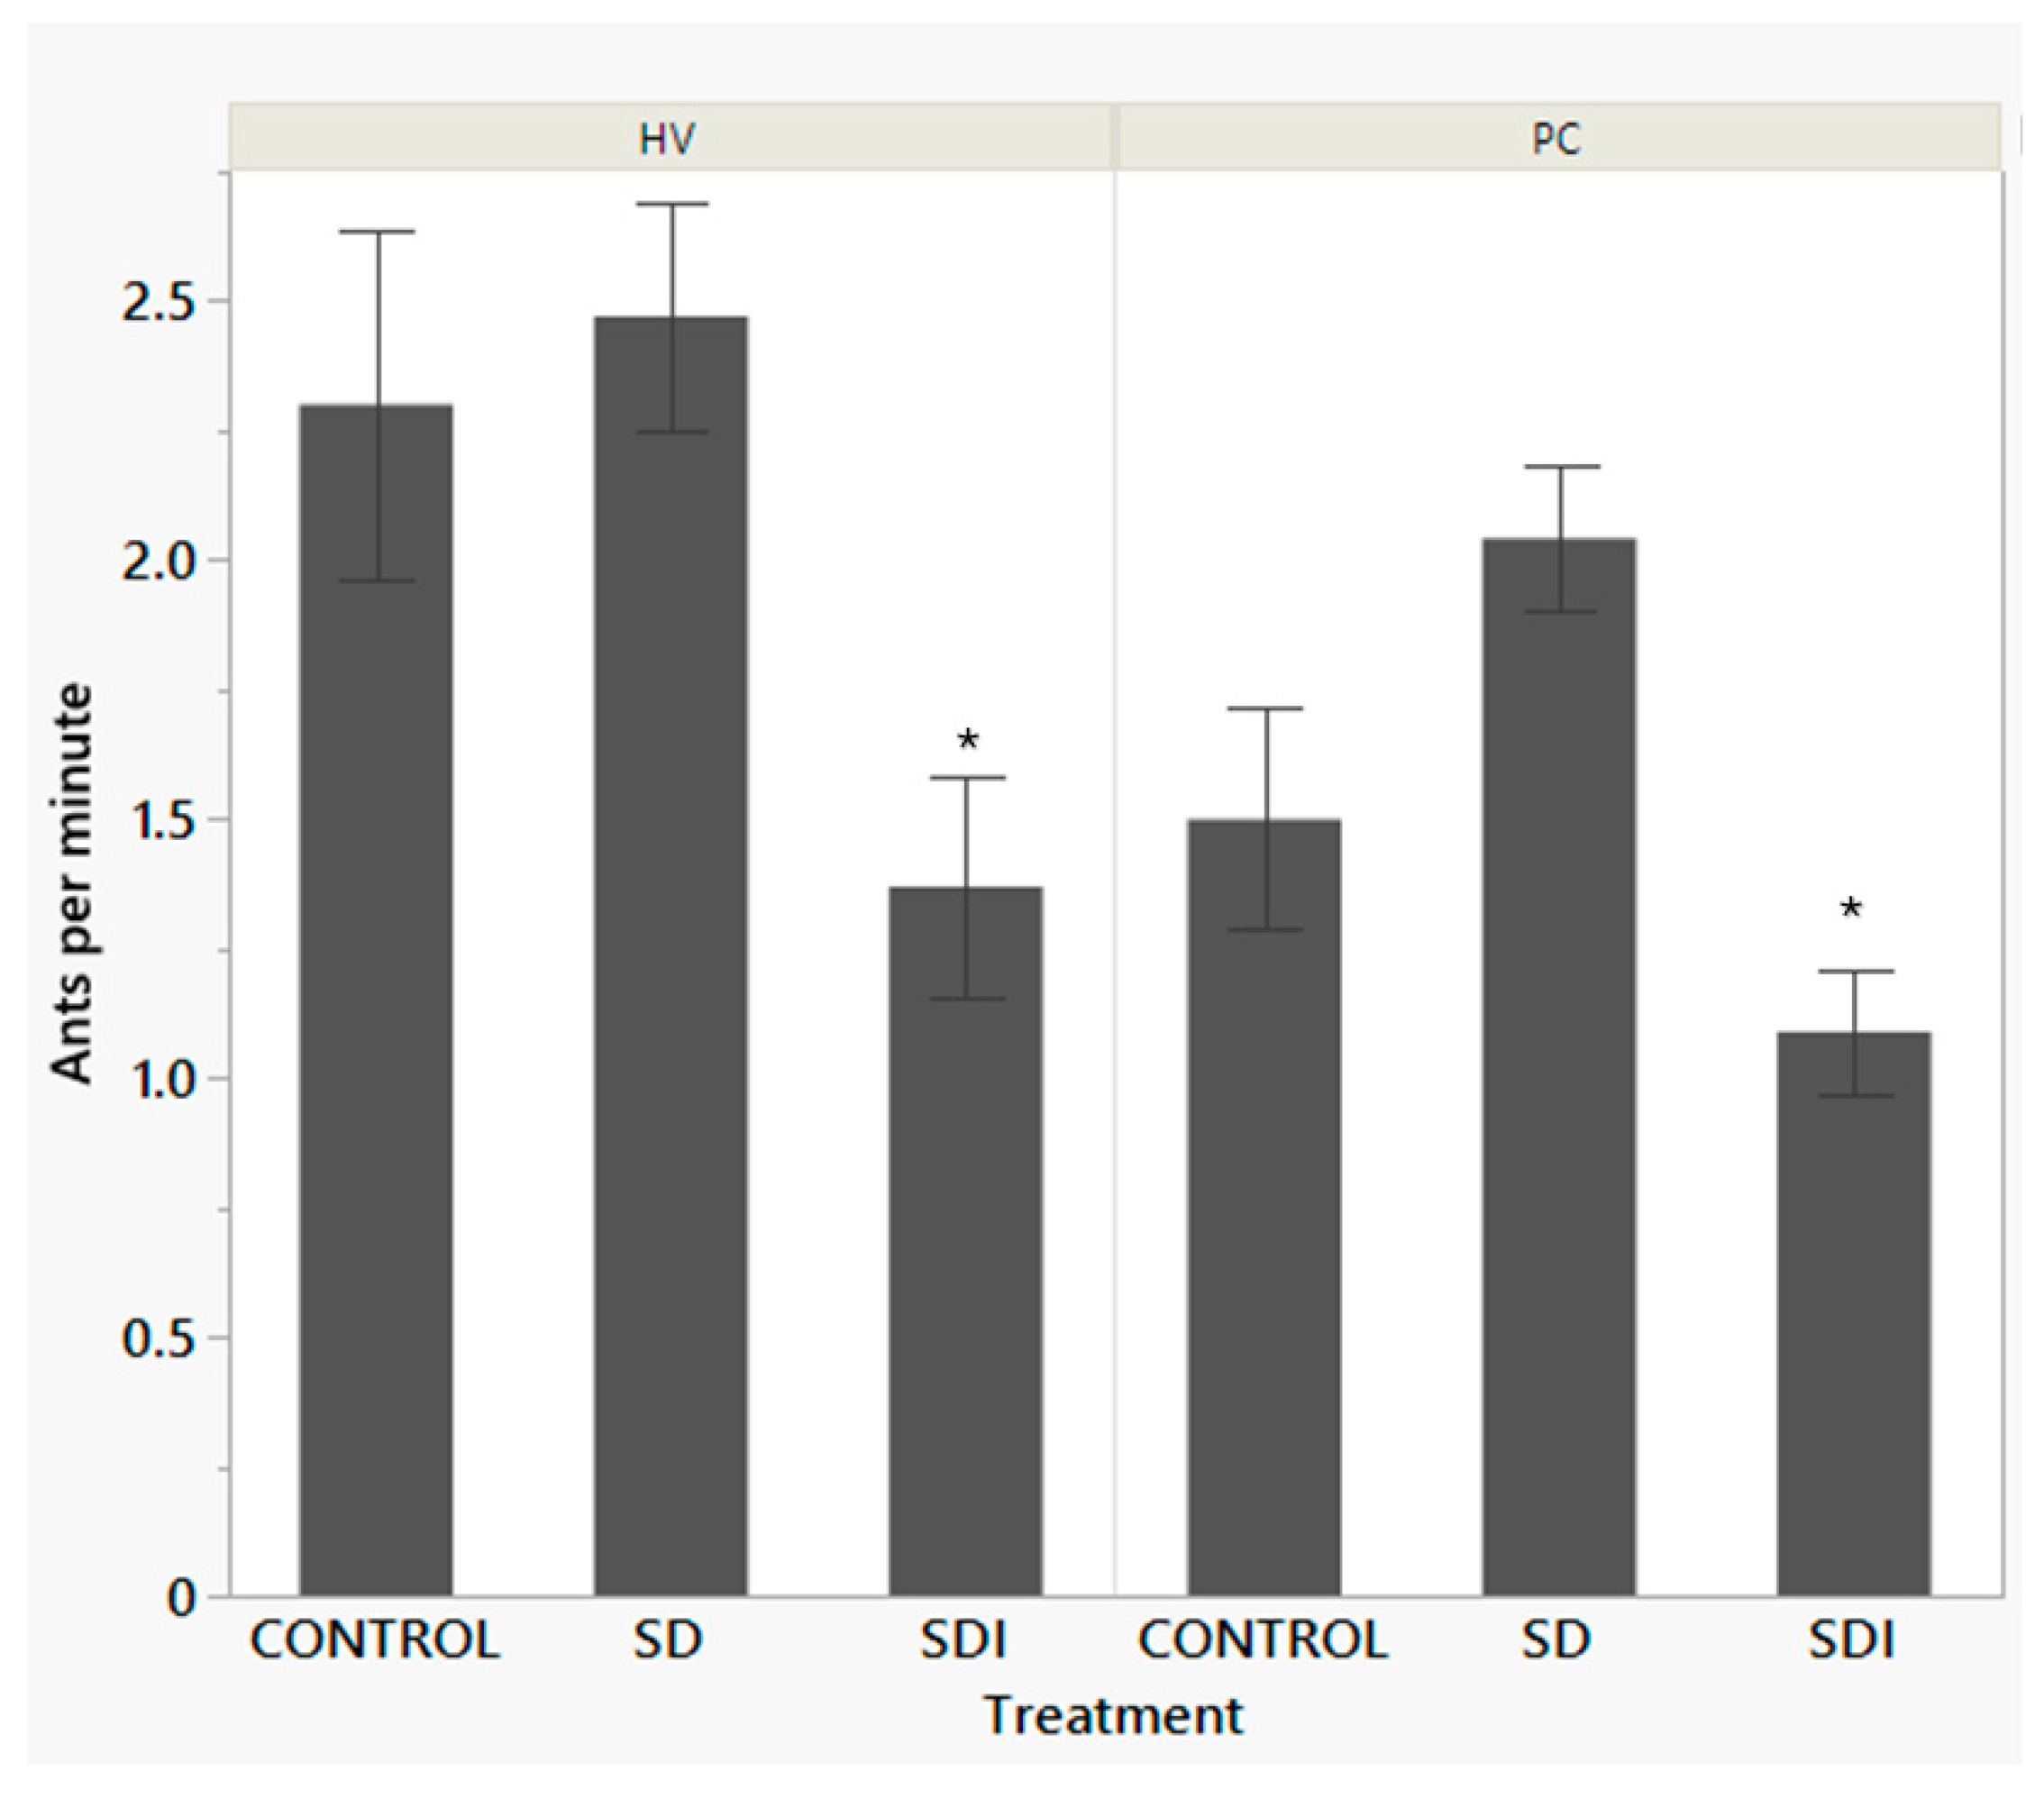
Figure 9.
Weekly mean numbers of ants captured per minute in different treatments (Treatment: control= untreated check, SDI=sugar dispenser with insecticide, SD=sugar dispenser with 25% sucrose solution) throughout the sampling season in vineyards HV (Orange County, Virginia) and PC (Fauquier County, VA). * Indicates significant difference in data in comparison to the control.
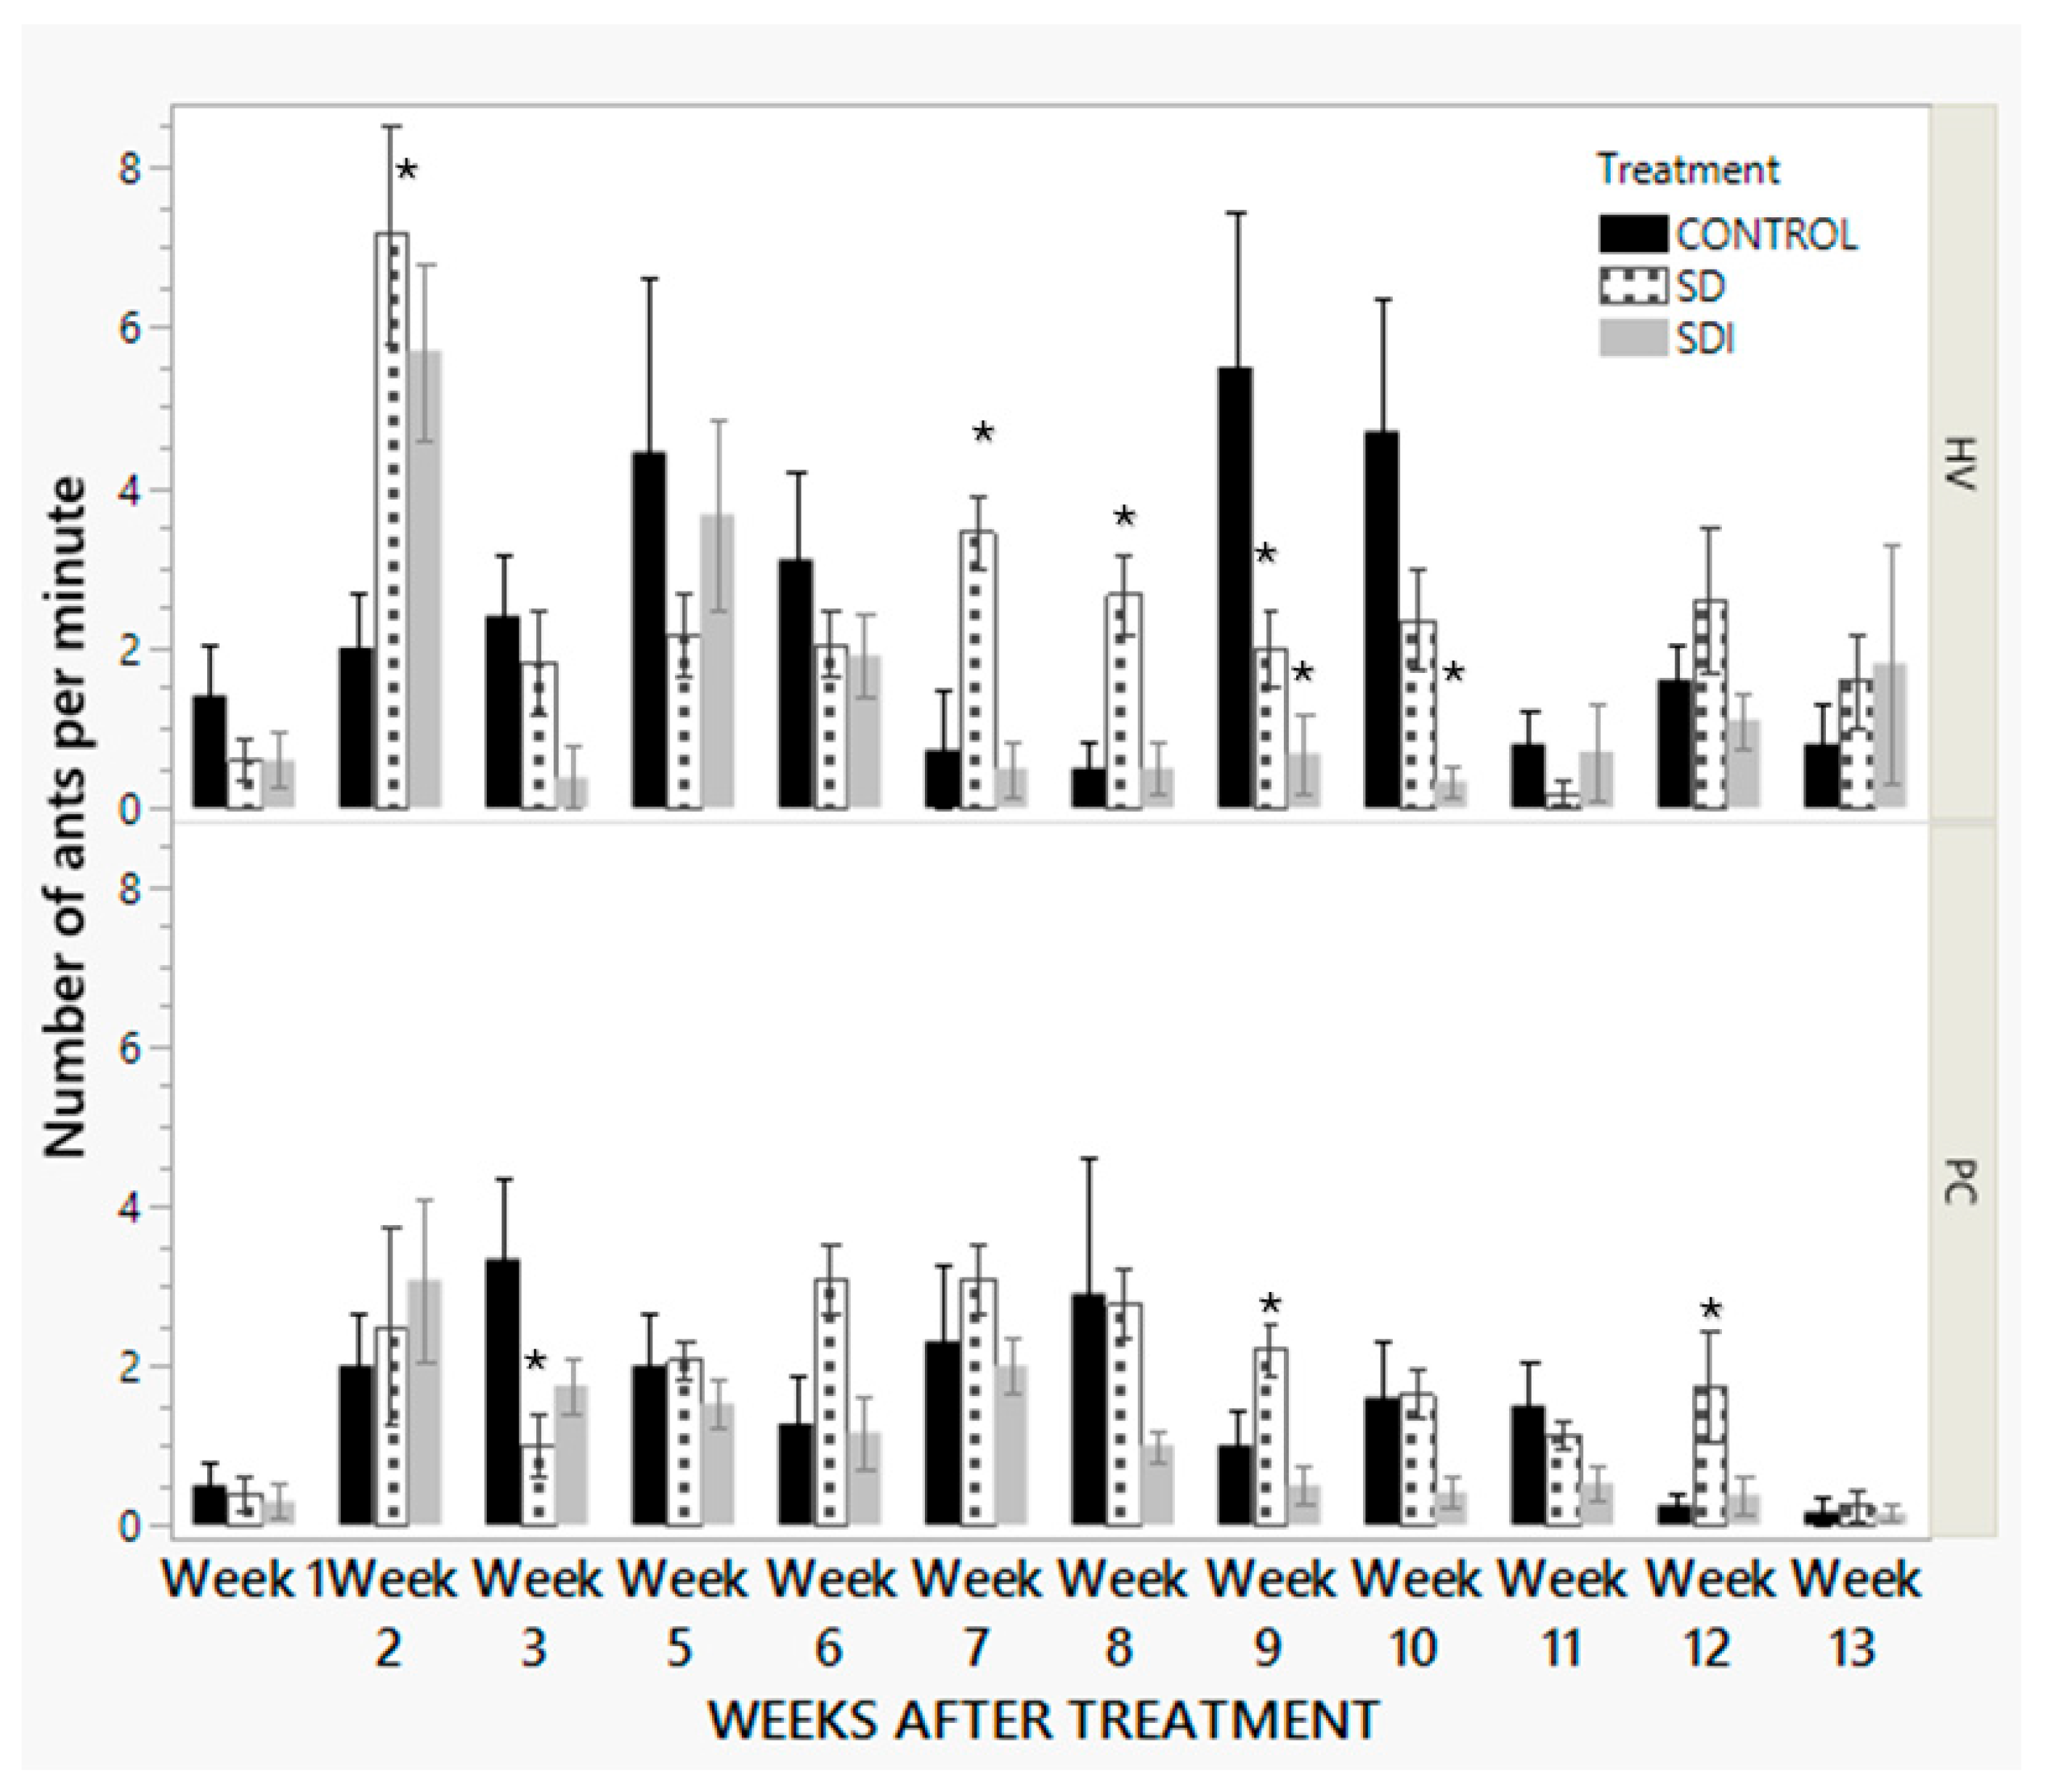
Figure 10.
Percentage of grape clusters infested in two vineyards (HV and PC). Each error bar is constructed using 1 standard error from the mean. Three treatments: 1. Control without any dispensers 2. Sugar dispensers with only sucrose solution (SD), and 3. Sugar dispensers with insecticide (SDI).
Figure 10.
Percentage of grape clusters infested in two vineyards (HV and PC). Each error bar is constructed using 1 standard error from the mean. Three treatments: 1. Control without any dispensers 2. Sugar dispensers with only sucrose solution (SD), and 3. Sugar dispensers with insecticide (SDI).
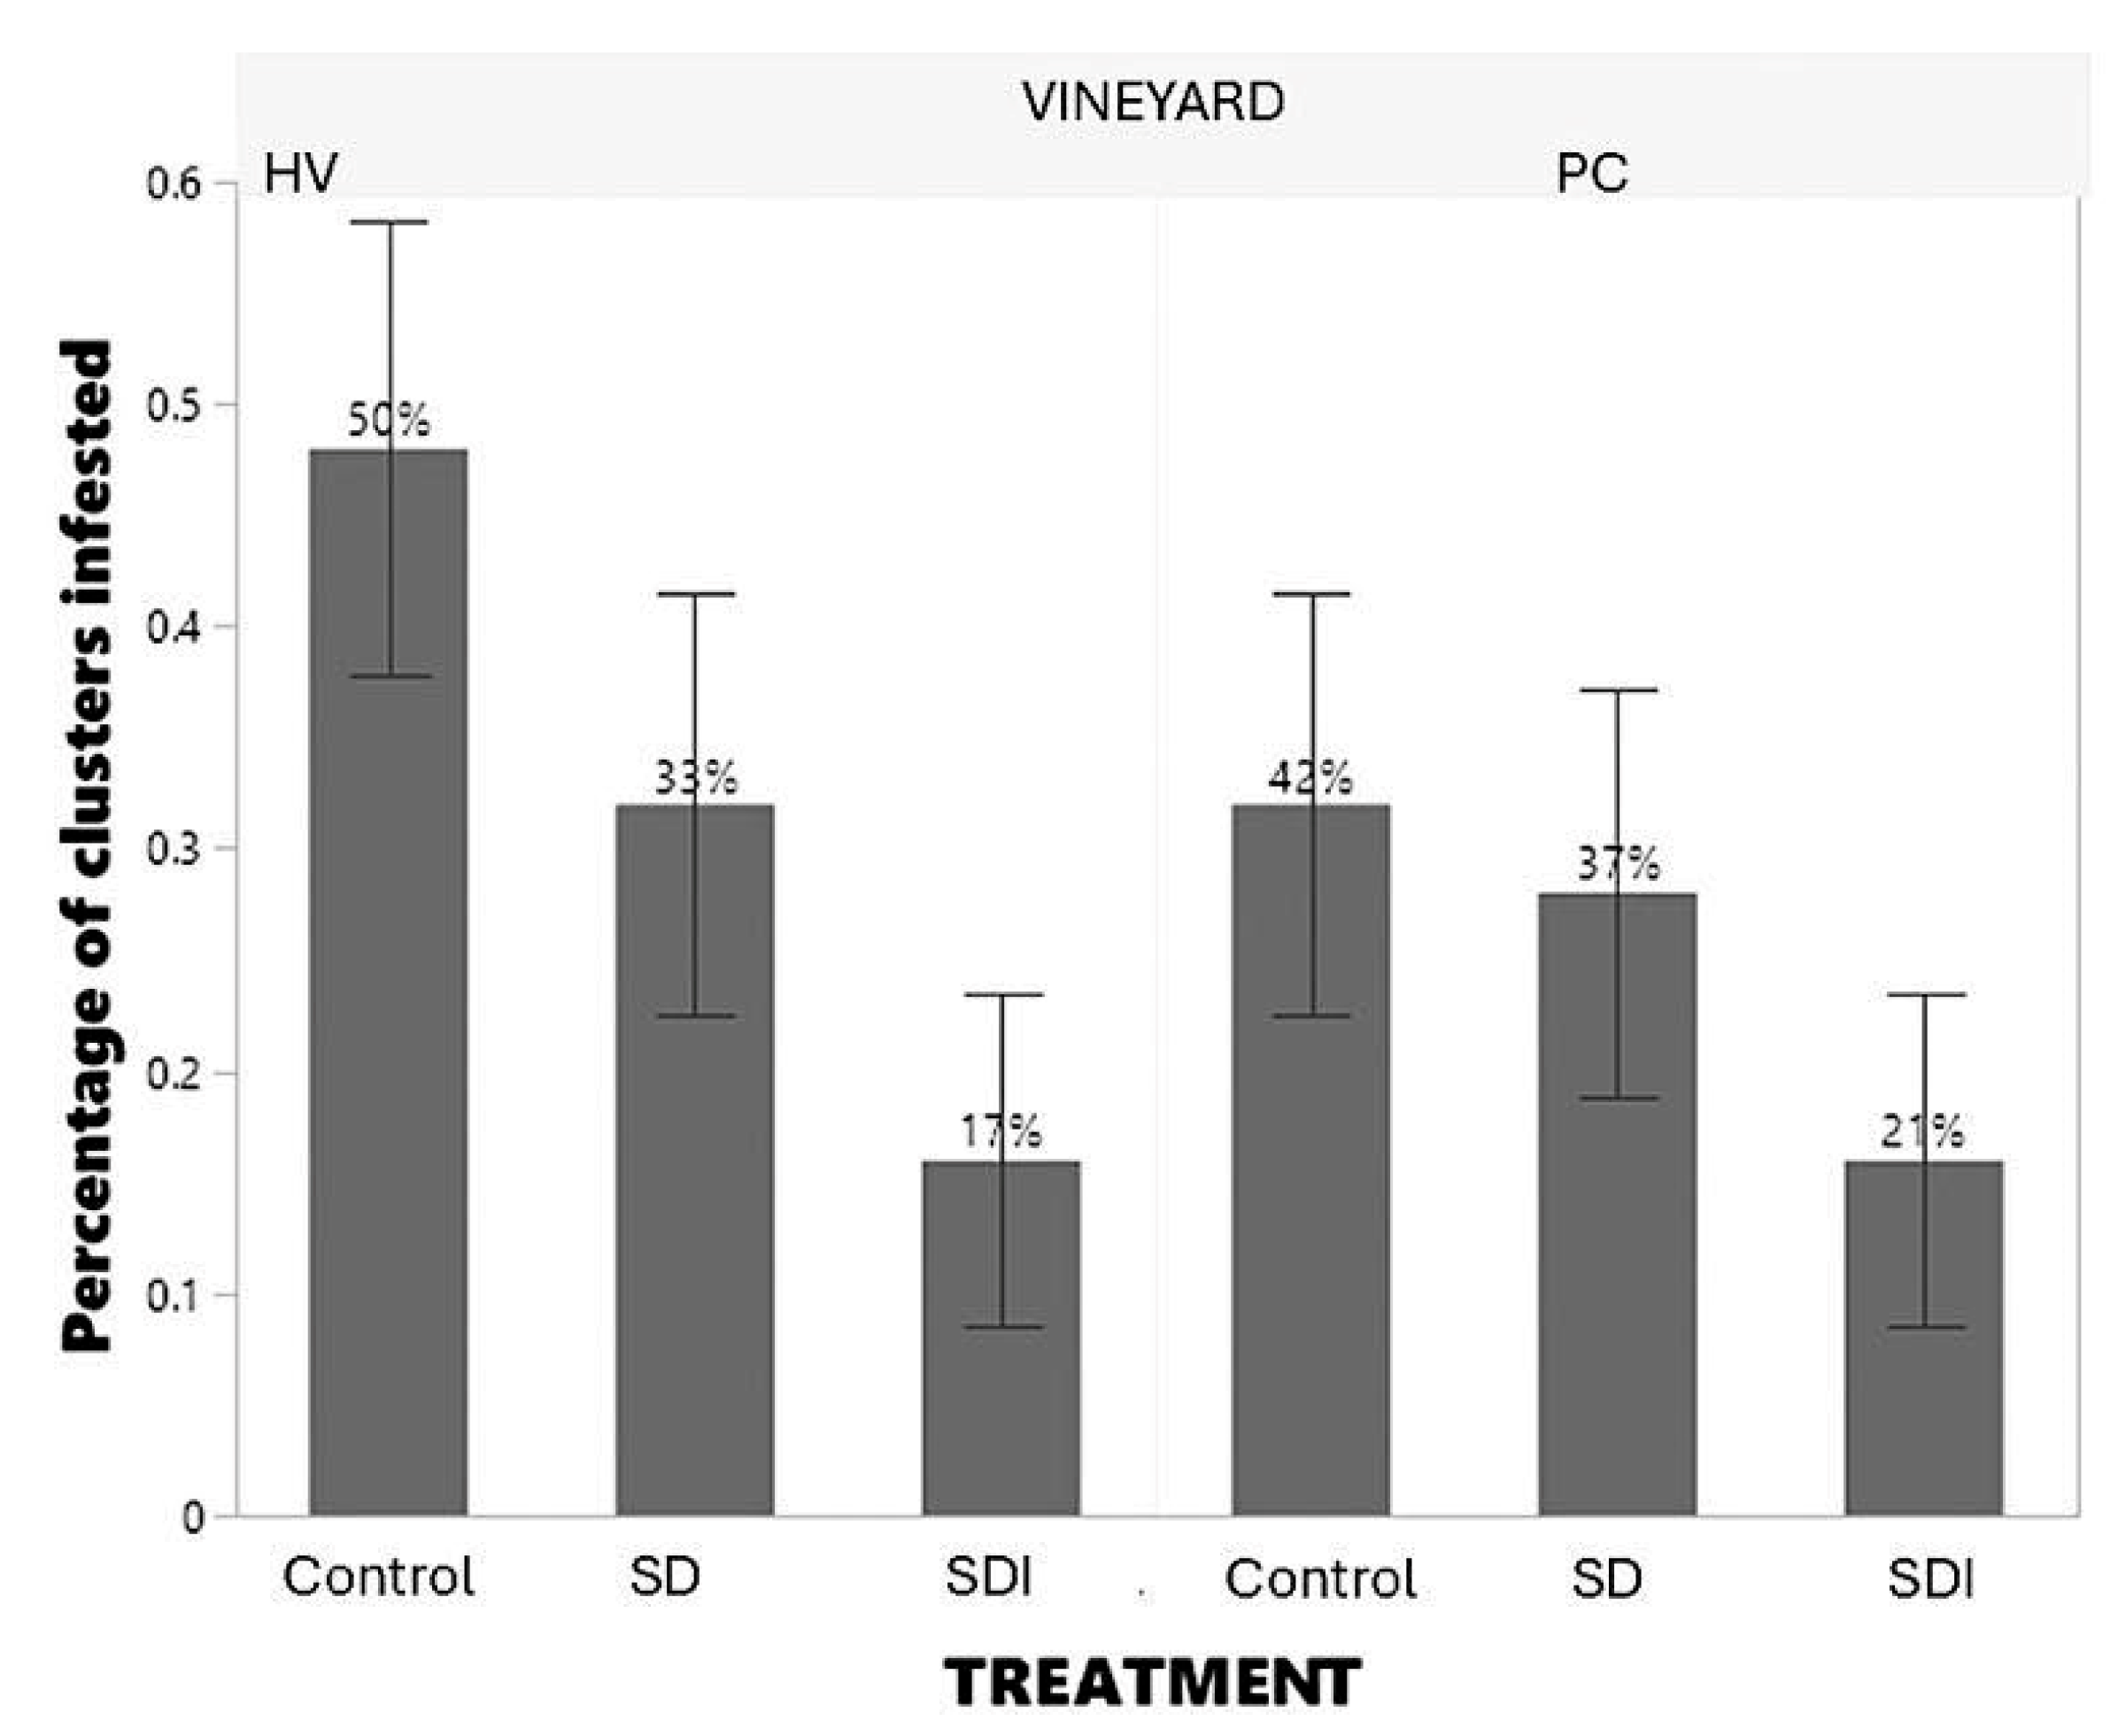
Figure 11.
Scatterplot matrix showing correlation in vineyard PC for treatments: a. Control without any dispensers; b. Sugar dispensers without insecticide and c. Sugar dispensers with insecticide.
Figure 11.
Scatterplot matrix showing correlation in vineyard PC for treatments: a. Control without any dispensers; b. Sugar dispensers without insecticide and c. Sugar dispensers with insecticide.
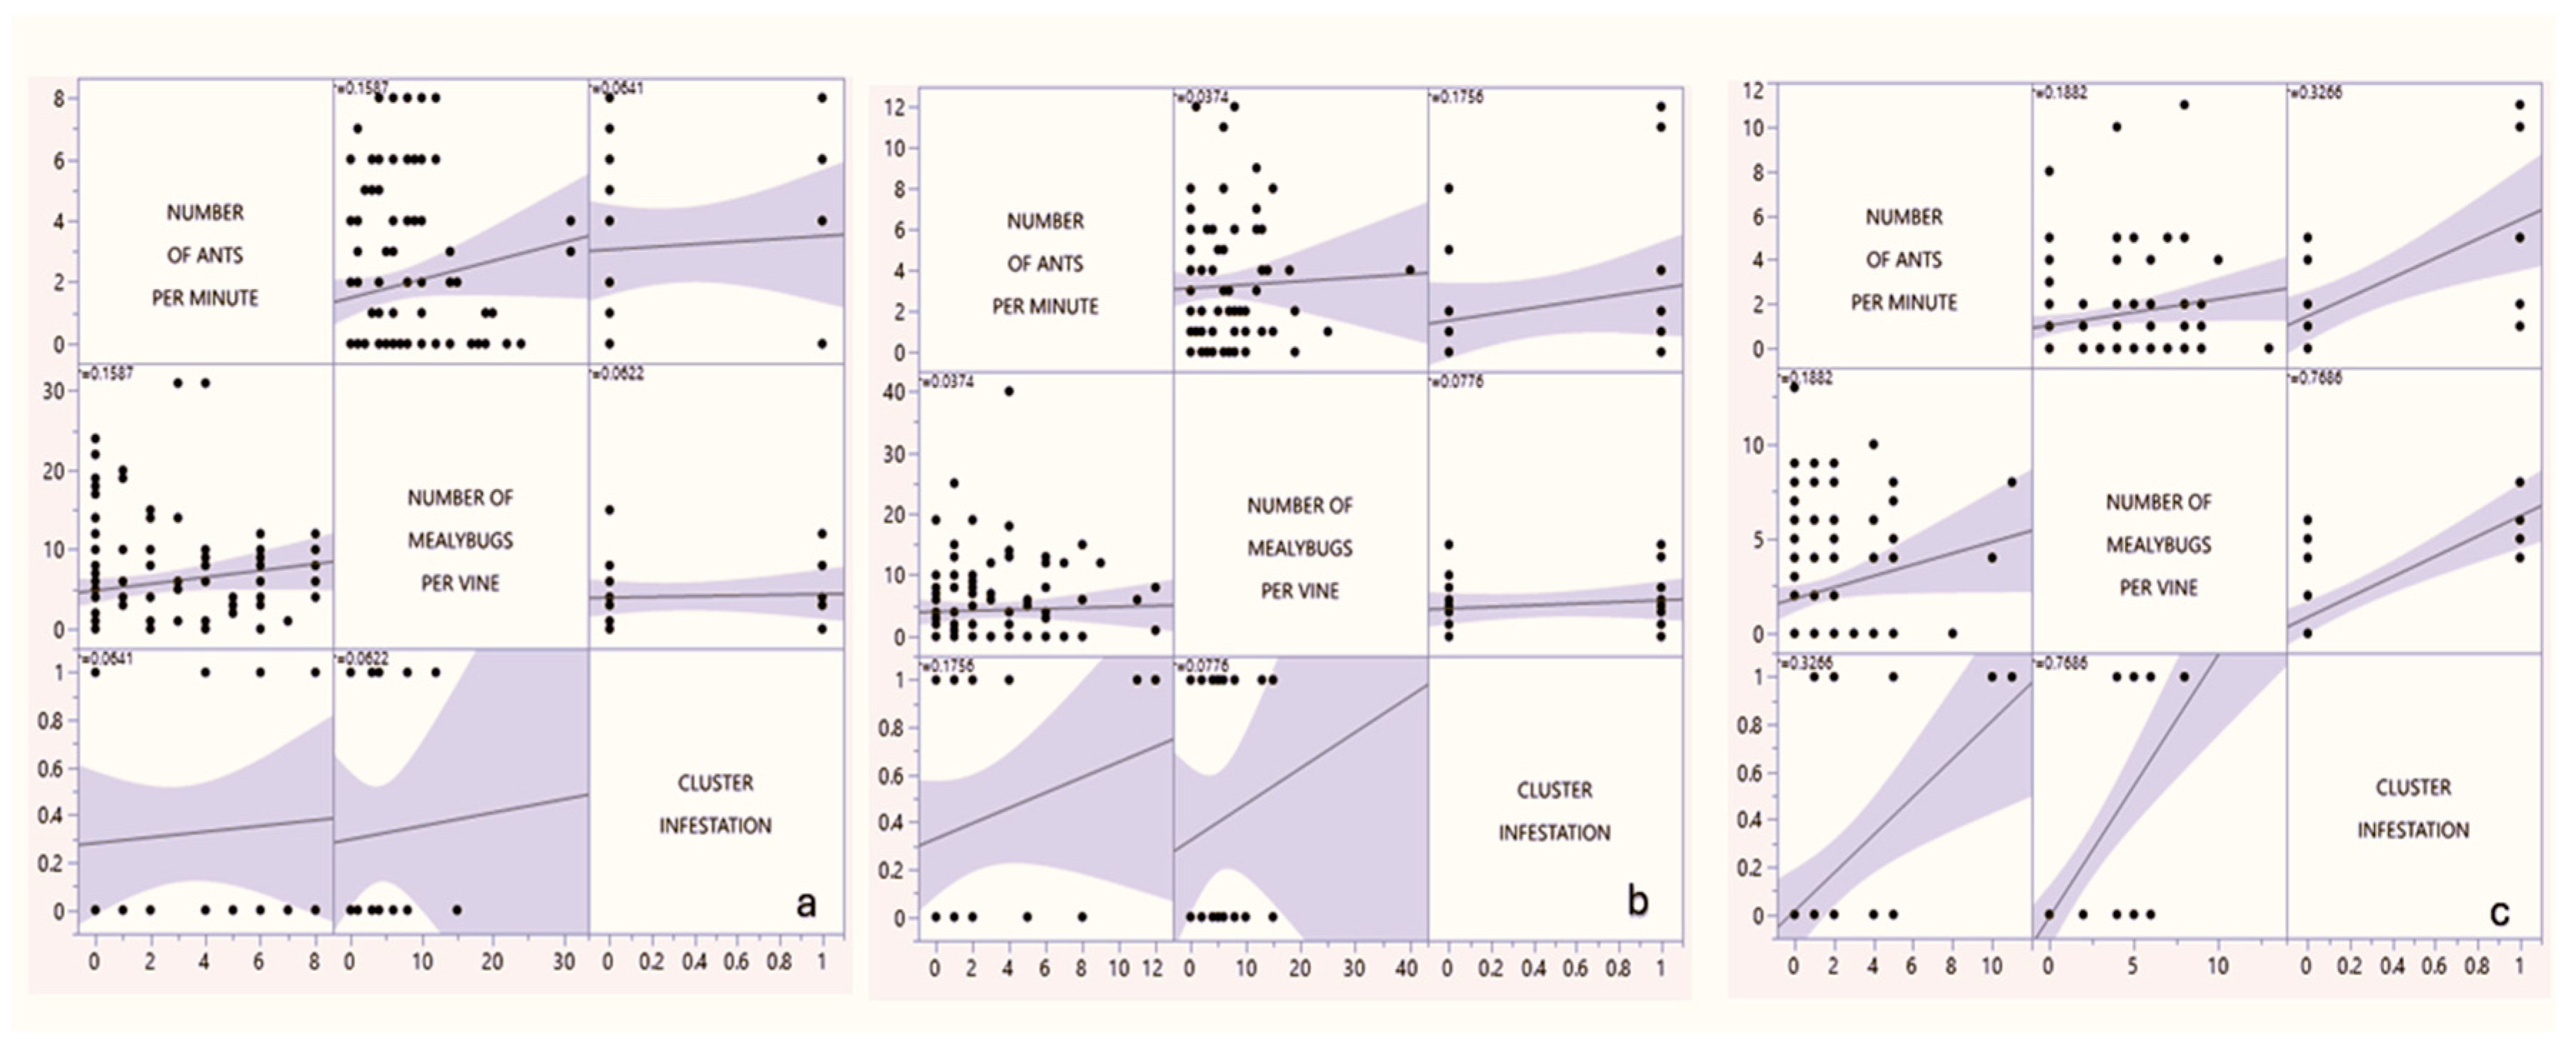
Figure 12.
Scatterplot matrix showing correlation in vineyard HV for treatments: a. Control without any dispensers; b. Sugar dispensers without insecticide and c. Sugar dispensers with insecticide.
Figure 12.
Scatterplot matrix showing correlation in vineyard HV for treatments: a. Control without any dispensers; b. Sugar dispensers without insecticide and c. Sugar dispensers with insecticide.
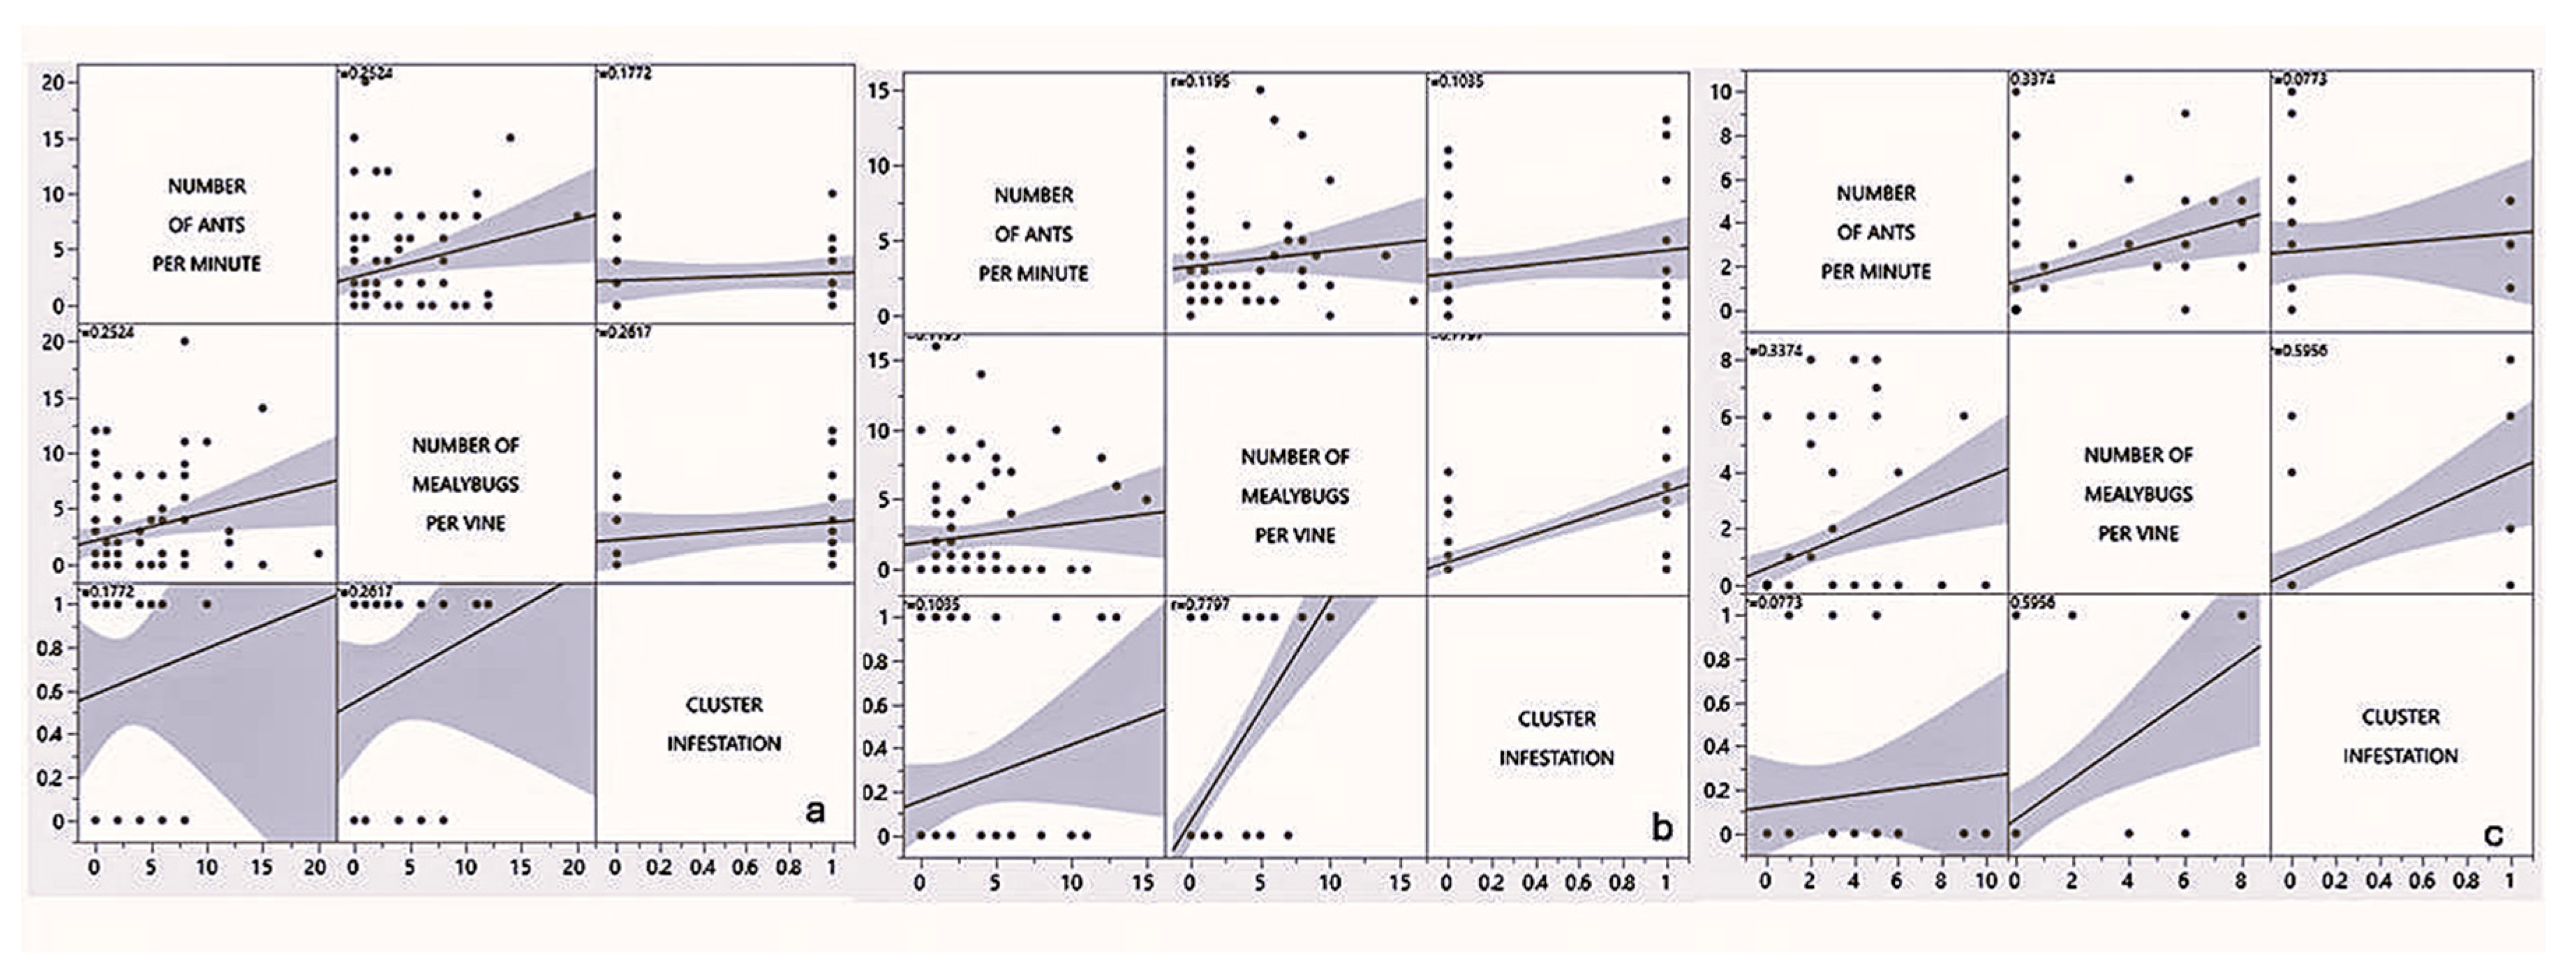

Table 1.
Factor effects in the two-way ANOVA analyzed on the average number of ants recorded from the pitfall traps (α=0.05).
Table 1.
Factor effects in the two-way ANOVA analyzed on the average number of ants recorded from the pitfall traps (α=0.05).
| Factor | Nparm | DF | F | p |
|---|---|---|---|---|
| Treatment | 2 | 2 | 20.52 | <0.0001 |
| Weeks after Treatment | 11 | 11 | 9.28 | <0.0001 |
| Vineyard | 1 | 1 | 16.19 | <0.0001 |
| Vineyard*Weeks after treatment | 11 | 11 | 2.94 | 0.0008 |
| Treatment*Weeks after treatment | 22 | 22 | 3.34 | <0.0001 |
Table 2.
Effects of treatments on the average number of ants recorded from the pitfall traps using Tukey HSD all pairwise comparisons (α=0.05).
Table 2.
Effects of treatments on the average number of ants recorded from the pitfall traps using Tukey HSD all pairwise comparisons (α=0.05).
| Treatment | mean±SE | Treatment Comparison | t-Ratio | P |
|---|---|---|---|---|
| Control | 1.68±0.176 | Control-SD | -6.38 | <0.0001 |
| Sugar dispenser without insecticide (SD) | 3.2±0.167 | Control-SDI | -2.89 | 0.0112 |
| Sugar dispenser with insecticide (SDI) | 2.56±0.168 | SD-SDI | 3.58 | 0.0011 |
Table 3.
Effects of treatments on the average number of ants recorded from the pitfall traps using Tukey HSD all pairwise comparisons (α=0.05).
Table 3.
Effects of treatments on the average number of ants recorded from the pitfall traps using Tukey HSD all pairwise comparisons (α=0.05).
| Vineyard | Treatment | mean±SE | Treatment Comparison | t-Ratio | P |
|---|---|---|---|---|---|
| HV | Control | 1.68±0.176 | Control-SD | -6.38 | <0.0001 |
| Sugar dispenser without insecticide (SD) | 3.2±0.167 | Control-SDI | -2.89 | 0.0112 | |
| Sugar dispenser with insecticide (SDI) | 2.56±0.168 | SD-SDI | 3.58 | 0.0011 | |
| PC | Control | 1.21±0.241 | Control-SD | -6.72 | <0.0001 |
| Sugar dispenser without insecticide (SD) | 3.4±0.205 | Control-SDI | -1.54 | 0.2729 | |
| Sugar dispenser with insecticide (SDI) | 1.76±0.209 | SD-SDI | 5.59 | <0.0001 |
Table 4.
Factor effects in the two-way ANOVA analyzed on the average number of ants recorded from the 1-minute visual count (α=0.05).
Table 4.
Factor effects in the two-way ANOVA analyzed on the average number of ants recorded from the 1-minute visual count (α=0.05).
| Factor | Nparm | DF | F | P |
|---|---|---|---|---|
| Treatment | 2 | 2 | 13.45 | <0.0001 |
| Weeks after Treatment | 11 | 11 | 9.71 | <0.0001 |
| Vineyard | 1 | 1 | 11.23 | 0.0008 |
| Vineyard*Weeks after treatment | 11 | 11 | 3.82 | <0.0001 |
| Treatment*Weeks after treatment | 22 | 22 | 3.10 | <0.0001 |
Table 5.
Effects of treatments on the average number of ants recorded from 1-minute visual count using Tukey HSD all pairwise comparisons (α=0.05).
Table 5.
Effects of treatments on the average number of ants recorded from 1-minute visual count using Tukey HSD all pairwise comparisons (α=0.05).
| Treatment | mean±SE | Treatment Comparison | t-Ratio | P |
|---|---|---|---|---|
| Control | 1.93±0.146 | Control-SD | -1.08 | 0.5256 |
| Sugar dispenser without insecticide (SD) | 2.143±0.128 | SDI-Control | -3.57 | 0.0011 |
| Sugar dispenser with insecticide (SDI) | 1.237±0.129 | SDI-SD | -5.00 | <0.0001 |
Table 6.
Effects of treatments on the average number of ants recorded from 1-minute visual count using Tukey HSD all pairwise comparisons (α=0.05).
Table 6.
Effects of treatments on the average number of ants recorded from 1-minute visual count using Tukey HSD all pairwise comparisons (α=0.05).
| wi | Treatment | mean±SE | Treatment Comparison | t-Ratio | P |
|---|---|---|---|---|---|
| HV | Control | 2.33±0.243 | Control-SD | -0.18 | 0.98 |
| Sugar dispenser without insecticide (SD) | 2.39±0.224 | Control-SDI | 2.57 | 0.028 | |
| Sugar dispenser with insecticide (SDI) | 1.49±0.219 | SD-SDI | 2.87 | 0.0119 | |
| PC | Control | 1.57±0.169 | Control-SD | -1.15 | 0.48 |
| Sugar dispenser without insecticide (SD) | 1.82±0.142 | Control-SDI | 2.22 | 0.069 | |
| Sugar dispenser with insecticide (SDI) | 1.06±0.150 | SD-SDI | 3.66 | 0.0008 |
Disclaimer/Publisher’s Note: The statements, opinions and data contained in all publications are solely those of the individual author(s) and contributor(s) and not of MDPI and/or the editor(s). MDPI and/or the editor(s) disclaim responsibility for any injury to people or property resulting from any ideas, methods, instructions or products referred to in the content. |
© 2026 by the authors. Licensee MDPI, Basel, Switzerland. This article is an open access article distributed under the terms and conditions of the Creative Commons Attribution (CC BY) license (http://creativecommons.org/licenses/by/4.0/).
Copyright: This open access article is published under a Creative Commons CC BY 4.0 license, which permit the free download, distribution, and reuse, provided that the author and preprint are cited in any reuse.


