
Submitted:
20 February 2025
Posted:
20 February 2025
You are already at the latest version
Abstract
The continuous monitoring of radioactivity in a cabled subsea network in the North Sea Observatory was performed to test the performance of a medium resolution underwater spectrometer as well as to identify and to assess potential anthropogenic and/or natural hazards. The effectiveness of continuous monitoring is tested together with the operability of underwater sensor and optimized quantification methods to iden-tify the type of the radioactivity as well as the activity concentration of radionuclides in the seawater. In the frame of RADCONNECT project, the medium resolution underwater radioactivity system named GeoMAREA was integrated in an existing cabled ocean observatory placed in Helgoland Island (COSYNA network). The system operated in an online mode controlled by the operational Centre (AWI) as well as remotely from the end-user (HCMR). The system provided gamma-ray spectra and activity concentrations of key radionuclides that were enriched in seawater during the monitoring period. As con-cerns the quantification method of natural radioactivity, the average activity concentration (in terms of the total monitoring period) of 214Bi, 208Tl, 228Ac and 40K, was found 108 ± 30, 57 ± 14, 40 ± 5 and 9800 ± 500 Bqm-3, respectively. As concerns the quantification of 137Cs, the average activity concentration in terms of the total monitoring period (although it is uncertain) was found 6 ± 4 Bqm-3. The data analysis proved that the system had a stable operation in terms of voltage stability so that all acquired spectra could be summed up efficiently in time to produce statistically high gamma-ray spectra for further analy-sis.
Keywords:
in-situ sensors
; cabled observatory
; ocean radioactivity
; sensor integration
; seawater
; Helgoland
1. Introduction
The detection of hazardous materials and the related monitoring systems express high technological and scientific interest in the last decades for the identification of contaminants in the oceans using direct and lab-based methods. The direct method gives rapidly the state of the studied marine area, but the available detectors are limited for the underwater operations and can’t be integrated in existing platforms. Indicatively, past and recent review information related to in-situ applications in the ocean enabling in-situ sensors is presented in detail in literature [1,2,3,4].
The identification and monitoring of ionizing radiation (alpha particles, beta particles, gamma rays, and X-rays) and neutrons in the marine environment, through detection systems exhibits many difficulties due to the ocean conditions as well as due to the absorption of the radiation in the water. In the last years, a lot of effort has been made to monitor the gamma-ray intensity in the seawater, enabling smart systems and methods. Very briefly, the continuous monitoring of radioactivity in the ocean is performed by integrating underwater in-situ sensors in fixed stations such as buoys and landers [5,6] as well as in mobile units [7,8].
During the last years, a lot of effort has been made to understand the distribution and change of oceanic rainfall patterns as a major component of global/regional water cycle and climate change. The most commonly implemented instruments to measure rainfall are rain gauges, together with other in-situ underwater sensors (such as gamma-ray intensity of radionuclides). As concerns the radioactivity measurement in the sea, radon progenies are observed after and during a rainfall event[4,9]. Radon (222Rn with half life 3.825 d) is a noble gas and is found in aerosol particles in accumulation-mode. Radon progenies are transported from the atmosphere to the sea surface by the scavenging processes of rainfall, and it can be observed after rainfall via the short-lived radon daughters (214Bi and 214Pb). The activity concentration of radon progenies (gamma-ray emitters) in the seawater or sediments can be detected via 214Bi and 214Pb deploying underwater gamma-ray spectrometers in the corresponding matrices. The observed radon concentrations vary with respect to rainfall intensity, rainfall type and humidity.
As concerns artificial radioactivity fallout in the oceans, the crucial radionuclide for continuous monitoring is 137Cs since it is present as a nuclear fission product, it is highly enriched in seawater, has a long half life, and it is monoenergetic and easily detected with gamma-ray spectrometry. All national laboratories provide routine and emergency monitoring of Cs as a key tracer for nuclear incidences. For instance, in the Aegean Sea, many data of 137Cs have been reported to control potential gradients of activity concentration as well as to better define background concentrations [10,11,12,13].
In this work, a new medium resolution underwater spectrometer (named GeoMAREA [16]) was integrated into the Helgoland Underwater Observatory (HUWO) which was founded in the frameworlk of the project COSYNA [17,18]. The system was sending data in near real-time mode every 3 h, providing information related to the activity concentration of gamma-ray emitters in the sea. The deployment of detection system and its integration in the cabled observatory network at the North Sea lasted from 7th of November 2023 until 8th of January 2024. The proposed technology provides an effective autonomous, robust, low-power consumption and cost-effective in-situ radioactivity system enabling real-time measurements of gamma-ray intensity for each gamma-ray emitter present in the seawater. The data analysis provides baseline information regarding potential contaminants originated from anthropogenic activities or natural processes. Furthermore, the method has proven reliable to be utilized for decision-making in case of nuclear accident or nuclear blast. This complementary information will dramatically support existing actions for assessing the state of the sea in the future and national authorities and policymakers to protect humans against potential nuclear incidences.
2. Deployment Site and Accessed Infrastructure
The Helgoland Underwater Observatory (HUWO) (see Figure 1) is located at 54°11′32.3″ N/7°52′42.2″ E (WGS84), about 500 m north of the island of Helgoland, at a depth of 9.7 m (± 0.9 m SD tidal amplitude). The cabled network is owned and maintained by AWI (Alfred Wegener Institute). The area is particularly characterized by strong hydrodynamic forces with average current velocities of 0.5 m s–1 and dominant M2 and S2 tides, allowing the characterization of this area as a hydrodynamically complex ecosystem. Minimum monthly averaged water temperatures of about 3 °C are reached in February and maximum values of about 18 °C in August [19]. Another local feature affecting shallow water habitats and permanently installed measurement technology are wind speeds up to 147 km/h (Climate Data Center). These strong storms occur primarily in autumn and spring and can lead to “groundswell,” where the wave height is greater than the water depth so that the benthic community and technical installations on the seafloor are significantly exposed to strong hydrodynamic forces.
3. Sensor Upgrade and Integration
The GeoMAREA detection system was implemented to provide continuous activity concentration data of gamma-ray emitters enriched in the marine environment in near real-time mode. The GeoMAREA system is an underwater medium resolution spectrometer using a 2” x 2” CeBr3 detection crystal, connected with a photomultiplier tube, a preamplifier, and a power supply unit, together with the electronics for signal amplification, data acquisition and data storage. The details and the application of the system is described elsewhere [16]. The enclosure was designed to offer continuous functionality up to 600 m water depth. The system is designed to be integrated in any stationary platform and cabled network, enabling it to operate in (near) real-time mode. The data logger of the system was programmed accordingly to communicate with any typical computer system via hyper-terminal RS232 interface and then to operate in a sequential buffering mode to save the data. A specific software code is developed for this function, allowing the end user to give as an input the time lag of the time series acquisition before the communication is initialized. The underwater detection system GeoMAREA was calibrated (for energy, energy resolution and efficiency) and tested for its stability to temperature variations before the deployment. The data logger of the system was appropriately programmed to perform easily all necessary acquisition commands (such as start, set preset time, set spectroscopy, set threshold channels) by remote command via the network. The system was connected to a virtual machine in the host institute. The operational center at HCMR had full access via internet to this virtual machine and the data at all times.
The experimental set-up for the integration of GeoMAREA system in the HUWO is shown in Figure 2. The GeoMAREA system was deployed at a distance of around 2 m below the sea surface and 9mm from the seabed (see Figure 3). This set up was selected to avoid contribution of gamma-rays produced in the atmosphere as well as from the sediment of the seabed. The volume of the construction in combination with their material was taken into account for the quantification method. The crystal was out of the frame (more than 10 cm including the crystal of GeoMAREA system was exposed in the sea and well below the sea surface).
The end-user (HCMR) could continuously check the system operation, the quality of the measured spectra as well as the whole process and state of operation. In case some dysfunctions were present, the end user informed the host institute about the problem and the necessary steps were performed by the latter. For deployment, recovery and maintenance of the system, scientific diving according to DGUV Regel 101-023 was used [20]. The time lag of the system was set to 3h.
4. Results
The gamma-ray spectra were analysed with the SPECTRW [21] software package. A first comment on this analysis procedure, is that the use of a medium resolution crystal compared to low-resolution scintillators makes the analysis easier for those radionuclides that emit gamma-rays in neighboring energy intervals. The sum of all spectra provided a good statistical spectrum for the analysis, including the identification of low activity concentration radionuclides in the low-energy part of the spectrum.
The first step of our method analysis is to calculate/monitor the total counting rate of the system during the acquisition period. In the Figure 4, we depict the time series of the values of the total counting rate as observed from the GeoMAREA detection system (which is, in fact, the gamma-ray intensity rate or the total counting rate-TCR). The TCR is a key factor to assess any potential gradients of the marine areas that are under surveillance in terms of naturally occurring and anthropogenic processes/phenomena. There are two main phenomena when there are such gradients of TCR. The first one is to check the natural gradient of radon progenies due to rainfall and the second one has anthropogenic origin and may be due to a nuclear incidence (e.g., an identification of a radioactive plume due to a nuclear accident or nuclear blast). The key anthropogenic tracer that can be easily detected after a nuclear accident of nuclear blast is cesium, due to its high production fission yield and can be detected via gamma-ray spectrometry from its two isotopes (134,137Cs). Another critical chemical property of cesium is that it is highly soluble in the seawater. The second step is the analysis of the total gamma-ray spectrum as acquired during the period of the experiment as well as the selection of gamma-ray spectra acquired in key periods of time according to their counting rate gradients.
In Figure 4 the total counting rate is depicted along with the time of acquisition and the time lag (3h) of the detection system. In the x-axis a detailed information (as file name) is included indicating the time stamp of each spectrum acquired. The observed spectra are analysed appropriately to calculate the TCR. The results exhibit several gradients which are mainly caused from rainfalls that took place the specific periods of time. The background counting rate was about 5.7 counts/gamma-rays per second.
The second step is focused on the analysis of the observed photopeaks, starting from the high energetic part of the spectrum (which is a low background spectrum area affected mainly from the Compton continuum of the cosmic rays). The total gamma-ray spectrum acquired during the acquisition period is depicted in Figure 5. As concerns the uncertainty budget, all uncertainties are calculated using the propagating law of uncertainties, considering mainly the statistical uncertainty of the measured photopeak net counts and the uncertainty of the efficiency of the detection system. The reported values correspond to 1s uncertainty.
The first peak that was analysed was at 2614 keV of 208Tl and the second at 1461 keV of 40K. These photopeaks are intense (well separated from other contributions) in the spectrum. The analysis provided average activity concentrations of 40 ± 5 and 9880 ± 590 Bqm-3, for 208Tl and 40K respectively. The contribution of the CeBr3 crystal intrinsic radiation and the gamma-rays from the 214Bi at the energy window at 1461 keV was calculated and subtracted according to literature [16]. The following peaks that were analysed are those of 228Ac at 911 and 968 keV. In these photopeaks the contribution of 214Bi (the gamma-rays are emitted at 934 and 964 keV) was subtracted accordingly from the 609 keV net counts (which is described in the following text). The average activity concentration of 228Ac as calculated from the two aforementioned photopeaks are 52 ± 13 and 62 ± 17 Bqm-3, respectively. It should also be mentioned that the strong peaks at the energy window of 1600 till 2200 keV are produced due to the intrinsic radiation of the crystal.
The next step was the analysis of the radionuclides 214Pb, 214Bi, 208Tl and 137Cs at 291, 351, 583, 609 and 661 keV, respectively. In this step, some peaks are folded due to the energy resolution of the system and thus special process has to be considered to unfold these peaks. The unfolding analysis was performed using the SPECTRW software package [21] and the individual contribution and the result of each photopeak counts for the radionuclides 214Bi, 208Tl and 137Cs are given in Figure 6, while the results of the radionuclide 214Pb for two energy lines is depicted in Figure 7. It is significant to mention here that the counts depicted in the Figure 6 and Figure 7 include counts of gamma-rays from other natural radionuclides (for instance at 251 energy window of 214Pb there is negligible contribution from 228Ac). The final activity concentration is calculated by subtracting the counting rate of this contribution, considering the quantification method. In the case of triple energy lines unfolding, the statistical uncertainty of the detected counts becomes high due to the minimum detectable activity of the GeoMAREA detection system. The average activity concentration of 214Bi, 208Tl and 137Cs is 108 ± 32, 105 ± 54 and 6 ± 4 Bqm-3, respectively.
The 137Cs energy peak is not clearly seen in the graph of Figure 6. However, the results of the analysed net photopeak counts are given from the SPECTRW [20] automatically together with the energy lines, the energy resolution in absolute units and the uncertainties of the analysed net counts. The FWHM at 661 keV is around 30 keV, which similar with the FWHM at the same energy (~28 keV) when the system is calibrated in the tank [16] by diluting 137Cs calibration sources in drinking water of the tank. The minimum detectable activity of the GeoMAREA detection system provides uncertain results for 137Cs (at 661 keV) and 208Tl (at 583 keV) in terms of statistics.
A similar process was followed for the analysis of 214Pb at 291 and 351 keV (see Figure 7). The unfolding analysis using the SPECTRW software package [21] provided the net counts of all participating natural radionuclides into the measurement contributions. For instance, at the gamma-ray energy window of 351 keV, there are two other energy lines of 228Ac at 338 and 328 keV, while at the 291 keV gamma-ray energy window, there is contribution from a low intensity energy peak of212Pb at 300 keV. The quantification method provided results for the two emission energies of 214Pb average activity measurements during the acquisition period which are 126 ± 14 and 147 ± 16 Bqm-3, respectively (which agree within uncertainties).
The 214Pb energy peak is not well distinguished into the spectrum of Figure 7. However, the unfolded results of the analysed net photopeaks counts are given from the SPECTRW [20] automatically together with the energy lines, the energy resolution for each peak in absolute units and the uncertainties of the analysed net counts. The FWHM at 291 and at
351 keV is around 36 keV, which increased by 35% compared with the FWHM at the same energy (~22 keV) when the system is calibrated in the laboratory [16] using point sources. This increase may be attributed to the aforementioned gamma-rays from other neighboring (in terms of gamma-ray energy) contributions of radionculides (228Ac at 338 and 328 keV which affects the 351 keV energy peak and this of 212Pb at 300 keV which affects the 291 keV).
5. Discussion
In this work, the medium resolution detection system named GeoMAREA was tested as part of the Helgoland Underwater Observatory (HUWO) at Helgoland island (Germany). The time lag of the system was set at 3h to observe short term potential gradients of the radioactivity levels of natural and/or anthropogenic hazards. The gradients of the total counting rate of the detection system exhibited variations only due to the rainfall events that took place during the period of acquisition. More specifically, radon progenies (214Pb and 214Bi) are the main contributors to the variation of the total counting rate, since rainfall enriches radon progenies in the seawater.
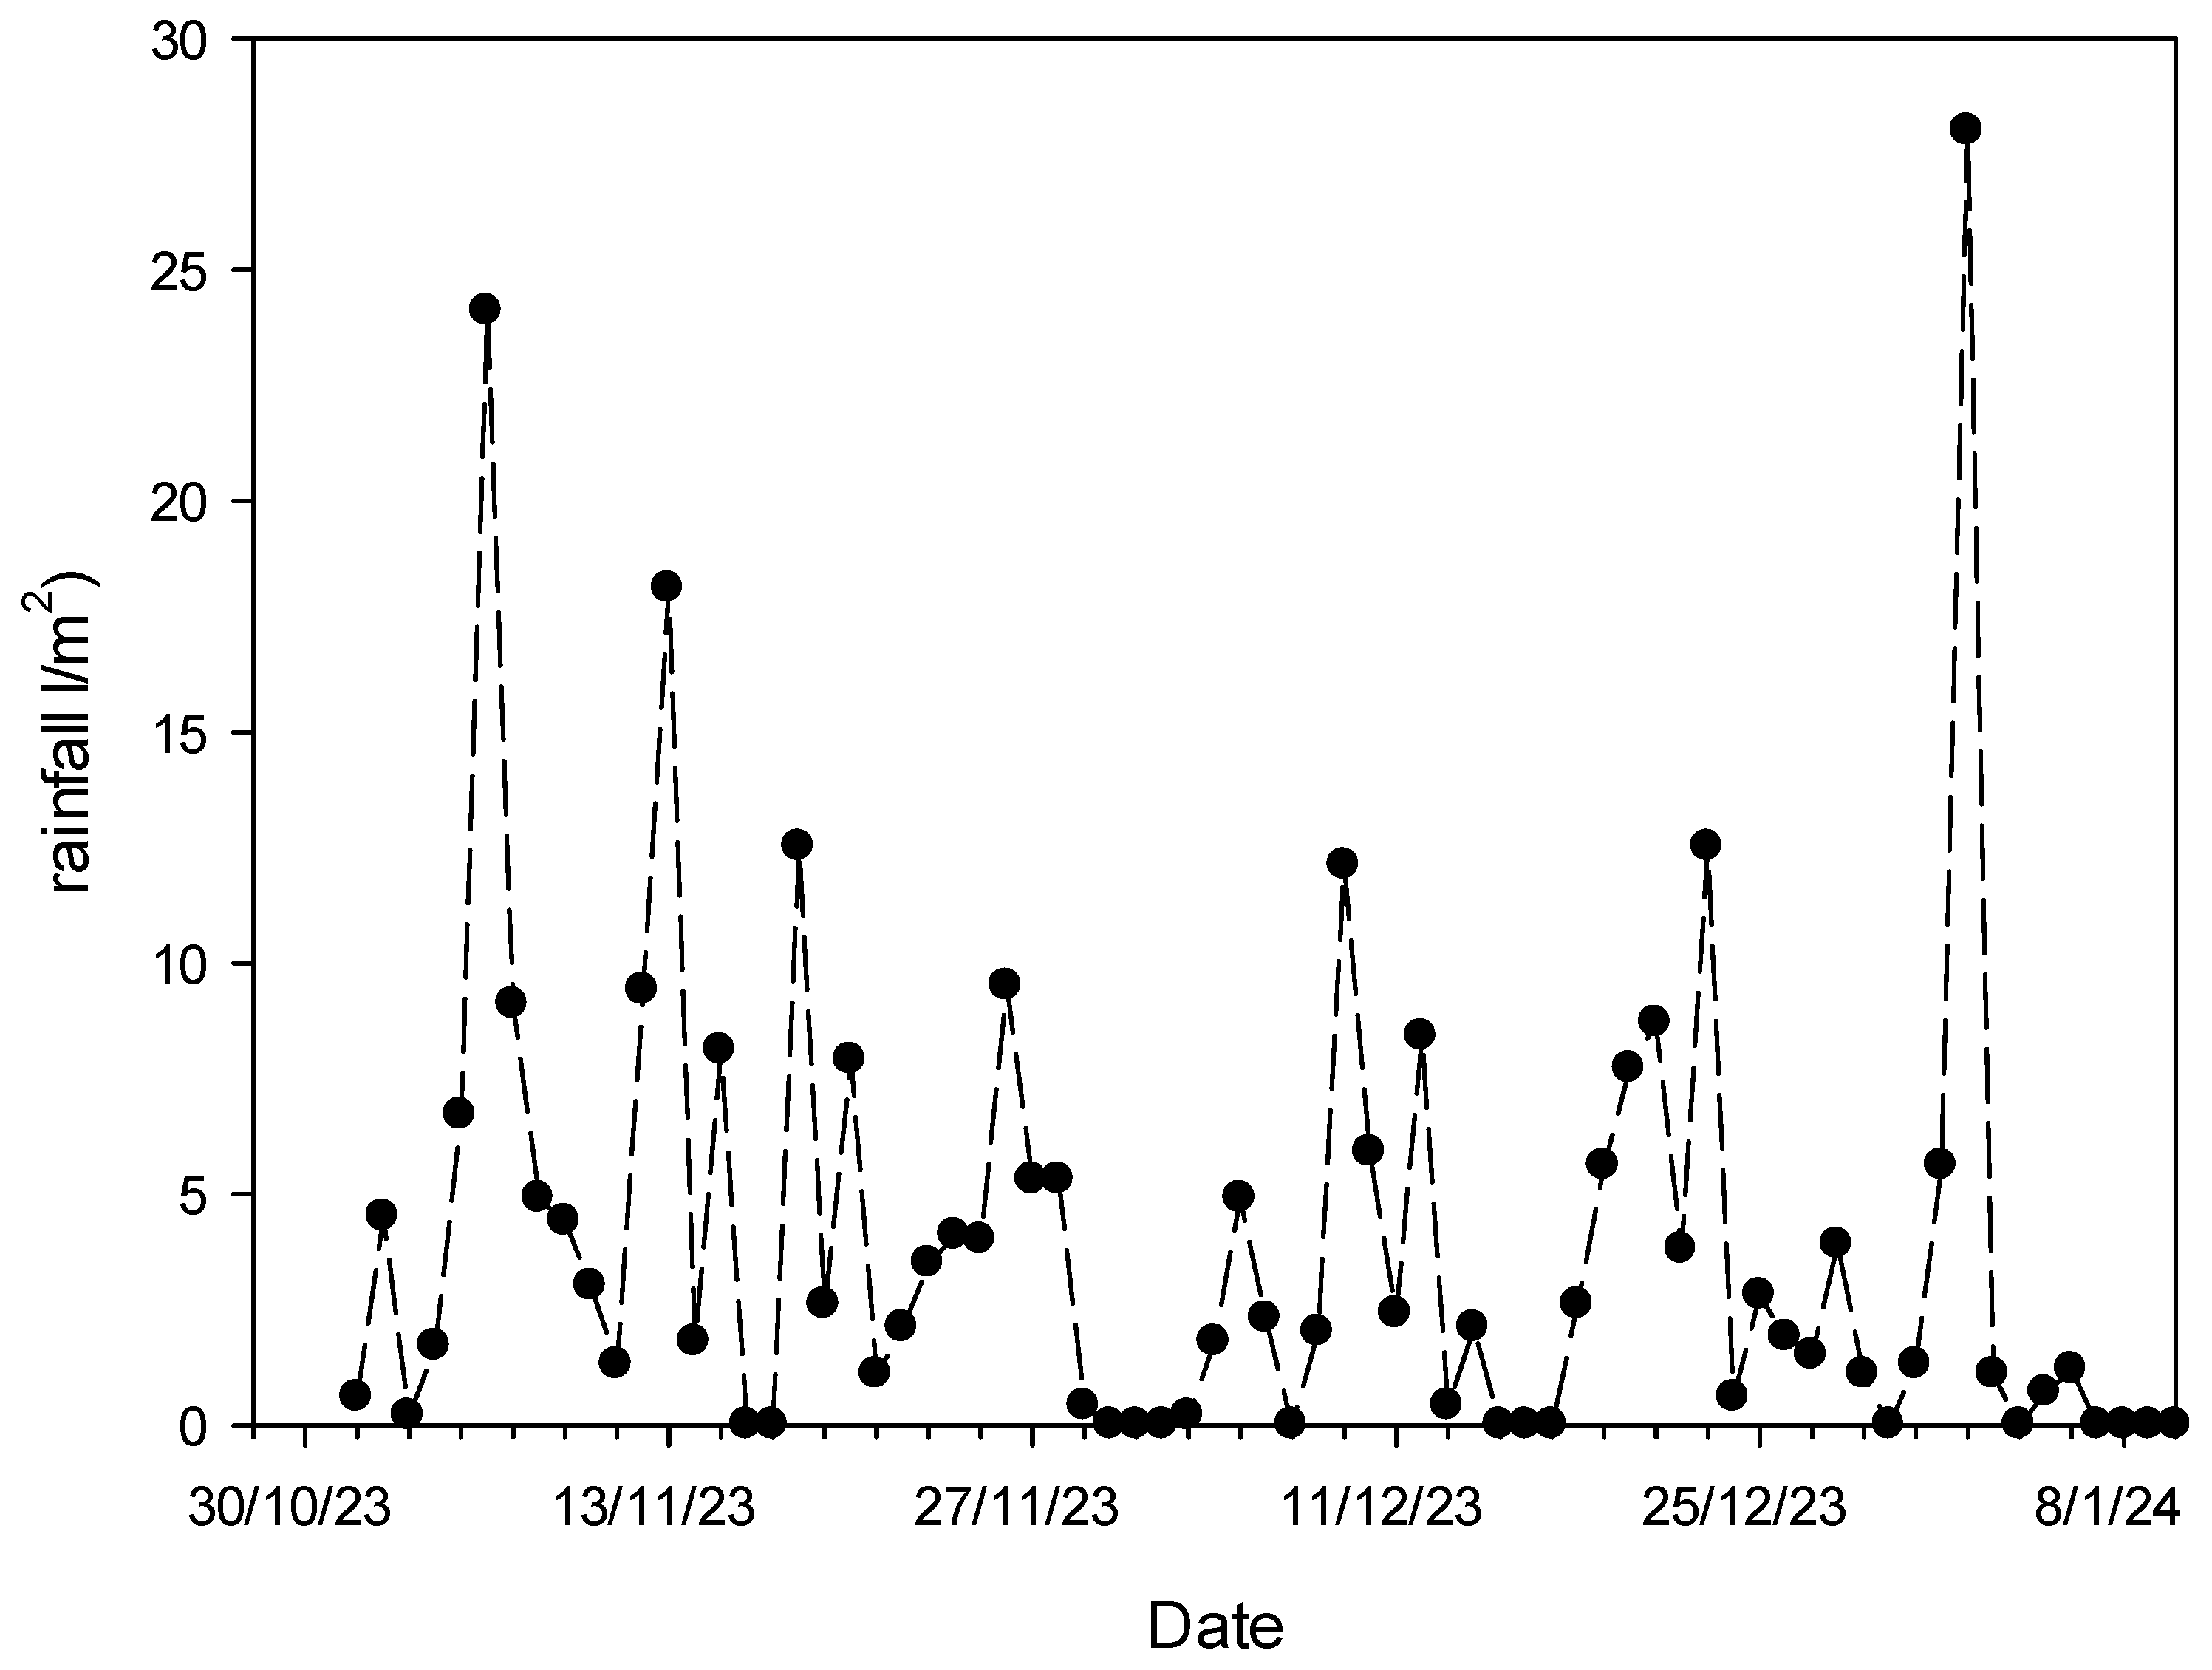
The correlation of gamma-ray intensity of an underwater detector in seawater with rainfall parameters is of high importance to better understand air-sea interactions. For that puprose, the radioactivity data were compared with quantitative rainfall data in units of lm-2 at the same period with the monitoring activity. Due to statistical isues, the underwater measurement of the gamma-ray emitters (such as 40K and radon progenies) were not given daily. The rainfall data are taken from existing database [22] and are ploted in Figure 8.
The rainfall data are correlated with the gamma-ray intensity of the measured gamma-ray spectra as ploted in the Figure 4. The rainfall height was not linearly correlated with the gamma-ray intensity validating previous studies where non-linear relation of rainfall intensity was revealed with the acativity concentration of radon progenies [4], [9]. The above correlation is qualitative and takes only into account the daily average rainwater height and not the rain water intensity.
The dates of raifall coincides well with the enhancement of gamma-ray intensity. More specifically from 11-14/11/2023 the rainfall height is around 32 lm-2 while the gamma-ray instesity recorded from the GeoMAREA system is 6.3 s-1. Similarly from 4-14/12/23 the average rainfall height is around 35 lm-2 while the the gamma-ray instesity recorded is 6.5 s-1. Additionally, during the period of 30/12/23-2/1/24 the rainfall height is around 34 lm-2 while the the gamma-ray instesity recorded is 6.4 s-1.
The average activity concentration of 137Cs (as the most anthropogenic radionuclide from past nuclear incidences) exhibited an average value of 6 ± 4 Bqm-3. Although the analysis exhibits very low statistics, it is considered a typical value at the North Sea as a background level. Due to the small dimensions of the GeoMAREA crystal (2x2 inches) the minimum detectable activity is very low (50 Bqm-3 in 24h acquisition), and thus such low activity concentrations are not easily detectable by the system without the performance of unfolding methods and related full spectrum analysis methods. However, the average 137Cs activity concentration is indicative of the study area. The main advantage of using a medium resolution crystal for the marine environment is to distinguish 214Bi at 609 keV and 208Tl at 583 keV from 137Cs at 661 keV. Although the average 137Cs activity concentration was found at the background level, it is clearly seen that a potential photopeak contribution in a hypothetical nuclear incidence would be well observed and separated from the contribution of 208Tl (at 583 keV) and 214Bi (609 keV).
The analysis of 40K activity concentration was inter-compared with the salinity values. The average salinity value of the monitoring period was around 30psu which is converted according to literature [6] in 40K activity concentration which is 10400 Bqm-3. This calculated value extracted from the average salinity at the studied area agrees very well within uncertainty with the average measured activity concentration of 40K (which is 9880 ± 590 Bqm-3). This is a critical validation result to apply CeBr3 crystals in underwater detectors for monitoring the oceans since the intrinsic radiation of the such crystals can be subtracted accordinlgy for optimising the quantification method at the intermediate energies. This validation result provides also significant information about monitoring the deterioration of the crystal.
Moreover, the analysis of radon progenis (214Pb, 214Bi) provided good agreement among the two radionuclides of 238U series (within 20% of their average values). Another advantage of the system is the voltage stability of the energy spectra. The final spectrum was summed up for the whole period of acquisition and the FWHM remained stable for the analysed radionuclides (that are not affected from neighboring energy peaks). On contrary, the disadvantage of the system is the small dimension of the crystal (2x2 inches) that renders it to measure low levels of radioactivity in seawater as well as the intrinsic radiation at the intermediate gamma-ray energies of the spectrum producing additional uncertainty to the analysis key natural radionuclides at the high-energy window (such as 214Bi at 1764 and 2220 keV). Such analysis is required to validate the activity concentration of folded peaks of 214Bi at 609 keV.
6. Summary-Perspectives
The GeoMAREA system is a valuable tool for continuous monitoring of gradients of gamma-ray intensity of radioactivity in the marine environment and may provide significant information on various environmental processes for which radon (and thoron) can be applied as a tracer. The system proved capable to monitor radon and thoron progenies due to rainfall events. The system was also used to monitor gradients of 137Cs activity concentration. However, the minimum detectable activity was inadequate to provide accurate results. Furthermore, the data analysis did not exhibit potential contaminants originating from anthropogenic activities. The proposed system can support the surveillance in terms of marine radioactivity to assess the state of the sea as well as to support models to forecast the evolution of marine ecosystems and their impact to humans.
The proposed technology, using a novel in-situ underwater sensors with a cabled data network and existing information system [23], can be exploited to provide an effective robust, low-power consumption and cost-effective monitoring system for the surveilance of the marine radioactivity and nuclear security issues. The capability to get data in real-time mode, makes the system aqequate to operate as a decision support tool taking into account the thresholda and the measures from the national and international authorities. In the future, a special algorithm can be integrated into the data logger to analyse automatically and internally the gamma-ray spectrum and to transmit only the activity concentration as a decision support action. However, near-real-time data transmission (since the integration is cabled) is also very helpful for an operational center to control at pre-defined time interval potential gradients of the gamma-ray intensities in the different gamma-ray energy lines.
The integration of underwater medium resolution spectrometers in fixed existing platforms as well as in existing cabled marine networks will drastically support the surveillance of the oceans in terms of radioactivity, especially in ecosystem areas that are close to potential releases of radionuclides. The exploitation of observation systems as well as the development of smart algorithms for data analysis (such as artificial intelligence) will improve the spatial and temporal information of the radioactivity levels (natural and anthropogenic) in the oceans in a worldwide basis.
As concerns new developments of underwater medium resolution spectrometers, it is recommended to optimize the proposed technology with a similar system using 3x3 inches crystal (or larger) to increase the minimum detectable activity. A second recommendation is to use as a scintillator crystal SrI2 to eliminate the contribution of intrinsic radiation in the intermediate gamma-ray energies and thus making the detection system more suitable for ocean monitoring applications.
The rainfall height exhibits a non-linear relation with gamma-ray inetnsity since rainfalls with low heights do not affect the activity concentration of radon progenies, propably due to the different values of rainfall intensities as well due to statistical reasons from the counting rate.
Author Contributions
Data curation, C.T., S.A., E.A., M.N., D.P.; Formal analysis, C.T., E.A.; Investigation, C.T., E.A, D.P., F.F.; Methodology, M.B., M.L., C.T.,E.A.; P.F.; Software, S.A., M.B.; Supervision, P.F., C.T.; Validation, C.T.,F.F., M.B., E.A.; Visualization, C.T., M.L., M.B. S.A.; Writing—original draft, C.T., E.A., D.P.; Writing—review & editing, C.T., P.F., M.L., M.B., M.N.; All authors have read and agreed to the published version of the manuscript.
Funding
This research was not funded by an authority.
Institutional Review Board Statement
The study was conducted in the frame of RADCONNECT of JERICO-S3 project.
Informed Consent Statement
Informed consent was obtained from all subjects involved in the study.
Data Availability Statement
The data are available on request. The data presented in this study are available on request to the corresponding author.
Acknowledgements
The authors would like to acknowledge the TNA project of JERICO–S3 Transnational Access named RADCONNECT. The authors would also like to acknowledge the NAUTILOS EU Horizon 2020 project for supporting calibration tasks of the deployed in-situ sensor. HCMR authors would like to thank ITO ltd for supporting activities for the GeoMAREA sensor.
Conflicts of Interest
There is no conflict of interest.
References
- Tsabaris, C., Bozzano, R. 2024. Application of Coastal/Ocean Sensors and Systems. Journal of Marine Science and Engineering 12 (1), 91.
- Zielinski, O., Busch, J. A., Cembella, A. D., Daly, K. L., Engelbrektsson, J., Hannides, A. K., Schmidt, H. 2009. Detecting marine hazardous substances and organisms: sensors for pollutants, toxins, and pathogens. Ocean Science5, 329–349.
- Tsabaris, C., Androulakaki, E.G., Ballas, D., Alexakis, S., Perivoliotis, L., Iona, A., 2021. Radioactivity monitoring at north aegean sea integrating in-situ sensor in an ocean observing platform. Journal of Marine Science and Engineering 1–16, 77.
- Pensieri, S., Patiris, D., Alexakis, S., Tsabaris, C., Bozzano, R., 2018. Integration of underwater radioactivity and acoustic sensors into an open sea near real-time multi-parametric observation system. Sensors 18, 2737.
- Tsabaris, C., 2008. Monitoring natural and artificial radioactivity enhancement in the Aegean Sea using floating measuring systems. Applied Radiation and Isotopes 66, 1599–1603.
- Tsabaris, C., Ballas, D., 2005. On line gamma-ray spectrometry at open sea. Applied Radiation and Isotopes 62, 83–89.
- Patiris, D.L., Tsabaris, C., Schmidt, M., Alexakis, S.,Linke, P., 2018. Mobile underwater in situ gamma-ray spectroscopy to localize groundwater emanation from pockmarks in the Eckernförde bay, Germany. Applied Radiation and Isotopes140, 305–313.
- He, J., Tsabaris, C., Yu, W., Lin, F. 2023. Development and application of an in-situ shipboard device for the measurement of gamma-ray emitters in seawater. Journal of Environmental Radioactivity 261, 107137.
- Patiris, D.L., Pensieri, S., Tsabaris, C., Anagnostou, M.N., Alexakis, S. 2021. Rainfall investigation by means of marine in situ gamma-ray spectrometry in ligurian sea, mediterranean sea, Italy. Journal of Marine Science and Engineering 9, 903.
- Tsabaris, C., Eleftheriou, G., Pappa, F.K., Krasakopoulou, E., Zervakis, V., 2024. Evolution of 137Cs Activity Concentration in the Aegean Sea. Handbook of Environmental Chemistry 127, 287–311.
- Leivadaros, P., Tsabaris, C., Patiris, D.L., Krasakopoulou, E., Zervakis, V. 2022. Recent 137Cs Distribution in the Aegean Sea, Greece. Journal of Marine Science and Engineering 10, 1719.
- Tsabaris, C., Kaberi, H., Pappa, F.K., Krasakopoulou, E., Zervakis, V. 2020. Vertical distribution and temporal trends of 137Cs at Lemnos and Cretan deep basins of the Aegean Sea, Greece. Deep-Sea Research Part II: Topical Studies in Oceanography, 171, 104603.
- Tsabaris, C., Zervakis, V., Kaberi, H., Lampropoulou, M., Kalfas, C.A. 2014. 137Cs vertical distribution at the deep basins of the North and Central Aegean Sea, Greece. Journal of Environmental Radioactivity 132, 47–56.
- Qiao, J., Andersson, K., Nielsen, S. 2020. A 40-year marine record of 137Cs and 99Tc transported into the Danish Straits: Significance for oceanic tracer studies. Chemosphere 244, 125595.
- Maderich, V., Kim, K.O., Bezhenar, R., Martazinova, V., Brovchenko, I. 2021. Transport and Fate of 137Cs Released From Multiple Sources in the North Atlantic and Arctic Oceans. Frontiers in Marine Science 8, 806450.
- Tsabaris, C., Androulakaki, E.G., Prospathopoulos, A., Alexakis, S., Pappa, F.K., Sarantakos, K., Kokkoris, M., Vlastou, R. 2019. Development and optimization of an underwater in-situ cerium bromide spectrometer for radioactivity measurements in the aquatic environment. Journal of Environmental Radioactivity 204, 12–20.
- Baschek, B., Schroeder, F., Brix, H., Zielinski, O., Ziemer, F. 2017. The Coastal Observing System for Northern and Arctic Seas (COSYNA). Ocean Science 13, 379–410.
- Fischer, P., Schwanitz, M., Loth, R., Brand, M., Schröder, F. 2017. First year of practical experiences of the new Arctic AWIPEV-COSYNA cabled Underwater Observatory in Kongsfjorden, Spitsbergen. Ocean Science , 13, 259–272.
- Wiltshire, K. H., Manly, B. F. J. 2004. The warming trend at Helgoland Roads, North Sea: phytoplankton response. Helgol. Mar. Res. 58, 269–273. [CrossRef]
- DGUV Regel 101-023 - Einsatz von Forschungstauchern (2011) Deutsche Gesetzliche Unfallversicherung e.V. (DGUV), Berlin.
- Kalfas, C.A., Axiotis, M., Tsabaris, C. 2016. SPECTRW: A software package for nuclear and atomic spectroscopy. Nuclear Instruments and Methods in Physics Research, Section A: Accelerators, Spectrometers, Detectors and Associated Equipment 830, 265–274.
- Wetterkontor (2025). WetterKontor [Online]. https://www.wetterkontor.de/de: WetterKontor GmbH. https://www.wetterkontor.de/de/wetter/deutschland/rueckblick.asp?id=84&datum0=01.11.2023&datum1=31.01.2024&jr=2025&mo=2&datum=01.11.2023&t=4&part=0#google_vignette [Accessed 18.02.2025 2025].
- PANGAEA® - Data Publisher for Earth & Environmental Science. [CrossRef]
Figure 1.
The study area (COSYNA-Helgoland cabled network). The radioactivity system was deployed in the cabled North Sea Observatory.
Figure 1.
The study area (COSYNA-Helgoland cabled network). The radioactivity system was deployed in the cabled North Sea Observatory.
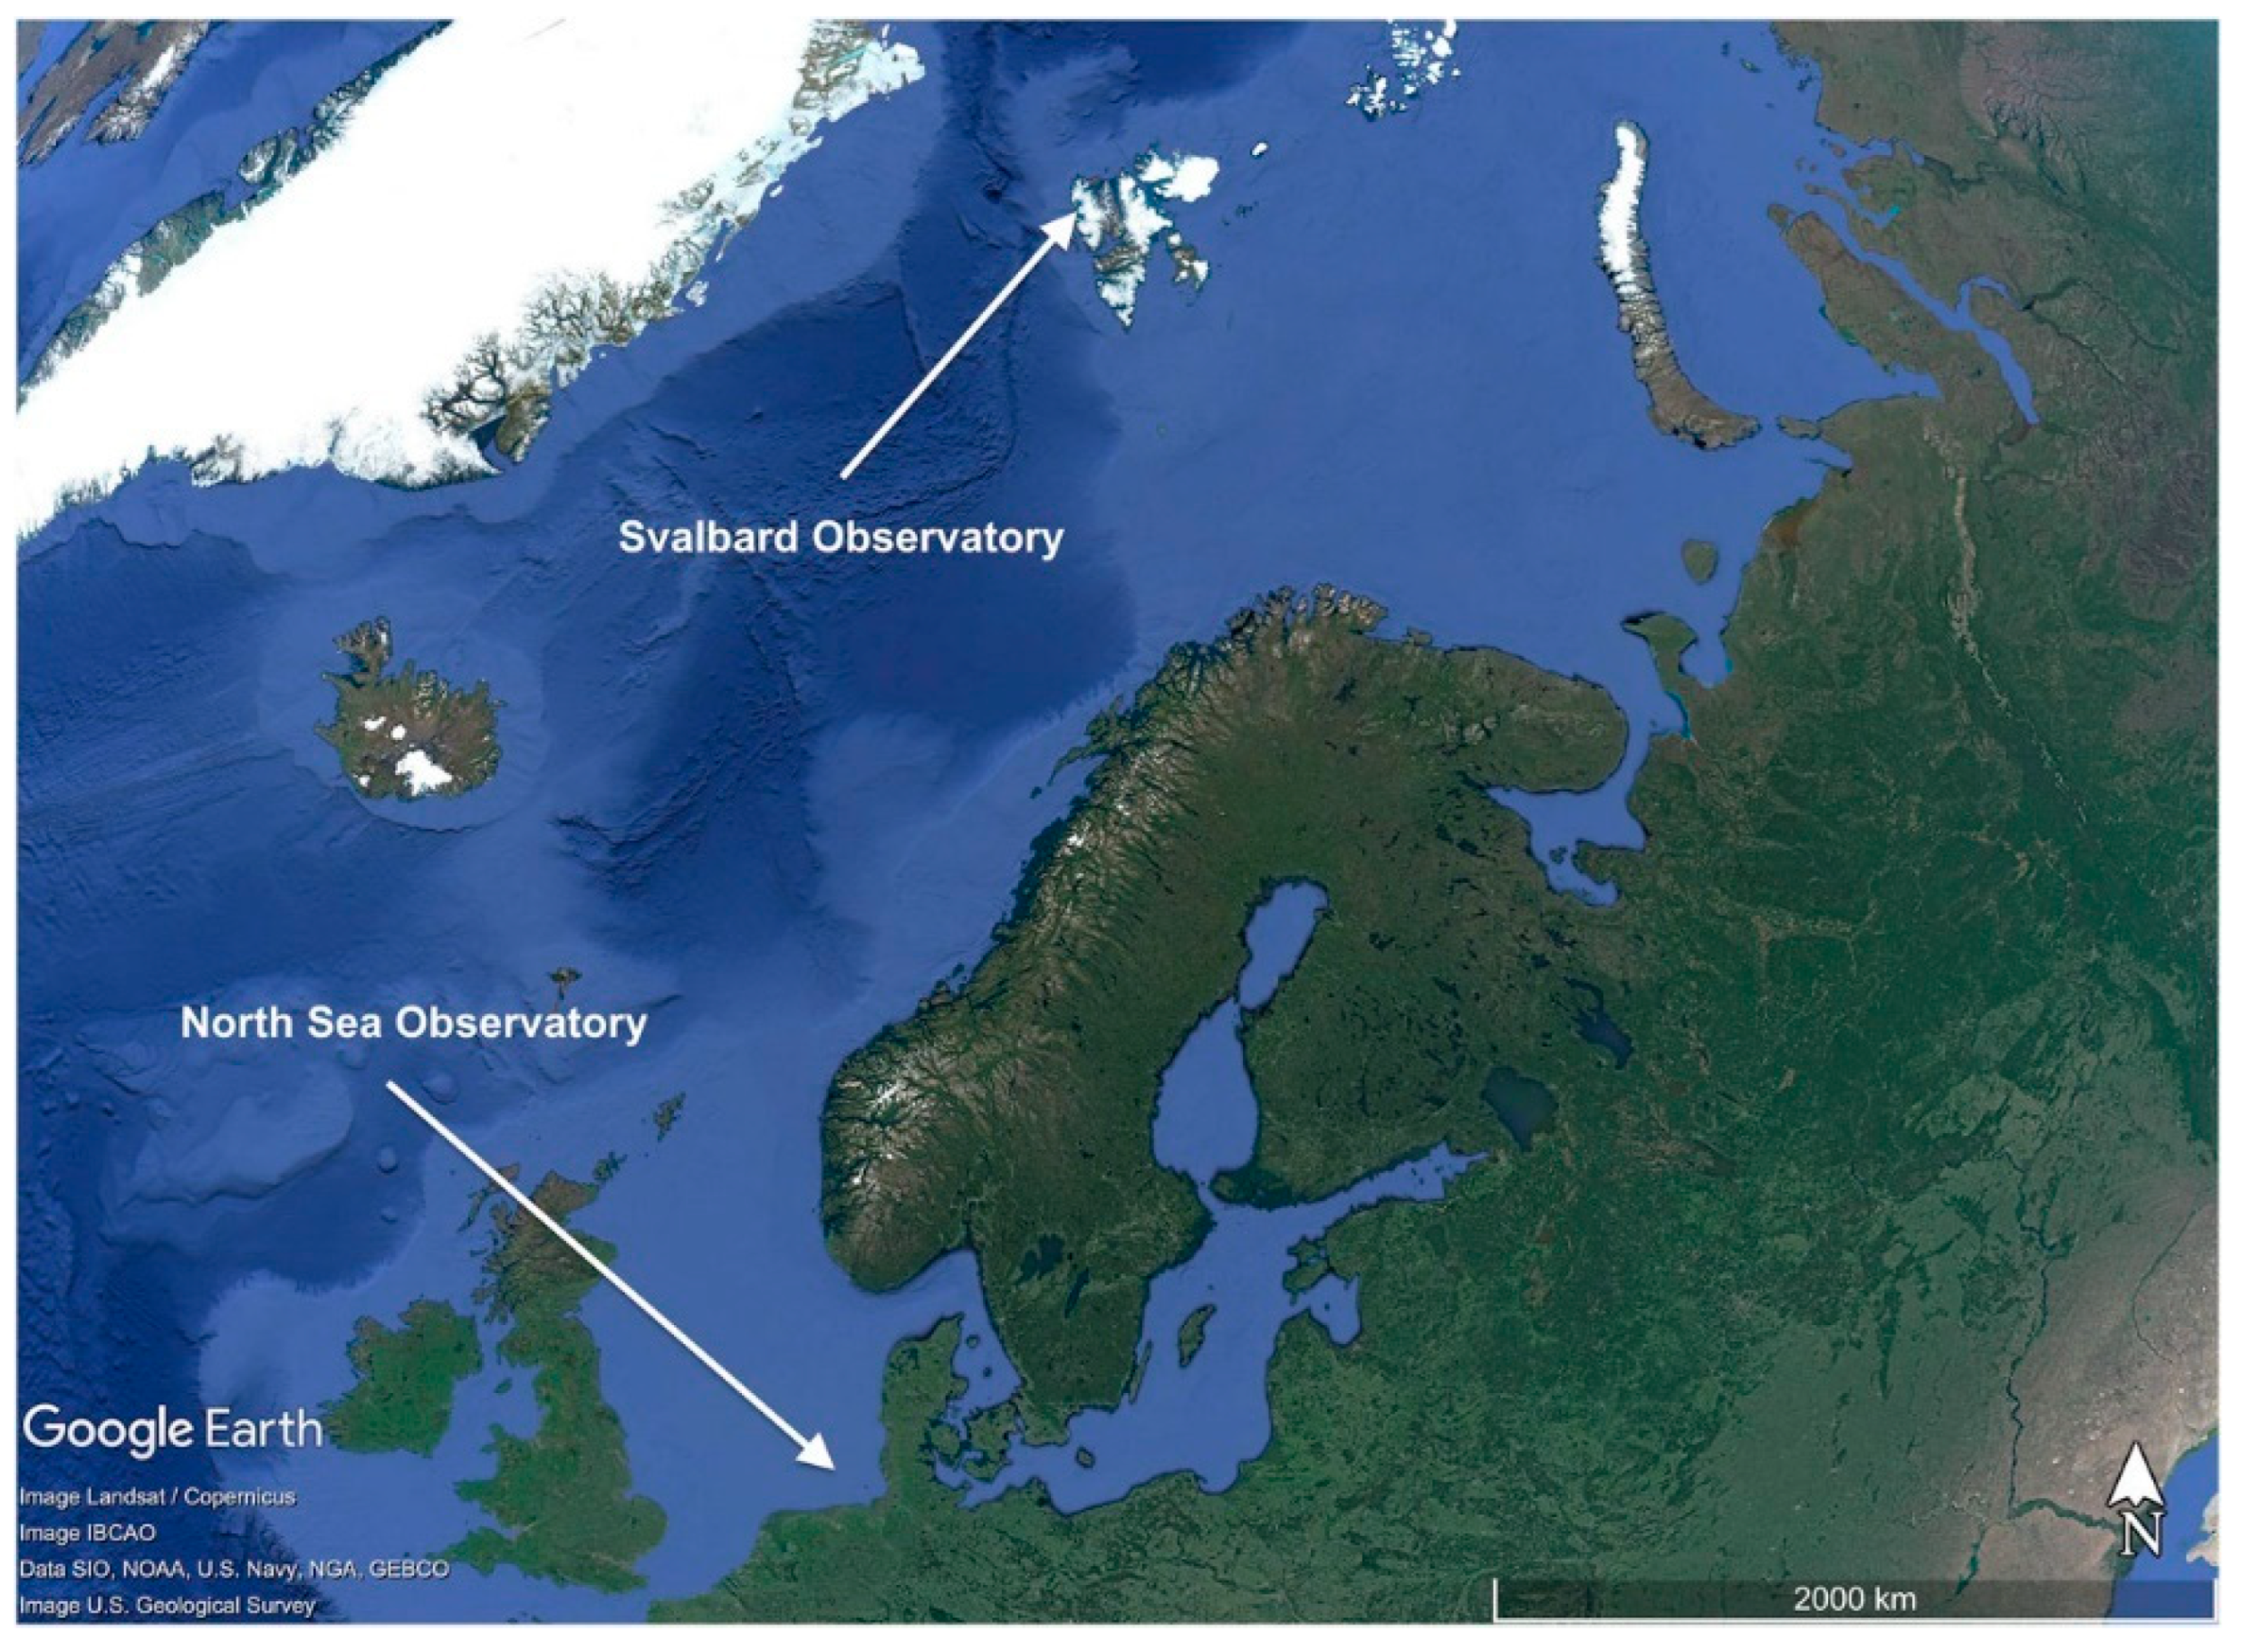
Figure 2.
The integration of the GeoMAREA detection system into the COSYNA cabled network to monitor gamma-ray spectra in seawater (North Sea Observatory, Helgoland station).
Figure 2.
The integration of the GeoMAREA detection system into the COSYNA cabled network to monitor gamma-ray spectra in seawater (North Sea Observatory, Helgoland station).
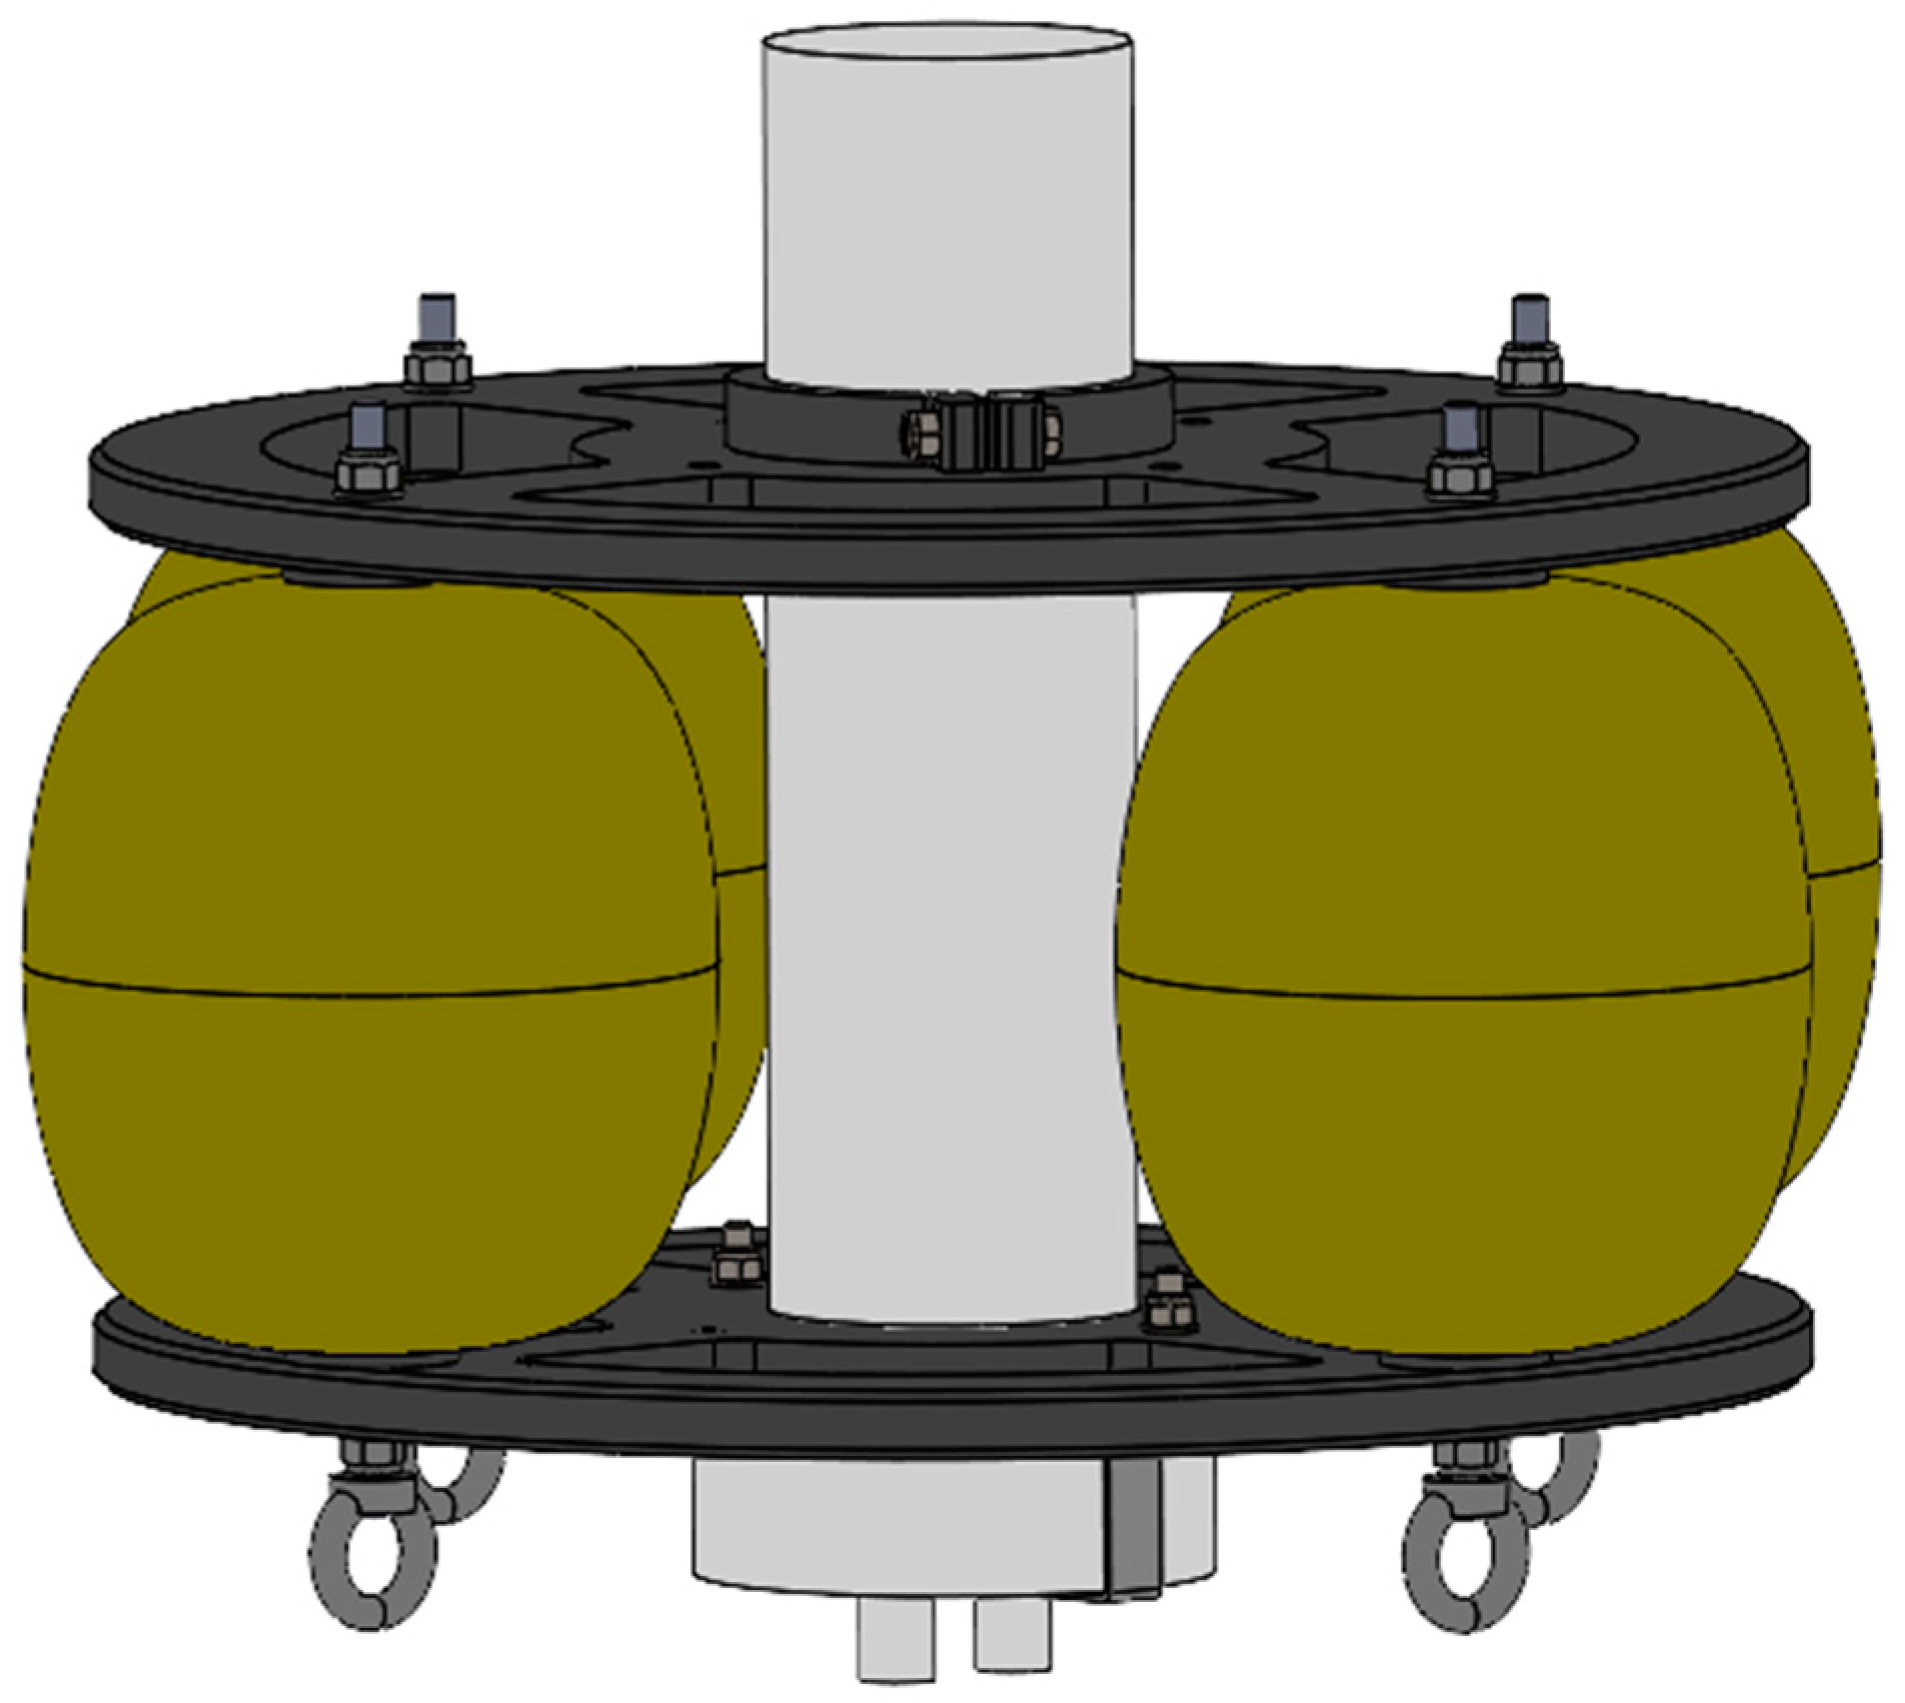
Figure 3.
The experimental set up for the deployment of the GeoMAREA sensor in North Sea.
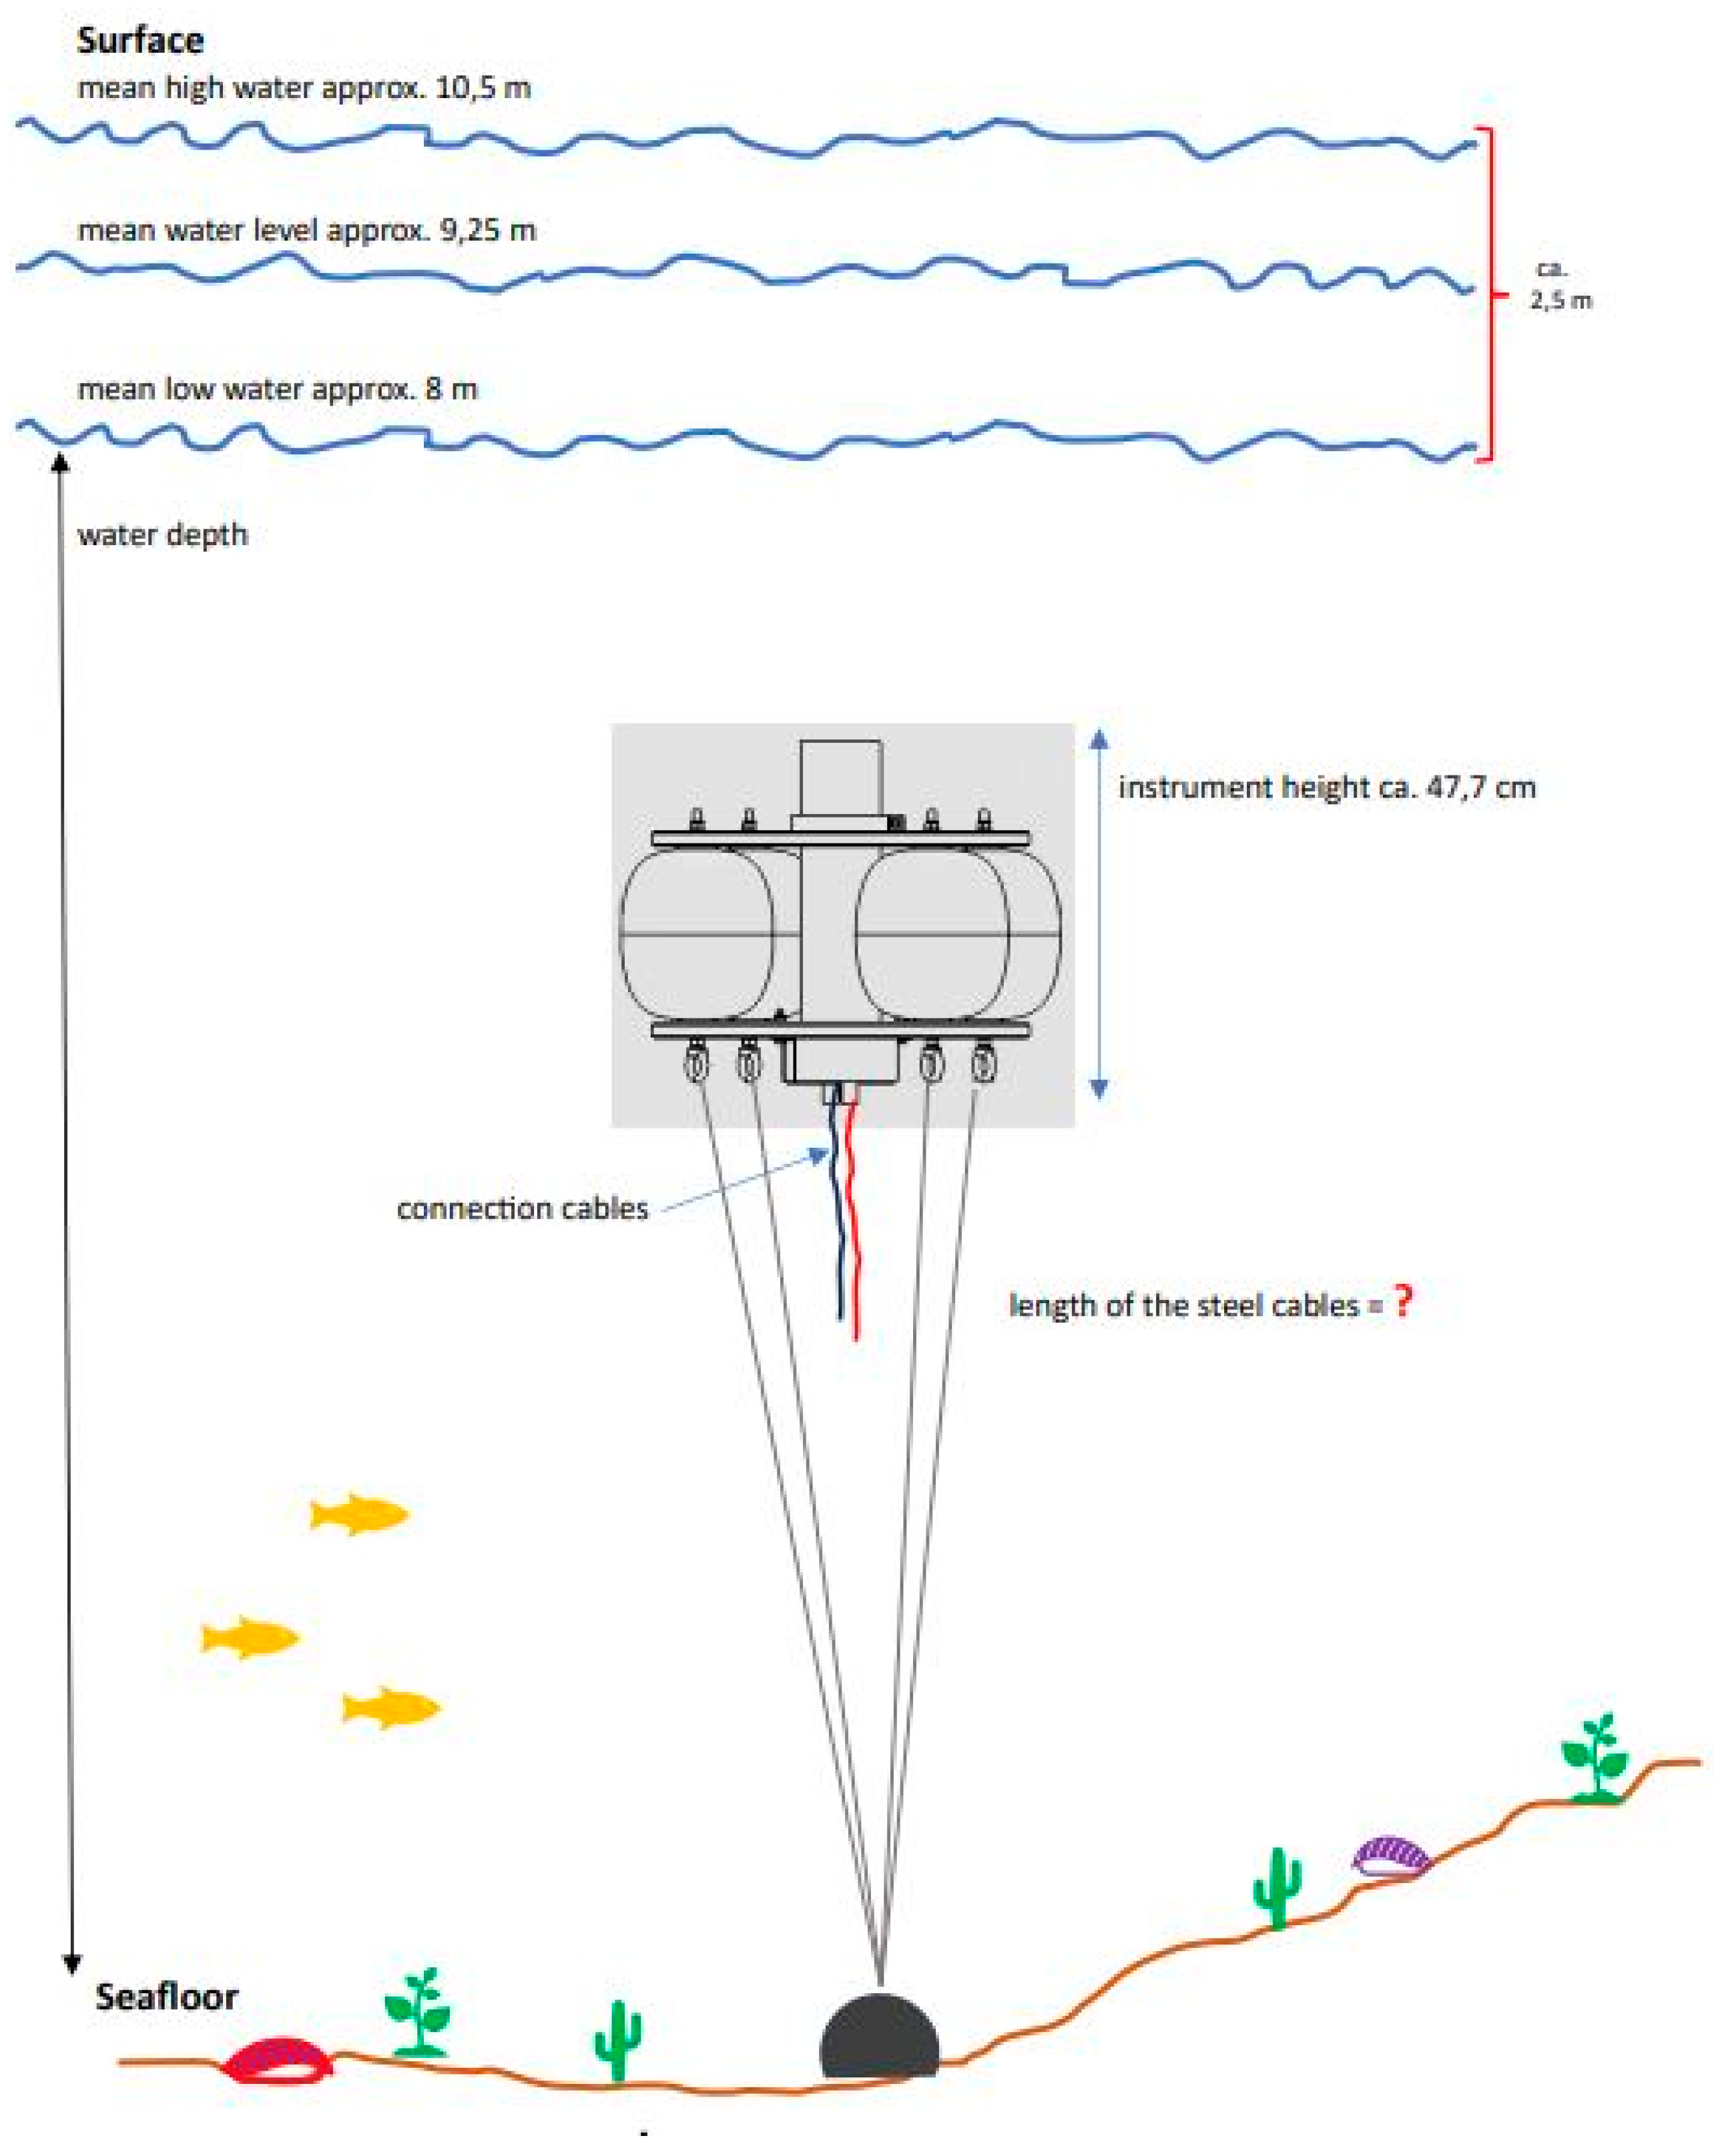
Figure 4.
The time series of total counting rate as aquired from the GeoMAREA detection system.
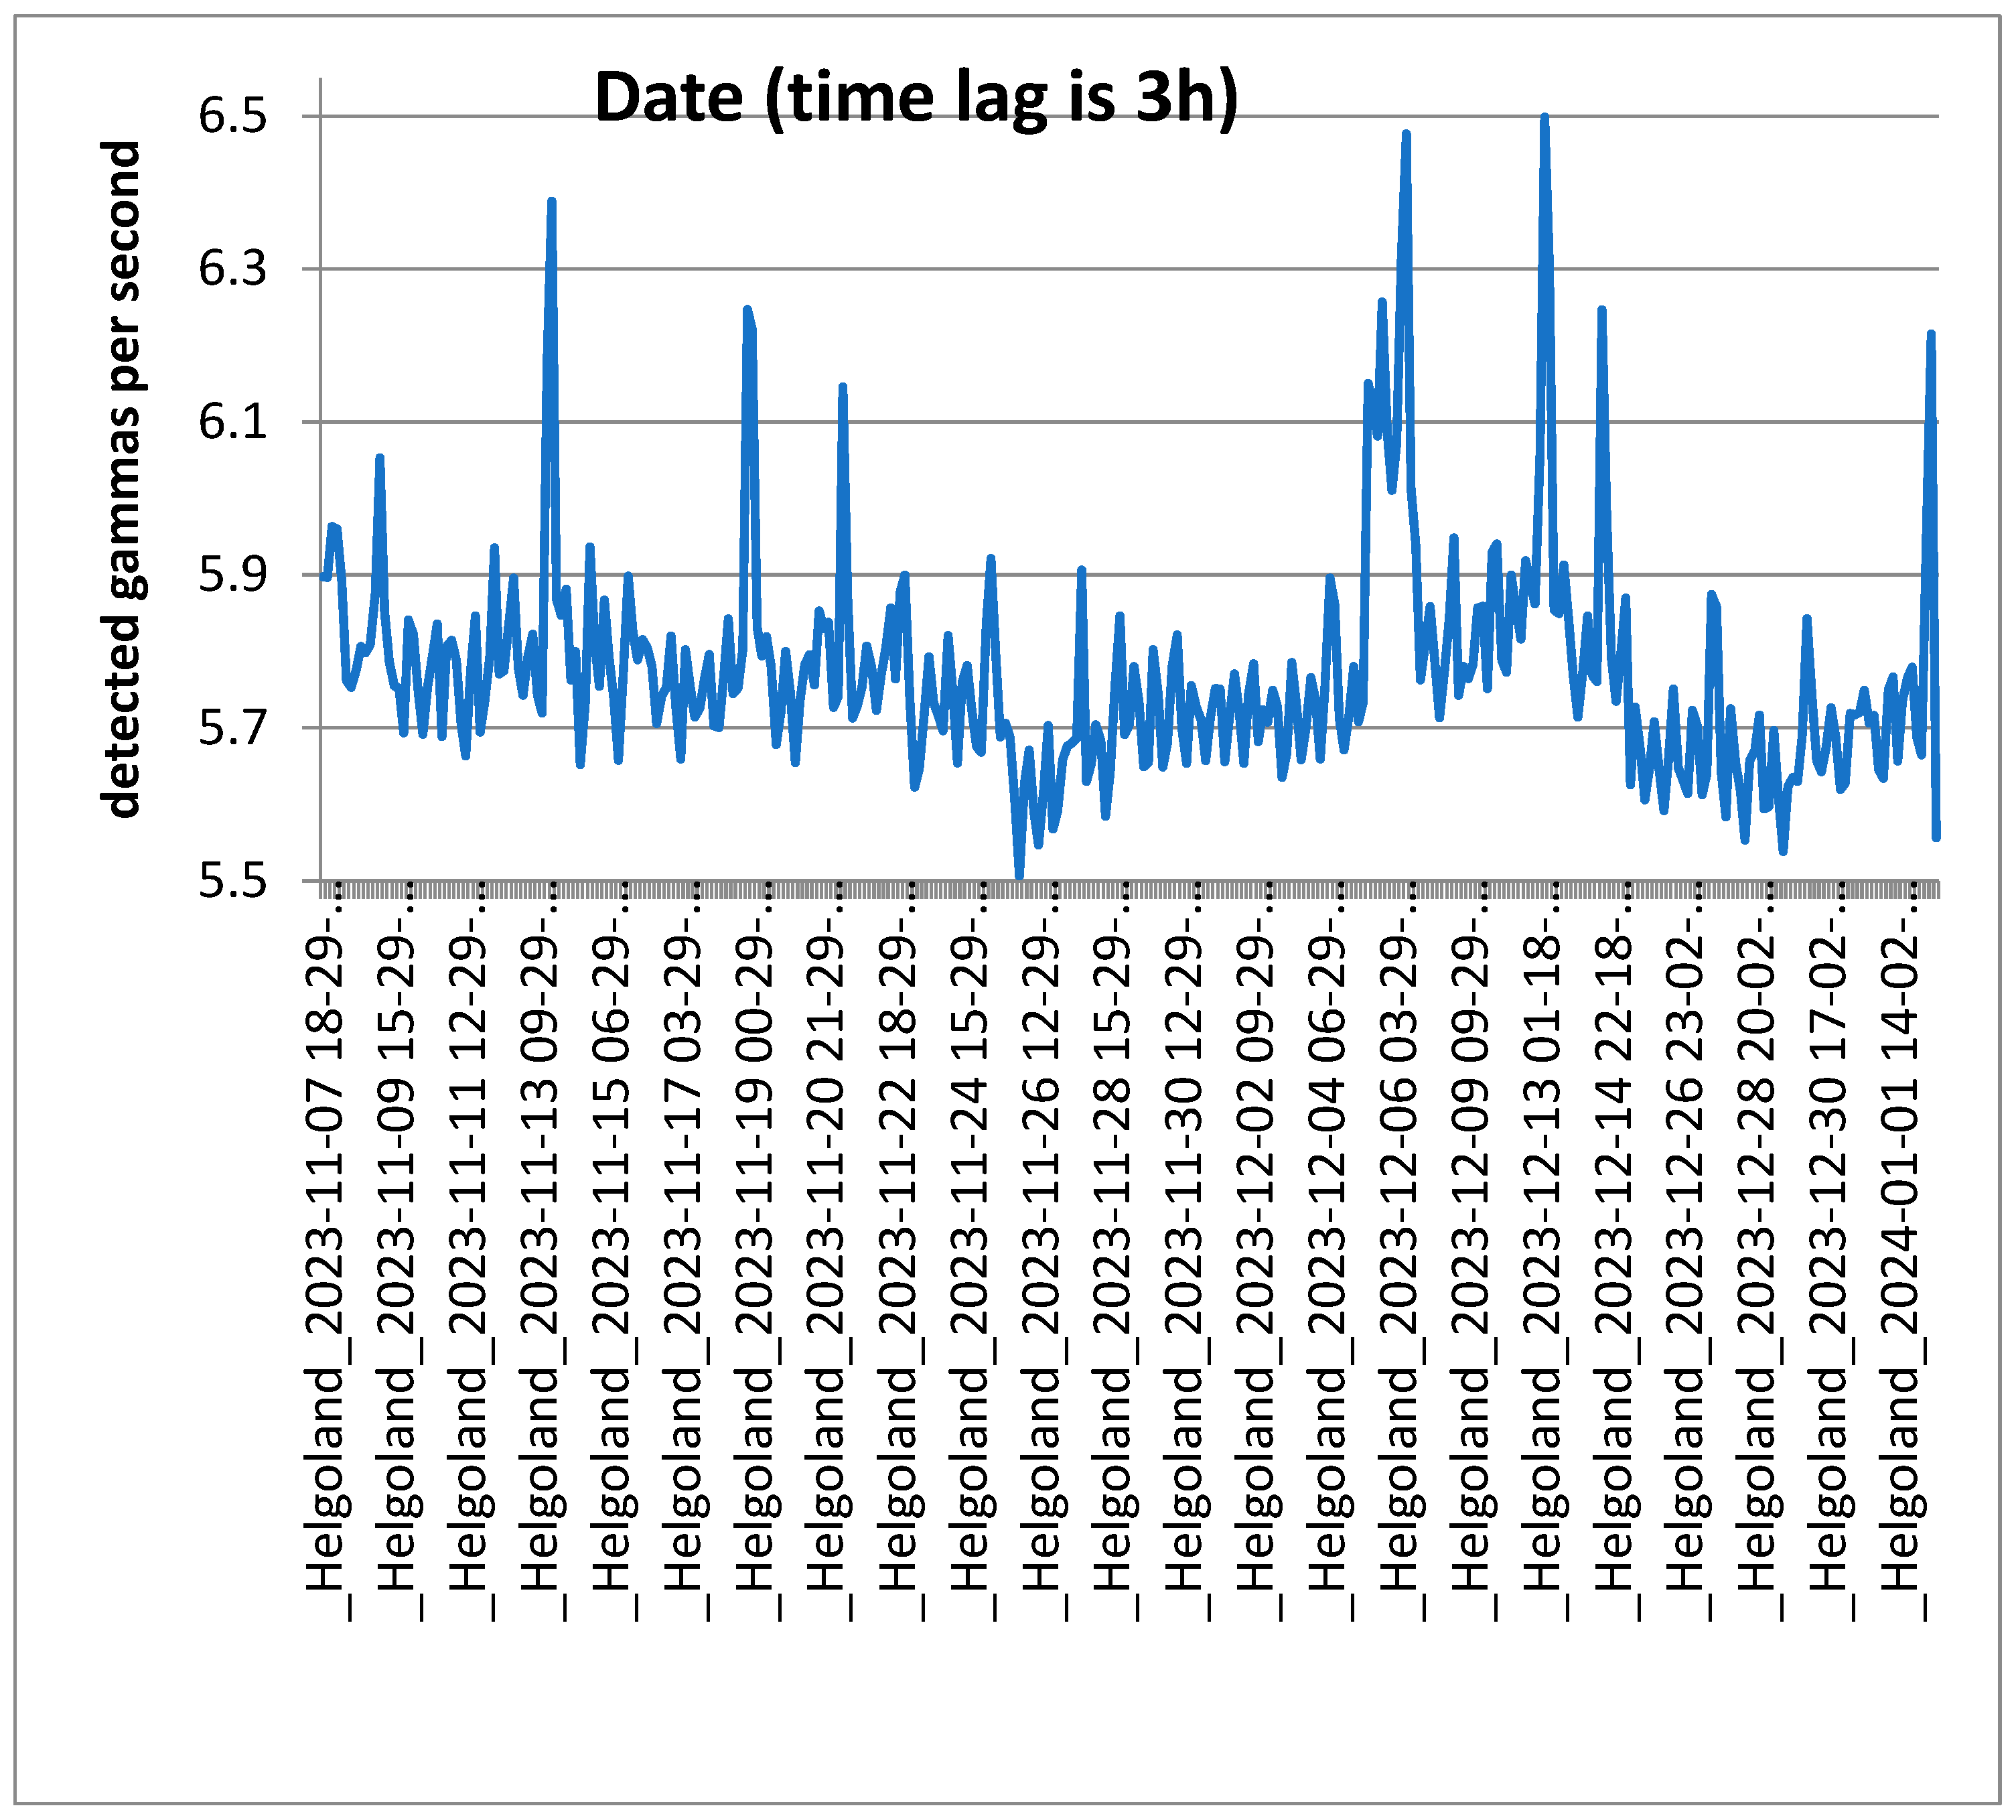
Figure 5.
Gamma-ray spectrum acquired by the GeoMAREA system during acquisition period. The gamma-ray intensity (counts) plotted versus channels (raw data, bottom axis) and keV (energy calibrated, top axis).
Figure 5.
Gamma-ray spectrum acquired by the GeoMAREA system during acquisition period. The gamma-ray intensity (counts) plotted versus channels (raw data, bottom axis) and keV (energy calibrated, top axis).
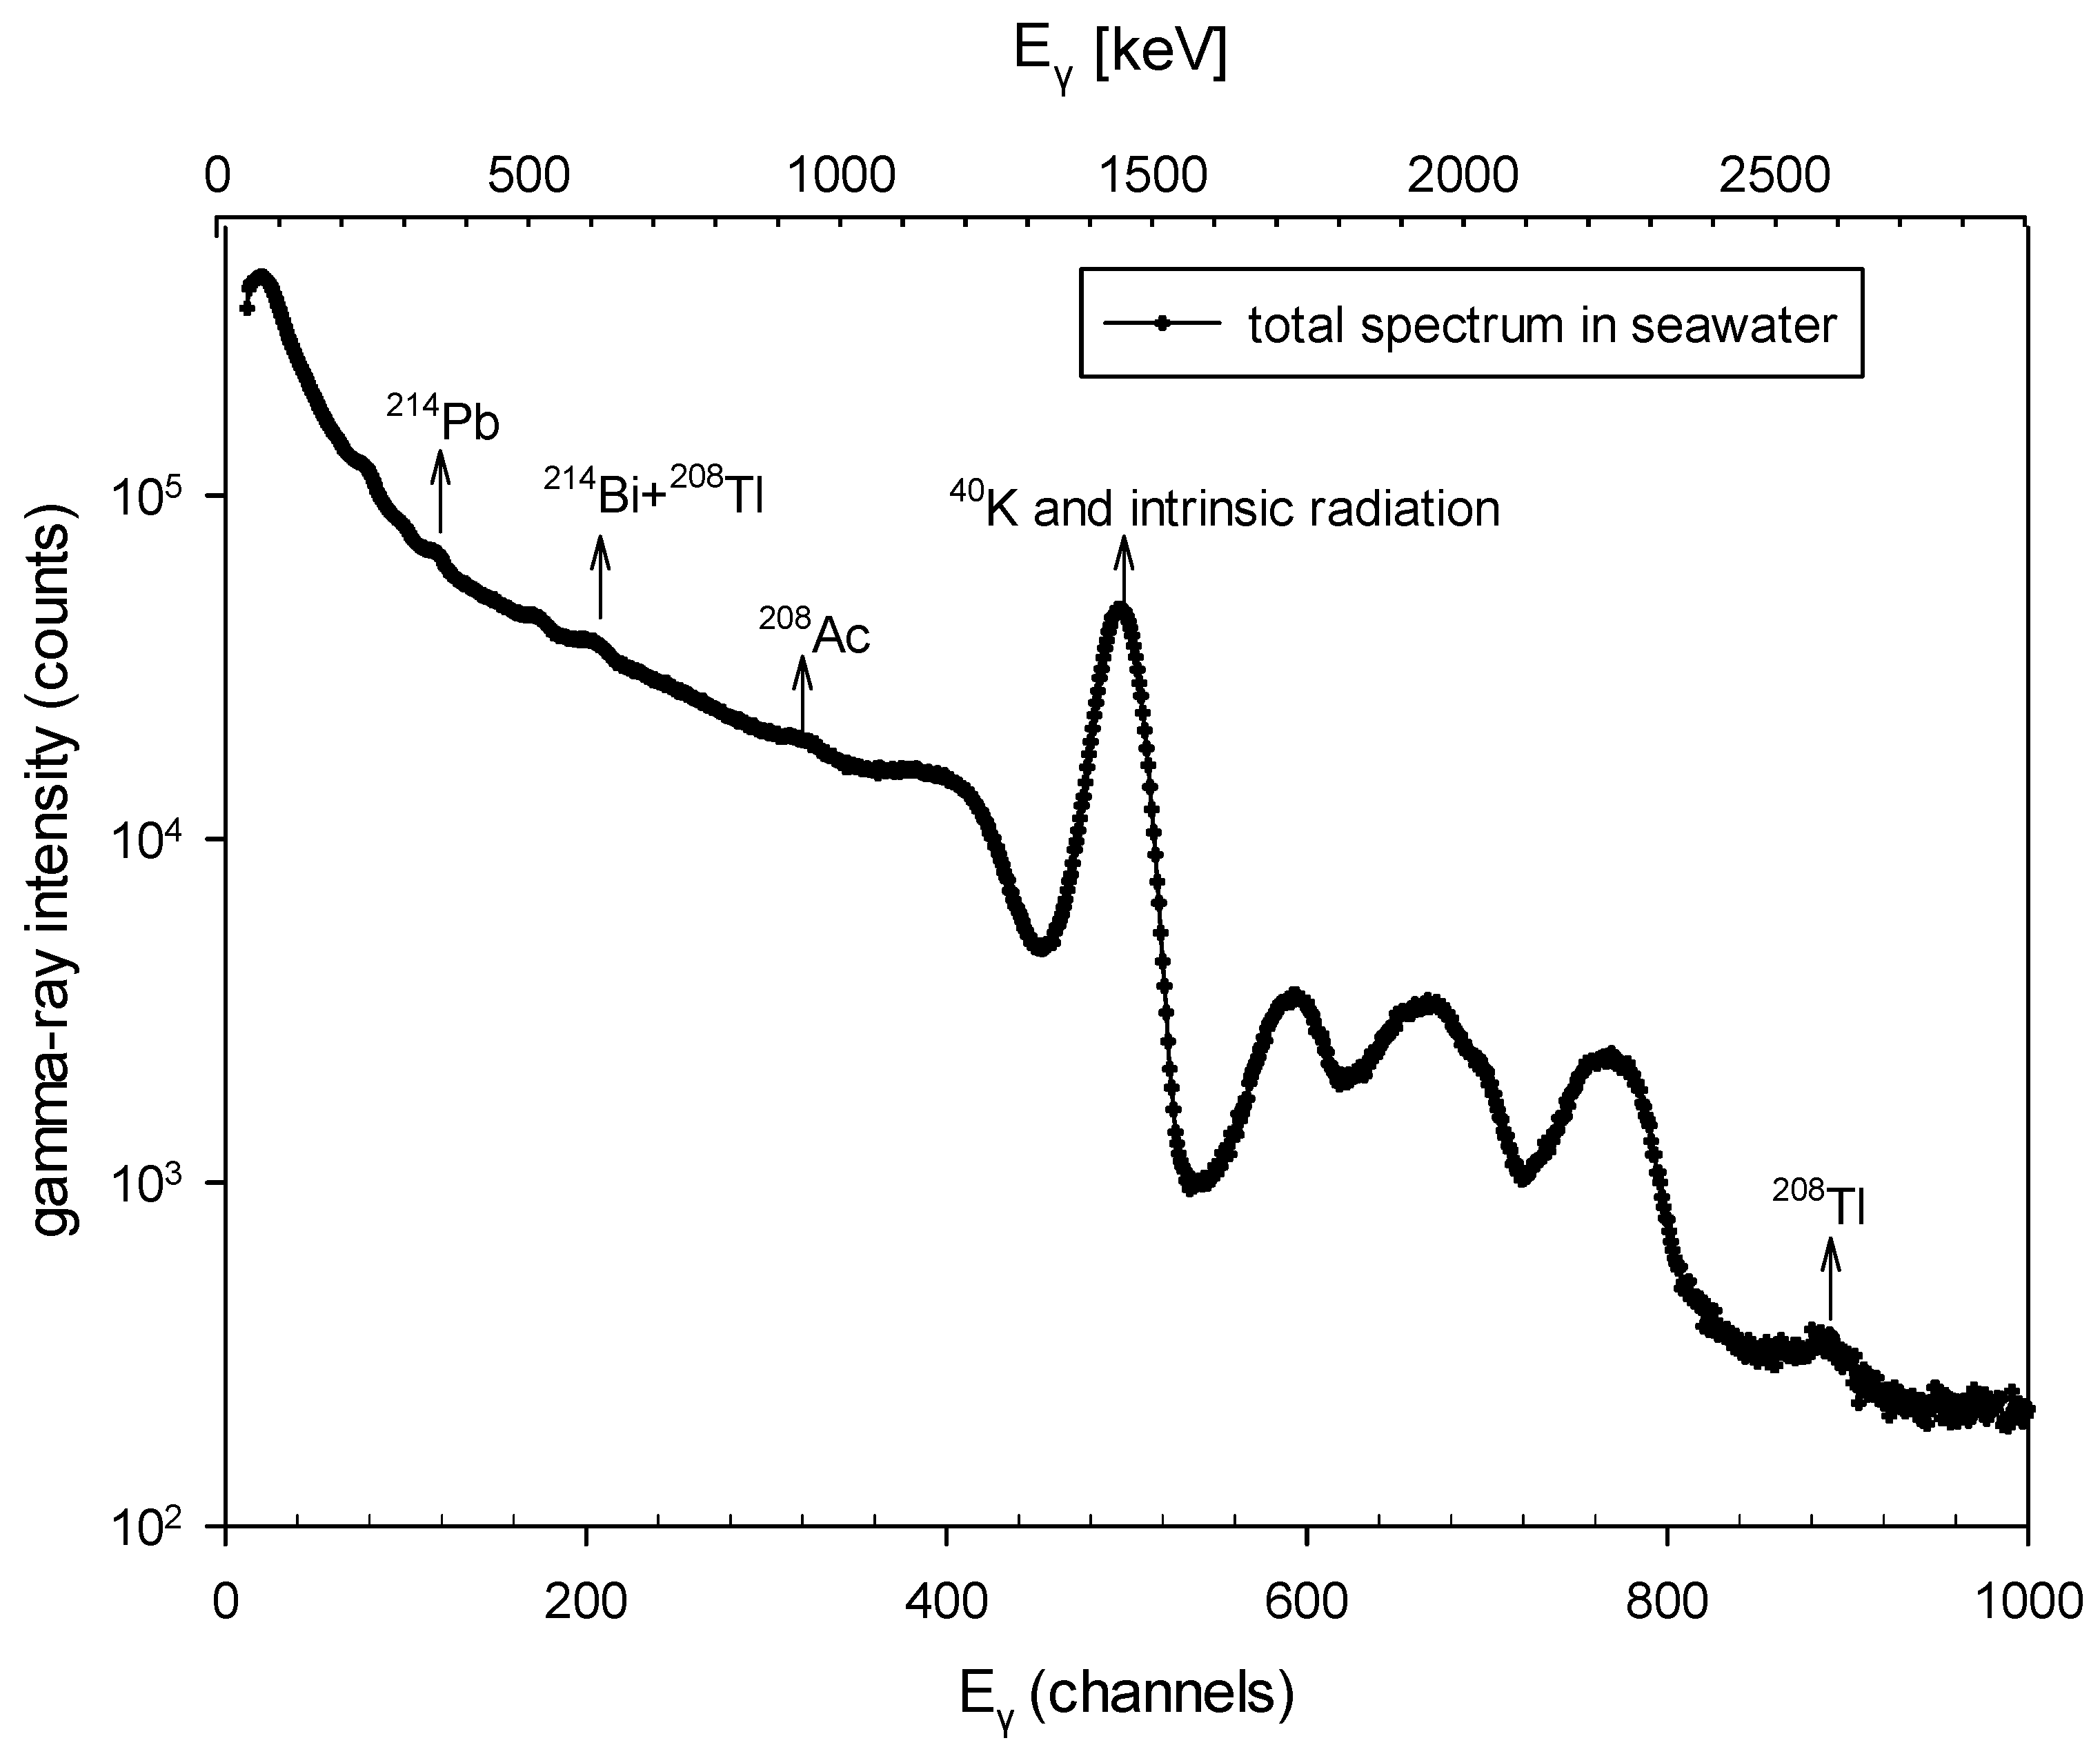
Figure 6.
The analysis [21] procedure for the folded low statistical photopeaks of 214Bi, 208Tl and 137Cs (at 609, 583 and 661 keV, respectively). The 137Cs contribution is very small and it is not evident in the graph.
Figure 6.
The analysis [21] procedure for the folded low statistical photopeaks of 214Bi, 208Tl and 137Cs (at 609, 583 and 661 keV, respectively). The 137Cs contribution is very small and it is not evident in the graph.
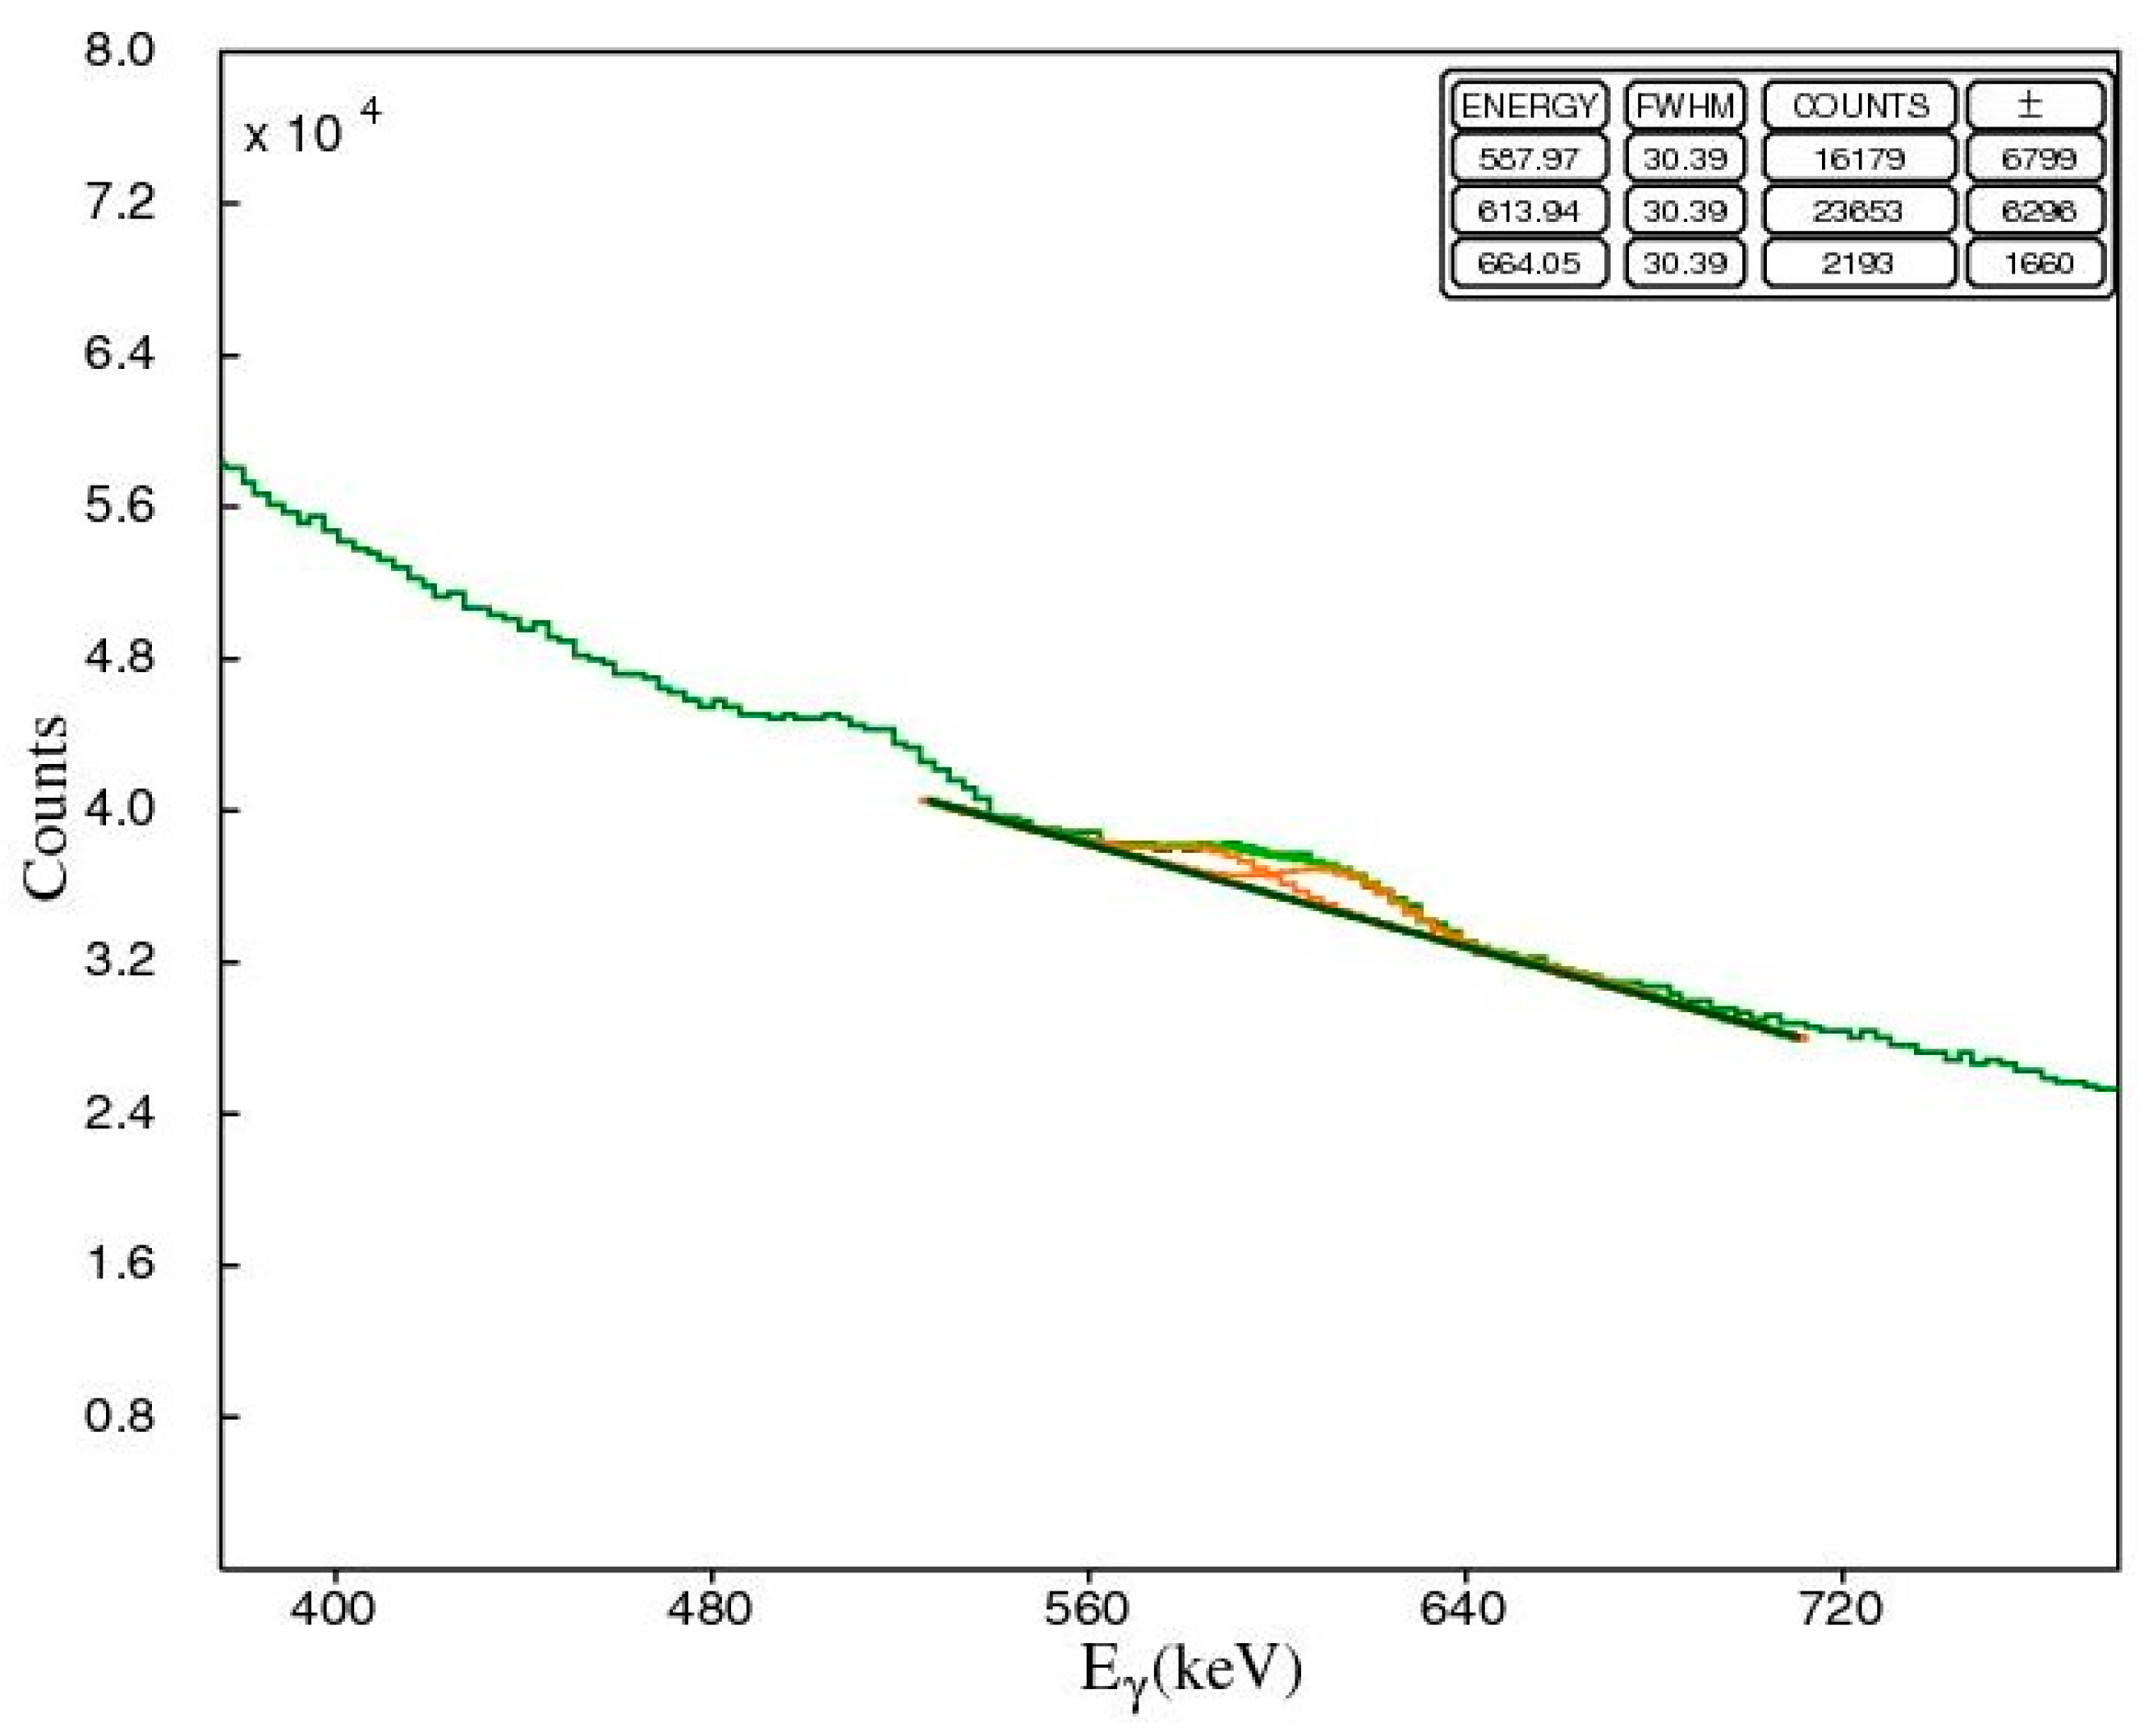
Figure 7.
The analysis [21] procedure for the folded low statistical photopeaks of 214Pb (at 291 and 351 keV, respectively). The depicted counts include the contribution of 228Ac and 212Pb.
Figure 7.
The analysis [21] procedure for the folded low statistical photopeaks of 214Pb (at 291 and 351 keV, respectively). The depicted counts include the contribution of 228Ac and 212Pb.
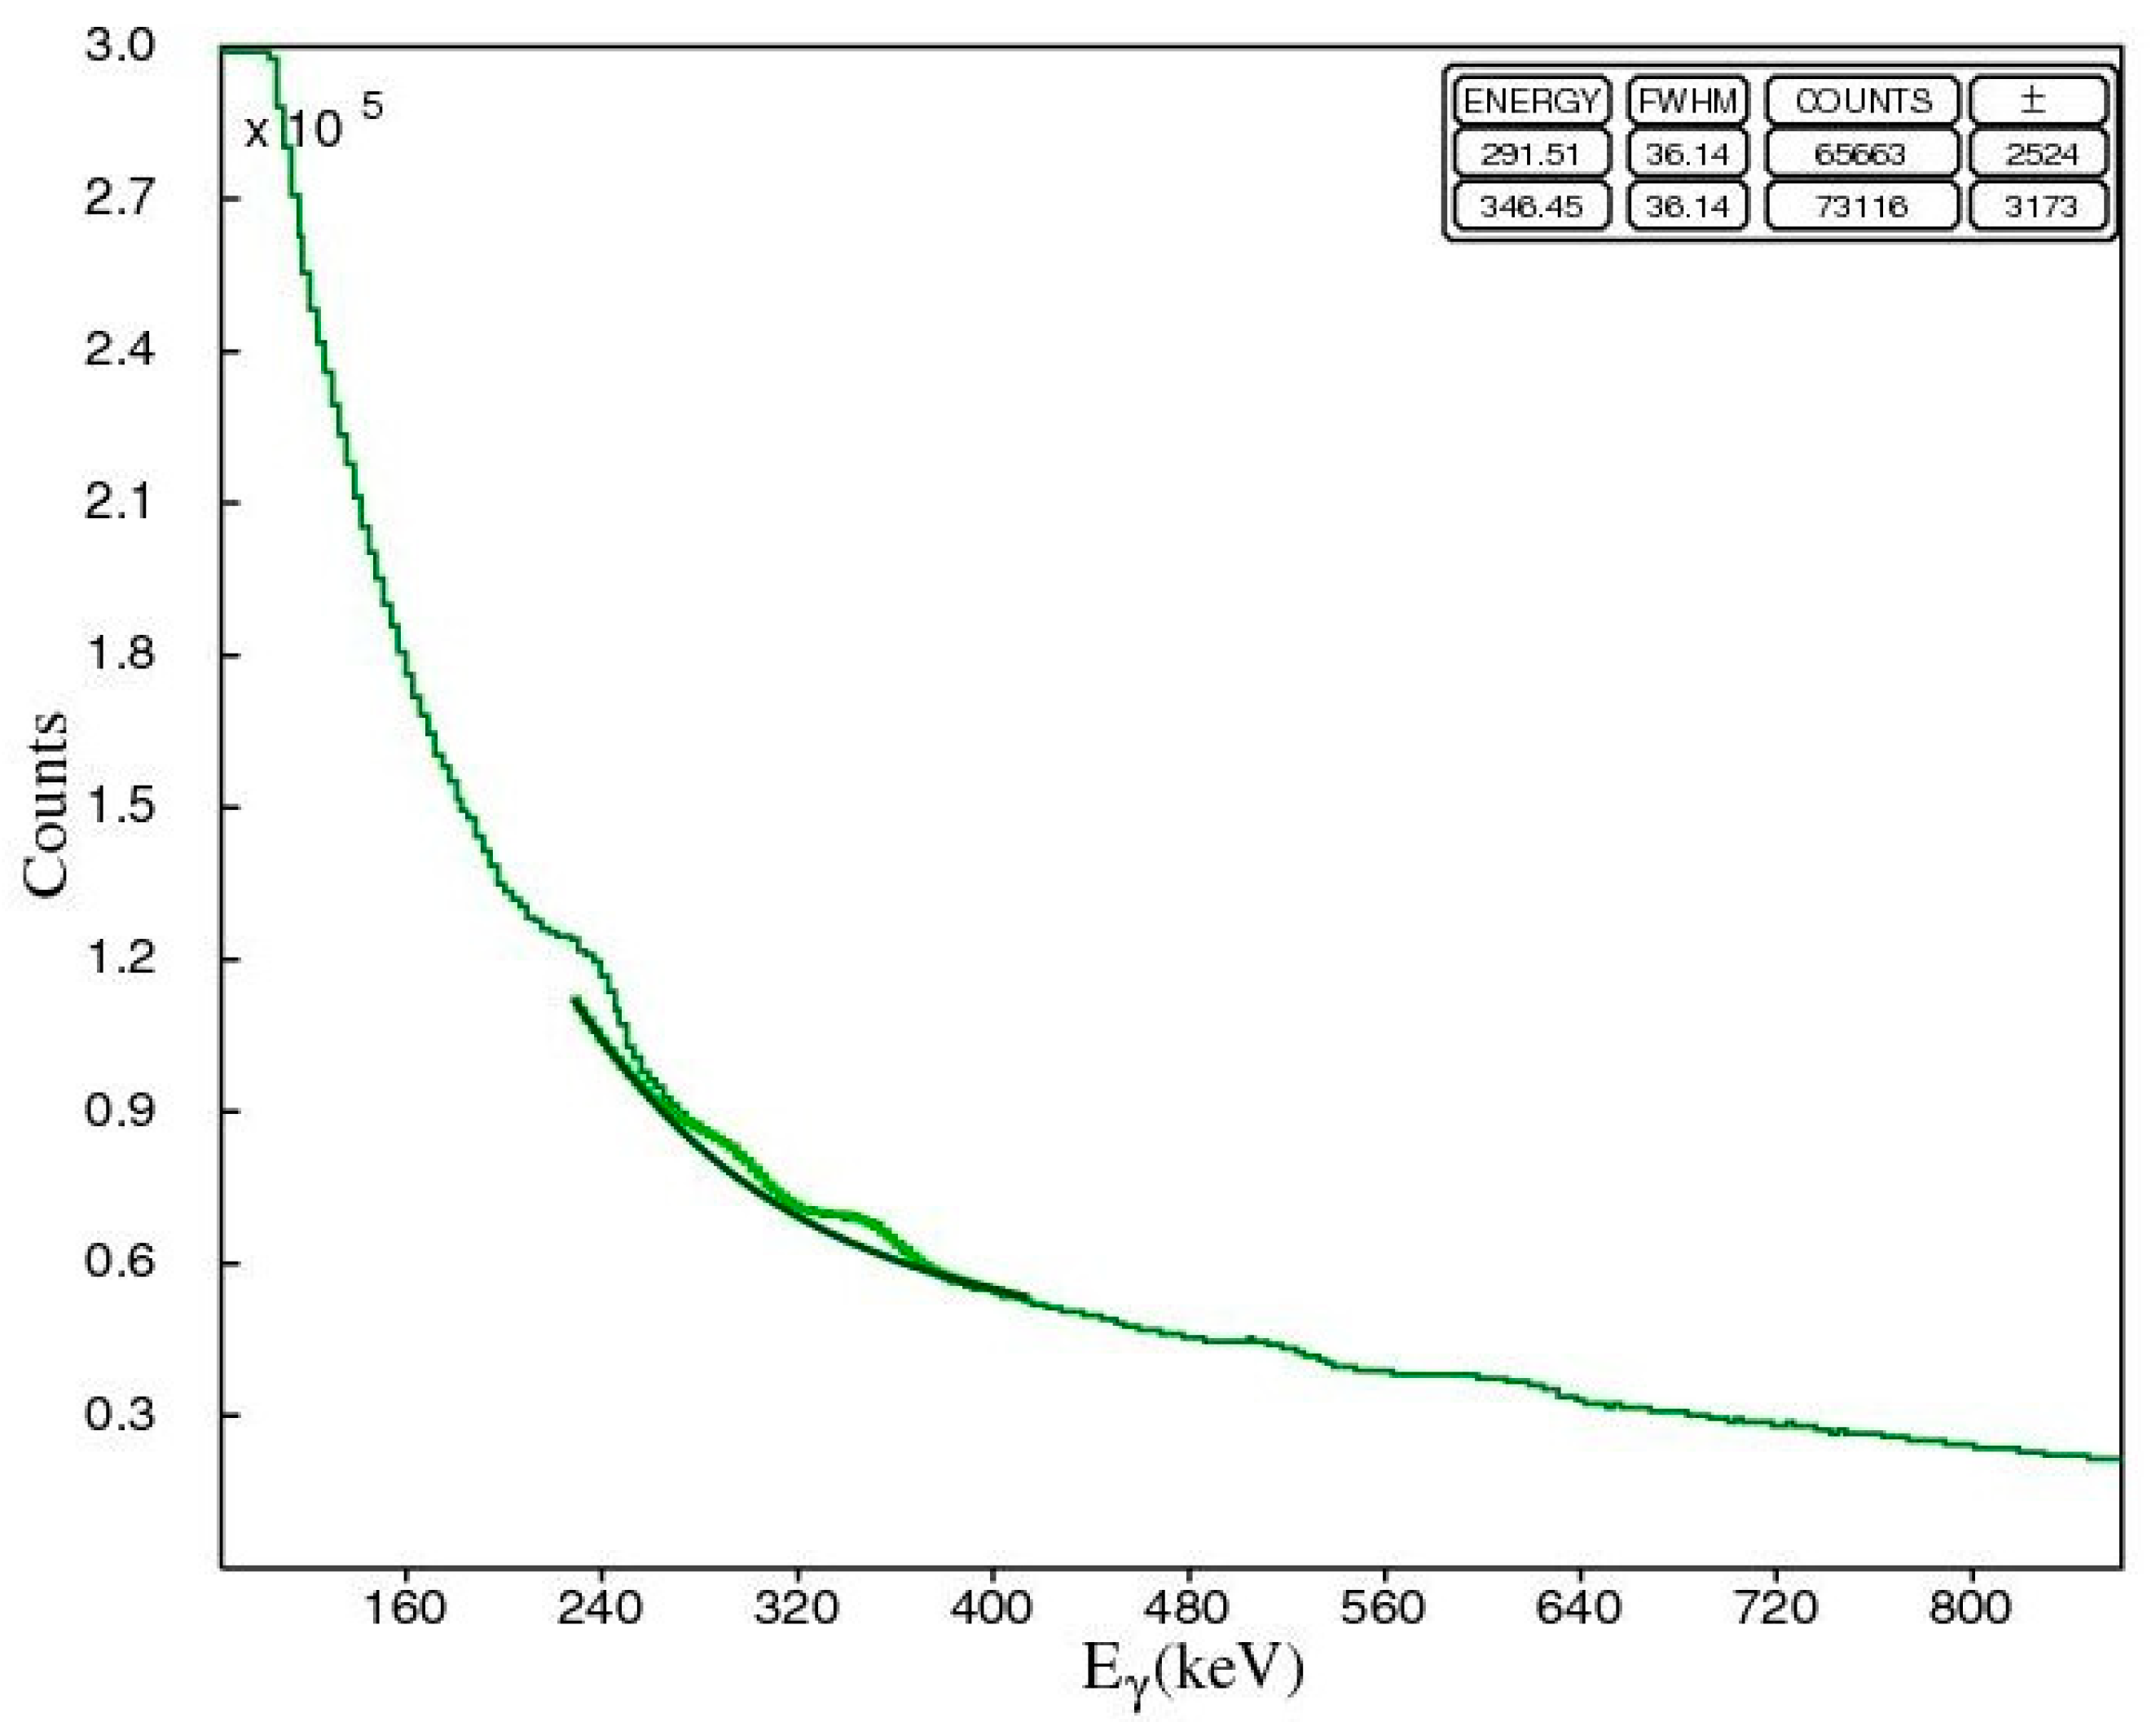
Figure 8.
Rainfall data in lm-2 for the monitoring period. The data are averaged for each day.
Disclaimer/Publisher’s Note: The statements, opinions and data contained in all publications are solely those of the individual author(s) and contributor(s) and not of MDPI and/or the editor(s). MDPI and/or the editor(s) disclaim responsibility for any injury to people or property resulting from any ideas, methods, instructions or products referred to in the content. |
© 2025 by the authors. Licensee MDPI, Basel, Switzerland. This article is an open access article distributed under the terms and conditions of the Creative Commons Attribution (CC BY) license (http://creativecommons.org/licenses/by/4.0/).
Copyright: This open access article is published under a Creative Commons CC BY 4.0 license, which permit the free download, distribution, and reuse, provided that the author and preprint are cited in any reuse.


