1. Introduction
Children with autism spectrum disorder (ASD) have impairments in their social-emotional functioning and abnormalities in their emotional development compared with typically developing children. Children with autism have difficulties in recognizing and understanding others’ emotions and in processing their own emotions [
1]. Typically, they exhibit inadequate or excessive emotional reactions [
2] and cannot convey their feelings recognizable and comprehensible to normal people, which can lead to severe problems in social interactions [
3] and, consequently, affect their mental health. Therefore, accurately identifying and understanding the emotions of children with autism is essential for developing targeted interventions and support strategies. However, at present, the emotional states of children with autism are predominantly evaluated and interpreted by trained therapists or psychologists, which can be a challenging and long-term process for inexperienced families and intervenors.
Existing research on the emotions of children with autism primarily focuses on comparing the emotion recognition abilities of children with autism with those of typically developing children. There is little research on the external emotional expressions and internal emotional activities of individual children with autism. In typically developing children’s learning affective computing domain, many studies have examined the tracking changes in individual learning emotions [
4,
5]. These studies involve creating datasets of children’s emotions and employing deep learning technology to construct models for recognizing emotions [
6], thereby enabling intelligent detection of children’s learning emotions. However, compared with those of typically developing children, the facial muscle movements of children with autism are different [
7], and their facial expressions exhibit asynchrony [
8] and lower complexity [
9]. These findings lead to the fact that affective computing models and datasets for the general population cannot be directly adapted and applied to this special group of children. In addition, the language development ability of children with ASD, who have fewer verbal expressions and more emotional elements in their speech, lags behind that of typically developing children. For example, special pronunciations such as “babbling” and “growling” contain negative emotions. Therefore, the speech modality can be used as a key reference for emotion recognition of children with ASD.
The current research on automatic emotion recognition of children with ASD has the following limitations:
(1) The existing studies mainly rely on single-modal data such as facial expressions to analyze the emotions of children with ASD. This approach may not comprehensively capture these children’s emotional states. For example, the emotional expression of happiness is typically accompanied by multiple simultaneous responses such as smiling, high pitch, and quick speech. To enhance the accuracy and robustness of emotion recognition, the emotional information from the facial expressions and speech of children with autism can be cross corroborated and compensated for. Therefore, the construction of multimodal datasets plays a crucial role in emotion recognition of children with autism.
(2) Emotion recognition algorithms have low accuracies. Traditional machine learning methods such as the support vector machine (SVM) or decision tree have limited performance in processing complex and high-dimensional data. The commonly employed deep learning model convolutional neural network (CNN) for emotion computation, which relies on local facial cues, cannot capture the interplay between different facial regions from a holistic viewpoint. The vision transformer model can effectively compute and assign weights to different facial regions to extract highly discriminative features from facial images. This capability enables the vision transformer to meet the specific requirements for emotion computation for children with autism.
To address the aforementioned issues, first, this study produces three datasets of facial expression images, speech Mel spectrograms, and Mel-frequency cepstral coefficients (MFCCs) from real-life videos of 33 children with autism at an educational rehabilitation facility. Second, we construct emotion recognition models with diverse architectures for distinct datasets and conduct training experiments to compare the performance of the models. On this basis, a feature fusion emotion recognition model is created using the convolutional vision transformer network and the multiscale channel attention module. The experimental results confirm the efficacy of this fusion strategy. Finally, gradient-weighted class activation mapping is used to visualize the model training outcomes, and the resulting heat map provides the basis for the manual identification of emotions of children with autism.
2. Related Works
2.1. Characteristics of Emotional Expressions of Children with Autism
The Diagnostic and Statistical Manual of Mental Disorders (DSM-5) defines ASD as a neurodevelopmental disorder characterized by impairments in social interaction and communication functioning, narrow interests, and stereotyped repetitive behaviors [
10]. Compared with typically developing children, children with ASD exhibit distinct variations in facial expression, speech, and other forms of emotional expression.
Regarding facial expressions, Guha et al. [
9] compared basic emotions between children with ASD and typically developing children, and found that the former have less dynamic complexity and left-right symmetry of the facial regions, and a more balanced movement intensity. Samad et al. [
7] discovered that the area and extent of activation of the facial muscles in children with ASD differ from those in typically developing children. According to Metallinou et al. [
8], children with autism have more asynchrony in their facial movements, exhibiting greater roughness and range in the lower region. Jacques et al. [
11] characterized the facial expressions of children with autism as incongruous, inappropriate, flat, stiff, disorganized, ambiguous, and having fewer positive emotions.
Children with autism have speech expression disorders [
12], and their intonation and rhythm are significantly different from those of typically developing children [
13,
14]. Yankowitz et al. [
15] found that children with autism exhibit delayed pronunciation, heterogeneous language performance, abnormal intonation rhythm, and monotonous or robotic-like speech, and express emotions through vocalizations such as screaming, shouting, and trembling. The following speech characteristics are also present in children with autism: prolonged vowels, stereotyped repetitions of meaningless discourse sequences [
16], and single-word verbal expressions [
17].
2.2. Emotional Perception of Children with Autism
Research has indicated that facial expressions account for 55% of human emotional expressions, whereas voice and words account for 38% and 7%, respectively [
18]. This shows that an individual’s emotional state can be judged mainly from facial and speech expressions. Hence, data analysis based on facial expressions and speech features has been widely used in the field of emotion recognition of children with autism.
Facial expression is an important factor in evaluating an individual’s emotional state. Using electromyography, Rozga et al. [
19] analyzed facial muscle movements under different emotions in children with autism and found that their zygomatic and frowning muscles show less variation than those of typically developing children. Jarraya et al. [
20] used Inception-ResNet-V2 to extract facial expression features such as fear and anger in the meltdown state of children with autism, and developed a system for detecting and alerting meltdown emotions. Fatma et al. [
21] developed a CNN-based emotion recognition system for children with autism that recognized six facial expressions in real time through a camera while children were playing games and generated analysis reports that can be used for the development of targeted therapeutic interventions.
Another critical factor in identifying the emotions of children with autism is speech characteristics. Landowska et al. [
22] conducted a study on the application of emotion recognition techniques for children with autism. They found that SVM and neural networks are the most frequently used techniques, with the best effects. Ram et al. [
23] developed a speech emotion database for children with autism that is based on the Tamil language, retrieved acoustic features such as MFCCs using SVM, and identified five emotions, including anger and sadness. Sukumaran et al. [
24] created a speech-based emotion prediction system for children with autism by extracting two acoustic features, namely MFCCs and spectrograms, and using the multilayer perceptron classifier to predict children’s seven basic emotions. Emotion perception methods for children with autism have been progressing towards intelligence, with developments in deep learning and large data analysis technologies. Neural networks are increasingly becoming the dominant technology in this field. Nevertheless, most current studies have been limited to analyzing single-modal data such as facial expressions or speech characteristics. Few studies have investigated the emotion perception of children with autism from the perspective of multimodal data fusion.
2.3. Multimodal Fusion in Emotion Recognition
Human emotions are inherently multimodal and usually interwoven by multiple dimensions of information, including facial expressions, speech features, and physiological signals. Multimodal emotion recognition is a method for assessing emotions thoroughly by combining data from various sources, resulting in higher accuracy and robustness than single-modal recognition [
25]. Children with autism typically display rigid, exaggerated, or inadequate facial expressions that fail to effectively convey their emotional condition. In addition, they express their emotions through unique vocal tones and patterns. For example, despite being in anger, certain children may maintain calm facial expressions while channeling their feelings through repetitive screaming. Single-modal emotion identification may not always effectively identify the feelings of children with autism. In contrast, multimodal fusion can deeply analyze the complementary nature of the data, making it more appropriate for emotion detection of children with autism.
Typical multimodal fusion strategies can be classified into three categories, namely data-, feature-, and decision-level fusion. Data-level fusion involves combining the original data from various modes into a single feature matrix, and subsequently performing feature extraction and decision discrimination on the fused data [
26]. It effectively retains the original data information but fails to fully use the complimentary information included in different modal data because of redundant data. Feature-level fusion fuses modal data into a new feature matrix after extracting them through a feature extraction network [
27]. The commonly used feature fusion methods include serial, parallel, and attention-based fusion [
28]. Attention-based fusion methods enable deep neural network models to selectively dismiss irrelevant information and focus on crucial information. This approach is widely used in existing research to enhance the performance of models [
29]. Decision-level fusion involves the local classification of various modal data using appropriate deep learning models, followed by global fusion of the model output values using maximum, mean, or Bayes’ rule fusion. The training processes of this method are independent and do not interfere with or impact one another, but it is prone to overlooking the complementary information between distinct modal data.
3. Dataset
3.1. Data Collection
3.1.1. Participants
Data were obtained through follow-up filming at a non-profit educational rehabilitation institution that specializes in the rehabilitation of children with autism and related disorders in Zhejiang Province, China. A total of 36 children with autism, consisting of 18 girls and 18 boys, were recruited for the study. Prior to participation, their parents signed an informed consent form and a confidentiality agreement. The recruited children met the DSM-V diagnostic criteria, were diagnosed with ASD by a professional pediatrician, and had no psychiatric or developmental disorders other than autism. Among the children, three boys were unwilling to wear recording equipment during the filming process and were thus excluded from the study. Finally, 33 children completed the task for data collection.
3.1.2. Methods
In data collection, the emotion-evoking approach was abandoned in favor of filming the children with autism in their natural state of learning and living in a one-on-one rehabilitation classroom. Owing to stereotyped behaviors and resistance to changes in daily routines, the installation of video cameras in the classroom can cause children with autism to resist the surroundings and disrupt the intended filming effect. To prevent this, a 14-day period was scheduled for the subjects to adapt to the equipment, facilitating the children’s swift adjustment to the modified learning environment. After the adaptation period, the data collectors chose either handheld or static filming depending on the type of the children’s activities. Ultimately, through this experiment, 698 video clips were collected, of which 31 were deleted because the teacher’s explanation was too long or the children’s vocalizations were too few, resulting in 667 effective video clips.
3.2. Data Processing
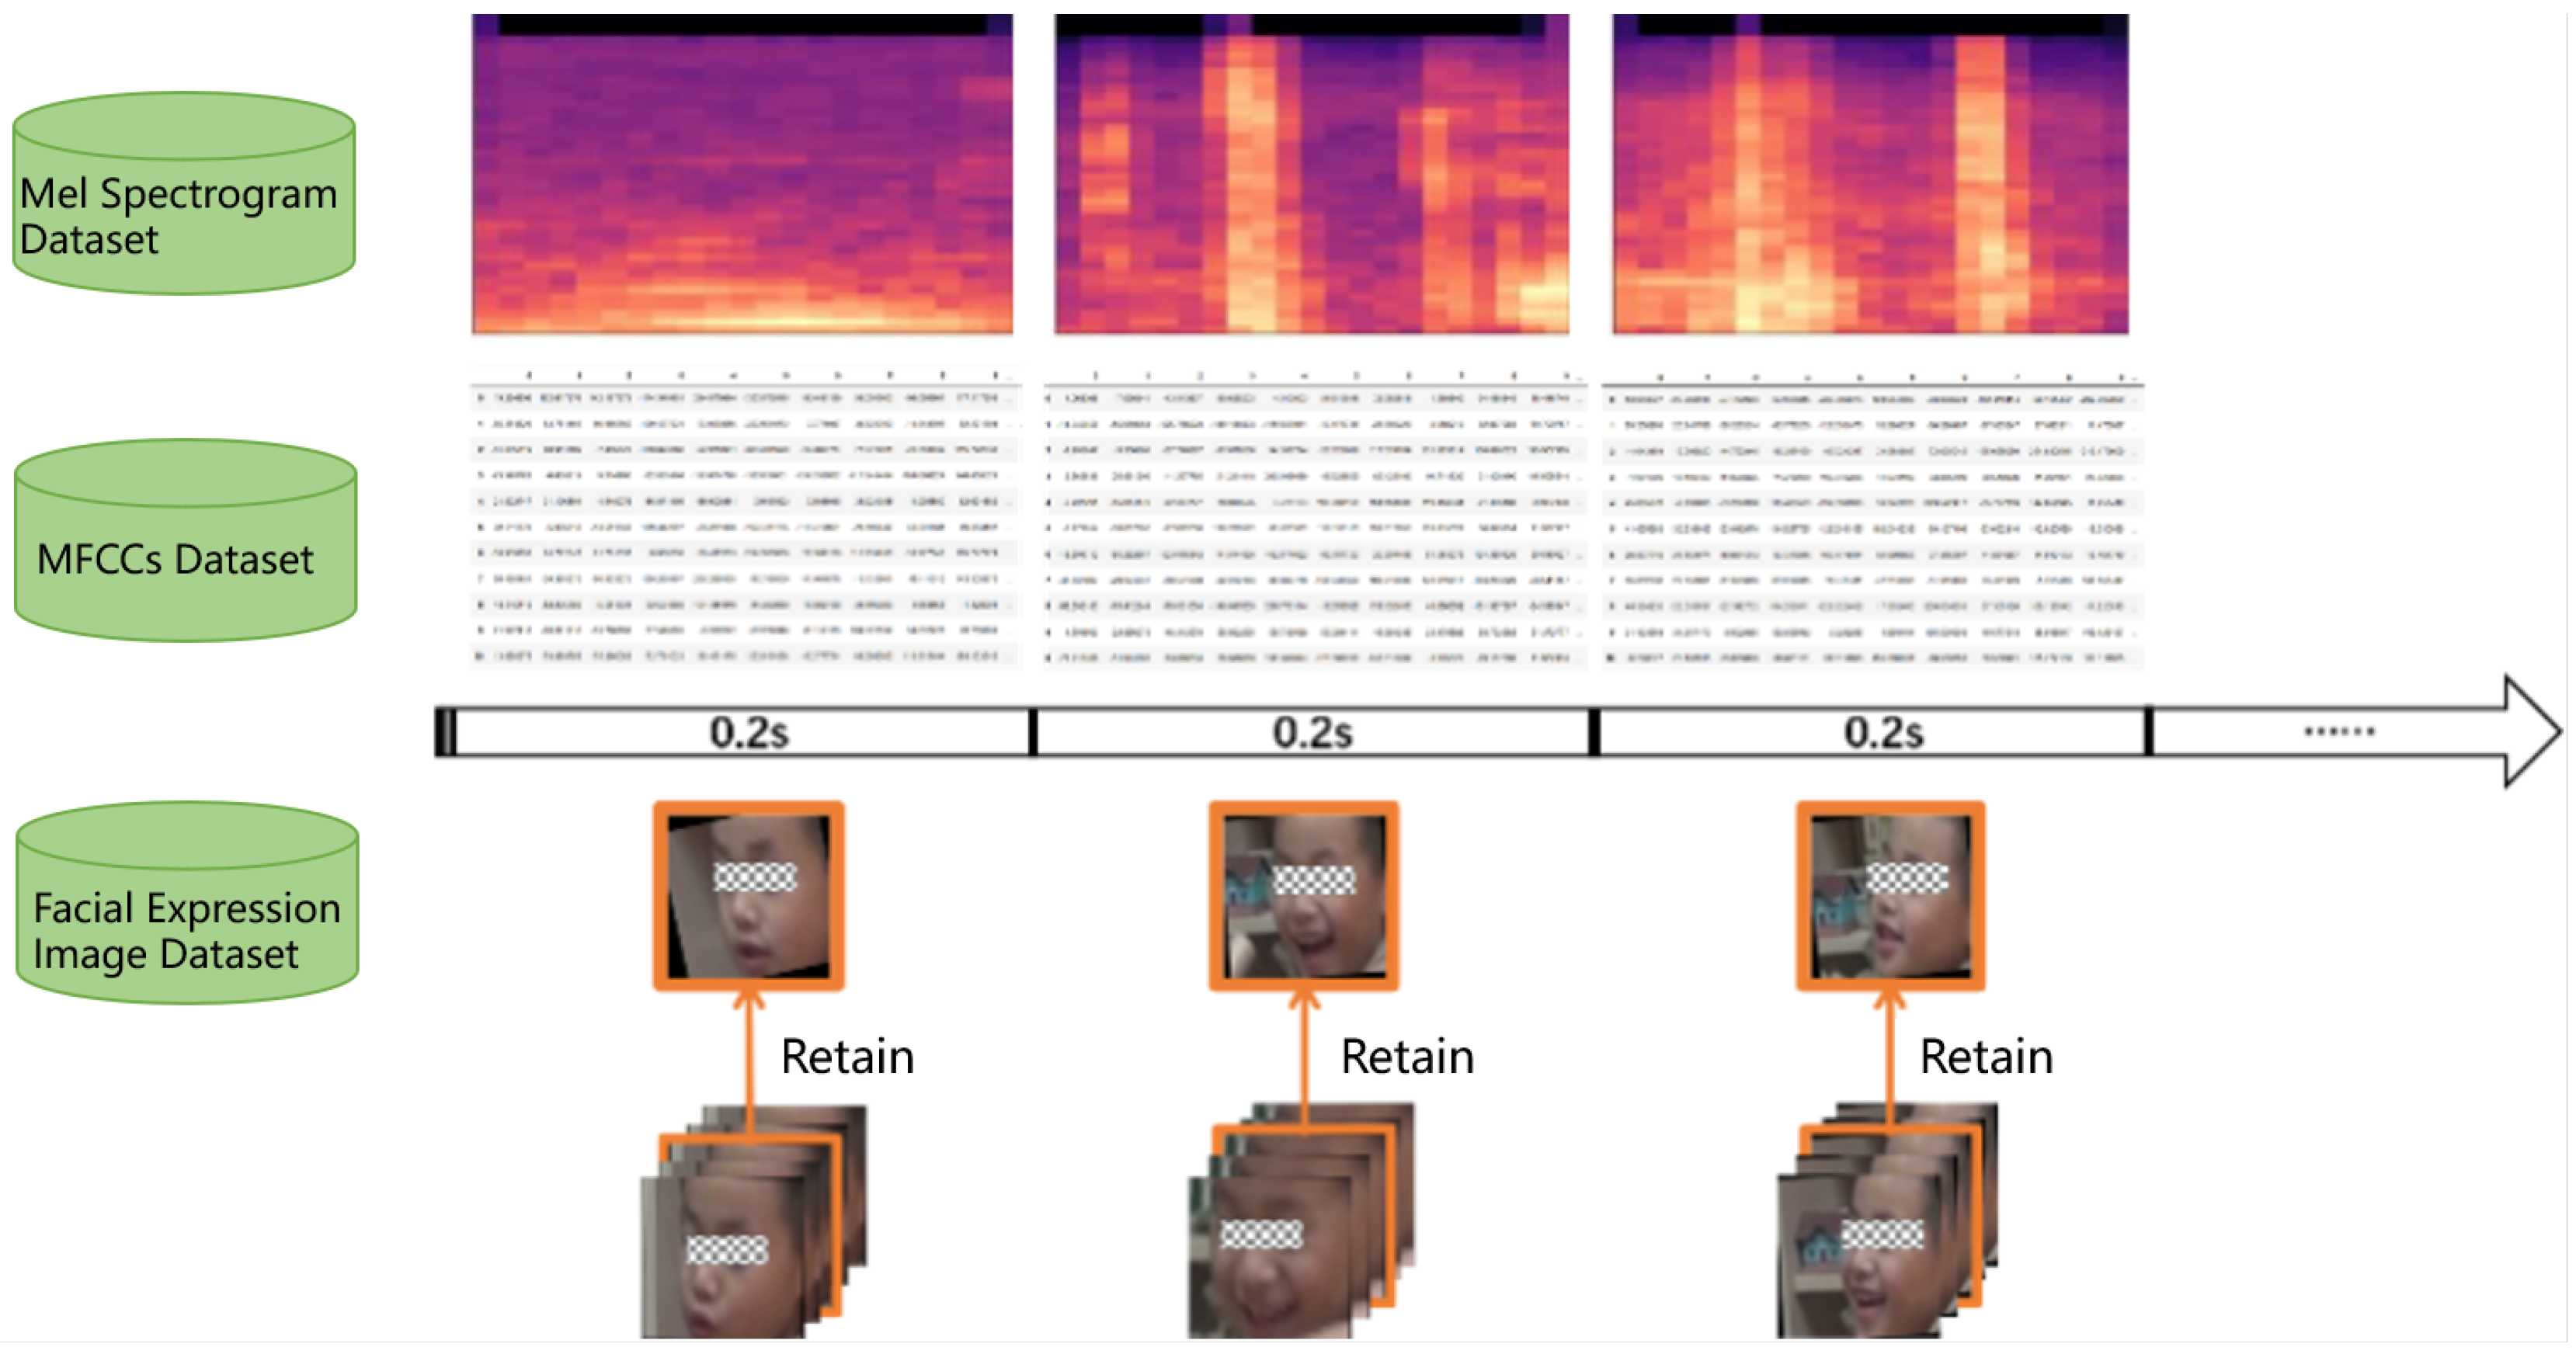
Facial emotions can be inferred from facial activity units in a single frame of an image; however, split-frame speech data are too short and insufficient to discern the emotion conveyed therein. In the field of speech signal processing, the signal features of speech are widely accepted to remain essentially in a quasi-steady state over a short time span. Given these features, the study matches the modal timing with the identical time principle, using Adobe Premiere to separate the sound and picture from the recorded video to obtain the time-synchronized silent video and audio files, and then divide the video and audio files into several 0.2-second segments, as shown in
Figure 1.
3.2.1. Facial Expression Image Processing
The video footage captured during the study includes the child’s head, upper body, or entire body, together with the surrounding backdrop environment. This has an impact on the precision of emotion detection. Hence, it is necessary to conduct video processing, including video framing, face cropping, and face alignment.
Initially, the original video was transformed into individual frame images using the OpenCV tool in Python. The video has a frame rate of 25 frames per second, resulting in the automatic capture of one frame every five frames. In addition, to isolate the subjects’ facial expressions, facial photos were preserved using a single-shot multibox detector to focus on the fine-grained state of the facial expressions. Finally, the spatial constraints of the facial key points in the Dlib model were used to align the facial images in different positions with the coordinates of the overall centers of the left and right eyes as the base point. This reduced the impacts of sideward, tilted, and lowered head poses on the positioning of facial feature points. After manual screening, 24,793 facial expression images were finally obtained.
3.2.2. Speech Feature Processing
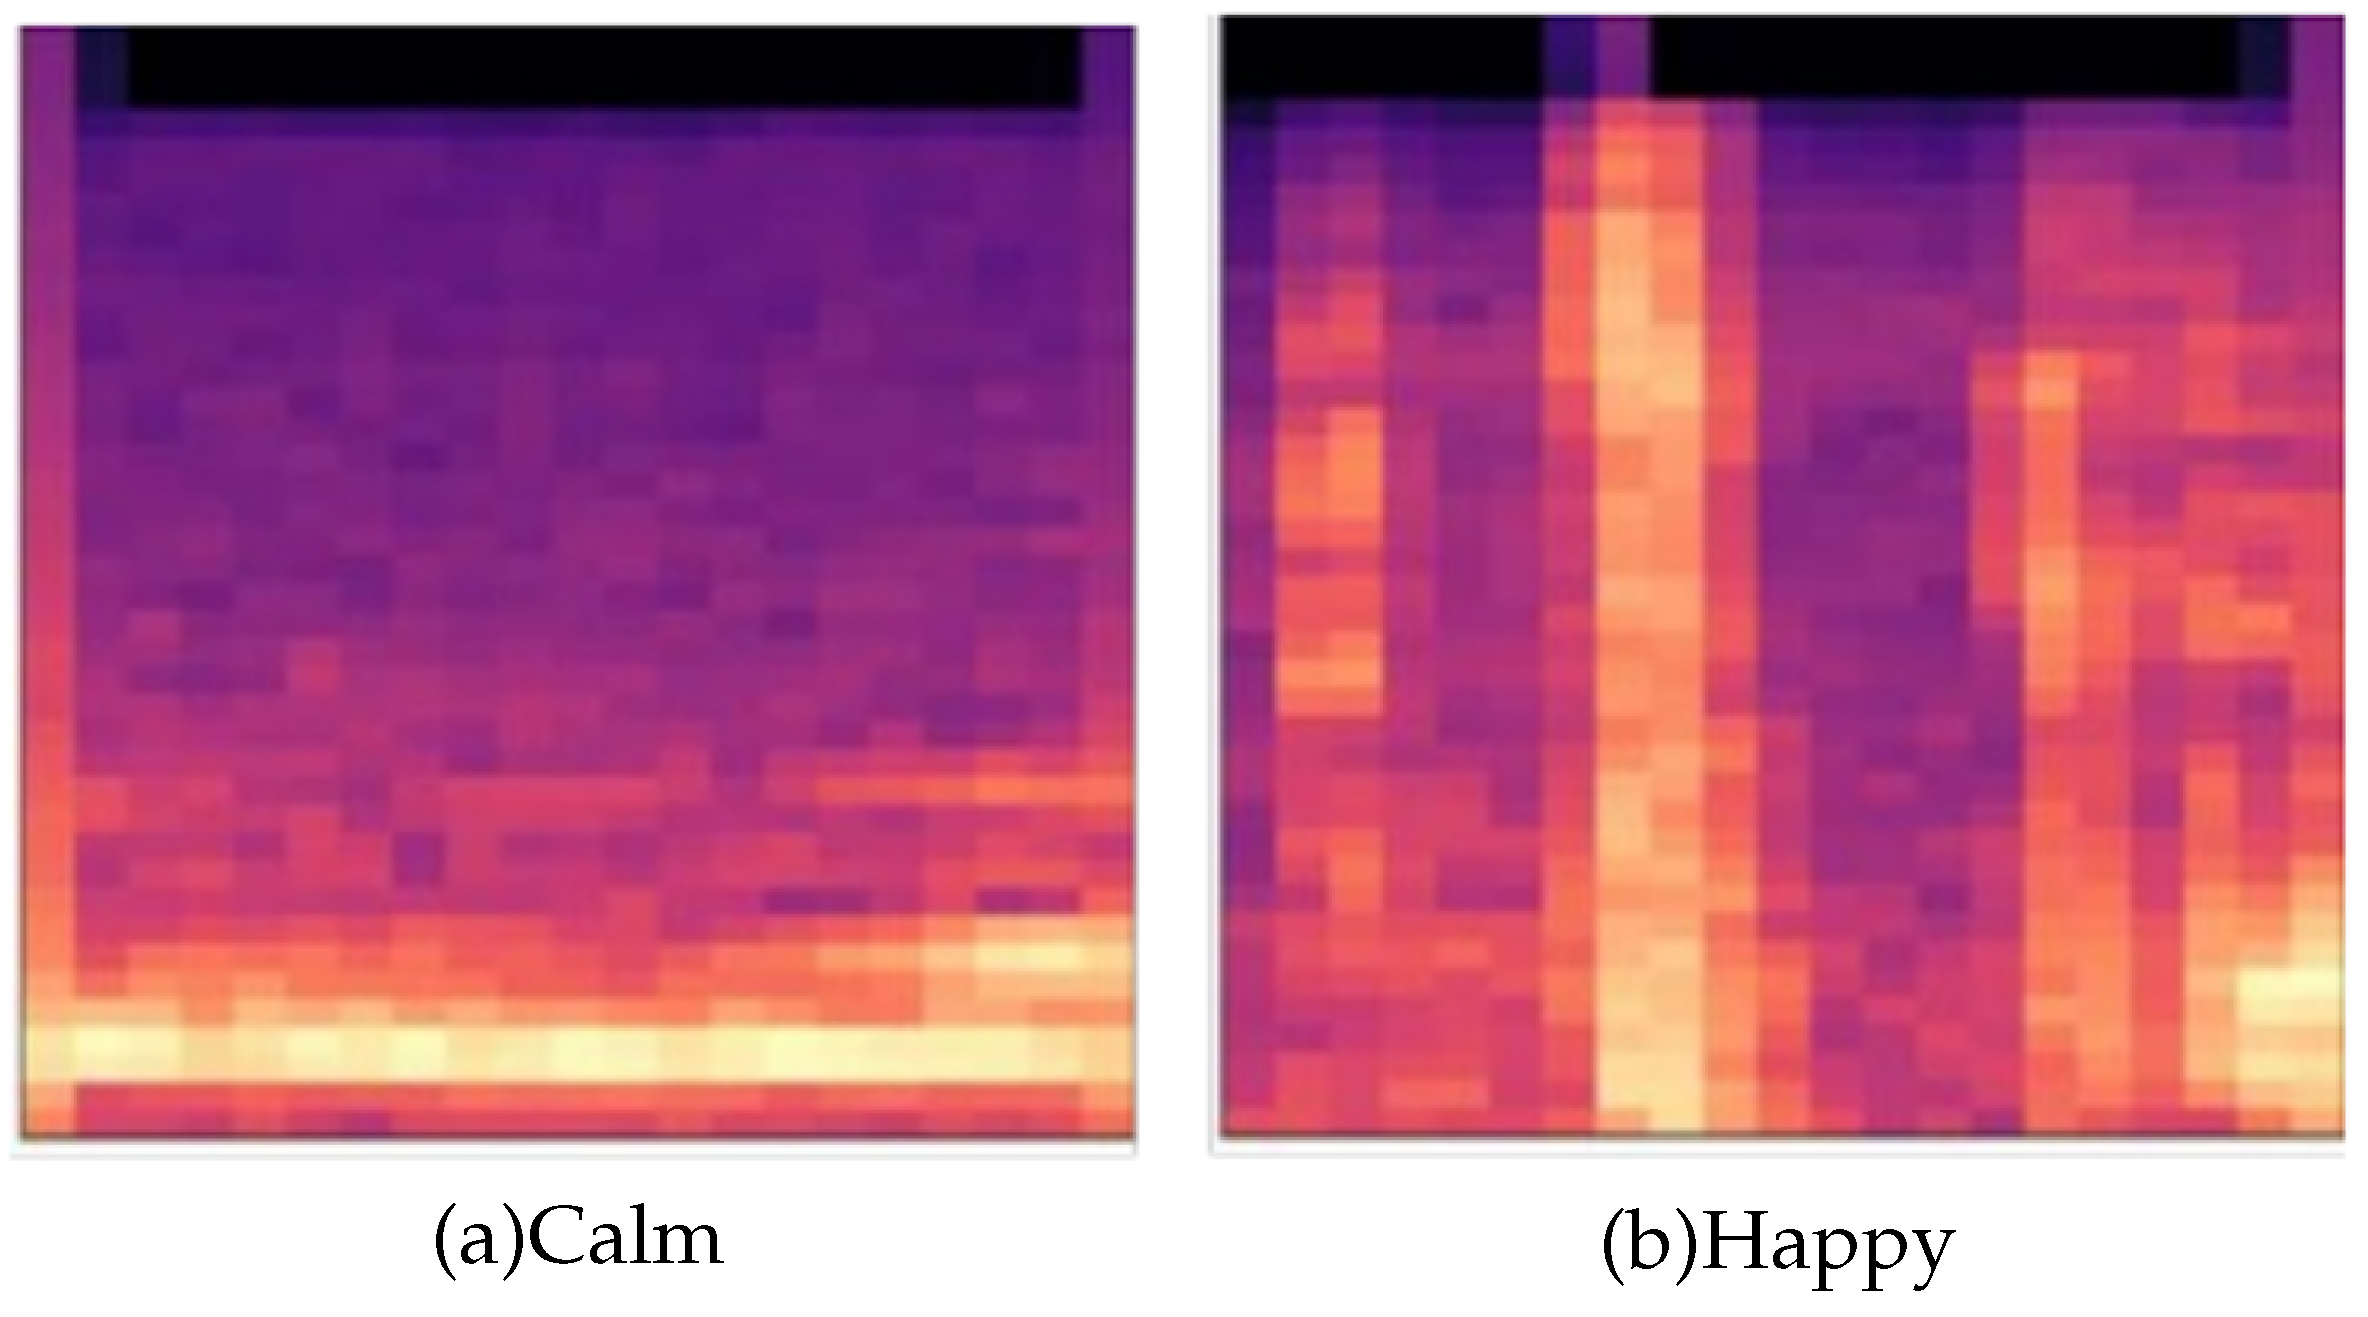
Mel spectrograms and MFCCs are widely used methods to characterize speech signals in the field of speech emotion recognition. Mel spectrograms display the temporal, amplitude, and frequency of audio signals through two-dimensional axes. The horizontal axis shows the change in time, the vertical axis reflects the magnitude of frequency, and the colors indicate the strength of energy. In this study, we use the Librosa Python library to convert original speech files into Mel spectrograms, as shown in
Figure 2. MFCCs are generated by applying discrete cosine transform operations on the Mel spectrograms, resulting in cepstrum analyses of the Mel frequency, which can accurately capture the resonance peaks of speech signals and the distribution of energy in different frequency ranges.
The generation of the Mel spectrograms and MFCCs is illustrated in
Figure 3. The original audio file was subjected to sequential pre-emphasis, frame splitting, windowing, Fourier transformation, and Mel filter bank operations to produce Mel spectrograms. Finally, a discrete cosine transform operation was applied to generate MFCCs. In accordance with the preceding steps, 667 audio segments collected from the filming process were submitted to the speech feature extraction process. After manual screening, the final numbers of Mel spectrograms and MFCCs are 24,793 and 942,134, respectively.
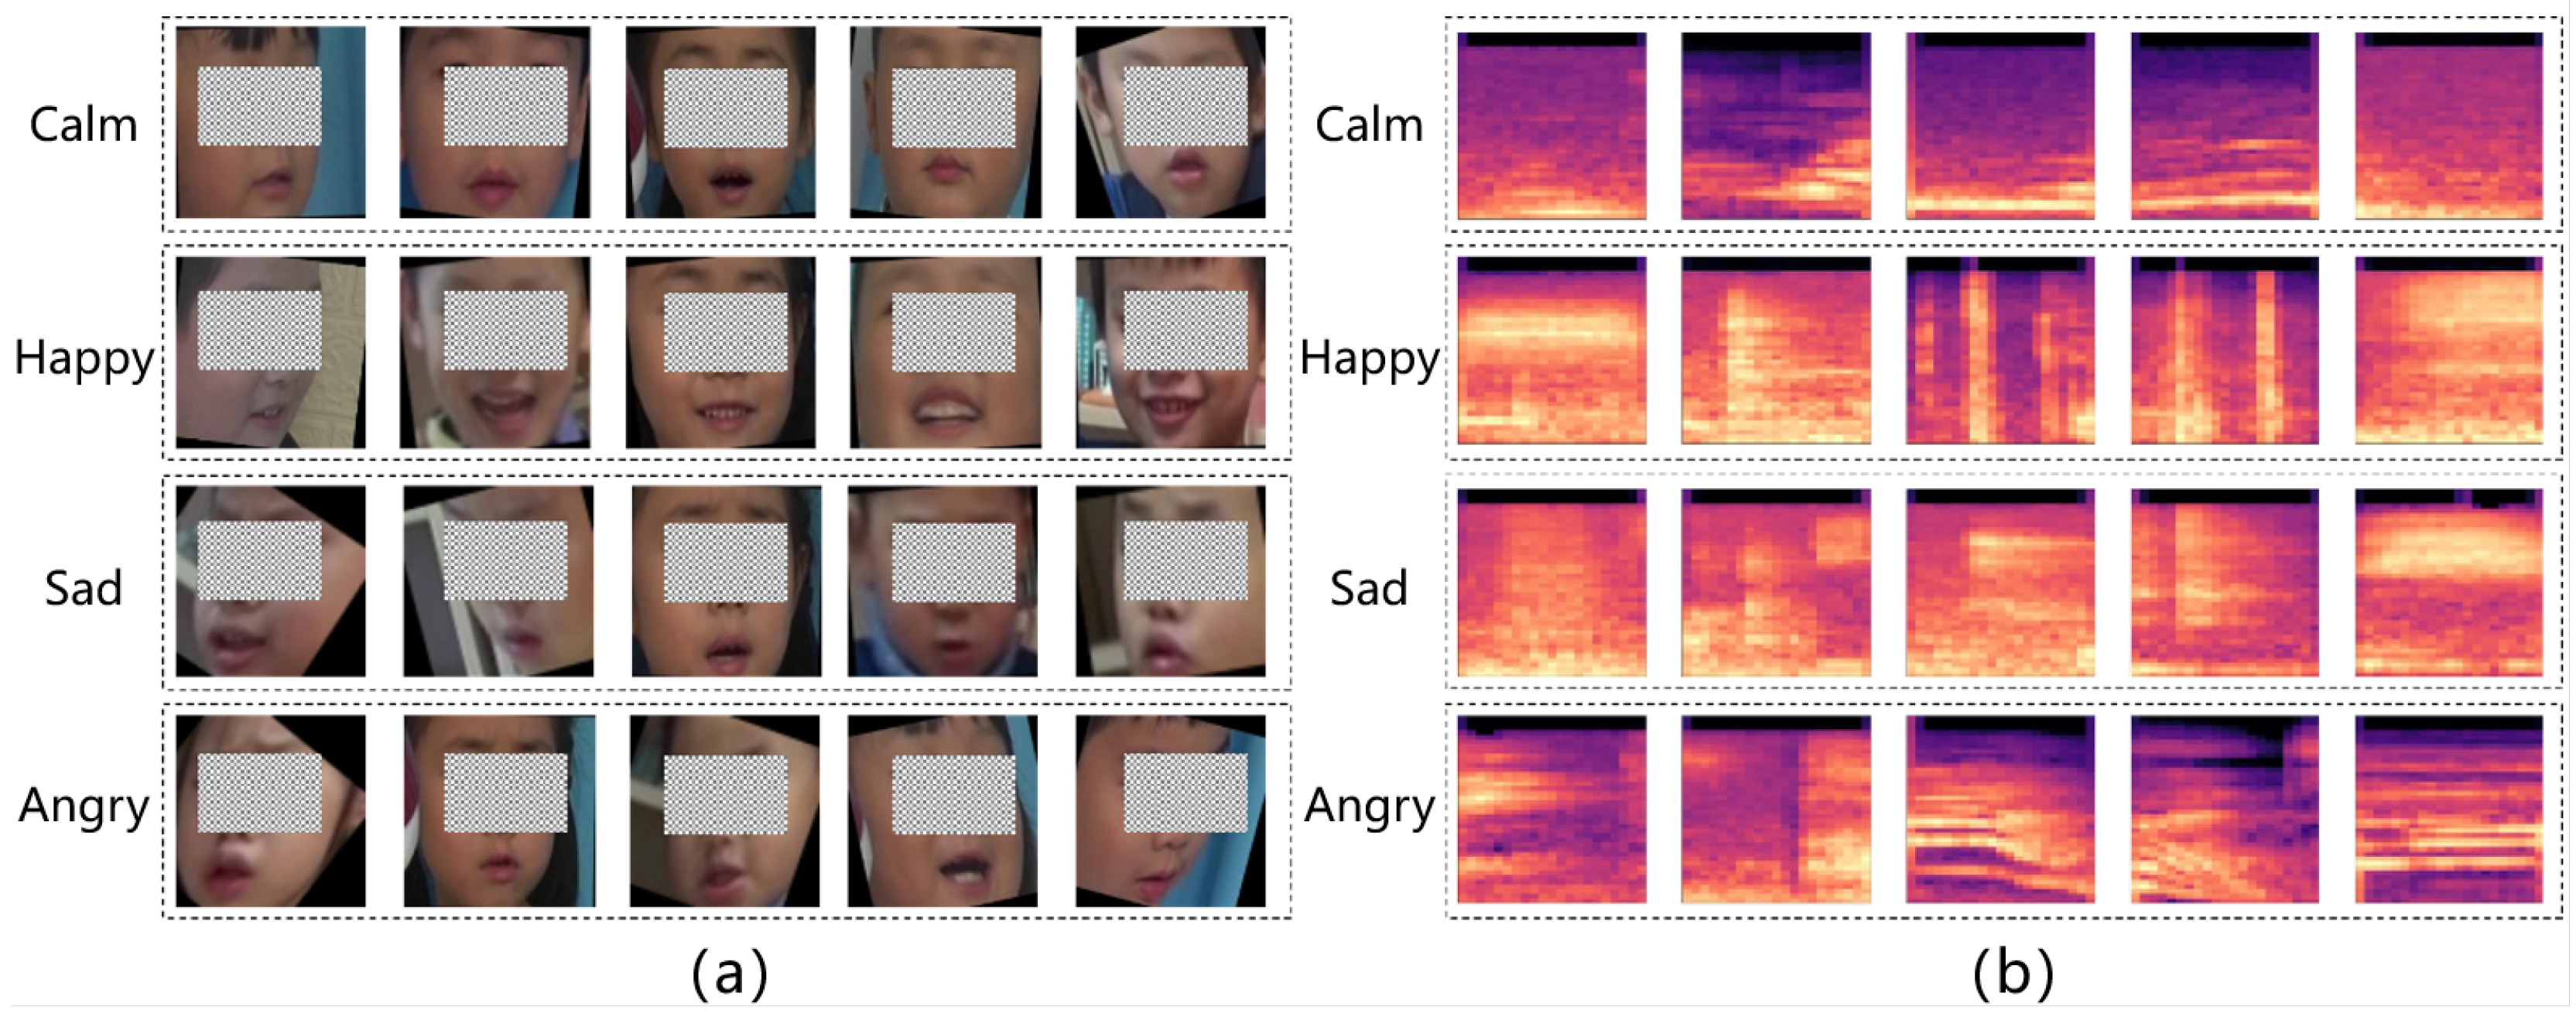
3.3. Data Annotation
This study uses PyQt5 to develop a multimodal emotion tagging tool that can concurrently annotate facial photos, Mel spectrograms, and MFCCs for a given time series. The annotation team comprises of a rehabilitation trainer for children with autism and three individuals responsible for tagging emotions. The rehabilitation trainer devises the tagging standards on the basis of the facial activity unit of children with autism, including four emotion types, namely calm, happy, sad, and angry (
Table 1).
Using the data annotation tool we developed, we carried out data annotation according to a multi-round, multi-person process to produce a multimodal dataset with emotion labels, as shown in
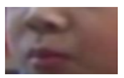
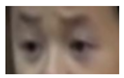
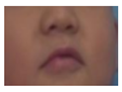
Figure 4. The facial expression image datasets (a) and Mel spectrogram (b) consist of partial examples.
3.4. Data Division
Upon completion of the data annotation, we obtained 24,793 facial expression images and Mel spectrograms. We used horizontal flipping and Gaussian blurring to augment the dataset and improve the generalization ability of the model. As a result, we acquired 49,586 facial expression images and Mel spectrograms. The facial expression image and Mel spectrogram datasets were split in a 7:2:1 ratio.
Table 2 displays the composition and distribution of the datasets.
The MFCC dataset was also divided according to the scale, as shown in
Table 3.
4. Proposed Methodology
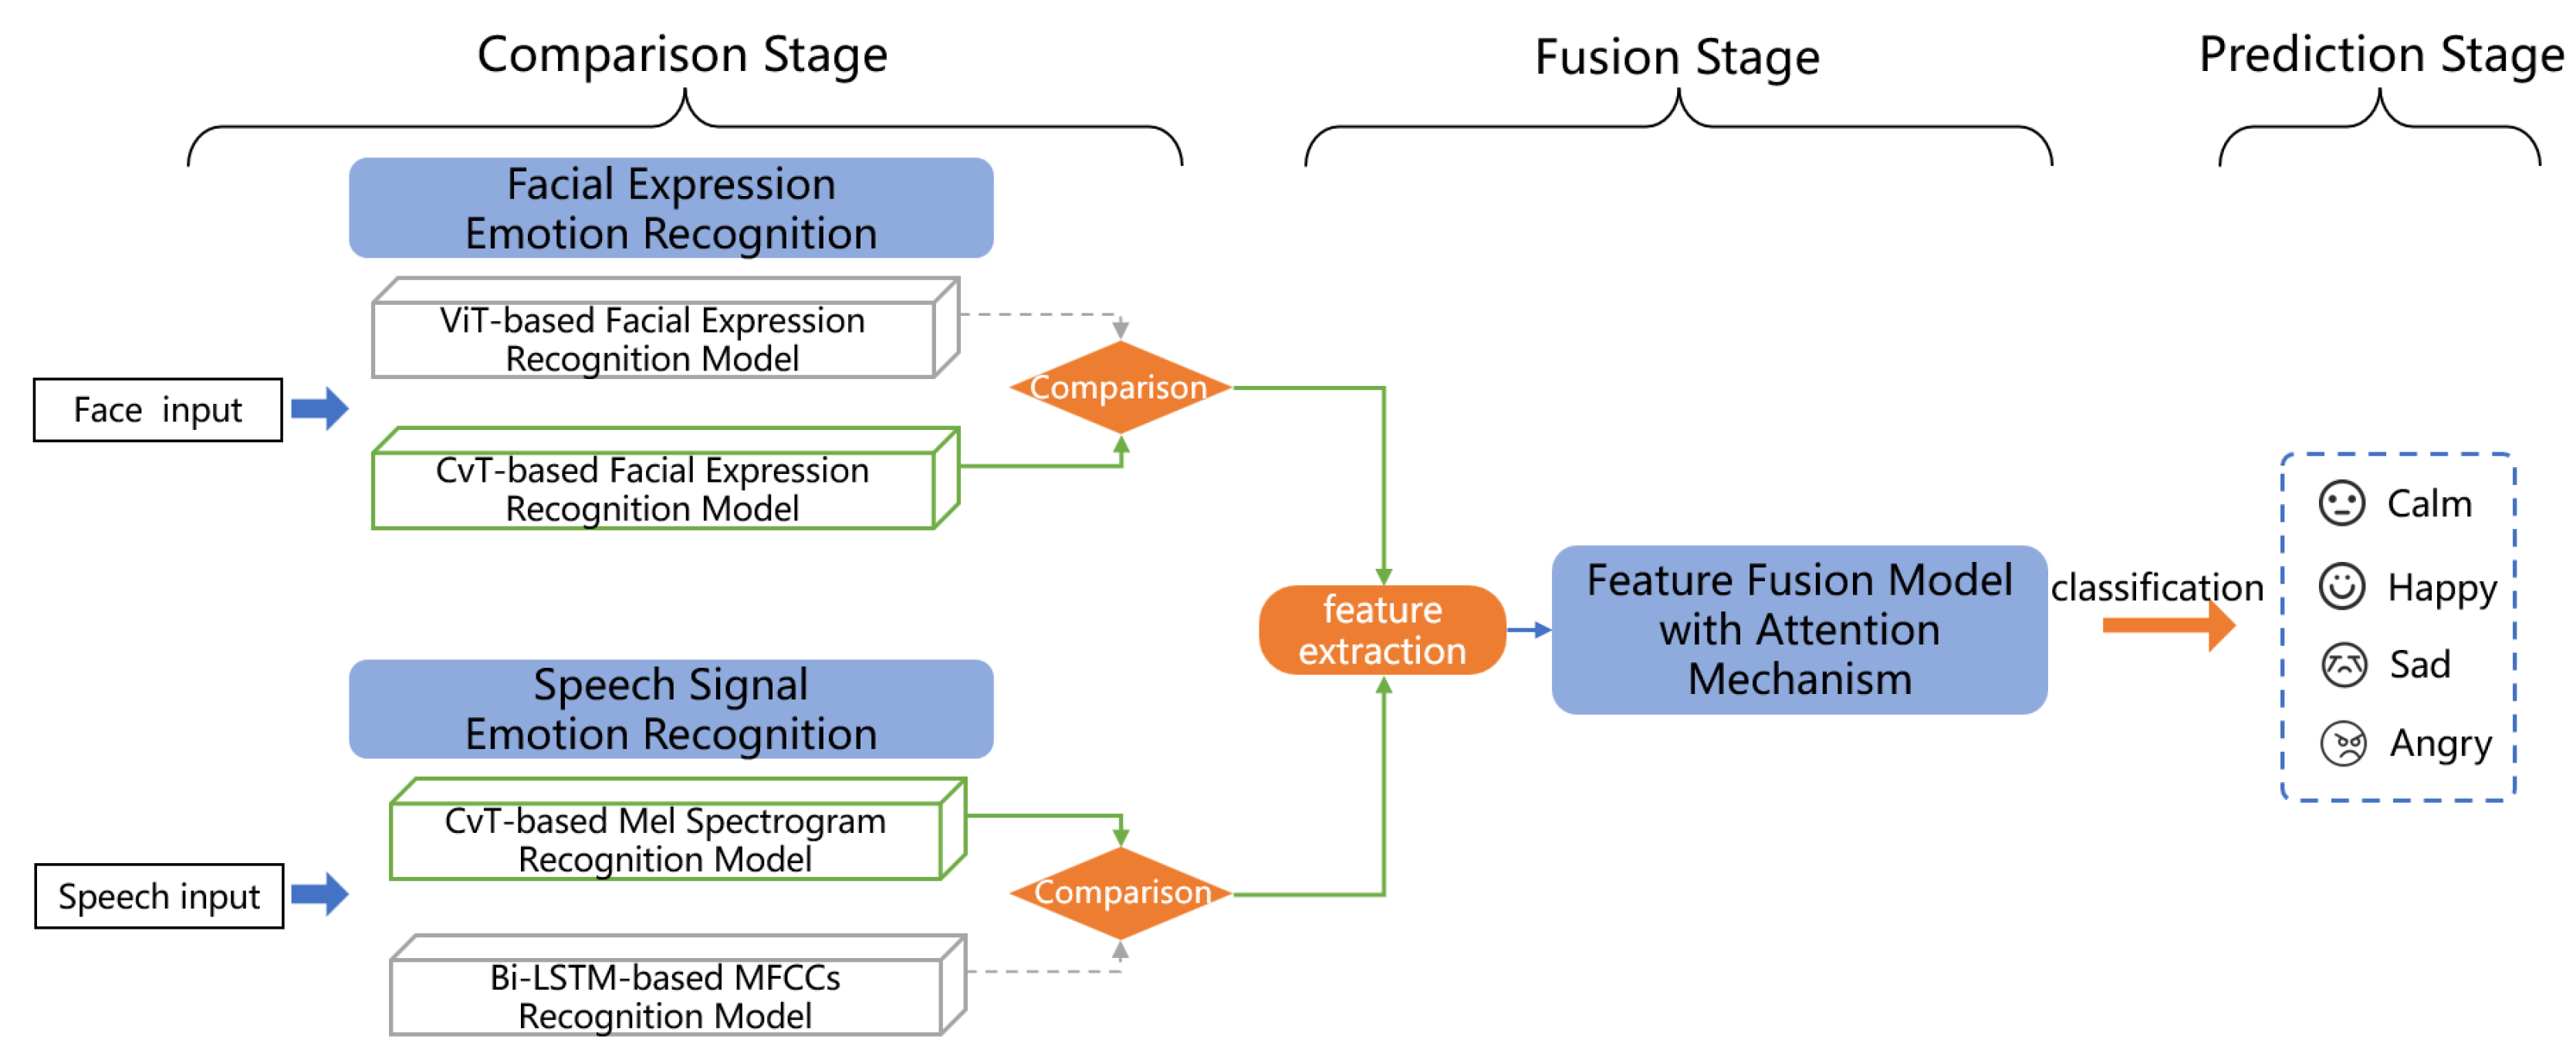
We propose an emotion recognition architecture for autistic children based on the fusion of expression and speech features as shown in
Figure 5, which consists of three stages: comparison, fusion and prediction.
In the comparison stage, we conduct model experiments using single-modal data separately. Emotion recognition based on facial expression involves comparing the performance of two models with different structures, ViT and CvT, and selecting the best one as the facial expression feature extraction network in the following stage. The purpose of emotion recognition using speech signals is to determine which representation, either MFCCs or Mel spectrogram, is more effective for model training. Our study employs the BiLSTM model for processing MFCCs and the CvT model for processing Mel spectrogram.
In the fusion stage, the previously screened model is used as a feature extraction network to process the input data. A new batch of facial expression and Mel spectrogram image data is processed into two feature vectors, and then fed into the feature fusion model based on the attention mechanism, which automatically calculates the weight values and fuses the significant features.
During the prediction stage, the model’s efficacy is assessed by employing a test set. The accuracy of the feature fusion model is determined by computing the percentage of correctly predicted samples by the model, relative to the total number of samples.
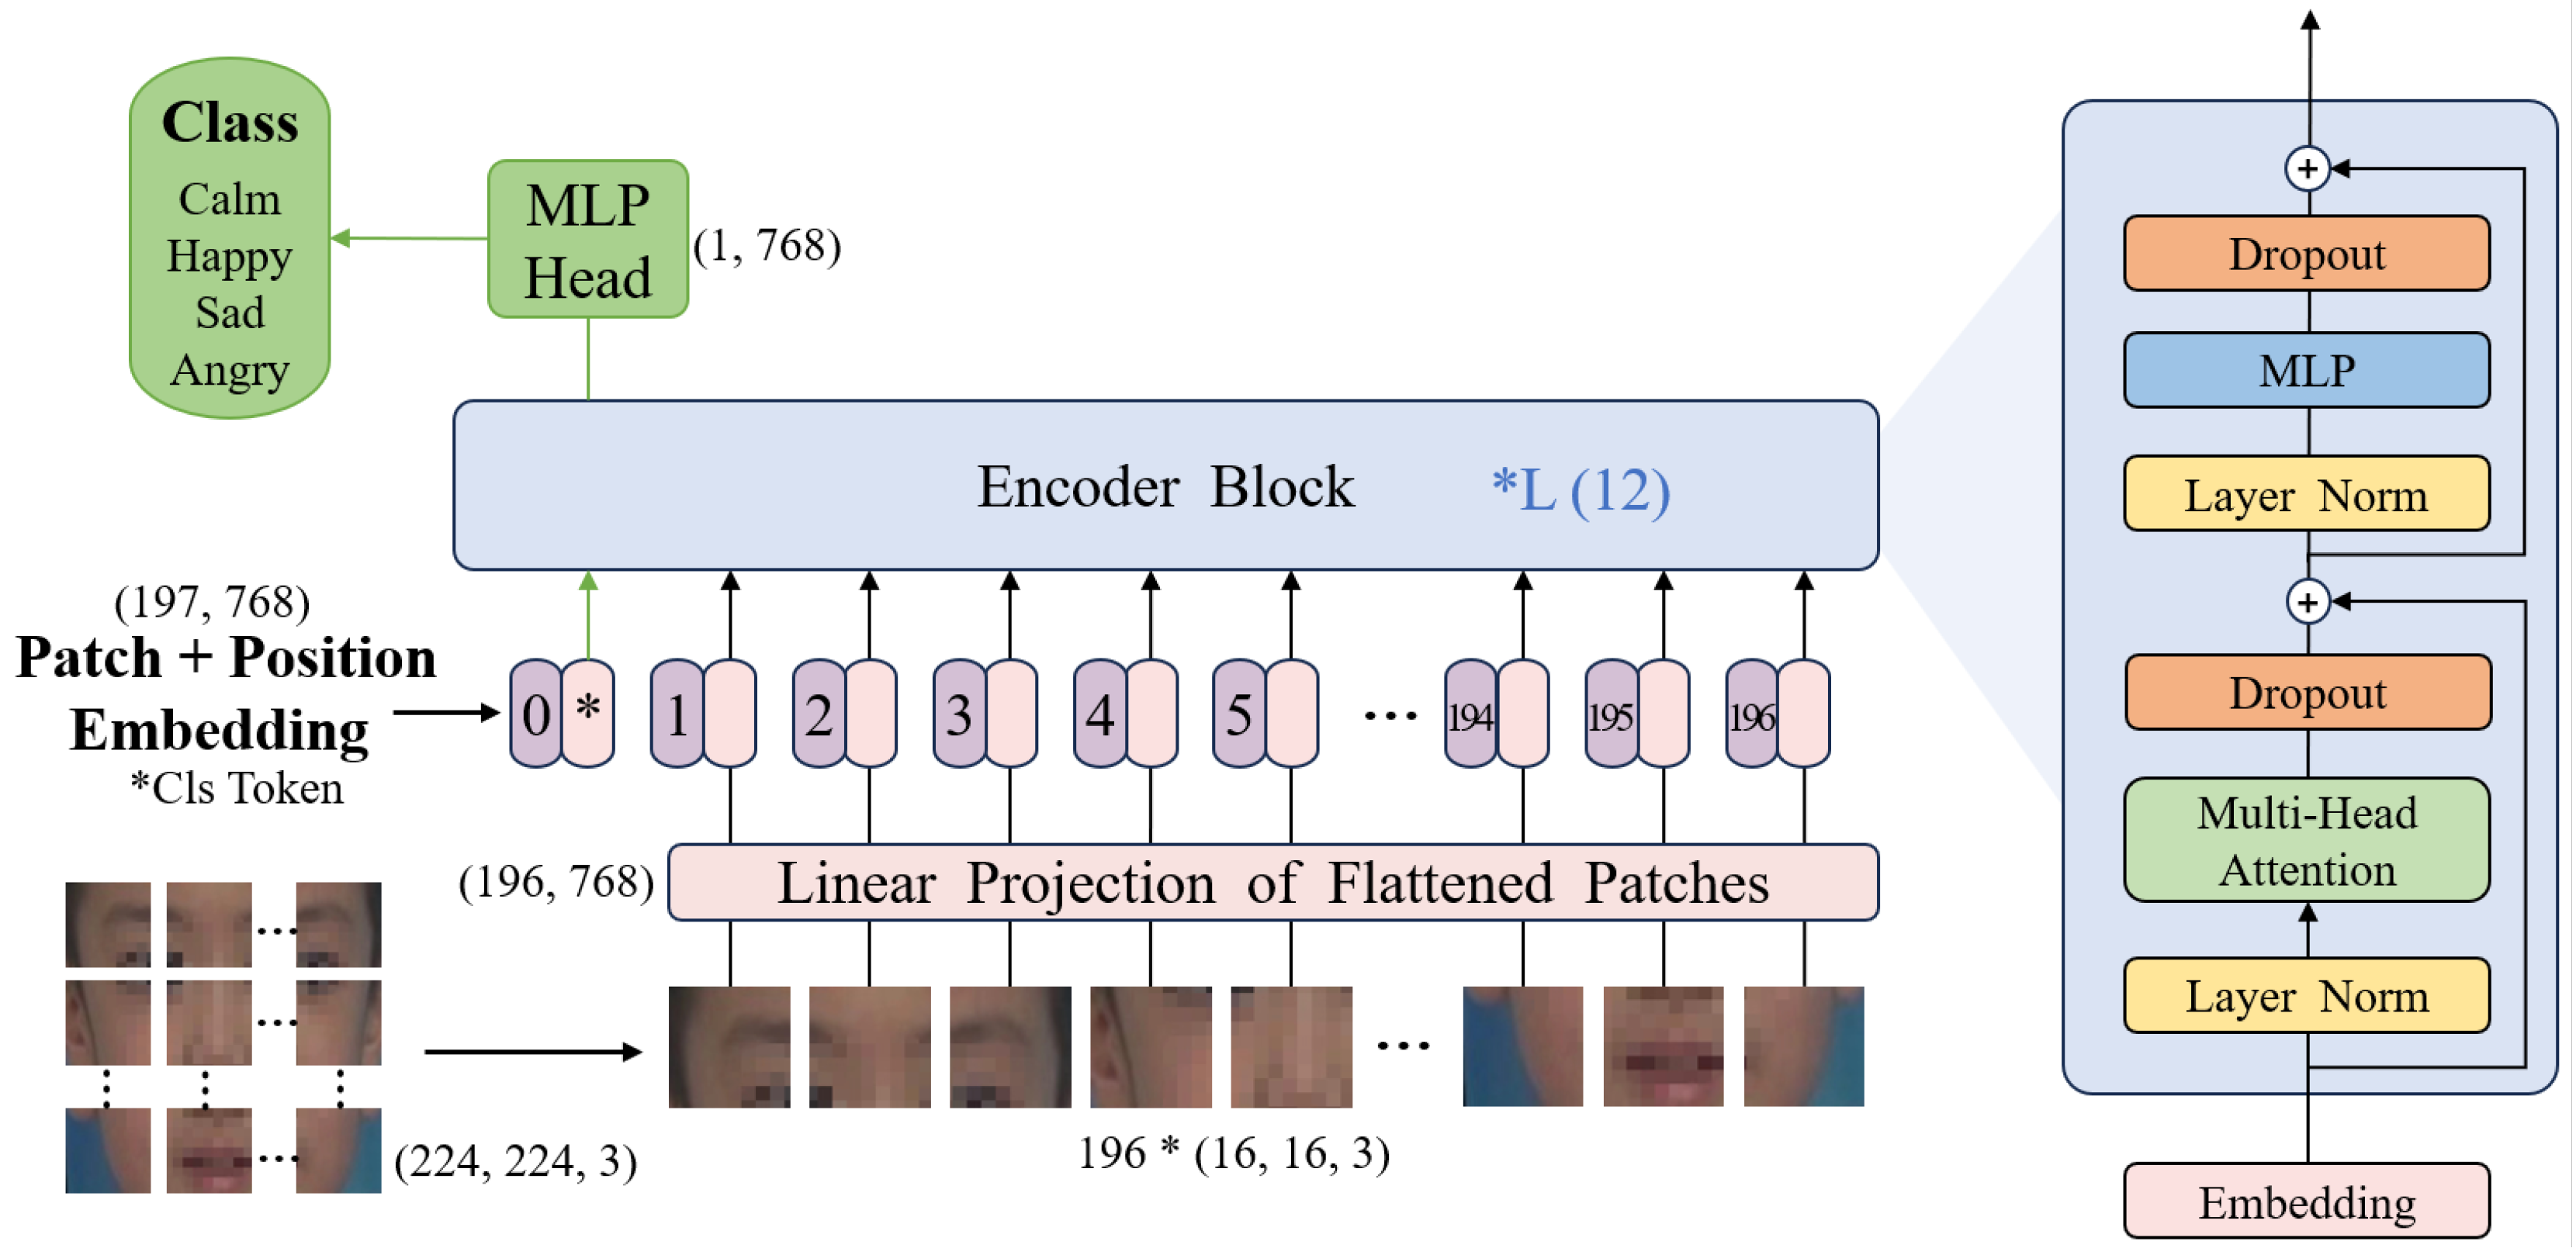
4.1. ViT-based facial expression recognition model
ViT (
Figure 6) model is one of the models used in this study to classify facial expression images, and it is the first application of Transformer architecture in the field of computer vision. ViT converts images into sequential tokens that can be processed by Transformer structure through patching operations, and is an image classification model based entirely on the self-attention mechanism. In image classification tasks with large datasets, ViT achieves better performance than CNN.
The procedure for image processing with ViT consists of the following steps:
- 1.
Divide the facial image into several patches, apply linear projection to each patch, and then incorporate positional encoding. Specifically, the entire token sequence is as follows:
where
Nis the number of patches,
is the vector of each patch after linear projection,
is the initial part of the input sequence used for classification, and is the vector carrying the positional information.
- 2.
The token sequence z is processed by
L Encoder blocks, where each block
is composed of three components: Multiple Self-attention module (MSA), Layer Normalisation (LN), and Multi-Layer Perceptron (MLP). The computation of these components is as follows:
- 3.
The final token sequence after several stacked Encoders is represented as
, with the categorization information contained in the vector
. The output
y, obtained after processing by
, is the ultimate classification result, i.e.,
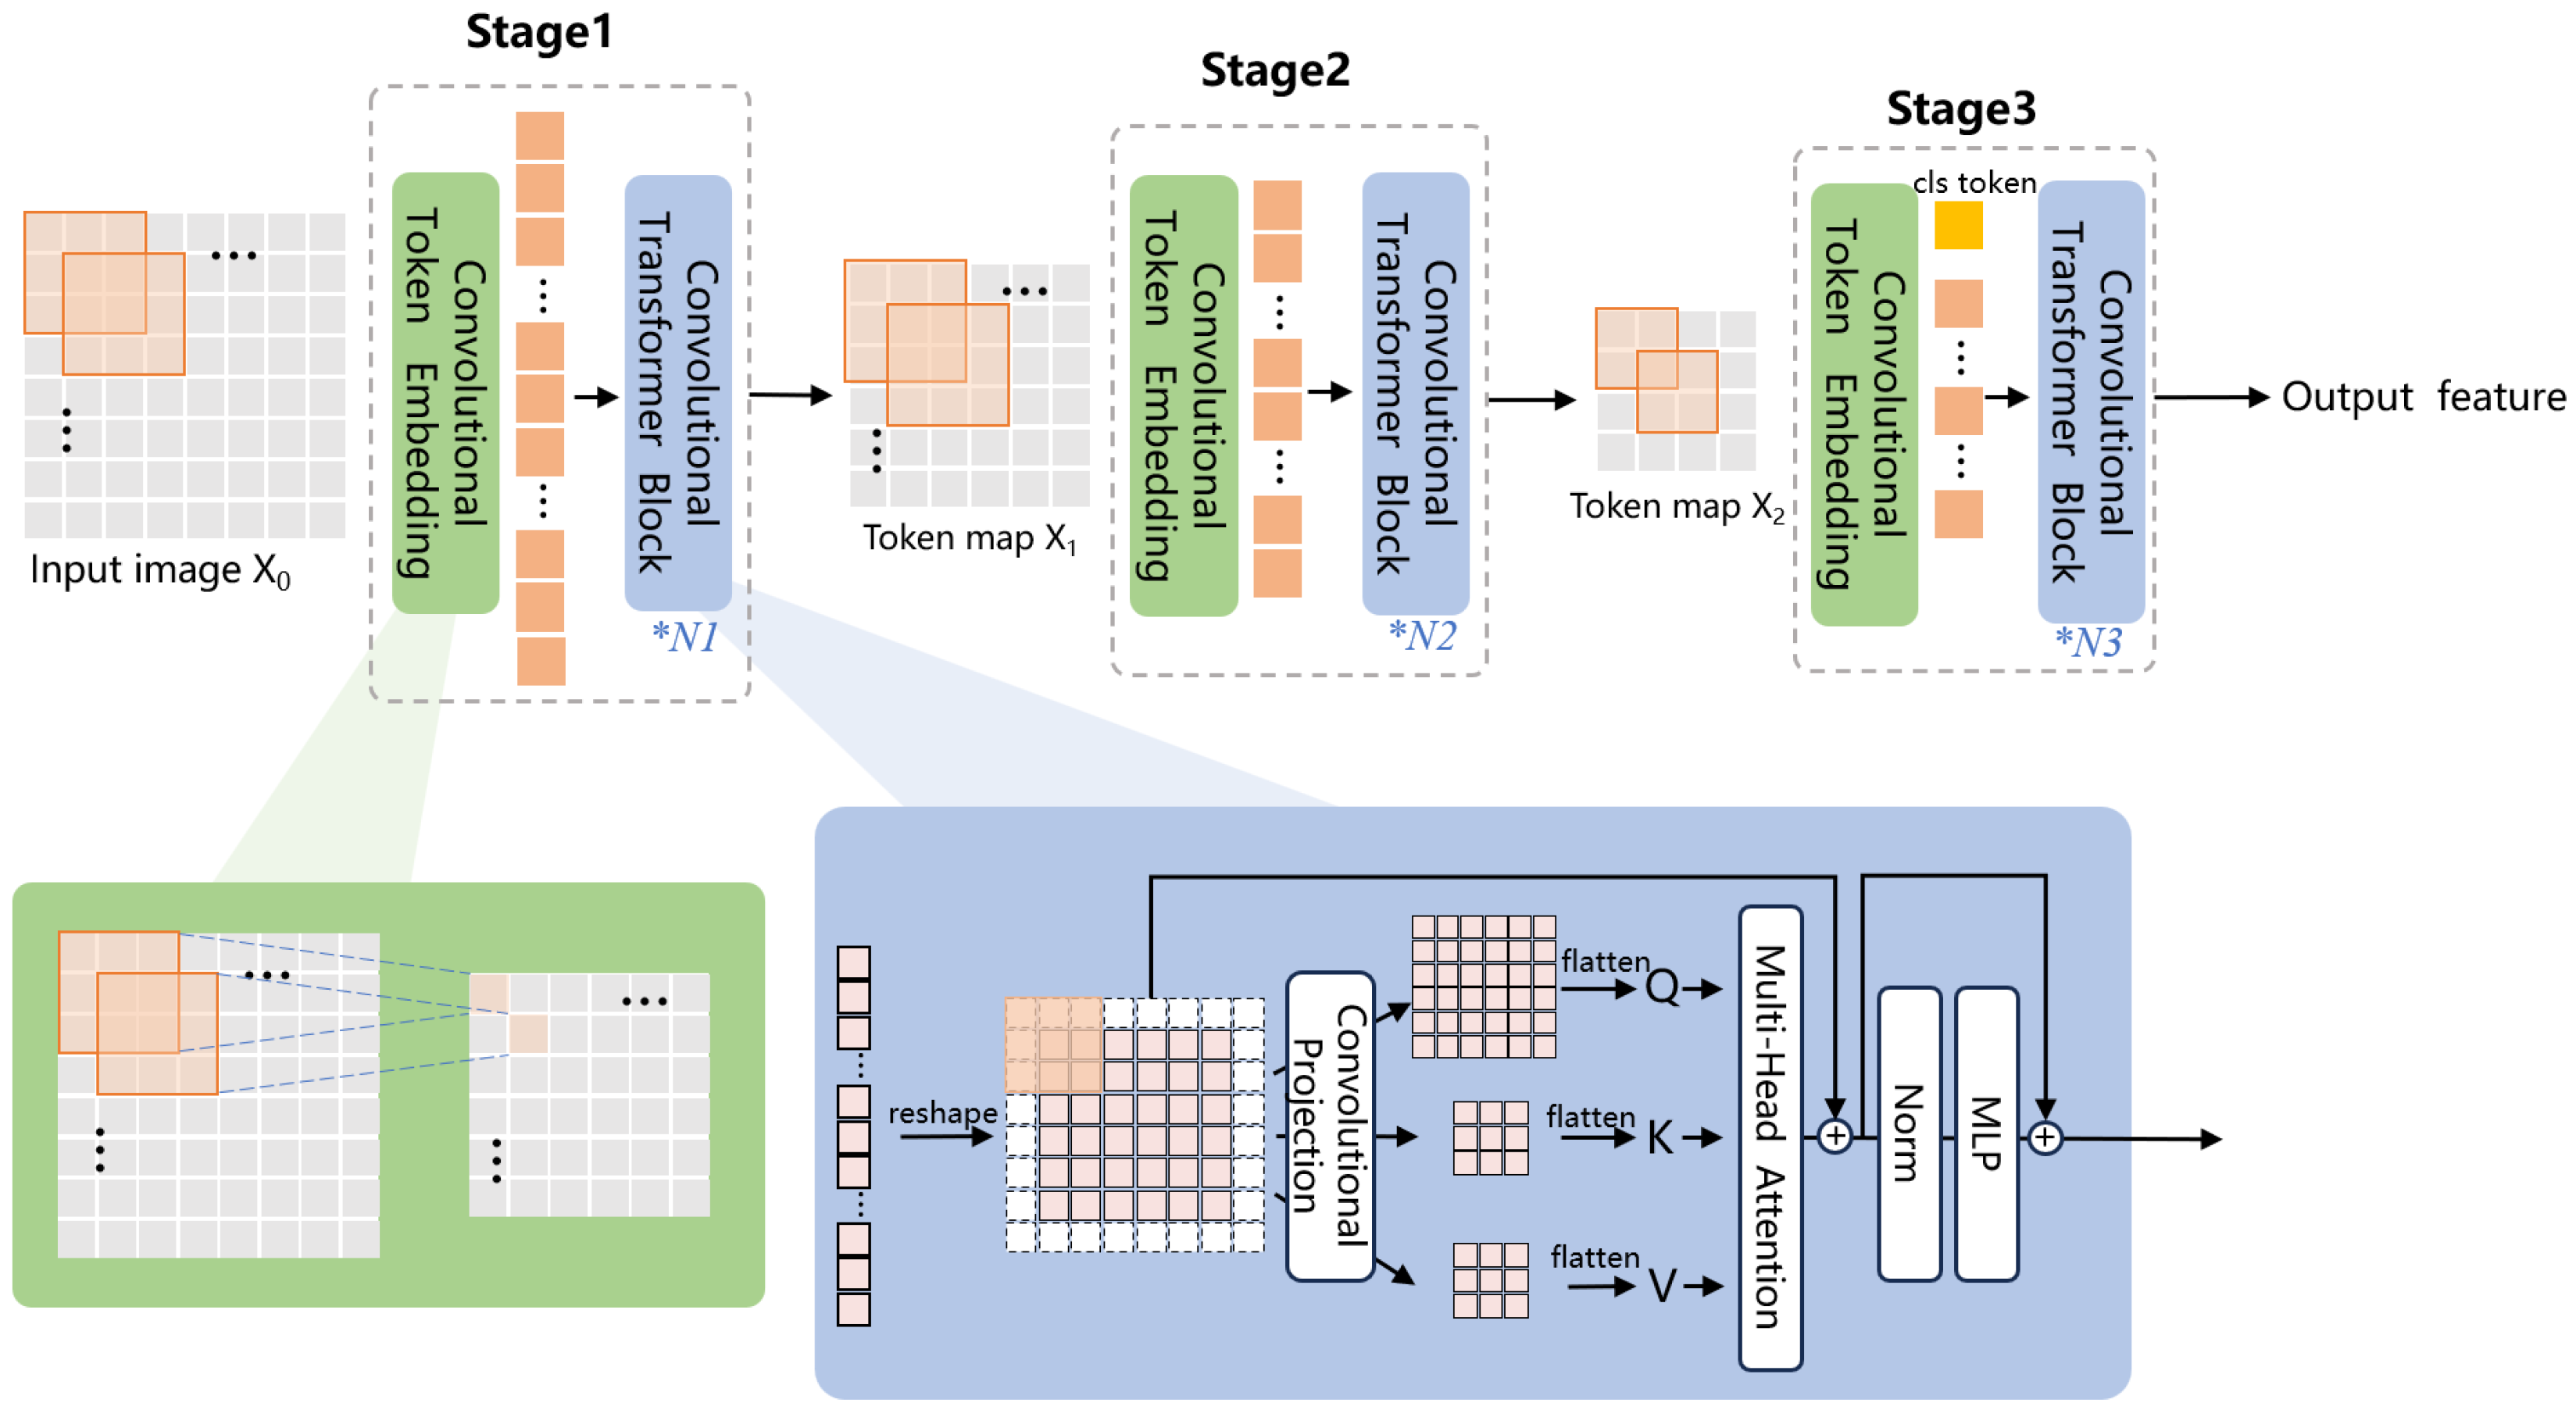
4.2. CvT-based Models for Facial Expression, Mel Spectrogram Recognition
CNN is excellent in capturing the local details of images by utilizing local receptive fields, shared weights, and spatial downsampling. In this study the convolutional operation is applied to the ViT structure to construct the CvT model for the classification of facial expression images and Mel Spectrogram (
Figure 7). The model includes three stages, each comprising a Convolutional Token Embedding module and a Convolutional Projection module. The Convolutional Token Embedding module utilizes convolution to capture the local information from the input feature map and reduce the sequence length, resulting in spatial downsampling. The Convolutional Projection module replaces the linear projection in the previous layer of the self-attention block with a convolutional projection, which computes the feature maps Q, K and V using three depth-separable convolutions. This module enables the model to further capture the local spatial contextual information, reduces semantic ambiguities in the attention mechanism, and improves model performance and robustness while maintaining high computational and memory efficiency.
Each head in the multi-head attention structure possesses its own self-attention layer, which takes the feature maps
Q,
K, and
V as input and calculates the similarity between each pair of features as follows:
This process is repeated independently for h times (h is the number of heads), and finally, it splices the results each time to calculate the long dependency of the positional information between the elements.
The output of the previous stage of the CvT model is utilized as the input for the subsequent stage, with the convolution kernel size, step size, number of multi-attention modules, and network depth differing in different stages.
Table 4 shows the model parameters and the output size of each stage.
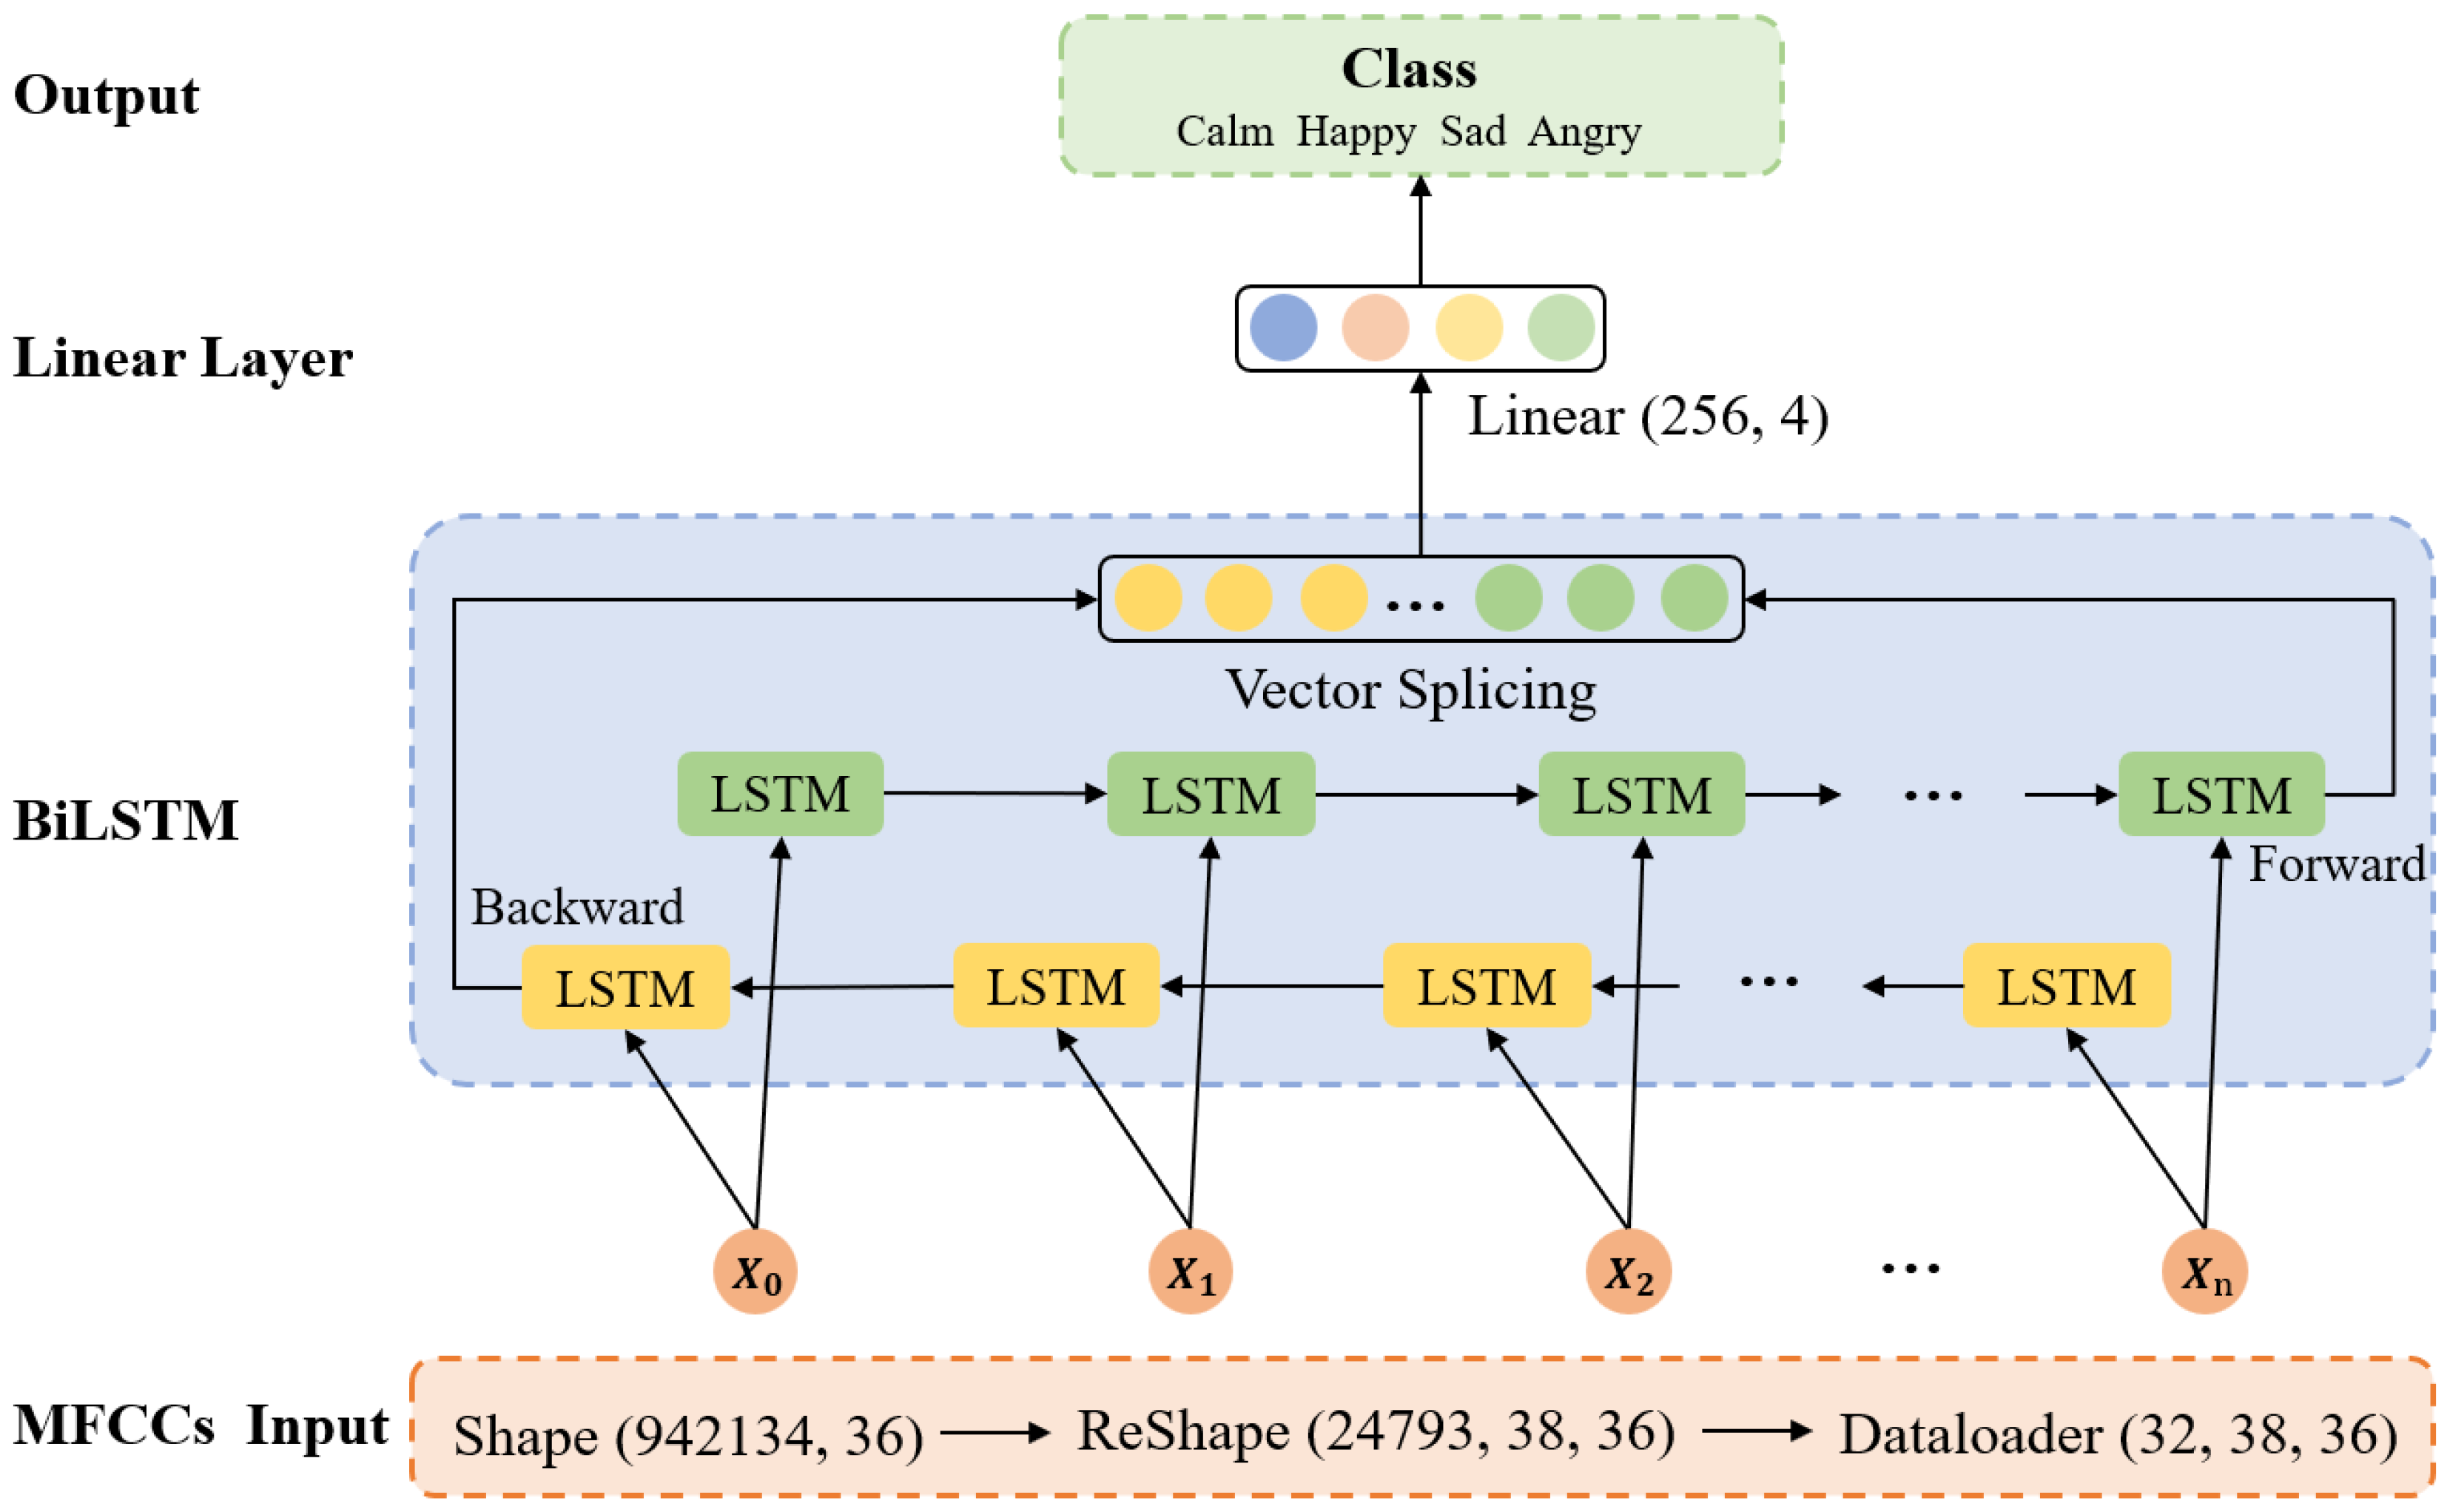
4.3. Bi-LSTM-based MFCCs Recognition Model
In this study the Bi-LSTM model is employed for the classification of MFCCs, which consists of two LSTM networks, namely a forward LSTM and a backward LSTM. The forward LSTM processes the input sequence using a front-to-back time step, whereas the backward LSTM does the opposite. In each time step, Bi-LSTM utilizes both preceding and subsequent information to enhance its modeling of the sequential data. The inference process of the model is shown in
Figure 8. The dataset is normalized and transformed into 3D vectors required for the model and then fed into the dataloader as input to the network with the shape of (32, 38, 36). The number of network layers is set to two, the number of hidden neurons is 256, and the time step seq_len is 38. The data are input into the forward and backward LSTM and then vector splicing is performed, finally outputting the classification results after the linear layer.
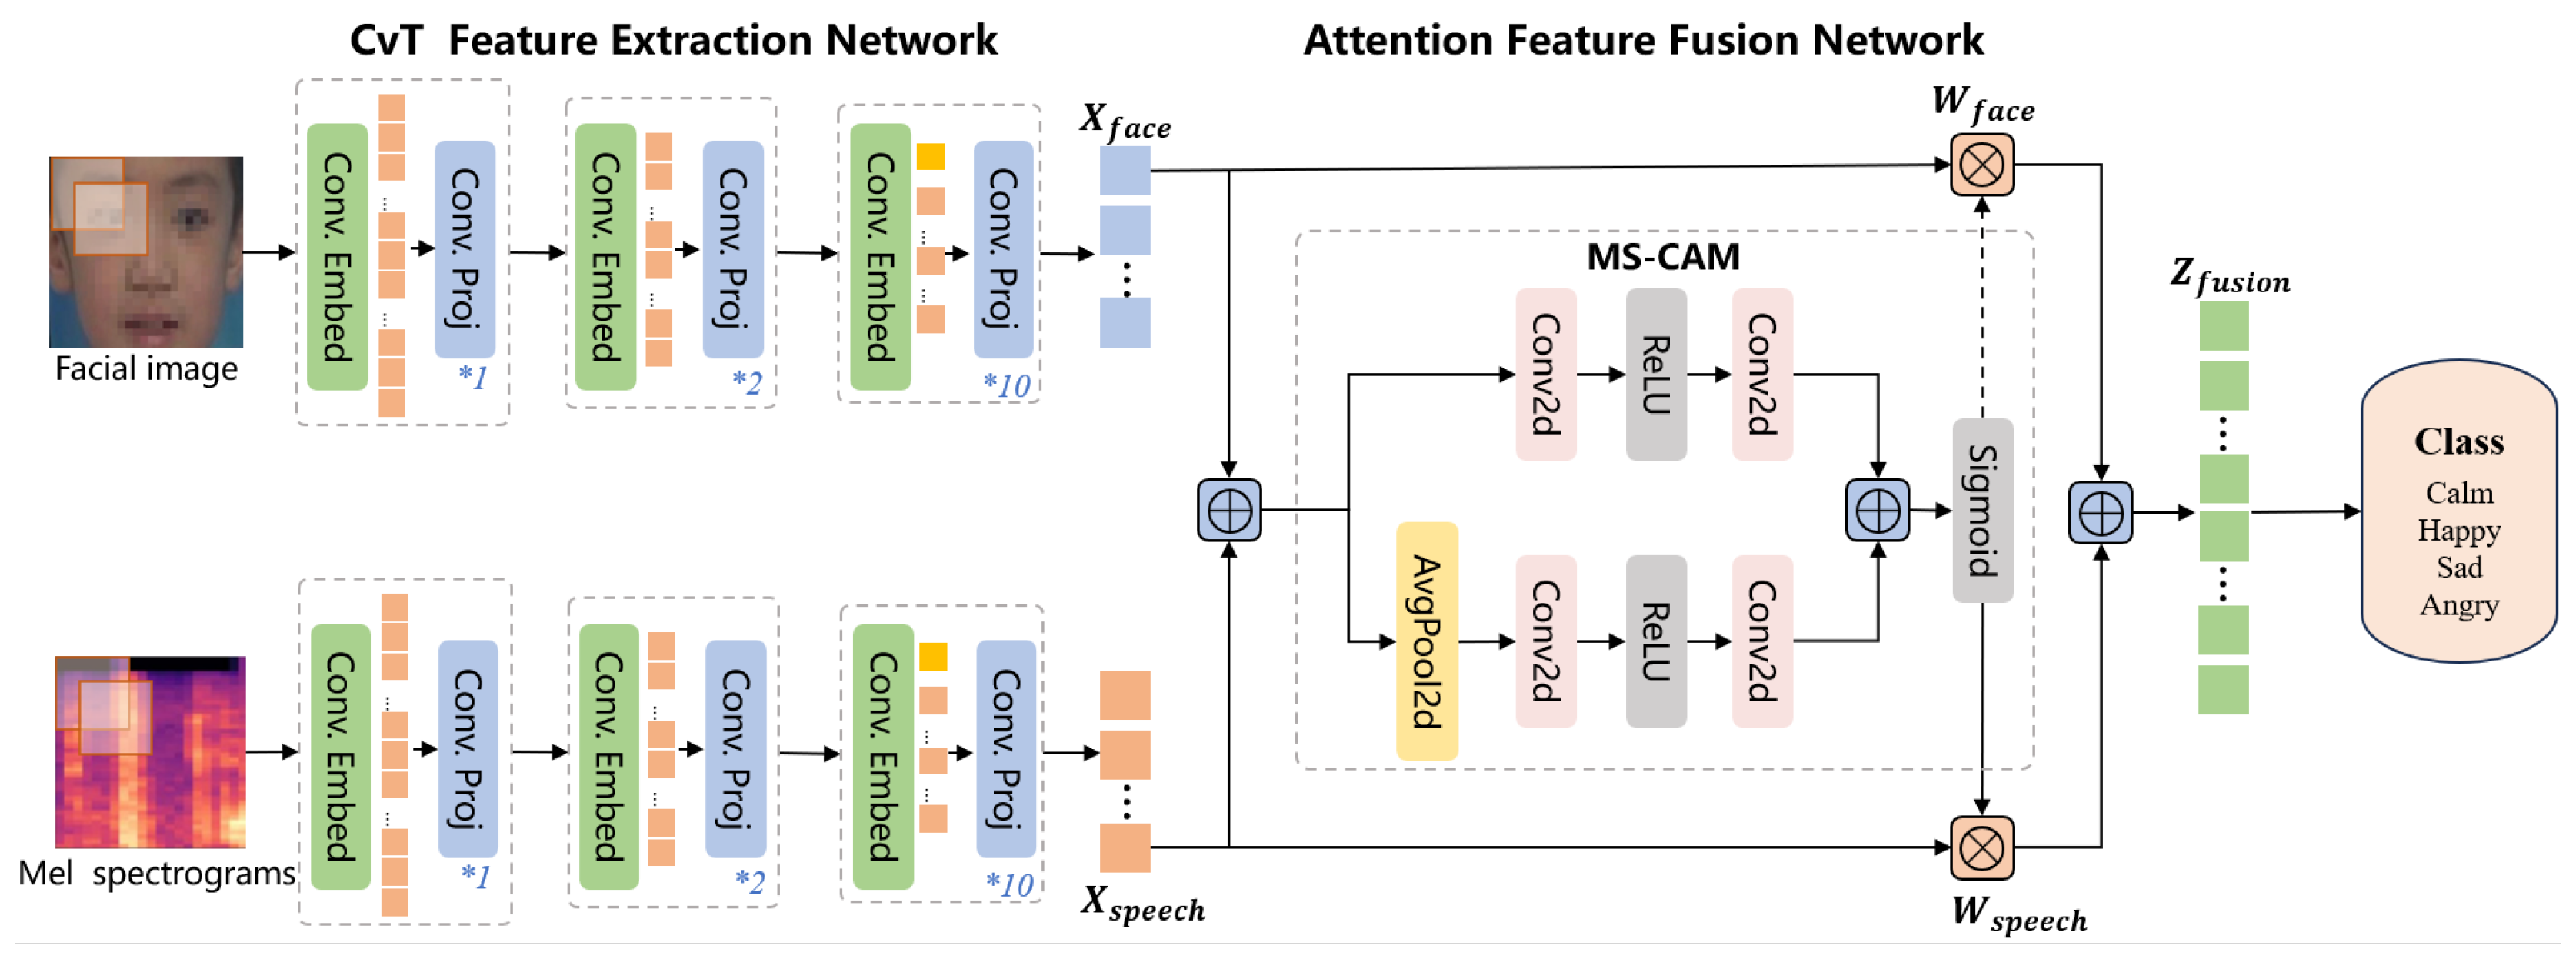
4.4. Expression and Speech Feature Fusion Model with Attention Mechanism
The expression and speech feature fusion model based on the attention mechanism is shown in
Figure 9. This study selects CvT, the recognition model with the best performance in both facial expression and speech modalities, as the feature extraction network through comparison experiments. The expression and speech data are transmitted to the attention feature fusion module following their respective feature extraction networks to form a novel fusion sequence. Finally, the corresponding emotion categories are output through the fully connected layer.
The attention feature fusion network is the core part of the model, which uses the Multiscale Channel Attention Module (MS-CAM) to compute the weights of the two modalities to generate the foci of the facial and speech features. The high-dimensional features of facial expressions and Mel spectrogram acquired in the previous stage are utilized as input to the network, i.e.,
and
, respectively. The module employs two branches to derive the channel attention weights. One branch uses global average pooling to extract the attention of the global features and the other branch directly employs pointwise convolution to extract the attention of the local features, thus acquiring the weight values
and
, respectively. Finally the feature vector
is computed as follows:
The specific processing and parameter variations of the attention feature fusion network are shown in
Table 5. The input image, with size (3, 224, 224), is transformed into feature vectors
and
of size (384, 14, 14) using the CvT feature extraction network. After the initial feature fusion, it is fed into the two branches of local attention and global attention, respectively. The extracted local feature shapes are (384, 14, 14) while the global feature shapes are (384, 1, 1). The outputs from the two attention branches are then linearly summed and passed through the Sigmoid function to calculate the weight values
and
, which are subsequently multiplied by
and
, respectively, resulting in the fusion features with the shape of (384, 14, 14). Finally, through the fully connected layer, the four classification results are output to predict the autistic child’s emotion.
5. Model Experiment
5.1. Evaluation Metrics
In this study, accuracy, precision, and recall are used as metrics to assess the performance of the model. Used to assess the overall performance of the model, accuracy is the proportion of correctly classified samples out of the total number of samples. Precision and recall assess the specific performance of the model for each type. Precision is the proportion of all the samples predicted to be positive that are actually in the positive category. Recall is the proportion of all the samples with actual positive classes that are correctly predicted as positive by the model.
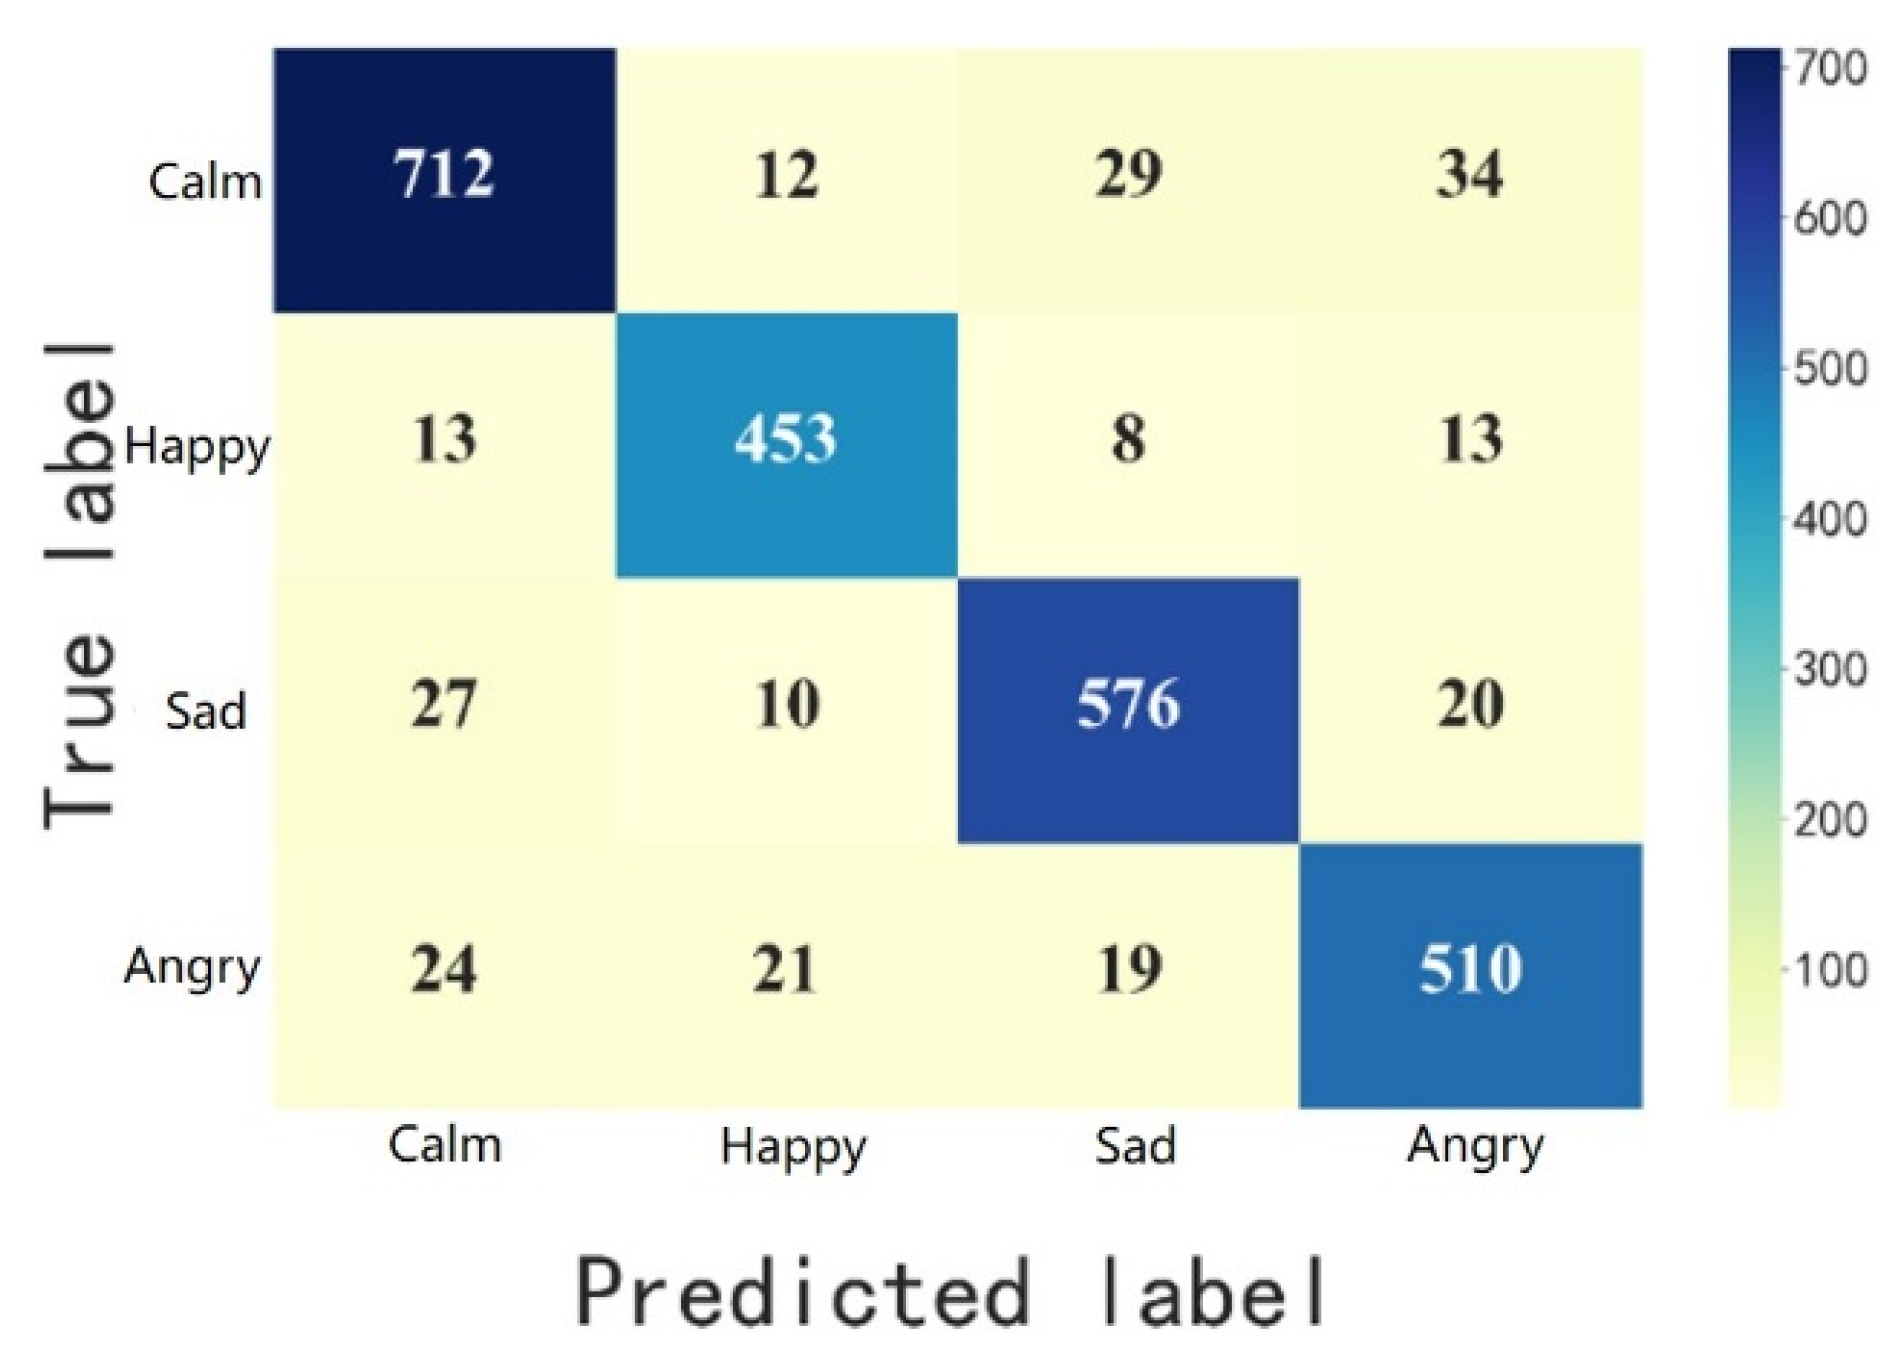
In addition, we present the predicted and true quantities of each type of emotion using the confusion matrix, where the horizontal coordinates indicate the predicted labels and the vertical coordinates indicate the true labels. The values on the cells with the same horizontal and vertical labels, i.e., values on the diagonal, indicate the number of correct predictions, and the values on the other cells, i.e., values off the diagonal, indicate the number of incorrect predictions.
5.2. Parameter Settingss
The five emotion recognition models are trained for the experiment according to the parameter settings shown in
Table 6.
5.3. Results
5.3.1. Results of Different Emotion Recognition Models on the Single-modal Dataset
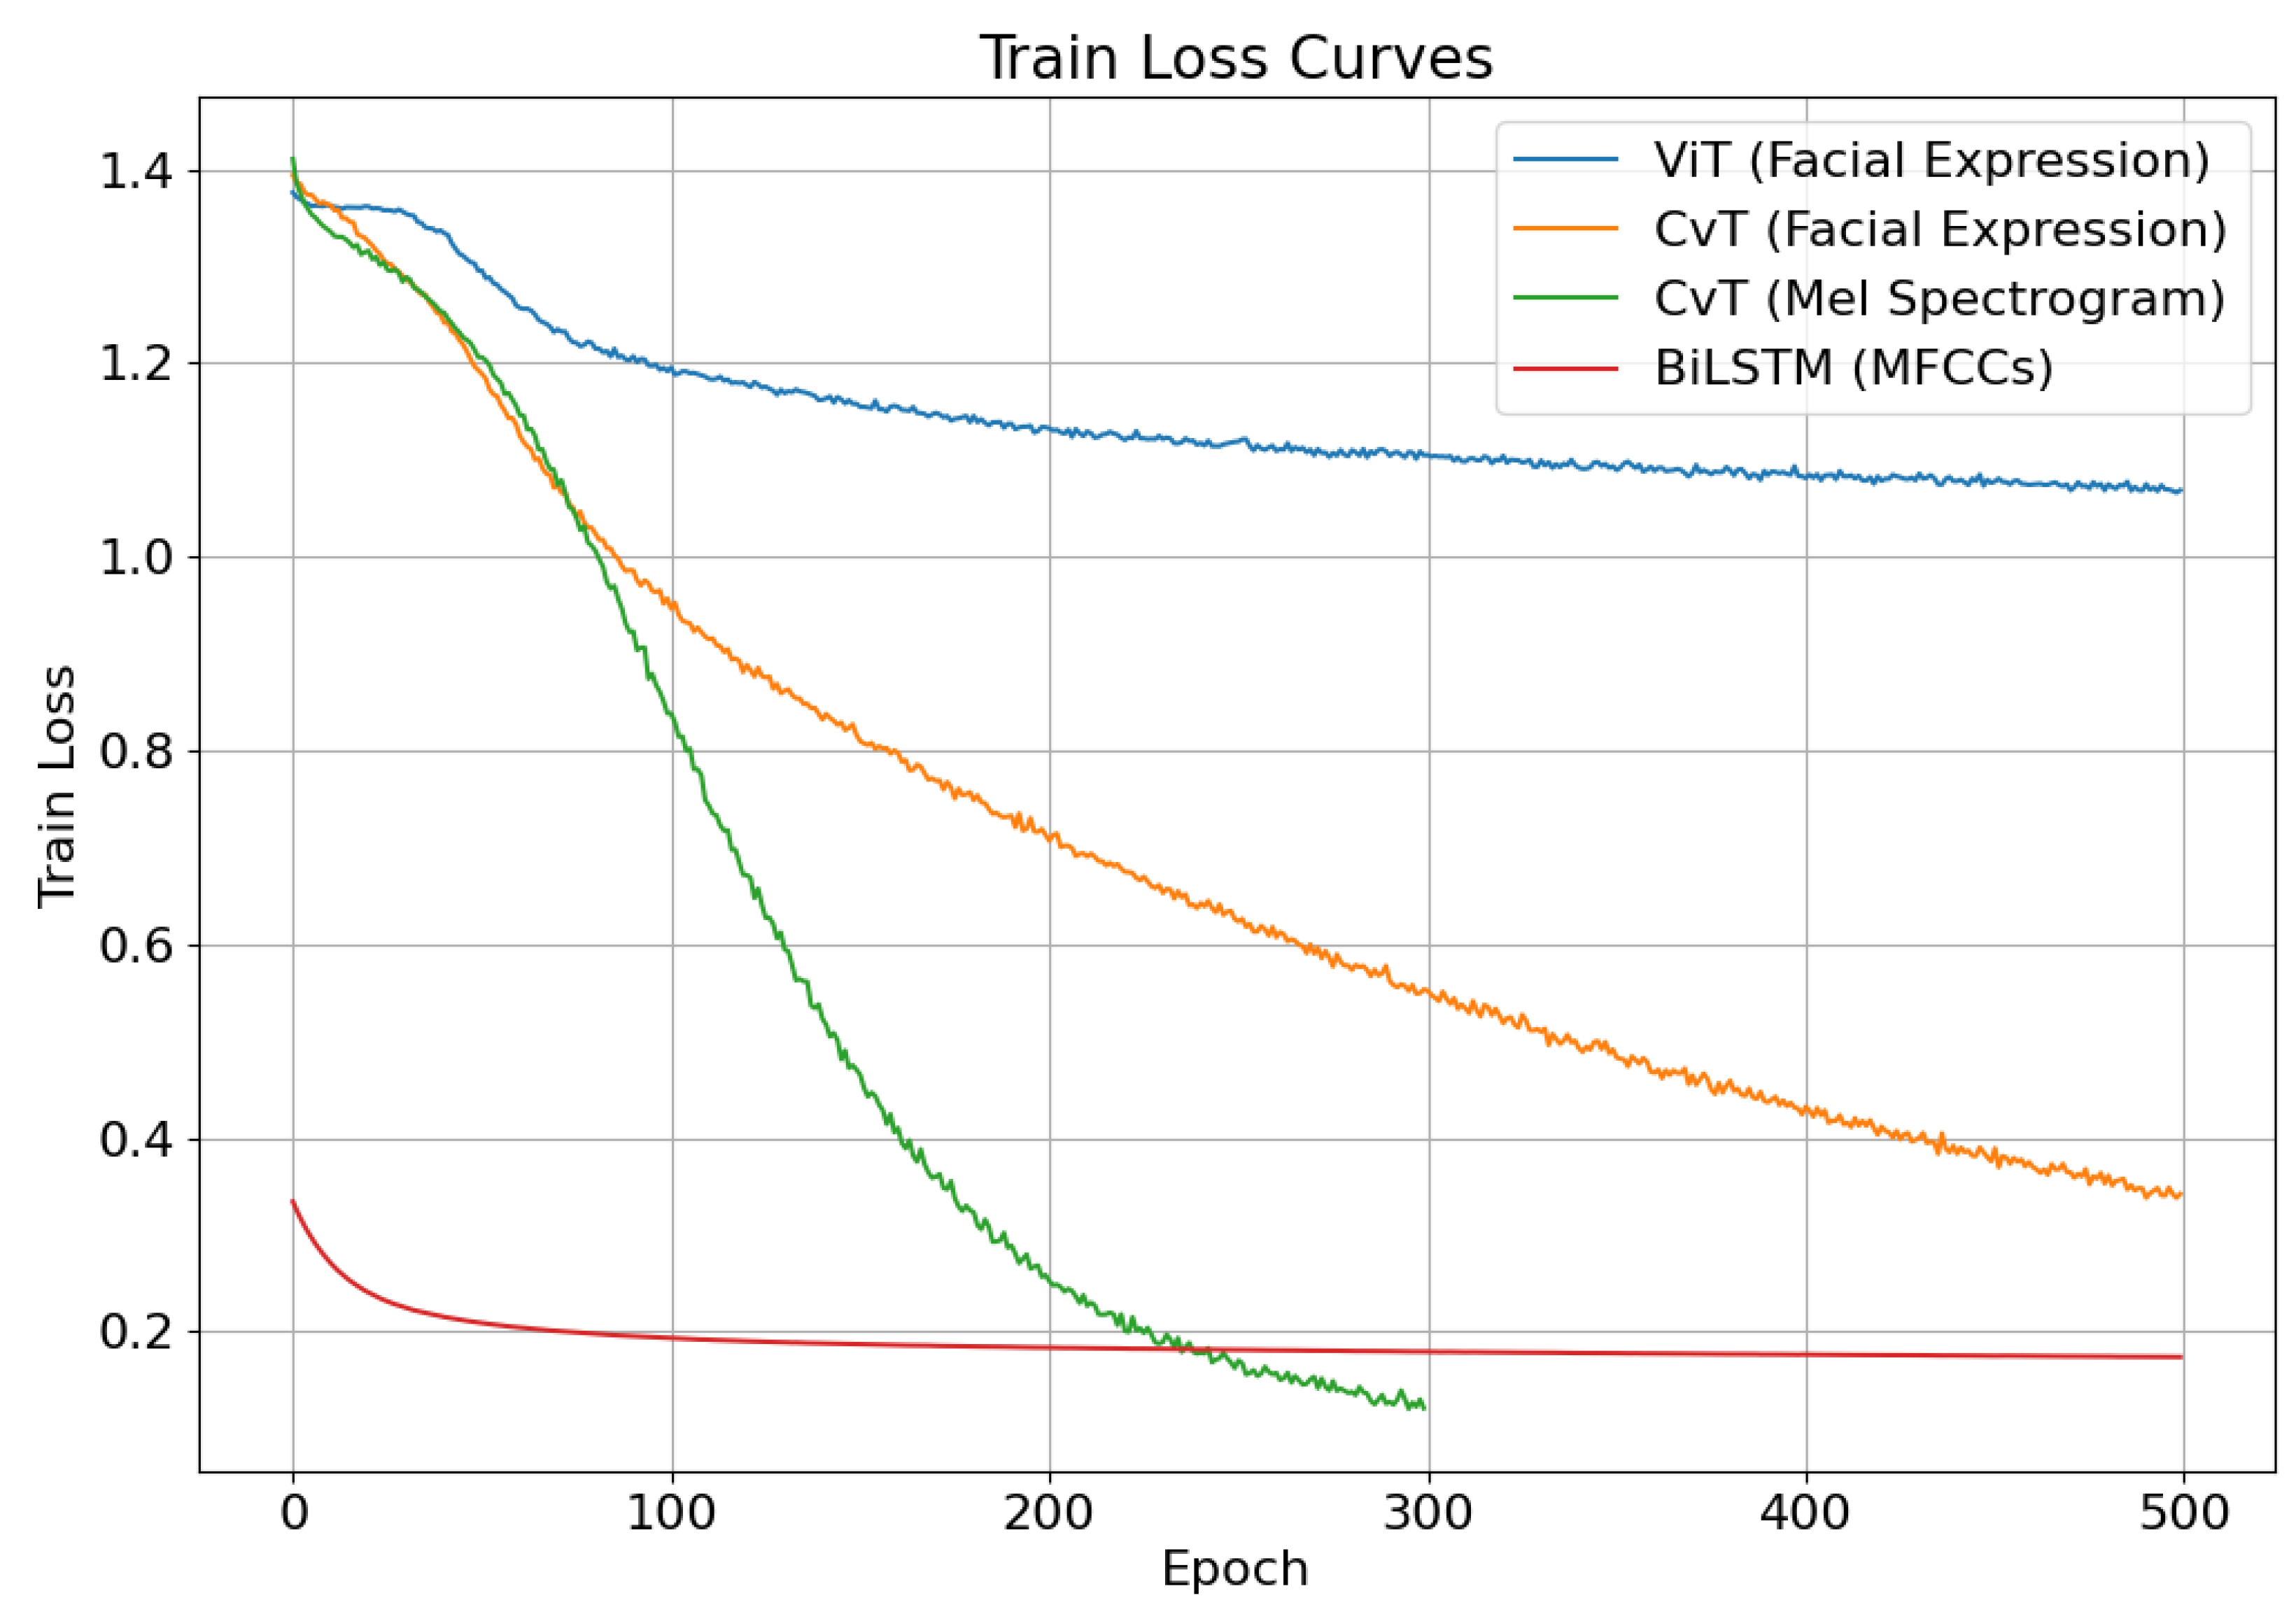
After model training, the loss functions of the facial expression and speech dataset in the different models converge to a stable value, and the variation curves are shown in
Figure 10.
On facial expression image inference, both models reach a state of convergence. The loss function’s value of the ViT model declines rapidly in the first 100 epochs of training, and slows down thereafter, gradually converging to 1.0. In comparison, the loss function’s value of the CvT model declines at a faster rate, eventually converging to 0.3, which is distinctly lower than that of ViT.
On speech signal inference, due to the differences in the intrinsic structure of the Mel Spectrogram and MFCCs data, the BiLSTM model has a lower loss value in the pre-training period and a faster rate of decline. The loss function’s value of the CvT model tends to 0.1 in the late training period, which is lower than that of BiLSTM, and the overall rate of decline is significantly higher than that of BiLSTM. Meanwhile, it is found that the loss value of BiLSTM on the validation set shows a tendency of initially decreasing and then increasing. Evidently, the BiLSTM model’s training effect is unsatisfactory and has not yet achieved the convergence state.
Table 7 displays the overall accuracy and individual classification recall of the four models after testing. The results of facial expression recognition show that the ViT model achieves an overall accuracy of 48% on the test set, while the CvT model achieves an accuracy of 79.12%. This means that the CvT network structure outperforms the ViT model in recognizing facial expressions in children with autism. It confirms that integrating convolutional concepts into the Transformer mechanism is more effective in extracting emotional features from autistic children’s facial expressions, which can provide more precise technical support for emotion recognition research.
The comparison of speech signal recognition in Table 7 demonstrates that the CvT-based Mel spectrogram recognition model outperforms the Bi-LSTM-based MFCCs recognition model to a significant degree. The data shown above indicate that the Mel spectrogram representation possesses a greater abundance of emotional characteristics of children with autism, rendering it more valuable for emotion recognition.
5.3.2. Results of Facial Expression and Speech Feature Fusion Model
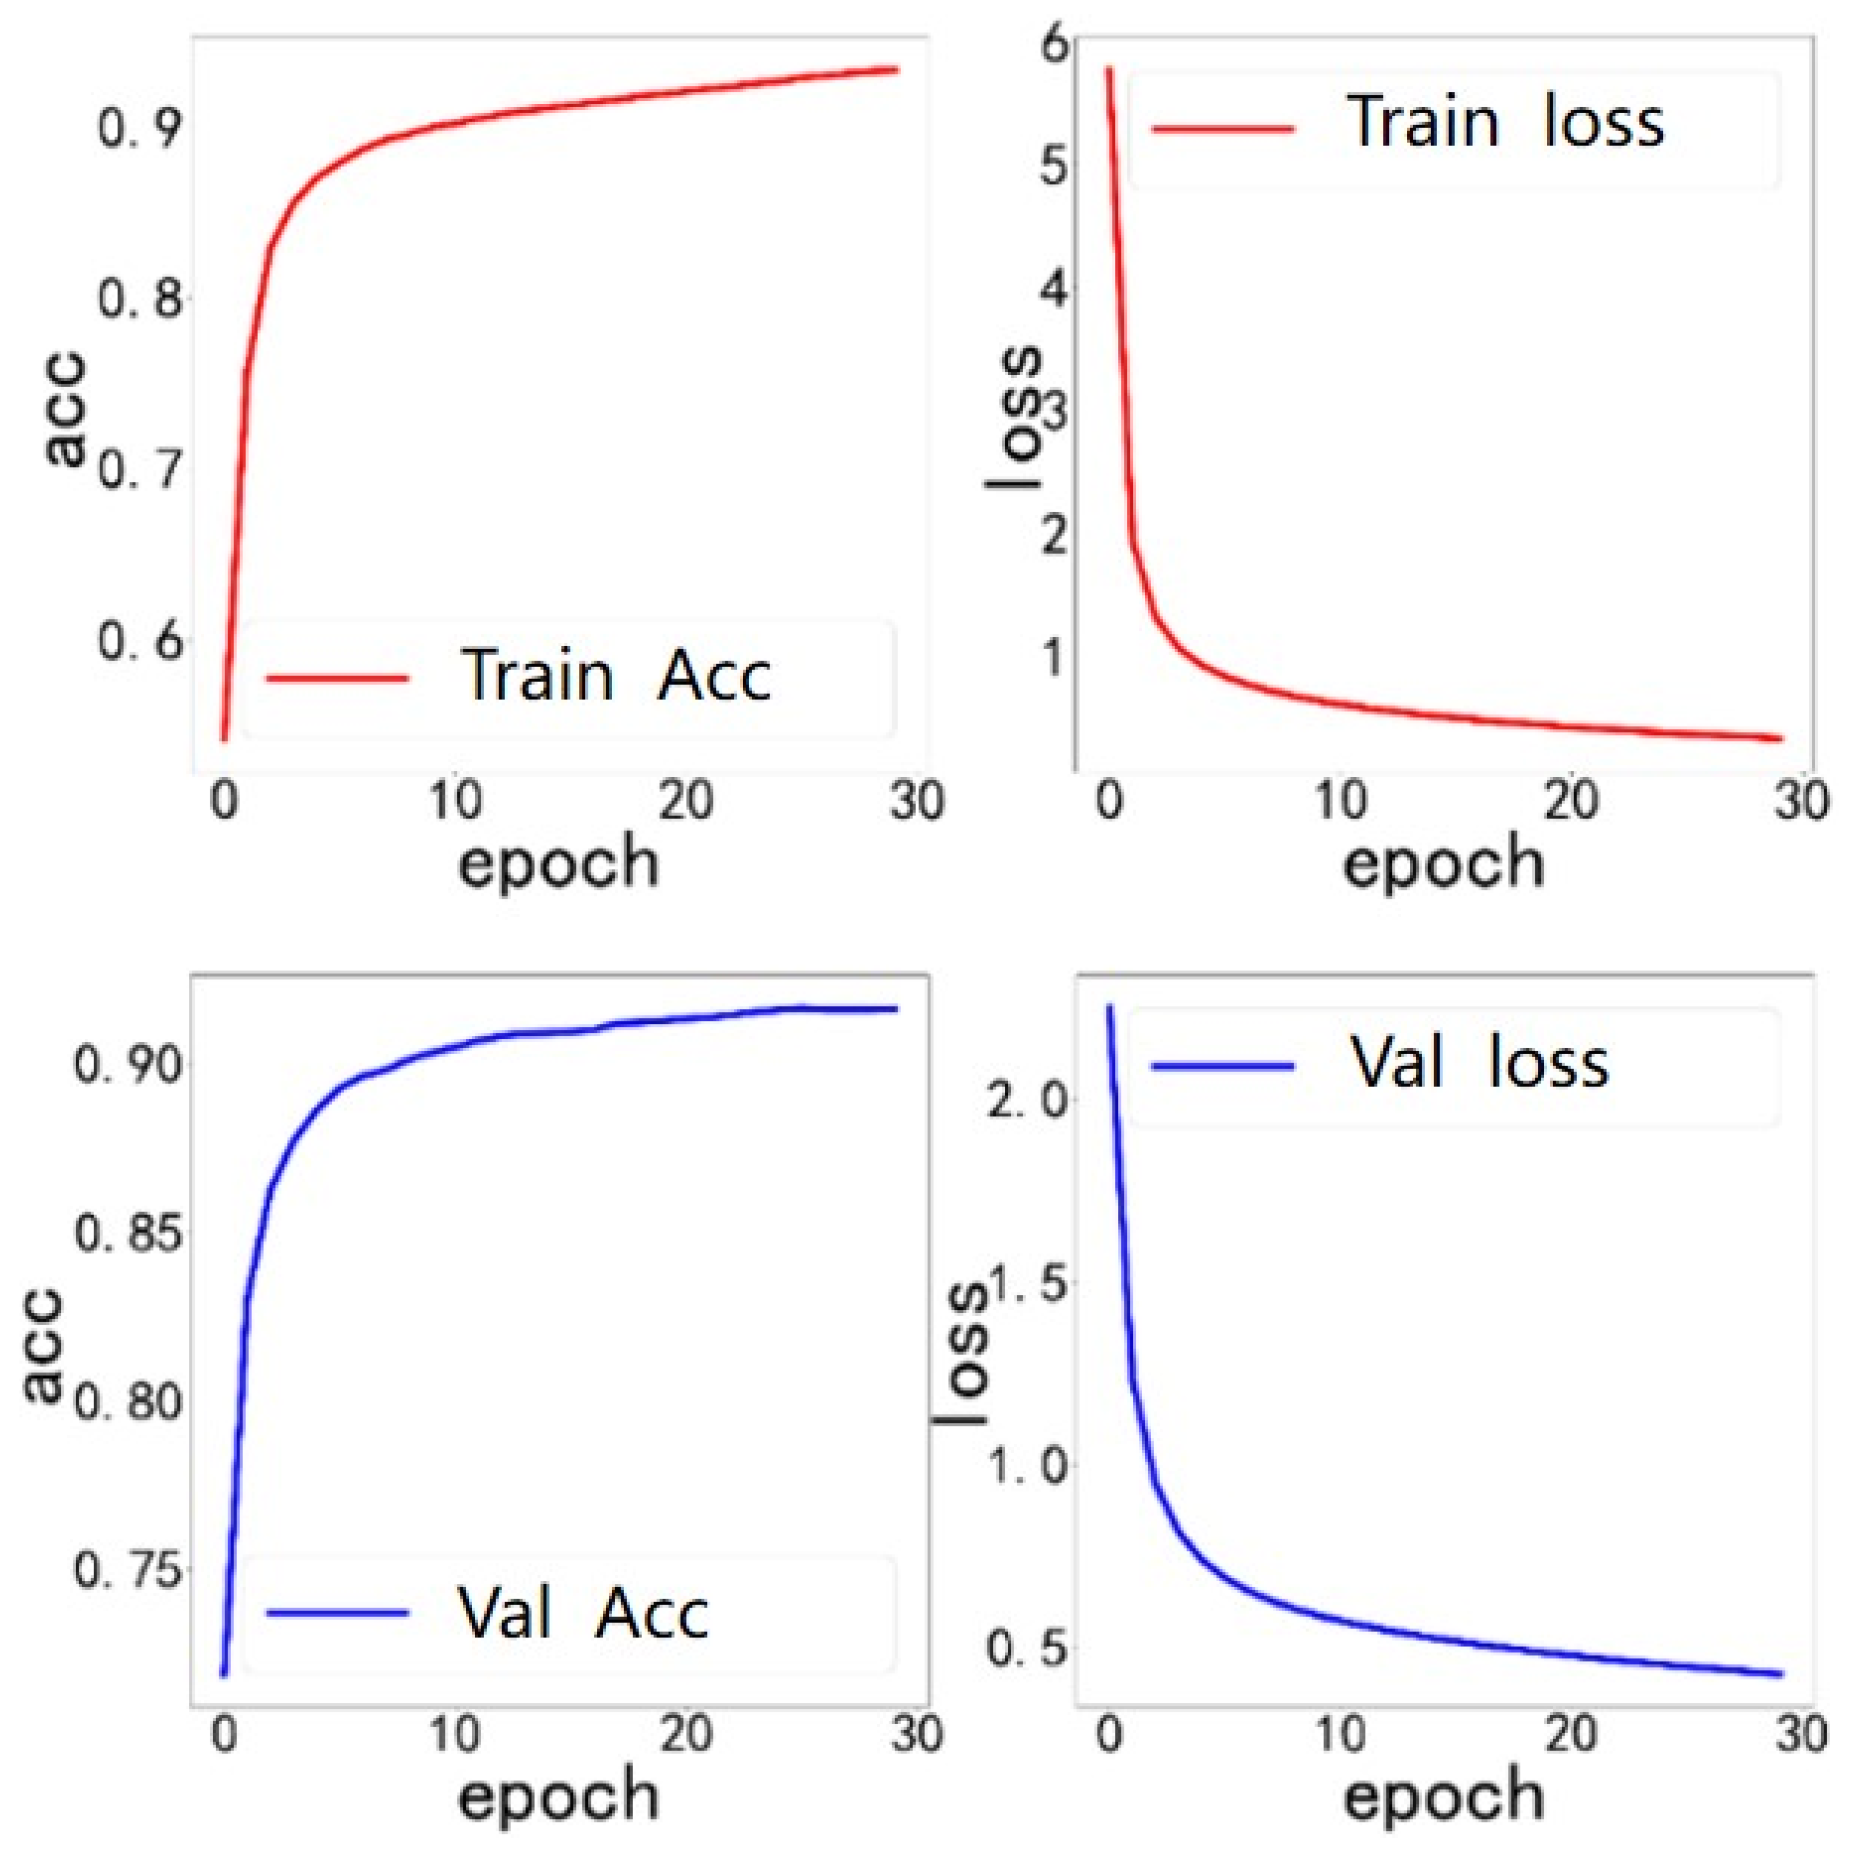
Given the above experimental findings, the CvT model is chosen as the feature extraction network for facial expression and Mel spectrogram. The extracted data are inputted into the multimodal feature fusion model based on the attention mechanism for 30 epochs of iterative training, and the accuracy and loss values of the training set and validation set are shown in
Figure 11. The loss value of the training set gradually approaches 0.5, whereas the loss value of the validation set gradually approaches 0.2, indicating that the model reaches the convergence state and has been effectively trained.
The multimodal feature fusion model based on the attention mechanism achieves an overall accuracy of 90.73% on the test set. The precision and recall of the four emotions (calm, happy, sad and angry) are calculated with the help of the confusion matrix, as shown in
Figure 12 and
Table 8. The results indicate that the overall accuracy, precision, and recall of this feature fusion model are higher than those of the single-modal data model, and the former model has better emotion recognition capability.
5.4. Discussion and Analysis
5.4.1. CvT Model Incorporating Convolution Exhibits Excellent Performance in Facial Expression Recognition
The results in Table 7 show that the CvT model outperforms the ViT model in facial expression recognition of children with autism.
Children with autism exhibit reduced dynamic variability in their entire face and display more balanced intensity of facial movements [
9], as compared with typically developing children. Gepner et al. [
30] discovered, via computational analysis, that children with autism have diminished complexity in all facial regions when experiencing sadness, whereas certain facial regions display atypical dynamics during moments of happiness. In order to accurately predict the emotional states of children with autism, it is crucial to analyze both the intricate features of their entire face and the distinct features of certain facial regions.
The CvT model synergistically integrates the advantages of CNN’s local feature recognition with Transformer’s global information processing capability, enabling collection of both local details and the overall structural characteristics of facial expressions. Compared with the ViT model, which mainly relies on global information processing, the CvT model shows better performance in dealing with tasks with special expression features such as those of children with autism. Wodajo et al. [
31] proposed a network structure including convolution and ViT for face forgery detection task, which raises the accuracy to more than 75%. It also demonstrates the efficacy of utilizing convolution and Transformer in combination, consistent with the findings of this research. Hence, when constructing a classification model for facial expression images of children with autism, it is necessary to thoroughly consider the differences in children’s facial expressions. In addition, incorporating the concept of convolution into the model enables it to effectively focus on the fine-grained features of the image.
5.4.2. Advantages of Mel Spectrogram for Analyzing Speech Characteristics of Autistic Children
The experimental results presented in Table 8 show that the Mel spectrogram contains more types of speech emotional characteristics in children with autism, with distinct variations detected among different features. Using the Mel spectrogram as a model input to assess the speech features of children with autism is more advantageous.
Autistic children’s speech contains atypical pitch, rhythm, and rich short-time features. Mel spectrogram preserves the majority of audio signals in the original speech, excel at analyzing time-domain features such as frequency, energy, amplitude, and other short-time segmental features of speech samples, and are particularly relevant to the emotions of children with autism. This conclusion is consistent with the findings of Meng et al. [
32] and Bulatović et al. [
33]. MFCCs are generated from the original sound using computational processing like discrete cosine transform, which are primarily used to describe the directionality and energy distribution information of speech samples, and are particularly good at analyzing frequency domain features such as power spectral density. But these features have weak correlations with the emotions of children with autism , resulting in poor performance in autism emotion recognition studies.
5.4.3. Feature Fusion Model Leverage Complementary Benefits of Multimodal Data
Based on the results presented in Table 8, the expression and speech feature fusion model demonstrates superior recognition performance against the single-modal data model, which proves that the complementary advantages of multimodal data overcome the limitations of single-modal data.
Expression and speech, two distinct sources of emotional information, provide complementary data. Expression mainly conveys non-verbal emotional information, whereas signals such as intonation and rhythm in speech also contains emotion, which cannot be fully accessed in a single modality. Furthermore, a single modality has constraints when it comes to addressing nuanced alterations in emotional displays. Multimodal fusion has the ability to decrease errors or ambiguities that arise from a single source of information, thus enhancing the accuracy and robustness of the model. In special groups such as children with emotional interaction disorder, the change of facial expression may be less discernible, thus incorporating speech signals can enhance the model’s comprehension of the individual’s emotional state.
The advantages of multimodal data were also verified by Li et al. [
34]. They used auditory and visual clues from children with autism to predict children’s positive, negative, and neutral emotional states in real-world game therapy scenarios, with a recognition accuracy of 72.40% [
34]. We use the CvT network to extract facial expression and speech features of children with autism. By using a multi-scale channel attention module, the model enables the fusion of multimodal data. The accuracy of multimodal emotion recognition is 90.73%, which is higher than the accuracy of 79.12% for facial expression modality and 83.47% for speech modality. This effectively enhances the model’s performance and makes use of a higher value between the data for both modalities.
5.4.4. Visualization of Emotional Features in Autistic Children
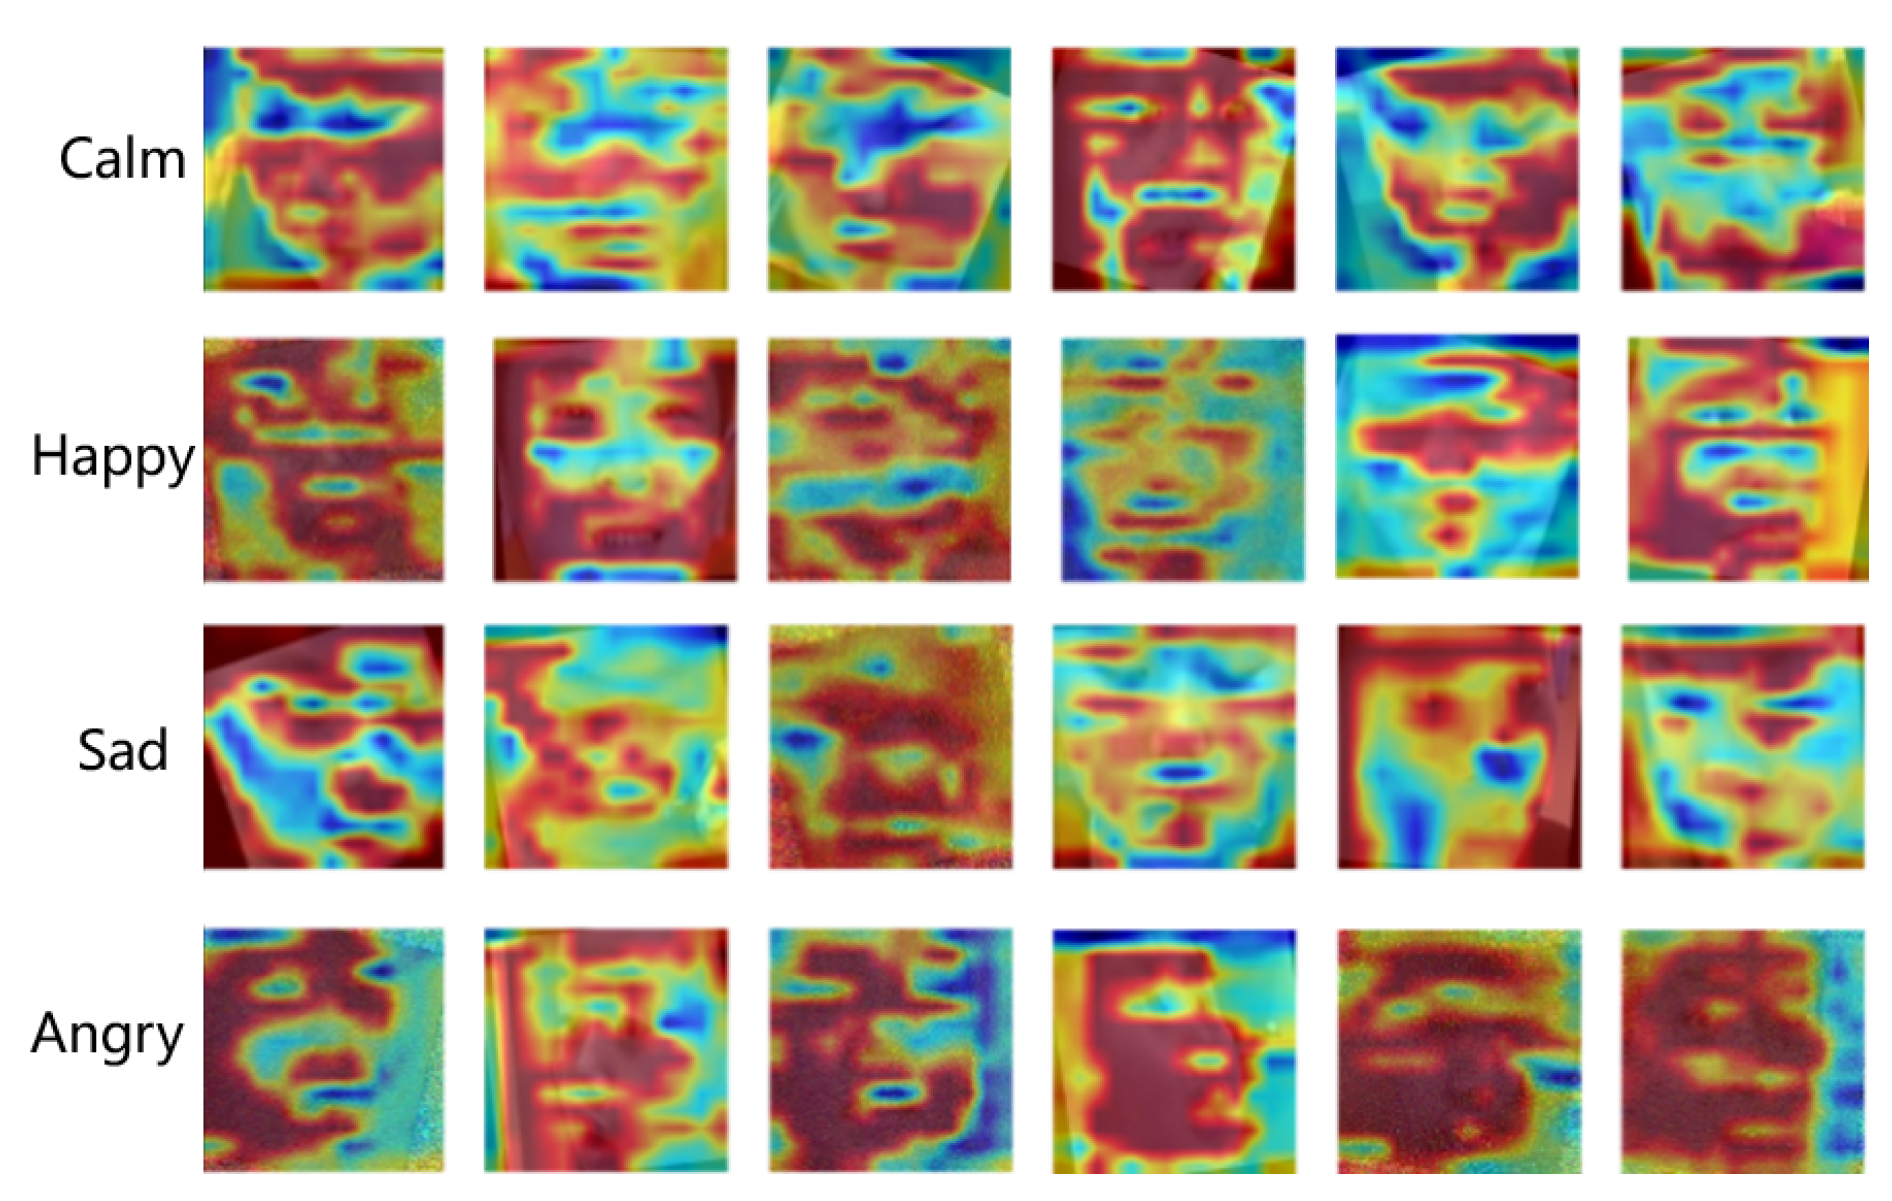
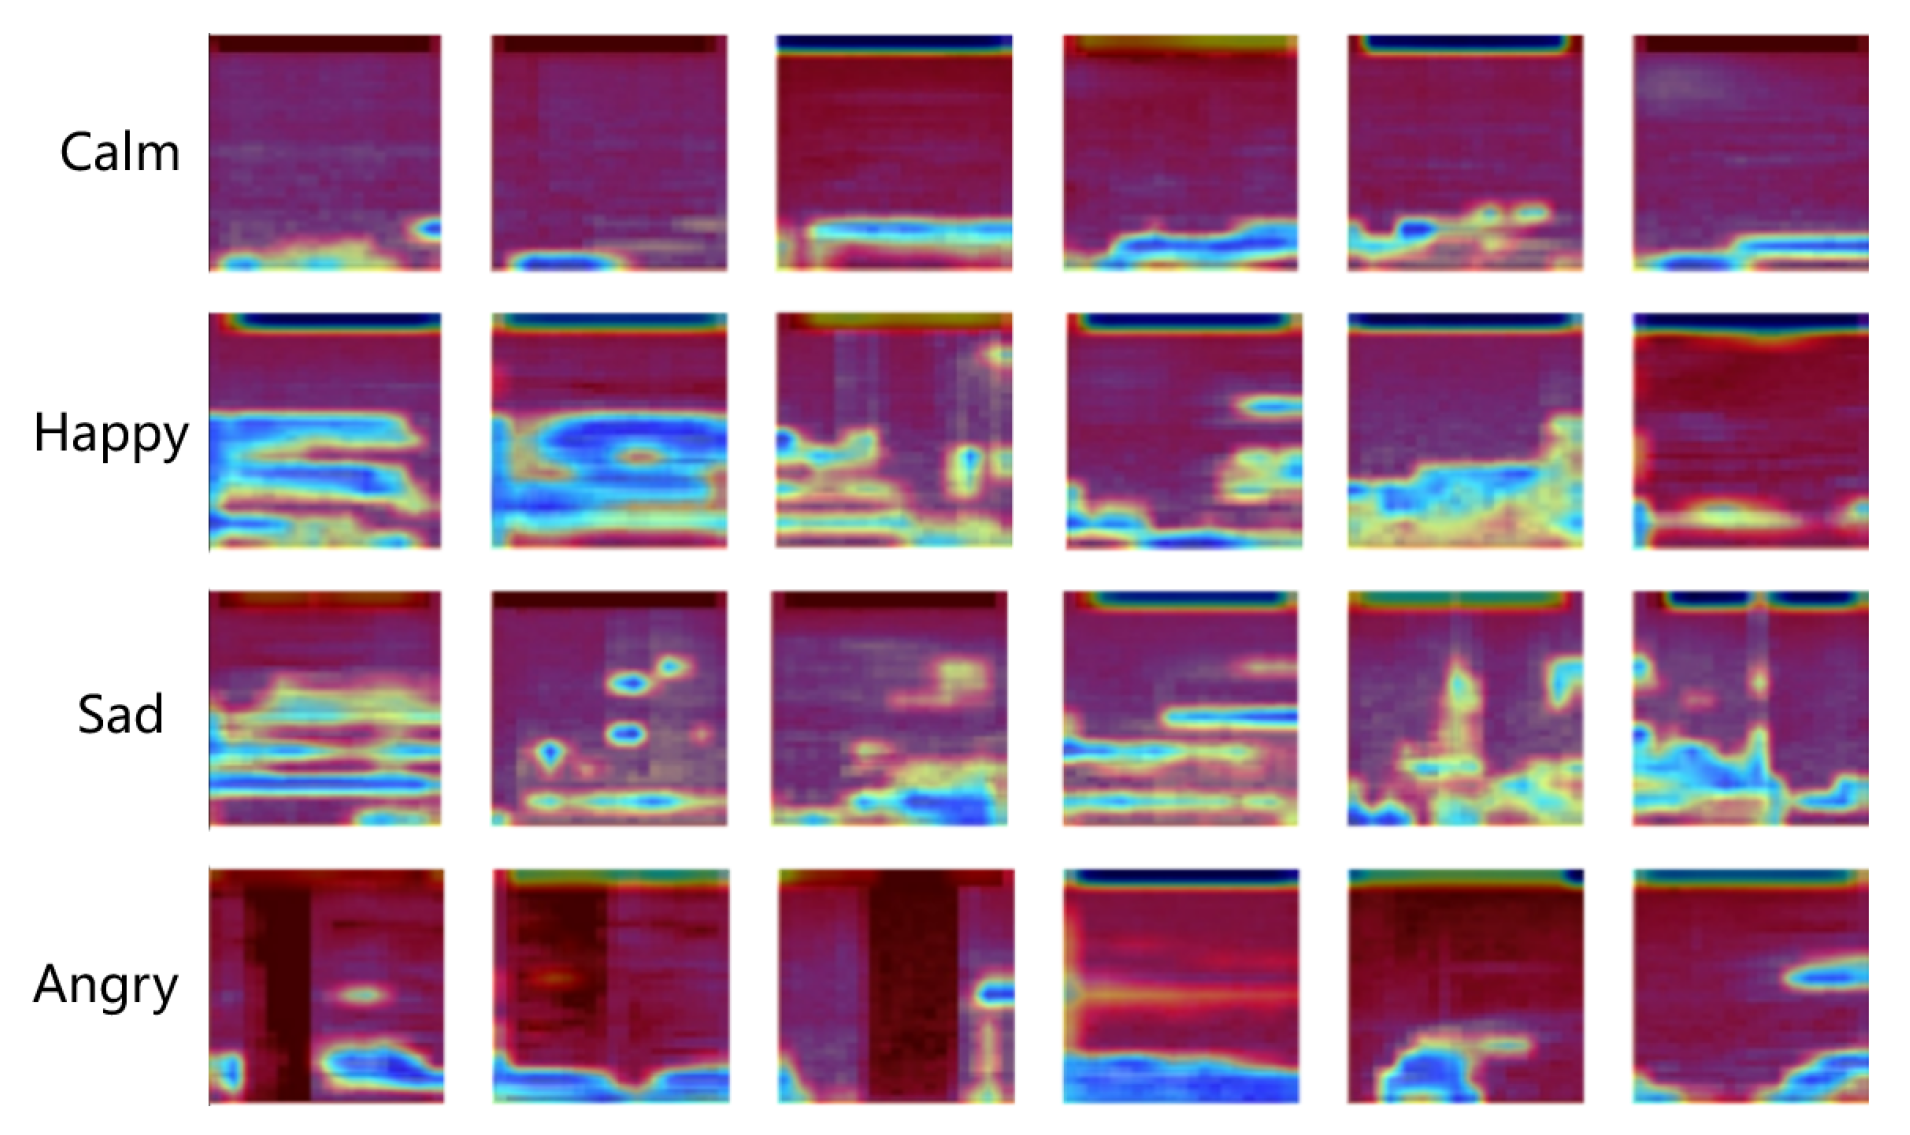
This study uses the gradient-weighted class activation mapping (Grad-CAM) algorithm to generate heat maps to visually represent the significant basis for model prediction. The darker color of red displayed on the heat map signifies a greater contribution and heightened response of the region to the emotion recognition model, which serves as the primary foundation for discriminating emotions in the model.
Figure 13 shows the heat map of the facial expression features of children with autism. According to the color distribution, it is found that: (1) When predicting calm emotions, the multimodal feature fusion model places a greater emphasis on the local areas of the face, including the upper cheeks, forehead, jaw, and nasolabial folds. (2) In the case of happy emotions, the model’s attention is directed towards sensory regions and their surroundings, such as the eyes, mouth, and albinus muscle. (3) For sad emotions, the model pays more attention to the localized sensory regions of the children’s faces, such as the eyes, mouth, and nose. (4) When it comes to angry emotions, the model primarily focuses on the overall facial features. These analysis reveals that children with autism exhibit reduced utilization of global facial movements for emotional expression, instead relying more on specific facial regions. This finding aligns with the results in Guha et al.’s research on the facial features of children with autism [
9].
Figure 14 displays the heat map of the Mel spectrogram features of children with autism, with the analysis revealing the following: (1) The model gives more attention to the low-frequency components and low-energy region when the emotion is calm, because the signal changes in the Mel spectrogram are smooth and less abruptly increasing. (2) Children’s speech signals in a state of happiness exhibit increased energy, with the frequency mostly concentrated in the middle and low regions. This aspect is the main emphasis of the model. (3) The Mel spectrogram associated with the emotion of sadness exhibits an erratic distribution of frequencies and pronounced fluctuations. The model determines this emotion by analyzing the local changes in frequency. (4) The model predicts angry emotions in children with autism by focusing on the high-frequency, high-energy regions due to the increased speech signal energy detected during anger. Based on the aforementioned analysis, it is concluded that the speech characteristics associated with happy, sad, angry, and calm emotions in children with autism are significantly different, primarily in terms of frequency and energy distribution.
6. Conclusion and Limitations
This study enriches the application of deep learning techniques in the field of emotion perception of children with autism. Based on the creation of a multimodal emotion dataset of children with autism, we first construct a feature fusion emotion recognition model with the CvT network and multi-scale channel attention module. We then conduct comparative experiments of deep learning models to confirm the effectiveness of the fusion strategy. However, there are some limitations in this study. (1) In speech signal modality, only the most typical features of the Mel spectrogram and MFCCs are taken into account, while other features such as the linear prediction cepstrum coefficients, line-spectrogram pair parameters, amplitude ratios etc are not investigated. The impacts of individual features and feature combinations on the efficacy of emotion recognition models should be further examined in future research, and experiments are required to identify the speech elements that most accurately represent the emotions associated with autism. (2) The fact that the dataset is built from a special education facility in East China raises the possibility that the subjects’ cultures have an impact on it. Subsequent studies should gather data from diverse countries and areas to further confirm the applicability of this work.
Author Contributions
Conceptualization, Y.W. and K.P.; methodology, Y.W. and K.P.; software, Y.W. and K.P.; validation, K.P. and Y.S.; formal analysis, Y.W. and K.P.; investigation, K.P. and Y.S.; resources, Y.W. and K.P.; data curation, K.P. and Y.S.; writing—original draft preparation, Y.W., K.P. and Y.S.; writing—review and editing, Y.W., K.P., Y.S., J.M. and X.L.; supervision, X.L.; project administration, Y.W.; funding acquisition, Y.W. All authors have read and agreed to the published version of the manuscript.
Funding
This research was funded by the National Natural Science Foundation of China (Grant No. 62177043), the National Social Science Fund of China (Grant No. 20BKS099) and the Humanities and Social Sciences Research Projects of the Ministry of Education (Grant No. 18YJCZH085).
Institutional Review Board Statement
The study was conducted in accordance with the Declaration of Helsinki, and approved by the Ethics Committee of the Institute of Applied Psychology at Zhejiang University of Technology (No. 2024D008).
Informed Consent Statement
Informed consent was obtained from all subjects involved in the study.
Data Availability Statement
The data presented in this study are available on request from the corresponding author due to privacy and ethical restrictions.
Conflicts of Interest
The authors declare no conflicts of interest.
Abbreviations
The following abbreviations are used in this manuscript:
| ASD |
autism spectrum disorder |
| MFCCs |
Mel-frequency cepstral coefficients |
| CNN |
convolutional neural network |
| MS-CAM |
Multiscale Channel Attention Module |
References
- Garcia-Garcia, J.M.; Penichet, V.M.; Lozano, M.D.; Fernando, A. Using emotion recognition technologies to teach children with autism spectrum disorder how to identify and express emotions. Universal Access in the Information Society 2022, 21, 809–825. [Google Scholar] [CrossRef]
- Sarmukadam, K.; Sharpley, C.F.; Bitsika, V.; McMillan, M.M.; Agnew, L.L. A review of the use of EEG connectivity to measure the neurological characteristics of the sensory features in young people with autism. Reviews in the Neurosciences 2019, 30, 497–510. [Google Scholar] [CrossRef] [PubMed]
- Shi, J.; Liu, C.; Ishi, C.T.; Ishiguro, H. Skeleton-based emotion recognition based on two-stream self-attention enhanced spatial-temporal graph convolutional network. Sensors 2020, 21, 205. [Google Scholar] [CrossRef] [PubMed]
- Zhai, X.; Xu, J.; Wang, Y. Research on Learning Affective Computing in Online Education: From the Perspective of Multi-source Data Fusion. Journal of East China Normal University (Educational Sciences) 2022, 40, 32. [Google Scholar]
- Donahue, J.; Anne Hendricks, L.; Guadarrama, S.; Rohrbach, M.; Venugopalan, S.; Saenko, K.; Darrell, T. Long-term recurrent convolutional networks for visual recognition and description. In Proceedings of the Proceedings of the IEEE conference on computer vision and pattern recognition, 2015, pp. 2625–2634.
- Zhang, K.; Huang, Y.; Du, Y.; Wang, L. Facial expression recognition based on deep evolutional spatial-temporal networks. IEEE Transactions on Image Processing 2017, 26, 4193–4203. [Google Scholar] [CrossRef]
- Samad, M.D.; Bobzien, J.L.; Harrington, J.W.; Iftekharuddin, K.M. Analysis of facial muscle activation in children with autism using 3D imaging. In Proceedings of the 2015 IEEE International Conference on Bioinformatics and Biomedicine (BIBM); IEEE, 2015; pp. 337–342. [Google Scholar]
- Metallinou, A.; Grossman, R.B.; Narayanan, S. Quantifying atypicality in affective facial expressions of children with autism spectrum disorders. In Proceedings of the 2013 IEEE international conference on multimedia and expo (ICME); IEEE, 2013; pp. 1–6. [Google Scholar]
- Guha, T.; Yang, Z.; Grossman, R.B.; Narayanan, S.S. A computational study of expressive facial dynamics in children with autism. IEEE transactions on affective computing 2016, 9, 14–20. [Google Scholar] [CrossRef]
- American Psychiatric Association, D.; American Psychiatric Association, D.; et al. Diagnostic and statistical manual of mental disorders: DSM-5; American psychiatric association: Washington, DC, 2013; Vol. 5. [Google Scholar]
- Jacques, C.; Courchesne, V.; Mineau, S.; Dawson, M.; Mottron, L. Positive, negative, neutral—or unknown? The perceived valence of emotions expressed by young autistic children in a novel context suited to autism. Autism 2022, 26, 1833–1848. [Google Scholar] [CrossRef]
- Bone, D.; Black, M.P.; Lee, C.C.; Williams, M.E.; Levitt, P.; Lee, S.; Narayanan, S.S. Spontaneous-Speech Acoustic-Prosodic Features of Children with Autism and the Interacting Psychologist. In Proceedings of the InterSpeech; 2012; pp. 1043–1046. [Google Scholar]
- Bone, D.; Black, M.P.; Ramakrishna, A.; Grossman, R.B.; Narayanan, S.S. Acoustic-prosodic correlates of’awkward’prosody in story retellings from adolescents with autism. In Proceedings of the Interspeech; 2015; pp. 1616–1620. [Google Scholar]
- Diehl, J.J.; Paul, R. Acoustic differences in the imitation of prosodic patterns in children with autism spectrum disorders. Research in autism spectrum disorders 2012, 6, 123–134. [Google Scholar] [CrossRef]
- Yankowitz, L.D.; Schultz, R.T.; Parish-Morris, J. Pre-and paralinguistic vocal production in ASD: Birth through school age. Current psychiatry reports 2019, 21, 1–22. [Google Scholar] [CrossRef]
- Winczura, B. Dziecko z autyzmem: terapia deficytów poznawczych a teoria umysłu. Psychologia Rozwojowa 2009, 14. [Google Scholar]
- Jaklewicz, H. Autyzm wczesnodzieciÄ™ cy: diagnoza, przebieg, leczenie; GdaĹ „skie Wyd-wo Psychologiczne, 1993. [Google Scholar]
- Mehrabian, A. Communication without words. In Communication theory; Routledge, 2017; pp. 193–200. [Google Scholar]
- Rozga, A.; King, T.Z.; Vuduc, R.W.; Robins, D.L. Undifferentiated facial electromyography responses to dynamic, audio-visual emotion displays in individuals with autism spectrum disorders. Developmental science 2013, 16, 499–514. [Google Scholar] [CrossRef]
- Jarraya, S.K.; Masmoudi, M.; Hammami, M. A comparative study of Autistic Children Emotion recognition based on Spatio-Temporal and Deep analysis of facial expressions features during a Meltdown Crisis. Multimedia Tools and Applications 2021, 80, 83–125. [Google Scholar] [CrossRef]
- Talaat, F.M. Real-time facial emotion recognition system among children with autism based on deep learning and IoT. Neural Computing and Applications 2023, 35, 12717–12728. [Google Scholar] [CrossRef]
- Landowska, A.; Karpus, A.; Zawadzka, T.; Robins, B.; Erol Barkana, D.; Kose, H.; Zorcec, T.; Cummins, N. Automatic emotion recognition in children with autism: a systematic literature review. Sensors 2022, 22, 1649. [Google Scholar] [CrossRef] [PubMed]
- Ram, C.S.; Ponnusamy, R. Assessment on speech emotion recognition for autism spectrum disorder children using support vector machine. World Applied Sciences J 2016, 34, 94–102. [Google Scholar]
- Sukumaran, P.; Govardhanan, K. Towards voice based prediction and analysis of emotions in ASD children. Journal of Intelligent & Fuzzy Systems 2021, 41, 5317–5326. [Google Scholar]
- Geetha, A.; Mala, T.; Priyanka, D.; Uma, E. Multimodal Emotion Recognition with deep learning: advancements, challenges, and future directions. Information Fusion 2024, 105, 102218. [Google Scholar]
- Minotto, V.P.; Jung, C.R.; Lee, B. Multimodal multi-channel on-line speaker diarization using sensor fusion through SVM. IEEE Transactions on Multimedia 2015, 17, 1694–1705. [Google Scholar] [CrossRef]
- Zhang, Y.; Sidibé, D.; Morel, O.; Mériaudeau, F. Deep multimodal fusion for semantic image segmentation: A survey. Image and Vision Computing 2021, 105, 104042. [Google Scholar] [CrossRef]
- Jun, H.; Caiqing, Z.; Xiaozhen, L.; Dehai, Z. Survey of research on multimodal fusion technology for deep learning. Computer Engineering 2020, 46, 1–11. [Google Scholar]
- Dai, Y.; Gieseke, F.; Oehmcke, S.; Wu, Y.; Barnard, K. Attentional feature fusion. In Proceedings of the Proceedings of the IEEE/CVF winter conference on applications of computer vision, 2021, pp. 3560–3569.
- Gepner, B.; Godde, A.; Charrier, A.; Carvalho, N.; Tardif, C. Reducing facial dynamics’ speed during speech enhances attention to mouth in children with autism spectrum disorder: An eye-tracking study. Development and psychopathology 2021, 33, 1006–1015. [Google Scholar] [CrossRef] [PubMed]
- Wodajo, D.; Atnafu, S. Deepfake video detection using convolutional vision transformer. arXiv arXiv:2102.11126 2021.
- Meng, H.; Yan, T.; Yuan, F.; Wei, H. Speech emotion recognition from 3D log-mel spectrograms with deep learning network. IEEE access 2019, 7, 125868–125881. [Google Scholar] [CrossRef]
- Bulatović, N.; Djukanović, S. Mel-spectrogram features for acoustic vehicle detection and speed estimation. In Proceedings of the 2022 26th International Conference on Information Technology (IT). IEEE; 2022; pp. 1–4. [Google Scholar]
- Li, J.; Bhat, A.; Barmaki, R. A two-stage multi-modal affect analysis framework for children with autism spectrum disorder. arXiv arXiv:2106.09199 2021.
Figure 1.
Modal timing matching method.
Figure 1.
Modal timing matching method.
Figure 2.
Comparison of the Mel spectrograms of calm and happy emotions.
Figure 2.
Comparison of the Mel spectrograms of calm and happy emotions.
Figure 3.
Generation of Mel spectrograms and MFCCs.
Figure 3.
Generation of Mel spectrograms and MFCCs.
Figure 4.
Partial examples in the facial expression image and Mel spectrogram datasets.
Figure 4.
Partial examples in the facial expression image and Mel spectrogram datasets.
Figure 5.
Partial examples in the facial expression image and Mel spectrogram datasets.
Figure 5.
Partial examples in the facial expression image and Mel spectrogram datasets.
Figure 6.
ViT model structure.
Figure 6.
ViT model structure.
Figure 7.
CvT model structure.
Figure 7.
CvT model structure.
Figure 8.
Bi-LSTM model structure.
Figure 8.
Bi-LSTM model structure.
Figure 9.
Multimodal feature fusion model structure.
Figure 9.
Multimodal feature fusion model structure.
Figure 10.
Train loss curves of different models.
Figure 10.
Train loss curves of different models.
Figure 11.
Training and validation process of multimodal feature fusion model.
Figure 11.
Training and validation process of multimodal feature fusion model.
Figure 12.
Confusion matrix of the multimodal feature fusion model.
Figure 12.
Confusion matrix of the multimodal feature fusion model.
Figure 13.
Visualization of facial expression features.
Figure 13.
Visualization of facial expression features.
Figure 14.
Visualization of Mel spectrogram features.
Figure 14.
Visualization of Mel spectrogram features.
Table 1.
Data Annotation Standards.
Table 2.
Numbers of Facial Expression Image and Speech Mel Spectrogram Datasets.
Table 2.
Numbers of Facial Expression Image and Speech Mel Spectrogram Datasets.
| Emotion type |
Training set |
Validation set |
Test set |
Total |
| Calm |
11,328 |
2834 |
1574 |
15,736 |
| Happy |
7002 |
1752 |
974 |
9728 |
| Sad |
9106 |
2278 |
1266 |
12,650 |
| Angry |
8258 |
2066 |
1148 |
11,472 |
| Total |
35,694 |
8930 |
4962 |
49,586 |
Table 3.
Number of MFCC Datasets.
Table 3.
Number of MFCC Datasets.
| Emotion type |
Training set |
Validation set |
Test set |
Total |
| Calm |
160,474 |
96,672 |
39,444 |
296,590 |
| Happy |
138,168 |
29,982 |
19,494 |
187,644 |
| Sad |
203,224 |
22,192 |
14,592 |
240,008 |
| Angry |
176,662 |
20,482 |
20,748 |
217,892 |
| Total |
678,528 |
169,328 |
94,278 |
942,134 |
Table 4.
Internal parameters of the CvT model.
Table 4.
Internal parameters of the CvT model.
| |
Module Type |
Layer Name |
CvT-13 |
Output Size |
Params# |
| Stage 1 |
Convolutional Token Embedding |
Conv.Embed |
7×7,64,stride 4 |
[64,56,56] |
9600 |
Convolutional
Projection |
Conv.Proj |
|
[3136,64] |
52096 |
| MHSA |
| MLP |
| Stage 2 |
|
Rearrge |
(b(h w)c)->(b c h w) |
[64,56,56] |
– |
| Convolutional Token Embedding |
Conv.Embed |
3×3,192,stride 2 |
[192,28,28] |
111168 |
Convolutional
Projection |
Conv.Proj |
|
[784,192] |
902400 |
| MHSA |
| MLP |
| Stage 3 |
|
Rearrge |
(b(h w)c)->(b c h w) |
[192,28,28] |
– |
| Convolutional Token Embedding |
Conv.Embed |
3×3,384,stride 2 |
[384,14,14] |
664704 |
Convolutional
Projection |
Conv.Proj |
|
[197,384] |
17871360 |
| MHSA |
| MLP |
| Head |
|
Linear |
|
[4] |
2308 |
Table 5.
Parameters of the Layers of the Multimodal Feature Fusion Model.
Table 5.
Parameters of the Layers of the Multimodal Feature Fusion Model.
| Module Type |
Layer Name |
Output Size |
Params# |
| Initial Feature Fusion |
Summation |
[384,14,14] |
– |
| Local Attention Branch |
Conv2d |
[96,14,14] |
75168 |
| ReLU |
[96,14,14] |
| Conv2d |
[384,14,14] |
| Global Attention Branch |
AdaptiveAvgPool2d |
[384,1,1] |
75168 |
| Conv2d |
[96,1,1] |
| ReLU |
[96,1,1] |
| Conv2d |
[384,1,1] |
| Feature Fusion Layer |
Sigmoid |
[384,14,14] |
– |
| Fully Connected Layer |
Linear |
[4] |
1540 |
Table 6.
Parameter Settings for Different Models.
Table 6.
Parameter Settings for Different Models.
| Module Type |
Optimizer |
Lr |
loss function |
Epochs |
Batch
size |
Random Shuffle |
| ViT-based Facial Expression Recognition Model |
SGD |
1e-3 |
Cross Entropy Loss |
500 |
32 |
True |
| CvT-based Facial Expression Recognition Model |
Adam |
1e-5 |
Cross Entropy Loss |
500 |
32 |
True |
| CvT-based Mel Spectrogram Recognition Model |
Adam |
1e-4 |
Cross Entropy Loss |
300 |
32 |
True |
| Bi-LSTM-based MFCCs Recognition Model |
Adam |
1e-5 |
MSE |
500 |
64 |
False |
| Expression and Speech Feature Fusion Model based on Attention Mechanism |
Adam |
1e-6 |
Cross Entropy Loss |
30 |
8 |
False |
Table 7.
The Accuracies of Different Models for Emotion Recognition.
Table 7.
The Accuracies of Different Models for Emotion Recognition.
| Model Type |
Overall Accuracy |
Calm |
Happy |
Sad |
Angry |
| ViT(Facial Expression) |
48% |
62.90% |
52.57% |
36.81% |
36.06% |
| CvT(Facial Expression) |
79.12% |
73.82% |
90.14% |
75.67% |
80.84% |
| CvT(Mel spectrogram) |
83.47% |
84.12% |
83.78% |
82.15% |
83.80% |
| Bi-LSTM(MFCCs) |
25.72% |
29.48% |
21.64% |
38.28% |
13.55% |
Table 8.
Results of the Multimodal Feature Fusion Model on the Test Set.
Table 8.
Results of the Multimodal Feature Fusion Model on the Test Set.
| Evaluation Metrics |
Calm |
Happy |
Sad |
Angry |
| Precision |
91.75% |
91.33% |
91.14% |
88.39% |
| Recall |
90.47% |
93.02% |
91.00% |
88.85% |
|
Disclaimer/Publisher’s Note: The statements, opinions and data contained in all publications are solely those of the individual author(s) and contributor(s) and not of MDPI and/or the editor(s). MDPI and/or the editor(s) disclaim responsibility for any injury to people or property resulting from any ideas, methods, instructions or products referred to in the content. |
© 2025 by the authors. Licensee MDPI, Basel, Switzerland. This article is an open access article distributed under the terms and conditions of the Creative Commons Attribution (CC BY) license (http://creativecommons.org/licenses/by/4.0/).