
Submitted:
19 February 2025
Posted:
20 February 2025
You are already at the latest version
Abstract
Soil and water resources are crucial for the stability and sustainable development of oases in inland arid zones. The conflict between socio-economic development and ecological environmental protection is a major challenge. Establishing a harmonious, stable, efficient, and sustainable oasis is key to balancing economic growth and environmental protection. This study evaluates oasis value through Gross Domestic Product (GDP) and Gross Ecosystem Product (GEP), revealing the current economic and ecological value of oases and the relationship between oasis value conversion in Xinjiang. This is achieved by combining land value transfer, oasis water-heat balance equation, and oasis value system, thereby assessing oasis stability and sustainability amid changes in value scale. The results indicate significant differences in the development trajectories of artificial and natural oases in Xinjiang since 2000. There has been a considerable expansion in the area and GEP of artificial oases, while the GEP of natural oases has continuously decreased. The land value transfer matrix reveals that converting ecological spaces to construction land and arable land has resulted in the loss of land GEP while simultaneously generating substantial GDP. The MOP model's optimization of oasis structures in each region indicates that areas like Aksu and Altay need to prioritize ecological security over the economic value of artificial oases. In contrast, regions like Bortala and Changji, with higher carrying capacities, can expand artificial oases to boost economic benefits without compromising ecological safety. This study offers a framework for evaluating and optimizing the value and sustainability of oases, playing a crucial role in balancing ecological security and socio-economic value in arid zones.
Keywords:
gross ecosystem product
; oases
; economic benefits
; ecological benefits
; MOP model
1. Introduction
Oasis is a combination of natural and artificial complexes unique to arid zones [1]. As an inseparable part of the ecosystem, oasis is also the carrier of human economic development [2]. With the intensification of human activities, the continuous expansion of artificial oasis is accompanied by the decline of natural oasis, and the contradiction between the two is becoming more and more obvious [3,4]. To establish a harmonious, stable and sustainable oasis, there is an urgent need to find a balance between artificial and natural oases and research on the appropriate size of the oasis under the constraints of water resources. [5].
Maintaining the sustainable development of oasis and coordinating the relationship between economic development and environmental protection is impossible to avoid [6]. Initially, the negative effects of economic development on resources and the environment were first observed by researchers [7]. Later, the emergence of the “environmental Kuznets curve” corrected the view that economic growth will definitely bring negative impact on the ecological environment, and obtained the idea that economic development to a certain extent will help to improve the quality of the ecological environment [8]. However, it is difficult to grasp the balance of interests between economic development and ecological environment protection from the perspective of economic development or ecological protection [9]. After the opposing viewpoints, researchers have tried to maintain the coordinated development of economic development and environmental protection [10]. In the process of land development, the stability and balance of economic and ecological space is ensured by dividing ecological protection zones to avoid being destroyed [11]. Although this approach effectively protects ecological land, it also limits the space for land value enhancement.
After that, most of the research focused on exploring the mechanism of natural resources value preservation and appreciation to realize the win-win situation between economic development and environmental protection [12,13]. A series of relationship models of benign coexistence between economic development and environmental protection have been successively proposed and explained [14]. From the environmental Kuznets inverted U-curve relationship to the coupling of urbanization and ecological environment [8,15]. Scholars increasingly observe the possibility of organic unification of economic development and environmental protection. That is, through the revision of the original ecological space area, to guide the land use to the more valuable functional area change [16], and then realize the land value. The emergence of ecosystem gross product [17] opens up a new way of thinking for balancing the relationship between the two. It also provides technical guidance for exploring the transformational relationship between economic development and environmental protection [18].
The concept of gross ecosystem product (GEP) was proposed in 2013. It is defined as “the sum of the values of final goods and services provided by ecosystems for human well-being and sustainable economic and social development” [19].The GEP accounting framework is able to effectively quantify the value of ecosystem services, and transform ecological benefits into socio-economic benefits. It provides a scientific basis for the value of ecosystem services to be incorporated into the economic and social development assessment system [17]. Under the logic of the transformation of economic value and ecological value of land use. Scholars have developed from the beginning of the static analysis of the regional GEP accounting results [20] to the dynamic change analysis of the GEP accounting results of the study area year by year [13]. Some scholars have also explored the driving factors behind the dynamic changes in GEP [21]. Some studies consider the coupling of economic development and ecological security and evaluate the study area by constructing an evaluation index system. This helps us understand the relationship between economic development and ecology [22]. However, in the quantitative research on land value in the past, the practice is mostly to convert the “land value” into a weighted score “comprehensive evaluation index” or a single evaluation index through the model, which lacks the visualization of the amount of land value transformation. This leads to the limitations of the research results on the production practice.
Xinjiang is located in the inland arid zone, a vast area, the extreme scarcity of water resources makes the region desert. The ecological environment is very fragile and highly susceptible to human activities [22]. Under the conditions of policy support and accelerated urbanization in recent years, the continuous expansion of artificial oases has crowded out the living space of natural oases [23]. The overall area of oasis cannot be expanded indefinitely due to the limitation of water resources [24]. Under such conditions, the oasis in Xinjiang faces the dual tasks of ecological protection and high-quality development in sustainable development. In order to optimize the land use pattern of the oasis, researchers have searched for the carrying capacity limit through the ecological footprint method and the principle of system dynamics. And more satisfactory results have been obtained in Tarim River Basin and Shiyang River Basin [25,26]. With the increasing complexity and diversity of oasis land pattern changes, the coupled simulation model taking into account the structure-layout has become a hot spot of oasis land optimization research. For example, the MOP-CLUE model [27], the SD-FLUS model and the MCR- FLUS-Markov model [28,29] have provided scientific methodological support for the study of oasis land optimization. However, in the process of oasis land change, the contradiction between the increase of economic benefits and the loss of ecological benefits cannot be avoided. Methods such as ecosystem service value assessment based on land use change [30], statistical information and surveys [31], and parametric modeling have been gradually applied to the trade-off analysis of ecological and economic benefits of land [32]. However, in actual land use planning decisions, decision makers’ preferences for different development goals often lead to different land use outcomes. Existing studies are prone to neglect the trade-off relationship between social, economic and ecological benefits under different development goal preferences [33]. Therefore, choosing multi-objective preference trade-off analysis and proposing the optimization scheme of future oasis land use pattern is more realistic operability and policy guidance.
In this regard, this study mainly considers the economic and ecological values of land use through GDP and GEP comprehensively. It explores the value transformation law between artificial oasis and natural oasis in Xinjiang. And through the multiple-objective programming (MOP) model to plan the future sustainable oasis structure, based on the above oasis value transformation relationship, analyze the future oasis value transfer. Provide scientific basis for the sustainable development of Xinjiang oasis region. It will help to promote the rational planning and protection of oasis resources in Xinjiang and realize the sustainable synergistic development of economic development and ecological environment.
2. Materials and Methods
2.1. Study Area
The study area is Xinjiang (Figure 1), with a total area of 1.66 million yuan km2, located in the hinterland of the Eurasian continent, with a geographic location from 34°25′N to 48°10′N and 73°40′E to 96°18′E, and bordered by eight countries including Russia, Kazakhstan, Tajikistan, Afghanistan, Pakistan and India. As Xinjiang is far from the sea, it has a typical temperate continental arid climate with large temperature difference, sufficient sunshine time, low precipitation and high evaporation. Most rivers in Xinjiang are seasonal intermittent and rivers. Mountains surrounded by rolling hills of the terrain and blocked access to the sea, and eventually disappeared into the desert or pooled in the depression to form the tail break into the lake.
Oases are categorized into AO and NO. NO land-use types in the study area include forested, open forest, shrub, high cover grassland, medium cover grassland, lakes, beaches, and swamps. AOs include paddy fields, dry land, other forested land, construction land, reservoirs, and canals.Oasis in Xinjiang is mainly distributed in the basin and plains, of which AO is mostly distributed in the middle and lower reaches of the river, and NO is distributed in the lower reaches and the periphery of the AO [34].
2.2. Data Sources
The data used in this study to calculate GEP include land use and statistical data. The land use data were obtained from the Center for Resource and Environmental Sciences and Data of the Chinese Academy of Sciences. (https://www.resdc.cn/) with a resolution of 30 meters. Statistical data on agriculture, forestry, animal husbandry and fishery, grain production and planted area are mainly from Xinjiang Statistical Yearbook (2001, 2011 and 2021) (https://tjj. xinjiang.gov.cn/). Water resources data and precipitation data are from Xinjiang Water Resources Bulletin(2001,2011and2021)(http://slt.xinjiang.gov.cn/).
The evapotranspiration (ET) data used to calculate the water-heat balance equations were obtained from the PMLV2 data of the Geospatial Data Cloud (http://www.gscloud.cn/) with a spatial resolution of 500 m. The NPP data were based on MODIS17A3 data and processed using the GEE platform. Group official website (http://www.ntsg.umt.edu). The price of reservoir capacity, carbon sequestration price, and oxygen production price were referred to the Specification for the Assessment of Forest Ecosystem Service Function.
2.3. Research Methods
This study investigates the changing relationship between GEP and GDP by calculating the GEP and GDP of different land uses in Xinjiang in different ages. Through the constraints of the MOP model, the amount of transformation between GEP and GDP under the future sustainable development conditions is accounted for. The research framework diagram is shown in Figure 2.
2.4. Technical Paths for the Conversion of Economic and Ecological Values of Land Use
The GDP and GEP indicators, which measure the economic and ecological value of land, were chosen as the main criteria for assessing the economic and ecological value of oases.It is worth noting that the economic and ecological values of oases do not directly originate from the land resources themselves, but rather from the spatial utilization patterns that give the land specific functional attributes and the compounding effects of human activities. Therefore, using GDP and GEP to measure the economic and ecological value of land is essentially an assessment of the value of spatial utilization outputs over the land cover [17].
The regional GDP is used as an indicator to assess the economic value of the oasis. The spatial scope of the assessment is positioned on construction land, versus arable land. It should be emphasized that although GDP reflects the overall economic scale of the entire regional area, the economic value of the land does not arise only from the construction land, and in order to be able to differentiate from the ecological value of ecological spatial land, the primary industry GDP in GDP is assigned to arable land, which includes the gross product of agriculture, forestry, animal husbandry and fishery, and the secondary and tertiary industry GDP is assigned to the construction land, which includes the gross product of GDP of construction, service industry, etc.
The ecosystem product GEP [35] was used as an indicator to assess the ecological value of land use. The spatial scope of land use ecological value assessment is the ecological land in Xinjiang, including forest land and grassland, water bodies and wetlands carrying natural ecological space, and cropland carrying artificial ecological space.
All tables should be numbered with Arabic numerals. Headings should be placed above tables, left justified. Leave one line space between the heading and the table. Only horizontal lines should be used within a table, to distinguish the column headings from the body of the table, and immediately above and below the table. Tables must be embedded into the text and not supplied separately. Below is an example which authors may find useful.
EPV means the value of ecological resource market products, ERSV means the value of ecological regulation services, and ECSV means the value of ecological cultural services.
2.5. GEP Accounting Framework
The GEP accounting framework of this study is divided into 3 major categories: supply service value, regulation service value, and cultural service value. It includes 10 items of product provision [19], water supply, water conservation [36]., flood storage [37], carbon sequestration and oxygen release [38], soil conservation [39,40], water purification [41], air purification, wind and sand control [42], and aesthetic landscape. Determine the calculation method and formula parameters for each functional value based on the characteristics of Xinjiang’s mainly arid and semi-arid climate. Carry out GEP accounting and assessment of the study area (Table 1).
2.6. Value Transformation Analysis
On the basis of obtaining land use data, the two periods of spatial data were intersected and counted through the ArcGIS platform, and then the land use transfer matrix operation was used to obtain the number, structure and direction of the land use type transformation from 2000 to 2020. The land use transfer matrix is usually expressed in the form of a table, and its mathematical model expression is shown in equation (2) [43].
where Sij represents the land area of land type i transformed into land type j, n represents the number of land use types,. Type i and j represent the land use types at the beginning and the end of the transfer.
On the basis of obtaining the results of monetized measurement of economic and ecological values of land use, the economic value density Yk (108 yuan/km2) and ecological value density Pi (billion yuan/km2) of each land use are calculated as shown in Equation 21 and 22 [44].
where Yk represents the economic value density of land use, GDP is the GDP of k area, and Sk is the area of AO of k area; Pi represents the ecological value density of land use, and GEP is the GEP of i land class, and Si is the area of i ecological land class.
Finally, the land use transfer matrix and land use value density calculation are combined to realize the transformation analysis of economic and ecological values of land use.The value transformation between ecospatial land use is calculated as equation 23. The value conversion of ecological land and construction land is calculated as shown in equation 24 and 25 [45].
2.7. Model for Calculating the Appropriate Size of an Oasis
On the global scale, Hm is calculated based on the ratio of precipitation to evaporation potential to divide different climate environment zones. According to the principle of water-heat balance of ecology, put forward the index H0 for evaluating the water-heat balance of oasis [46].
where A is the oasis area; W is the total amount of water resources available in the basin ; W0 is the average annual water demand of industrial water, water for domestic use and ecological environment of the river in the basin; ET0 is the amount of crop vacated according to Penman’s formula for the calculation of the reference crop; P is the average annual precipitation in the basin; kp is the comprehensive influence coefficient of the plants in the basin, which is the influence parameter reflecting the plant’s own biological properties on the demand for water. H0 is able to reflect the degree of guarantee of oasis water resources on the change of oasis scale, and can be used as an indicator to determine whether the oasis is stable.
2.8. MOP Model
Multi Objective Programming (MOP) is a multi-objective planning model, which is one of the important models to study the optimization of land use structure [48].MOP can combine economic, ecological and some variables based on the planner’s own needs, which are considered by defining the objective function and constraints, and the constraints of the objective function are shown in Table 1. In this study, two optimization objectives are defined: ① max Ed(x) to maximize economic benefits; ② max Ep(x) to maximize ecological benefits, and the optimization objectives of MOP are as follows.
where Ed(x) and Ep(x) represent economic and ecological benefits, respectively; xi represents the variable of the i class (i=1, 2,..., 7); di and pi are the coefficients of economic and ecological benefits of the class per unit area. To obtain the optimal land use structure, these two objectives need to be maximized at the same time.
3. Results
3.1. Comprehensive Evaluation of Oasis Economy and Ecological Value
Over the last twenty years, the development trends of AO and NO in Xinjiang have significantly diverged(Table 3). From 2000 to 2010, the GDP of artificial oases in Xinjiang soared by 463.23 billion yuan, a 352.88% increase. This growth continued from 2010 to 2020, with an increase of 785.24 billion yuan, or 132.08%. Concurrently, their GEP and area increased by 34.94% and 37.76%, respectively. Additionally, their value density grew by 171.28% and 98.54% over these two decades. In contrast, natural oases showed a declining economic trend, with a 6.15% decrease in GDP and 9.55% in GEP during the same period. While the area of natural oases generally decreased, their value density saw a modest increase of 2.60% from 2010 to 2020. This data highlights the consistent growth of artificial oases in Xinjiang and the challenges confronting natural oases.
Considering that land use ecological value assessment encompasses six land types, this study offers a comprehensive analysis of this assessment. Between 2000 and 2020, the GDP and GEP changes for different land use types within Xinjiang’s oases varied significantly (Figure 3).
Overall, the GDP saw a significant rise from 138.36 billion yuan in 2000 to 1,386.19 billion yuan in 2020, whereas the GEP experienced a modest increase from 182.58 billion yuan to 189.83 billion yuan. For specific land use types, construction land’s GDP rocketed from 100.62 billion yuan in 2000 to 1,181.63 billion yuan in 2020, marking a 527.4% growth. The GDP of cultivated land escalated from 30.65 billion yuan to 198.13 billion yuan, an increase of 546.6%. Meanwhile, the GDP of forests, shrubs, grasslands, water bodies, and wetlands exhibited relatively stable changes, with growth rates varying from -28.87% to 6.91%. The GEP of cropland increased from 43.51 billion yuan to 58.71 billion yuan, a growth rate of 34.9%. In summary, over these two decades, the remarkable growth in construction and cultivated lands significantly enhanced the GDP contribution of various land use types in the Xinjiang oasis, while the GEP changes for each land use type remained relatively stable.
3.2. Characteristics of Positive and Negative Flow of Oasis Land Value
In land use change, the land’s value resembles a “value vector,” possessing both magnitude and direction. Previously, we derived the “value vector” from the dual calculation of GDP and GEP, while its directional shift was determined by the land use type shift matrix. In this analysis, we’ll integrate the directional shifts in land use types with the average value data of each land type to fully illustrate the flow characteristics of land use values in the Xinjiang oasis. From 2000 to 2020 (Figure 4), the flow characteristics of oasis ecological values exhibited a distinct positive and negative divergence. Between 2000 and 2010, the net transfer was 14.11 billion yuan, with unused land displaying a pronounced positive transfer trend and a total transfer of 48.89 billion yuan with other land types. However, from 2010 to 2020, the ecological value flow of unused land decreased to 9.68 billion yuan. Grasslands and forests, both key ecological land types, demonstrated significant transfers with other land types in both periods. From 2010 to 2020, there was a notable shift from water bodies to wetlands, closely associated with national and local water conservation and wetland restoration policies. Additionally, from 2000 to 2020, the transfer from unused land to other land types amounted to 54.60 billion yuan. These data reveal not only the positive flow characteristics of wasteland during a specific period but also highlight its substantial potential for ecological value.
3.3. Transformation Relationship Between Oasis Economic Value and Ecological Value
Converting ecological spaces into construction and cultivated lands results in a loss of ecological value, but it also significantly increases economic value (Figure 5a).Between 2000 and 2020, changes in land use methods resulted in a 122.37 billion yuan increase in economic value and a 13.35 billion yuan decrease in ecological value. This suggests that for every one yuan decrease in ecological value, economic value increases by 9.17 yuan. the conversion of forests, shrubs, grasslands, wetlands, and water bodies led to economic growth of 24.06 billion yuan, 7.39 billion yuan, 72.82 billion yuan, 2.10 billion yuan, and 16 billion yuan, respectively. Correspondingly, for every yuan decrease in ecological value, these land types contributed 4.95 yuan, 7.51 yuan, 21.35 yuan, 1.50 yuan, and 5.94 yuan to economic growth. ( Figure 5b).
A phased analysis from 2000 to 2010 shows that changes in land use methods led to a 44.06 billion yuan increase in economic value and a 11.12 billion yuan decrease in ecological value. For each yuan reduction in ecological value, economic value increased by 3.96 yuan. The conversion of forests, shrubs, grasslands, wetlands, and water bodies resulted in economic growth of 8.97 billion yuan, 3.06 billion yuan, 25.07 billion yuan, 0.84 billion yuan, and 6.13 billion yuan, respectively. Additionally, for every yuan reduction in ecological value, these land types contributed 2.17 yuan, 3.78 yuan, 9.11 yuan, 0.73 yuan, and 2.70 yuan to economic growth.
From 2010 to 2020, due to the GDP increase, the economic value per unit of land was higher than the previous period, resulting in more economic value from land use changes. Overall, there was a 42.78 billion yuan increase in economic value and a 2.36 billion yuan decrease in ecological value. For every yuan decrease in ecological value, economic value increased by 18.14 yuan. Correspondingly, for every one yuan decrease in ecological value, these land types contributed 7.26 yuan, 3.02 yuan, 30.80 yuan, 2.22 yuan, and 9.17 yuan to economic growth.
3.4. Analysis of Value Changes after Optimizing Structure Based on MOP Model
The framework for future sustainable development of oases is established by applying constraints to the objective function of the MOP model. Given the varied conditions across Xinjiang’s regions, the model was employed to categorize constraints and objectives by region, determining the proportion of oasis that fits the sustainable development model in each area. Integrating the aforementioned relationship between economic and ecological benefits, the trends in economic and ecological benefits of the oasis pre- and post-planning were finally calculated (Table 4).
The evaluation of oasis stability across Xinjiang reveals that 50% of the regions are sub-stable, particularly in Changji, Tacheng, and Yili, while the other 50% are stable, notably in Karamay, Hotan, and Bole, with Altay, Aksu, and Bazhou having the highest share of ecological benefits (Figure 6a).
According to the ratios of artificial to natural oases (Figure 6b, c), in regions like Aksu and Altay, the area ratio is expected to decrease from 1.70 to 1.52 and from 0.53 to 0.37. Conversely, in regions like Bortala and Changji, this ratio is expected to rise from 1.36 to 2.35 and from 3.83 to 3.59, respectively. Economically (Figure 6d), changes are also anticipated in these regions, with Aksu and Altay expected to see decreases of 128 million yuan and 113 million yuan, respectively, while Bayinguoleng and Bortala are projected to see increases of 132 million yuan and 232 million yuan.
On the ecological front (Figure 6e), Aksu’s ecological benefits are expected to see a slight increase of 2.31 million yuan, while those in Altay and Bayinguoleng are projected to decrease by 13.72 million yuan and 1.96 million yuan, respectively. Bortala’s ecological benefits are also anticipated to decrease slightly, by 3.87 million yuan.
These dynamics underscore the complex interaction between economic development, ecological sustainability, and the role of artificial oases. The varying trends across regions highlight the necessity for tailored strategies to balance economic growth and ecological management, guiding changes in oasis landscapes with a long-term view and a focus on sustainable development.
To sustain oasis development, the MOP model, considering H0>0.5, provides insights into land type structure and economic transformation in each region before and after optimization (Figure 7). Future development trends vary across regions. Regions with larger ecological values, like Bortala Mongol Autonomous Prefecture, have more development potential. Here, the artificial to natural oasis ratio rose from 1.36 to 2.35, reducing ecological benefits by 386 million yuan but yielding 2328 million yuan in economic benefits. Conversely, in the Aksu region, the artificial to natural oasis ratio decreased from 1.70 to 1.52, leading to a loss of 12813 million yuan in economic benefits but compensating with 230 million yuan in ecological benefits. High economic density areas like Urumqi and Karamay will gain higher benefits from land structure adjustments. Meanwhile, less economically dense regions will need to relinquish more natural oasis area to achieve a corresponding rise in economic benefits.
4. Discussion
4.1. Unbalanced Development of Oasis Economy and Ecological Value
The growing conflict between social and ecological water use in Xinjiang makes finding a balance challenging. To reverse this and enhance oasis stability while boosting the local economy and preserving ecology, it’s essential to optimize the ecosystem and improve ecological carrying capacity. This requires a rational oasis structure, balancing both aspects to achieve green development in both ecology and society [49].
This study prioritizes water as the key element of oasis development, proposing maximum carrying values for oases in each basin and calculating their GDP and GEP using the MOP model. This approach also allows for determining the optimal proportion of oasis development. The results reveal varying ecological and economic values of oases in each region, with a comprehensive analysis underscoring significant regional differences in economic prosperity and ecological balance. This highlights the urgent need for targeted sustainable development strategies. For instance, the sharp contrast between Changji Prefecture’s economic strength at 138.7 million yuan and Altay’s lower economic figure of 334 million yuan illustrates the uneven distribution of wealth and resources. This economic imbalance also manifests in ecological benefits; Bayin’guoleng’s ecological benefits total 280 million yuan, exemplifying ecological balance, whereas Changji Prefecture, despite its robust economy, falls short in ecological advantages.In Changji, the imbalance between economy and ecology is evident, with an artificial to natural oasis ratio of 3.83, raising concerns about the sustainability of its development model. This situation underscores the importance of integrating ecological considerations into economic planning and points out the potential risks of overlooking environmental health in pursuit of economic growth.
As per the MOP model, the projected shift in the ratio of artificial to natural oases in future planning indicates a deliberate change in regional development strategies.In Bortala, this ratio significantly increases from 1.36 to 2.35, suggesting a preference for artificial oases, possibly motivated by economic incentives.Conversely, in Changji, the ratio slightly decreased to 3.59, indicating a possible reevaluation and shift toward natural oasis restoration, aligning with Xinjiang’s sustainable development objectives.
4.2. Countermeasures for the Sustainable Development of Oasis Economy and Ecological Values
Currently, certain areas must preserve natural oases by reducing artificial ones, leading to a trade-off between economic and ecological values. This can be balanced using ecological compensation and occupancy balancing, mitigating the adverse effects of reduced economic value. Essentially, when a site’s ecological value must yield to economic development, compensation for ecological loss or reconstruction of ecological value at alternative sites can ensure a balance between the site’s economic and ecological values. Implementing an ecological compensation system, the relationship between a site’s economic and ecological values guides compensation for economic loss in areas where ecological value has diminished due to ecological damage [50]. In regions lacking resources, the disparity in oasis value can be compensated with measures like water conservation and external basin water transfers [14].
4.3. Future Development Trend of Oasis Structure
Considering the results of the above analysis, the future development and utilization of oasis soil and water resources in Xinjiang indicate these trends: (1) Artificial oases also retain some ecological value of natural oases. Sustainable development of oasis structures, through rational planning of oasis ratios, aims to enhance socio-economic value, achieving a win-win for both ecology and society. (2) The stability of oases in Northern Xinjiang is lower than in Southern Xinjiang, and the water produced in Northern basins is inadequate for the demand, while Southern Xinjiang’s water resources mostly meet regional needs. Hence, greater attention should be paid to the benefits of water conservation measures. The region must capitalize on this opportune period to initiate economic transformation, modify its water use structure, balance economic and ecological factors, and guide oasis landscape transformation with a focus on foresight, resilience, and sustainability.
5. Conclusions
(1) Analysis from 2000 to 2020 reveals significant developmental disparities between Xinjiang’s artificial and natural oases. Artificial oases saw substantial economic growth, with GDP surging by 463.24 billion yuan (2000-2010) and 785.25 billion yuan (2010-2020), alongside notable expansions in area and GEP. Conversely, natural oases encountered economic and ecological setbacks, experiencing a 6.15% decline in GDP and 9.55% in GEP, despite a marginal 2.60% increase in value density from 2010 to 2020.
(2) A detailed assessment of the ecological value across six land-use types further uncovers nuances and disparities between GDP and GEP, underscoring the complexity of sustainable development in the region. This includes a particularly marked increase in the contribution of built-up land to GDP relative to agricultural land, and relatively stable changes in GEP across various land-use types. These findings highlight the urgent need for targeted interventions and policies to promote balanced growth and ecological management across various oasis types and land use categories.
(3) The conversion of ecological spaces into construction land and arable land resulted in ecological value loss, while simultaneously generating significant economic value. Over 20 years, the transfer from NO to AO decreased ecological value by 13.35 billion yuan and increased economic value by 122.37 billion yuan. The expansion of AO compensated for the decline in NO’s GEP, leading to an overall increase in GEP. This reflects a delicate equilibrium between economic growth and ecological protection. Data indicates that various land types contribute distinctly to this shift. Forests and grasslands, in particular, demonstrate the most substantial economic growth per unit of ecological value reduction. Between 2010 and 2020, this trend shifted, with the rate of economic growth per unit of ecological value reduction decreasing in 2010 but increasing significantly by 2020.
(4) Optimizing the oasis structure through the MOP model reveals that development trends vary across regions. In Aksu and Altay, the ratio of artificial to natural oasis must decrease, which will also lead to a decline in economic benefits.In regions like Bortala and Changji, the ratio of artificial to natural oasis and economic benefits are expected to increase, suggesting that expanding artificial oases for economic growth may come at the cost of a portion of the natural ecosystem.
Author Contributions
Ziyu Long: Writing- review & editing, Project administration, Supervision, Methodology, Funding acquisition, Conceptualization. Xudong Wang: Writing-original draft, Visualization, Validation, Methodology, Formal analysis, Data curation, Conceptualization.
Data Availability Statement
Data will be made available upon request. If there is a need for data from this study you can contact the author,
Acknowledgments
This research was supported by the National Natural Science Foundation of China.
Conflicts of Interest
The authors declare that they have no known competing financial interests or personal relationships that could have appeared to influence the work reported in this paper.
References
- Zhang, G. & Rong, X. A concise history of the turfan oasis and its exploration. Asia Major 1998, 11, 13–36. [Google Scholar]
- Baoquan, J. Approach to some theoretical problems on oasis landscape. Arid Land Geography 1996, 58–65. [Google Scholar] [CrossRef]
- Chen, Y. , Yang, G., Zhou, L., Liao, J. & Wei, X. Quantitative analysis of natural and human factors of oasis change in the tail of Shiyang River over the past 60 years. Acta Geol. Sin 2020, 94, 637–645. [Google Scholar]
- Zhou, D. , Wang, X. & Shi, M. Human driving forces of oasis expansion in Northwestern China during the last decade—A case study of the Heihe River Basin. Land Degrad. Dev, 2016. [Google Scholar]
- Qi, S. , Li, X. & Duan, H. Oasis land-use change and its environmental impact in Jinta Oasis, arid northwestern China. Environ Monit Assess, 2007. [Google Scholar]
- Chun-xian, H. A. N. , Yao-feng, M. A. & Hei-gang, X. Measuring the economic sustainable development of man-made oasis in arid area. Arid Land Geography.
- Commoner, B. The environmental cost of economic growth. Chemistry in Britain 1972, 8, 52–56. [Google Scholar]
- Dinda, S. Environmental Kuznets Curve hypothesis: A survey. Ecological Economics 2004, 49, 431–455. [Google Scholar] [CrossRef]
- Lv, X.; et al. Agricultural Characteristics and Its Sustainable Development Strategies of Desert Oasis Region. Journal of Desert Research 2005, 25, 599–603. [Google Scholar]
- Lv, X. , Zhang, W. & Zhang, F. The Characteristics and Sustainable Development Tactic of Midland Oasis Agriculture in Northwest Arid Regions. The Characteristics and Sustainable Development Tactic of Midland Oasis Agriculture in Northwest Arid Regions. Xinjiang agricultural sciences 2005, 42, 1–4. [Google Scholar]
- Chen, Y. D. & Xu, F. F. The optimization of ecological service function and planning control of territorial space planning for ecological protection and restoration. Sustainable Computing-Informatics & Systems. [CrossRef]
- Chunxian, H. A. N. & Heigang, X. Research on Relationship Between Qitai Artificial Oasis and Environment and Its Sustainable Development in Xinajing. Research on Relationship Between Qitai Artificial Oasis and Environment and Its Sustainable Development in Xinajing. Journal of Arid Land Resources and Environment 2007, 21, 48–53. [Google Scholar]
- Yuan, L. & Yang, G. Study on the assessment of sustainable development of the oasis in Xinjiang Province. Journal of northwest sci-tech university of agriculture and forestry.
- Xu, M. , Luo, J. & Cui, C. Oasis agriculture sustainable development in Xinjiang. Oasis agriculture sustainable development in Xinjiang. Journal of Arid Land Resources and Environment 2011, 25, 20–23. [Google Scholar]
- Hu, Y.; et al. Balancing urban expansion with a focus on ecological security: A case study of Zhaotong City, China. Ecological Indicators. [CrossRef]
- Zhou, J. , Xue, J., Wu, L., Wang, X. & Xia, R. Impacts of change of landuse on ecosystem service values in Dalinuoer Lake Basin. Environmental Pollution & Control.
- Wang, J.; et al. Corrigendum to “Gross economic-ecological product as an integrated measure for ecological service and economic products” [Resources, Conservation and Recycling 171 (2021) 105566]. Resources, Conservation and Recycling. [CrossRef]
- Zhou, X.; et al. A Spatiotemporal Analysis of Hainan Island’s 2010-2020 Gross Ecosystem Product Accounting. Sustainability. [CrossRef]
- Ouyang, Z.; et al. Gross ecosystem product:concept, accounting framework and case study. Acta Ecologica Sinica 2013, 33, 6747–6761. [Google Scholar] [CrossRef]
- Chen, Z.-Z.; et al. Gross ecosystem product accounting of national park: Taking Hainan Tropical Rainforest National Park as an example. Ying yong sheng tai xue bao = The journal of applied ecology, 3883. [Google Scholar] [CrossRef]
- Han, Z. , Zhao, Y., Yan, X. & Zhong, J. Coupling Coordination Mechanism and Spatial-Temporal Relationship Between Gross Ecosystem Product and Regional Economy:A Case Study of Dalian. Economic Geography.
- Fei, S. U. & Pingyu, Z. Assessment of Coordinative Development between Economy and Environment Based on Ecosystem Service Values Change: A Case of Daqing City. Progress in Geography.
- Zhang, J.; et al. Analysis of Spatio-Temporal Pattern Changes and Driving Forces of Xinjiang Plain Oases Based on Geodetector. Land. [CrossRef]
- Hadidi, A. , Remini, B., Habi, M., Saba, D. & Benmedjaed, M. in International Conference on Technologies and Materials for Renewable Energy, Environment and Sustainability (TMREES). (2016).
- Dong-xia, Y. U. E. , Jin-hui, M. A., Jie, G., You-cai, X. & Ya-jie, S. Quantitative estimation and spatial pattern analysis of ecological carrying capacity in northwestern China based on GIS. Quantitative estimation and spatial pattern analysis of ecological carrying capacity in northwestern China based on GIS. Journal of Lanzhou University. Natural Science 2009, 45, 68–75. [Google Scholar]
- Ge, R. , Cheng, H., Zou, X., Wnag, S. & Zhang, C. A STUDY ON LAND CARRYING CAPACITY IN EJINA OASIS. A STUDY ON LAND CARRYING CAPACITY IN EJINA OASIS. Journal of Beijing Normal University. Natural Science 2006, 42, 624–628. [Google Scholar]
- Hu, B. , Zhang, P., Bai, N. & Zhao, L. LAND USE SCENARIO SIMULATION IN QINGLONG MANCHU AUTONOMOUS COUNTY BASED ON CLUE S AND GMOP MODEL. LAND USE SCENARIO SIMULATION IN QINGLONG MANCHU AUTONOMOUS COUNTY BASED ON CLUE S AND GMOP MODEL. Journal of China Agricultural Resources and Regional Planning 2020, 41, 173–182. [Google Scholar]
- Lin, Y. , Zhao, J., Chen, G. & Zhang, M. Optimization of Regional Territory Space Pattern Based on MCR-FLUS-Markov Model. Transactions of the Chinese Society for Agricultural Machinery.
- Zhang, X. , Li, A., Nan, X., Lei, G. & Wang, C. Multi-scenario Simulation of Land Use Change Along China-Pakistan Economic Corridor through Coupling FLUS Model with SD Model. Journal of Geo-Information Science, 2409. [Google Scholar]
- Ren, Y.; et al. Multi-scenario simulation of land use change and its impact on ecosystem services in Beijing-Tianjin-Hebei region based on the FLUS-InVEST Model. Acta Ecologica Sinica 2023, 43, 4473–4487. [Google Scholar]
- Lan, Z. , Jia, L. & Cheng, Y. The ecosystem services evaluation and trade-off synergy in Min River Basin. Acta Ecologica Sinica, 3920. [Google Scholar]
- Wang, X. , Che, L., Zhou, L. & Xu, J. Spatio-temporal Dynamic Simulation of Land use and Ecological Risk in the Yangtze River Delta Urban Agglomeration, China. Chinese Geographical Science 2021, 31, 829–847. [Google Scholar] [CrossRef]
- Chen, H. , Shi, Y., Ke, X., Hao, J. & Chen, A. Spatial optimization of land use based on the objective of coordinated ecological protection and economic development in Zhengzhou City. Spatial optimization of land use based on the objective of coordinated ecological protection and economic development in Zhengzhou City. Resources Science 2019, 41, 717–728. [Google Scholar]
- Zhaopeng, W. U. Review on studies of oasis stability in China. Journal of Arid Land Resources and Environment 2008, 22, 42–48. [Google Scholar]
- Gao, M. The connotation,accounting framework,and implementation conditions of the Gross Ecosystem Product-design and argumentation from the perspective of statistics. Acta Ecologica Sinica 2020, 40, 402–415. [Google Scholar]
- Si, J. , Han, P. & Zhao, C. Review of Water Conservation Value Evaluation Methods of Forest and Case Study. Review of Water Conservation Value Evaluation Methods of Forest and Case Study. Journal of Natural Resources 2011, 26, 2100–2109. [Google Scholar]
- Rao, E. , Xiao, Y. & Ouyang, Z. Assessment of Flood Regulation Service of Lakes and Reservoirs in China. Assessment of Flood Regulation Service of Lakes and Reservoirs in China. Journal of Natural Resources 2014, 29, 1356–1365. [Google Scholar]
- Wang, K. , Wei, B. & Chang, L. Study on the Accounting of Gross Ecosystem Product(GEP)of Forest Ecosystem in Fuzhou City. Journal of Shenyang Agricultural University.
- Peng, J. , Zhou, Y., An, W. & Shi, Q. Assessment on Functional Value of Ecosystem Service in Oasis and Desert Criss-cross Zone in Qitai Region. Xinjiang Agricultural Sciences, 1670. [Google Scholar]
- Wang, M. , Ruan, J., Yao, J., Sha, C. & Wang, Q. Study on Soil Conservation Service of Ecosystem Based on InVEST Model -A Case Study of Ningde City,Fujian Province. Research of Soil and Water Conservation.
- Wang, L.; et al. Gross ecosystem product accounting in the national key ecological function area: an example of Arxan. China Population Resources and Environment 2017, 27, 146–154. [Google Scholar]
- Jiang, L. , Xiao, Y., Rao, E., Wang, L. & Ouyang, Z. Effects of land use and cover change (LUCC) on ecosystem sand fixing service in Inner Mongolia. Acta Ecologica Sinica, 3747. [Google Scholar]
- Zhang, Y. & Chen, Y. Primary Exploration on Allocation and Transfer of Land Development Rights. Primary Exploration on Allocation and Transfer of Land Development Rights. China Land Science 2005, 19, 10–14. [Google Scholar]
- Chen, Y. , Shi, P., Zhao, Z. & Li, B. The Ecological Benefit Evaluation of Land-Use Planning Based on Ecosystem Services Valuation ---A case of Minle County. Journal of Soil Science.
- Zhao, M. , Cheng, Y. & Pan, H. CONCEPT AND IMPLEMENTATION STRATEGIES OF THE URBAN DEVELOPMENT BOUNDARY: RE-EXPLORATION IN THE SPATIAL PLANNING SYSTEM OF CHINA. City Planning Review.
- Cao, Z. , Wang, X., Li, W., Ye, Z. & Guo, B. Suitable scale for oasis in lower reaches of Tarim River. Suitable scale for oasis in lower reaches of Tarim River. Arid Land Geography 2012, 35, 806–814. [Google Scholar]
- Wei, G. , Zhang, L., Jiang, Z. & Xue, L. Appropriate scale and stability of oasis in Aksu river basin. Appropriate scale and stability of oasis in Aksu river basin. Journal of Arid Land Resources and Environment 2018, 32, 87–92. [Google Scholar]
- Chen, Y. , Zhang, L., He, L. & Men, M. Multi-scenario simulation of land use structure based on dual combined models. Acta Ecologica Sinica 2016, 36, 5391–5400. [Google Scholar]
- Wang, C.; et al. Analysis of relative carrying capacity of resources in Tarim River Basin in Xinjiang. Acta Ecologica Sinica 2015, 35, 2880–2893. [Google Scholar]
- Jiang, Y.; et al. Quantification of the coupling relationship between ecological compensation and ecosystem services in the Yangtze River Economic Belt, China. Land Use Policy. [CrossRef]
Figure 1.
Xinjiang Location Map,China.
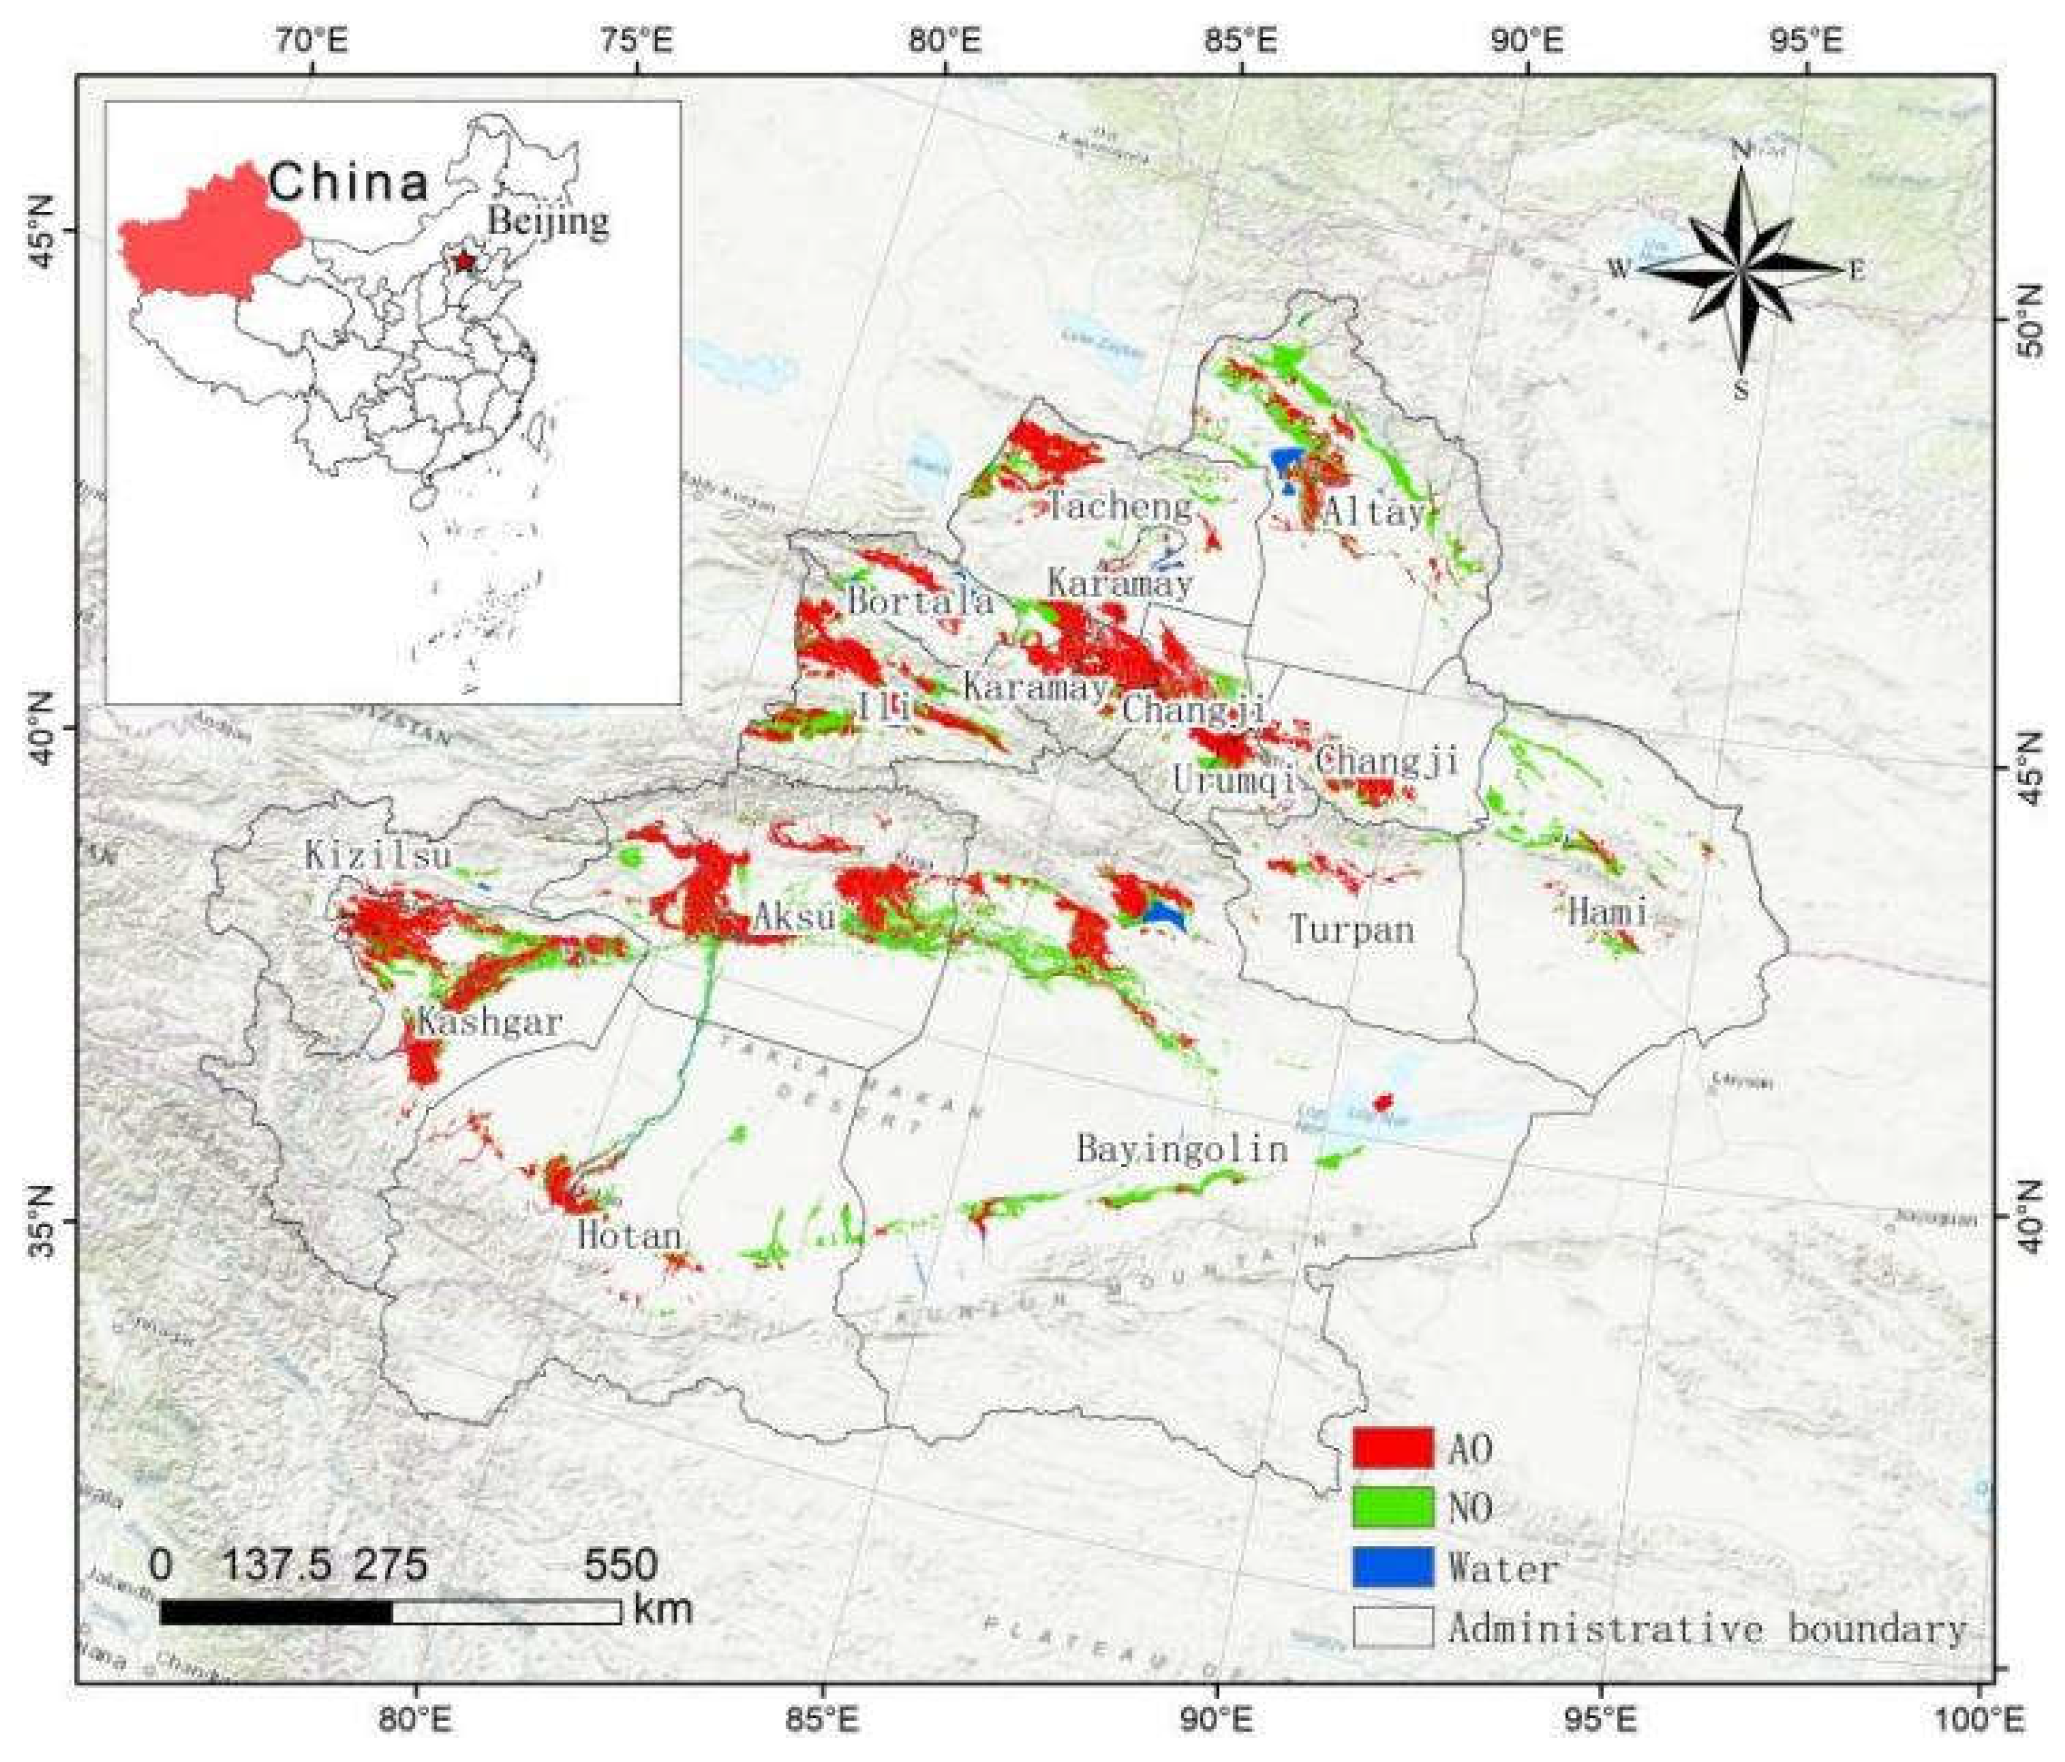
Figure 2.
The framework of this study.
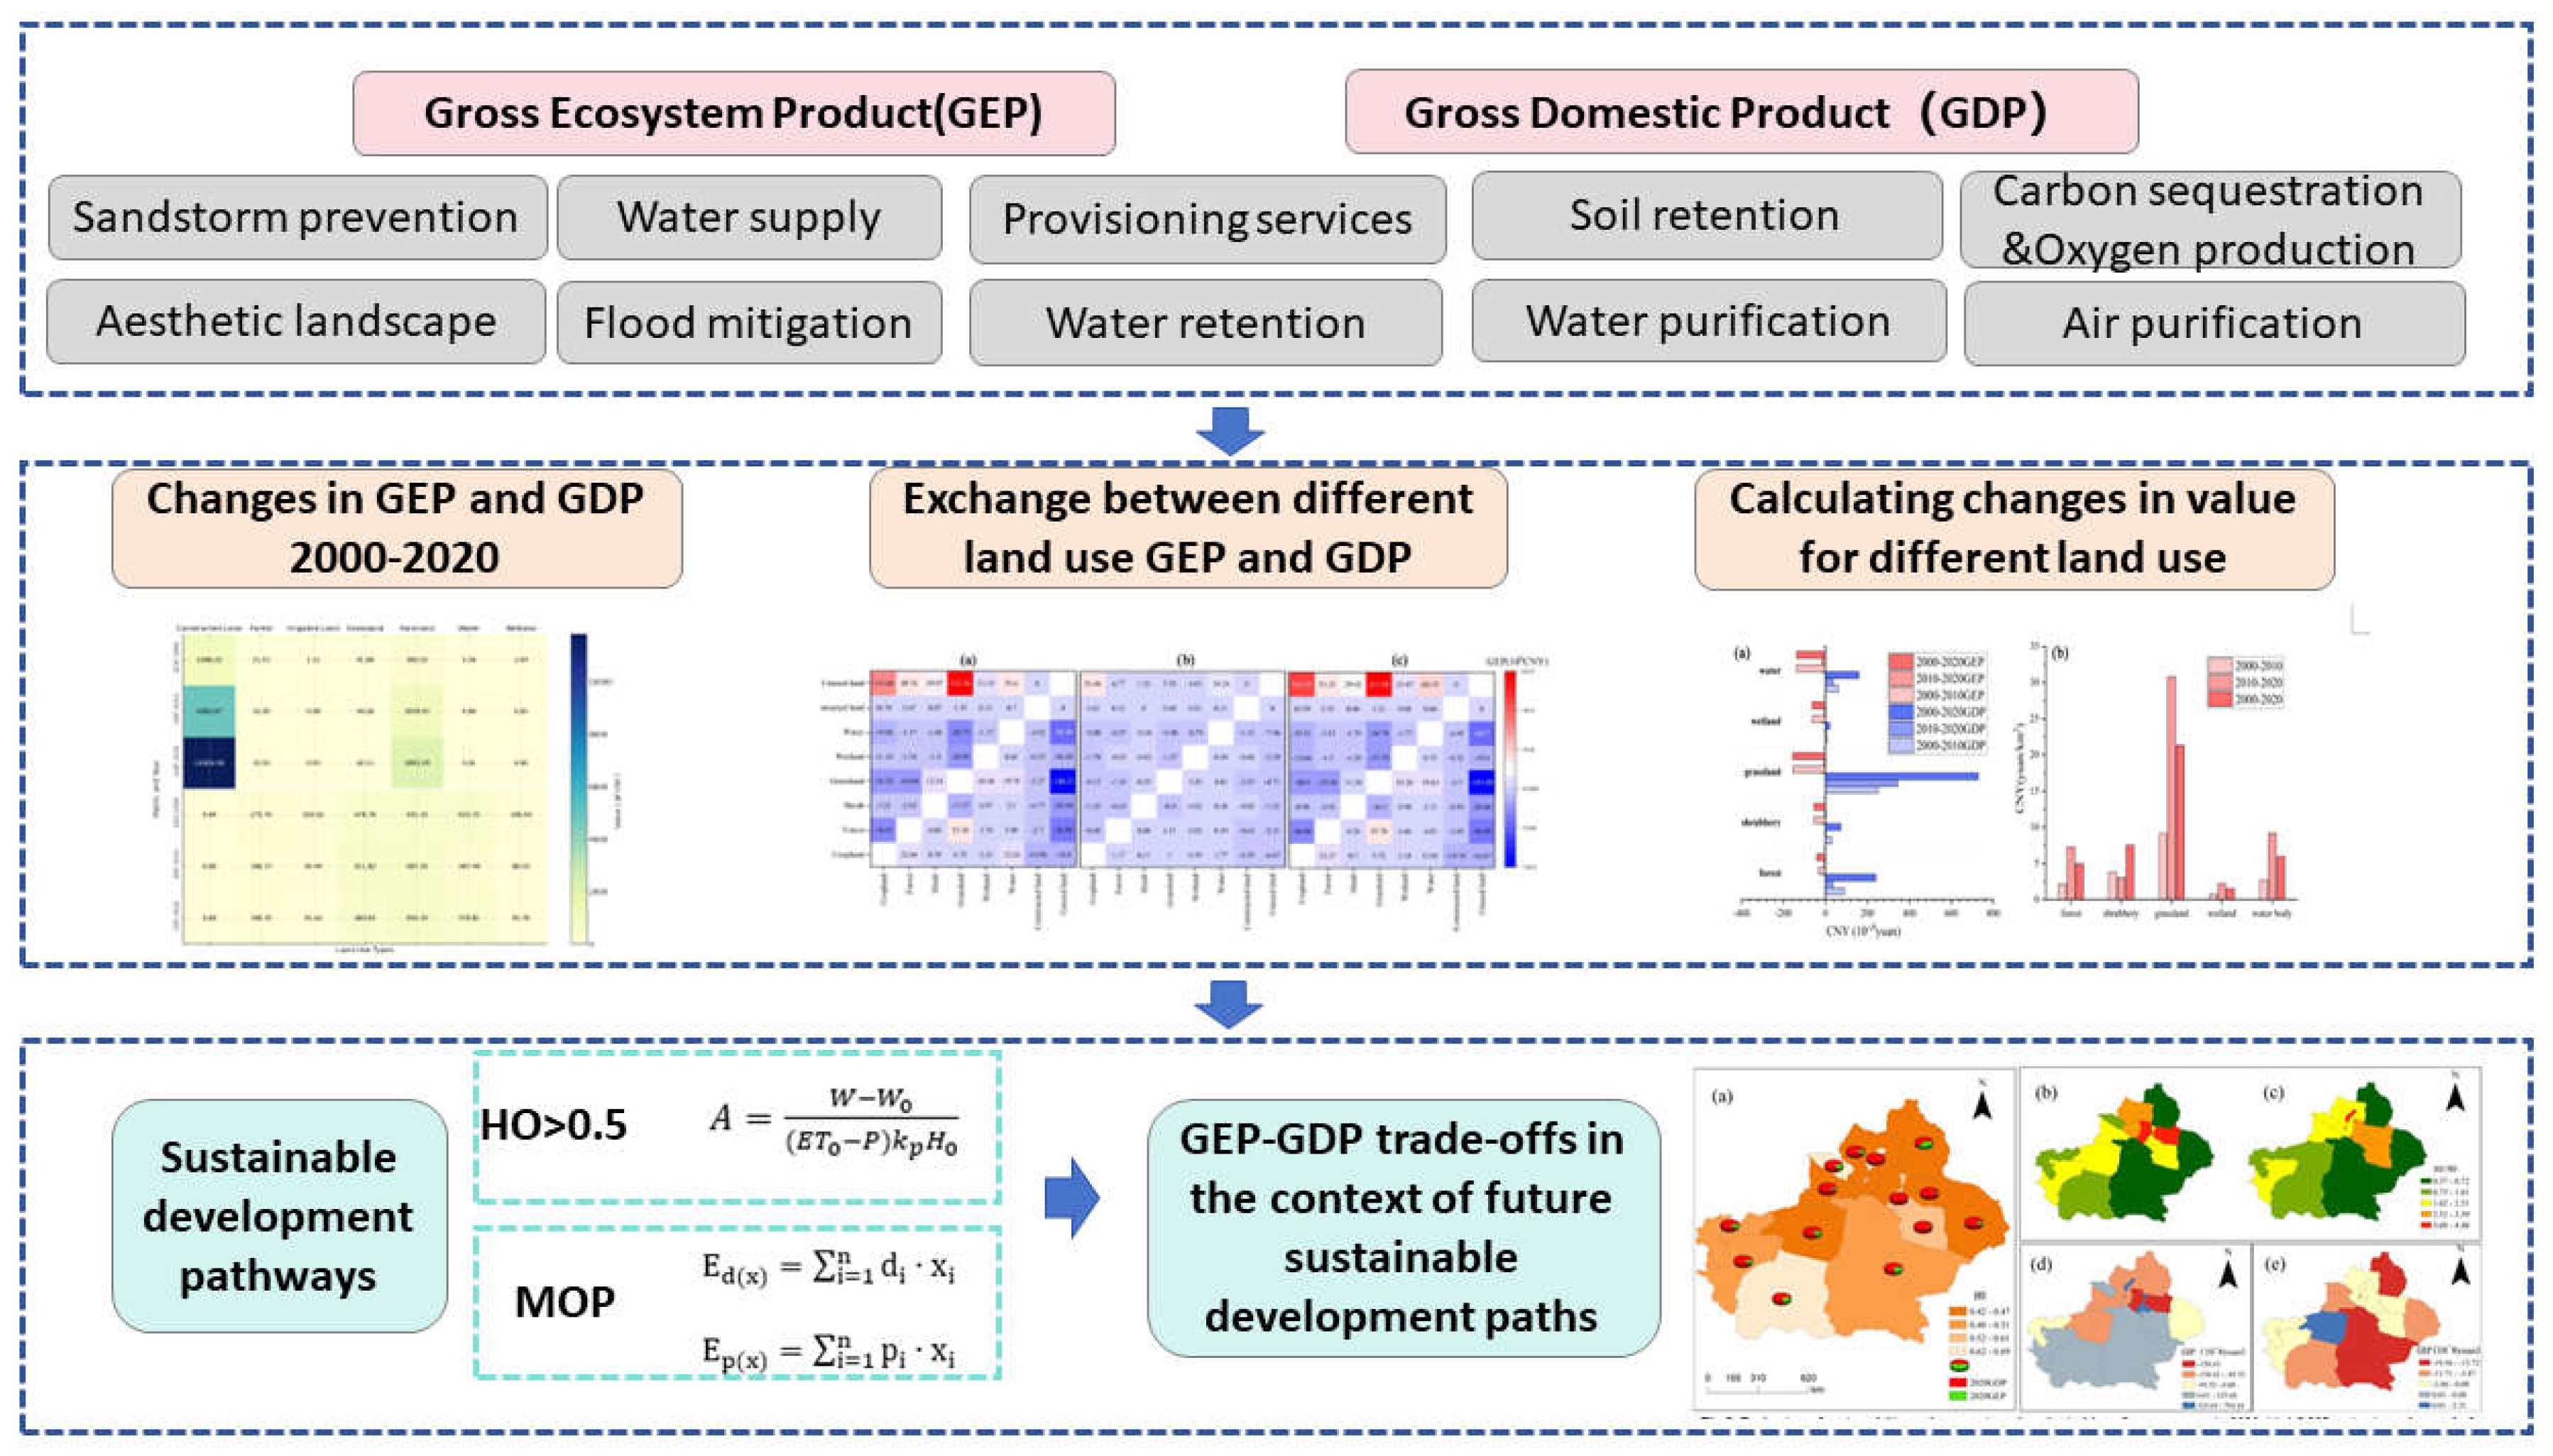
Figure 3.
Economic and social values of different land use types in Xinjiang, 2000-2020.
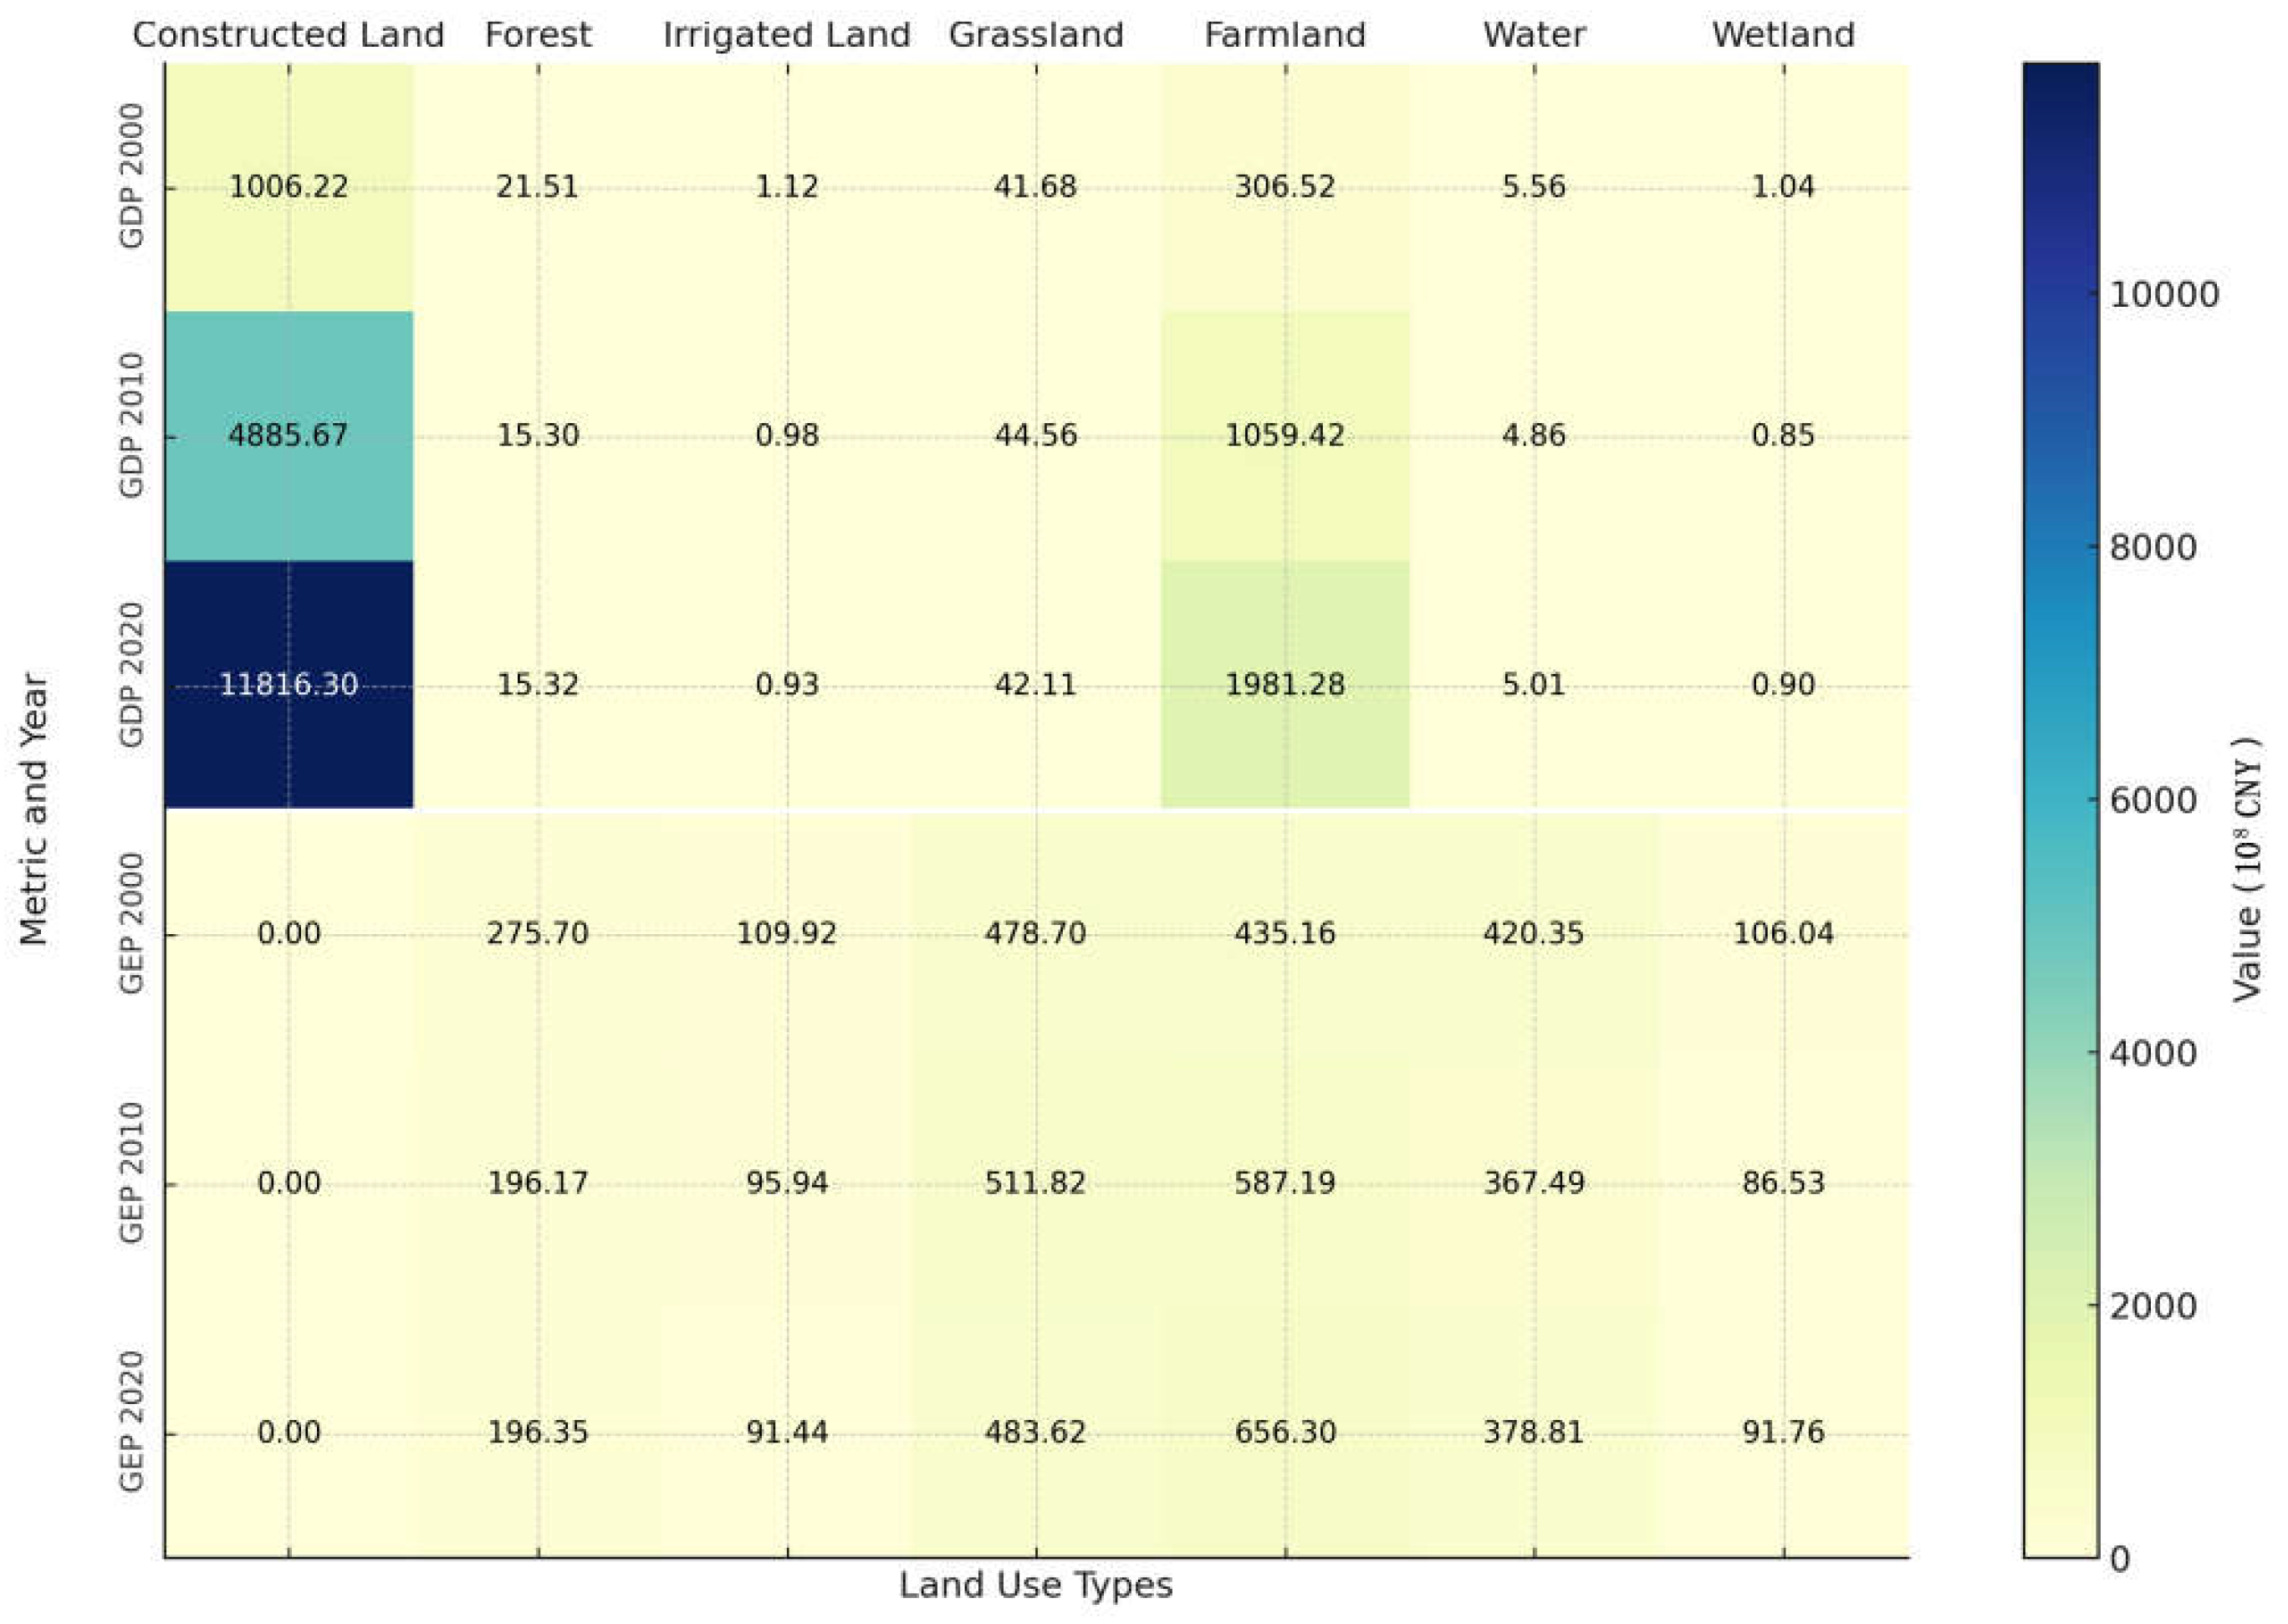
Figure 4.
Ecological value flow of oases,2000-2020 (a),2010-2020(b),2000-2020(c).
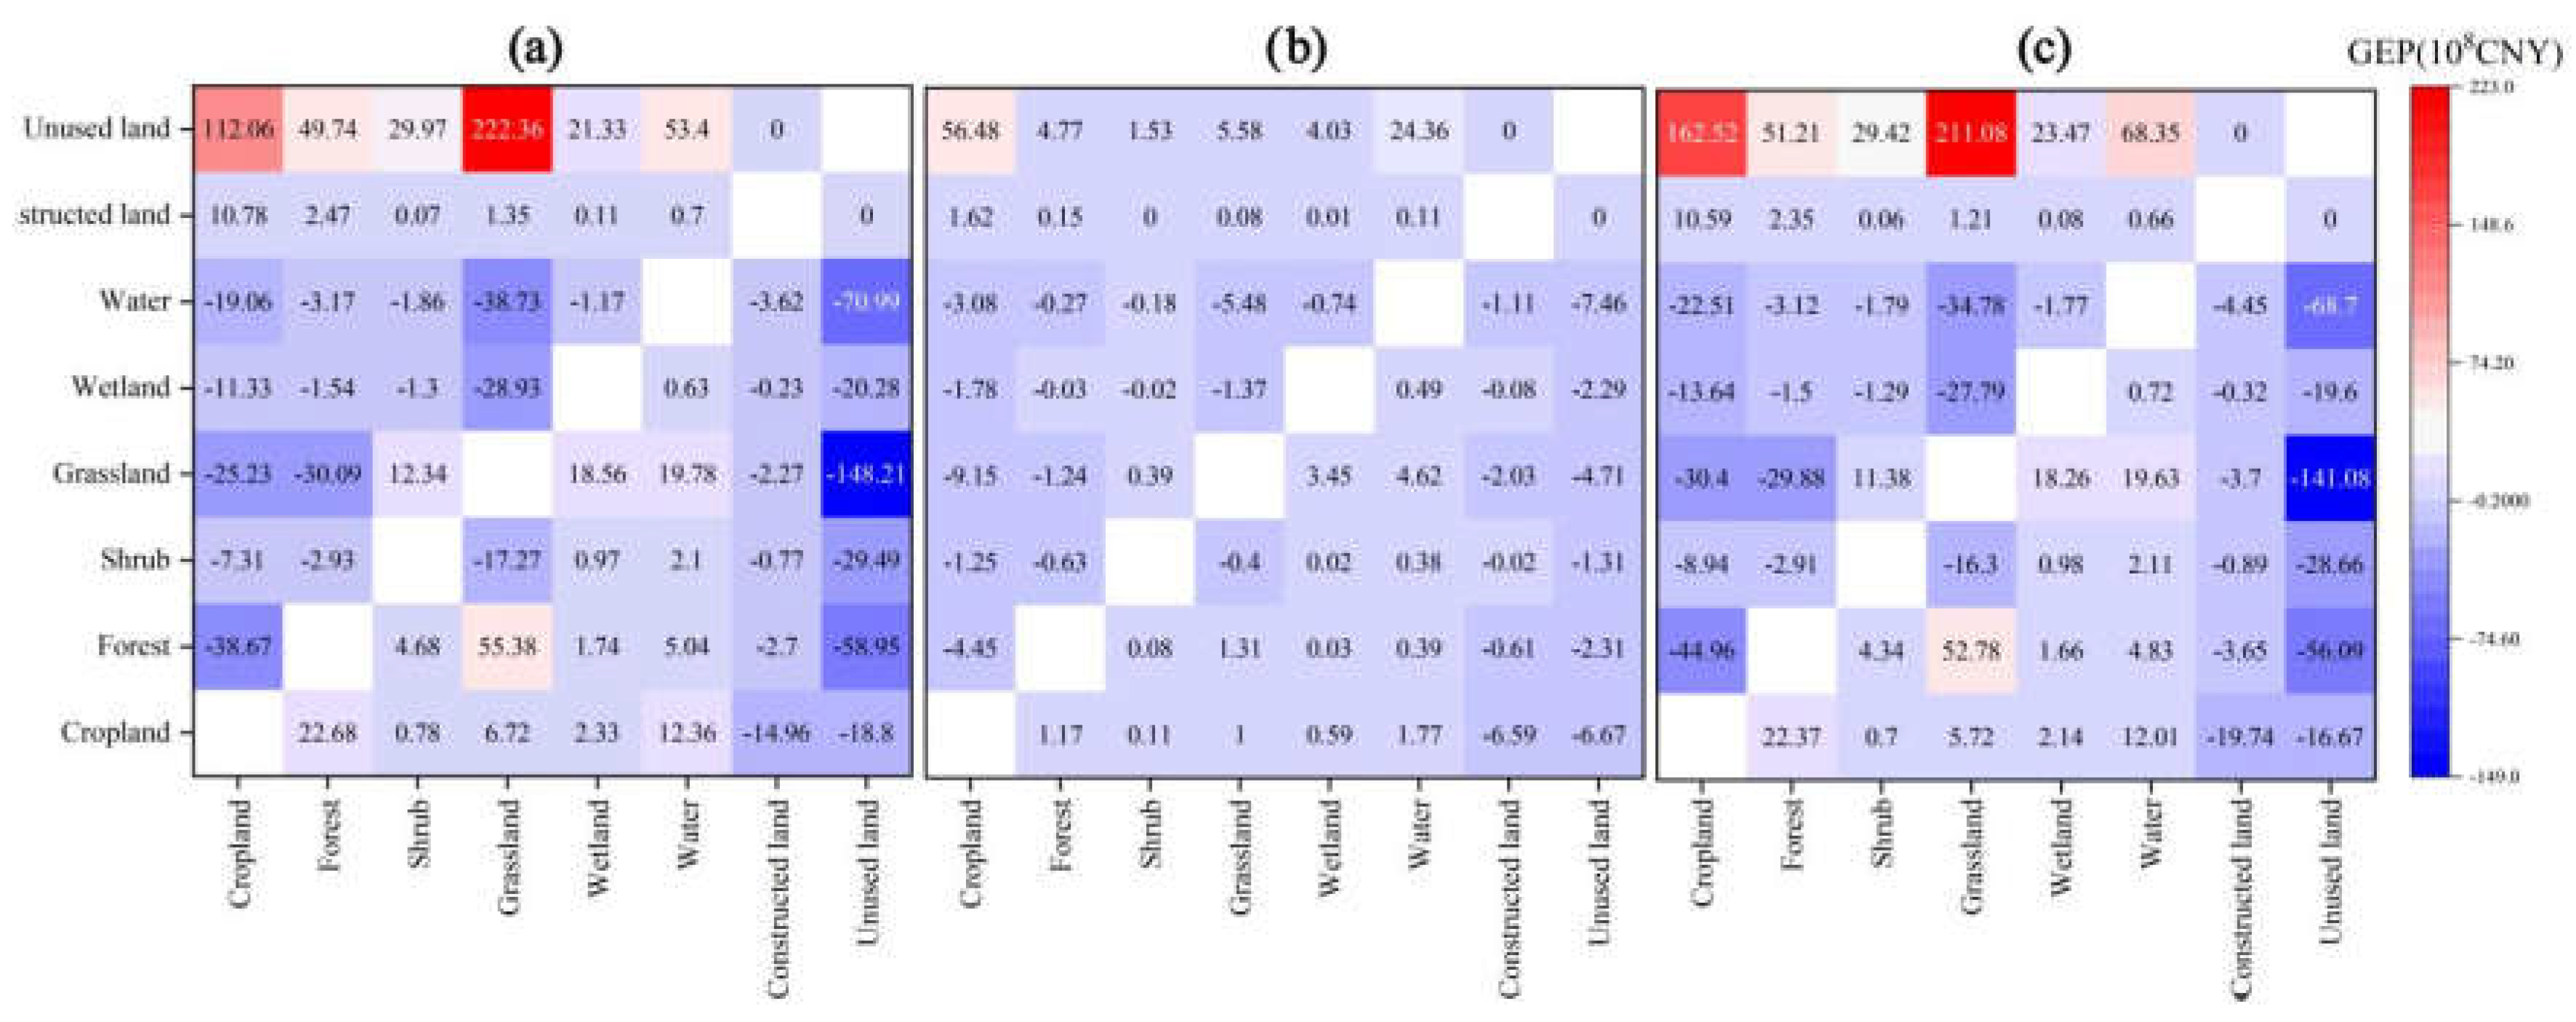
Figure 5.
GEP and GDP changes of different land types from 2000 to 2020(a), and the increase in GDP per unit of land change(b).
Figure 5.
GEP and GDP changes of different land types from 2000 to 2020(a), and the increase in GDP per unit of land change(b).

Figure 6.
Evaluation of oasis stability and economic and ecological benefit components in 2020 (a),AO/NO ratios in each state before and after planning, pre-planning (b), post-planning (c), amount of change in GDP before and after planning (d), amount of change in GEP (e).
Figure 6.
Evaluation of oasis stability and economic and ecological benefit components in 2020 (a),AO/NO ratios in each state before and after planning, pre-planning (b), post-planning (c), amount of change in GDP before and after planning (d), amount of change in GEP (e).
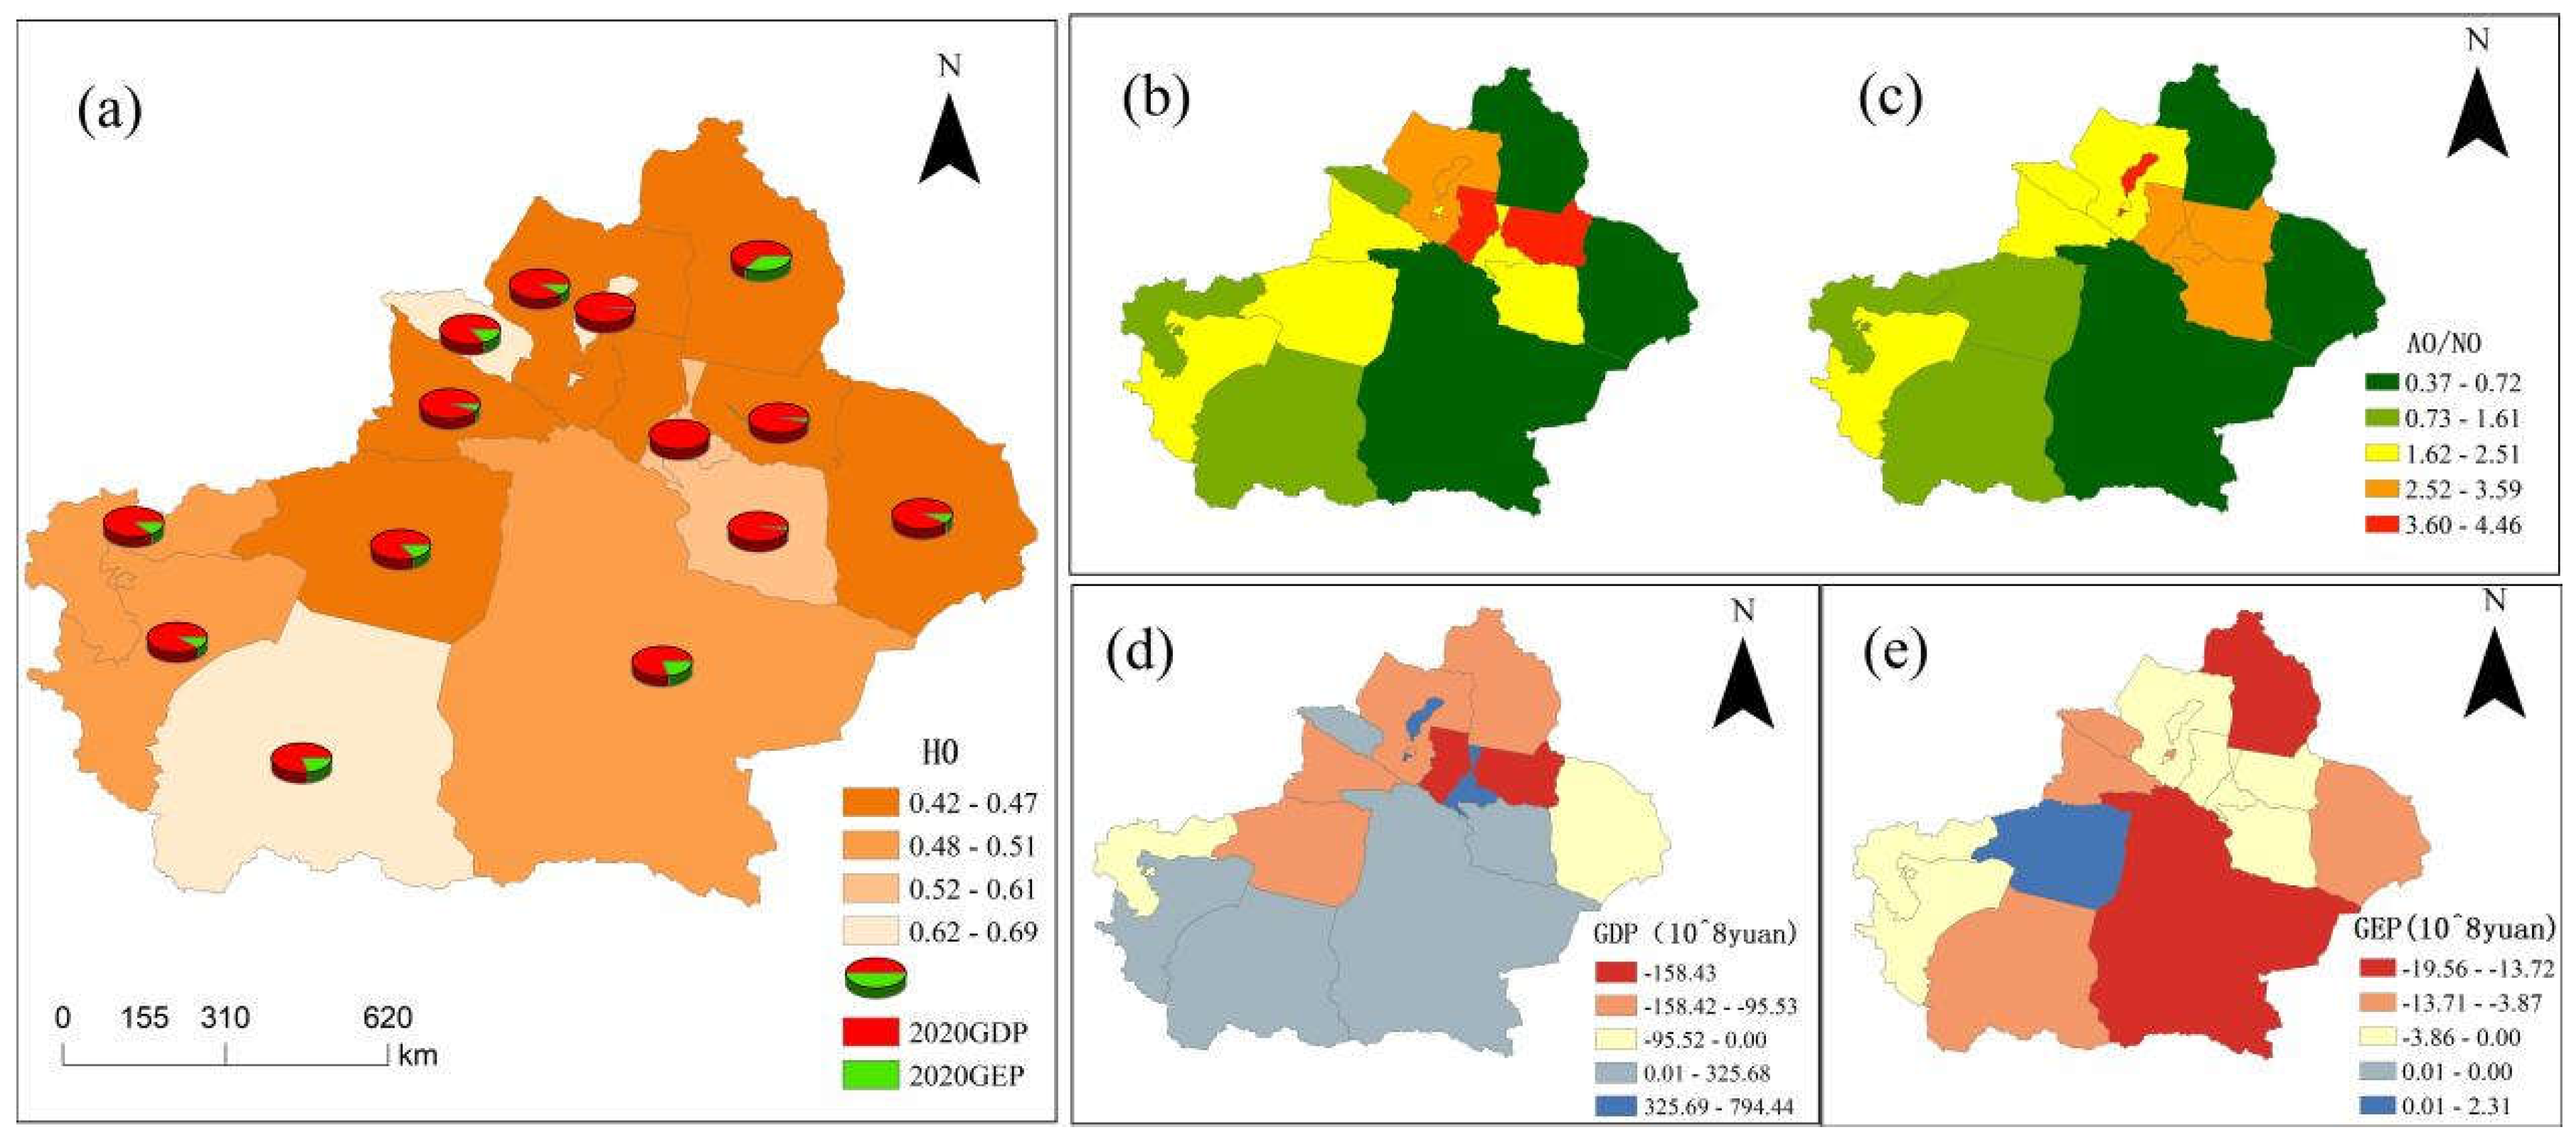
Figure 7.
Changes in the relationship between ecological and economic benefits and AO/NO ratios before and after planning.
Figure 7.
Changes in the relationship between ecological and economic benefits and AO/NO ratios before and after planning.


Table 1.
Xinjiang GEP Accounting Indicator System.
| Service types | Items | Methodology | Accounting metrics |
|---|---|---|---|
| Ecosystem production | Provisioning services | Market value approach | Value of agricultural, forestry, animal husbandry, and fishery products |
| Water supply | Market value approach | Value of water for agriculture, industry, domestic use and ecology | |
| Ecological regulation services | Water retention | Shadow engineering approach | Value of water storage effects in ecosystems |
| Flood mitigation | Shadow engineering approach | Value of lakes, reservoirs, etc. for flood storage | |
| Carbon sequestration &Oxygen production | Alternative costing | Value of fixing carbon dioxide and releasing oxygen | |
| Soil retention | Alternative costing | The Value of Reducing Sedimentation and Reducing Face Source Pollution | |
| Water purification | Alternative costing | Value of ecosystems for purifying COD, total nitrogen, and total phosphorus | |
| Air purification | Alternative costing | Value of reducing concentrations of air pollutants and improving air quality | |
| Sandstorm prevention | Recovery cost method | The value of reducing soil erosion and wind-sand hazards | |
| Ecological cultural services | Aesthetic landscape | Equivalent factor method | The value of landscape aesthetics |
Table 2.
Evaluation grading of oasis stability.
| Evaluation grade | H0 | Environmental change trend | Scale assessment |
|---|---|---|---|
| Ultra-stable | >0.75 | High spatial heterogeneity | arger development potential |
| Stable | 0.50≤H0<0.75 | Remain stable | Can be further developed |
| Sub-stable | 0.20≤H0<0.50 | Beginning to degrade at the initial stage | No potential for development |
| Destabilized | <0.20 | Degradation in progress | Exploitation and utilization should be reduced immediately |
Table 3.
Evaluation grading of oasis stability.
| Year | Type | GDP (108yuan) | GEP (108yuan) | Area (km2) | Density (104yuan/km2) |
|---|---|---|---|---|---|
| 2000 | AO | 1312.74 | 435.16 | 65383.32 | 267.33 |
| NO | 70.91 | 1390.71 | 78567.46 | 186.03 | |
| 2010 | AO | 5945.09 | 587.19 | 90072.74 | 725.22 |
| NO | 66.55 | 1257.94 | 75755.81 | 174.84 | |
| 2020 | AO | 13797.58 | 656.30 | 100387.01 | 1439.82 |
| NO | 64.27 | 1241.98 | 72819.97 | 179.38 |
Table 4.
Limitation conditions of objective function of MOP model.
| Constraint Name | Constraint Factor | Constraint Expression | Explanation |
|---|---|---|---|
| Land sustainable utilization constraint | Land area | When HO>0.5, it is sustainable utilization state. | |
| Planning target constraint | Cropland | X1≥2020 cropland area | Binding indicators |
| Forest | X2≥2020 forest area | Binding indicators | |
| Grassland | X3≥90%·2020 grassland area | Binding indicators | |
| Wetland | X4≥90%·2020 grassland area | Binding indicators | |
| Water | X5≥2020 grassland area | Binding indicators | |
| Shrubs | X6≥90%·2020 grassland area | Binding indicators | |
| Construction land | X7≥2020 grassland area | Binding indicators |
Disclaimer/Publisher’s Note: The statements, opinions and data contained in all publications are solely those of the individual author(s) and contributor(s) and not of MDPI and/or the editor(s). MDPI and/or the editor(s) disclaim responsibility for any injury to people or property resulting from any ideas, methods, instructions or products referred to in the content. |
© 2025 by the authors. Licensee MDPI, Basel, Switzerland. This article is an open access article distributed under the terms and conditions of the Creative Commons Attribution (CC BY) license (http://creativecommons.org/licenses/by/4.0/).
Copyright: This open access article is published under a Creative Commons CC BY 4.0 license, which permit the free download, distribution, and reuse, provided that the author and preprint are cited in any reuse.


