
Submitted:
19 February 2025
Posted:
20 February 2025
You are already at the latest version
Abstract
Background and Objectives: Glaucoma (GL) classification is crucial for early diagnosis and treatment, yet relying solely on stand-alone models or International Classification of Diseases (ICD) codes is insufficient due to limited predictive power and inconsistencies in clinical labeling. This study aims to improve GL classification by stacking weights using machine learning-based models. Materials and Methods: We analyzed a subset of 33,636 participants (58% female) with 340,444 visual fields (VFs) from the Mass Eye and Ear (MEE) dataset. Five clinically relevant GL detection models (LoGTS, UKGTS, Kang, HAP2_part1, and Foster) were selected to serve as base models. Two Multi-Layer Perceptron (MLP) models were trained using 52 total deviation (TD) and pattern deviation (PD) values from Humphrey Field Analyzer (HFA) 24-2 VF tests, along with four clinical variables (age, gender, follow-up time, and race) to extract model weights. These weights were then utilized to train three meta-learners including Logistic Regression (LR), Extreme Gradient Boosting (XGB), and MLP to classify cases as GL or non-GL. Results: The MLP meta-learner achieved the highest performance, with an accuracy of 96.43%, an F-score of 96.01%, and an AUC of 97.96%, while also demonstrating the lowest prediction uncertainty (0.08 ± 0.13). XGB followed with 92.86% accuracy, a 92.31% F-score, and a 96.10% AUC. LR had the lowest performance, with 89.29% accuracy, an 86.96% F-score, and a 94.81% AUC, as well as the highest uncertainty (0.58 ± 0.07). Permutation importance analysis revealed that the superior temporal sector was the most influential VF feature, with importance scores of 0.08 in Kang’s and 0.04 in HAP2_ part1 models. Among clinical variables, age was the strongest contributor (score= 0.3). Conclusion: The meta-learning approach outperformed stand-alone models in GL classification, offering a valuable tool for automated glaucoma assessment.
Keywords:
Glaucoma
; Classification
; Humphrey Field Analyzer
; Machine Learning
; MLP
1. Introduction
Glaucoma (GL) is a major cause of irreversible blindness worldwide [1]. The disease is characterized by progressive retinal ganglion cell (RGC) loss, leading to permanent visual field (VF) damage [2,3]. Standard automated perimetry (SAP) is widely regarded as the gold standard for tracking visual function in GL patients [4]. However, SAP has inherent limitations, including subjectivity, test-retest variability, and confounding effects from age-related visual changes, all of which can reduce its effectiveness in detecting GL and accurately assessing functional impairment [3,5,6,7]. Establishing a robust framework for visualizing, statistically analyzing, and clinically interpreting VF loss is essential for effective GL management. Additionally, there is critical research need for precise methodologies to identify and quantify vision loss caused by GL. Current methods of relying on International Classification of Diseases (ICD) diagnosis codes and manual review of VF records are inconsistent and labor intensive [8,9].
Machine learning (ML) has emerged as a powerful tool in ophthalmology, improving disease classification, progression prediction, and treatment planning [10,11,12,13,14]. In VF analysis, ML models can detect glaucomatous patterns more effectively than conventional statistical approaches. Artes et al. (2005) employed a point-wise linear regression model to evaluate VF progression by comparing total and pattern deviation (PD) analyses in a prospective longitudinal study involving GL patients and healthy controls [15]. Their findings indicated that PD might underestimate VF progression in GL, especially in the absence of clinical signs of worsening media opacity. Later on, Sabharwal et al. (2023) demonstrated that deep learning models can reliably predict VF progression (AUC = 0.94) incorporating both trend and event-based methods [16].
Five clinical criteria [17] have been widely used in GL research and clinical practice to define VF defects, including LoGTS [18] (Low-Pressure Glaucoma Treatment Study) by Krupin et al. (2005), UKGTS [19,20] (United Kingdom Glaucoma Treatment Study) by Garway-Heath et al. (2013 and 2015), Kang’s method [21] by Kang et al. (2015), HAP2 [22,23] (Humphrey Automated Perimetry Part 2) by Perkins and Chang et al. (1994 and 2016), and Foster [24] criterion by Foster et al. (2002). Despite their clinical value, these criteria vary in predictive performance across different datasets. A key challenge in GL classification is integrating these multiple diagnostic standards into a unified, reliable model.
Previous research has led to the development of VF analysis tools in R and Python. Marín-Franch et al. (2013) created an R-based visual fields package for analyzing and visualizing VFs, but its effectiveness varied across datasets, making standardization challenging [25]. Later, Elze et al. (2015) introduced the “vfprogression” package in R, designed specifically for VF progression analysis [26], yet it lacked comprehensive diagnostic capabilities. While these tools are valuable for tracking changes over time, there is still no toolbox that provides an ML-based framework for GL classification within a unified approach.
To address these gaps, we propose a stacked weight meta-learning framework to improve GL classification based on VF data. In this approach, we first train Multi-Layer Perceptron (MLP) models using total deviation (TD) and PD values from Humphrey Field Analyzer (HFA) 24-2 VF tests to extract model weights. These extracted weights capture meaningful features from VF data, incorporating multiple clinical criteria. We then use these weights as inputs for three meta-learners namely Logistic Regression (LR), Extreme Gradient Boosting (XGB) [27], and MLP to classify VFs as GL or non-GL. Our primary contribution in this study is the development of a novel stacked weight meta-learning approach, which integrates the predictive strengths of multiple ML-based models to improve GL classification. Unlike traditional single-model approaches, our framework leverages stacked model weights to enhance predictive accuracy and robustness. By testing different meta-learning models, we assess their ability to capture VF data complexity and optimize GL detection performance. Additionally, our secondary goal is to provide an open-source toolbox, PyGlaucoMetrics, which enables all analyses within a user-friendly environment. By integrating multiple clinical criteria into a structured ML pipeline, our approach advances the field of automated GL detection, offering a more reliable, accessible, and scalable method for VF-based diagnosis.
2. Materials and Methods
2.1. Dataset and Clinical Labeling
Standard automated perimetry tests from study participants were obtained using the HFA II (Carl Zeiss Meditec, Inc., Dublin, CA, USA) at Mass Eye and Ear (MEE) of Mass General Brigham (MGB). The study received approval from the Institutional Review Board at MGB, and all procedures complied with the principles outlined in the Declaration of Helsinki for research involving human participants. Informed consent was obtained from all participants. Pointwise sensitivities were extracted from HFA 24-2 VF tests. TD and PD values were computed for all 52 test locations, excluding the two blind spots, using the PyVisualFields [28]. VF data with a false positive rate (FPR) exceeding 33% were excluded. Only patients with at least two VF tests conducted on different dates were considered, and a minimum follow-up period of six months was required for inclusion. These data were utilized for both training and validation purposes. The final dataset comprised 33,636 patients with 340,444 VF tests, and model performance was assessed through a clinical review. A random subset of 200 patients was selected for clinical review. Two fellowship-trained GL specialists independently examined the corresponding clinical records to confirm the diagnosis of GL. Only the patients for whom both reviewers agreed on the diagnosis (GL or Non-GL) were included, resulting in 160 VFs from 160 patients, reflecting an 80% agreement between the reviewers. This data was then used for the training and testing of three meta-learner models. The dataset was split into 82.5% for training (N=132) and 17.5% for testing (N=28).
2.2. Stand-Alone Model Development
We developed five independent models from scratch to classify glaucomatous VFs. These models are HAP2_part1 (HAP2_p1), Foster, UKGTS, Kang, and LoGTS. Supplementary Table S1 shows the full criteria used in each model to classify glaucomatous VFs. The input data for each model consists of either 52 TD or PD values. All scripts for these models are publicly available on the first author’s GitHub page. The models were implemented in Python v.3.8.19. In cases where TD or PD values were missing for some examinations, they were recovered using sensitivity data from the PyVisualFields library [28]. Other essential libraries, such as PyQt5 v.5.15.10 (for GUI development) and rpy2 v.3.4.5 (the wrapper library), were installed via pip. Data preprocessing and analysis were carried out with Pandas v. 1.2.4 and NumPy v. 1.24.4, while visualization was performed using Matplotlib v. 3.7.3 and Seaborn v. 0.13.0.
2.3. Data Preprocessing and Training Protocol
Missing values were addressed using imputation by filling them with the median value of each column, while categorical variables such as race and gender were converted into numerical labels to ensure compatibility with the model. The base models consisted of two TD-based classifiers (HAP2_p1, Foster) and three PD-based classifiers (UKGTS, LoGTS, Kangs), all adjusted for clinical data (age, race, gender, and follow-up time). Given the moderate to strong correlation between the outputs of these five models (Supplementary Figure S2), a single MLP was trained as the base model [29]. For feature extraction, two MLPs were trained using a combination of 52 TD or PD features and 4 clinical variables (HAP2_p1 and Foster were trained on PD data, and UKGTS, LoGTS, and Kang on TD data). Hyperparameters were optimized using the “GridSearchCV” class from the scikit-learn library with 5-fold cross-validation. “GridSearchCV” searched for the best combination of hyperparameters, including activation functions [’softmax’, ’ReLU’, ’sigmoid’], learning rates [1e-2, 1e-3, 1e-5], and optimizers [’SGD’, ’RMSprop’, ’Adam’]. The optimal configuration was found to be an activation function of ’sigmoid’, a learning rate of 1e-3, and an optimizer of ’Adam’. The number of epochs was set to 25, with early stopping enabled and a patience of 3. To enhance the input features for the models, clinical data (age, race, follow-up time, and gender) were incorporated alongside the TD and PD features for each of the five stand-alone models. This modification ensured the model accounted for the influence of demographic and clinical factors on the prediction, resulting in a more robust, context-aware model that considered both medical and patient-specific variables.
2.4. The Proposed Meta-Learners
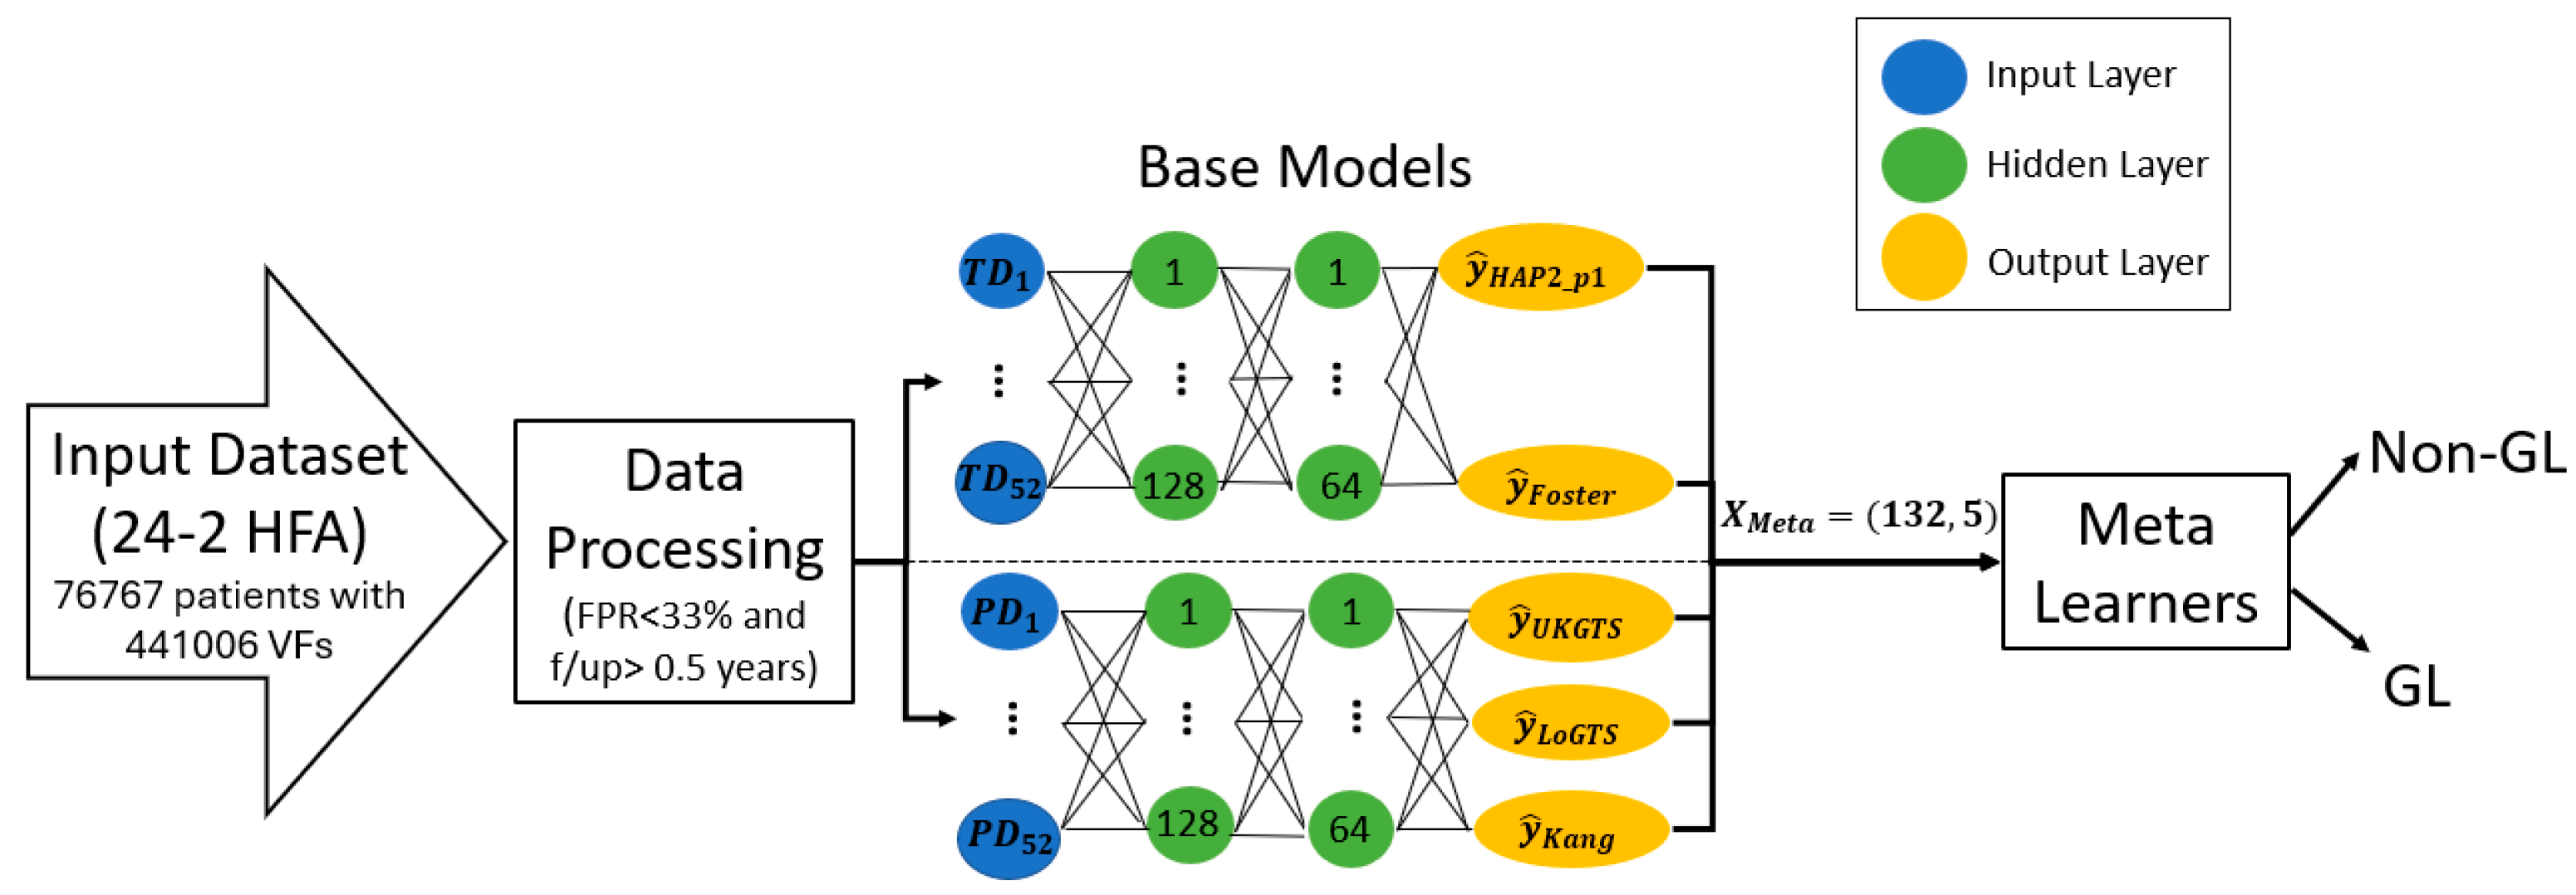
After extracting weights using the output layer of the base models, the three meta-learners (LR, XGB, and MLP) were trained to combine the output features. The MLP model had 3 layers, with 128 neurons in the first layer, 64 neurons in the second, and sigmoid activation function in the final layer. The model used batch normalization and ‘ReLU’ activation between the hidden layers, along with a dropout rate of 0.08 to avoid overfitting. The hyperparameters include Adam optimizer, a learning rate of 0.0031, and weight decay of 1e-3, using a batch size of 32. For the other meta-learners, the LR model was trained using the ‘LogisticRegression’ class from scikit-learn with L2 regularization, a solver of ’lbfgs’, and no penalty term (C=1.0). The XGBoost model was trained using the ‘XGBClassifier’ from the XGBoost library with a learning rate of 0.3, maximum depth of 6, and a boosting type of ’gbtree’. All models were trained on the meta-features extracted from the base models’ outputs, and their hyperparameters were optimized for best performance. All models were trained for 25 epochs. Figure1 shows the block diagram of the proposed model.
Figure 1.
General block diagram of the proposed stack-weight classification model. Beside TD and PD values, clinical data including age, race, gender, and follow-up time were included during weight extraction in each base learner. f/up= follow-up time.
Figure 1.
General block diagram of the proposed stack-weight classification model. Beside TD and PD values, clinical data including age, race, gender, and follow-up time were included during weight extraction in each base learner. f/up= follow-up time.
2.5. Statistical Analysis
The Wilcoxon Signed-Rank Test, from the Python “stat” library, was applied for pairwise model comparisons. Tests with a significance level of < 0.05 were considered statistically significant. To remove outliers from the analysis, the IQR for each model’s probabilities was computed. To assess uncertainty in the predictions of the meta-learner models (Logistic Regression, XGBoost, and MLP), the entropy for each model was calculated using the following formula:
Where p is the predicted probability for the GL class and 1-p is the predicted probability of the non-GL class.
3. Results
3.1. Patients Characteristics
Table 1 presents the characteristics of the 33,636 study participants (mean age 61.86 ± 14.40, 58% female) with 340,444 VFs. The majority of participants identified as White (70.18%, 309,516), followed by Black/African Americans (11.70%, 51,579), Asians (6.02%, 26,563), American Indian/Alaska Native (3.98%, 17,564), and others (7.59%, 33,473). The median follow-up time was 1.25 years, with an interquartile range (IQR) of [0, 4.93] years. On average, each eye had 2.95 visits (SD = 3.35). At baseline, the mean MD was -4.48 dB (SD = 6.49). Patients were categorized into three groups based on their MD values [30] into mild MD (MD > -4.20) with a mean MD of -1.13 dB (SD = 1.73), moderate MD (-8.17 < MD ≤ -4.20) with mean MD of -5.83 dB (SD = 1.12), and severe MD (MD ≤ -8.17) with mean MD of -16.34 dB (SD = 6.70).
3.2. Permutation Importance Analysis
To assess the relative contribution of different features in our base models, we utilized permutation importance [31] with feature values randomly shuffled. This method ensures a more reliable ranking by mitigating biases from collinear features (e.g., age). The top 10 influential features (Figure 2) were largely associated with the superior temporal (ST) and inferior nasal (IN) sectors. In the UKGTS model, key features included td11 (ST, 0.026), td2 (ST, 0.023), and td37 (IN, 0.018), while in LoGTS, the most important were td11 (ST, 0.039), td19 (ST, 0.034), and td34 (IN, 0.028). The Kangs model showed the highest permutation scores, with td11 (ST, 0.080), td19 (ST, 0.065), and td34 (IN, 0.050) among the top predictors. Conversely, in the HAP2_p1 and Foster models, pd2 (ST, 0.041), pd4 (ST, 0.038), and pd34 (IN, 0.032) exhibited the highest importance scores. Furthermore, pd31 (IN, 0.027), pd52 (IN, 0.025), and pd21 (ST, 0.022) were identified as key contributors in HAP2_p1, whereas pd56 (IN, 0.026), pd31 (IN, 0.023), and pd37 (ST, 0.021) ranked as the most significant features in Foster. As expected, age was the most influential clinical factor in all models (permutation score ~0.30), followed by follow-up time, while gender and race had minimal predictive impact. The list of all features is provided in Supplementary Figure S1.
3.2. Model Execution Results
Table 2 shows the performance metrics of the developed meta-learners and stand-alone models demonstrate that the Multi-Layer Perceptron (MLP) achieved the highest accuracy (96.43%), precision (92.32%), sensitivity (100%), and F-score (96.01%) among all models. The Extreme Gradient Boosting (XGB) model follows with an accuracy of 92.86%, precision of 85.71%, and an F-score of 92.31%. Logistic Regression (LR) attained an accuracy of 89.29%, precision of 90.91%, and a sensitivity of 83.33%. Among the stand-alone models, LoGTS exhibited the highest accuracy (87.51%) and an F-score of 83.33%. UKGTS and Kang demonstrated comparable performances, with accuracy values of 84.40% and 84.41%, respectively. The Foster model achieved the lowest accuracy (65.65%) and precision (52.22%) but retained a high sensitivity of 95.03%.
The confusion matrices in Figure 3 reveal that LR produced 1 false positive (FP) and 2 false negative (FN) errors, suggesting a tendency to under-detect glaucomatous cases. In contrast, XGB completely eliminated FNs but resulted in 2 FP errors, indicating a slight tendency to overpredict GL cases. MLP exhibited the most accurate classification performance, with only 1 FP and 0 FN errors, highlighting its effectiveness in capturing glaucomatous patterns without misclassifying true GL cases. The prediction VF plots are further supporting these results.
The receiver operating characteristic (ROC) curves in Figure 4(A) demonstrate the performance of each model in distinguishing glaucomatous from non-glaucomatous visual fields. The MLP meta-learner achieved the highest area under the curve (AUC) value of 0.979, followed by XGB with an AUC of 0.961, and LR with an AUC of 0.948. Among the stand-alone models, LoGTS exhibited the highest AUC (0.831), whereas the Foster model had the lowest (0.667). Figure 4(B) displays the uncertainty in predictions for the three meta-learner models. The Logistic Regression model exhibited the highest level of uncertainty, while MLP demonstrated the lowest, remaining well below the uncertainty threshold of 10%.
The proposed MLP meta-learner in this study outperformed similar reported models in the literature. Specifically, the MLP achieved an accuracy of 96.43%, a precision of 92.32%, and a sensitivity of 100%, with an AUC of 97.96%. Comparatively, Wu et al. (2021) [32] reported an accuracy of 87.1% and an AUC of 94% using a Decision Tree model, while Masumoto et al. (2018) [33] achieved a sensitivity of 81.3% and an AUC of 87.2% using a deep learning model. The performance of the proposed MLP model demonstrates a substantial improvement over prior method.

Table 3.
Comparison of the proposed meta- learner against similar works in the literature.
| Classifier | Accuracy (%) | Precision (%) | Sensitivity (%) | AUC (%) |
| MLP Meta Learner (this study) | 96.43 | 92.32 | 100 | 97.96 |
| Wu et al. [32], 2021, C5 Decision Tree | 87.1 | 84.7 | 88.3 | 94 |
| Masumoto et al. [33], 2018, Deep learning model | NA | 80.2 | 81.3 | 87.2 |
4. Discussion
In this study, we introduce PyGlaucoMetrics as a stacked weight meta-learning approach, which integrates the predictive strengths of multiple ML-based models to improve GL classification. Unlike prior studies that rely on single-model approaches, such as Marín-Franch et al.’s R-based visualFields package [25] and Elze et al.’s vfprogression package [26], PyGlaucoMetrics provides a meta-learning framework, integrating predictions from multiple established models to improve classification accuracy and robustness. By leveraging a meta-learner trained on model outputs rather than simple majority voting, PyGlaucoMetrics enhances standardization, interpretability, and reproducibility in GL detection and severity assessment.
Our meta-learning approach integrates outputs from five well-established VF-based classifiers (HAP2, UKGTS, LoGTS, Kang’s method, and Foster) and refines predictions through a secondary learning stage. Three machine learning models including LR, XGB, and MLP were developed as meta-learners, trained on the outputs of the base classifiers. Among these, MLP outperformed all other models, achieving an accuracy of 96.43%, precision of 92.32%, and AUC of 97.96%, demonstrating superior ability to distinguish GL from non-GL VFs. In comparison, XGB and LR achieved AUCs of 96.1% and 94.8%, respectively, while the best-performing stand-alone classifier (LoGTS) had an AUC of 83.1%. The improved classification performance of the meta-learners, particularly MLP, highlights the advantage of aggregating information from multiple VF models rather than relying on a single classification criterion.
Performance validation using an independent test set further confirmed the clinical reliability of PyGlaucoMetrics. The MLP meta-learner demonstrated the lowest uncertainty in predictions, as indicated in Figure 4B, while LR exhibited higher uncertainty levels, suggesting a greater sensitivity of MLP to robust VF patterns. Additionally, feature importance analysis (Figure 2) identified the ST and IN sectors as key regions in GL classification, with td11 (ST, 0.080) and td34 (IN, 0.050) ranking highest in the Kangs model, while UKGTS and LoGTS also prioritized td11 (ST). In contrast pd2 (ST, 0.041) and pd34 (IN, 0.032) contributed more to HAP2_p1 and Foster models. Age was the most influential clinical variable across all models (~0.30), while gender and race had minimal impact. These findings reinforce the role of ST and IN sectors in GL progression and suggest that integrating both TD- and PD-derived features enhances predictive performance.
The clinical applicability of PyGlaucoMetrics was assessed using a cohort of 160 patients, where MLP outperformed traditional stand-alone classifiers, achieving an AUC of 96% in distinguishing GL vs. non-GL eyes. Compared to existing methods, PyGlaucoMetrics demonstrated a notable improvement, surpassing the C5 Decision Tree model by Wu et al. (AUC = 94%) and the deep learning model by Masumoto et al. (AUC = 87.2%). These results highlight the advantage of the meta-learning framework in reducing bias and improving model generalizability across different datasets.
Despite its robust performance, several limitations of PyGlaucoMetrics should be acknowledged. First, GL diagnosis, particularly in early stages, remains inherently variable among specialists, and the absence of a universally accepted ground truth introduces challenges in benchmarking model performance. The clinical labels used in this study were validated by two GL specialists with 80% inter-rater agreement, but the subjectivity of clinical diagnosis remains a potential source of bias. Future work should explore alternative labeling strategies, such as integrating longitudinal VF progression trends to refine diagnostic certainty. Second, while PyGlaucoMetrics was trained on a large dataset of 340,444 VF tests, its reliance on HFA 24-2 test patterns may limit generalizability to other test strategies or devices (e.g., HFA 10-2, Octopus perimeters).
Future research should validate PyGlaucoMetrics on broader and more diverse patient populations, particularly in healthy normative cohorts, to enhance specificity and minimize the risk of false-positive classifications. Further exploration of deep learning-based models for time-series VF analysis may provide additional insight into GL progression prediction, expanding the utility of PyGlaucoMetrics beyond cross-sectional classification. While PyGlaucoMetrics represents a significant step forward in automated GL detection, its greatest utility currently lies as a research tool rather than a standalone clinical application. Future integration with VF devices and automated clinical workflows will be essential for maximizing its impact and translating its benefits into real-world ophthalmic practice.
5. Conclusions
PyGlaucoMetrics, as a stacked weight meta-learning approach, significantly improves GL classification by integrating outputs from multiple VF-based models. Among the meta-learners, MLP demonstrated superior performance with minimal misclassification errors and the most distinct probability distribution for GL detection. The findings suggest that utilizing meta-learning enhances classification robustness and generalizability, offering a valuable tool for automated glaucoma assessment.
Code Availability Statement
The code for this article is available from the first author GitHub page at: https://github.com/Mousamoradi/PyGlaucoMetrics
Supplementary Materials
The following supporting information can be downloaded at the website of this paper posted on Preprints.org.
Author Contributions
M.M. originated the study’s concept, developed the code, conducted the simulations, analyzed the data, and wrote the initial manuscript draft. S.K.H. handled the data analysis and revised the draft. M.D. V. performed clinical grading and made edits to the draft. A.R.S. assisted with clinical grading. F.A. also contributed to clinical grading and revised the draft. M.W. participated in editing and securing funding, while T.E. was involved in both editing and funding. M.E. contributed to editing, project supervision, and package preparation. N.Z. contributed to manuscript editing, project supervision, funding, and administration. All authors have read and agreed to the published version of the manuscript.
Funding
This research was funded by the National Institutes of Health (NIH: R01 EY036222 and R21 EY035298), and MIT-MGB AI Cures Grant.
Institutional Review Board Statement
The study was conducted in accordance with the Declaration of Helsinki and approved by the Institutional Review Board at Mass General Brigham (MGB).
Informed Consent Statement
Informed consent was obtained from all subjects involved in the study.
Data Availability Statement
The data can be obtained from the corresponding author upon request.
Code Availability Statement
The code for this article is available from the first author GitHub page at: https://github.com/Mousamoradi/PyGlaucoMetrics
Acknowledgments
This article is a revised and expanded version of a paper entitled [PyGlaucoMetrics: An Open-Source Multi-Criteria Glaucoma Defect Evaluation], which was presented at ARVO annual meeting in Seattle on May 3rd, 2024.
Conflicts of Interest
The authors declare no conflicts of interest.
References
- Ha, Q. The number of people with glaucoma worldwide in 2010 and 2020. Br j ophthalmol 2006, 90, 262-267.
- Azuara-Blanco, A.; Traverso, C.E. Terminology and guidelines for glaucoma. 2020.
- Wu, Z.; Medeiros, F.A. Impact of different visual field testing paradigms on sample size requirements for glaucoma clinical trials. Scientific reports 2018, 8, 4889. [CrossRef]
- Elze, T.; Pasquale, L.R.; Shen, L.Q.; Chen, T.C.; Wiggs, J.L.; Bex, P.J. Patterns of functional vision loss in glaucoma determined with archetypal analysis. Journal of The Royal Society Interface 2015, 12, 20141118. [CrossRef]
- Russell, R.A.; Crabb, D.P.; Malik, R.; Garway-Heath, D.F. The relationship between variability and sensitivity in large-scale longitudinal visual field data. Investigative Ophthalmology & Visual Science 2012, 53, 5985-5990. [CrossRef]
- Wall, M.; Woodward, K.R.; Doyle, C.K.; Artes, P.H. Repeatability of automated perimetry: a comparison between standard automated perimetry with stimulus size III and V, matrix, and motion perimetry. Investigative ophthalmology & visual science 2009, 50, 974-979. [CrossRef]
- Christopher, M.; Bowd, C.; Belghith, A.; Goldbaum, M.H.; Weinreb, R.N.; Fazio, M.A.; Girkin, C.A.; Liebmann, J.M.; Zangwill, L.M. Deep learning approaches predict glaucomatous visual field damage from OCT optic nerve head en face images and retinal nerve fiber layer thickness maps. Ophthalmology 2020, 127, 346-356. [CrossRef]
- Heijl, A.; Leske, M.C.; Bengtsson, B.; Hyman, L.; Bengtsson, B.; Hussein, M.; Group, E.M.G.T. Reduction of intraocular pressure and glaucoma progression: results from the Early Manifest Glaucoma Trial. Archives of ophthalmology 2002, 120, 1268-1279.
- Chauhan, B.C.; Garway-Heath, D.F.; Goñi, F.J.; Rossetti, L.; Bengtsson, B.; Viswanathan, A.C.; Heijl, A. Practical recommendations for measuring rates of visual field change in glaucoma. British Journal of Ophthalmology 2008, 92, 569-573. [CrossRef]
- Moradi, M.; Chen, Y.; Du, X.; Seddon, J.M. Deep ensemble learning for automated non-advanced AMD classification using optimized retinal layer segmentation and SD-OCT scans. Computers in Biology and Medicine 2023, 154, 106512. [CrossRef]
- Moradi, M.; Du, X.; Huan, T.; Chen, Y. Feasibility of the soft attention-based models for automatic segmentation of OCT kidney images. Biomedical Optics Express 2022, 13, 2728-2738.
- Moradi, M.; Du, X.; Chen, Y. Soft attention-based U-NET for automatic segmentation of OCT kidney images. In Proceedings of the Optical Coherence Tomography and Coherence Domain Optical Methods in Biomedicine XXVI, 2022; pp. 106-111.
- Moradi, M.; Huan, T.; Chen, Y.; Du, X.; Seddon, J. Ensemble learning for AMD prediction using retina OCT scans. Investigative Ophthalmology & Visual Science 2022, 63, 732–F0460-0732–F0460.
- Ting, D.S.W.; Pasquale, L.R.; Peng, L.; Campbell, J.P.; Lee, A.Y.; Raman, R.; Tan, G.S.W.; Schmetterer, L.; Keane, P.A.; Wong, T.Y. Artificial intelligence and deep learning in ophthalmology. British Journal of Ophthalmology 2019, 103, 167-175. [CrossRef]
- Artes, P.H.; Nicolela, M.T.; LeBlanc, R.P.; Chauhan, B.C. Visual field progression in glaucoma: total versus pattern deviation analyses. Investigative ophthalmology & visual science 2005, 46, 4600-4606.
- Sabharwal, J.; Hou, K.; Herbert, P.; Bradley, C.; Johnson, C.A.; Wall, M.; Ramulu, P.Y.; Unberath, M.; Yohannan, J. A deep learning model incorporating spatial and temporal information successfully detects visual field worsening using a consensus based approach. Scientific reports 2023, 13, 1041. [CrossRef]
- Stubeda, H.; Quach, J.; Gao, J.; Shuba, L.M.; Nicolela, M.T.; Chauhan, B.C.; Vianna, J.R. Comparing five criteria for evaluating glaucomatous visual fields. American Journal of Ophthalmology 2022, 237, 154-163.
- Krupin, T.; Liebmann, J.M.; Greenfield, D.S.; Rosenberg, L.F.; Ritch, R.; Yang, J.W.; Group, L.-P.G.S. The Low-pressure Glaucoma Treatment Study (LoGTS): study design and baseline characteristics of enrolled patients. Ophthalmology 2005, 112, 376-385. [CrossRef]
- Garway-Heath, D.F.; Lascaratos, G.; Bunce, C.; Crabb, D.P.; Russell, R.A.; Shah, A.; Investigators, U.K.G.T.S. The United Kingdom Glaucoma Treatment Study: a multicenter, randomized, placebo-controlled clinical trial: design and methodology. Ophthalmology 2013, 120, 68-76. [CrossRef]
- Garway-Heath, D.F.; Crabb, D.P.; Bunce, C.; Lascaratos, G.; Amalfitano, F.; Anand, N.; Azuara-Blanco, A.; Bourne, R.R.; Broadway, D.C.; Cunliffe, I.A. Latanoprost for open-angle glaucoma (UKGTS): a randomised, multicentre, placebo-controlled trial. The Lancet 2015, 385, 1295-1304. [CrossRef]
- Kang, J.H.; Loomis, S.J.; Rosner, B.A.; Wiggs, J.L.; Pasquale, L.R. Comparison of risk factor profiles for primary open-angle glaucoma subtypes defined by pattern of visual field loss: a prospective study. Investigative Ophthalmology & Visual Science 2015, 56, 2439-2448.
- Perkins, T.W. Clinical decisions in glaucoma. Archives of Ophthalmology 1994, 112, 1518-1519.
- Chang, T.C.; Ramulu, P.; Hodapp, E. Clinical decisions in glaucoma; Bascom Palmer Eye Institute Miami (FL): 2016.
- Foster, P.J.; Buhrmann, R.; Quigley, H.A.; Johnson, G.J. The definition and classification of glaucoma in prevalence surveys. British journal of ophthalmology 2002, 86, 238-242. [CrossRef]
- Marín-Franch, I.; Swanson, W.H. The visualFields package: a tool for analysis and visualization of visual fields. Journal of vision 2013, 13, 10-10.
- Tobias Elze, D.L., Eun Young Choi. CRAN - Package vfprogression. 2019. [CrossRef]
- Hatami, F.; Moradi, M. Comparative Analysis of Machine Learning Models for Predicting Viscosity in Tri-n-Butyl Phosphate Mixtures Using Experimental Data. Computation 2024, 12, 133. [CrossRef]
- Eslami, M.; Kazeminasab, S.; Sharma, V.; Li, Y.; Fazli, M.; Wang, M.; Zebardast, N.; Elze, T. PyVisualFields: A Python Package for Visual Field Analysis. Translational Vision Science & Technology 2023, 12, 6-6.
- Wolpert, D.H. Stacked generalization. Neural networks 1992, 5, 241-259.
- Forchheimer, I.; De Moraes, C.; Teng, C.; Folgar, F.; Tello, C.; Ritch, R.; Liebmann, J. Baseline mean deviation and rates of visual field change in treated glaucoma patients. Eye 2011, 25, 626-632. [CrossRef]
- Altmann, A.; Toloşi, L.; Sander, O.; Lengauer, T. Permutation importance: a corrected feature importance measure. Bioinformatics 2010, 26, 1340-1347.
- Wu, C.-W.; Shen, H.-L.; Lu, C.-J.; Chen, S.-H.; Chen, H.-Y. Comparison of different machine learning classifiers for glaucoma diagnosis based on spectralis OCT. Diagnostics 2021, 11, 1718. [CrossRef]
- Masumoto, H.; Tabuchi, H.; Nakakura, S.; Ishitobi, N.; Miki, M.; Enno, H. Deep-learning classifier with an ultrawide-field scanning laser ophthalmoscope detects glaucoma visual field severity. Journal of glaucoma 2018, 27, 647-652.
Figure 2.
The top 10 important features based on the weights of each stand-alone model extracted by MLP.
Figure 2.
The top 10 important features based on the weights of each stand-alone model extracted by MLP.
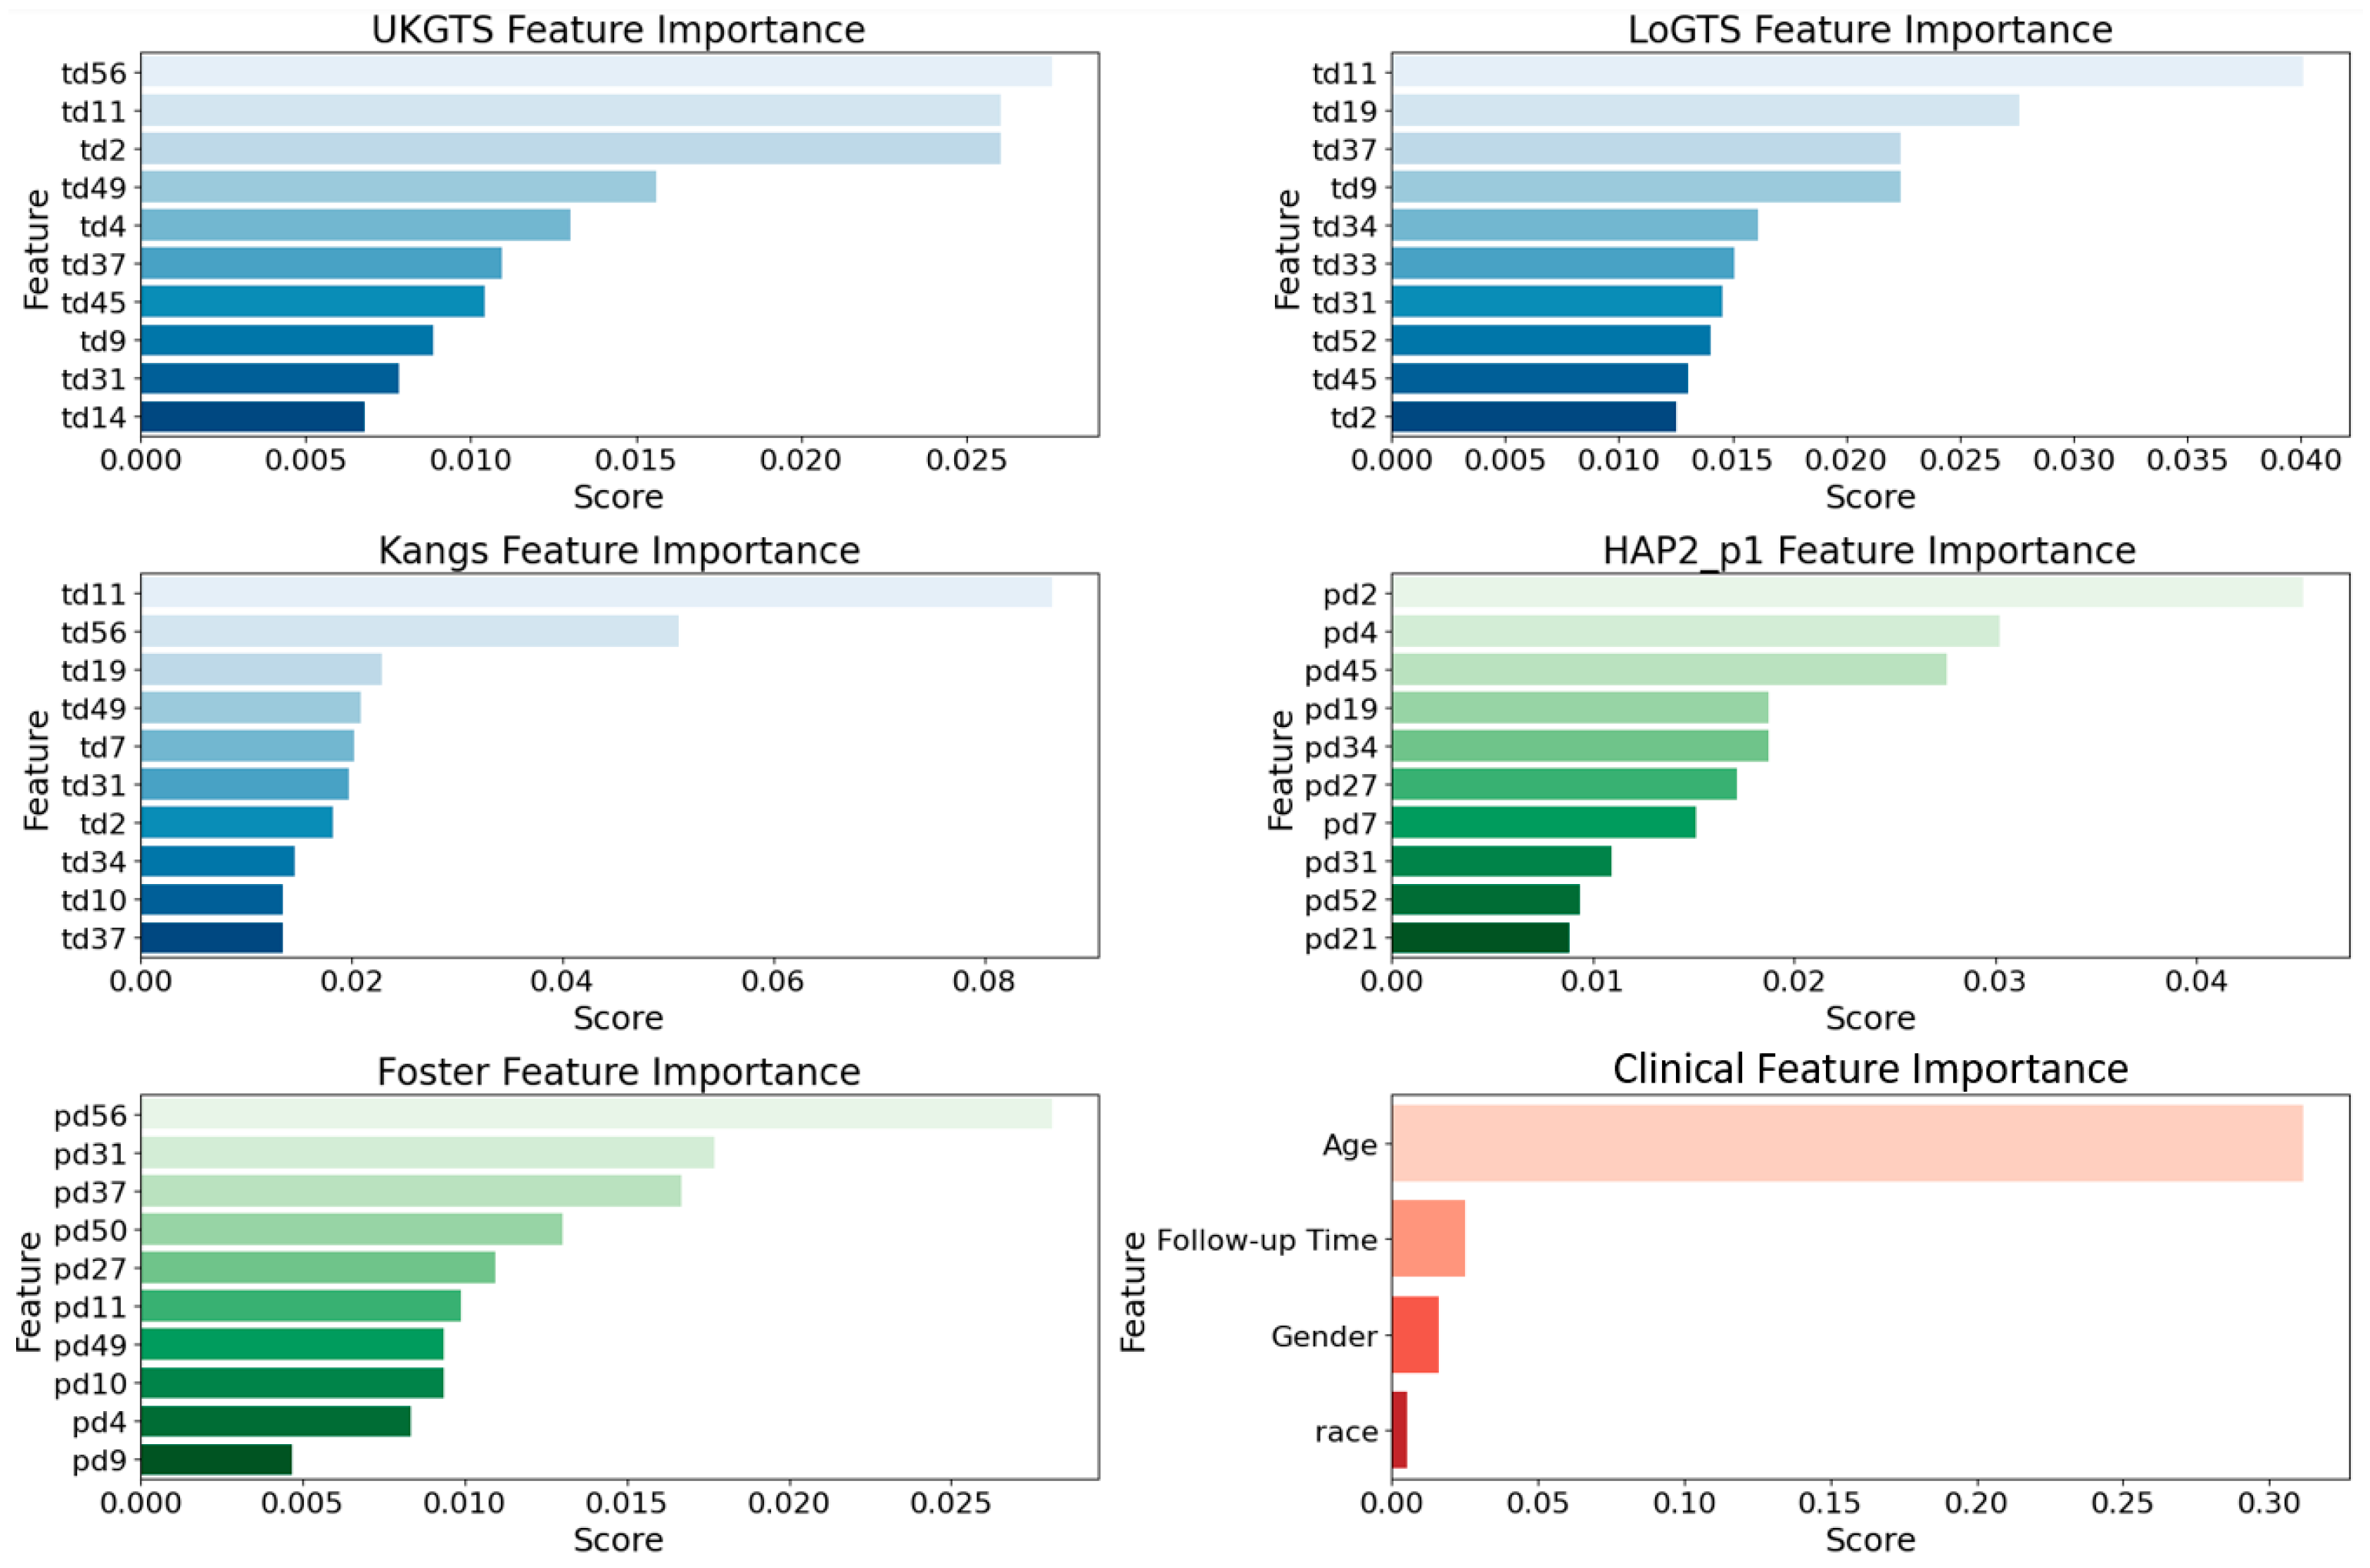
Figure 3.
Confusion matrices and prediction results for three meta-learners. The labels ‘LR’, ‘XGB’, and ‘MLP’ refer to the respective three meta-learner classifiers used in this study. The green and red colors in prediction plots indicate correct and incorrect predicted labels, respectively. The color bar represents the statistical probability that a specific point on the VF is considered as normal. LR= Logistic Regression, XGB= Extreme Gradient Boosting, and MLP= Multi-layer Perceptron.
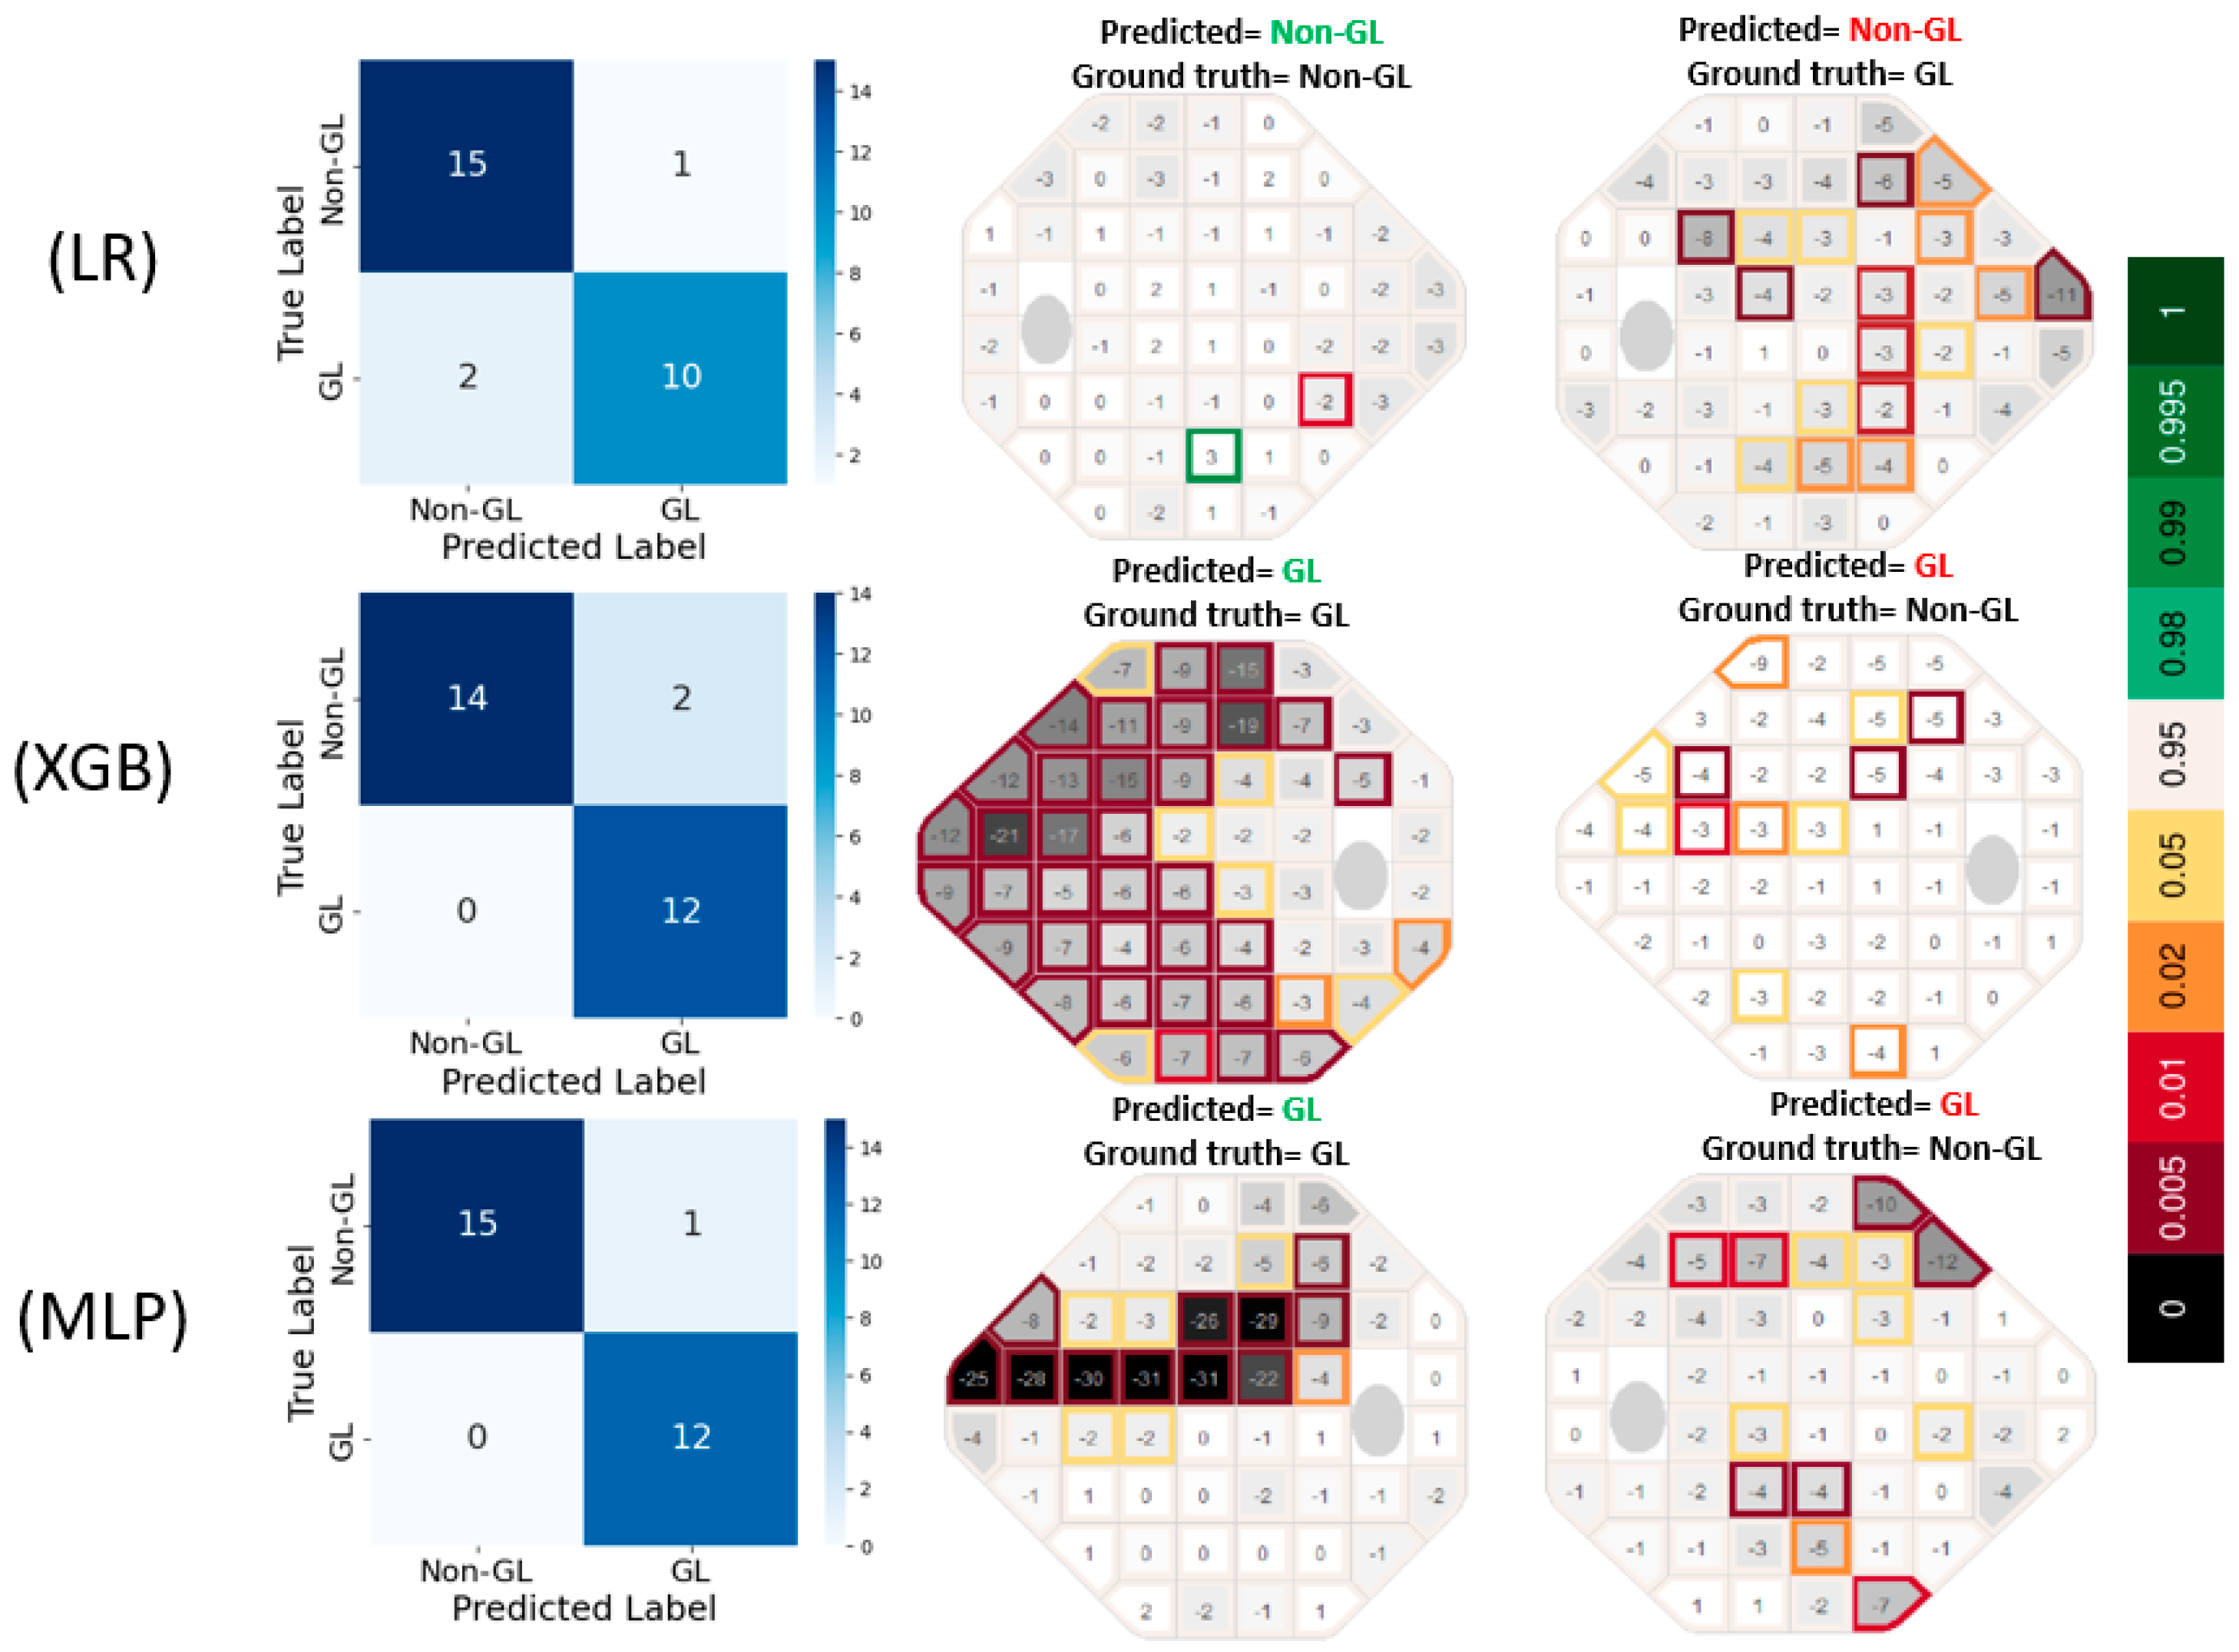
Figure 4.
ROC curves for stand-alone and meta learner models (A), uncertainty in predictions for each meta-learner models. The dashed line indicates the uncertainty threshold of 10%.
Figure 4.
ROC curves for stand-alone and meta learner models (A), uncertainty in predictions for each meta-learner models. The dashed line indicates the uncertainty threshold of 10%.
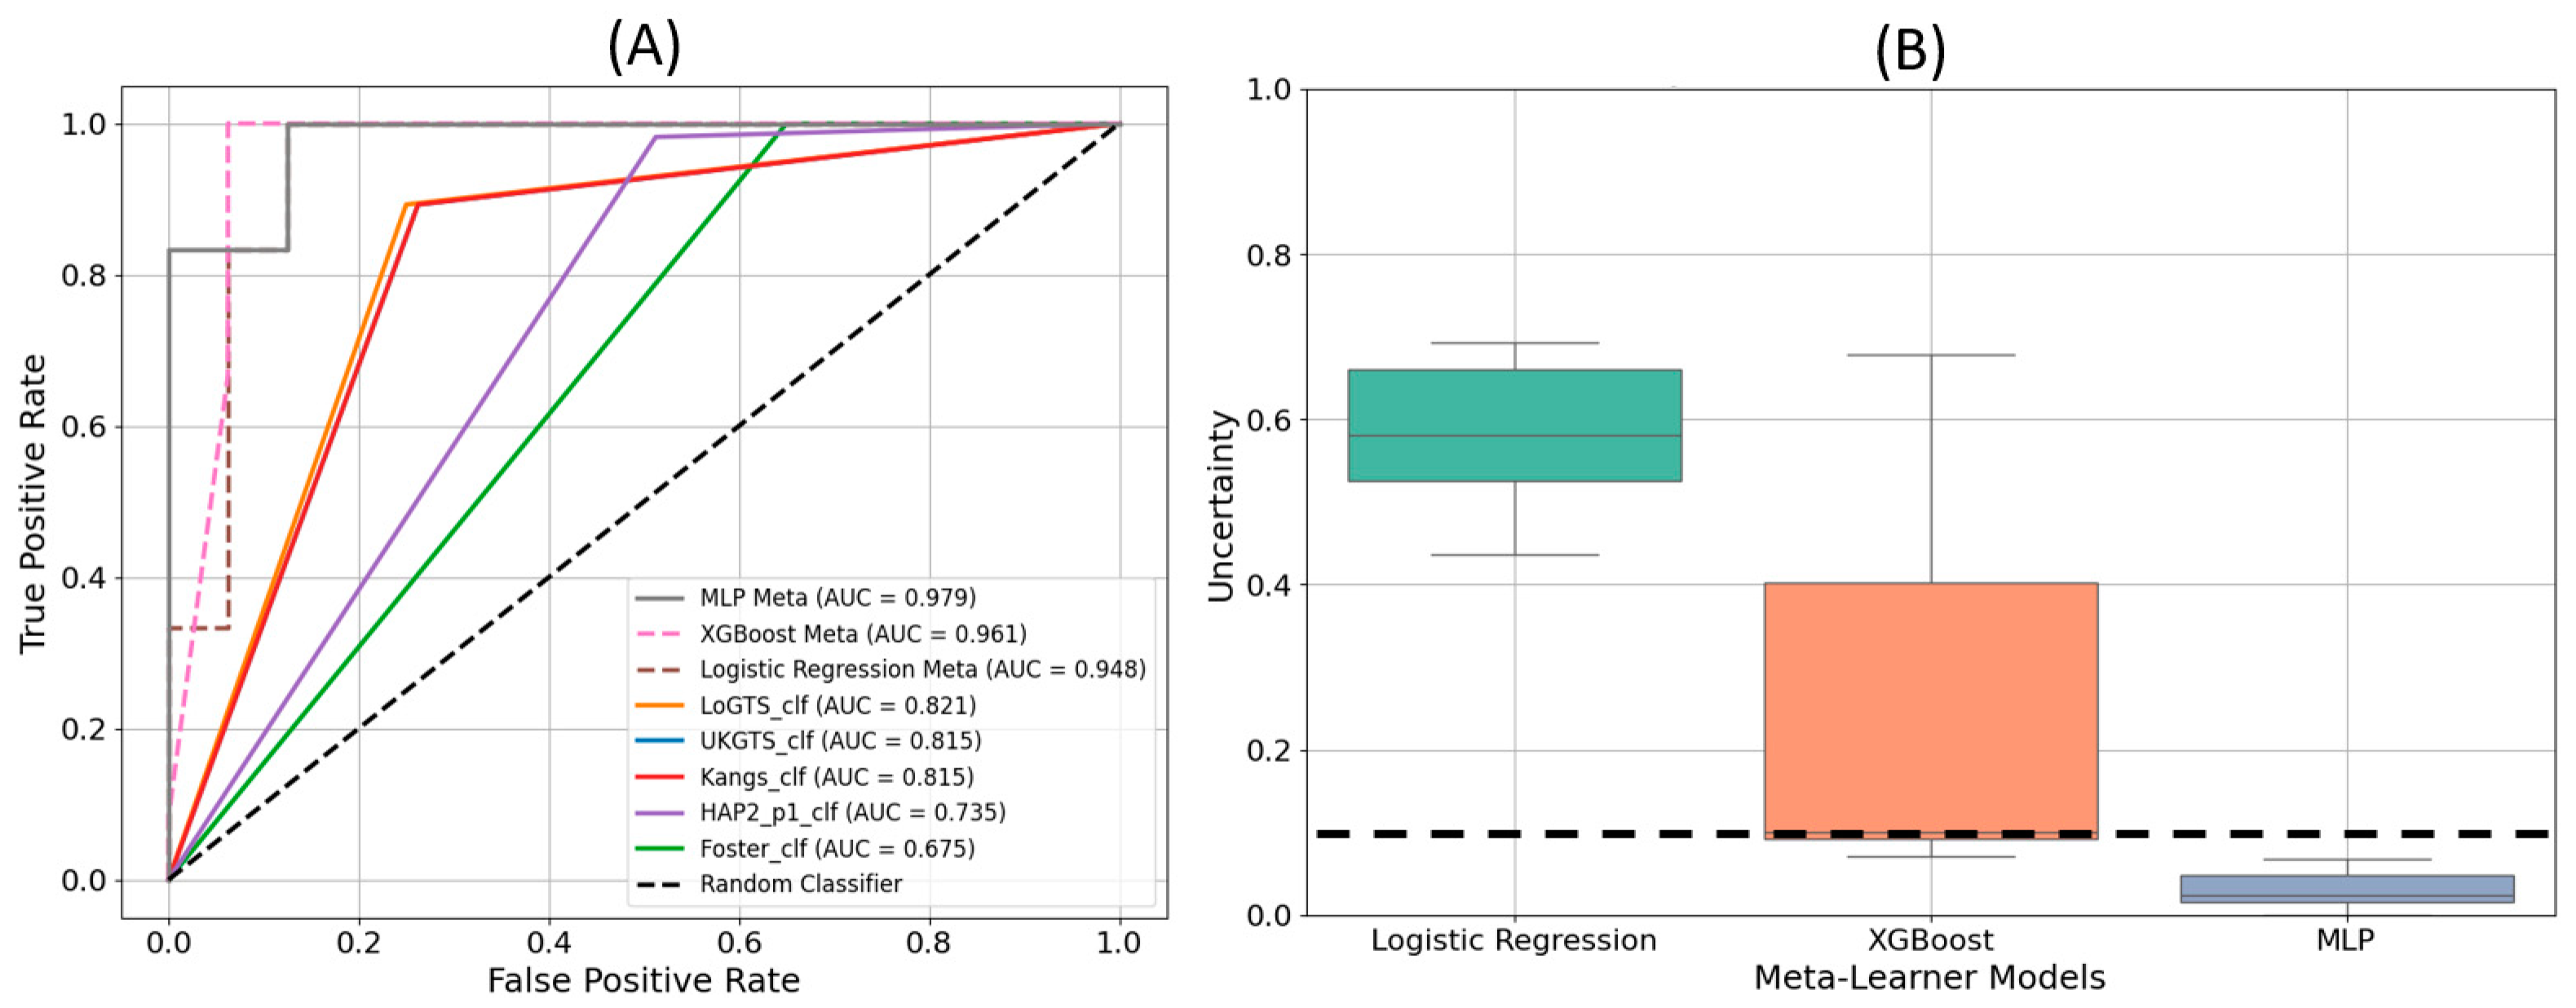
Table 1.
Clinical characteristics of the subjects included in this study. Data are presented as mean (SD), median [IQR] or n (%). Other races include Hispanic, Hawaiian, and not reported races. .
Table 1.
Clinical characteristics of the subjects included in this study. Data are presented as mean (SD), median [IQR] or n (%). Other races include Hispanic, Hawaiian, and not reported races. .
| Characteristic | |
| Age at baseline, years, Mean (SD) | 61.86 (17.40) |
| Gender, n (%) | |
| Female | 19528 (58.06%) |
| Male | 14109 (41.95%) |
| Race, n (%) | |
| White | 309516 (70.18%) |
| Black/African Americans | 51579 (11.70%) |
| Asians | 26563 (6.02%) |
| American Indian/Alaska Native | 17564 (3.98%) |
| Others | 33473 (7.59%) |
| Visual fields (total), n | 340439 |
| Follow-up time, years, median [IQR] | 2.49 [0.54, 6.22] |
| N of visits per eye, years, Mean (SD) | 5.16 (3.35) |
| MD at baseline, dB, Mean (SD) | |
| Overall | -4.48 (6.49) |
| Mild (MD > -4.20) | -1.13 (1.73) |
| Moderate (-8.17< MD <= -4.20) | -5.83 (1.12) |
| Severe (MD <= -8.17) | -16.34 (6.70) |
Table 2.
Performance metrics for the developed meta-learners and stand-alone models. LR= Logistic Regression, XGB= Extreme Gradient Boosting, and MLP= Multi-layer Perceptron. All metrics are in %.
Table 2.
Performance metrics for the developed meta-learners and stand-alone models. LR= Logistic Regression, XGB= Extreme Gradient Boosting, and MLP= Multi-layer Perceptron. All metrics are in %.
| Classifier | Accuracy (%) | Precision (%) | Sensitivity (%) | F-score (%) |
| MLP | 96.43 | 92.32 | 100 | 96.01 |
| XGB | 92.86 | 85.71 | 100 | 92.31 |
| LR | 89.29 | 90.91 | 83.33 | 86.96 |
| LoGTS | 87.51 | 76.92 | 90.90 | 83.33 |
| UKGTS | 84.40 | 73.30 | 91.72 | 81.48 |
| Kang | 84.41 | 73.32 | 91.73 | 81.50 |
| HAP2_p 1 | 78.14 | 63.22 | 95 | 75.92 |
| Foster | 65.65 | 52.22 | 95.03 | 67.40 |
Disclaimer/Publisher’s Note: The statements, opinions and data contained in all publications are solely those of the individual author(s) and contributor(s) and not of MDPI and/or the editor(s). MDPI and/or the editor(s) disclaim responsibility for any injury to people or property resulting from any ideas, methods, instructions or products referred to in the content. |
© 2025 by the authors. Licensee MDPI, Basel, Switzerland. This article is an open access article distributed under the terms and conditions of the Creative Commons Attribution (CC BY) license (http://creativecommons.org/licenses/by/4.0/).
Copyright: This open access article is published under a Creative Commons CC BY 4.0 license, which permit the free download, distribution, and reuse, provided that the author and preprint are cited in any reuse.


