
Submitted:
19 February 2025
Posted:
19 February 2025
You are already at the latest version
Abstract
Background/objectives: Effective communication is critical to optimizing cancer care, influencing treatment plans and outcomes. Studies consistently demonstrate that clear, well-structured communication with cancer patients significantly enhances therapeutic results and plays a central role in meeting patient communication needs and improving care quality. Methods: This randomised, controlled, parallel, study evaluated the impact of the Patient Communication Profile (PCP) and quality of life (QoL) measures through the use of the McGill QoL instrument, on cancer patient outcomes. The PCP was completed by participants at baseline and 2 follow-up visits over 4 weeks and the McGill QoL instrument was completed at baseline and second follow-up visit. Questionnaires were made available to oncologists for the study group while these were blind for oncologists of the control group. Results: 105 patients were randomized (2:1) into control (N=41) and study groups (N=64). At baseline, no differences were observed between groups, while over the follow-up period, a better understanding and higher level of satisfaction with their encounters, due to a more comprehensive acquisition of information, was reported in the study group vs. control (p<0.05). The periodical and individualized feedback on need for information and related issues significantly contributed to the improvement in QoL (assessed using the McGill questionnaire) in the study group (p<0.05). Furthermore, significant improvements in mean PCP domain scores in the study group were also observed (p<0.05). Conclusion: Our findings show that integrating routine assessments of patients' information needs with individualized feedback to clinicians before encounters enhances mutual understanding. This approach improves patient QoL and optimizes treatment adherence in cancer care.
Keywords:
Patients information needs and outcomes
; patient communication
; quality of life
; Patient Communication Profile (PCP)
; McGill quality of life questionnaire
; cancer patients
1. Introduction
Communicating medical information is one of the crucial foundations that have an effect on a patient’s treatment and care[1,2]. Previous studies have observed that effective communication with cancer patients improves their therapeutic outcomes[3,4,5,6]. To this end, Miller concluded that “patients fare better (physiologically, behaviourally, and psychologically) when the information they receive about their medical condition is tailored to their own coping style”[7]. An open and tailored communication with patients and their caregivers is essential for the acceptance of the disease and its treatment, resulting in improvements in physical and mental health[8,9,10,11,12].
In an effort to move towards more personalized care, patients should be assessed periodically to meet their information needs and related outcomes. This may help identify patient’s problems (and solutions), enhancing their participation in the decision-making process, thereby granting increased feeling of control over their illness[13,14,15,16].
Despite the recognized importance of tailored communication for improving therapeutic outcomes, discrepancies between clinicians' and patients' perspectives persist, highlighting the need for systematic assessment and individualized feedback to enhance care and patient participation in decision-making.
Several studies have shown that patients are diffident in their information seeking behaviours; some needing longer encounters to identify with or adjust to such behaviours. Some patients cope with their potentially threatening condition by avoiding further information (“blunters”)[17,18,19,20,21]. Moreover, there is often a discrepancy between patients’ and their clinicians’ views of patients’ information needs and resulting processes[22,23,24,25,26].
Considering these obstacles, interventions aimed at improving communication and enhancing patients’ participation in the decision process should differentiate between patients’ coping styles regarding illness and its treatment. To be effective, this intervention must be available, accessible, applicable, and not a burden to patients and doctors[1,27,28].
To assess patients’ needs for information and related outcomes, the Patient Communication Profile (PCP) was developed. The PCP is a short questionnaire for patients, which investigates the inclination of the patients towards obtaining information and participation in the decision-making process during the course of the disease and treatment. As the assessment of patient needs and outcomes is crucial in improving the delivery of care[5,29,30], the value of the PCP in routine assessment of patients with cancer must be established.
The PCP includes sub-scales that can assess short and intermediate outcomes; however, due to the shift of emphasis in oncology care from “adding years to life” to “adding life to years”, a comprehensive assessment of long-term needs and outcomes is strongly recommended[31,32,33]. In this regard, a disease-specific quality of life (QoL) instrument is needed to evaluate the impact of the information provision and patients’ satisfaction on patients focused outcomes. Thus, in this study the Revised McGill Quality of Life Questionnaire (MQOL-R) was adopted to supplement the PCP. It is a short, applicable and practical questionnaire for use in cancer clinical settings, covering physical, psychological and social aspects[34,35,36].
This study aimed to bridge the gap between clinicians' perceptions and patients' actual information needs by providing individualized feedback to clinicians. This study was conducted to evaluate whether periodic, systematic assessment of cancer patients' information needs, with tailored feedback to clinicians, influences patient-centered outcomes. We examined the use of the PCP to assess the relationship between the communicated medical information and its impact on patients’ QoL by MQOL-R scores. The findings could guide personalized care, enhancing patient participation and QoL, making interventions more effective and practical for both patients and healthcare providers.
2. Materials and Methods
2.1. Study Design
This was a randomised, controlled, parallel, study, consisting of two arms, with baseline and follow-up observations in control and study groups in patients with cancer.
2.2. Study Particpants
The participant physicians screened eligible patients from appointment lists of the outpatient clinic at the Wales Cancer Research Centre over a 6-month period. Patients were considered eligible for participation and enrolled in the study if they met the following inclusion criteria: males and females aged ≥18 years, cancer diagnosis, treated by an oncologist and expected to have at least 3 hospital visits with a 4-week interval period. According to standard clinical practice, we adopted a four-week interval between patient visits. This helps reduce the burden on patients with comorbidities or complications. More frequent visits could add unnecessary strain, while the four-week schedule allows for timely care and flexibility. All patients possessed the mental and physical ability to complete the study questionnaires, able to understand English and signed written informed consent.
2.3. Procedures
Investigators in the clinics identified eligible patients for the study from current patients and new referrals. Eligible patients were invited to participate and given an information sheet before they gave written consent. Participants were then randomly assigned to either study or control group by electronic random designation and were given an identification number for all records to guarantee privacy of sensitive data.
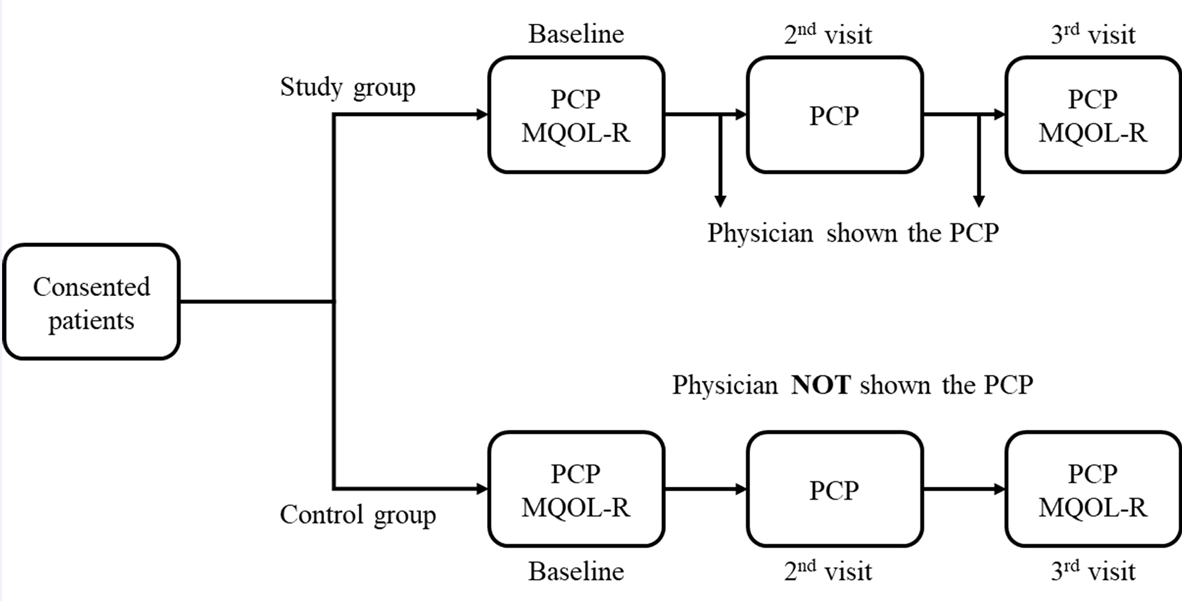
At the first visit, investigators administered the PCP and MQOL-R questionnaires. The researcher met the patient in a quiet environment, where the patient received brief instructions on how to complete the questionnaire. The physician was present to address any questions the patient may have had during or after completing the questionnaire. All physicians had received prior training, and responses to patient inquiries were kept neutral to avoid influencing the patient's answers. The completed PCP of the study group at the entry visit (baseline) was placed in the patients’ medical records and shown to the examining physicians followed by a brief discussion just before seeing the patients at the second visit. The brief discussion (<5 minutes) among physicians was specifically focussed on 1) checking that both questionnaires were fully completed, 2) gauging the nature and extent of information sought from patients from the PCP questionnaire and their QoL as reflected by their results in the MQOL-R and 3) whether a rapid overview of both PCP and MQOL-R results reflected what the physician had perceived/anticipated the results would reveal given their prior experience and knowledge of the patient, disease type and severity etc. The PCP of the control group was not shown to the examining physicians, who were blinded to the random allocation of the patient in the trial in the control group.
After the second visit, patients in both control and study groups again completed the PCP. The examining physicians of the study arm were provided with the PCPs from the first and second visits to be discussed with the patients prior to the third visit. Finally, after the third visit, both control and study patients completed the PCP and MQOL-R for within and between group comparisons.
2.4. Study Instruments
2.4.1. Patient Communication Profile (PCP)
The PCP (Appendix 1) was tested for content validity by a panel of experts (N=10) involved in the management of patients with cancer. The questionnaire was also tested internally within our hospital to assess its applicability, practicality and reliability (internal consistency and test-retest) as previously described elsewhere [37,38]. The PCP is a self-administered questionnaire consisting of five sections, plus questions seeking patients’ preferences for sources and methods of obtaining information, and for their participation in treatment related decision-making. The PCP sections assess a patient’s needs for information, satisfaction with the quantity of information received, understanding of illness and its treatment information, satisfaction with the quality of information, and patients’ current mental distress. All items in these sections were assessed using a 4-point Likert scale with response category options from “not at all” to “very much”. Thus, a score of ‘4’ always represents the highest and ‘1’ is the lowest response for all domains.
2.4.2. The Revised McGill Quality of Life Questionnaire (MQOL-R)
The MQOL-R consists of a global question to rate a patient’s overall QoL and 16 items, all considering the “previous week” as the recall period[34,35,36]. The first three items require the patient to list the three most bothersome physical symptoms and rate their severity. Remaining items assess physical well-being (1 item), psychological status (4 items), existential (6 items) and support issues (2 items). A score of ‘10’ represents the best health-related QoL (HRQoL) and ‘0’ the worst (i.e., improvement with increasing scores).
The Minimal Clinically Important Difference (MCID) is the smallest change in a score that is considered clinically meaningful. The MCID for the MQOL-R has not yet been established. However, it has been suggested that the MCID for a QoL questionnaire can be estimated using the Global Rating of Change Scale (GRCS) as an anchor-based method [39]. The GRCS is a single-item scale that measures the patient’s perception of change in their health status over time. The authors suggest that a change of 1.5 points or more on the MQOL-R is considered clinically meaningful when compared to the GRCS[40].
2.5. Statistical Analysis
Data were summarized as mean and standard deviation, median and interquartile range (IQR), or frequency and percentage, as appropriate. Each item in the PCP and MQOL-R was given a score value, from which a mean score for each domain for all patients was derived. For related measurement (i.e., within group comparison), the Wilcoxon ranks sum test (one-tailed) was used to examine the difference in the PCP scores between different visits; and between the baseline and the third visit for the MQOL-R scores. For unrelated, independent measurement, the Mann-Whitney U test (two-tailed) and the Kruskal-Wallis were used to compare mean scores between the study and control groups (i.e., between group comparisons) at each visit. Spearman’s rho rank correlation coefficient (rs) was used to assess the degree of association between sections in the PCP and MQOL-R questionnaires. Probability of type II error was set at p≤0.05. Statistical analysis was performed using SPSS software (IBM Corp, Version 10.0, Chicago, IL, USA).
3. Results
3.1. Patient Flow
Six oncologists identified 123 patients as eligible and were approached. Two patients were not interested in participating to the study and five patients were too ill to continue. Eleven patients could not be tracked for the second visit. In total, 105 (85%) patients were enrolled and completed the second visit, but seven missed the third visit, leaving 98 (80%) patients to complete the third assessment. At study entry, 64 patients were randomly allocated (2:1 ratio) to the study group and 41 to the control group.
3.2. Baseline Characteristics
All patients completed the PCP. At the last assessment (third visit), 59 (92%) study participants and 39 (95%) control patients completed the PCP. For the MQOL-R questionnaire, 63 study patients and 39 control patients completed at the first assessment and 57 (89%) and 34 (83%) at the third assessment, respectively. At baseline, no statistically significant differences between demographic characteristics in the control and study groups were observed (Table 1). In addition, baseline assessments revealed no significant differences between the two groups regarding their information needs, preferences and outcomes domains by PCP and MQOL-R (Table 2).
3.3. The PCP
i) Patient preferences for source and method of receiving information
At baseline, almost all patients preferred “doctors” as the primary source and “verbal” as the method of choice for receiving their information (56% preferred their doctor alone as the source and verbal delivery of information as the method while the remaining 44% of patients wished this to be supplemented by other sources and methods of delivery). At baseline, this level of preference was the same in both groups. After intervention, patients in the study group showed greater preference for one source (i.e., doctor) and one method (i.e., verbal) to obtain their information (Figure S1A). In contrast, patients in the control group showed a preference of integrating other methods to the verbal (Figure S1B). However, these differences did not reach statistical significance in both the second and the third visits (p=0.064).
ii) Patients preferences for their involvement in treatment decision-making process
Patients were divided into different groups based on their preference to be involved in the treatment decision-making. Only the first group (“who wish to leave the decision-making entirely to their doctor”) could be considered as exercising a passive role since there were no significant differences in the needs and outcomes between the second group (“who wish the doctor to make the decisions with a consideration of their opinion”) and the third group (“who wish to play equal collaborative role”), which were then categorised as “active” (Figure S1C and D). Baseline assessment revealed no significant differences in patients’ preferences for their involvement in this process between control and study groups (Figure S1C and D); however, patients in the control group showed a tendency for more involvement at the second (p=0.023) and third visits (p=0.017) (Figure S1D).
a) Patient needs for information (domain A)
Most patients reported a high demand for information related to their illness and its treatment. No difference in the total mean score of this domain between control and study groups over all visits was observed (Figure S2A and Table 3). Patients’ age and preference for treatment decision-making were found to influence their needs for information at all visits in both groups (Figure S2B). At the third visit, patients <65 years old (p<0.01) and patients who preferred to play an active role in the decision-making process (p<0.001) scored higher for this domain in both groups. Interestingly, as the study proceeded, patients with further education in the study group expressed a higher need for information than those in the control group, reaching statistical significance at the third visit (Figure S2C; p=0.042).
b) Patients’ satisfaction with the quantity of medical information (domain B)
At baseline, patients in the study group were less satisfied with the quantity of information they received, compared to the control group. However, following intervention, patients in the study group showed an improvement in their satisfaction level, whereas those in the control group indicated deterioration, with a significant difference observed at the third visit (p=0.018) (Table 3). A significant increase in the study group’s mean score at the third visit, compared to scores at the second visit (p=0.0045) was observed. In contrast, patients in the control group showed a significant decrease in their satisfaction score at the second (p=0.03) and third visit (p=0.05). However, within group comparison indicated that study patients had received more information in all areas, achieving statistical siginficance for topics such as illness, diagnosis, current treatment, and prognosis (Figure 1 and Table 4).
c) Patients’ understanding of information (domain C)
Patients in the study group reported better understanding of information after the intervention at the second and third visits, while patients in the control group showed a decrease in their scores for this domain (Table 3), although the difference between the third visit scores for the two groups just failed to reach statistical significance (p=0.072). However, when the domain C mean score of each patient from baseline assessment to the third visit was compared, patients in the study group showed an increase in their understanding (p=0.060), while a slight (non-significant) decrease (p=0.326) was seen in the control group.
Specifically, following intervention, patients in the study group reported higher understanding of current treatment information, particulary information regarding the management of side effects (p=0.012) (Table 4). In contrast, for the entire study duration, patients in the control group reported a decrease in their understanding of information on how to handle treatment-related side effects, although this decrease was not statistically significant (p=0.098).
d) Patients’ satisfaction with the quality of information (domain D)
For both groups, a significant difference (p<0.05) in their level of satisfaction with the quality of the received information immediately after intervention was observed. In fact, patients in the study group scored higher than controls in both consequent visits (Table 3).
Within group comparisons for patients in the control group showed significant decreases in the mean scores between baseline and the second (p=0.017), and third visits (p=0.007). In contrast, the same comparisons for patients in the study group indicated a slight, but non-significant increase in mean scores between the baseline and the second (p=0.132), and third visit (p=0.066). When satisfaction levels for the different aspects of the received information were analysed, the “opportunity to ask questions” and the “ability to express feeling” achieved the highest improvement in the study group following intervention (Table 4).
e) Patients’ mental distress (domain E)
In general, the mental distress of patients from the control and the study groups showed no statistical difference in any of the three visits (Table 3). However, within group comparisons revealed that mental distress of the study patients decreased significantly at the second visit following intervention. The mental distress improvement was sustained at the third visit, despite not reaching statistical significance (Table 4). Interestingly, female patients (p=0.002) and patients <65 years old (p=0.001) were found to have the highest level of distress, compared to the other patients’ categories; however, these differences were only statistically significant at baseline assessment. Moreover, in comparison to the “passive” patients, the patients who preferred involvement in treatment decision-making processes were found to have a higher distress, which was statistically significant at second (p=0.02) and third assessment (p=0.032).
f) Low and high PCP scores
In examining the “regression to the mean”, some patients possessed extreme scores in both ends of the spectrum, which in turn affected the total mean scores and consequent changes. Differences ranged from -0.07 to -0.12 for the control group and +0.09 to +0.16 for the study group. Although these differences were statistically significant, the repeated measurement did not exhibit the extent of change in individual’s scores. It was important to observe how patients on both extremes responded, in order to estimate the sensitivity of the PCP to change over time. To address this, patients were divided according to their baseline assessment in “low”, for those who scored ≤ 3 and “high” for those who scored >3 in their mean scores (Table S1). Encouragingly, patients who scored “low” at the entry of the study and underwent the intervention had a higher increase in their total scores, compared to other groups. All these increases were gradual and higher than 0.5 out of 3 at the third visit. These results provide an indication for the responsiveness of the PCP.
3.4. MQOL-R
The patient’s rating of the single item scale (overall) between control and study groups before and after intervention showed no significant difference. In contrast, analysis of each domain displayed a marked improvement in the psychological domain of the QoL for the study group (p=0.006) (Table S2). Moreover, when the total MQOL-R mean scores were compared, patients in the study group showed a greater improvement in their QoL (p=0.011), compared to the control group (p=0.357). Surprisingly, the physical symptom domain of the study group was the only domain that showed a decrease in the mean score at the third visit (Table S2). Nonetheless, a further investigation explained that at this visit the study group had an increase of reported symptoms, compared to the control group (Table S3). In general, the most frequently reported physical symptoms listed by the patients as problematic were fatigue, pain, nausea and vomiting, and infection (Table S3). As general patterns of the listed problems, 25% of patients responded “none” for the first bothered symptom, 44% for the second and 65% for the third (Table S4).
In this study, the listing of the second symptom played a key role in the physical symptoms’ domain. The occurrence that patients in the study group listed more second symptoms after intervention, in comparison to control patients, who reported more second symptoms at baseline is of no relevance. At a further investigation it was clear that there were no significant differences between patients in the control and those in the study group with regard to being on chemotherapy (Table S5) and type of treatment (Table S6).
Consequently, MQOL-R scores were calculated after excluding the physical symptoms domain, whereas patients’ total MQOL-R mean scores were based on the physical well-being (physical), psychological symptoms (psychological), existential well-being and support (social) domains, leading to greater significant differences. Considering this, despite the study patients having listed more physical symptoms at the third visit, they reported a better QoL, compared to those in the control group (p=0.016) (Table S7). Comparisons of MQOL-R mean scores regarding different cancer sites at baseline visit (Table S8) showed that patients with cancer in gynaecological sites reported more impaired QoL than those with cancer at other sites. Considering both patient groups together, these differences were significant on a global scale, psychological domain and MQOL-R total mean scores. However, this trend was not present at the third assessment except for the global scale (overall), whereby differences in both groups and study patients alone reached statistical significance (p<0.05). The low QoL scores among patients with gynaecological cancers also coincided with low scores for the outcome domains of the PCP (Table S9).
For both study and control groups at baseline, no differences in the information needs section were found between patients with gynaecological cancer and other groups; however, they differed with other groups in domains such as the satisfaction with the quantity (B), understanding (C), and satisfaction with the quality of information (D), in which they reported lower scores and higher mental distress (E) than other groups.
At the third visit, patients in control group maintained lower scores for satisfaction (B and D) and understanding (C) domains. At the same time, in both control and study groups, patients with gynaecological cancer scored lower on those same domains, compared to those with cancer of others sites (Table S9).
3.5. Relationships Between Patients’ QoL and Communicated Medical Information
At baseline assessment, patients who preferred to play a passive role in their treatment decision-making showed higher mean score in all MQOL-R’s domains, compared to those who preferred an active role (Table 5). This was statistically significant for the total MQOL-R mean score (p=0.049) and while the psychological domain showed the same trend, it did not reach statistical significance (p=0.068). Similarly, patients who expressed lower need for information reported higher QoL in all the domains of MQOL-R, compared to those who expressed higher needs, and these differences reached statistical significance for the psychological domain (p=0.015) and for the total MQOL-R (p=0.033) (Table 5).
Regarding the satisfaction levels with the amount of information, less satisfied patients reported lower QoL in all domains, compared to those who were more satisfied achieving statisitcal significance for physical symptoms (p=0.017) and support domains (p=0.011), and for the total MQOL-R score (p=0.028). Similarly, analysing the understanding level, lower QoL scores were found in all domains among patients who reported lower understanding, compared to those who reported better understanding (Table 5).
This was statistically significant for the overall scale (p=0.011) and for the total MQOL-R score (p=0.027), but it was not statistically significant for existential (p=0.093) and support domains (p=0.052). A similar trend was found for patients’ satisfaction with the quality of information, where patients who expressed less satisfaction reported lower QoL scores in all MQOL-R domains, compared to those who expressed higher satisfaction. This was statistically significant for existential (p=0.024) and support domains (p=0.039), and for total MQOL-R mean score (p=0.047) (Table 5).
Spearman’s rank correlation coefficients were calculated to examine associations between the MQOL-R and PCP domain scores for baseline and third visit, for which QoL assessments were carried out (Table S10 and Table S11). The majority of correlation coefficients were higher at the third visit compared to baseline. Significant and moderate correlations were identified between patients’ level of satisfaction with the quantity of information (B), understanding of information (C), satisfaction with the quality of information (D) and the MQOL-R psychological, existential and support domains, and total MQOL-R. In particular, the PCP domain B correlated with the MQOL-R support domain only at baseline, while it showed more correlations at the third visit. Similarly, domain B was correlated with the psychosocial domains and with the total MQOL-R mean scores. Patients’ mental distress (domain E) showed strong negative correlations with all the outcomes domains of the PCP and all the MQOL-R’s domains at both baseline and third visit (p<0.05).
4. Discussion
Although tailored communication is crucial for improving therapeutic outcomes, differences between clinicians' and patients' perspectives remain, emphasising the need for systematic evaluations and personalized feedback to improve care and encourage greater patient involvement in decision-making. This study examined the importance of the systematic use of the PCP in daily practice in oncology. At baseline, both study and control groups were similar in age and education level, characteristics which are known to greatly influence patients’ communication behaviours[18,41,42,43,44,45,46]. Furthermore, both groups were also similar with regard to some personality traits, such as patients’ needs for information, preferences for sources and methods, involvement in treatment decision-making, and their mental distress. Moreover, during this assessment, patients’ satisfaction and
QoL (through the McGill QoL questionnaire) obtained comparable scores in both groups. However, differences emerged in the reporting of the most problematic physical symptoms. Patients in the control group reported more problems at baseline, while patients in the study group reported more problems at the end of the study. Ruling out the differences in type and presence/absence of chemotherapy, this phenomenon suggests that, after intervention, patients in the study group have changed their behaviours, becoming more pro-active in seeking and using the information provided. As a result of this simple intervention, these patients might have felt more supported, as they were given more care and attention. In fact, it is recognised that an increase in patients’ involvement enhances their awareness about the potential side effects of their treatments[47,48], resulting in greater sense of being in control of the situation[2,6,49], underpinned by a marked increase in the reporting of treatment side effects. Actually, these processes could have contributed to the control group’s increasing preferences for receiving medical information through more than one method (i.e., verbal), including written, audio, or videos, and the desire to be more involved in treatment decision-making, moving from baseline to third visit. In contrast, patients in the study group showed a stabilized or slightly increased preference for one source, one method or less involvement in treatment decision-making. This same process may also explain the fact that the highly educated patients in the study group expressed higher needs for information, compared to the control group.
Improved Patient Communication and Satisfaction through Individualized Feedback
This study showed an improvement in various communication processes as a result of routine and individualized feedback/discussion about a patient’s needs for information and related issues to their consulting physicians, corroborating previous studies[5]. The continuous increase in patients’ satisfaction with the amount of received information by the study group at visit 2 and 3 and the decrease in control group’s satisfaction was a strong indicator of the intervention’s significant influence on outcomes. In particular, patients in the study group received more information on their illness and its treatment, as measured by domain B of the PCP. In particular, they acquired more information about their prognosis, a type of information which is usually the least discussed among other topics with patients, but that is crucial in the way the patients face the course of the illness. Indeed, in this study the mean scores for this topic exceeded 3.00, compared to previous studies[8,13,18,50,51,52]. Moreover, patients who received the intervention reported a better understanding about their current treatment, compared to those in the control group. This directly correlated with a positive increase in the study patients’ understanding of how to manage the side effects of their treatment, thus enhancing their QoL[27,53,54].
Enhancing Patient Satisfaction and Reducing Mental Distress through Intervention
As previously indicated from other studies, patients’ satisfaction with the quality of care was higher than other outcomes[8,16,55,56,57,58]. However, satisfaction of patients in the control group decreased at the later assessments, while it increased for patients receiving intervention. The best achievement in the study was about the patients’ control over their encounters with medical staff. After intervention, these encounters were seen as an opportunity to ask questions and express feelings, rather than being associated with psychological distress, as it usually happens[4,59,60]. Patients in the control group showed a significant reduction in the ranking of the items “the doctor provided answers in a caring way”, “the treatment was explained to my satisfaction”, “I was included in the decision made about my treatment” (Table 4). Taken together, these results highlight the importance of partnership building, trust in patient-clinician relationship, transparency in information giving, and involvement in treatment decision-making as a foundation for effective communication and engagement between patients and their doctors[28,30,32,61,62]. However, in this study, these interactive behaviours did not show an improvement in the study group, especially regarding the involvement in the decision-making process. Intervention to enhance more participation of patients should be implemented[1].
The results of this intervention suggest that individualised feedback about patients’ needs for information and the resultant outcomes may be helpful in reducing patients’ mental distress. Although the comparison between the control and study groups showed no significant differences at any visits, test of related samples showed that both patient groups had a reduction in their mental distress, attaining significance at the second and third visits in the study group. The reduction in control patients’ distress was in the normal range, due to their contact with the medical team[59,63].
Enhanced Psychological Well-being in Patients through Targeted Intervention
Patients’ mean score for all domains in the MQOL-R was improved for both groups; however, the value was higher for patients who received intervention. This result was different from that of the overall rating of their QoL, where no difference was found between groups. This may be due to the nature of the overall question, being difficult to answer accurately, asking the patient to rate all aspects of their life together on a single scale. Nevertheless, the presence of this question, as mentioned by the MQOL’ authors, is for validity testing purposes, therefore attention needed to be paid to consider a reliable result from this question[34,36]. As expected by the authors of the MQOL, its subscale scores allow determining differences in the QoL produced by interventions, as they are expected to affect one domain. In this study, with this simple intervention, the psychological domain improved for the study group. It is worth mentioning that, based on the results of this study, other domains such as “existential well-being” and “support” may improve even more if a comprehensive intervention will be applied.
Association Between Communication and QoL Domains in Patient Care
Correlations observed between the MQOL-R domains and the PCP outcome domains provide important information. They highlight a link between patients’ reaction to information and other communication behaviours with the different domains of patients’ QoL, especially regarding the psychosocial domains. Indeed, this correlation deserves further evaluation to determine whether it is the perceived QoL affecting the patient’s reaction to information or vice versa.
The significant changes in mean scores observed for the PCP domains in both groups are indicators of its responsiveness. Although the intervention was not comprehensive enough to provide patients with their preferred additional sources or various information materials, the increase in patients’ satisfaction and understanding, and the decrease in psychological distress for the study group were encouraging findings to establish a reasonable responsiveness property for the PCP. In addition, the ability of the PCP to detect the decreases in the control group regarding the studied variables provides an additional confirmation of the PCP response to change. Bearing in mind that the scale window of the PCP is very narrow (i.e., from 1 to 4), the ability of the PCP to detect change in this scale is encouraging.
Future Perspectives and Long-Term Impact of Communication on Cancer Patient Outcomes
Further research is needed to explore the long-term impact of these communication measures on patients’ outcomes and to develop targeted interventions, aimed at addressing the unique needs of diverse cancer patient populations[9]. The awareness of a possible gap in the communicated medical information can direct clinicians to explore this obstacle and implement strategies to help patients’ better understanding of the information provided leading to greater patient-centred care and optimised outcomes.
5. Study Limitations
This study has several limitations that need to be mentioned. First, the short follow-up period of 4 weeks limits the ability to assess long-term impacts of improved communication on cancer patient outcomes, such as QoL and treatment adherence. In addition, while both the McGill MQOL-R and PCP were formally validated, information and results derived from the design, development and validation of the PCP were not published. Another limitation is the heterogeneity of cancer types among participants, with some cancers being more severe than others. Although the sample was fairly well distributed between study and control groups, this variability could influence patients' communication needs and QoL improvements. However, the similar clinical characteristics between groups help mitigate these concerns. Future research should involve a validated PCP and longer follow-up to better understand the sustained effects of enhanced patient communication on QoL and clinical outcomes.
6. Conclusions
To enhance communication in cancer care, clinical workflows should integrate routine assessments of patients' information preferences and needs, followed by individualized feedback to clinicians. This will be an important step towards acknowledging the patients’ reactions to communicated medical information. Routine assessment of patients’ preferences and needs for information and the related outcomes accompanied by individualized feedback to their clinicians just before the encounter is a practical approach to enhance mutual understanding between both partners and lead to a better patient’s QoL as well as optimised adherence to treatment.
Supplementary Materials
The following supporting information can be downloaded at the website of this paper posted on Preprints.org. Figure S1: Patients preferences for their involvement in treatment decision-making process; Figure S2: Patient needs for information, Table S1: The change in mean scores for patients who were low and high responders at baseline, Table S2: Comparisons of the impact of intervention on patients quality of life, Table S3: Percentage of the occurrence of most problematic physical symptoms in both groups, Table S4: Patterns of the listed problems* in the “None” response category, Table S5: Prescribing patterns of chemotherapy treatment for the three visits, Table S6: Type of treatment that patients received, Table S7: Comparisons of the impact of intervention on patients’ quality of life (after excluding physical symptoms domains), Table S8: Comparisons of MQOL-R mean scores between patients with cancer of different sites, Table S9: Comparisons of PCP scores between patients with cancer of different sites, Table S10: Correlations$ between the MQOL-R and the PCP domain scores at the baseline visit, Table S11: Correlations$ between the MQOL-R and the PCP domain scores at the third visit.
Author Contributions
Conceptualization, S.S.; enrolment of patients and data acquisition, A.M.A.; data interpretation and statistical analysis, E.N.O.; writing—original draft preparation, E.N.O. and S.S.; writing—review and editing, E.N.O. and S.S.; visualization, S.S.; supervision, S.S.; project administration, S.S. All authors have read and agreed to the published version of the manuscript.
Funding
This research received no external funding.
Institutional Review Board Statement
This study was approved by the Cardiff/Wales local Ethics Committee. Patients were informed of the research and freely agreed to participate in the study.
Informed Consent Statement
All patients signed an informed consent. All personal data was blinded to protect patients’ privacy. The database did not contain sensitive data, according to the data protection law. The study did not increase the frequency of hospital visits. Patients were not obliged to continue in the study and were allowed to retrieve informed consent at any time with the full guarantee to continue receiving regular visits and treatments.
Data Availability Statement
All results are reported in the present manuscript. Additional supporting data can be made available upon reasonable request from the corresponding author.
Acknowledgments
The authors wish to thank the patients who agreed to participate in this study.
Conflicts of Interest
The authors declare no conflicts of interest.
References
- Gilligan, T.; Coyle, N.; Frankel, R.M.; Berry, D.L.; Bohlke, K.; Epstein, R.M.; Finlay, E.; Jackson, V.A.; Lathan, C.S.; Loprinzi, C.L.; et al. Patient-Clinician Communication: American Society of Clinical Oncology Consensus Guideline. J. Clin. Oncol. 2017, 35, 3618–3632. [Google Scholar] [CrossRef] [PubMed]
- Street, R.L.; Makoul, G.; Arora, N.K.; Epstein, R.M. How Does Communication Heal? Pathways Linking Clinician–Patient Communication to Health Outcomes. Patient Educ. Couns. 2009, 74, 295–301. [Google Scholar] [CrossRef]
- Lelorain, S.; Brédart, A.; Dolbeault, S.; Sultan, S. A Systematic Review of the Associations between Empathy Measures and Patient Outcomes in Cancer Care: Associations between Empathy and Outcomes. Psychooncology. 2012, 21, 1255–1264. [Google Scholar] [CrossRef]
- Lerman, C.; Daly, M.; Walsh, W.P.; Resch, N.; Seay, J.; Barsevick, A.; Heggan, T.; Martin, G.; Birenbaum, L. Communication between Patients with Breast Cancer and Health Care Providers Determinants and Implications. Cancer 1993, 72, 2612–2620. [Google Scholar] [CrossRef]
- Li, J.; Luo, X.; Cao, Q.; Lin, Y.; Xu, Y.; Li, Q. Communication Needs of Cancer Patients and/or Caregivers: A Critical Literature Review. J. Oncol. 2020, 2020, 1–12. [Google Scholar] [CrossRef] [PubMed]
- Rosa, W.E.; Levoy, K.; Doyon, K.; McDarby, M.; Ferrell, B.R.; Parker, P.A.; Sanders, J.J.; Epstein, A.S.; Sullivan, D.R.; Rosenberg, A.R. Integrating Evidence-Based Communication Principles into Routine Cancer Care. Support. Care Cancer 2023, 31, 566. [Google Scholar] [CrossRef] [PubMed]
- Miller, S.M. Monitoring versus Blunting Styles of Coping with Cancer Influence the Information Patients Want and Need about Their Disease. Implications for Cancer Screening and Management. Cancer 1995, 76, 167–177. [Google Scholar] [CrossRef]
- Blanchard, C.G.; Labrecque, M.S.; Ruckdeschel, J.C.; Blanchard, E.B. Physician Behaviors, Patient Perceptions, and Patient Characteristics as Predictors of Satisfaction of Hospitalized Adult Cancer Patients. Cancer 1990, 65, 186–192. [Google Scholar] [CrossRef]
- Brown, O.; Ham-Baloyi, W.T.; Rooyen, D. (Rm) V.; Aldous, C.; Marais, L.C. Culturally Competent Patient–Provider Communication in the Management of Cancer: An Integrative Literature Review. Glob. Health Action 2016, 9, 33208. [Google Scholar] [CrossRef]
- Glimelius, B.; Birgegård, G.; Hoffman, K.; Kvale, G.; Sjödén, P.-O. Information to and Communication with Cancer Patients: Improvements and Psychosocial Correlates in a Comprehensive Care Program for Patients and Their Relatives. Patient Educ. Couns. 1995, 25, 171–182. [Google Scholar] [CrossRef]
- Longacre, M.L.; Galloway, T.J.; Parvanta, C.F.; Fang, C.Y. Medical Communication-Related Informational Need and Resource Preferences Among Family Caregivers for Head and Neck Cancer Patients. J. Cancer Educ. 2015, 30, 786–791. [Google Scholar] [CrossRef]
- Van Wersch, A.; De Boer, M.F.; Van Der Does, E.; De Jong, P.; Knegt, P.; Meeuwis, C.A.; Stringer, P.; Pruyn, J.F.A. Continuity of Information in Cancer Care: Evaluation of a Logbook. Patient Educ. Couns. 1997, 31, 223–236. [Google Scholar] [CrossRef] [PubMed]
- Johnson, M.; Tod, A.M.; Brummell, S.; Collins, K. Prognostic Communication in Cancer: A Critical Interpretive Synthesis of the Literature. Eur. J. Oncol. Nurs. 2015, 19, 554–567. [Google Scholar] [CrossRef] [PubMed]
- Parker, S.M.; Clayton, J.M.; Hancock, K.; Walder, S.; Butow, P.N.; Carrick, S.; Currow, D.; Ghersi, D.; Glare, P.; Hagerty, R.; et al. A Systematic Review of Prognostic/End-of-Life Communication with Adults in the Advanced Stages of a Life-Limiting Illness: Patient/Caregiver Preferences for the Content, Style, and Timing of Information. J. Pain Symptom Manage. 2007, 34, 81–93. [Google Scholar] [CrossRef]
- Wilson-Barnett, J.; Osborne, J. Studies Evaluating Patient Teaching: Implications for Practice. Int. J. Nurs. Stud. 1983, 20, 33–44. [Google Scholar] [CrossRef]
- Woolley, F.R.; Kane, R.L.; Hughes, C.C.; Wright, D.D. The Effects of Doctor--Patient Communication on Satisfaction and Outcome of Care. Soc. Sci. Med. 1978, 12, 123–128. [Google Scholar] [CrossRef] [PubMed]
- Beisecker, A.E.; Beisecker, T.D. Patient Information-Seeking Behaviors When Communicating With Doctors. Med. Care 1990, 28, 19–28. [Google Scholar] [CrossRef]
- Butow, P.; Dunn, S.; Tattersall, M.; Jones, Q. Computer-Based Interaction Analysis of the Cancer Consultation. Br. J. Cancer 1995, 71, 1115–1121. [Google Scholar] [CrossRef]
- Ford, J.G.; Howerton, M.W.; Lai, G.Y.; Gary, T.L.; Bolen, S.; Gibbons, M.C.; Tilburt, J.; Baffi, C.; Tanpitukpongse, T.P.; Wilson, R.F.; et al. Barriers to Recruiting Underrepresented Populations to Cancer Clinical Trials: A Systematic Review. Cancer 2008, 112, 228–242. [Google Scholar] [CrossRef]
- Négrier, S.; Lanier-Demma, F.; Lacroix-Kante, V.; Chauvin, F.; Saltel, P.; Mercatello, A.; Philip, T. Evaluation of the Informed Consent Procedure in Cancer Patients Candidate to Immunotherapy. Eur. J. Cancer 1995, 31, 1650–1652. [Google Scholar] [CrossRef]
- Rood, J.A.J.; Van Zuuren, F.J.; Stam, F.; Van Der Ploeg, T.; Huijgens, P.C.; Verdonck- De Leeuw, I.M. Cognitive Coping Style (Monitoring and Blunting) and the Need for Information, Information Satisfaction and Shared Decision Making among Patients with Haematological Malignancies. Psychooncology. 2015, 24, 564–571. [Google Scholar] [CrossRef] [PubMed]
- Chan, A.; Woodruff, R.K. Communicating with Patients with Advanced Cancer. J. Palliat. Care 1997, 13, 29–33. [Google Scholar] [CrossRef] [PubMed]
- Larsson, G.; Peterson, V.W.; Lampic, C.; Von Essen, L.; Sjödén, P. Cancer Patient and Staff Ratings of the Importance of Caring Behaviours and Their Relations to Patient Anxiety and Depression. J. Adv. Nurs. 1998, 27, 855–864. [Google Scholar] [CrossRef]
- Newell, S.; Sanson-Fisher, R.W.; Girgis, A.; Bonaventura, A. How Well Do Medical Oncologists’ Perceptions Reflect Their Patients’ Reported Physical and Psychosocial Problems? Data from a Survey of Five Oncologists. Cancer 1998, 83, 1640–1651. [Google Scholar] [CrossRef]
- Tanco, K.; Rhondali, W.; Perez-Cruz, P.; Tanzi, S.; Chisholm, G.B.; Baile, W.; Frisbee-Hume, S.; Williams, J.; Masino, C.; Cantu, H.; et al. Patient Perception of Physician Compassion After a More Optimistic vs a Less Optimistic Message: A Randomized Clinical Trial. JAMA Oncol. 2015, 1, 176. [Google Scholar] [CrossRef]
- Westendorp, J.; Geerse, O.P.; Van Der Lee, M.L.; Schoones, J.W.; Van Vliet, M.H.M.; Wit, T.; Evers, A.W.M.; Van Vliet, L.M. Harmful Communication Behaviors in Cancer Care: A Systematic Review of Patients and Family Caregivers Perspectives. Psychooncology 2023, pon.6247. [Google Scholar] [CrossRef]
- Bernacki, R.E.; Block, S.D. Communication About Serious Illness Care Goals: A Review and Synthesis of Best Practices. JAMA Intern. Med. 2014, 174, 1994. [Google Scholar] [CrossRef]
- Butow, P.; Brown, R.; Aldridge, J.; Juraskova, I.; Zoller, P.; Boyle, F.; Wilson, M.; Bernhard, J. Can Consultation Skills Training Change Doctors’ Behaviour to Increase Involvement of Patients in Making Decisions about Standard Treatment and Clinical Trials: A Randomized Controlled Trial. Health Expect. 2015, 18, 2570–2583. [Google Scholar] [CrossRef]
- Nelson, E.C. Building Measurement and Data Collection into Medical Practice. Ann. Intern. Med. 1998, 128, 460. [Google Scholar] [CrossRef]
- Puts, M.T.E.; Tapscott, B.; Fitch, M.; Howell, D.; Monette, J.; Wan-Chow-Wah, D.; Krzyzanowska, M.; Leighl, N.B.; Springall, E.; Alibhai, S.M. A Systematic Review of Factors Influencing Older Adults’ Decision to Accept or Decline Cancer Treatment. Cancer Treat. Rev. 2015, 41, 197–215. [Google Scholar] [CrossRef]
- Heydarnejad, M.S.; Hassanpour, D.A.; Solati, D.K. Factors Affecting Quality of Life in Cancer Patients Undergoing Chemotherapy. Afr. Health Sci. 2011, 11, 266–270. [Google Scholar] [PubMed]
- Thorne, S.; Hislop, T.G.; Kim-Sing, C.; Oglov, V.; Oliffe, J.L.; Stajduhar, K.I. Changing Communication Needs and Preferences across the Cancer Care Trajectory: Insights from the Patient Perspective. Support. Care Cancer 2014, 22, 1009–1015. [Google Scholar] [CrossRef]
- Van Den Bos, G.; Triemstra, A. Quality of Life as an Instrument for Need Assessment and Outcome Assessment of Health Care in Chronic Patients. Qual. Saf. Health Care 1999, 8, 247–252. [Google Scholar] [CrossRef] [PubMed]
- Cohen, S.R.; Sawatzky, R.; Russell, L.B.; Shahidi, J.; Heyland, D.K.; Gadermann, A.M. Measuring the Quality of Life of People at the End of Life: The McGill Quality of Life Questionnaire–Revised. Palliat. Med. 2017, 31, 120–129. [Google Scholar] [CrossRef] [PubMed]
- Pratheepawanit, N. Incorporation of Quality of Life Assessment in Routine Practice as an Aid to Clinical Decision-Making. PhD thesis, University of Wales, 2000. [Google Scholar]
- Cohen, S.R.; Mount, B.M.; Bruera, E.; Provost, M.; Rowe, J.; Tong, K. Validity of the McGill Quality of Life Questionnaire in the Palliative Care Setting: A Multi-Centre Canadian Study Demonstrating the Importance of the Existential Domain. Palliat. Med. 1997, 11, 3–20. [Google Scholar] [CrossRef]
- Al-Mohammadi, A.; Salek, M.S.; Maughan, T.; Mason, M.; Nicholls, P.J. The Impact of Routine Assessment of Information Needs on HRQoL of Patients with Cancer. Qual. Life Res. 2003, 12, 813. [Google Scholar] [CrossRef]
- Al-Mohammadi, A. Development and Validation of a Medical Information Needs and Outcomes Assessment Tool for Patients with Cancer. PhD Thesis, University of Cardiff, UK, 2003. [Google Scholar]
- Mokkink, L.B.; Terwee, C.B.; Patrick, D.L.; Alonso, J.; Stratford, P.W.; Knol, D.L.; Bouter, L.M.; de Vet, H.C.W. The COSMIN Checklist for Assessing the Methodological Quality of Studies on Measurement Properties of Health Status Measurement Instruments: An International Delphi Study. Qual. Life Res. Int. J. Qual. Life Asp. Treat. Care Rehabil. 2010, 19, 539–549. [Google Scholar] [CrossRef]
- Mouelhi, Y.; Jouve, E.; Castelli, C.; Gentile, S. How Is the Minimal Clinically Important Difference Established in Health-Related Quality of Life Instruments? Review of Anchors and Methods. Health Qual. Life Outcomes 2020, 18, 136. [Google Scholar] [CrossRef]
- Berkman, N.D.; Sheridan, S.L.; Donahue, K.E.; Halpern, D.J.; Crotty, K. Low Health Literacy and Health Outcomes: An Updated Systematic Review. Ann. Intern. Med. 2011, 155, 97. [Google Scholar] [CrossRef]
- Blanchard, C.G.; Labrecque, M.S.; Ruckdeschel, J.C.; Blanchard, E.B. Information and Decision-Making Preferences of Hospitalized Adult Cancer Patients. Soc. Sci. Med. 1988, 27, 1139–1145. [Google Scholar] [CrossRef]
- Chaturvedi, S.K.; Strohschein, F.J.; Saraf, G.; Loiselle, C.G. Communication in Cancer Care: Psycho-Social, Interactional, and Cultural Issues. A General Overview and the Example of India. Front. Psychol. 2014, 5. [Google Scholar] [CrossRef]
- Fujimori, M.; Uchitomi, Y. Preferences of Cancer Patients Regarding Communication of Bad News: A Systematic Literature Review. Jpn. J. Clin. Oncol. 2009, 39, 201–216. [Google Scholar] [CrossRef] [PubMed]
- Rothenbacher, D.; Lutz, M.P.; Porzsolt, F. Treatment Decisions in Palliative Cancer Care: Patients’ Preferences for Involvement and Doctors’ Knowledge about It. Eur. J. Cancer 1997, 33, 1184–1189. [Google Scholar] [CrossRef] [PubMed]
- Wynia, M.K.; Osborn, C.Y. Health Literacy and Communication Quality in Health Care Organizations. J. Health Commun. 2010, 15, 102–115. [Google Scholar] [CrossRef] [PubMed]
- Dodd, M.J. Assessing Patient Self-Care for Side Effects of Cancer Chemotherapy--Part I. Cancer Nurs. 1982, 5, 447–451. [Google Scholar] [CrossRef]
- Walling, A.; Lorenz, K.A.; Dy, S.M.; Naeim, A.; Sanati, H.; Asch, S.M.; Wenger, N.S. Evidence-Based Recommendations for Information and Care Planning in Cancer Care. J. Clin. Oncol. 2008, 26, 3896–3902. [Google Scholar] [CrossRef]
- McWilliam, C.L.; Brown, J.B.; Stewart, M. Breast Cancer Patients’ Experiences of Patient–Doctor Communication: A Working Relationship. Patient Educ. Couns. 2000, 39, 191–204. [Google Scholar] [CrossRef]
- Butow, P.N.; Dunn, S.M.; Tattersall, M.H.N.; Jones, Q.J. Patient Participation in the Cancer Consultation: Evaluation of a Question Prompt Sheet. Ann. Oncol. 1994, 5, 199–204. [Google Scholar] [CrossRef]
- Clayton, J.M.; Hancock, K.M.; Butow, P.N.; Tattersall, M.H.N.; Currow, D.C. Clinical Practice Guidelines for Communicating Prognosis and End-of-life Issues with Adults in the Advanced Stages of a Life-limiting Illness, and Their Caregivers. Med. J. Aust. 2007, 186. [Google Scholar] [CrossRef]
- Diamond, E.L.; Corner, G.W.; De Rosa, A.; Breitbart, W.; Applebaum, A.J. Prognostic Awareness and Communication of Prognostic Information in Malignant Glioma: A Systematic Review. J. Neurooncol. 2014, 119, 227–234. [Google Scholar] [CrossRef]
- De Vries, A.M.M.; De Roten, Y.; Meystre, C.; Passchier, J.; Despland, J.-N.; Stiefel, F. Clinician Characteristics, Communication, and Patient Outcome in Oncology: A Systematic Review. Psychooncology. 2014, 23, 375–381. [Google Scholar] [CrossRef] [PubMed]
- Dodd, M.J. Measuring Informational Intervention for Chemotherapy Knowledge and Self-Care Behavior. Res. Nurs. Health 1984, 7, 43–50. [Google Scholar] [CrossRef]
- Hillen, M.A.; De Haes, H.C.J.M.; Stalpers, L.J.A.; Klinkenbijl, J.H.G.; Eddes, E.H.; Butow, P.N.; Van Der Vloodt, J.; Van Laarhoven, H.W.M.; Smets, E.M.A. How Can Communication by Oncologists Enhance Patients’ Trust? An Experimental Study. Ann. Oncol. 2014, 25, 896–901. [Google Scholar] [CrossRef]
- Jones, R.; Pearson, J.; McGregor, S.; Gilmour, W.H.; Atkinson, J.M.; Barrett, A.; Cawsey, A.J.; McEwen, J. Cross Sectional Survey of Patients’ Satisfaction with Information about Cancer. BMJ 1999, 319, 1247–1248. [Google Scholar] [CrossRef] [PubMed]
- Steptoe, A.; Sutcliffe, I.; Allen, B.; Coombes, C. Satisfaction with Communication, Medical Knowledge, and Coping Style in Patients with Metastatic Cancer. Soc. Sci. Med. 1991, 32, 627–632. [Google Scholar] [CrossRef]
- Wiggers, J.H.; Donovan, K.O.; Redman, S.; Sanson-Fisher, R.W. Cancer Patient Satisfaction with Care. Cancer 1990, 66, 610–616. [Google Scholar] [CrossRef]
- Fujimori, M.; Shirai, Y.; Asai, M.; Kubota, K.; Katsumata, N.; Uchitomi, Y. Effect of Communication Skills Training Program for Oncologists Based on Patient Preferences for Communication When Receiving Bad News: A Randomized Controlled Trial. J. Clin. Oncol. 2014, 32, 2166–2172. [Google Scholar] [CrossRef]
- Rodin, G.; Zimmermann, C.; Mayer, C.; Howell, D.; Katz, M.; Sussman, J.; Mackay, J.A.; Brouwers, M. Clinician–Patient Communication: Evidence-Based Recommendations to Guide Practice in Cancer. Curr. Oncol. 2009, 16, 42–49. [Google Scholar] [CrossRef] [PubMed]
- Ong, L.M.L.; De Haes, J.C.J.M.; Hoos, A.M.; Lammes, F.B. Doctor-Patient Communication: A Review of the Literature. Soc. Sci. Med. 1995, 40, 903–918. [Google Scholar] [CrossRef]
- Stevenson, F.A.; Barry, C.A.; Britten, N.; Barber, N.; Bradley, C.P. Doctor–Patient Communication about Drugs: The Evidence for Shared Decision Making. Soc. Sci. Med. 2000, 50, 829–840. [Google Scholar] [CrossRef]
- Molleman, E.; Krabbendam, P.J.; Annyas, A.A.; Koops, H.S.; Sleijfer, D.Th.; Vermey, A. The Significance of the Doctor-Patient Relationship in Coping with Cancer. Soc. Sci. Med. 1984, 18, 475–480. [Google Scholar] [CrossRef] [PubMed]
Figure 1.
Comparison of level of satisfaction with quantity of medical information between baseline and third visit scores in control (A) and study patients (B). SE = side effects.
Figure 1.
Comparison of level of satisfaction with quantity of medical information between baseline and third visit scores in control (A) and study patients (B). SE = side effects.
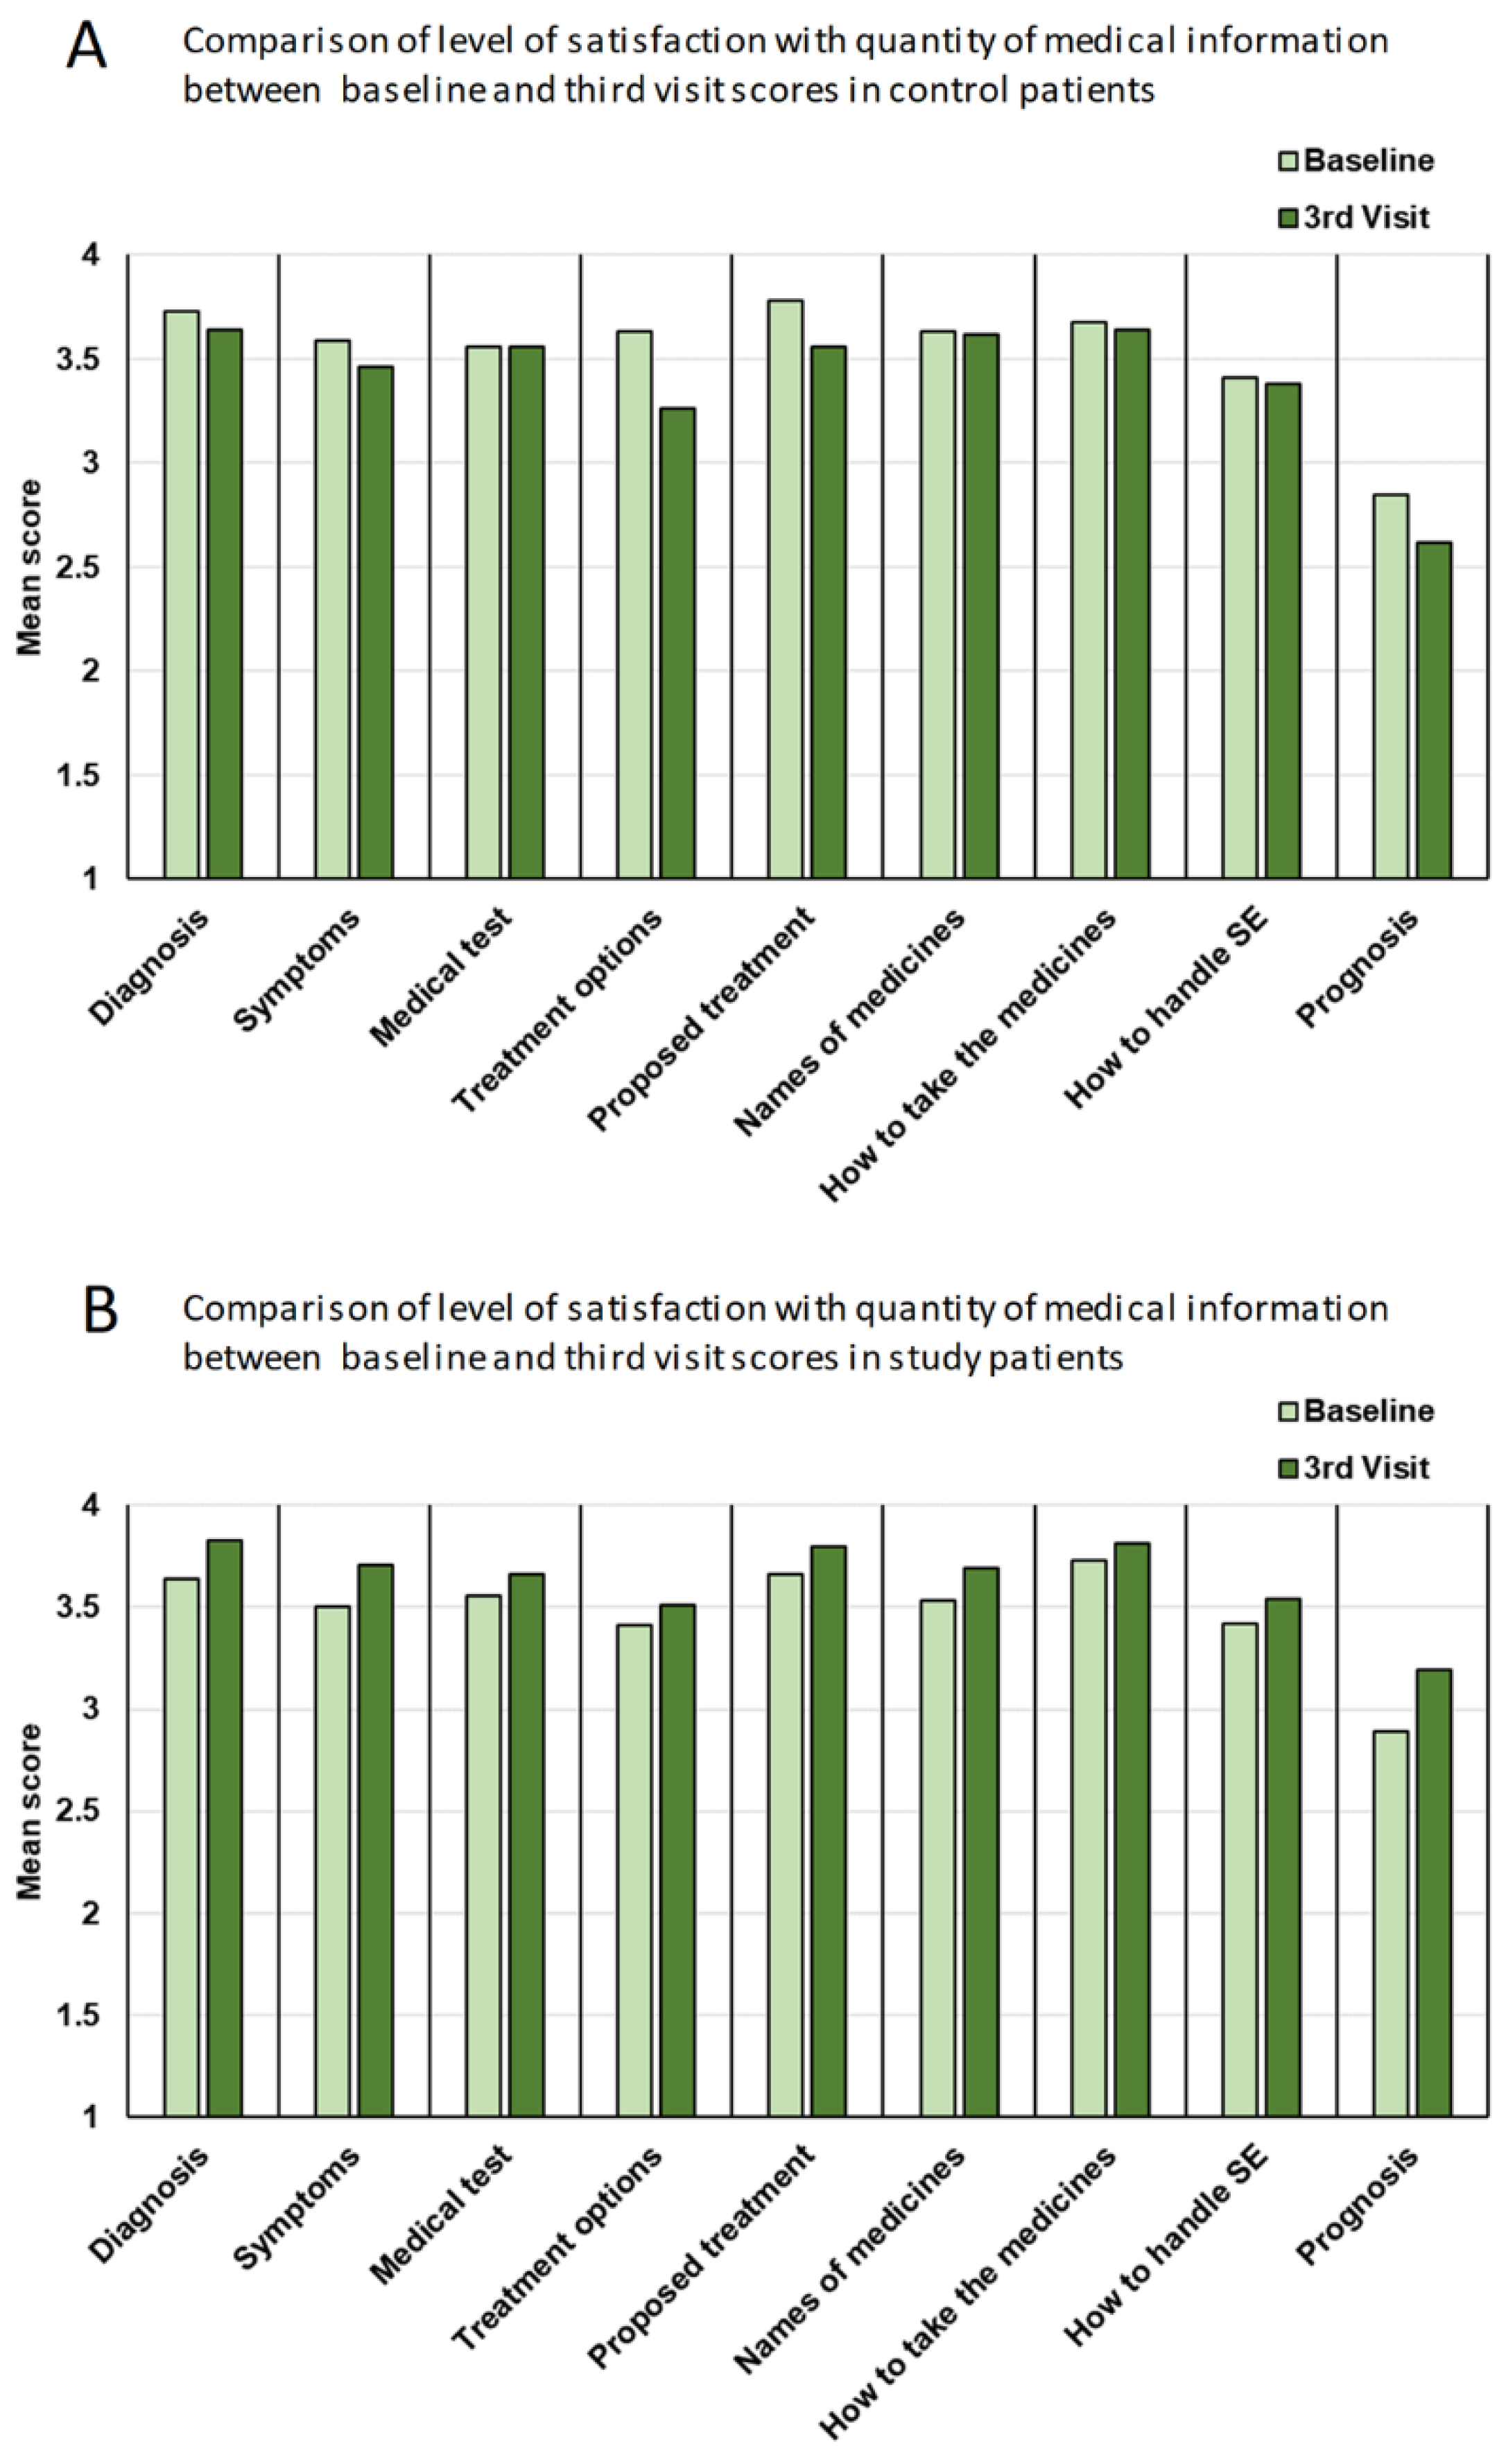

Table 1.
Demographic characteristics and their comparison between control and study group patients.
| Total (n = 105) | Control (n = 41) | Study (n = 64) | p-value* | |
|---|---|---|---|---|
| n (%) | n (%) | n (%) | ||
| Age(years) | ||||
| Mean | 57.96 | 58.32 | 57.73 | 0.828 |
| Range | 18-88 | 18-80 | 26-88 | |
| 18-44 | 15 (14.3) | 6 (14.6) | 9 (14.1) | |
| 45-64 | 53 (50.5) | 21 (51.2) | 32 (50.0) | |
| ≥65 | 37 (35.2) | 14 (34.1) | 23 (35.9) | |
| Gender | ||||
| Male | 45 (43) | 15 (37) | 30 (47) | 0.320 |
| Female | 60 (57) | 26 (63) | 34 (53) | |
| Education | ||||
| Further | 36 (38) | 14 (39) | 22 (37) | 1.000 |
| No further | 59 (62) | 22 (61) | 37 (63) | |
| Cancer site | ||||
| Breast | 23 (21.9%) | 8 (19.5) | 15 (23.4) | 0.236 |
| Urogenital | 10 (9.5%) | 2 (4.9) | 8 (12.5) | |
| Lymphoma | 22 (21.0%) | 7 (17.1) | 15 (23.4) | |
| GIT | 26 (24.8%) | 14 (34.1) | 12 (18.8) | |
| Gynaecological | 18 (17.1%) | 7 (17.1) | 11 (17.2) | |
| Brain | 04 (3.8%) | 1 (2.4) | 3 (4.7) | |
| Other | 02 (1.9%) | 2 (4.9) | 0 (0.0) | |
| Illness status | ||||
| Advanced | 66 (62.5%) | 23 (64) | 43 (72) | 0.497 |
| Not advanced | 30 (37.5%) | 13 (36) | 17 (28) |
GIT = gastrointestinal tract; * One-way ANOVA (interval data) and Chi-square test (categorical data).
Table 2.
Comparisons of the PCP and MQOL-R scores between the control and study groups at baseline.
| PCP and MQOL-R Domains | Control | Study | p-value* |
|---|---|---|---|
| n (%) | n (%) | ||
| Source of information preferred: | |||
| One source preferred | 21 (51) | 36 (56) | 0.690 |
| More than one source preferred | 20 (49) | 28 (44) | |
| Method of information preferred: | |||
| One method preferred | 23 (56) | 36 (56) | 1.000 |
| More than one method preferred | 18 (44) | 28 (44) | |
| Preferences for involvement in treatment decision-making: |
|||
| Passive | 14 (34) | 18 (28) | 0.523 |
| Active | 27 (66) | 46 (72) | |
| Domains | Median (range) | ||
| Information needs (A) | 3.64 (1.50-4) | 3.71 (1.57-4) | 0.272 |
| Satisfaction with the amount of information (B) | 3.78 (2.22-4) | 3.67 (1.67-4) | 0.567 |
| Understanding of information (C) | 3.50 (2.00-4) | 3.56 (1.50-4) | 0.610 |
| Satisfaction with the quality of information (D) | 3.90 (2.50-4) | 3.90 (2.40-4) | 0.857 |
| Mental distress (E) | 2.00 (1.00-4) | 3.00 (1.00-4) | 0.636 |
| MQOL-R | Median (range) | ||
| Overall quality of life | 7.00 (1.00-10) | 7.00 (1.00-10) | 0.906 |
| Physical symptoms | 6.00 (0.33-10) | 7.66 (1.33-10) | 0.160 |
| Physical well being | 7.00 (0.00-10) | 7.00 (0.00-10) | 0.419 |
| Psychological domain | 8.25 (0.25-10) | 7.75 (0.00-10) | 0.277 |
| Existential domain | 7.67 (0.33-10) | 7.58 (0.83-10) | 0.461 |
| Support domain | 9.00 (4.00-10) | 9.00 (1.00-10) | 0.769 |
| Total MQOL-R | 7.00 (1.13-9.9) | 7.35 (2.88-10) | 0.791 |
MQOL-R = Revised McGill Quality of Life Questionnaire; PCP = Patient Communication Profile Questrionnaire; * Chi-square test (categorical data) and Mann-Whitney U (ordinal data).
Table 3.
Comparisons of means scores for patients’ need for information, satisfaction with the quantity of medical information, understanding of information, satisfaction with the quality of information and mental stress as from the 5 different domains of the patient communication profile between the control and study groups.
| Control | Study | p-value* | |||
|---|---|---|---|---|---|
| Mean (SD) | Median (range) | Mean (SD) | Median (range) | ||
| Domain A | Patients’ need for information | ||||
| Baseline | 3.52 (0.51) | 3.64 (1.50-4) | 3.56 (0.53) | 3.71 (1.57-4) | 0.272 |
| Visit 2 | 3.52 (0.52) | 3.71 (2.07-4) | 3.61 (0.40) | 3.75 (2.36-4) | 0.478 |
| Visit 3 | 3.50 (0.48) | 3.57 (1.93-4) | 3.59 (0.51) | 3.79 (1.64-4) | 0.107 |
| Domain B | Patients’ satisfaction with the quantity of medical information | ||||
| Baseline | 3.54 (0.53) | 3.77 (2.22-4) | 3.48 (0.58) | 3.66 (1.67-4) | 0.567 |
| Visit 2 | 3.42 (0.53) | 3.66 (2.11-4) | 3.52 (0.53) | 3.78 (1.78-4) | 0.211 |
| Visit 3 | 3.42 (0.55) | 3.66 (2.33-4) | 3.64 (0.46) | 3.89 (2.22-4) | 0.018 |
| Domain C | Patients’ understanding of information | ||||
| Baseline | 3.34 (0.59) | 3.50 (2.00-4) | 3.38 (0.63) | 3.56 (1.50-4) | 0.610 |
| Visit 2 | 3.30 (0.57) | 3.38 (2.25-4) | 3.45 (0.60) | 3.63 (1.75-4) | 0.084 |
| Visit 3 | 3.27 (0.58) | 3.12 (2.38-4) | 3.47 (0.53) | 3.63 (2.00-4) | 0.072 |
| Domain D | Patients’ satisfaction with the quality of information | ||||
| Baseline | 3.68 (0.48) | 3.90 (2.50-4) | 3.69 (0.45) | 3.90 (2.40-4) | 0.857 |
| Visit 2 | 3.51 (0.53) | 3.70 (2.30-4) | 3.75 (0.38) | 3.95 (2.30-4) | 0.018 |
| Visit 3 | 3.53 (0.47) | 3.70 (2.50-4) | 3.72 (0.51) | 4.00 (1.40-4) | 0.017 |
| Domain E | Patients’ mental stress | ||||
| Baseline | 2.37 (0.92) | 2.00 (1.00-4) | 2.40 (0.77) | 3.00 (1.00-4) | 0.636 |
| Visit 2 | 2.27 (0.90) | 2.00 (1.00-4) | 2.22 (0.84) | 2.00 (1.00-4) | 0.967 |
| Visit 3 | 2.26 (0.85) | 2.00 (1.00-4) | 2.25 (0.84) | 2.00 (1.00-4) | 0.865 |
* Mann-Whitney U test “two-tailed”.
Table 4.
Comparisons of the impact of the intervention on patients’ satisfaction, understanding and level of satisfaction with the quality of information received from Domains B, C, D and E of the PCP.
Table 4.
Comparisons of the impact of the intervention on patients’ satisfaction, understanding and level of satisfaction with the quality of information received from Domains B, C, D and E of the PCP.
| Type of information | Control | Study | ||||||
|---|---|---|---|---|---|---|---|---|
| Baseline$ | 3rd visit$ | z# | p-value* | Baseline$ | 3rd visit$ | z# | p-value* | |
| Domain B | Comparison of the impact of the intervention on patients’ satisfaction with the amount of information receieved on various aspects of treatment | |||||||
| Diagnosis | 3.73 | 3.64 | -0.83 | 0.202 | 3.64 | 3.83 | +2.13 | 0.016 |
| Symptoms | 3.59 | 3.46 | -1.00 | 0.158 | 3.50 | 3.71 | +2.29 | 0.011 |
| Medical test | 3.56 | 3.56 | +0.27 | 0.391 | 3.56 | 3.66 | +1.36 | 0.087 |
| Treatment options | 3.63 | 3.26 | -2.84 | 0.002 | 3.41 | 3.51 | +0.82 | 0.206 |
| Proposed treatment | 3.78 | 3.56 | -2.31 | 0.011 | 3.66 | 3.80 | +1.79 | 0.037 |
| Names of medicines | 3.63 | 3.62 | -0.03 | 0.487 | 3.53 | 3.69 | +2.52 | 0.006 |
| How to take the medicines | 3.68 | 3.64 | -0.42 | 0.337 | 3.73 | 3.81 | +1.43 | 0.076 |
| How to handle side-effects | 3.41 | 3.38 | -0.00 | 0.500 | 3.42 | 3.54 | +1.62 | 0.053 |
| Prognosis | 2.85 | 2.62 | -1.25 | 0.106 | 2.89 | 3.19 | +1.78 | 0.037 |
| Domain C | Effects of the intervention on patients’ understanding of each type of information | |||||||
| Diagnosis | 3.51 | 3.49 | 0.000 | 0.500 | 3.59 | 3.61 | 0.000 | 0.500 |
| How diagnosed | 3.49 | 3.56 | +0.943 | 0.173 | 3.69 | 3.64 | -0.254 | 0.400 |
| Medical test | 3.32 | 3.31 | +0.218 | 0.413 | 3.45 | 3.54 | +1.034 | 0.150 |
| Treatment | 3.59 | 3.46 | -1.000 | 0.158 | 3.53 | 3.64 | +1.410 | 0.079 |
| Other available treatment | 2.85 | 2.64 | -0.813 | 0.208 | 2.84 | 2.88 | +0.601 | 0.274 |
| Names of medicines | 3.24 | 3.21 | -0.166 | 0.434 | 3.30 | 3.44 | +1.621 | 0.052 |
| How to handle side-effects | 3.27 | 3.13 | -1.291 | 0.098 | 3.19 | 3.42 | +2.241 | 0.012 |
| The current state of illness | 3.49 | 3.33 | -1.116 | 0.132 | 3.44 | 3.56 | +1.073 | 0.141 |
| Domain D |
Comparisons of the impact of intervention on the patients’ level of satisfaction with the quality of various aspects of information received |
|||||||
| Opportunity to ask questions | 3.68 | 3.56 | -1.43 | 0.076 | 3.69 | 3.81 | +2.07 | 0.019 |
| Express feelings | 3.66 | 3.56 | -1.21 | 0.112 | 3.53 | 3.66 | +1.93 | 0.027 |
| Caring answers | 3.80 | 3.67 | -2.11 | 0.017 | 3.81 | 3.85 | +0.64 | 0.261 |
| Given enough time | 3.59 | 3.62 | -0.24 | 0.404 | 3.70 | 3.76 | +0.84 | 0.201 |
| Honest information | 3.83 | 3.69 | -1.25 | 0.106 | 3.89 | 3.80 | -1.51 | 0.065 |
| Given all the available information | 3.66 | 3.54 | -1.08 | 0.141 | 3.72 | 3.75 | +0.37 | 0.356 |
| Satisfactory explanation of the treatment | 3.76 | 3.54 | -2.50 | 0.006 | 3.77 | 3.73 | -0.25 | 0.402 |
| Involvement in decision-making | 3.68 | 3.31 | -2.36 | 0.009 | 3.64 | 3.51 | -1.36 | 0.087 |
| Feeling informed | 3.66 | 3.54 | -1.15 | 0.125 | 3.64 | 3.71 | +0.78 | 0.219 |
| Feeling reassured | 3.44 | 3.31 | -1.53 | 0.063 | 3.55 | 3.63 | +0.76 | 0.224 |
| Domain E | Comparisons of the impact of intervention on patients’ mental distress | |||||||
| Visit 2 | -0.853 | 0.197 | -2.01 | 0.022 | ||||
| Visit 3 | -0.688 | 0.245 | -1.37 | 0.085 | ||||
PCP = Patient Communication Profile Questrionnaire; $ Mean scores; #Positive signs indicate an increase in the reported patients’ satisfaction, understanding or mental stress; * Wilcoxon Matched-pairs Signed-ranks Test (one-tailed).
Table 5.
Comparisons of MQOL-R mean scores in all patients with regard to information received.
| Mean (SD) | Mean (SD) | ||
|---|---|---|---|
| Domain | Active | Passive | p-value* |
| Overall | 6.90 (2.39) | 6.69 (2.06) | 0.553 |
| Physical symptoms | 6.98 (2.75) | 6.35 (2.95) | 0.295 |
| Physical well being | 6.94 (2.34) | 6.32 (2.40) | 0.277 |
| Psychological | 7.60 (2.73) | 6.50 (2.94) | 0.068 |
| Existential | 7.65 (2.06) | 7.11 (2.16) | 0.179 |
| Support | 9.12 (1.26) | 8.48 (1.92) | 0.145 |
| Total MQOL-R | 7.68 (1.47) | 6.95 (1.69) | 0.049 |
| Lower needs | Higher needs | ||
| Overall | 8.14 (1.95) | 6.65 (2.14) | 0.094 |
| Physical symptoms | 7.86 (2.23) | 6.45 (2.92) | 0.151 |
| Physical well being | 7.57 (3.05) | 6.43 (2.33) | 0.207 |
| Psychological | 9.29 (0.83) | 6.66 (2.93) | 0.015 |
| Existential | 8.17 (1.42) | 7.20 (2.17) | 0.306 |
| Support | 9.07 (1.24) | 8.64 (1.81) | 0.703 |
| Total MQOL-R | 8.39 (1.19) | 7.08 (1.65) | 0.033 |
| ‡Less satisfied | More satisfied | ||
| Overall | 6.00 (2.24) | 6.91 (2.12) | 0.116 |
| Physical symptoms | 5.41 (2.95) | 6.77 (2.84) | 0.017 |
| Physical well being | 5.76 (2.75) | 6.66 (2.30) | 0.110 |
| Psychological | 6.88 (2.85) | 6.83 (2.94) | 0.522 |
| Existential | 6.43 (2.76) | 7.44 (1.97) | 0.104 |
| Support | 7.62 (2.55) | 8.88 (1.50) | 0.011 |
| Total MQOL-R | 6.42 (2.18) | 7.32 (1.50) | 0.028 |
| Low understanding | High understanding | ||
| Overall | 5.74 (2.32) | 7.05 (2.02) | 0.011 |
| Physical symptoms | 5.64 (2.87) | 6.81 (2.86) | 0.105 |
| Physical well being | 5.78 (2.70) | 6.72 (2.26) | 0.129 |
| Psychological | 6.45 (2.86) | 6.95 (2.93) | 0.336 |
| Existential | 6.44 (2.65) | 7.51 (1.92) | 0.093 |
| Support | 7.89 (2.35) | 8.90 (1.50) | 0.052 |
| Total MQOL-R | 6.44 (1.94) | 7.38 (1.50) | 0.027 |
| ‡‡Less satisfied | More satisfied | ||
| Overall | 6.00 (2.16) | 6.84 (2.15) | 0.194 |
| Physical symptoms | 5.73 (2.57) | 6.63 (2.92) | 0.329 |
| Physical well being | 6.30 (1.95) | 6.53 (2.44) | 0.527 |
| Psychological | 5.80 (2.84) | 6.95 (2.91) | 0.142 |
| Existential | 5.82 (2.37) | 7.43 (2.06) | 0.024 |
| Support | 7.15 (2.82) | 8.84 (1.55) | 0.039 |
| Total MQOL-R | 6.16 (1.72) | 7.28 (1.62) | 0.047 |
MQOL-R = Revised McGill Quality of Life Questionnaire; ‡quantity or ‡‡quality with regard to satisfaction with information. * Mann-Whitney U test “two-tailed”.
Disclaimer/Publisher’s Note: The statements, opinions and data contained in all publications are solely those of the individual author(s) and contributor(s) and not of MDPI and/or the editor(s). MDPI and/or the editor(s) disclaim responsibility for any injury to people or property resulting from any ideas, methods, instructions or products referred to in the content. |
© 2025 by the authors. Licensee MDPI, Basel, Switzerland. This article is an open access article distributed under the terms and conditions of the Creative Commons Attribution (CC BY) license (http://creativecommons.org/licenses/by/4.0/).
Copyright: This open access article is published under a Creative Commons CC BY 4.0 license, which permit the free download, distribution, and reuse, provided that the author and preprint are cited in any reuse.


